Article

Exploration of Flow Instability Characteristics in a Two-Stage Axial-Flow Compressor via Numerical Simulation Method

School of Mechanical Engineering, Shanghai Jiao Tong University, Shanghai 200240, China
*
Author to whom correspondence should be addressed.
Machines 2023, 11(3), 401; https://doi.org/10.3390/machines11030401
Submission received: 20 February 2023 / Revised: 11 March 2023 / Accepted: 15 March 2023 / Published: 20 March 2023
(This article belongs to the Special Issue Selected Papers from CITC2022)

Abstract

:
A four-blade-passage numerical model was developed for a two-stage axial-flow compressor with an inlet guide vane (IGV) for the purpose of studying the steady and dynamic characteristics of the compressor approaching its stability limit. The flow-field information indicated that the tip-leakage flow decreased more rapidly from the blade’s leading edge to the trailing edge, with a decreasing flow rate. The leakage flow was verified to be driven via the blade load over the whole operating range. Further research on the blade load was carried out. The magnitude of the highest blade load in the leading-edge portion of the first-stage rotor determined the lowest flow rate with steady-simulation analysis. The circumferential grooves on the rotor improved the rotor’s stable range via reducing the blade load. Unsteady-simulation results showed that the extreme blade load appeared first at the front of the first stage, with a decreasing flow rate. The second stage played a positive compensative role through releasing some of the load from the first stage. It can be generalized that the lowest flow rate at a specific speed is determined via not only any single stage but also other stages in a multistage axial-flow compressor.

1. Introduction

The instability phenomenon, including rotating stall and surge, is the main limiting factor of axial-flow compressors and has been a topic of study for more than 60 years. Rotating stall refers to circumferential propagation of disturbance caused by low-energy fluid in one or several blade passages. Surge represents the axial fluctuation of the gas microcluster. It indicates that the flow rate along the axial direction varies with time. Stall and surge have different flow-field characteristics, but their triggering conditions and generating mechanisms are related. Rotating stall is even thought to be the cause and prelude of surge. Therefore, research on compressor flow instability generally focuses on the phenomenon and mechanism of rotating stall.
Early research on rotating stall placed much stress on the effect of stall cells on compressor performance and flow characteristics. Some compressor instability models have been put forward. The rotating stall model proposed by Emmons [1] in 1955 states that when stall cells are generated in one or more blade passages via some transient disturbance, the airflow blocked by stall cells is diverted to the adjacent passages. The effect is an increased attack angle of the next blade in the rotating direction and a decreased attack angle of the preceding blade. While the flow in the next blade passage will tend to stall, the preceding blade passage will tend to become more stable. In this manner, stall spreads in the rotating direction, with 30% to 50% of the rotor’s speed. Emmons’ model is a two-dimensional steady-state model that explains the generation and development mechanism of rotating stall from the perspective of steady-state separation. Based on Emmons’ stall model, Moore and Greitzer [2], in 1986, established a relatively complete stability model (the M-G model) from the perspective of compression system stability, proposing the modal stall inception theory for the first time. In 1990, McDougall et al. [3] made detailed measurements of the transient stalling process in an axial compressor stage and concluded that stall inception was at the tip region, with clearances typical for a multistage compressor. In 1993, Day [4] observed small-scale disturbances at the blade tip, which were not of the long length-scale modal type. These disturbances, later known as “spike”, only appeared in the local area of the blade tip region and rotated at about 70% the of rotor speed, while a modal disturbance usually rotates at less than 50% of the rotor speed. In 1997, Camp and Day [5] summarized in detail the characteristics of two types of stall inception (modal/spike) in terms of disturbance amplitude (small/large), disturbance wavelength (large/small), number of passages occupied (large/small) and circumferential propagation speed (slow/fast).
Flow-stability control technology has been promoted with the introduction of modal and spike stall inception theory. However, the specific mechanism of compressor flow instability and the specific flow characteristics inducing stall inception have not been clearly concluded. With some in-depth understanding of the flow characteristics inside a compressor, researchers have found that rotor-tip flow, especially tip-leakage flow, is closely related to the instability of the compressor. Hoying [6] first proposed the relationship between tip-leakage vortex trajectory and compressor instability in 1999. It was pointed out that the compressor would become unstable when the path of the leakage vortex was parallel to the leading edge of the blade. Saathoff et al. [7] found that there was an interaction between tip-leakage flow and the end-wall boundary layer in the end-wall region, which resulted in separation of the boundary layer at the end wall and blockage of the flow passage near the blade tip. Vo et al. [8] proposed judgment criteria for occurrences of spike stall inception in compressor rotors with a spilled of tip-leakage flow at the blade leading edge and a reverse flow at the blade trailing edge. In recent years, some new research results have supplemented the spike stall inception criteria proposed by Vo. For example, Pullan et al. [9] believed that in a case of zero clearance, flow separation at the suction’s leading edge, with a large attack angle, could induce radial vortices in the passage, thus leading to spike stall inception. The unsteady fluctuation characteristics of tip-leakage flow under near-stall conditions were also studied. Kameier and Neise [10] observed unsteady fluctuation of tip-leakage flow in their experiments and named it rotating instability (RI). RI is reflected in physical flow as a periodic collision between the tip-leakage vortex and adjacent blades, with a frequency of 30–40% blade-passing frequency (BPF). Yamada et al. [11] made a further study on the unsteady fluctuation phenomenon of tip-leakage flow and believed that such unsteady fluctuation was caused by breakage of the tip-leakage vortex. Du [12] carried out experiments with a transonic compressor and proposed that the unsteady fluctuation of the tip-flow field was caused by enhanced interaction between the tip-leakage flow and the main flow, and that it has no relation with external excitation and whether or not vortexes are broken, so this unsteady fluctuation was then called self-excited unsteadiness. Wu et al. [13,14] also found rotating instability with the testing transonic compressor. It was found that formation and development of secondary tip vortices are closely related to rotating instability.
The studies conducted in the literature have shown that rotor-tip flow plays an important role in the instability process in axial-flow compressors. However, due to different experimental objects and perspectives, the research on compressor instability mechanisms is still somewhat controversial. In this paper, the onset and development rules of instability in a two-stage, low-speed axial compressor were investigated with a numerical method. The blades of the two stages had similar profiles. A casing treatment (CT) with circumferential grooves was used to enhance the stable working range [15]. It was found that the extent of working range enhancement was quite different for the wholly and partially grooved casings, and stall always occurred initially in the first stage. The flow characteristics in the tip region and the relevant multistage stability were emphasized here. The physical mechanism of circumferential grooves on instability characteristics was also explored, providing theoretical and experimental references for other flow-stability enhancement technologies.

2. Numerical Model and CFD Method

2.1. Multistage Model with Circumferential-Groove Casing Treatment

A four-blade-passage numerical model was built to study the internal flow in a two-stage, low-speed axial compressor, including the inlet guide vane (IGV), the first stage and the second stage. The parameters of the model were defined and are shown in reference [15]. Cascades in the computational domain are shown in Figure 1, where the first stage rotor is denoted by R1, the first-stage stator by S1, the second-stage rotor by R2 and the second-stage stator by S2. The inlet domain and the outlet domain were extended to set up reasonable boundary conditions.
The structure details of the compressor casing with circumferential grooves are shown in Figure 2. “Structure A” represents the model with the smooth wall, and “structure B” is the CT model with a 0–35% rotor-tip chord covered in grooves. The cross-section of the groove was square, at 3 mm in length, as shown in Figure 2. The notations of the numerical models with different CTs are listed in Table 1. The CT structures with 0–50% of the chord covered and 0–100% of the chord covered were also considered in the following study.

2.2. Boundary Conditions, Grid and Numerical Method

The numerical simulation was performed with ANSYS CFX 18.0. The inlet boundary condition was specified through the total temperature and the total pressure, and the outlet boundary condition was specified through the static pressure to obtain the flow rate. The turbulent model used was the k-epsilon model with the scalable wall function. The value of the dimensionless wall function in the flow field was around 50.
Since two stages were involved in the CT, the computational domain was composed of multiple subdomains, including cascades, CT regions, inlets and outlets, with interfaces between them. After grid independence was validated, there were 4,821,572 grids in total [15].
The frozen-rotor interface condition was applied in the steady simulation, while transient rotor/stator interface was applied in the unsteady simulation. The time step for the unsteady simulation was determined via balancing accuracy and costs. For example, when the rotating speed was 6000 rpm, the blade numbers of the two-stage rotors were 20 and 25, respectively, and the time step was determined via the Nyquist–Shannon sampling theorem to be 0.01 ms. During the unsteady simulation, parameters such as the mass flow rate, the pressure rise and the pressures at some positions were monitored online to judge the tendency of computing convergence. To accelerate the converging process, the result of the previous operating condition was used to initiate the flow field. The convergence histories of the monitored parameters with the S_B model are shown in Figure 3. The mass flow rate decreased continuously until it became relatively stable. The pressure-rise coefficient presented no obvious trend in the same period. The comparison necessitated some convergence criteria to be identified for the unsteady simulation.

2.3. Numerical Determination of the near-Stall Point

The lowest flow-rate conditions were always gradually approached through changing of the outlet static pressure in very small increments in the numerical simulation. As shown in Figure 4, the roman numerals denoted as the flow-rate conditions. The flow-rate-monitoring curve dropped sharply before the simulation no longer converged with the increased outlet static pressure. Correspondingly, on the static-pressure-rise curve indicated by the squared dots, when the highest value was reached or the slope of the curve changed from negative to nearly 0, the last converged simulation condition was considered the near-stall point.

2.4. Validation

Simulation results were validated through comparison with the experimental data. Figure 5 shows the comparison of the pressure-rise coefficient, ψ, in the working range at a rotating speed of 3000 rpm. The pressure-rise coefficient is defined in Formula (1):
ψ = p o u t p i n ρ i n u m 2
where pout is the static/total outlet pressure, pin is the static/total inlet pressure, ρin is inlet density and um is the circumferential velocity of the rotating blade at the mean radius.
The pressure-rise coefficient data obtained from the numerical simulation were found to be close to the experimental data. Pressure-rise coefficient errors were slightly increased with the increasing deviation of mass flow rate from the design point. Improvement of the numerical simulation method was considered to further depress the error.

3. Numerical Results and Discussion

3.1. Steady-Simulation Results

The numerical performance of the S_A model (refer to Table 1) at 6000 rpm is shown in Table 2. The outlet pressure was increased from 110 kPa to 120.0 kPa, and 120.7 kPa was found to be the near-stall point at that speed.
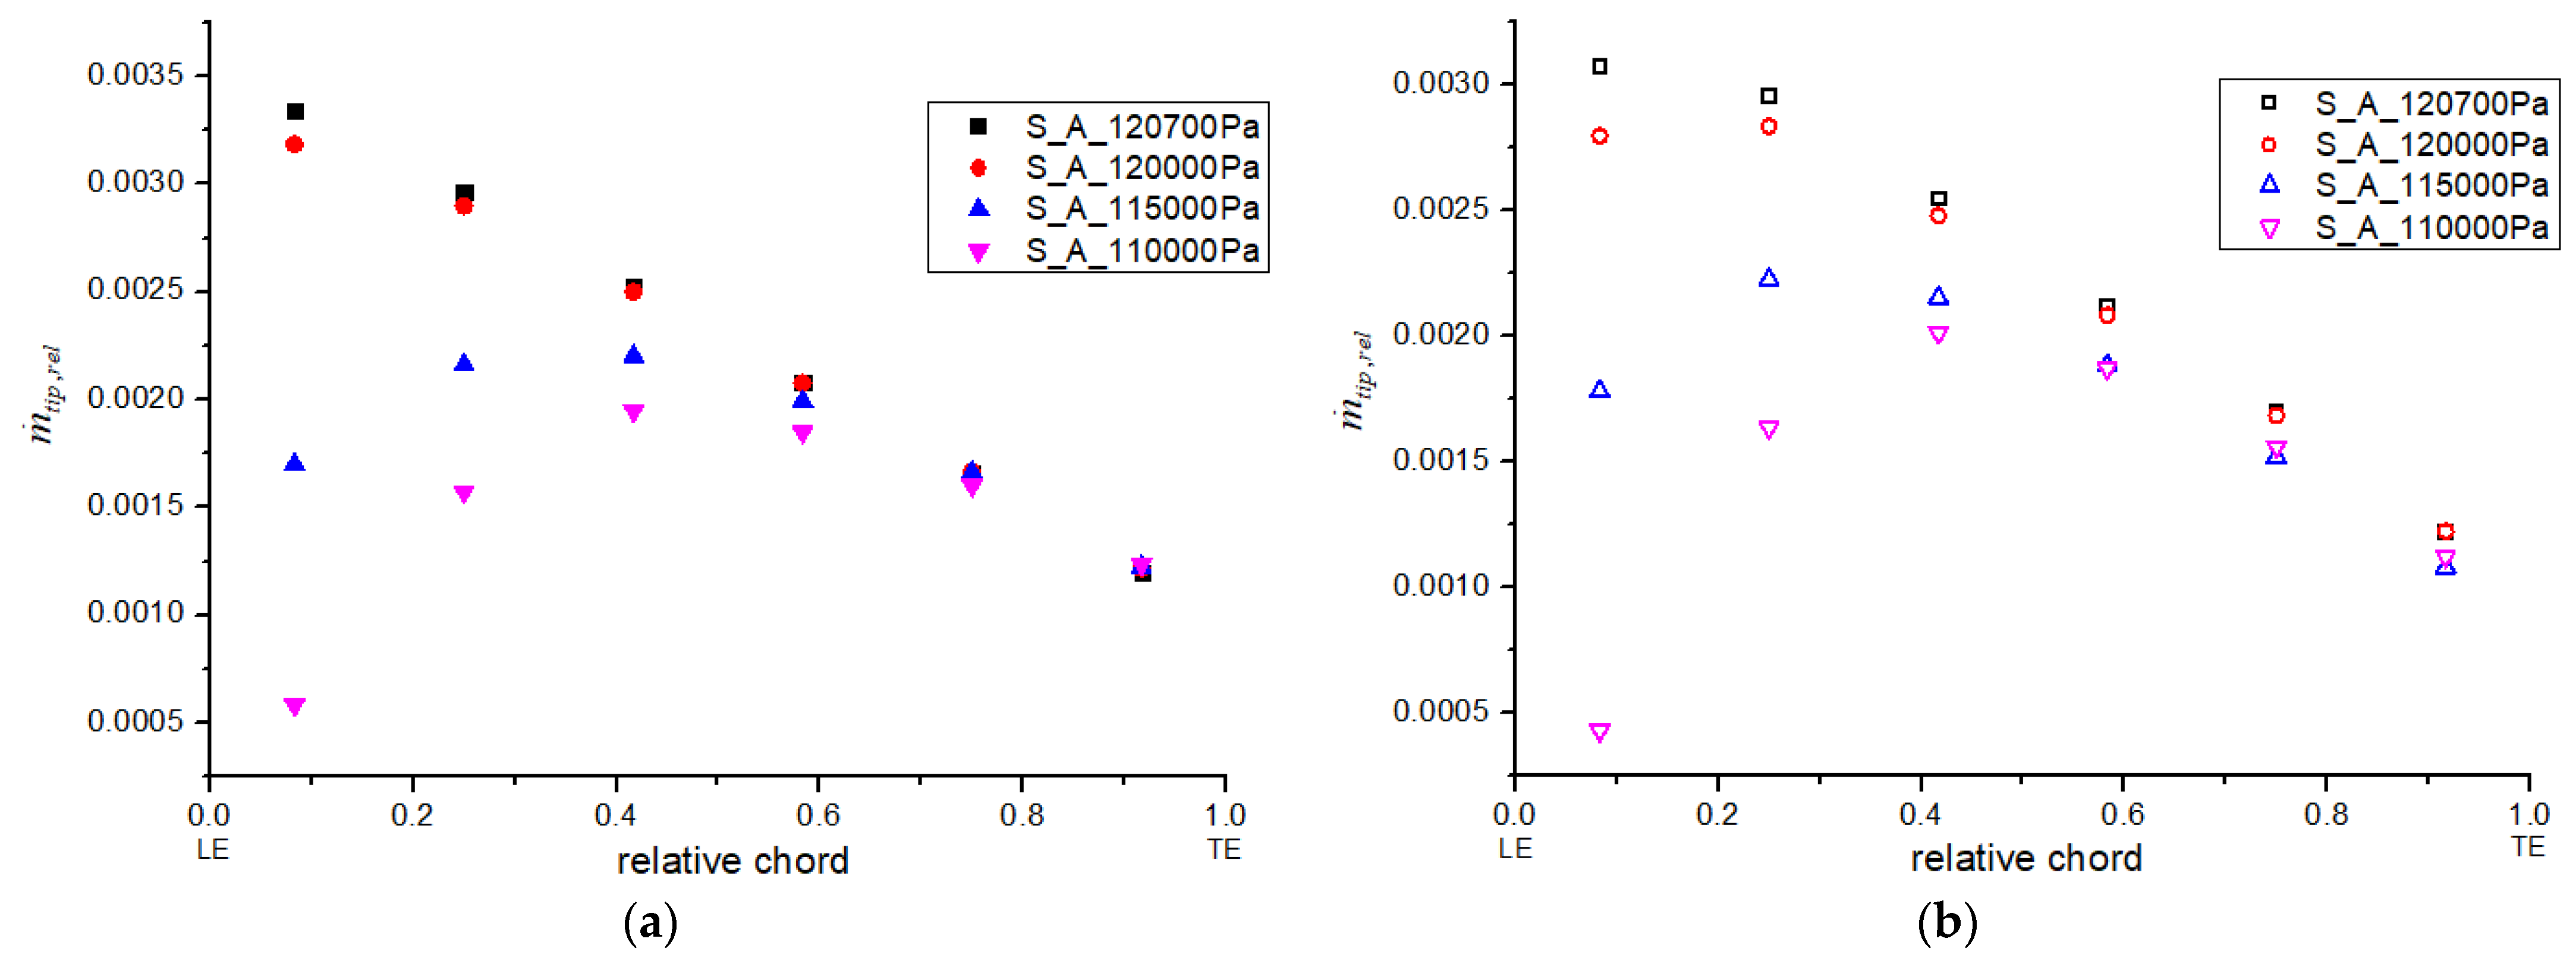
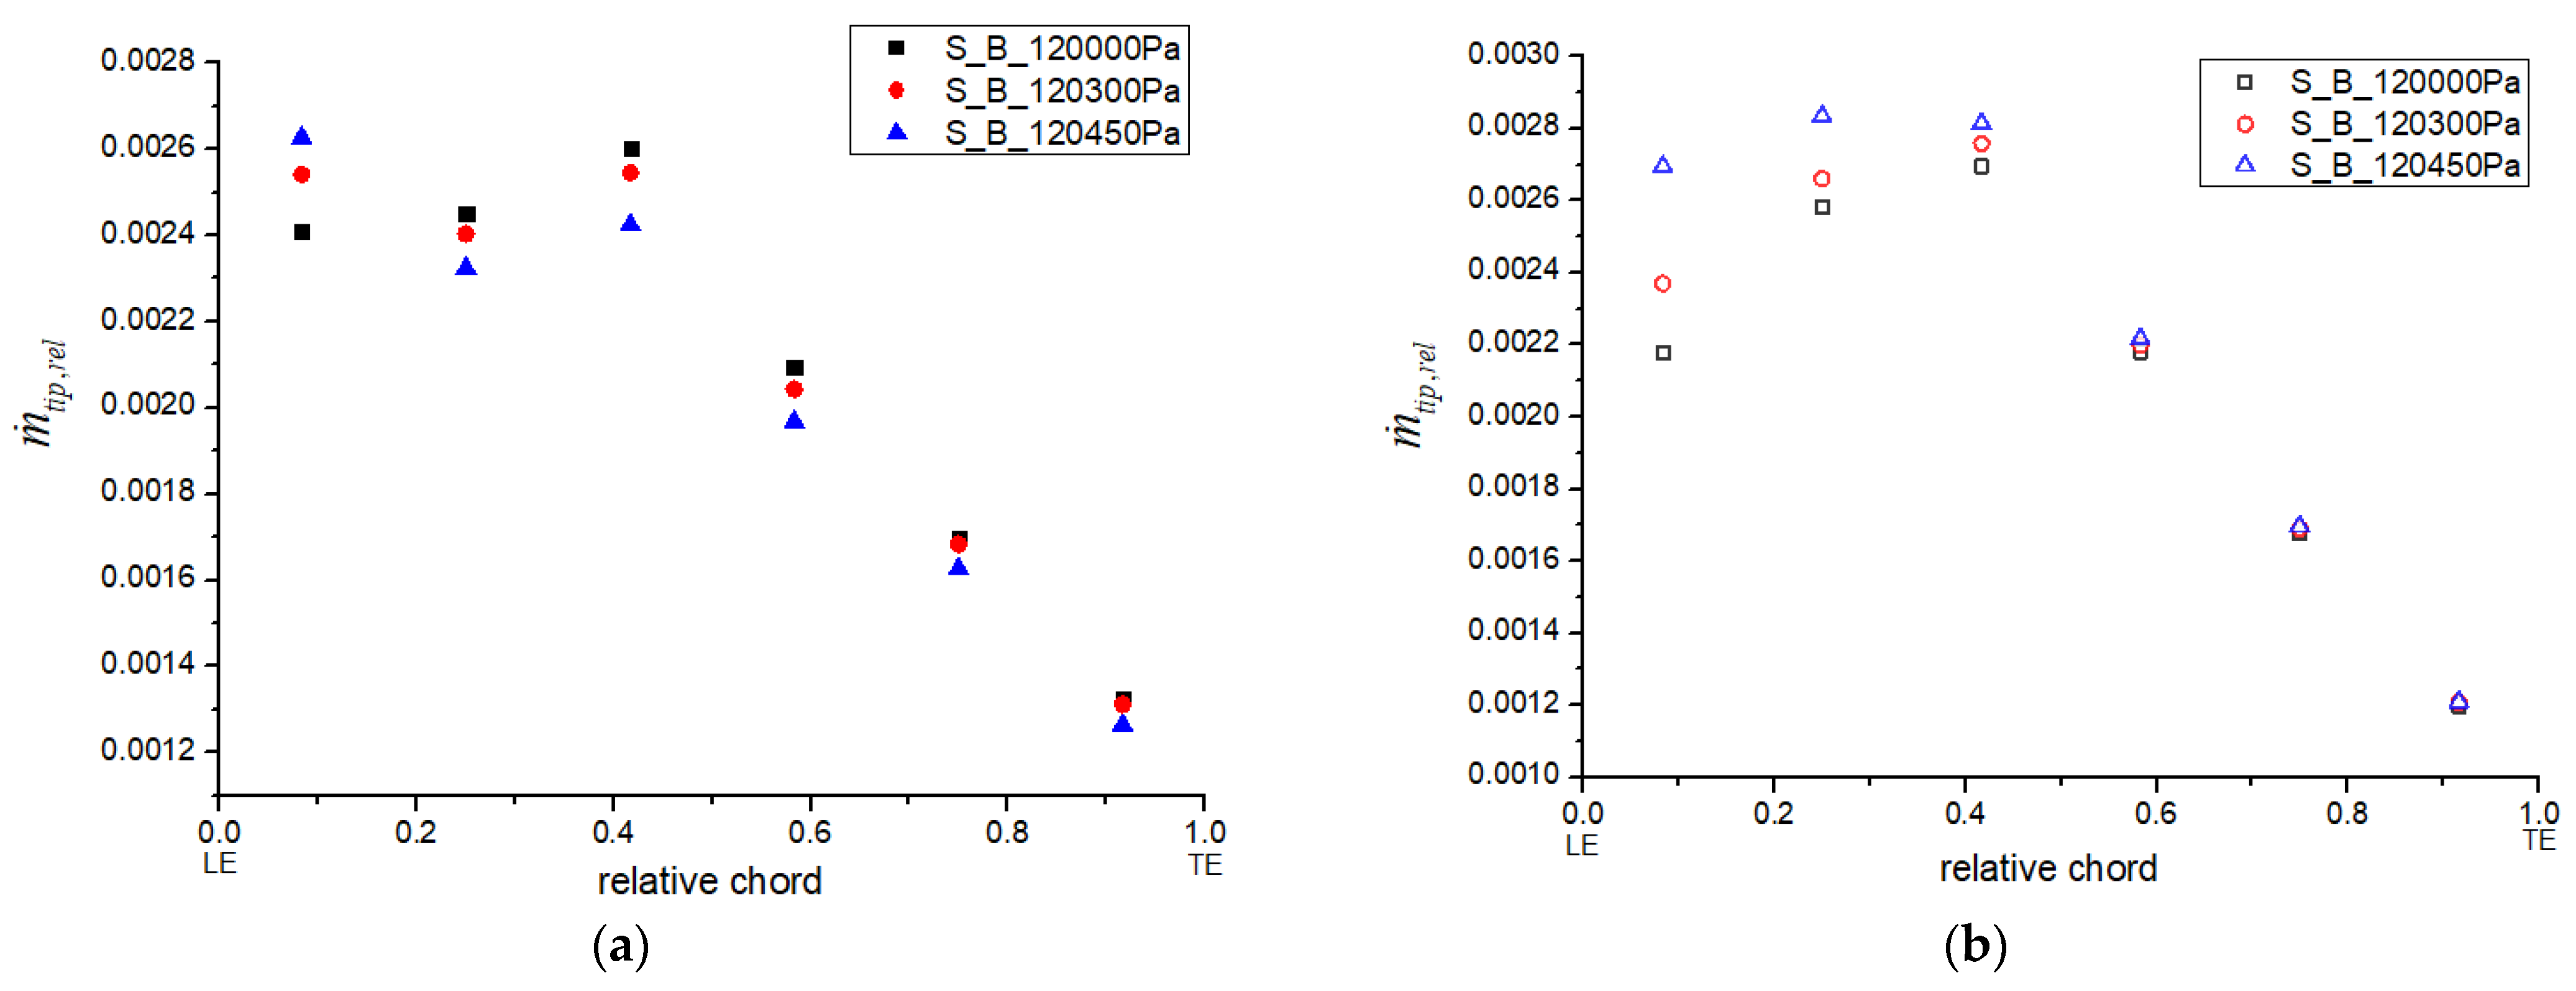
Tip-leakage flow was analyzed at the working points shown in Table 2. To facilitate the analysis of the tip-leakage flow distribution, the tip-clearance region was divided equally into six sections along the blade chord. As shown in Figure 6, the local leakage flow rate relative to the mass flow rate in a blade passage was calculated for each section at different outlet pressures. The leakage-flow distributions of the two stages show similar tendencies. The convex distributions of the relative local leakage were found near the design condition; this might be related to the performance of the cascade. With increasing outlet pressure, the relative local leakage flow either increased or stayed almost unchanged. The negative effect of the tip-leakage flow on the main flow might have increased. Once the outlet pressure rose to some extent, the relative local leakage in the front of the blade rose and the distribution changed to monotonic descent along the chord. It was suggested that the distribution variation of the local leakage could be used as a criterion to identify occurrences of instability in the numerical simulation.
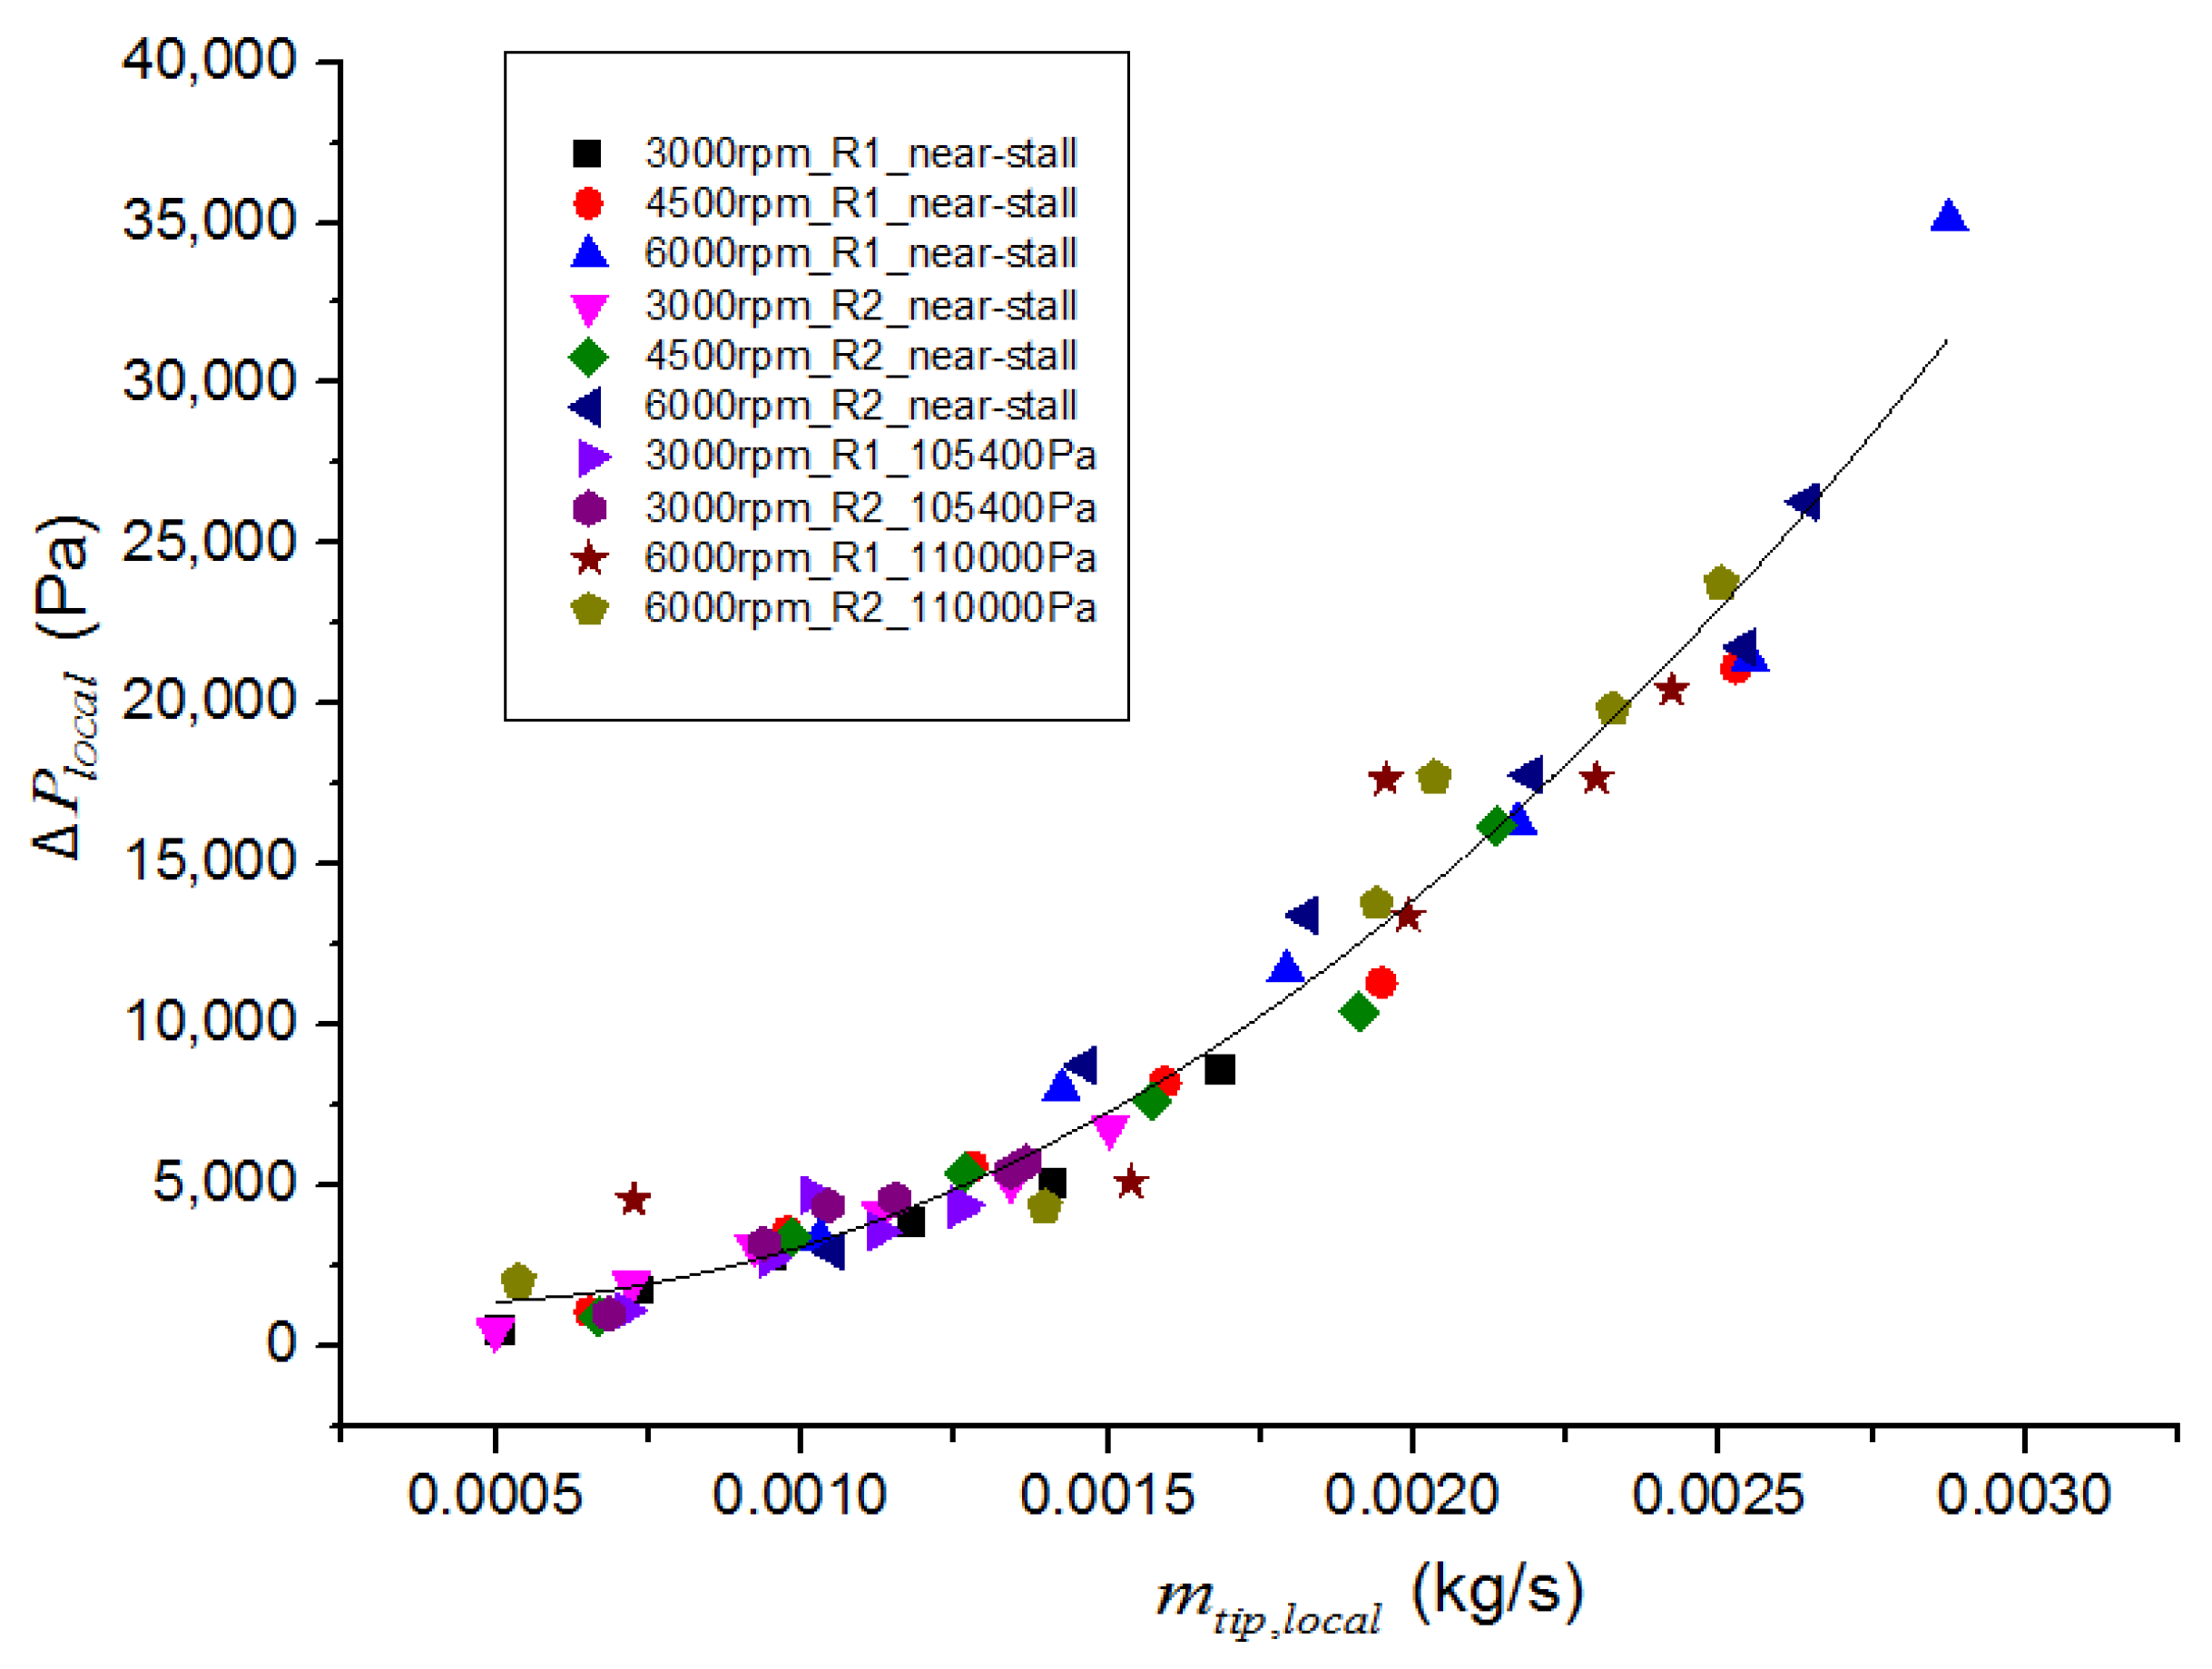
The local blade load along the blade chord is defined by the local static pressure difference:
Δ P l o c a l = p s , p p s , s
where ps,p is the static pressure on the pressure surface and ps,s is the static pressure on the suction surface.
Static pressure at 90% blade height was considered representative of the main flow and potentially related to leakage flow. As shown in Figure 7, local blade data were plotted against the local relative leakage flow rate at different rotating speeds, different outlet pressures and different stages. The data points were effectively regressed into a quadratic curve with a correlation coefficient of 0.96. The strong correlation suggests that the local leakage flow is driven by the local blade load.
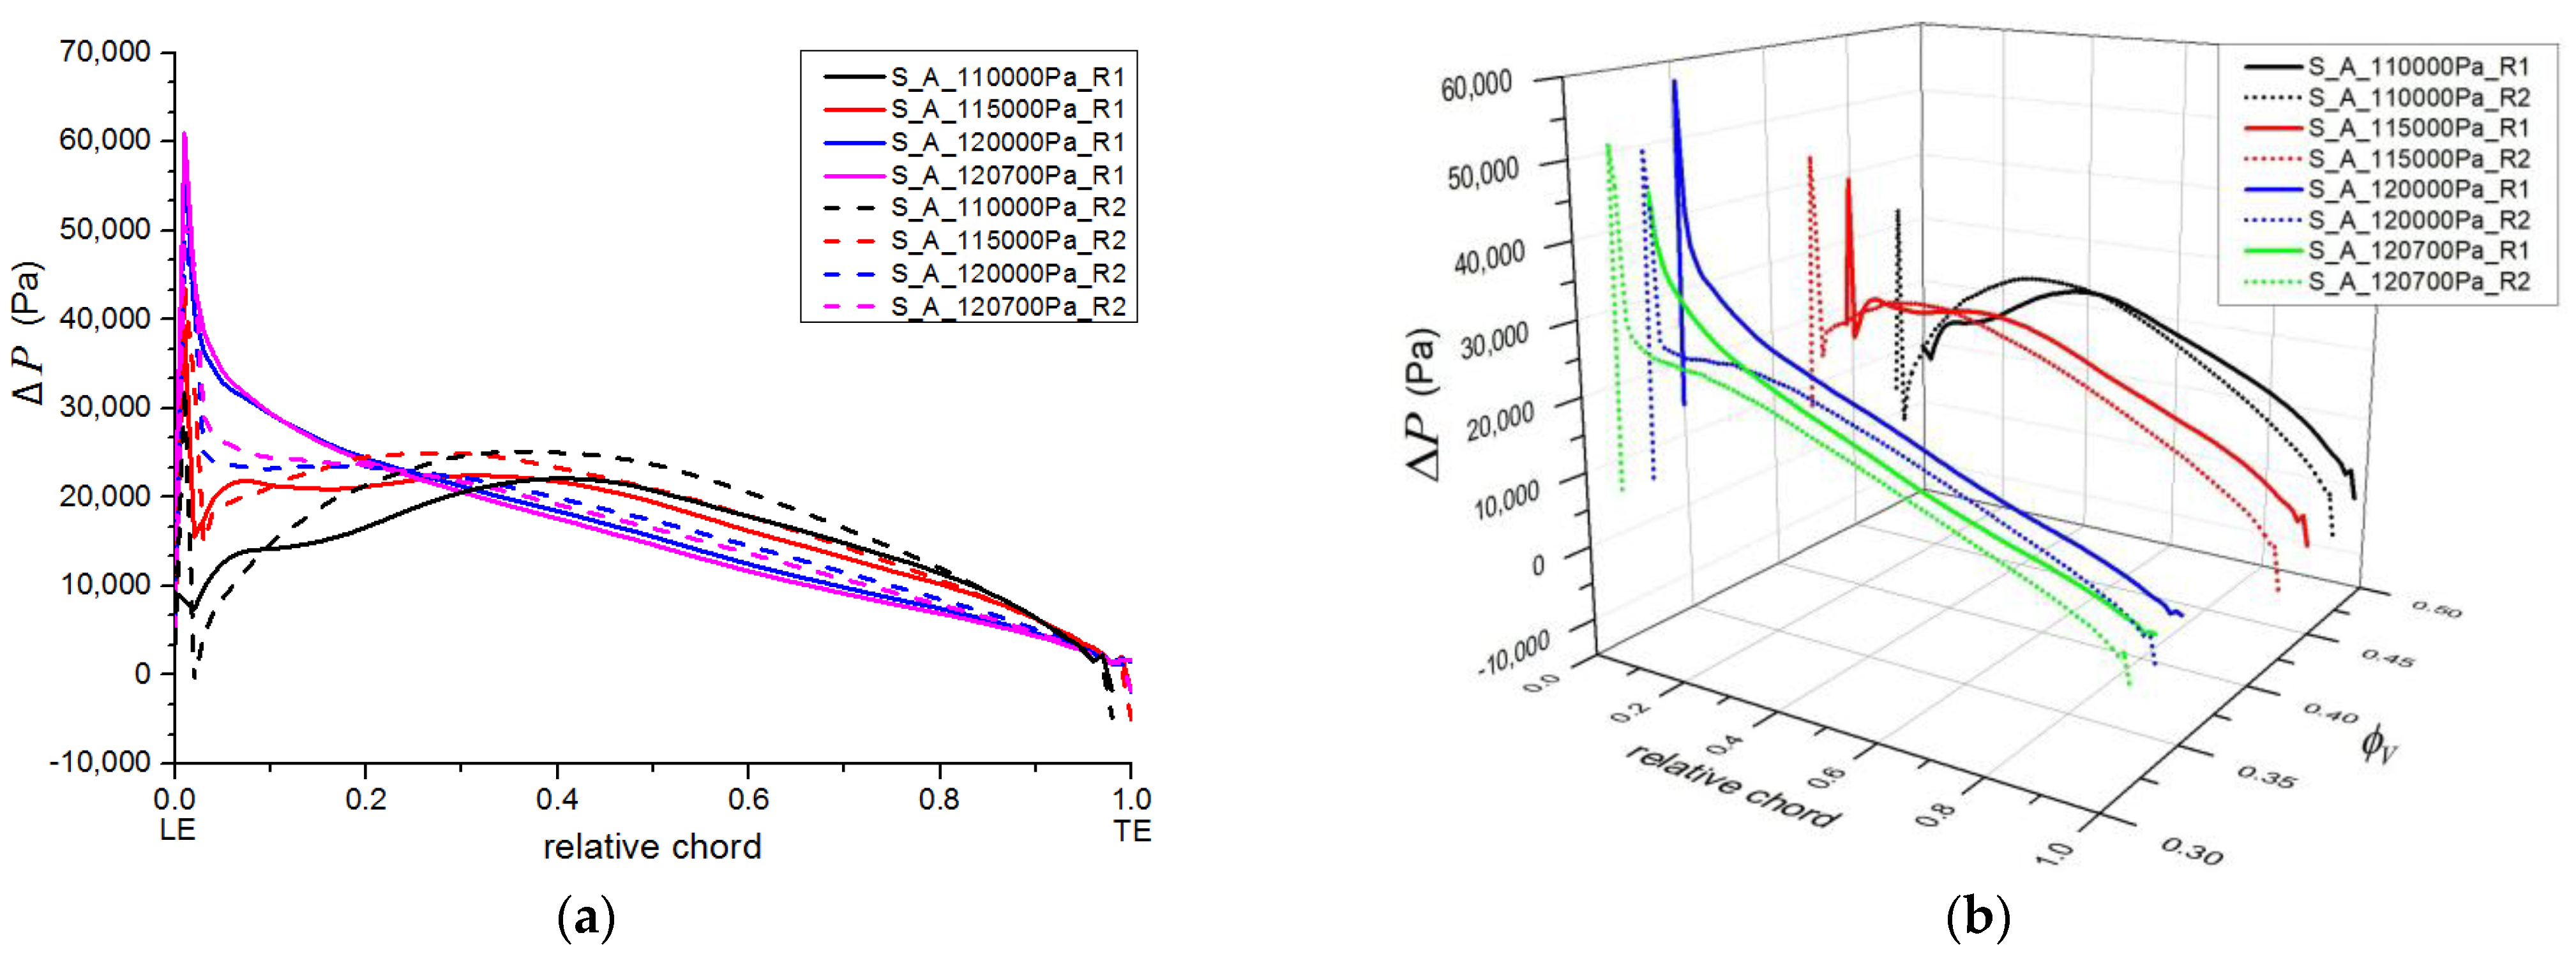
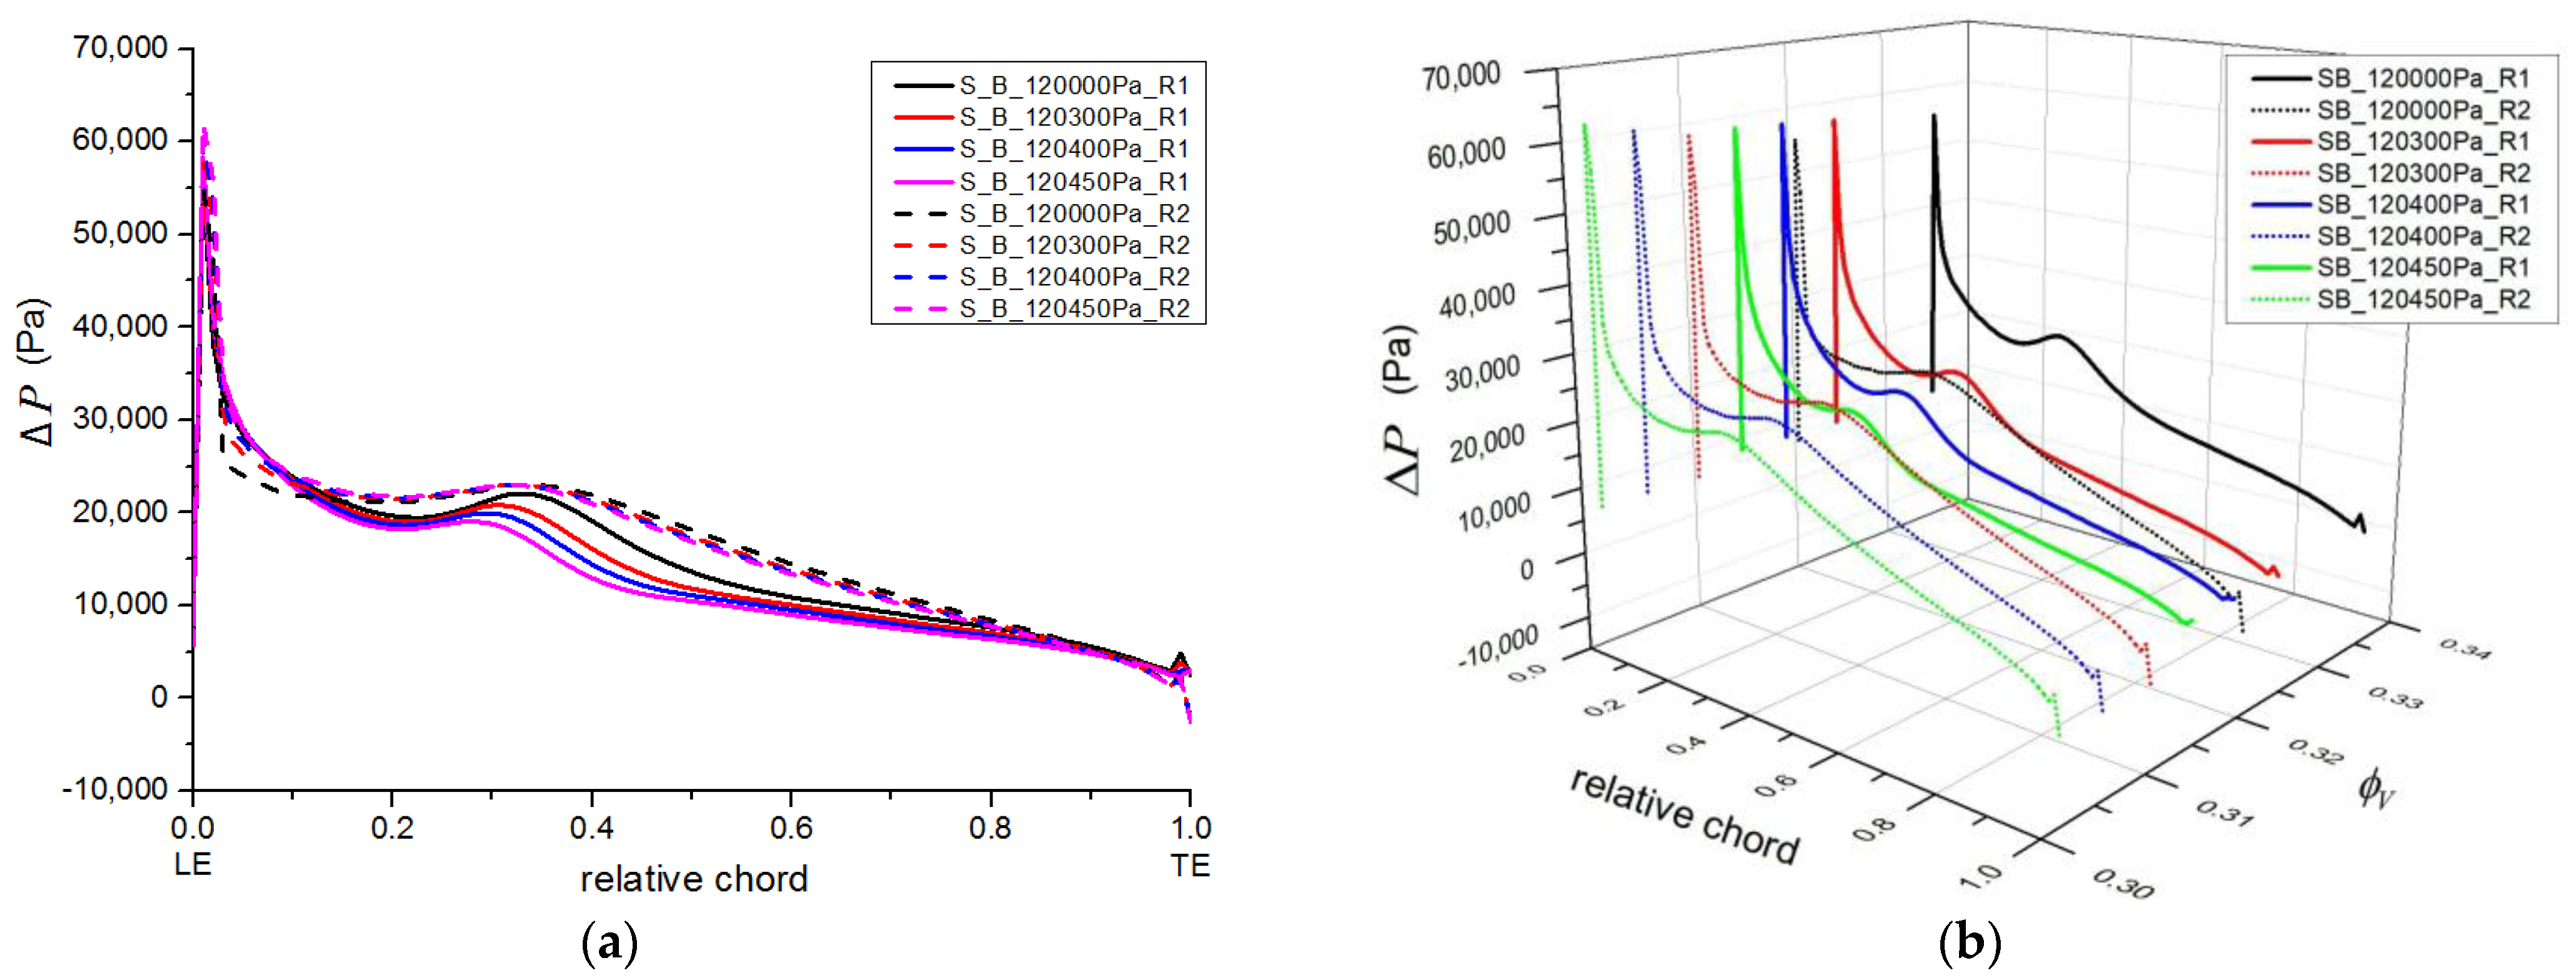
The local blade load is plotted along the blade chords for both stages at the different outlet pressures in Figure 8a; the inlet volume-flow-rate coefficients of the compressor are shown in Figure 8b. Slight convex curves were found for both stages operating near the design points. Similarly to the distributions in Figure 6, the local load in the leading-edge portion increased gradually with increasing outlet pressure; then, monotonic descent curves appeared. The monotonic descent curve of the first stage appeared earlier than that of the second stage. The local load curve of the first-stage became an oblique line, while the local load curve of the second-stage remained a slight convex shape. It can be concluded that even if the first stage reached its maximum pressure-rise operating point, the second stage would still have some potential to increase pressure-rise continuously. The local blade load is shown in Figure 8b as a 3D plot, with the volume-flow coefficient being the second independent parameter for both stages. It was observed that the second stage always operated under a higher volume flow coefficient. Considering the fact that both stages had a similar blade profile and that the local load curves always showed slight convex shapes, the first stage looks to be the bottleneck of this compressor.
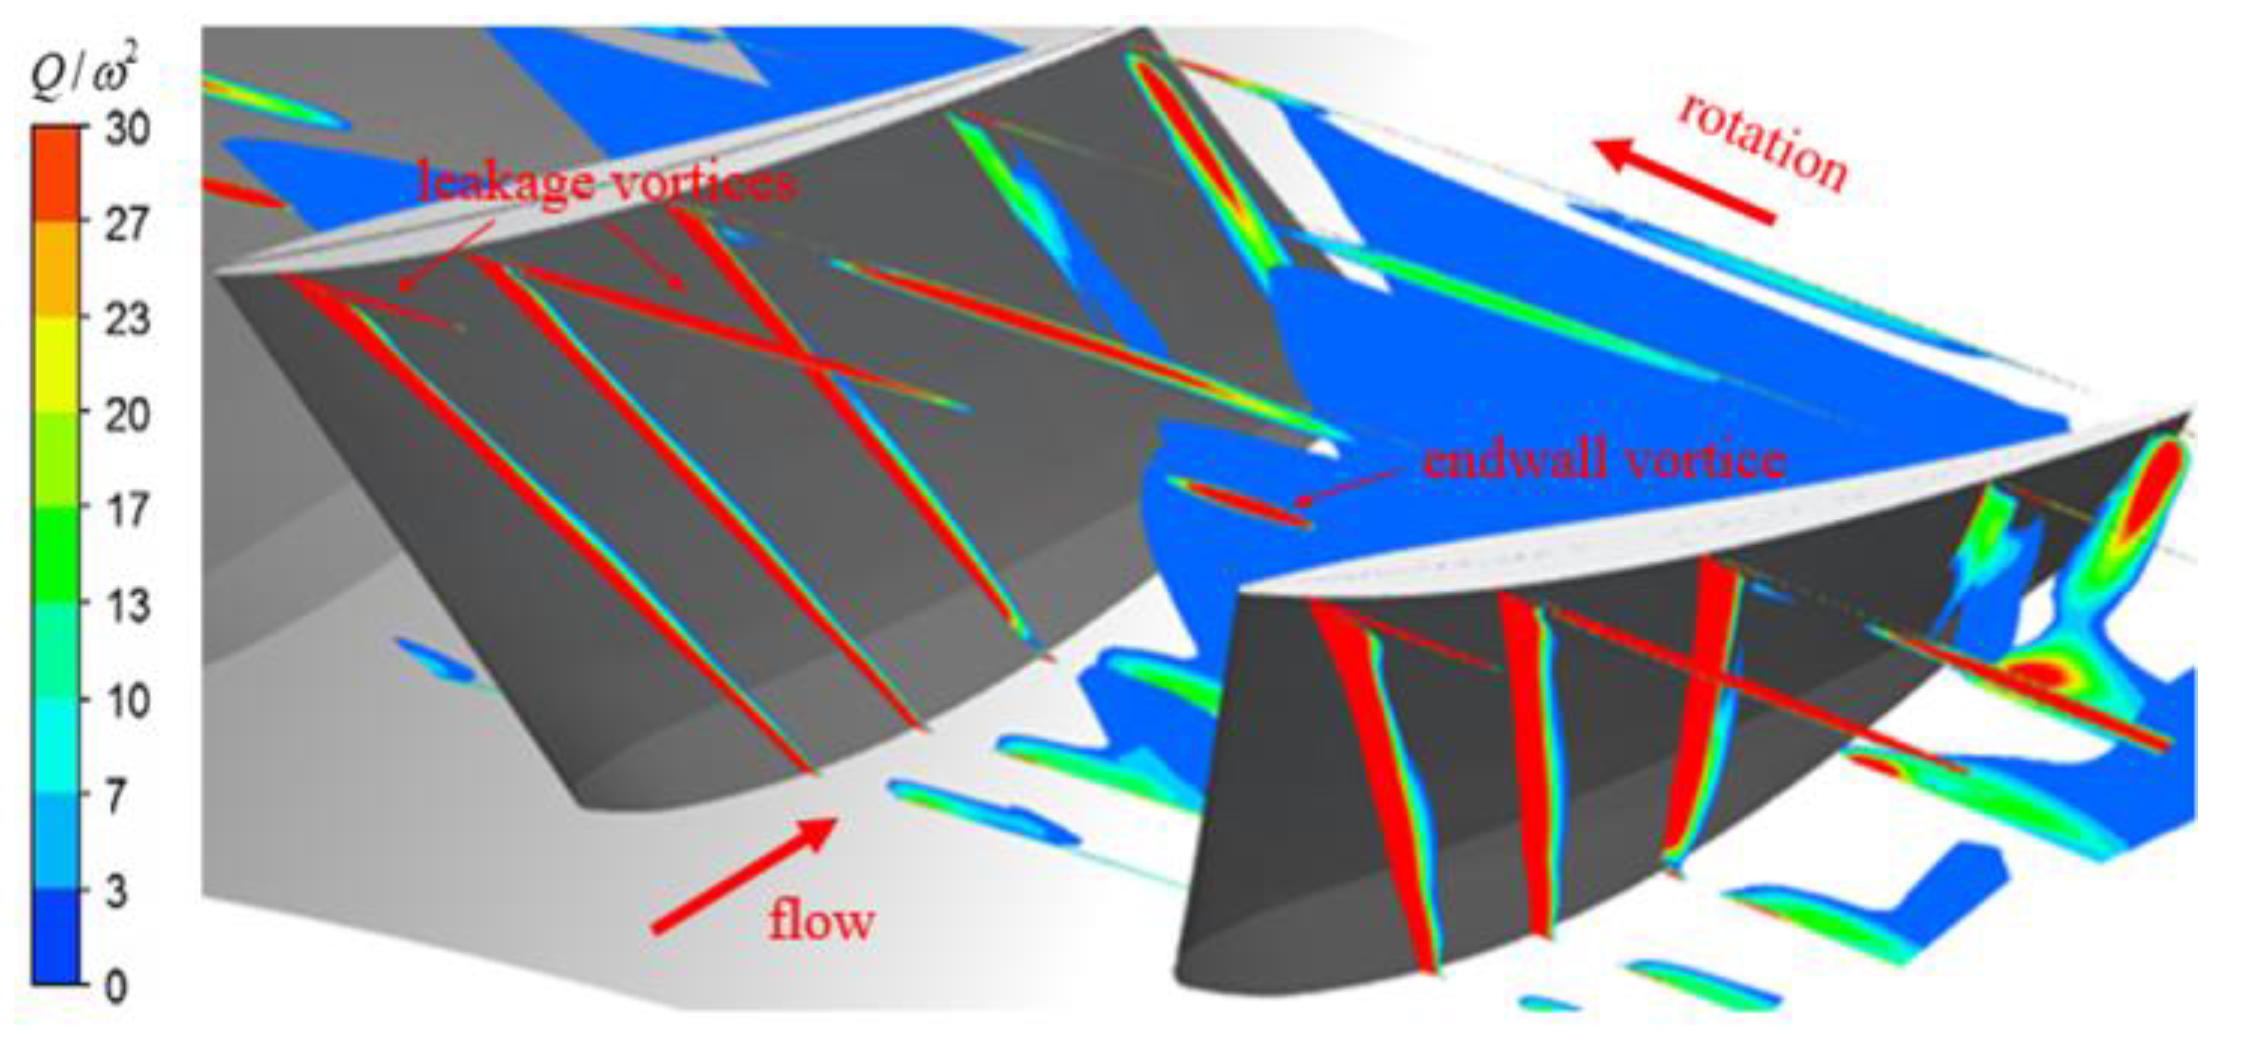
Some in-depth analysis of the first-stage rotor was then conducted. Figure 9 shows the relative Q-criterion contour in the first-stage rotor of the S_A model under near-stall conditions. It was found that the tip-leakage vortices and the separation vortices on the suction side were generated at the leading-edge portion of the blade. The tip-leakage vortices developed in streamwise, mixed with the end-wall vortices generated from the hub in the middle of the passage, then diffusing near the blade-passage exit. The mixed vortices occupied the most sectional area at the blade-passage outlet, resulting in near-stall conditions.
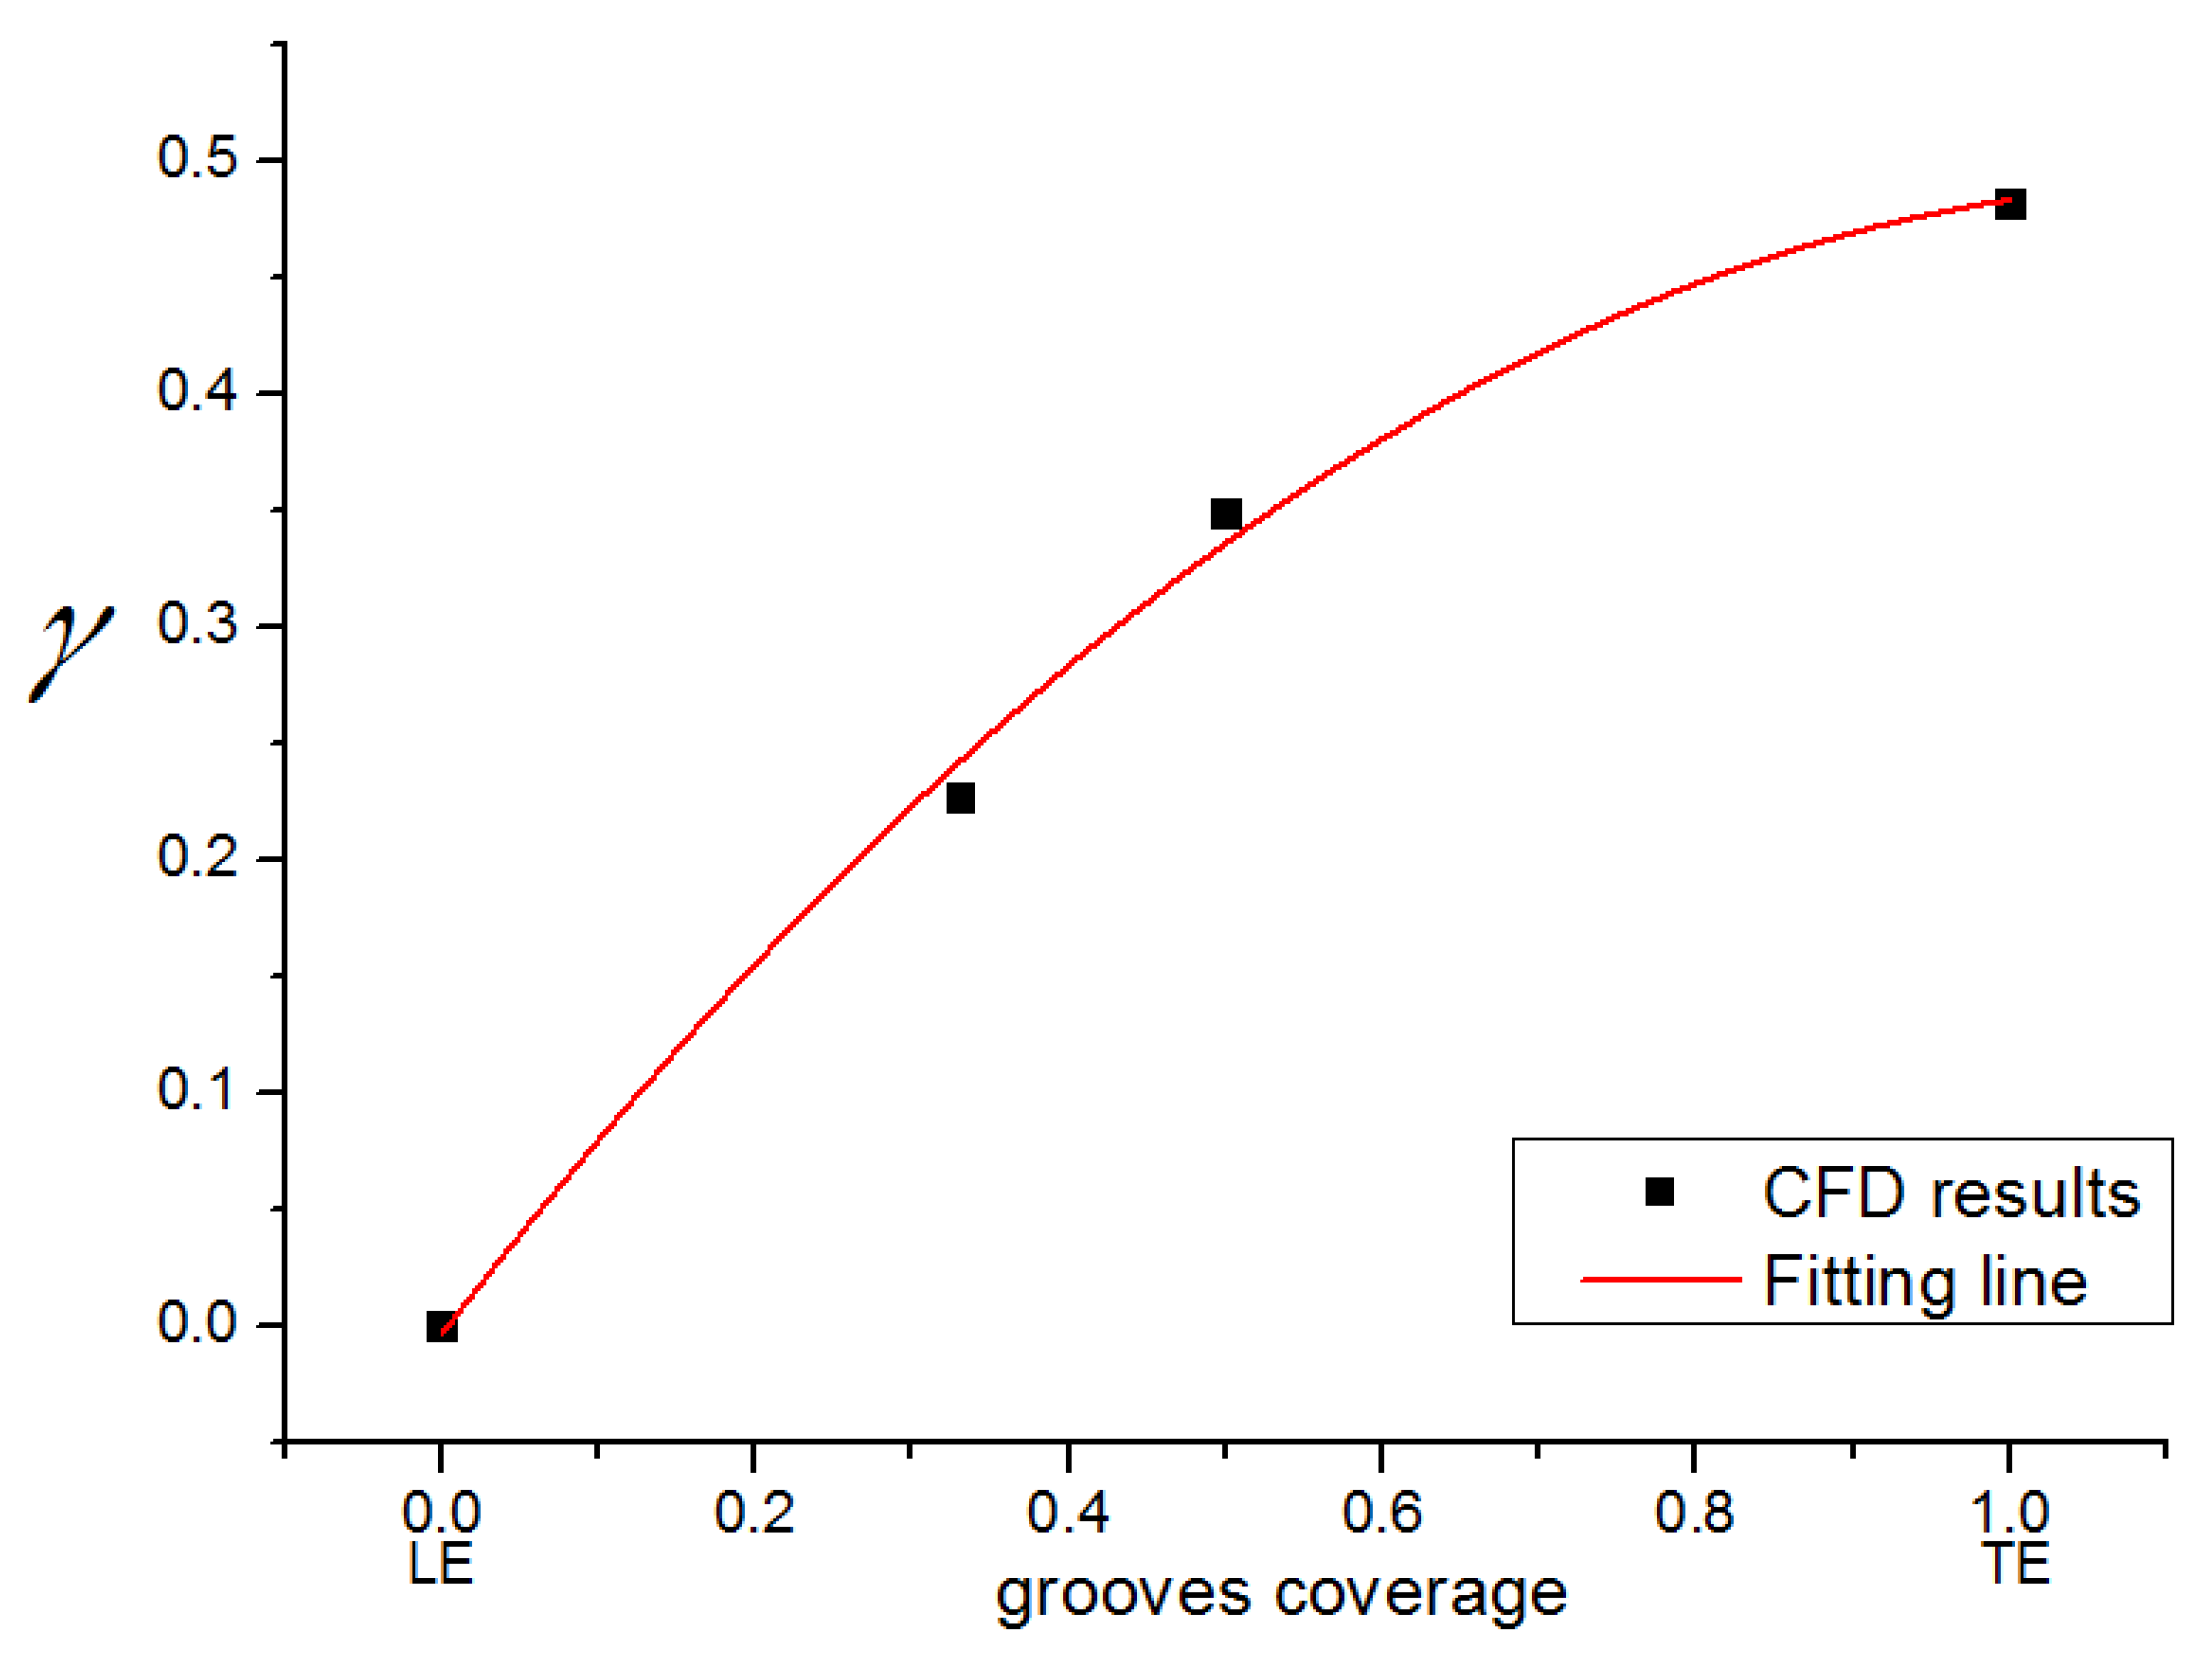
The effect of the CT was evaluated with the stability enhancement coefficient, γ:
γ = ϕ stall , A ϕ stall , G ϕ d ϕ stall , A × 100 %
where ϕ is the flow-rate coefficient, subscript “stall” represents the near-stall point, subscript “A” represents the smooth wall (without CT), subscript “G” represents the condition with the grooves and subscript “d” represents the design point.
Simulations were conducted with different groove-coverage ranges [15]. As shown in Figure 10, the stability-enhancement coefficients increased monotonically with increasing CT coverage. However, the first 50% of coverage contributed to the 70% stability enhancement. It would have been more cost-effective to configure the CT near the leading edge.
Figure 11 showed improvement of the S_B model over the S_A model in compressor performance. The circumferential-groove coverage was about 35% there. The working range was obviously extended via the stability enhancement effect of the circumferential grooves, with a little penalty of a decreasing pressure-rise coefficient.
The local leakage distributions with the S_B model along the blade chords for both stages are shown in Figure 12. The outlet pressure ranged from 120 kPa to 120.45 kPa to obtain the converged simulation results. Compared with that in Figure 6, the leakage-flow-distribution data pattern changed. Leakage flow in R1 generally decreased with increasing compressor outlet pressure, and in the 35% region covered in grooves, the leakage flow had a local minimum value.
The local blade-load curves for both stages, with the S_B model, are plotted in Figure 13. Compared with the results with the S_A model, the convex curves appeared under all of the working conditions, even the near-stall condition. The blade load in the leading-edge portion was reduced via the circumferential grooves. Furthermore, the convex curve of the second stage did not change characteristics with a flow-rate decrease; it maintained a continuous pressure-rise ability. At the same time, the local blade load of the first stage decreased with the flow-rate decrease. As a whole, the local load curves of the second stage were higher than those of the first stage.
It was concluded from the steady-simulation results that the distribution characteristic of local blade load has a strong effect on the maximum pressure-rise capability of the compressor. At least for the compressor under study, the stable operating range was mainly limited by the first stage. Stability enhancement could be achieved with a circumferential-groove casing treatment in the leading-edge portion.

3.2. Unsteady-Simulation Results Analysis

In addition to the steady-state simulation results, an unsteady simulation was necessary to reveal the interaction of rotor/stator cascades and unsteady interaction between the two stages of the compressor.
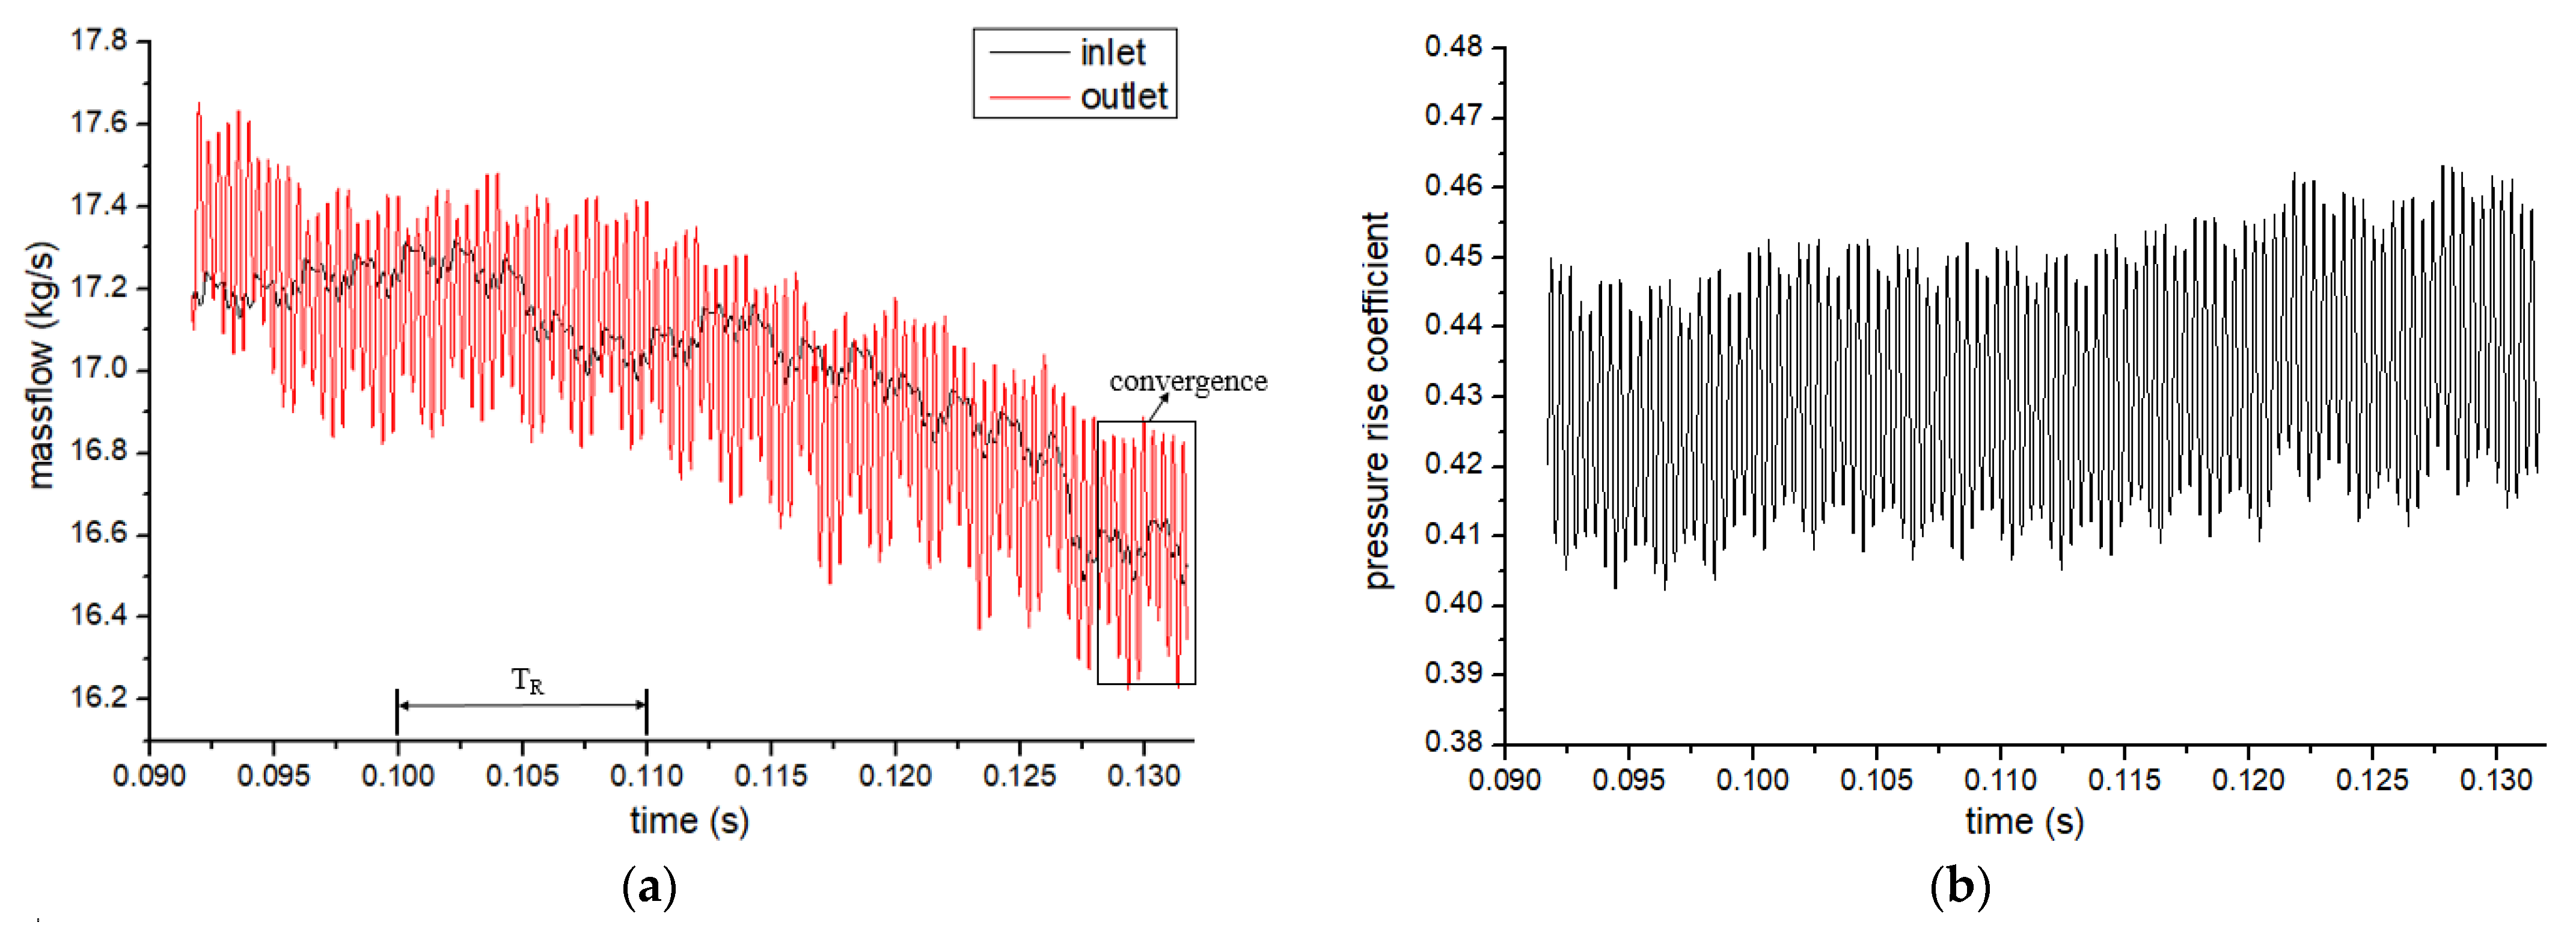
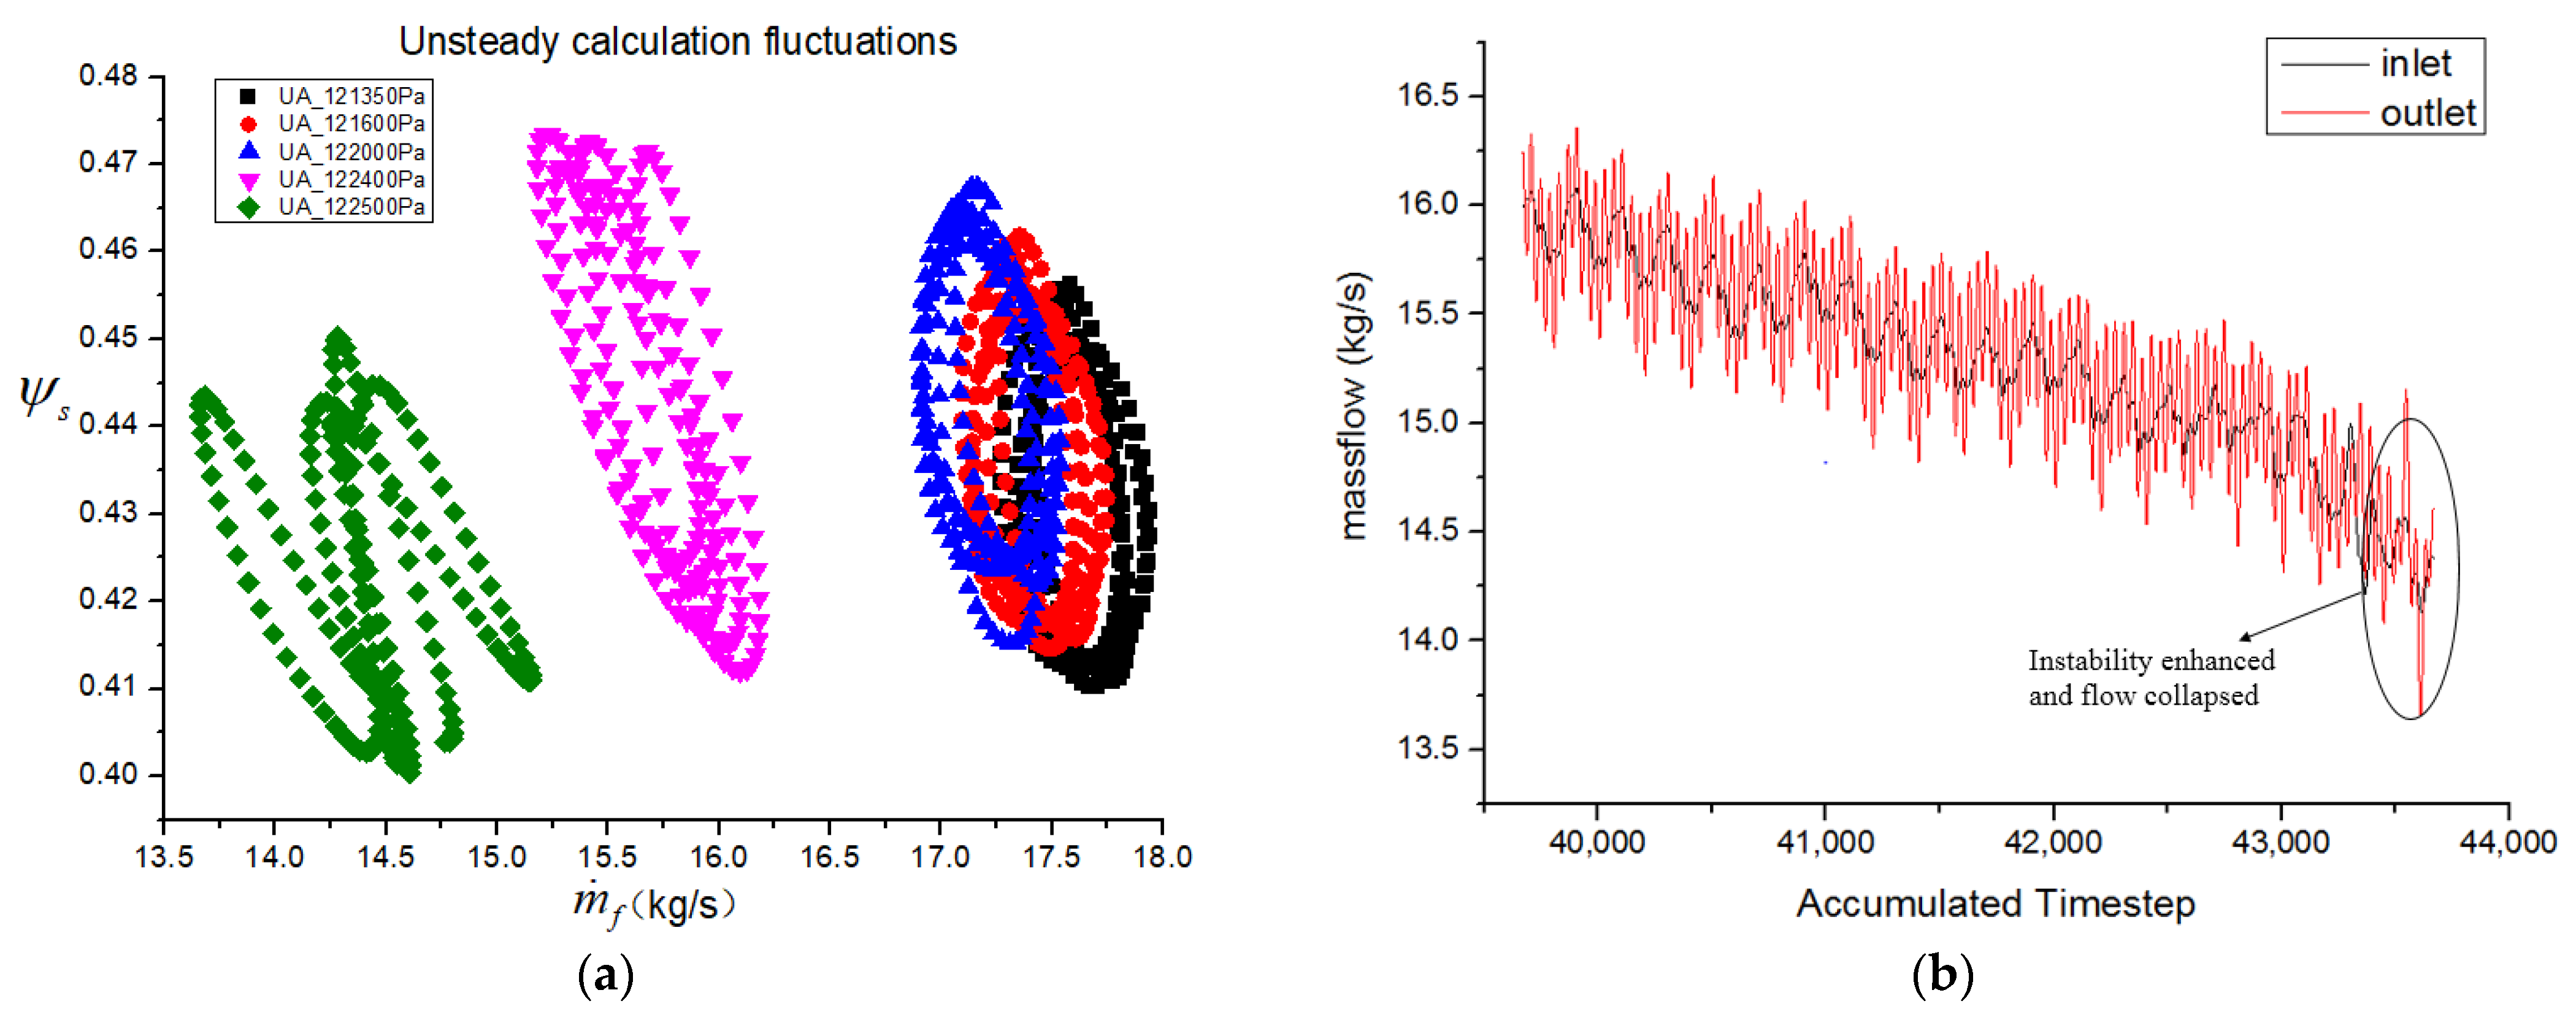
The convergence process of the unsteady simulation of the U_A model (unsteady and structure A) is shown in Figure 14a as loops in the phase diagram of the pressure-rise coefficient and the mass flow rate. The range of the loops becomes larger with increasing outlet pressure, indicating a greater possibility of developing into unstable flow. The mass flow rate with 122.5 kPa outlet pressure at each computing step is shown in Figure 14b. After some time, the mass-flow-rate curve had a significant drop, and the corresponding loop in the phase diagram also broke up. Both phenomena indicate the compressor flow becoming unstable.
The unsteady simulation resulted in a wider stable working range with the U_A model than did the steady simulation with the S_A model. The maximum outlet pressure achieved was 122.4 kPa, with a flow coefficient of 0.294, and the maximum pressure-rise coefficient increased to 0.706. Snapshots of the local load and the corresponding leakage-flow distribution for both stages are shown in Figure 15, with the exact time step appended to the legend of each curve. While the magnitudes were different, the distribution patterns were very similar to those obtained from the steady simulation. The following discussion focuses on the results for the near-stall flow.
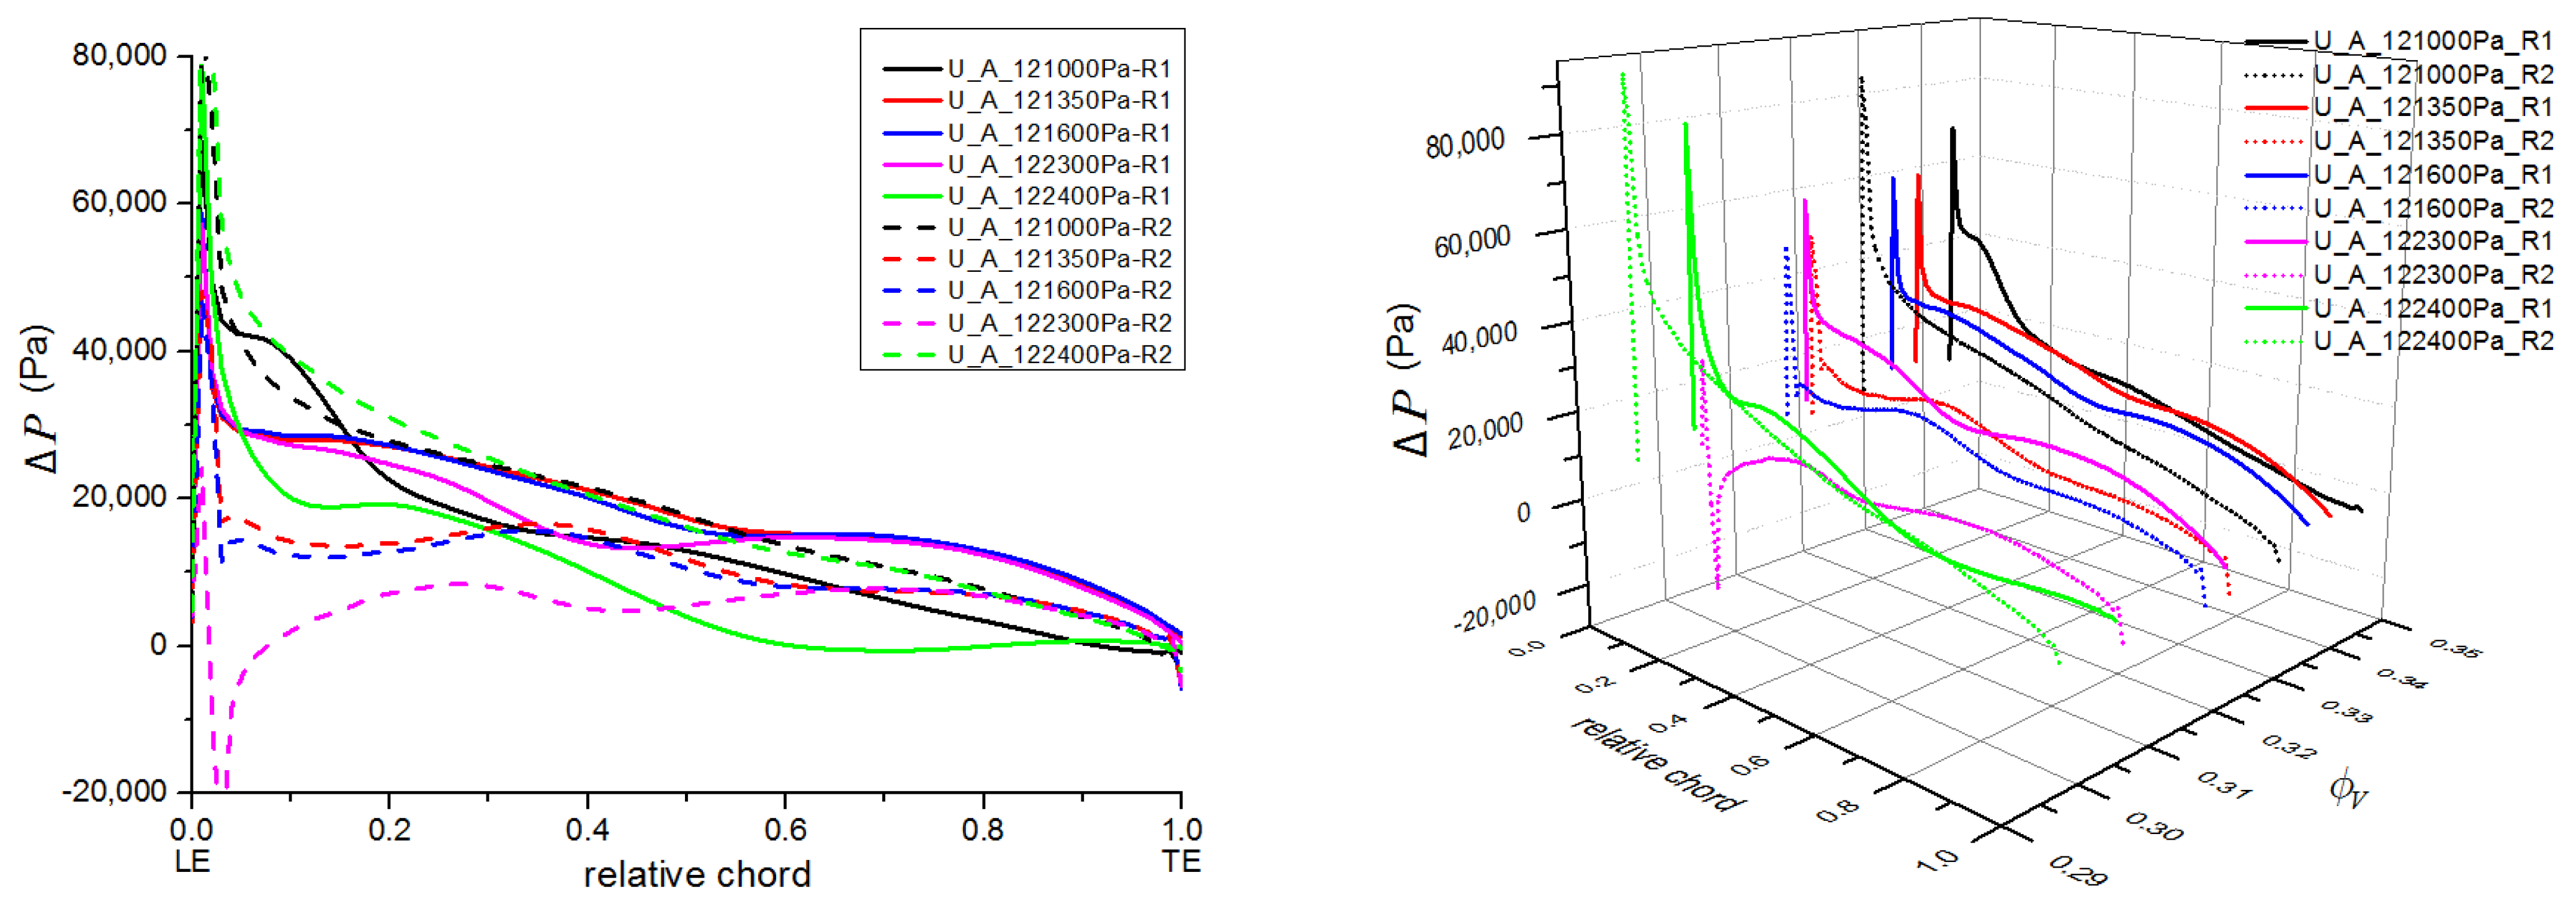
The local blade-load curves for both stages, with the U_A model, are plotted in Figure 16. The outlet pressure was set from 121 kPa to 122.4 kPa to obtain the converged solutions. On the condition of an outlet pressure of 121 kPa, the local load curves of the two rotor blades were both monotonic descent curves from the leading edge to the trailing edge. The load in the lending portion of the first stage was obviously higher than that of the second stage. Compared with the steady-simulation results given in Figure 8, a higher local load for the second stage was obtained here.
As the outlet pressure increased, the flow rate of the compressor decreased and the local load in the leading-edge portion of the first-stage rotor dropped distinctly. The first stage might have achieved its flow-rate stall limit. Due to the interaction of the two stages, the overall load distribution of the second stage was obviously reduced and presented as “fatter” curves in the largest part of the chord. This phenomenon was not observed in the steady-simulation results. It was inferred that the influence of the local load on the flow-rate stall limit would be compensated for with the second stage. The load in the leading-edge portion of the first stage was mitigated by the interaction; then, the two-stage compressor as a whole could extend its stable working range to the lower-flow-rate conditions. When the outlet pressure reached 122.3 kPa, the local load of the second stage decreased further, to a negative value, in the leading-edge portion. This suggests that instability, causing interaction between the two stages, might happen. When the outlet pressure was increased to 122.4 kPa, some abrupt changes happened. The overall load curve of the first stage moved downward as a whole, while the trailing-edge portion became negative, which meant the portion lost its normal pressure-rise capability. Meanwhile, the load curve of the second stage remained a monotonic descent curve.
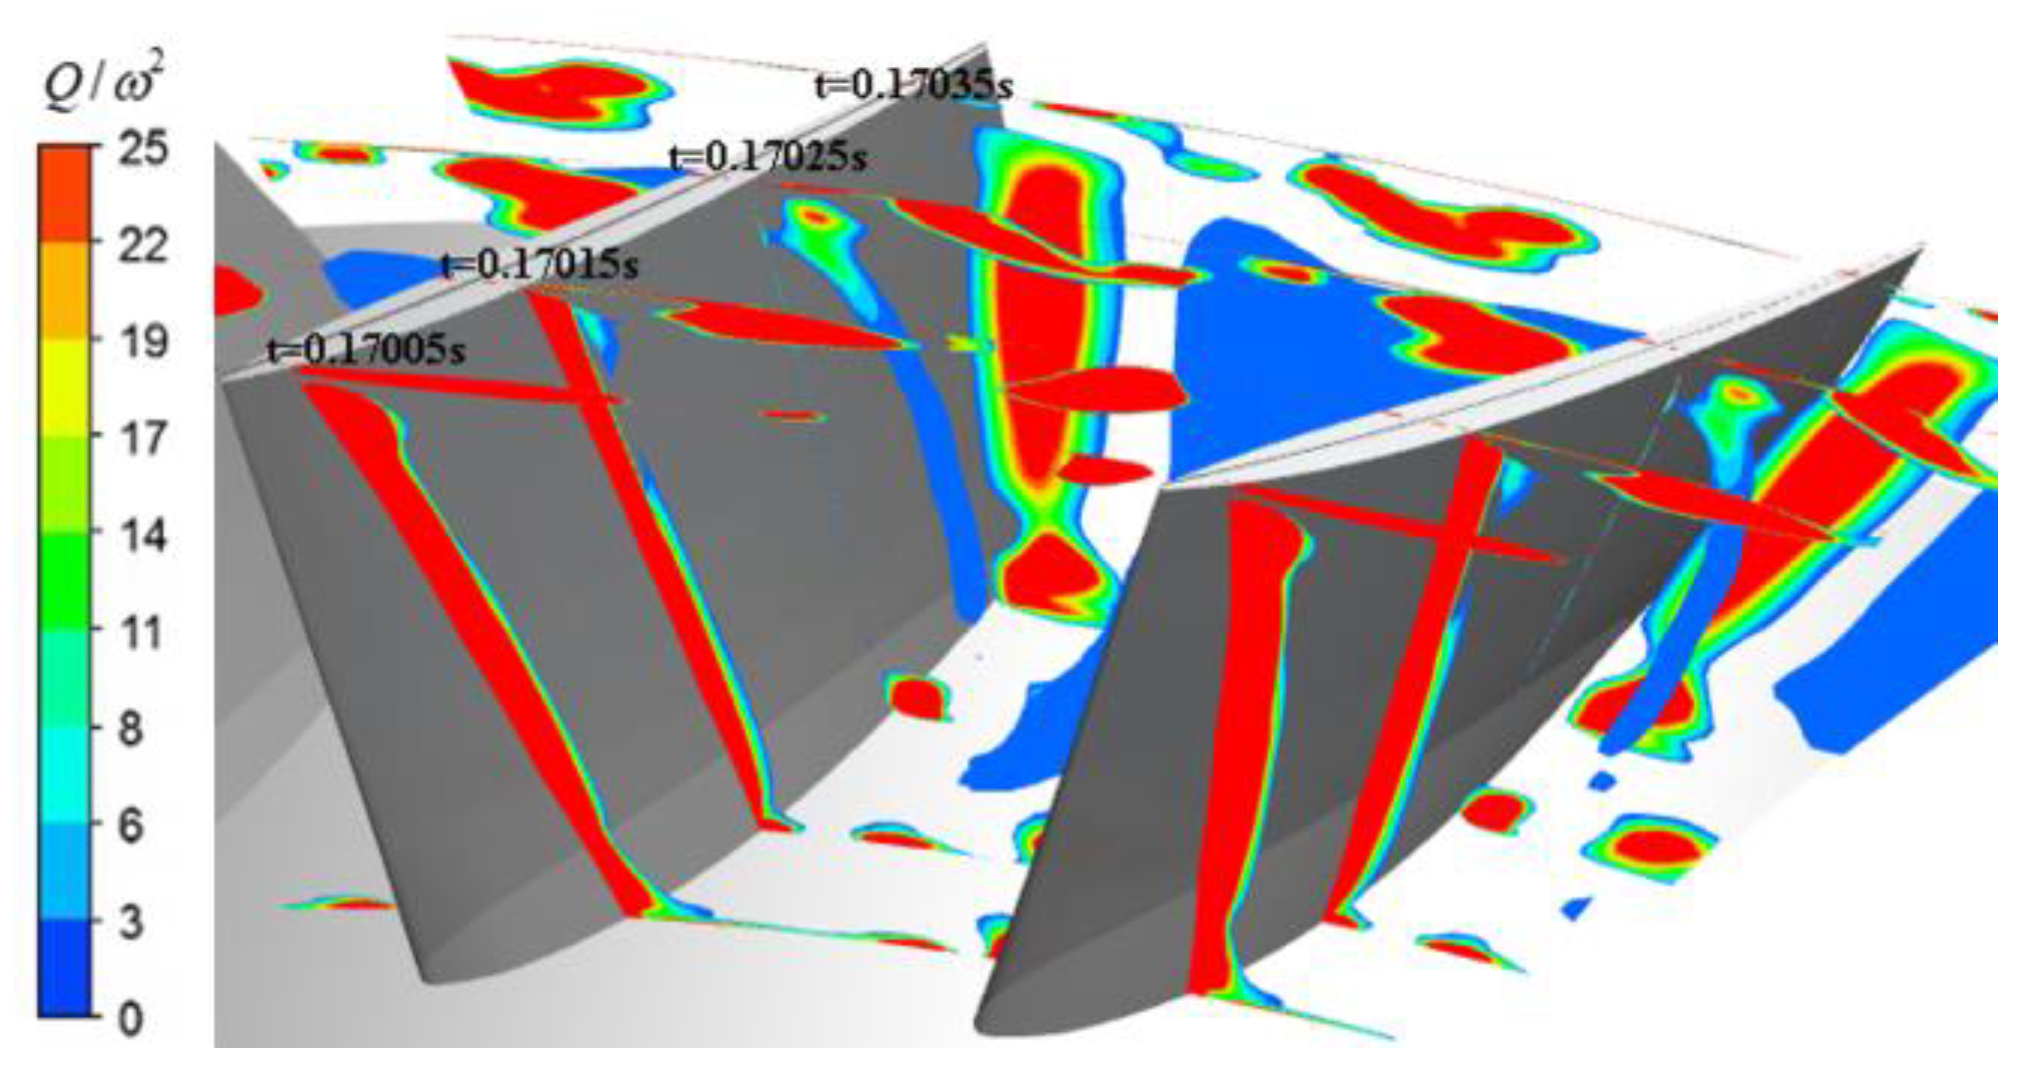
The vortex development in the first stage was explored. Figure 17 shows snapshots of the relative Q-criterion contours on the sections during the unsteady simulation of the “U_A_122400Pa” model. These vortices occupied more space than those in Figure 8. The vortex on the suction surface gradually separated from the wall in the flowing process. The leakage vortex and the separation vortex gradually spread to the whole sectional area. The flow with vortices was reorganized via the stator (S1); then, the inlet flow of the second stage was improved to pressurize the fluid normally, while the first-stage flow further reached its lowest flow rate. Referring to the load curve in Figure 16, the second-stage rotor displayed a maximum pressure-rise capacity in this case.
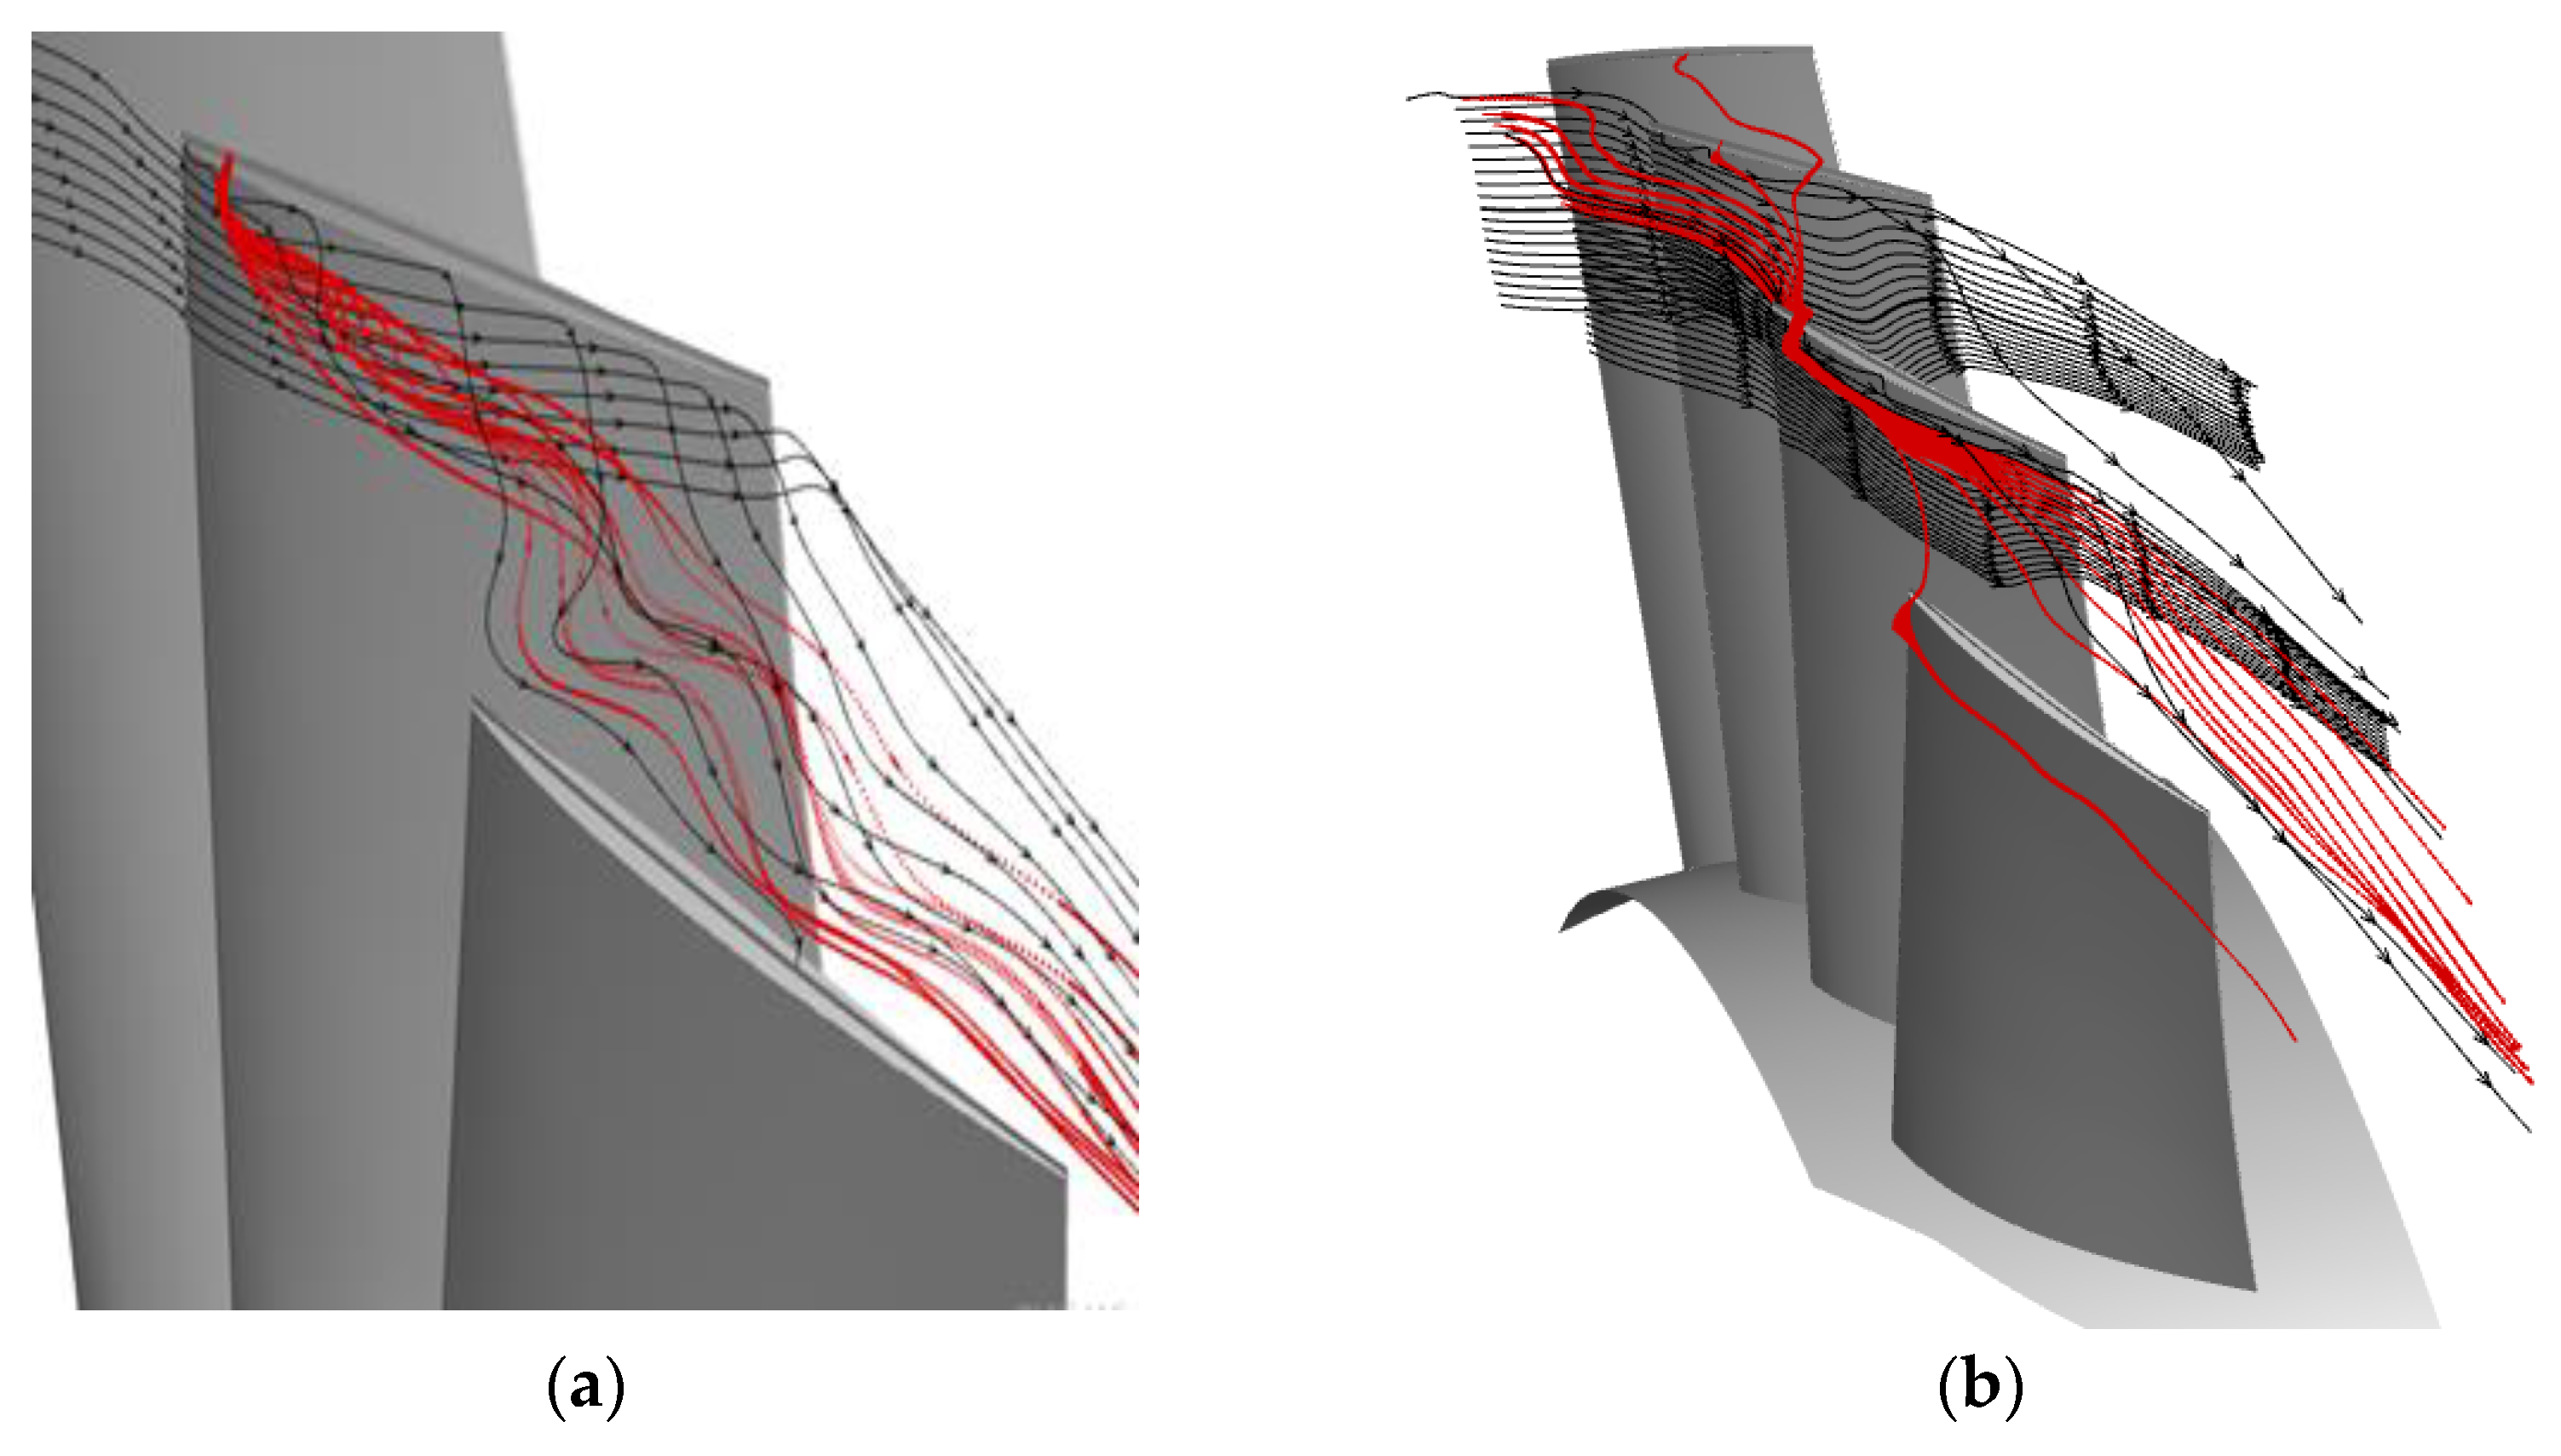
Figure 18 shows the streamlines of flow in the blade-tip regions of both stages’ rotors in the “U_A_122400Pa” model. The leakage flow (red streamlines) left the blade-tip-clearance region, which was driven by the local load, and mixed with the main stream near the casing in Figure 18a. Extra momentum from the leakage flow drove the mixed flow to the tip clearance of the adjacent blade. Figure 18b shows that the tip-leakage flow propagated circumferentially across all blade passages in the second stage. The so-called “leading edge overflow” phenomenon appeared. It was inferred that the second stage was in the extreme load condition, corresponding to the maximum pressure-rise capacity of the two-stage compressor.
It was concluded through the unsteady-simulation results that the extreme local blade load appeared first in the leading-edge portion of the first stage, with a decreasing flow rate. The second stage could compensate for the first-stage performance through reducing its blade load. Therefore, the unsteady simulation gave a lower flow-rate-stall limit for the compressor. Unsteady interaction between the two stages drive them to the near-stall condition.

4. Conclusions

The steady and unsteady flow fields of the two-stage axial-flow compressor were analyzed numerically. Occurrences of flow instability were investigated with the interaction of the two stages. The main conclusions are as follows:
The numerical performance indicated that the distribution of the tip-leakage flow exhibited a decreasing trend from the leading edge to the trailing edge of the blade in the near-stall condition. The leakage flow was driven by the local load over the whole working range.
The highest blade load in the leading-edge portion of the first-stage rotor limited reduction in the flow rate via the steady-simulation results. With circumferential grooves on the rotor cascade, the blade load between the pressure and suction surfaces was neutralized and the flow stability was improved. It was verified that the circumferential-groove casing treatment has a positive effect on stability enhancement.
The effect of interstage matching on instability characteristics was investigated here. The unsteady-simulation results showed that the limiting blade load first appeared in the front of the first-stage rotor with a flow-rate reduction. The second-stage rotor then compensated for the first-stage flow via reducing the blade load of the first stage. The mass flow rate of the whole machine could be further reduced to some extent via the matching design technique. The instability characteristics that first appeared in a certain stage could be alleviated via the adjacent stage in a multistage axial-flow compressor. It was proven that the flow-rate stall limit could be compensated for with the other stages in the multistage axial-flow compressor and not absolutely limited by a specific stage.

Author Contributions

Conceptualization, T.W.; Data curation, T.W. and X.D.; Funding acquisition, Y.L.; Methodology, T.W. and Y.L.; Software, X.D.; Supervision, T.W.; Validation, T.W. and X.D.; Writing—Original Draft, X.D.; Writing—Review & Editing, T.W., X.D. and Y.L. All authors have read and agreed to the published version of this manuscript.

Funding

This research was funded by National Science and Technology Major Project of China grand No. 2017-V-0002-0051 and Science Center for Gas Turbine Project of China grand number P2021-A-I-003-002. The authors would like to give our thanks to the foundation committees.

Data Availability Statement

Not available.

Conflicts of Interest

The authors declare no conflict of interest.

References

  1. Emmons, H.W. Compressor surge and stall propagation. Trans. ASME 1955, 77, 455–467. [Google Scholar] [CrossRef]
  2. Moore, F.K.; Greitzer, E.M. A theory of post-stall transients in axial compression systems: Part I—Development of equations. J. Eng. Gas Turbines Power 1986, 108, 68–76. [Google Scholar] [CrossRef]
  3. McDougall, N.M.; Cumpsty, N.A.; Hynes, T.P. Stall inception in axial compressors. J. Turbomach. 1990, 112, 116–123. [Google Scholar] [CrossRef]
  4. Day, I.J. Stall inception in axial flow compressors. J. Turbomach. 1993, 115, 1–9. [Google Scholar] [CrossRef]
  5. Camp, T.R.; Day, I.J. A Study of Spike and Modal Stall Phenomena in a Low-Speed Axial Compressor; American Society of Mechanical Engineers: New York, NY, USA, 1997. [Google Scholar]
  6. Hoying, D.A.; Tan, C.S.; Vo, H.D.; Greitzer, E.M. Role of blade passage flow structurs in axial compressor rotating stall inception. J. Turbomach. 1999, 121, 735–742. [Google Scholar] [CrossRef]
  7. Saathoff, H.; Stark, U. Tip clearance flow induced endwall boundary layer separation in a single–stage axial–flow low–speed compressor. In Turbo Expo: Power for Land, Sea, and Air; American Society of Mechanical Engineers: New York, NY, USA, 2000; Volume 78545, p. V001T03A070. [Google Scholar]
  8. Vo, H.D.; Tan, C.S.; Greitzer, E.M. Criteria for spike initiated rotating stall. J. Turbomach. 2008, 130, 011023. [Google Scholar] [CrossRef]
  9. Pullan, G.; Young, A.M.; Day, I.J.; Greitzer, E.M.; Spakovszky, Z.S. Origins and structure of spike-type rotating stall. J. Turbomach. 2015, 137, 051007. [Google Scholar] [CrossRef]
  10. Kameier, F.; Neise, W. Experimental study of tip clearance losses and noise in axial turbomachines and their reduction. J. Turbomach. 1997, 119, 460–471. [Google Scholar] [CrossRef]
  11. Yamada, K.; Furukawa, M.; Nakano, T.; Inoue, M.; Funazaki, K. Unsteady three-dimensional flow phenomena due to breakdown of tip leakage vortex in a transonic axial compressor rotor. In Turbo Expo: Power for Land, Sea, and Air; American Society of Mechanical Engineers: New York, NY, USA, 2004; Volume 41707, pp. 515–526. [Google Scholar]
  12. Du, J. Investigation on Unsteady Mechanism of a Transonic Compressor/Fan Rotor Tip Leakage Flow; Institute of Engineering Thermophysics, Chinese Academy of Sciences: Beijing, China, 2010. [Google Scholar]
  13. Wu, Y.; Wu, J.; Zhang, G.; Chu, W. Experimental and numerical investigation of flow characteristics near casing in an axial flow compressor rotor at stable and stall inception conditions. J. Fluids Eng. 2014, 136, 111106. [Google Scholar] [CrossRef]
  14. An, G.; Wu, Y.; Lang, J.; Chen, Z.; Wang, B. Investigation on unsteady flow and related mechanism in a transonic compressor rotor near stall condition. J. Propuls. Technol. 2016, 37, 1847–1854. [Google Scholar]
  15. Dou, X.; Wang, T.; Qu, X. Investigation on the circumferential grooves effects in a two-stage axial flow compressor. J. Phys. Conf. Ser. 2022, 2217, 012056. [Google Scholar] [CrossRef]
Figure 1. Cascades in the computational domain.
Machines 11 00401 g001
Figure 2. Casing-treatment structures with circumferential grooves.
Machines 11 00401 g002
Figure 3. Parameter convergence history during unsteady simulation. (a) Mass flow-rate signal and (b) pressure-rise coefficient signal.
Machines 11 00401 g003
Figure 4. Monitoring of curves during steady simulation.
Machines 11 00401 g004
Figure 5. Comparison of numerical and experimental results at 3000 rpm.
Machines 11 00401 g005
Figure 6. Relative leakage-flow distribution in S_A modal at 6000 rpm. (a) Local leakage flow in R1 and (b) local leakage flow in R2.
Machines 11 00401 g006
Figure 7. Relationship between local load difference and local leakage flow.
Machines 11 00401 g007
Figure 8. Load curve of blade-tip region in the S_A model. (a) Blade load vs. relative chord and (b) blade load vs. relative chord and volume flow.
Machines 11 00401 g008
Figure 9. Relative Q-criterion contour of S_A_120700Pa_R1.
Machines 11 00401 g009
Figure 10. Stability enhancement effects of the different CT models.
Machines 11 00401 g010
Figure 11. Performance near-stall points with the S_A and S_B models.
Machines 11 00401 g011
Figure 12. Relative leakage flow distribution with the S_B model at 6000 rpm. (a) First-stage rotor, R1, and (b) second-stage rotor, R2.
Machines 11 00401 g012
Figure 13. Load curve of blade-tip region under low-flow conditions in the S_B model. (a) Blade load and (b) blade load with volume flow.
Machines 11 00401 g013
Figure 14. Unsteady parameter fluctuation. (a) Parameter fluctuation under various working conditions with the U_A model and (b) flow-monitoring curve of U_A_122500Pa.
Machines 11 00401 g014
Figure 15. Blade load and corresponding leakage along chord under unsteady conditions. (a) Blade load and (b) corresponding leakage flow.
Machines 11 00401 g015
Figure 16. Local blade-load distribution under low-flow conditions in the U_A model.
Machines 11 00401 g016
Figure 17. Snapshots of relative Q-criterion contours of R1 passage.
Machines 11 00401 g017
Figure 18. Blade-tip streamlines in in the U_A_122400Pa model. (a) First-stage rotor, R1, and (b) second-stage rotor, R2.
Machines 11 00401 g018
Table 1. Notations of the numerical models with/without CT.
CTStructure AStructure B
Method
SteadyS_AS_B
UnsteadyU_A
Table 2. Steady numerical simulation performance of the S_A model.
Outlet Pressure (kPa)Volume-Flow-Rate
Coefficient
Static-Pressure-Rise
Coefficient
110.00.4680.213
115.00.4250.432
120.00.3400.649
120.70.3240.670
Disclaimer/Publisher’s Note: The statements, opinions and data contained in all publications are solely those of the individual author(s) and contributor(s) and not of MDPI and/or the editor(s). MDPI and/or the editor(s) disclaim responsibility for any injury to people or property resulting from any ideas, methods, instructions or products referred to in the content.

