2. Related Work
The liver is an essential organ that plays a critical role in removing toxins from the blood, aiding in digestion and metabolism. Any disruption in its function can lead to significant consequences in the body. The major types of liver diseases include hepatitis and cirrhosis, and early symptoms of liver disease may include nausea and fatigue. However, liver problems may not be diagnosed until they are advanced, and other symptoms may include itching, yellowing of the skin, and dark urine.
The diagnosis of liver disease typically involves a blood test that assesses the levels of alanine aminotransferase (ALT), aspartate aminotransferase (AST), or gamma-glutamic transferase (GGT). However, a liver biopsy may be needed to confirm the diagnosis and determine if treatment is necessary.
In [
10], a researcher developed a system that integrates data mining with Decision Tree (DT) and fuzzy logic to explore and control hepatitis C virus infection. The study used Trapezoidal Fuzzy Number (TFN) to predict the disease’s outcome and achieved a prediction accuracy of 98.1%, which is higher than DT’s prediction accuracy of 92.5%. This study suggests that integrating data mining techniques with fuzzy logic and DT can be an effective approach to explore and control hepatitis C virus infection. The high prediction accuracy achieved using TFN indicates the potential of this approach in improving the accuracy of diagnosis and treatment of liver diseases.
The work in [
4] analyzed the data of 4962 hepatitis C virus (HCV) patients in Egypt from 2006 to 2017 using machine learning techniques to identify the presence of esophageal varices, which is a common consequence of chronic liver disease. The study aimed to find a non-invasive approach to detect the existence of esophageal varices instead of using upper gastrointestinal endoscopy, which is a burdensome and unpleasant procedure for many patients. The study used 24 clinical laboratory variables and six well-known classifiers, namely Neural Networks (NNs), Naive Bayes (NB), Decision Tree (DT), Support Vector Machine (SVM), Random Forest (RF), and Bayesian Network (BN) to predict the presence of esophageal varices. The dataset was obtained from the Egyptian National Committee to Combat Viral Hepatitis, which is responsible for the national treatment program for viral hepatitis patients in Egypt, and the Ministry of Health oversees it. The study achieved an accuracy rate of 67.8%, 66.3%, 67.2%, 65.6%, 66.7%, and 68.9% using SVM, RF, C4.5, MLP, NB, and BN classifiers, respectively. These accuracy rates indicate that machine learning algorithms have the potential to detect the presence of esophageal varices using non-invasive approaches. The study suggests that machine learning techniques can be effective in predicting the presence of esophageal varices in patients with chronic liver disease. This non-invasive approach could potentially reduce the burden on endoscopy units and improve patient experience.
The work in [
11] developed a machine learning algorithm for predicting Hepatocellular Carcinoma (HCC) in patients with HCV-related chronic liver disease. They used a collection of filtered input variables to obtain the best variable subset, and they employed three different classifiers: Logistic Regression (LR), Decision Tree (DT), and Classification and Regression Tree (CART). The study found that the accuracy levels achieved using LR, DT, and CART were 96%, 99%, and 95.5%, respectively. This suggests that machine learning algorithms have a high potential for predicting HCC in patients with HCV-related chronic liver disease, which could help in early diagnosis and personalized treatment plans. The study also highlights the importance of selecting the best subset of input variables to improve the accuracy of the prediction model.
In [
8], the authors used machine learning techniques to predict outcomes of HCV based on viral nucleotides. They employed four different classifiers: Decision Tree (DT), Support Vector Machine (SVM), Naive Bayes (NB), and Neural Network (NN). They used processed features to predict the response to Interferon-alpha (IFN-alpha) and ribavirin (RBV) medication. The authors generated ten attribute weighting models using the basic dataset’s 76 attributes. These models were generated using various properties such as Chi-square, Gini index, Deviation, Info-Gain, Info-Gain Ratio, SVM, PCA, uncertainty, relief, and rule. Next, they categorized the 11 characteristics using SVM, NB, NN, and DT and achieved an average accuracy of 85% in predicting the response to IFN-alpha and RBV medication. The study highlights the potential of using machine learning techniques for predicting the response to medication, which could help in personalized treatment plans for patients with HCV. The authors in [
9] developed a machine learning-based prediction model for HCV using two different classifiers: Random Forest and K-Nearest Neighbors Algorithm. They used a dataset that included 668 cases of mild to moderate class 0 cirrhosis and 717 cases of class 1 cirrhosis. They used different features and characteristics to train the model. The goal was to identify the most efficient combination of characteristics to improve the accuracy of the model. Their study highlights the potential of using machine learning techniques for predicting HCV and improving patient outcomes.
While the Decision Tree algorithm used by [
10] achieved the highest accuracy, the studies had limitations in terms of not using Shapley techniques to interpret the models. Shapley techniques can help explain how the features in the model contribute to the predictions and can provide insights into the underlying relationships between the features and the target variable. By using Shapley techniques, the researchers could have gained a better understanding of the importance of different features in predicting the presence of HCV in patients.
Table 1 shows the summary of the related works.
3. Materials and Methods
3.1. Dataset
The dataset used in this study was obtained from The Hospital of Jordan University and contained information about 1801 individuals tested for the hepatitis C virus. The data were collected using different types of blood tests that can be performed. The first type of test listed is the albumin blood (ALB) test, which measures the amount of albumin in the blood. Low albumin levels can indicate liver or kidney disease or another medical condition. The second test listed is the alkaline phosphatase (ALP) test, which measures the amount of ALP in the blood. ALP is an enzyme found in many body parts, and the test results are expressed numerically. The third test listed is the alanine transaminase (ALT) test, which assesses liver health by measuring the amount of ALT enzyme in the blood. The results are also expressed numerically. The fourth test listed is the AST (aspartate aminotransferase) test, which measures the amount of the enzyme in the blood. The BIL test is also listed, and its results are expressed numerically. The cholesterol levels test measures the amount of cholesterol and certain fats in the blood; its results are expressed numerically. The creatinine test measures creatinine levels in blood and urine; its results are expressed numerically. The gamma-glutamyl transferase (GGT) test measures the amount of GGT in the blood, and its results are expressed numerically. The total protein test (PROT) measures the total amount of two classes of proteins found in the fluid portion of the blood, and its results are expressed numerically. The table also includes age, gender, patient ID, and class (infected or uninfected), expressed numerically for age and patient ID and as binary values (male/female or infected/uninfected) for gender and class. The class label attribute is the dependent variable for the machine learning algorithms and divides the records into two categories: infected and uninfected. The attribute values were obtained from various medical tests. The dataset consists of 1801 instances and 13 attributes, including the class attribute. The attributes are split into two binary attributes and eleven numerical attributes. The HCV diagnosis dataset consists of 1801 patient records, out of which 294 patients are HCV positive, and the remaining patients are HCV negative. These data will be used to train and test the machine learning algorithms to predict the likelihood of a person being infected with the virus.
Table 2 shows the features and meaning.
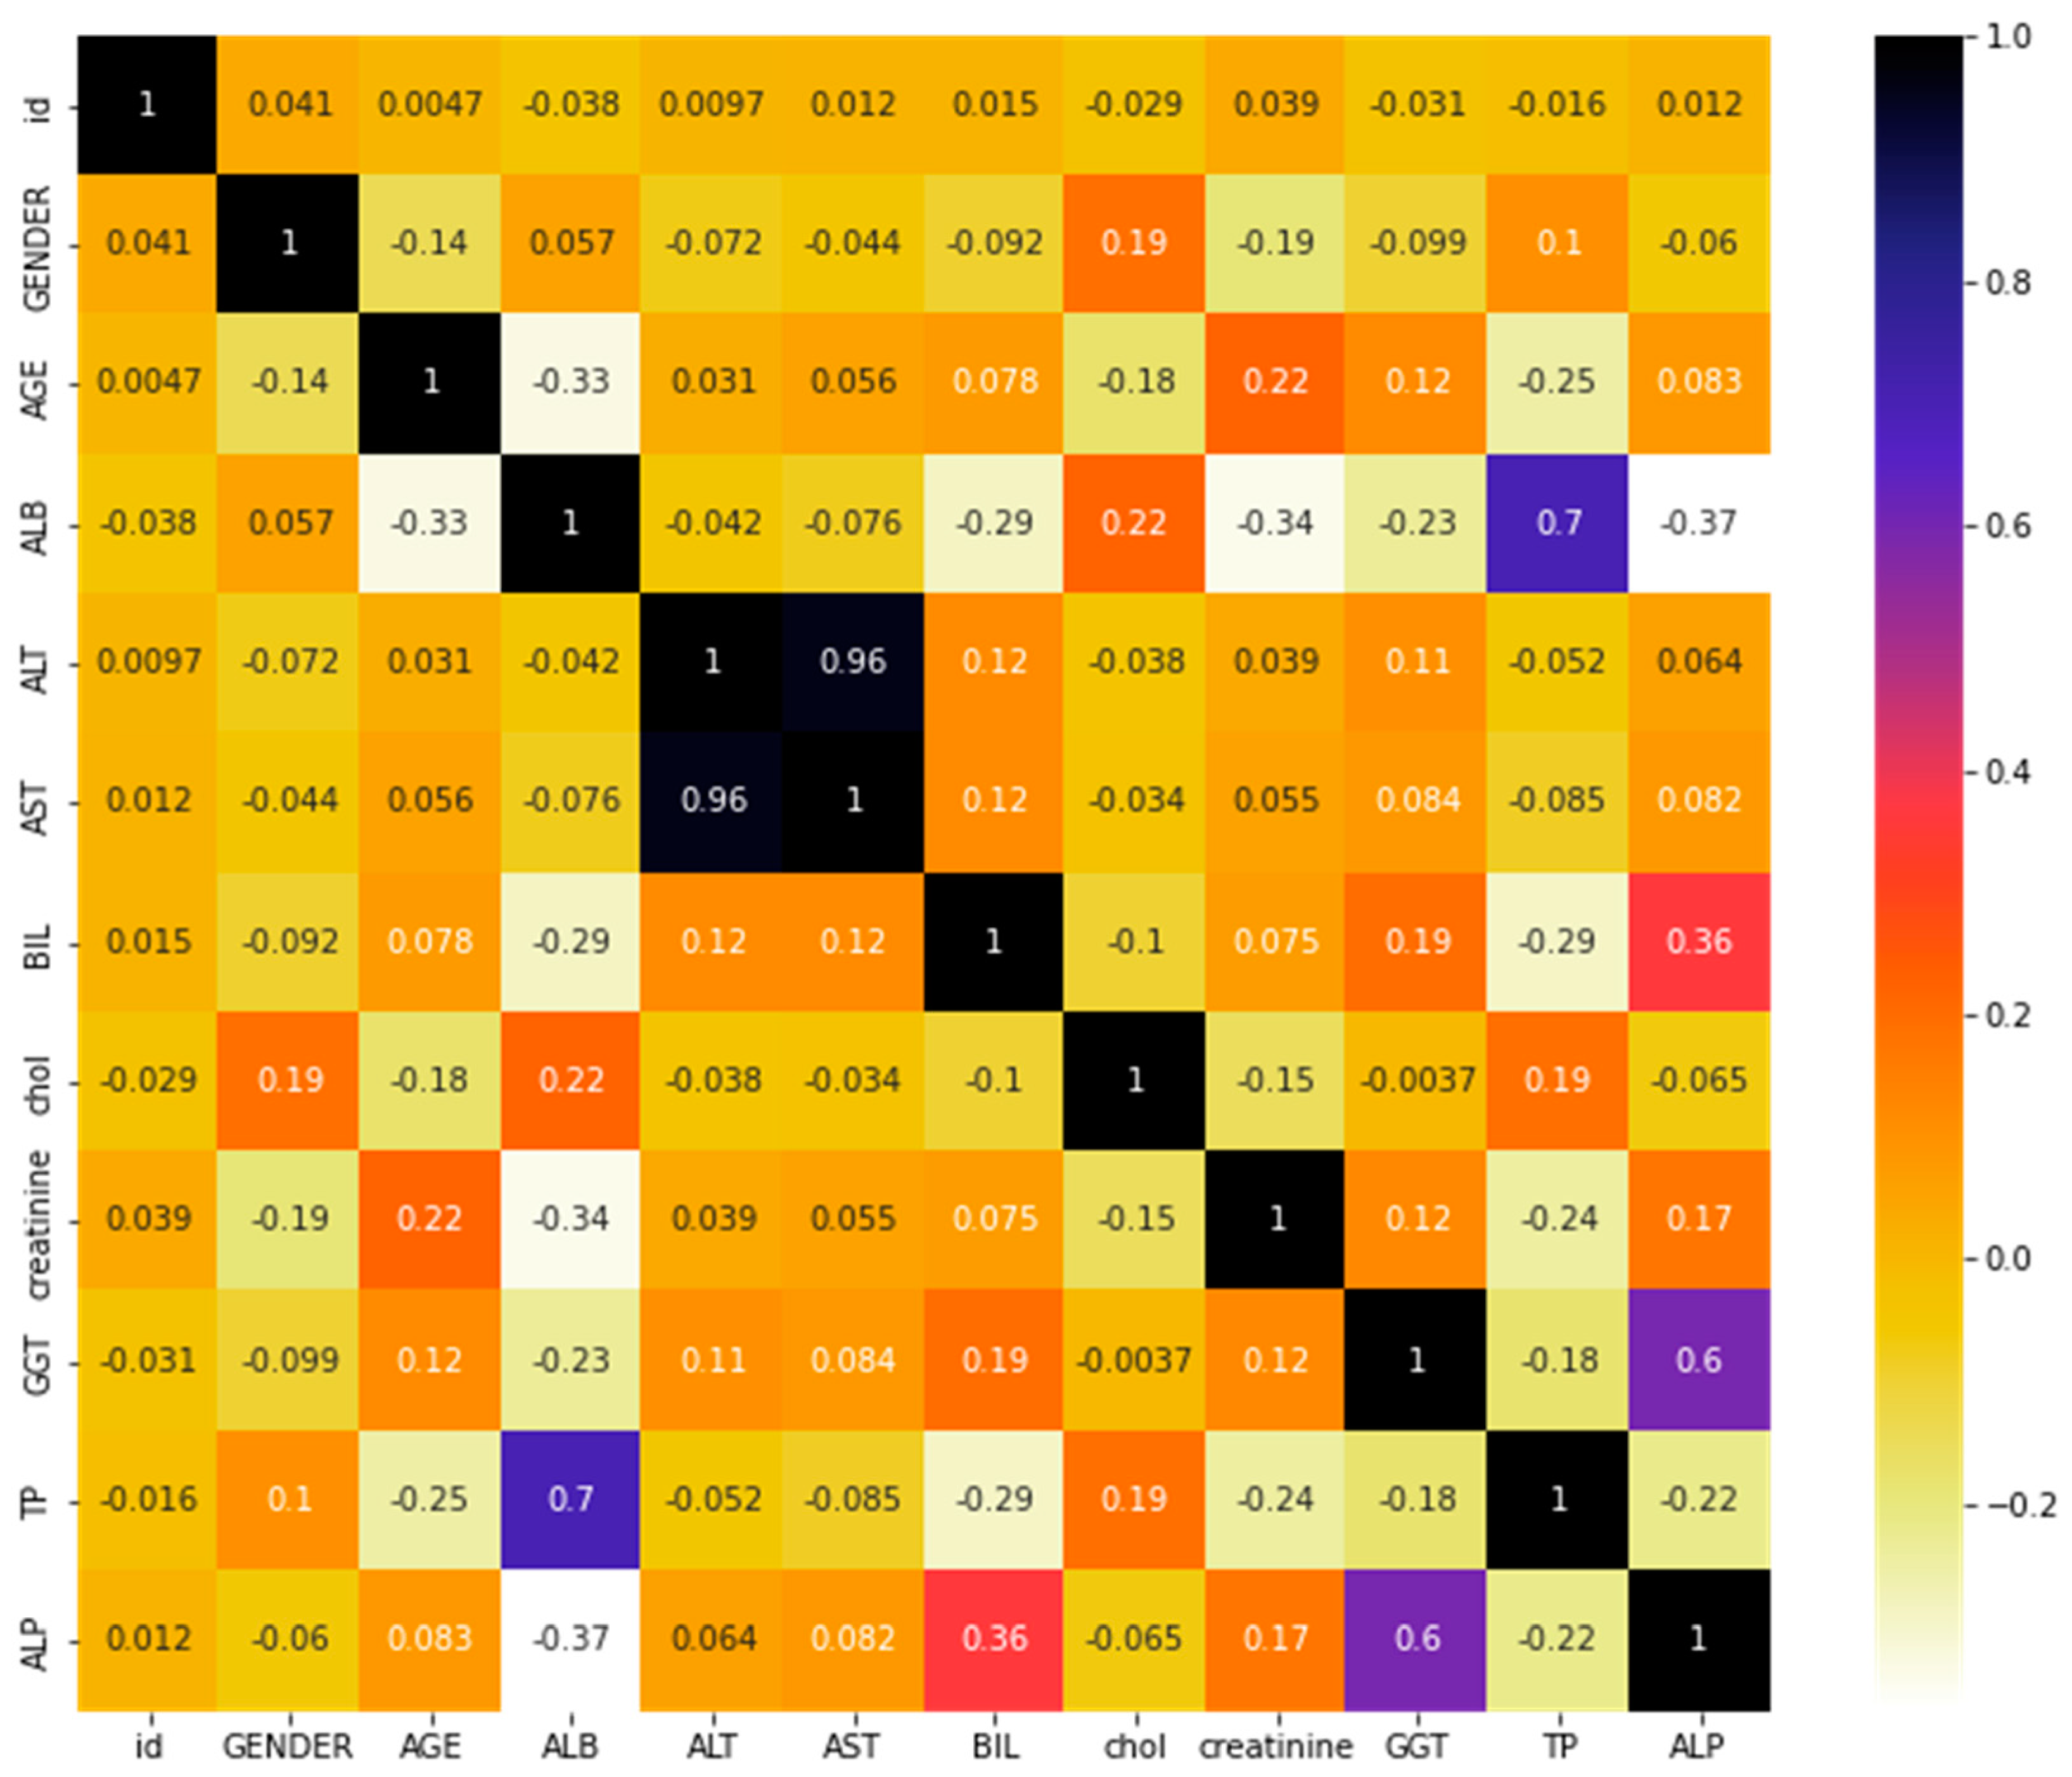
Our study calculated the correlation coefficients between different features using Pearson’s method. Pearson’s correlation coefficient is a commonly used method to measure the linear correlation between two variables, with values ranging from −1 to 1, where 1 indicates a perfect positive correlation, 0 indicates no correlation, and −1 indicates a perfect negative correlation. It measures the strength of the relationship and the direction of the relationship between two variables. In the HCV dataset, the correlation between features can provide insight into the relationship between various factors that influence HCV infection and its progression. For example, the correlation between age and HCV infection rate can help us understand if older individuals are more susceptible to HCV infection.
Additionally, the correlation between HCV viral load and liver function can help us understand how HCV progression affects liver function. Understanding the correlation between features in the HCV dataset can help us make better predictions and develop effective treatments for HCV.
Figure 1 shows the correlation matrix of the HCV dataset.
The feature selection problem is an important aspect of machine learning. The goal is to reduce the dimensionality of the feature set to minimize error in predicting the class. This is especially important when the feature set consists of many variables, making it difficult to solve the problem numerically.
In feature selection, there are two steps: (a) identifying irrelevant features and (b) identifying redundant features. Irrelevant features are those that have no relationship between input and output features, while redundant features are those that have a high correlation with other attributes. Feature selection eliminates these irrelevant and redundant features as a pre-processing stage.
Feature selection methods measure the relevance and redundancy of the features. Relevance refers to the relationship between two attributes, and a feature selection algorithm retains the attributes with relevance between input and output features. Redundancy refers to the correlation between features, and any method must eliminate the features with a high correlation and select the attributes with a low correlation with other attributes.
A feature is considered relevant to the target concept if there is a subset of features such that the probability of excluding is greater than zero, and the probability of given and is different from the probability of given alone. If the feature appears in every point representing , it is strongly relevant. If it appears in some points representing , it is weakly relevant. It is irrelevant if the feature does not appear in any point representing Y.
A feature is relevant to the target concept Y if for some subset , where is the set of all features except , and
If feature appears in every instance of , it is strongly relevant.
If feature appears in some instances of , it is weakly relevant.
If feature does not appear in any instance of , it is irrelevant.
In this study, we used Sequential Feature Selection (SFS). Sequential Feature Selection (SFS) is a well-known wrapper method used for feature selection in machine learning algorithms. SFS is an iterative algorithm that starts with an empty feature set and adds features one at a time to the set based on evaluating a classifier’s performance on the training data. The classifier performance evaluation uses a performance metric, such as accuracy or F1 score, to determine the best feature set for a specific problem. SFS works by adding the feature that improves classifier performance most until a predetermined stopping criterion is met. This criterion can be the maximum number of features to be selected or a threshold for performance improvement. The selected features form the feature subset used in the final classifier.
The feature subset evaluation using SFS is computationally expensive as it requires training the classifier for each feature subset and evaluating its performance. However, SFS provides a flexible way of feature selection as it allows the user to specify different performance metrics and stop criteria from fitting the specific problem. It is more suitable for problems where the number of features is relatively small, and the individual features are expected to have a strong relationship with the target variable. As a result, SFS is a powerful tool for feature selection and can be combined with data augmentation techniques to further improve the performance of machine learning algorithms in classifying HCV or any other problem.
3.2. Proposed Framework
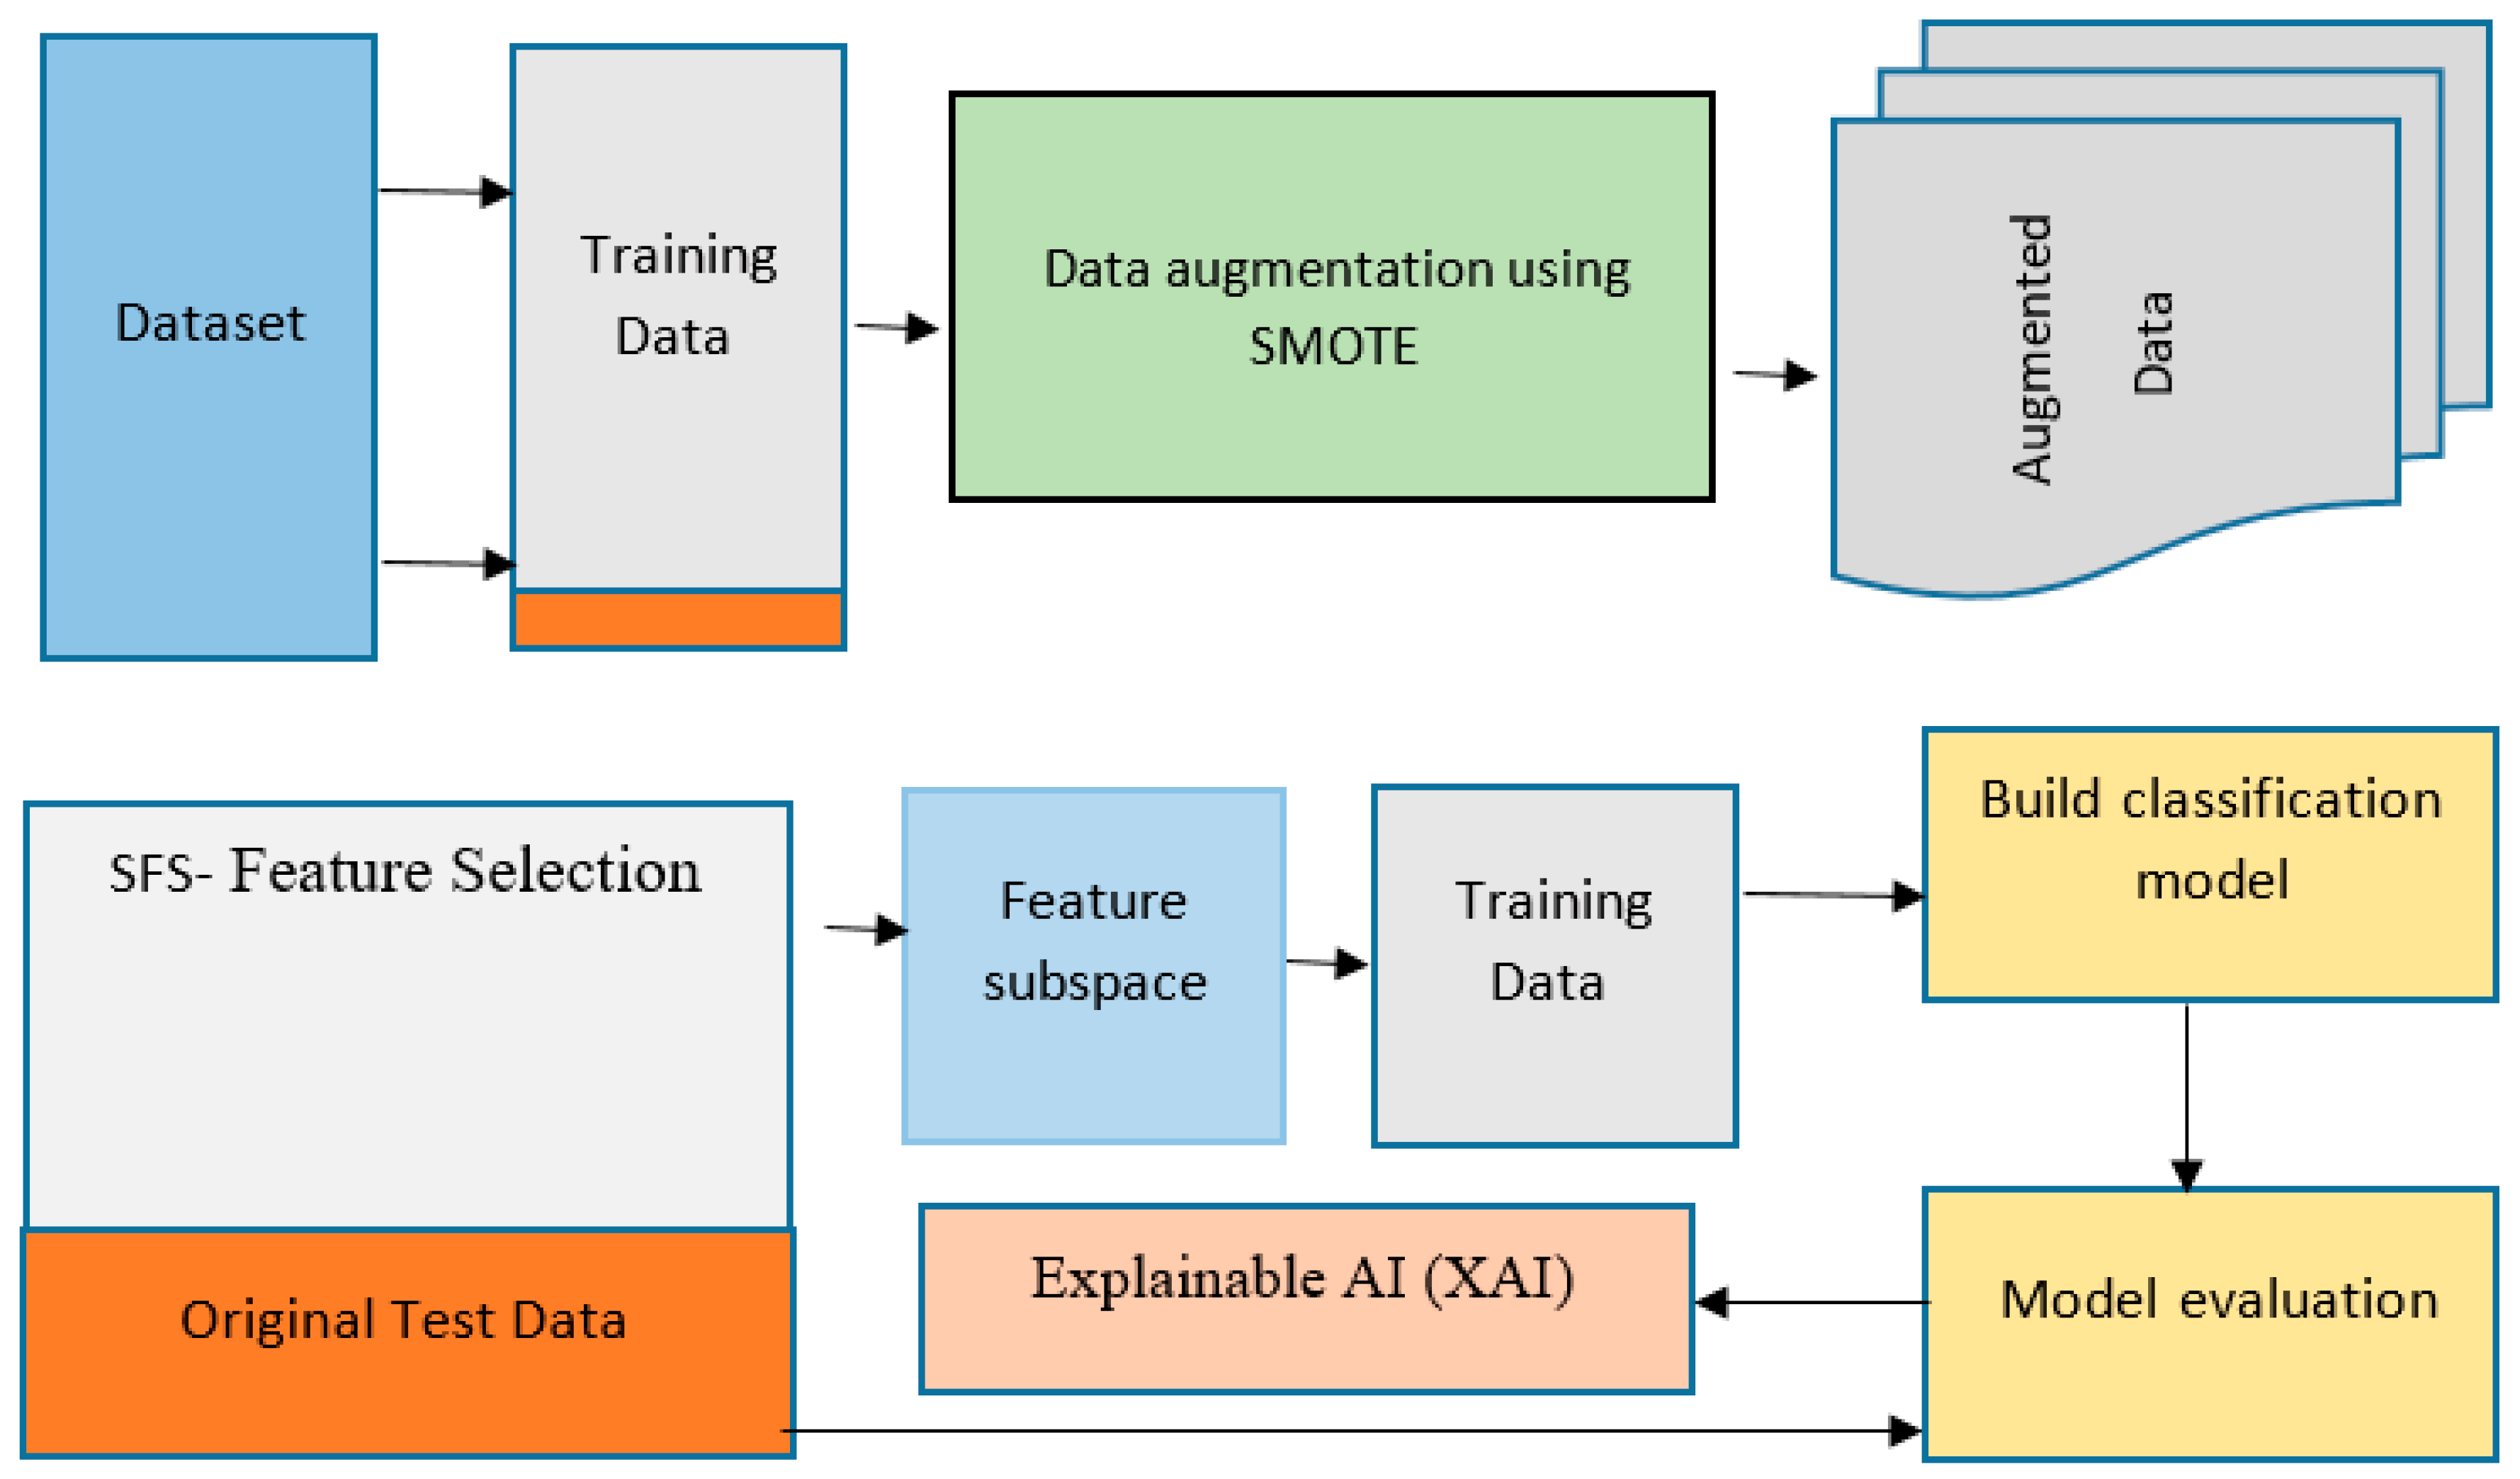
The methodology for explainable machine learning [
12] using feature selection and data augmentation involves several key steps. The first step is data collection, where a real-world dataset of hepatitis C in Jordan was collected and used in this study. The data were collected from the Jordan University Hospital and consisted of 1801 samples with 13 attributes, including a class label attribute.
After data collection, the next step is data pre-processing, which involves cleaning the data, handling missing values, and converting categorical variables into numerical variables if necessary. The third step is feature selection, where techniques are used to determine the most relevant features for the prediction task. Sequential Forward Selection (SFS) Feature Subset Selection was used as a feature selection technique [
13].
Data augmentation was then performed to overcome the limited data problem and improve the model’s robustness. The SMOTE technique generated new synthetic samples from the existing data. The next step was model selection, where multiple algorithms were evaluated, including Decision Trees, Random Forests, Support Vector Machines, and Neural Networks.
Once a suitable machine learning algorithm was selected, the model was trained on the pre-processed and augmented data. This involved splitting the data into training and validation sets and using the training set to fit the model. The model was then evaluated on the validation set to assess its performance.
The final step was Explainable AI (XAI) [
14], which is crucial in ensuring the transparency and interpretability of the model. XAI techniques were used to understand the model’s decision-making process and identify the features that contribute the most to the predictions. This study used techniques such as feature importance and partial dependence plots to provide interpretable insights into the model.
Figure 2 shows the schematic framework for the method used.
Explainable machine learning models are designed to explain their predictions through feature importance, decision rules, or visualizations, making the decision-making process transparent and understandable to human users [
15,
16]. This is crucial in applications where incorrect predictions, such as medical diagnosis or credit approval, could have severe consequences. Users can better understand the predictions and refine and improve the model over time by making it more interpretable, increasing trust in its outputs.
4. Experiments and Results
In this section, we will discuss the use of machine learning algorithms in classifying HCV by combining feature selection and data augmentation techniques. The main aim of this study is to improve the performance of machine learning algorithms by selecting the most important features and increasing the size of the dataset. In addition to feature selection, the study also employs data augmentation techniques, such as the synthetic minority oversampling technique (SMOTE), to increase the size of the dataset. SMOTE creates synthetic examples of the minority class by interpolating between existing examples. This technique is used to handle the imbalance in the dataset, where the majority class is overrepresented compared to the minority class.
- -
Linear Regression: A regression algorithm models the relationship between a dependent variable and one or more independent variables by fitting a linear equation to the observed data. The equation defines a straight line that can best approximate the relationship between the dependent and independent variables.
- -
Logistic Regression: A classification algorithm that models the probability of a discrete outcome, such as the occurrence of an event, given the values of one or more independent variables. The algorithm is an extension of linear regression and is useful for binary classification problems, where the outcome can only take two values, such as infected/uninfected.
- -
K-Nearest Neighbors: A non-parametric supervised learning algorithm for classification and regression. The algorithm classifies a new data point by finding its k-nearest neighbors in the training data and then taking a majority vote on the class labels of these neighbors.
- -
Random Forest: An ensemble learning method for classification and regression. The algorithm creates multiple decision trees by selecting random subsets of the training data and random subsets of the features. The final prediction is made by taking the average or majority vote of the predictions made by individual trees.
- -
Multi-Layer Perceptron: An artificial neural network used for classification. The network consists of input layers, hidden layers, and output layers. The hidden layers transform the inputs into outputs, and the network weights are adjusted during training.
The article discusses using various evaluation metrics such as precision, recall, AUC, and testing accuracy to evaluate ten machine learning classifiers, as shown in
Table 3. The authors use the GridSearchCV method to tune the hyperparameters of the boosting-based classifiers to improve their accuracy.
In this study, 5-fold cross-validation is used to evaluate the performance of the machine learning models. This method partitions the data into five equally sized subsets, with four subsets used for training the model and the remaining subset used for testing. The main advantage of 5-fold cross-validation is that it provides a more reliable estimate of a model’s performance than a single train/test split, as it uses all the available data for training and testing. It also helps to reduce the risk of overfitting, which can occur when a model is trained on a limited dataset. By repeating the process five times and using different subsets of the data for training and testing, cross-validation helps to ensure that the model generalizes well to new, unseen data. The results of the classification are based on the confusion matrix, which consists of the calculation of true positive (TP), true negative (TN), false positive (FP), and false negative (FN) values.
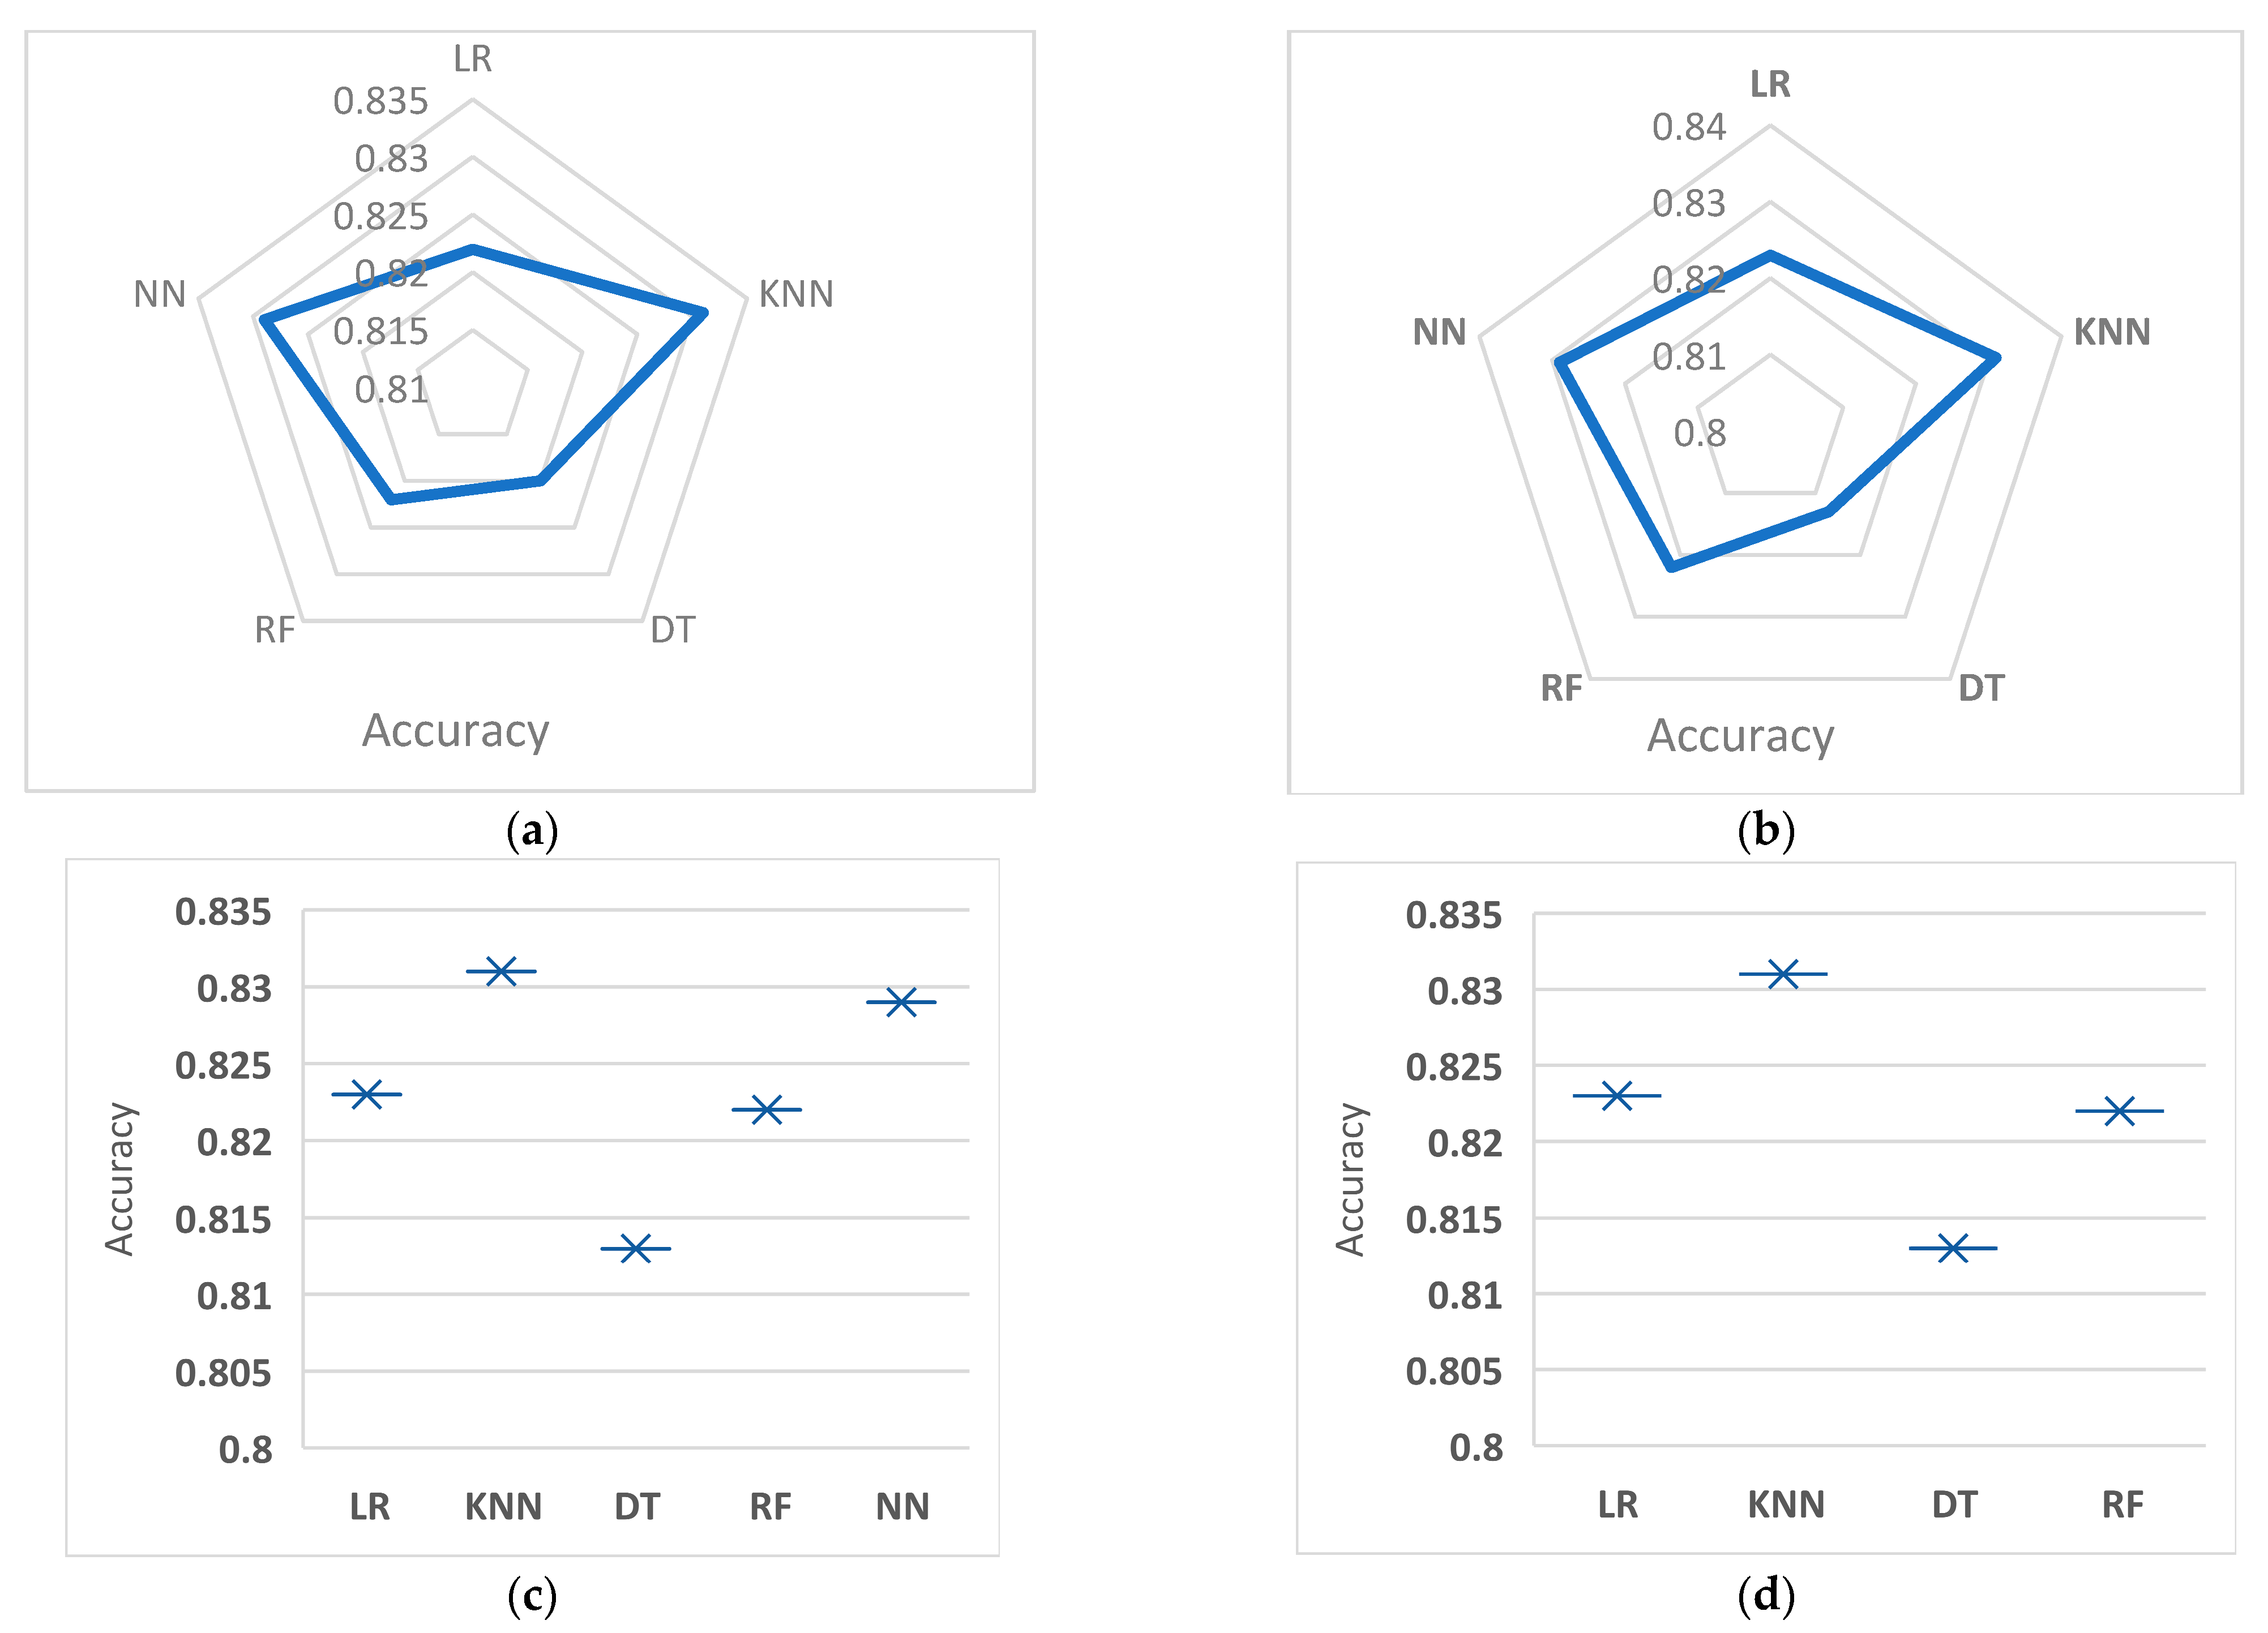
Table 4 summarizes results obtained by different classifiers under two combinations (data augmentation and feature selection). To make these results more readable,
Figure 3a–d show the comparison between these classifiers regarding accuracy.
Table 4 compares the performance of 5 different machine learning models (Logistic Regression (LR), K-Nearest Neighbors (KNNs), Decision Tree (DT), Random Forest (RF), and Neural Network (NN)) for binary classification. The comparison is made between the results with and without the Synthetic Minority Oversampling Technique (SMOTE). The performance of each model is evaluated using four evaluation metrics: accuracy, recall, precision, and F-measure.
The results show that the performance of the models is not significantly impacted by the use of SMOTE, with some variations in accuracy, recall, precision, and F-measure. KNN shows the highest accuracy, recall, precision, and F-measure with 0.831, 0.92, 0.51, and 0.46, respectively, both with and without SMOTE. The lowest accuracy, recall, precision, and F-measure are shown by Decision Tree (DT), with 0.813, 0.41, 0.49, and 0.45, respectively, both with and without using SMOTE. The other models show intermediate results between KNN and DT.
The linear regression (LR) model’s experimental results show that the SMOTE and feature selection accuracy decreased by 0.006 compared to using SMOTE without feature selection. The recall, precision, and F-measure criteria remained the same at 0.41, 0.5, and 0.45, regardless of whether feature selection was used. The RMSE decreased by 0.28 with feature selection and increased by 0.28 without feature selection. The AUC remained constant at 0.5 with or without feature selection. Without using SMOTE, the accuracy increased by 0.007 with feature selection and decreased by 0.007 without feature selection. The recall, precision, and F-measure criteria remained the same at 0.41, 0.5, and 0.45, regardless of whether feature selection was used.
The RMSE and AUC criteria remained constant at 0.41 and 0.45, respectively, with or without feature selection. The experiment’s KNN method results showed that the performance metrics such as accuracy, recall, precision, F-measure, RMSE, and AUC remained the same with or without using SMOTE and feature selection. This indicates that the use of SMOTE and feature selection did not significantly affect the performance of the KNN model.
The experiment’s Decision Tree method results showed that using SMOTE with feature selection did not significantly affect the accuracy, recall, precision, F-measure, RMSE, and AUC criteria compared to using SMOTE without feature selection. The differences in accuracy, RMSE, and AUC were only about 0.007 and 0.01, respectively, which can be considered a negligible change. The recall, precision, and F-measure values remained the same regardless of feature selection. The results of the experiment using Random Forest showed that the impact of using SMOTE with feature selection on accuracy was mixed, with a decrease of 0.002 but an increase of 0.002 without using feature selection. The recall criterion increased by 0.03 with feature selection but decreased by 0.03 without using it. The precision criterion decreased by 0.08 with feature selection and increased by 0.08 without using it. The F-measure criterion decreased by 0.31 with feature selection and increased by 0.31 without using it. The RMSE increased by 0.008 with and without feature selection. The AUC remained the same at 0.5 with and without feature selection. Without using SMOTE, the accuracy remained the same at 0.822, the recall decreased by 0.03 with feature selection and increased by 0.03 without using it, the precision decreased by 0.01 with feature selection and increased by 0.01 without using it, the F-measure increased by 0.04 with feature selection and decreased by 0.04 without using it, the RMSE remained the same at 0.421, and the AUC remained the same at 0.5. The experimental results with the Neural Network method indicate that using SMOTE with feature selection slightly increased the accuracy by 0.007 and decreased it without feature selection by 0.007. Other evaluation metrics such as recall, precision, F-measure, RMSE, and AUC remained unchanged with or without the use of feature selection and with or without the use of SMOTE. The results suggest that feature selection and SMOTE do not have a significant impact on the performance of the Neural Network method in this experiment.
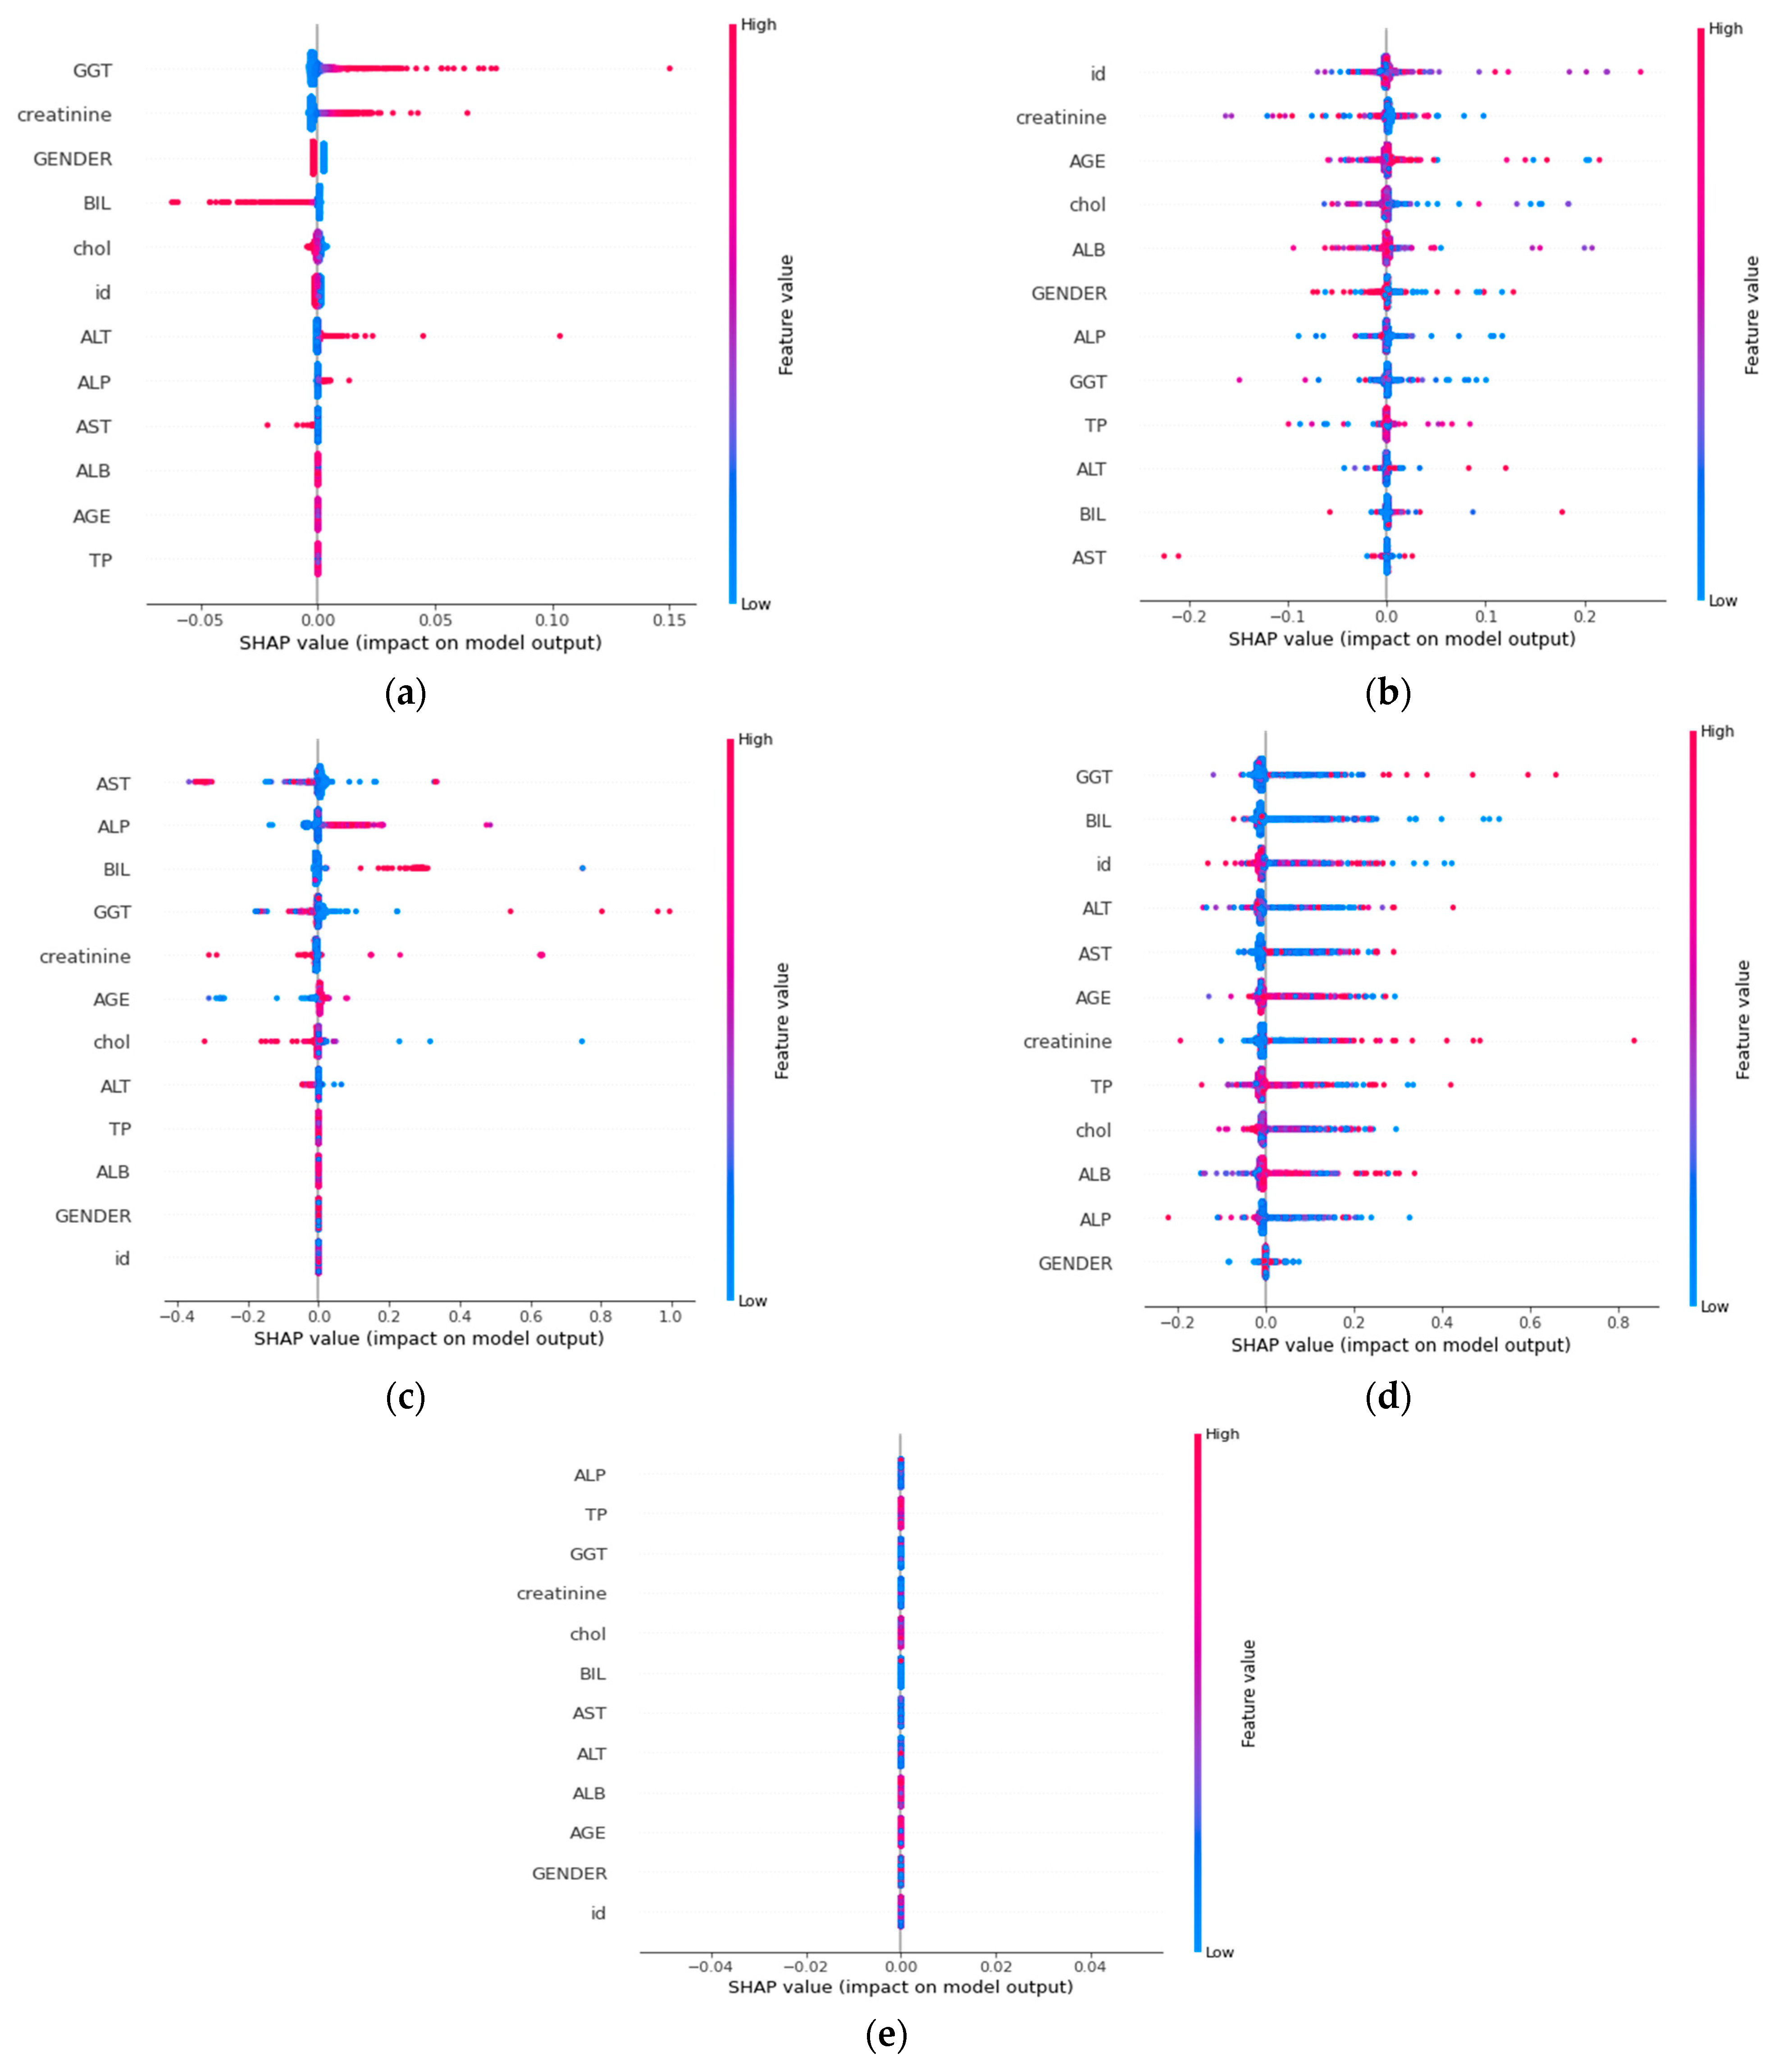
SHAP (SHapley Additive exPlanations) values are a method for interpreting the output of machine learning models. They provide a way to understand how each feature contributes to the prediction for a given instance.
In the context of different classifiers, the SHAP values give an idea of the contribution of each feature toward the prediction made by that classifier. The SHAP values for each feature can be positive or negative, with positive values indicating that a feature contributes to the prediction being higher and negative values indicating that a feature reduces the prediction.
By aggregating the SHAP values for all instances, one can better understand the feature importance for the classifier. This can help interpret the predictions made by the classifier and identify the most important features that drive its behavior. SHAP values provide a way to get a deeper understanding of how classifiers work and can be useful in interpreting the results of different models.
The SHAP values were derived from the training data and showed how each feature contributed to the predicted outcome.
Figure 4a–e shows SHAP values for different features at different classifiers. The study also used the SHAP values to visually interpret the model, making it easier for health practitioners or policymakers to understand and decide based on the results. Additionally, the study compared its results with state-of-the-art machine learning models for predicting hepatitis B and found that only one study considered model explainability, making this study an important contribution to the field.
Table 5 compares the performance of different machine learning models in predicting hepatitis C disease from four research studies. Suiçmez et al. [
17] achieved the highest accuracy of 98.7% using the Random Forest and multi-layer perceptrons. Dritsas and Trigka [
18] obtained an accuracy of 80.1% using the voting classifier. Yağanoğlu [
19] achieved an accuracy of 99.31% using various machine learning methods, pre-processing, and feature extraction. Saputra et al. and Safdari et al. [
18] found that the Random Forest classifier had the best performance, with an accuracy of 97.29%. The proposed approach in the previous study applied Sequential Forward Selection (SFS) for feature selection and the SHapley Additive exPlanations (SHAP) method to explain the machine learning model’s predictions, achieving an average accuracy of 83%. Overall, the results of these studies demonstrate the effectiveness of machine learning models in predicting hepatitis C disease, with some models achieving high accuracy rates.
In analyzing HCV data collected from the Jordanian population, several important medical considerations exist for using machine learning in classification tasks. Firstly, ensuring that the data used for training and testing is representative of the population and has been collected systematically and ethically is important. This helps minimize potential bias in the model and ensures reliable and trustworthy results. Furthermore, it is important to consider the complexity of the HCV infection and the various factors that can affect its transmission, progression, and treatment. These factors can include demographic, lifestyle, environmental factors, and other comorbid conditions. A machine learning model should be able to account for these various factors and provide a robust and reliable estimate of the probability of HCV infection for a given patient.
Another important consideration is the choice of evaluation metrics for the model. In the context of HCV infection, it is important to balance the need for high accuracy with the need to minimize false positive or false negative predictions. This can help to ensure that patients who are infected with HCV receive appropriate treatment and those who are not infected are not subjected to unnecessary testing and treatment. Using machine learning for classifying HCV data collected from the Jordanian population requires careful consideration of several medical and ethical factors. These factors include the quality and representativeness of the data, the complexity of the HCV infection, and the choice of evaluation metrics. By considering these factors, it is possible to develop machine learning models that provide reliable and trustworthy predictions of HCV infection in the Jordanian population. Using machine learning for classifying HCV datasets collected from the Jordanian population has several benefits. One of the main advantages of using machine learning algorithms is handling large amounts of data and identifying patterns and relationships that would be difficult to detect using traditional statistical methods. This can lead to improved accuracy in the classification of HCV patients, which is critical in the medical field, where early diagnosis and treatment can have a major impact on patient outcomes.
Additionally, machine learning algorithms can handle missing data and deal with noisy or incomplete data, which is often a challenge in medical datasets. This means that the results from these algorithms can be more robust and reliable, leading to more informed decision making for healthcare providers. Finally, machine learning algorithms can be trained and optimized for different criteria, allowing for a customized approach tailored to the analysis’s specific needs and goals. Using machine learning to classify HCV datasets collected from the Jordanian population can greatly improve the accuracy and efficiency of HCV diagnosis and treatment, ultimately leading to better patient outcomes.

 ,
, 


