Article

Thin-Walled Commercially Pure Titanium Structures: Laser Powder Bed Fusion Process Parameter Optimization

1
Department of Bioengineering, Institute of Science and Technology, Hacettepe University, Ankara 06800, Turkey
2
Department of Mechanical Engineering, Eskişehir Osmangazi University, Eskisehir 26480, Turkey
3
Department of Mechanical Engineering, Eskişehir Technical University, Eskişehir 26555, Turkey
4
Faculty of Medicine, Department of Sports Medicine, Hacettepe University, Ankara 06100, Turkey
*
Author to whom correspondence should be addressed.
Machines 2023, 11(2), 272; https://doi.org/10.3390/machines11020272
Submission received: 31 December 2022 / Revised: 21 January 2023 / Accepted: 28 January 2023 / Published: 11 February 2023
(This article belongs to the Special Issue Additive Manufacturing of Machine Components)

Abstract

:
Laser powder bed fusion (L-PBF) process parameters can be changeable depending on the part geometry due to thermal conductivity differences. The number of studies on the process parameter development for commercial pure titanium (Cp-Ti) with the L-PBF process is also quite limited in the literature. The aim of this study is to present a comprehensive process development for the production of Cp-Ti bulk and thin structures with the L-PBF technology. In the first phase, the right process parameters, including scan speed, laser power, hatch distance, and layer thickness, were identified with prismatic specimens with thin walls so that the obtained parameters could be used for both bulky sections and thin features such as lattice structures. The process parameters were varied to change the volumetric energy density from 19 to 208 J/mm3 among 80 different parameter sets. Parameter sets having a Volumetric Energy Density (VED) value between 32 J/mm3 and 47 J/mm3 gave almost fully dense Cp-Ti parts while the laser power was set to 200–250 W and the scan speed was used as 1000–1400 mm/s. Finally, Vickers hardness and tensile tests were applied to highly dense Cp-Ti parts. This study involving investigating the effect of process parameters on a wide range demonstrated that L-PBF is a favorable manufacturing technology for Cp-Ti parts with almost full density and good mechanical properties as well as good dimensional accuracy even on thin geometries. Moreover, the results show that combining parameters into a single one, i.e., VED, is not a proper way to optimize the process parameters since increasing laser power or decreasing the scan speed may alter the results, although VED is increased in both manners.

1. Introduction

The inherent principle of additive manufacturing (AM) is based on the creation of 3D parts from layers [1,2,3]. AM offers several advantages, such as almost unlimited design freedom, waste reduction, and reduced lead time from design to testing, which are compelling even for very demanding industries, including aerospace and biomedical [4,5]. Laser powder bed fusion (L-PBF) offers the highest technological maturity level as well as the widest industrial use for metallic materials among the AM techniques. Moreover, it is suitable for a very wide range of materials, including steels, aluminum alloys, copper alloys, nickel superalloys, and titanium alloys, as well as precious metals. Among these alloys, titanium alloys have an important place in various applications due to their strength-to-density ratios and corrosion/oxidation resistance provided by the passivation layer formed at their surface when exposed to air [6].
Commercially pure titanium is called Cp-Ti, with 99% Ti content. Cp-Ti shows lower mechanical strength in comparison to its alloys since it has a single phase (α) compared to the α + β phase encountered in Ti6Al4V [7]. Cp-Ti, however, has superior ductility with the greater elongation of Cp-Ti (15–24%) compared to Ti6Al4V (6–10%) [8]. Ti6Al4V is the most used titanium alloy studied extensively with L-PBF [9]. On the other hand, the number of studies on the process parameter development for Cp-Ti with the L-PBF process is quite limited in the literature (see Table 1).
Hundreds of process parameters are defined in the L-PBF process, and moreover, the interactions of some parameters have a significant impact on part performance in terms of microstructural, dimensional, and mechanical properties. Among several parameters, laser power (P), scan speed (v), layer thickness (t), and scan spacing, also known as hatch distance, (s) are the most effective parameters (see Figure 1a) playing a significant role on the energy density [18]. By formulating these main parameters, penetrated energy level to the molten pool is calculated by Volumetric Energy Density (VED), Surface Energy Density (SED), and Linear Energy Density (LED), as shown in Equations (1)–(3), respectively. It is important to note that, although it is practical to combine all these critical parameters into one using volumetric energy density, the change in porosity, as well as other material properties, cannot be solely explained based on VED since the effect of individual parameters may be different at constant energy density values [19].
V E D = P v · t · s   ,  
S E D = P v · t   ,  
L E D = P v   ,
As Figure 1b shows, the process window for the LPBF process is generally found as a triangle leading to maximum density eliminating keyhole porosity and lack of fusion. Generally, the keyhole porosity occurs as a result of increasing the VED value, while a lack of fusion porosity can form due to inadequate VED. The keyhole porosity shows a smaller and more spherical geometry, while the lack of fusion is generally identified as irregular and bigger pores.
Although most process parameter studies mainly focus on cubic or prismatic geometries, it is usually not possible to make very thin features with the same parameters since dimensional accuracy is not taken as one of the objectives. However, Mohr et al. [22] reported that the process parameters depend on the part geometry because of thermal conductivity differences. Bulk geometries provide higher heat transfer from the top of the part to the base plate due to higher sectional area compared to thin structures. Thin walls increase the distance of the melt pool from the top to the base plate resulting in heat accumulation and residual stresses due to the higher aspect ratio of the melt pool. Low heat transfer of thin walls also affects the cooling rate and can finally lead to crack propagation or warping inside the part [23,24]. L-PBF process parameter optimization can assist in minimizing defect formation [25]. A few optimized process parameter studies from the literature focused on the effects of process parameters on the microstructure, mechanical properties, and manufacturability of thin-walled Cp-Ti structures. Zhang et al. [24] discussed the microstructure and tensile properties of fabricated thin-walled titanium structures via L-PBF. Ataee et al. [8] studied the microstructure, surface roughness, and hardness features of manufactured porous Cp-Ti structures via L-PBF. Montufar et al. [26] also investigated the microstructure and mechanical properties of L-PBF-produced lattice-structured Cp-Ti for tissue engineering. However, the tested process parameters on thin-walled Cp-Ti, including laser power, scanning speed, layer thickness, hatch distance, and VED, are not well defined comprehensively in the mentioned studies due to inadequate ranges of parameter sets.
The aim of this study is to identify process parameters, mainly laser power, scan speed, layer thickness, and hatch distance for bulk and thin wall manufacturing that are especially suitable for lattice structures integrated into bulk parts. Both sets of process parameters, which can also be combined into a single parameter as VED, require a high density to ensure good mechanical properties. Moreover, for thin wall manufacturing, high dimensional accuracy is also desired. Thus, this study seeks to find suitable sets of parameters based on their effect on density, and this task was carried out by generating process maps in terms of scan speed and laser power at different hatch distance and layer thickness values specifying which parameters lead to full density or different types of porosities such as keyhole or lack of fusion. The mechanical properties of highly dense samples produced with determined sets of parameters were evaluated with hardness tests and tensile tests.

2. Materials and Methods

2.1. Materials

In this study, the L-PBF process parameter optimization was performed using EOSPRINT 2.8 software with gas-atomized spherical Cp-Ti Grade 2 (supplied by EOS) powder on EOS M290 L-PBF equipment. The average particle size (d50) is specified to be between 38 and 45 µm [27].

2.2. Methods

Cp-Ti Process Parameter Optimization

A simple prismatic part was used with outer dimensions of 5 × 15 × 5 mm with two thin walls having thicknesses of 0,4 mm and 0,5 mm (see Figure 2a). The laser power (LP) was varied between 150 and 300 W (at 4 levels), whereas the scan speed (SS) was varied between 400 and 1200 mm/s (at 5 levels), while the hatch distance (HD) was set to either 90 or 110 µm (2 levels) and the layer thickness (LT) was selected either 40 or 60 µm (2 levels) (see Table 2). This led to 80 different parameter sets with different VED values varying between 19 and 208 J/mm3. Moreover, one sample of each with 40 µm and 60 µm layer thickness was produced with standard parameters (laser power of 340 W, scan speed of 125 mm/s, and hatch distance of 120 µm) for comparison.
Up-skin and down-skin parameters were not utilized, and the stripe width was used as 7 mm by applying a stripe scanning pattern. Figure 2b shows 41 Cp-Ti samples produced at 60 µm layer thickness in the first batch. After the best parameters from this preliminary test were determined based on the highest density and productivity, the parameters were tested in terms of mechanical properties (see Table 2). A total of 9 tensile test specimens with 100 mm length and 12 mm diameter were produced. Three different parameter sets were employed with three repetitions (see Figure 3a). All samples were sandblasted and heat treated at 780 °C for 2 h to relieve residual stresses while the specimens were attached to the base plate. Later, they were cut using wire electrical discharge machining (WEDM), and the tensile specimens were turned into the final geometry, as shown in Figure 3b.

2.3. Material Characterization

2.3.1. Density Measurements

Metallography was applied to the cross-sections of prismatic samples along the build direction. For grinding, 1000 and 2500 grids were used, respectively, and then polishing with a diamond solution was performed. Density results were analyzed, and porosities were classified with an optical microscope (BX50, OLYMPUS).

2.3.2. Dimensional Measurement of Thin Walls

Images from 0.4 mm and 0.5 mm thin walls were taken under a stereomicroscope (Stemi 508, ZEISS), and the thickness values were measured at 3 different locations. Figure 4 shows two examples made with different sets of process parameters.

2.3.3. Mechanical Tests

Vickers hardness (Duramin 4, Struers) was measured with 500 gf load at different locations on each sample (with approx. 100 µm interval) per ASTM E384. The samples were compared with a nominal hardness value (195 HV) of Cp-Ti grade 2 material data [27].
The tensile tests were performed on a Besmak BMT 200E tensile test device with 200 kN load capacity according to ASTM E8 standard. A mechanical extensometer (Epsilon 3542) was utilized for the elongation measurement. The tensile samples were tested with a 0,6 mm/min strain rate at room temperature. The fractured surfaces of the samples were investigated under a stereomicroscope (MZ16A, Leica).

3. Results and Discussion

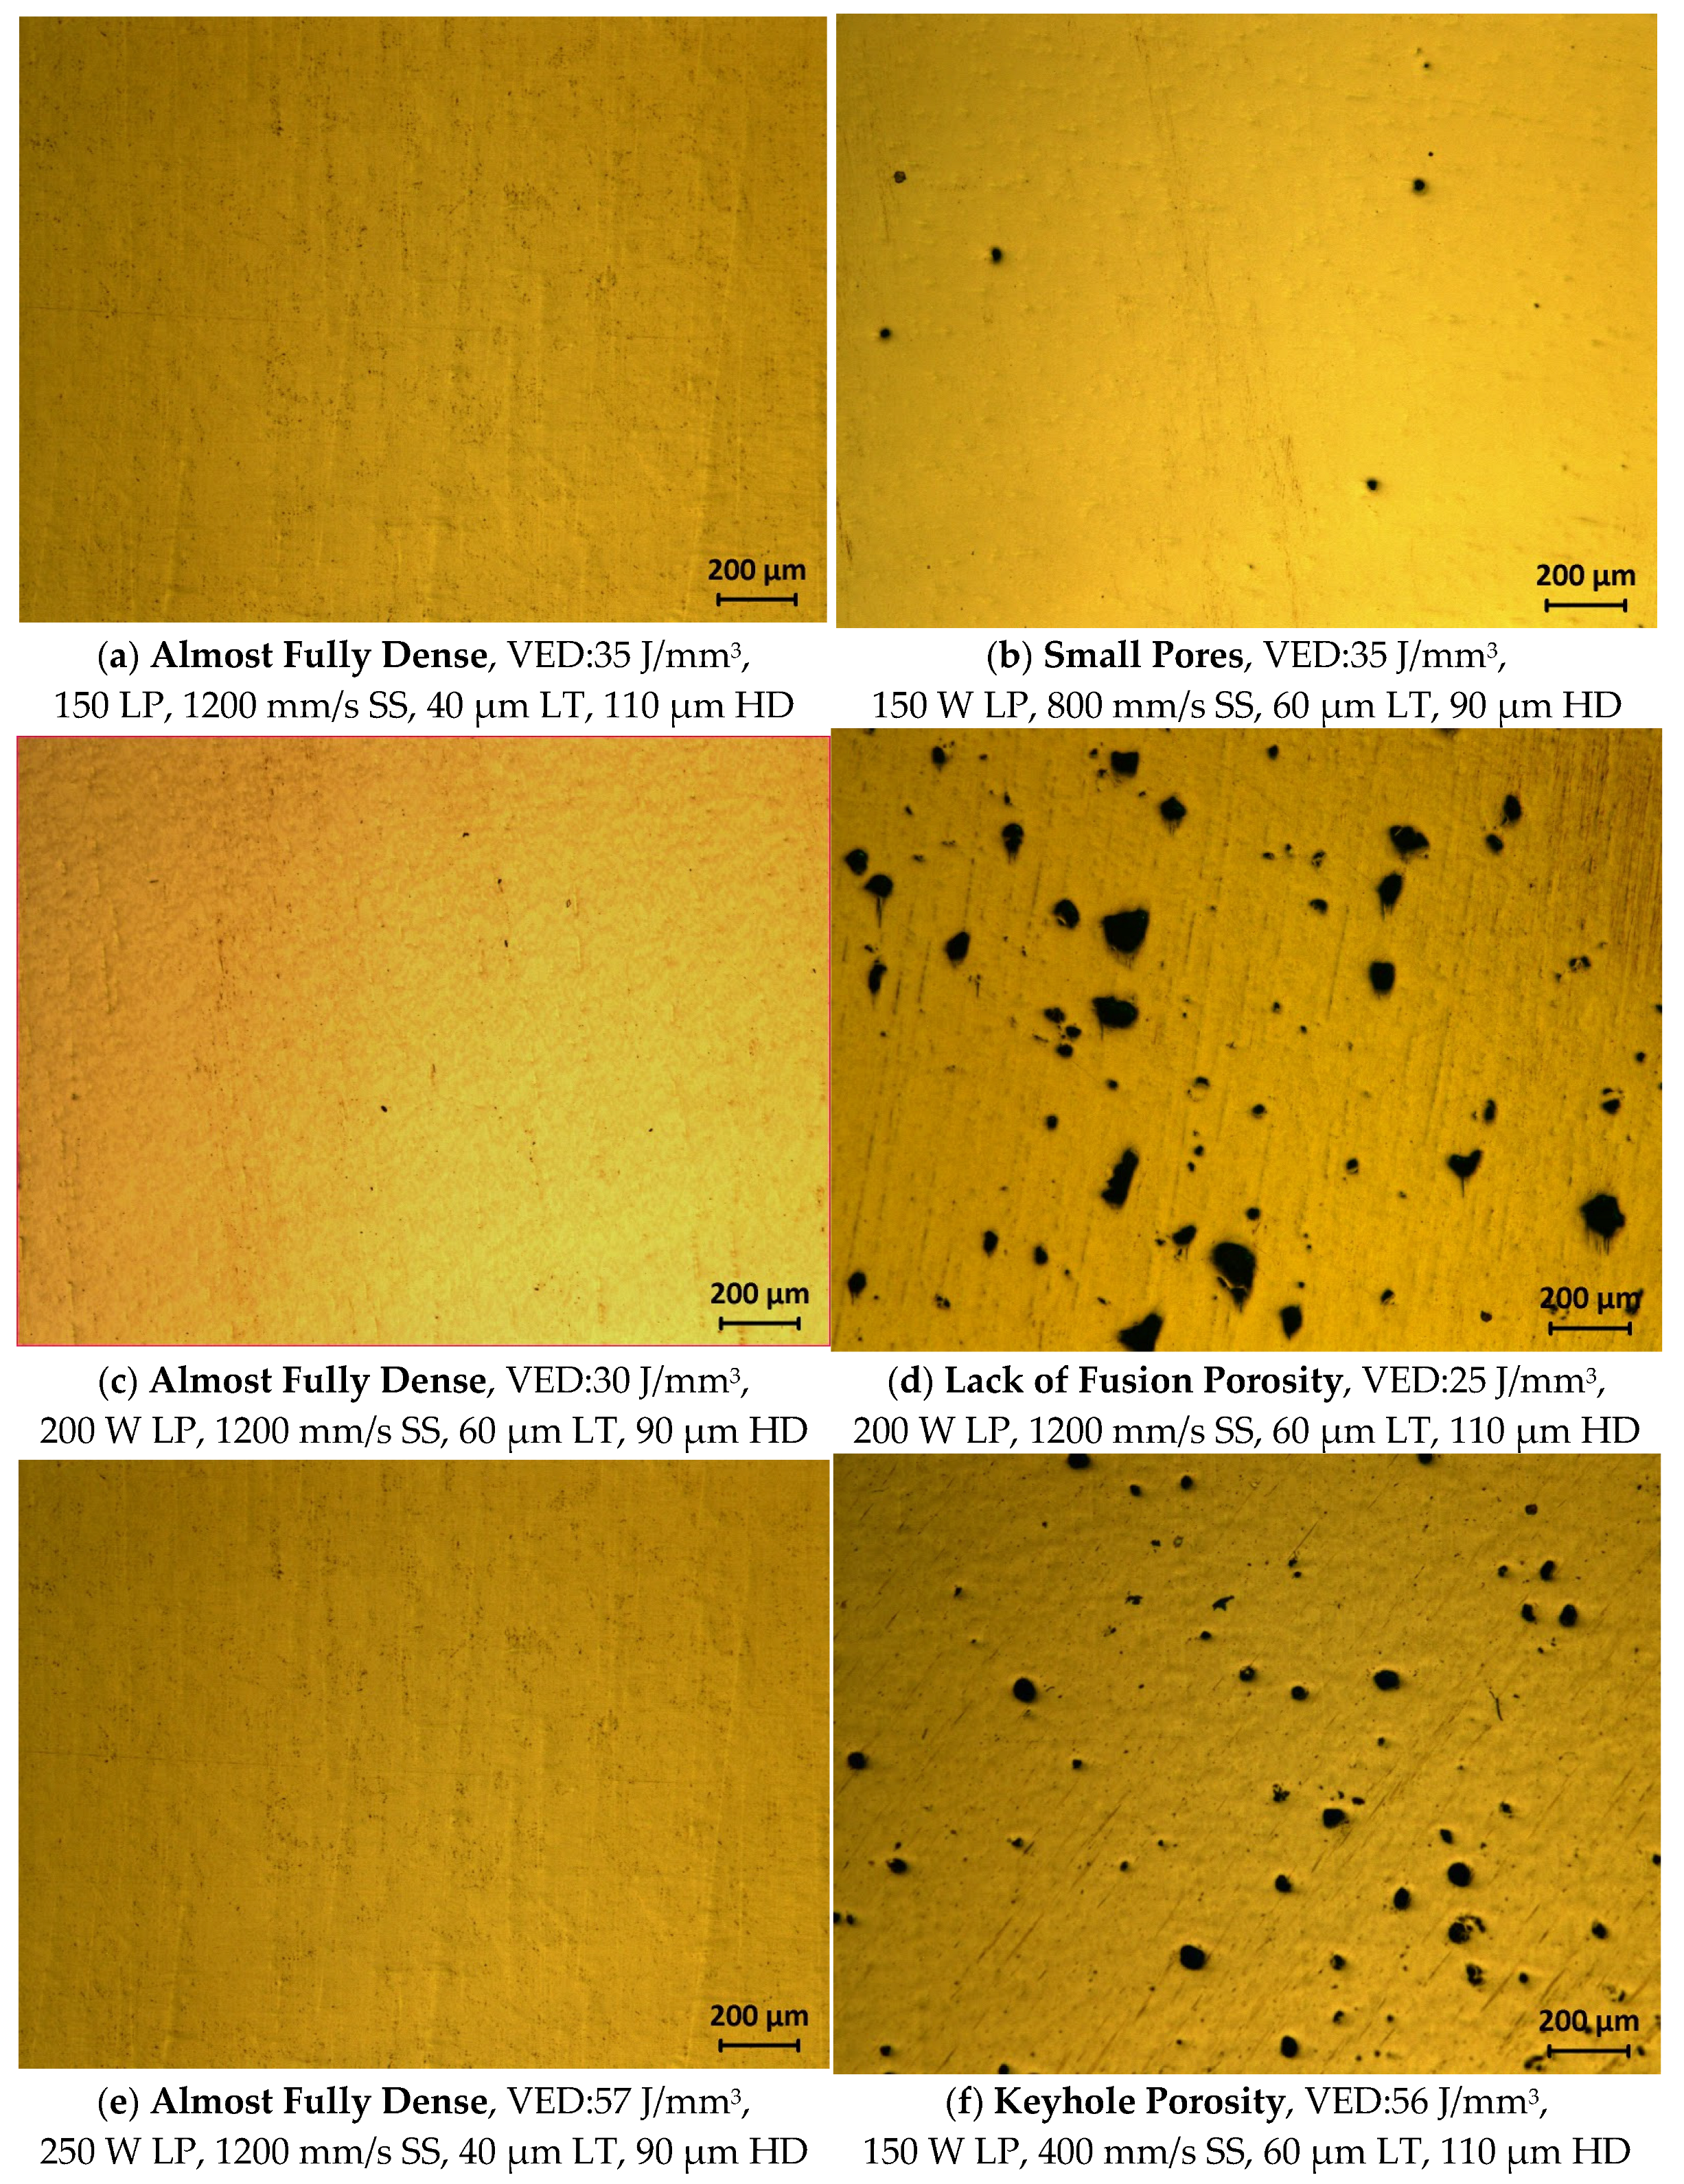
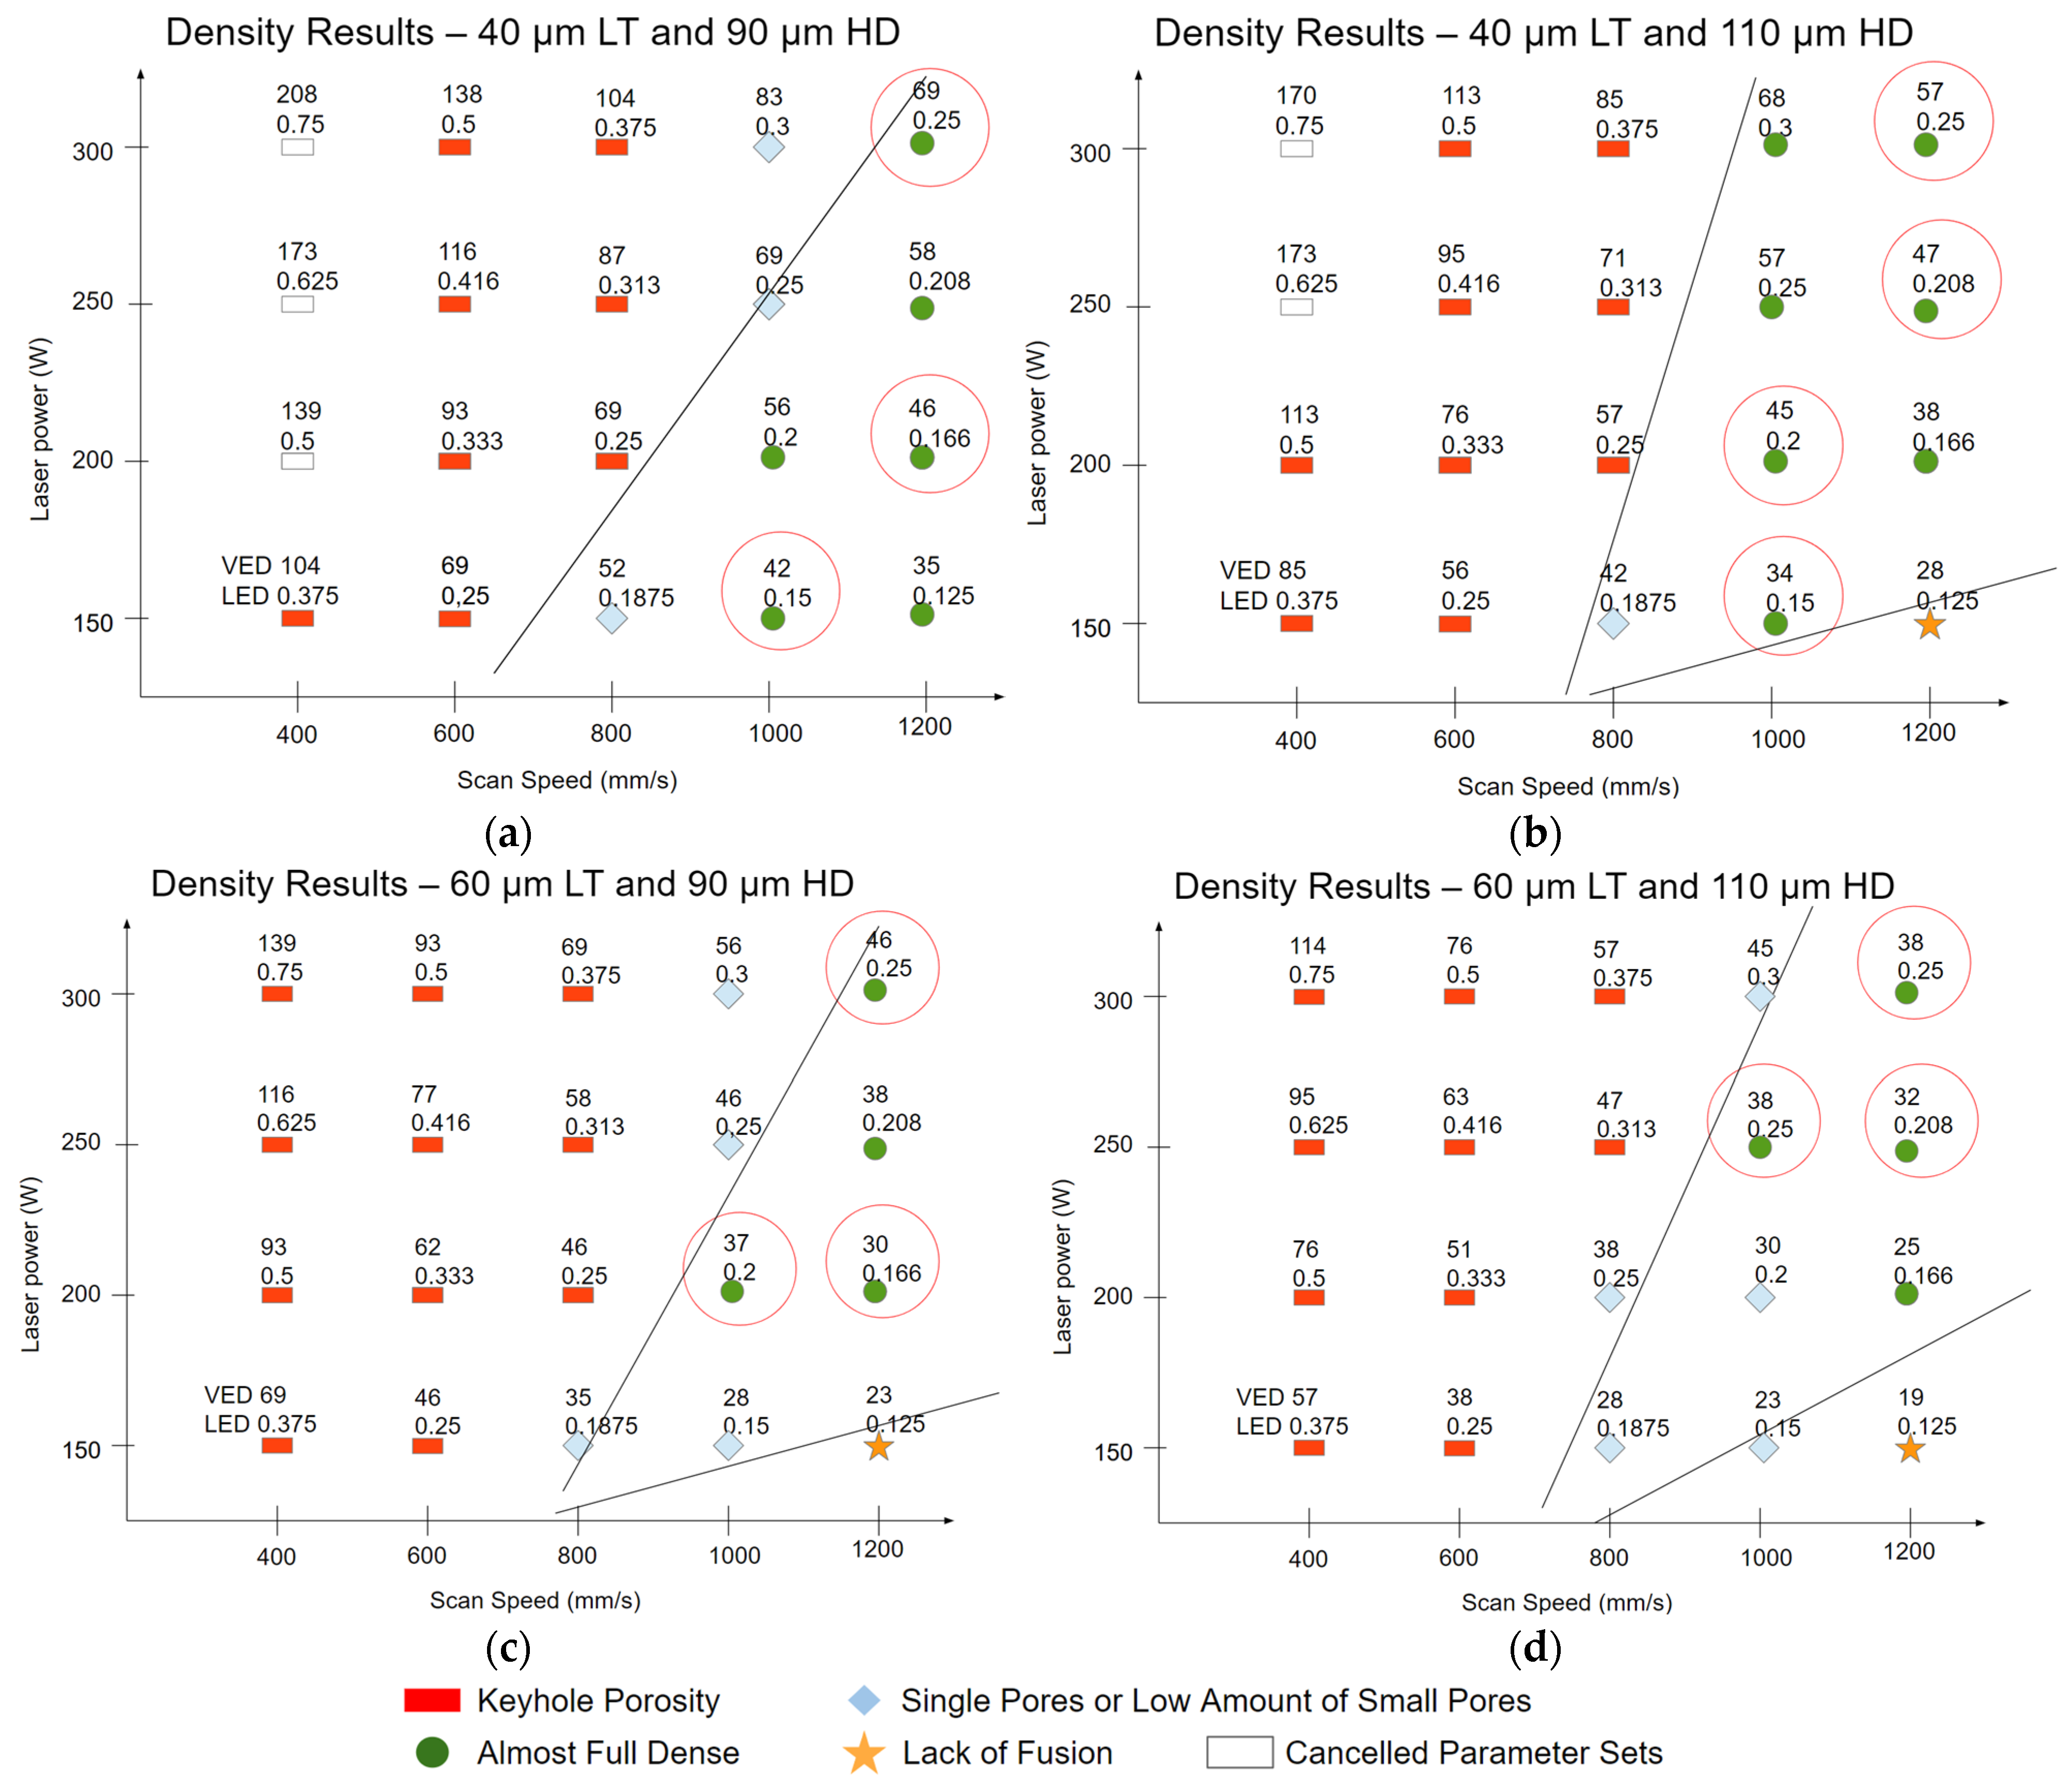
3.1. Cp-Ti Density Characterization

Metallographic results of prismatic samples were classified, as shown in Figure 5, under 4 categories: fully dense, few number of small pores, keyhole porosity, and lack of fusion. Some examples of fully dense specimens are shown in Figure 5a,c,e, while an example of small pores is presented in Figure 5b. Lack of fusion porosity and keyhole are demonstrated in Figure 5d and Figure 5f, respectively. The VED value for each sample shows that by only looking at this value, it is not possible to distinguish between different density levels. Very close VED values can lead to totally different density conditions, as depicted in Figure 5e,f. Almost the same VED (56–57 J/mm3) results in almost fully dense or keyhole porosity due to the combination of scan speed and laser power. This is better explained with the results shown in Figure 6, where VED and LED values for each parameter set are shown with 19–208 J/mm3 and 0.125–0.75 J/mm ranges, respectively, and the resulting pore types are also symbolized in the process windows. Boundary lines separate almost fully dense parts from keyhole and lack of fusion porosities. Red parameter sets to the left of the boundary lines are keyhole porosities due to the high VED values. The blue sets above and around the boundary line have small pores, while the orange sets, which have low VED values, to the right of the line were formed as lack of fusion. Na et al. [10] also presented that the keyhole formation is seen as laser power increases from 120 W to 440 W, while lack of fusion generates as scan speed increases from 500 mm/s to 2000 mm/s. The outcomes showed similarity with Figure 6 outcomes.
The 5 parameter sets with very high VED values were canceled in 40 µm layer thickness batch as 139, 170, 173, and 208 J/mm3. The white rectangles in the graphs represent those sets that were not manufactured. High-dense green samples between the lines were determined as parameter sets to be worked on further in parameter optimization. Figure 6 shows that the number of fully dense samples increased as scan speed increased in all graphs regardless of layer thickness and hatch distance values. The almost fully dense samples were achieved practically for all laser power values except for 150 W. Small porosity formation can be observed at 800 and 1000 mm/s scan speed with all laser power values, while a lack of fusion pores generated at 1200 mm/s scan speed with 150 W for Figure 6b–d.
It was found that the number of almost full dense samples is lower at 60µm LT according to 40µm LT at the same LP, SS, and HD values (see Figure 6). It can be remarked that higher layer thickness causes a reduction in the density of cp-Ti parts.
Higher VED values were obtained at 90 µm hatch distance because of heat accumulation [23,25] compared to 110 µm. The increase in VED caused keyhole porosity formation at 90 µm while small, porous, highly dense parts were achieved with 110 µm hatch distance under the same LP (200 W), SS (800 mm/s), and LT (60 µm) values. Boundary lines between 1000 mm/s and 1200 mm/s SS and 200 W and 250 W LP mostly provide green samples, although VED values decreased as LT and HD increased at four graphics. The reason for this likely is that the laser power and scanning speed parameters influence density according to hatch distance and layer thickness. Na et al. [10] also achieved almost fully dense parts at 1000 mm/s scanning speed with 120 W to 440 W when LT is 30 µm and HD is 120 µm.
Almost full-density results can be obtained at certain ranges of laser power and scanning speed values, although VED values differ. This proves that the VED parameter is not the only criterion for the exposure process. Additionally, Figure 5 shows that both different types of porosity and almost full density can occur at the same or very close VED values. Another reason is that the physics of the complex melt pool cannot be explained since the interaction between the heat source and the powder is ignored in the VED formula [28].
Low layer thickness and high hatch distance are recommended with high scanning speed and moderate laser power values at the aforementioned outcomes as a result of the density characterization of Cp-Ti prismatic samples. Tensile test parameter sets were prepared according to the VED range of green samples in the graph within the scope of the study. In addition, reaching almost full density with 33 J/mm3 [13] and 58 J/mm3 [15] VED values shows that this study is also correlated with the literature.

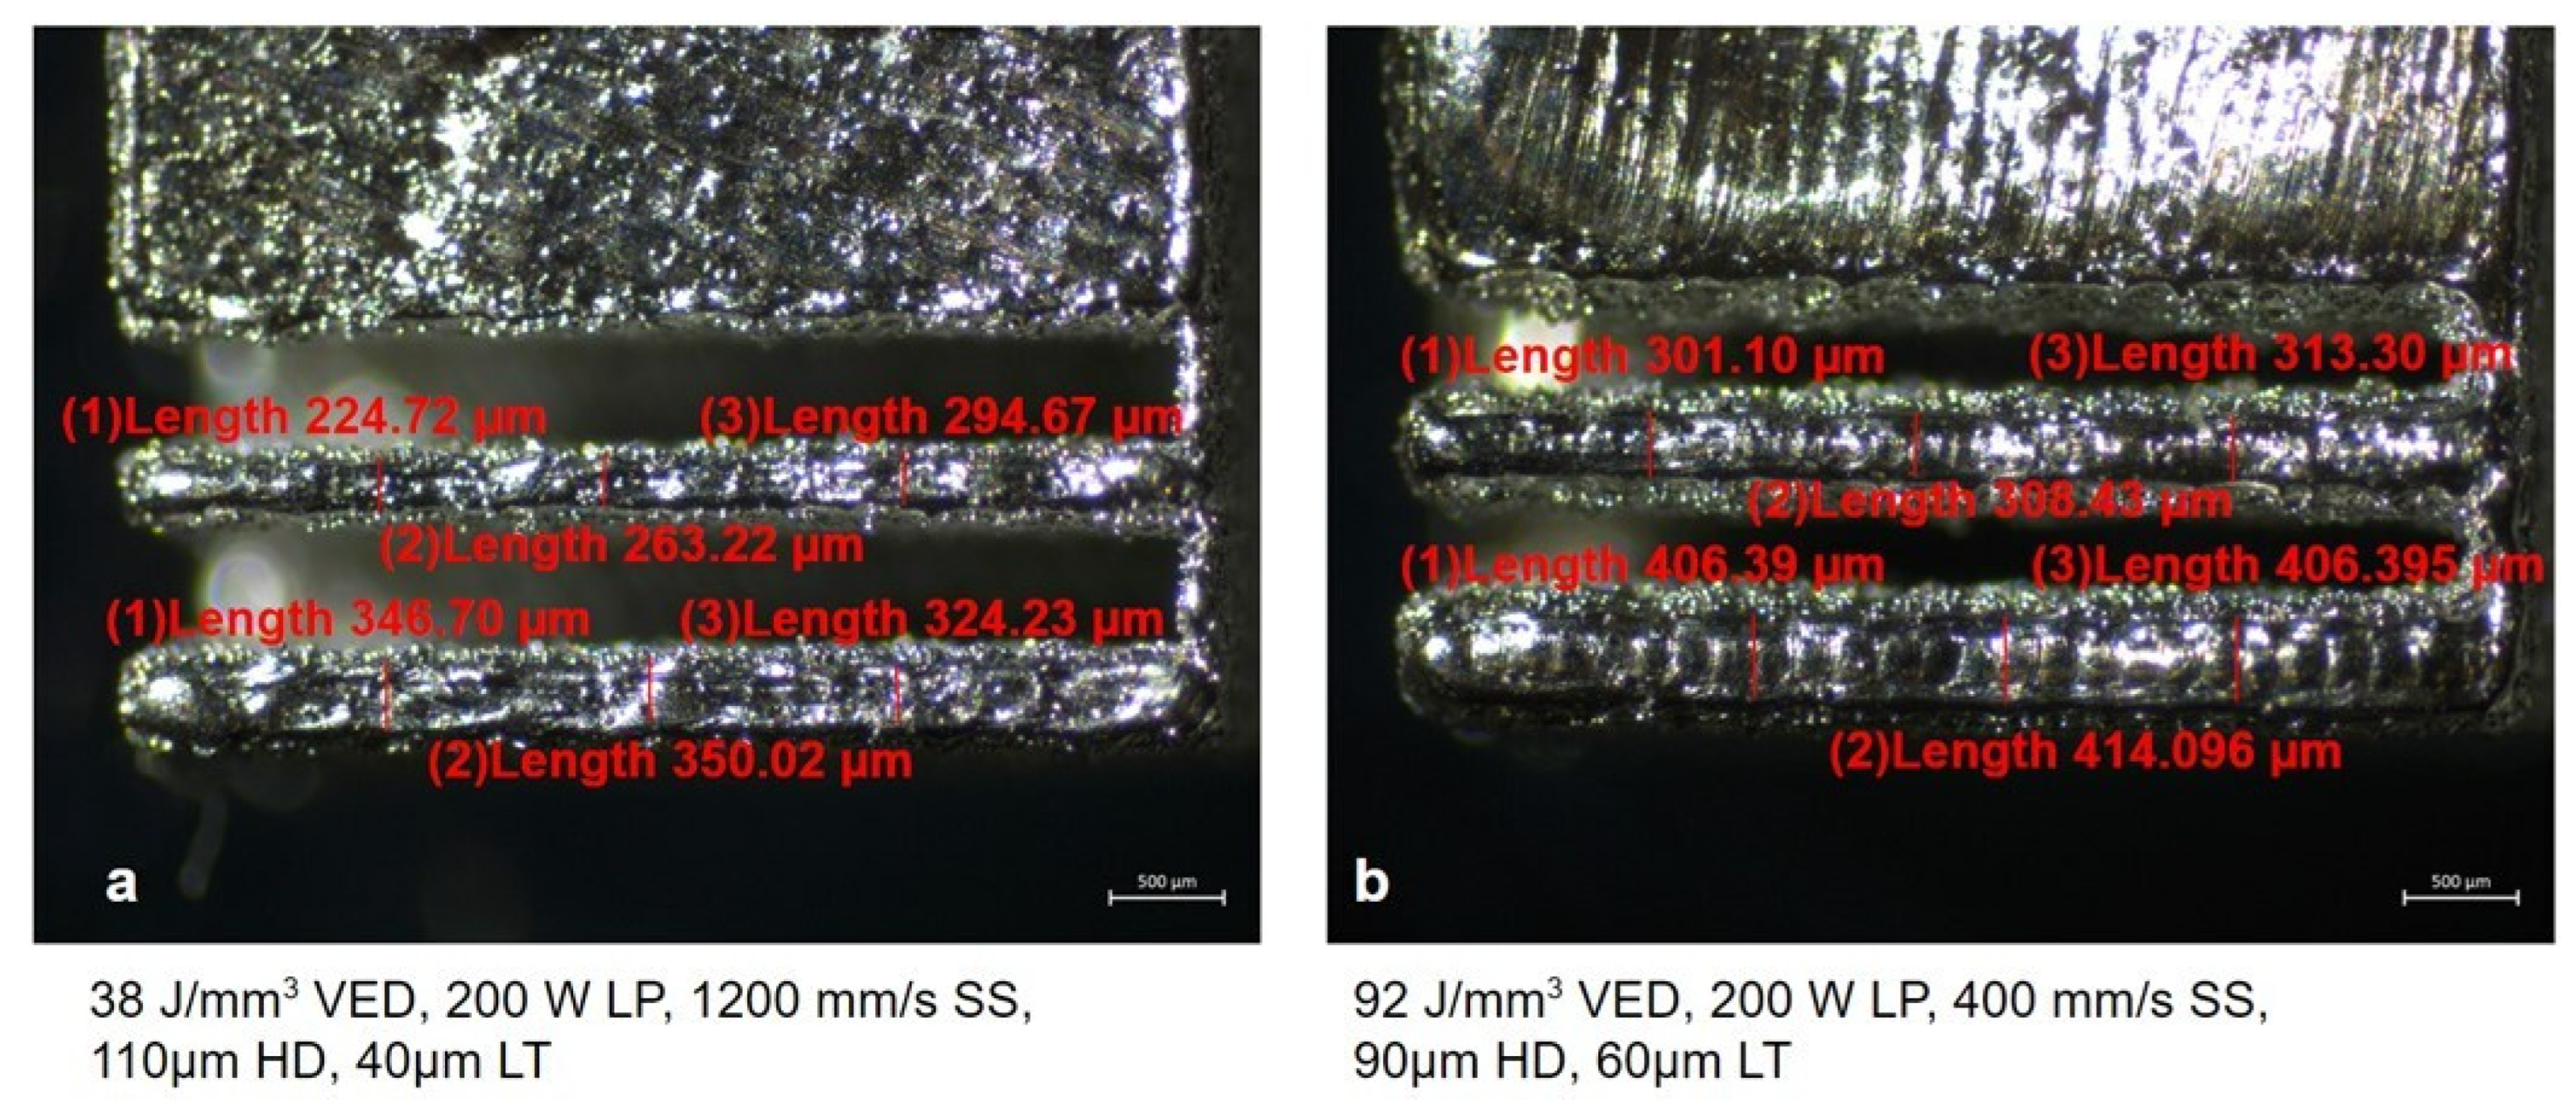
3.2. Dimensional Accuracy of Thin Walls

A dimensional error graph was created for the 0.4 mm (blue columns) and 0.5 mm (orange columns) wall thicknesses for each parameter set specified in Figure 7. Samples from parameter set number 1 to S40 (standard 40 µm parameter set) were produced with 40 µm layer thickness, while samples from 41 to S80 (standard 60 µm parameter set) included 60 µm layer thickness. Gaps in the graph are due to the parameter sets that were canceled due to high VED values.
The results show that the average dimensional error at a 60 µm layer thickness was approximately 30% less than the average of the samples produced with a 40 µm layer thickness. The effect of layer thickness on wall thickness can be explained with melt pool dimensions and laser track discontinuity [29]. Zhang et al. [29] stated that the melt pool sizes of lower layer thickness were larger than those with higher layer thickness under the same laser power and scanning speed since larger layer thickness requires more energy. It can be expressed that 60 µm layer thickness needs higher laser energy for powder fusion according to 40 µm in this study. Zhang et al. [29] indicated that the track discontinuity of the thicker layer is clearly higher than the thinner layer due to insufficient VED in addition to the melt pool size factor. Thin-walled structures can also generate heat accumulation which can cause crack propagation at high energy density. The heat is transferred from the top of the layer to the bottom faster as the layer thickness decreases; in other words, heat conductivity increases.
As a result, 40 µm layer thickness can form sufficient melt pool dimensions and melt track when it is combined with the right process parameters, and dimensional error can be tolerated with design compensation. Another advantage of 40 µm LT is greater performance on density results, as indicated in Section 3.1. The individual effects of scan speed, laser power, and hatch distance were, moreover, less noticeable on wall thickness after evaluation of all parameter sets.

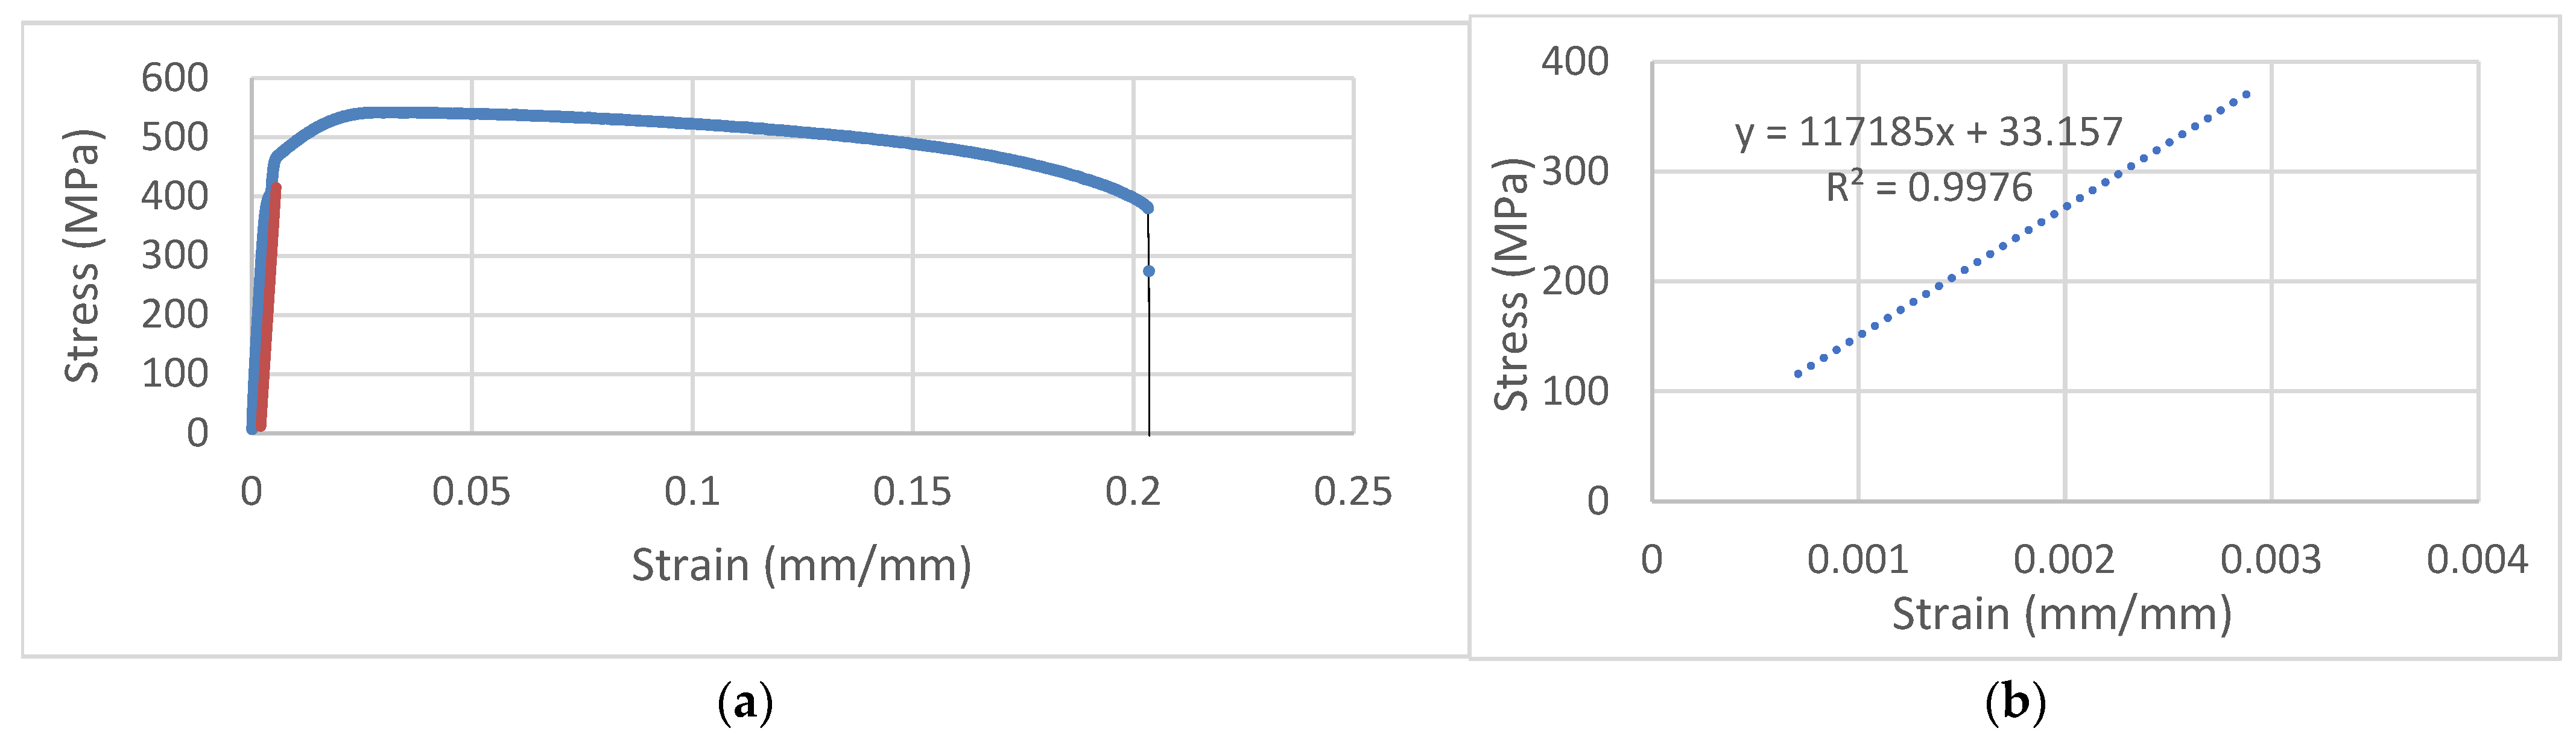
3.3. Mechanical Testing Results

The hardness test was applied to samples with high density and, additionally, to 3 samples with keyhole pores. The average Vickers hardness values of the tested highly dense samples are in the 210–230 HV range, while the specified hardness value for Cp-Ti in the material data is 195 HV [29], as seen in the distribution graph in Figure 8. Ataee et al. [8] stated that the hardness value of fabricated Cp-Ti with L-PBF is 232 HV, and thus the test results of this study are consistent with the literature. Three samples with keyhole pores showed the lowest hardness values in the graph (Figure 8). Therefore, the hardness values of the samples were wholly correlated with the density results; in other words, the VED parameter has an excellent impact on the hardness. Individual effects of process parameters on the material hardness were not observed.
Tensile tests were carried out on highly dense samples in accordance with the E8 standard. The aim of the test is to see whether the obtained properties with the L-PBF optimized process parameters are close to the material properties in the literature. Three parameter sets with 32, 45, and 47 J/mm3 VED values were produced as three samples per set.
Yield strength (YS) and ultimate tensile strength (UTS) of the material property datasheet [27] of Cp-Ti were indicated as 445 MPa and 570 Mpa, respectively, and referenced for this study. Yield strength and elongation values of manufactured parts by 3 parameter sets are shown in Figure 9, and 542 MPa UTS was also measured for all VED values (see Table 3). Experimental test results exhibited slightly lower values than referenced mechanical properties. The lowest YS value (405 MPa) was almost 9% lower than referenced YS, and UTS was measured 5% less for tensile samples, although all parameter sets for tensile tests were chosen from the optimum process parameter ranges to provide high density. The reason might be that the heat treatment was applied to tensile samples with 780 °C in this study, while referenced values were obtained with 700 °C heat treatment. On the other hand, hardness test specimens were higher than the reference values since no heat treatment was applied.
The yield strength obtained with the 47 J/mm3 VED parameter set was slightly lower than the 45 and 32 J/mm3 samples, as shown in Figure 9. The reason might be 250 W laser power value of 47 J/mm3 causes a low amount of small pores formation and resulting lower mechanical behavior than the 200 W laser power of 45 and 32 J/mm3 parameter sets. On the other hand, UTS values of 542 MPa were measured to be approximately the same for three sets which are very close to the 570 MPa UTS reference value.
It should be noted that in some other references, depending on the grade and production parameters, the obtained mechanical properties show a high scatter. As given in [30,31], grade 2 Cp-Ti can lead to a tensile strength of 345 MPa, which is significantly lower than the reference value that is obtained with a layer thickness of 30 µm and the results obtained in this study. Moreover, another reference material datasheet, which can be found in [31], states that the UTS is 570 Mpa, whereas YS is 430 MPa maximum. These results were also obtained with 30 µm by the same machine vendor and are closer to the results of the current work. Another powder supplier [32] specifies that the minimum UTS shall be 345 MPa with typical UTS values in the range of 510–605 MPa, while the minimum YS shall be 275 MPa with typical YS values in the range of 335–545 MPa. This also proves that the mechanical properties obtained here are well above the minimum and satisfy the typical ranges.
One of the tensile test sample’s stress–strain graph is shown in Figure 10a, and its 117 GPa elastic modulus value was determined via linear regression equation in Figure 10b. Elongation at break was measured at almost 20%, while 26% elongation was stated in the reference data [27]. In addition, the necking of the tensile sample with a reduction in diameter is indicative of the ductile fracture in Figure 11. Additionally, Attar et al. [14] found 18% elongation and higher than 250 HV hardness in samples with 99,5% relative density.

4. Conclusions

The current L-PBF process parameter optimization study was carried out on Cp-Ti, investigating the fabricability of thin walls with high density and good mechanical properties. A wide range of scan speed, laser power, hatch distance, and layer thickness values were investigated, leading to the fact that a VED value in the range of 32–47 J/mm provided high density and adequate mechanical properties.
  • Within the tested ranges, a low layer thickness and a high hatch distance are recommended with high scan speed and moderate laser power values. The laser power and scan speed parameters have a higher influence on the density.
  • The wall thicknesses obtained with the tested parameters were lower than the nominal 400 and 500 µm, while 60 µm led to smaller dimensional errors and achieved closer to the nominal thickness values. However, to increase the resolution along the z-axis and obtained density for small features, it is recommended to use smaller layer thicknesses.
  • In terms of mechanical properties, in comparison to the literature, satisfying results are obtained with the selected process parameters well above the minimum requirements.
  • It is concluded that low layer thickness and low laser power favored the producibility of thin-walled Cp-Ti structures, while high scan speed and moderate laser power were able to achieve almost full density.

Author Contributions

All authors contributed to the study’s conception and design. Material preparation, data collection, and analysis were performed. The first draft of the manuscript was written by F.N.D., and all authors commented on previous versions of the manuscript. Conceptualization, F.N.D., E.Y., O.P. and F.K.; Methodology, F.N.D., E.Y., O.P. and F.K.; Validation, F.N.D.; Resources E.Y.; Data Curation, F.N.D., O.P.; Writing—Original Draft Preparation, F.N.D.; Writing—Review and Editing, E.Y., O.P. and F.K.; Supervision, Project Administration, E.Y.; Funding Acquisition, E.Y. All authors have read and agreed to the published version of the manuscript.

Funding

Some of the research for this review was performed under the project PorouSLM: “Development of a Selective Laser Melting (SLM) Technology Platform for the Production and Characterization of Calcium Phosphate/PLGA Composite Coated Porous Titanium Mini Plates for Maxillofacial, Hand and Ear-Nose-Throat (ENT) Surgery” and was funded by the Cooperation of The Scientific and Technological Research Council of Turkey (TUBITAK) and the National Research Foundation (NRF) of Korea under grant agreement. TUBITAK Funding Number 120N943 and NRF Funding Number 2020K2A9A1A0610851.

Data Availability Statement

Data sharing not applicable. No new data were created or analyzed in this study. Data sharing is not applicable to this article.

Conflicts of Interest

The authors declare that they have no known competing financial interest or personal relationships that could have appeared to influence the work reported in this paper. Feza Korkusuz MD is a member of the Turkish Academy of Sciences (TUBA).

References

  1. Rahmatabadi, D.; Soltanmohammadi, K.; Aberoumand, M.; Soleyman, E.; Ghasemi, I.; Baniassadi, M.; Abrinia, K.; Bodaghi, M.; Baghani, M. Development of Pure Poly Vinyl Chloride (PVC) with Excellent 3D Printability and Macro-and Micro-Structural Properties. Macromol. Mater. Eng. 2022, 2200568. [Google Scholar] [CrossRef]
  2. Ahmadi, M.; Tabary, S.B.; Rahmatabadi, D.; Ebrahimi, M.S.; Abrinia, K.; Hashemi, R. Review of Selective Laser Melting of Magnesium Alloys: Advantages, Microstructure and Mechanical Characterizations, Defects, Challenges, and Applications. J. Mater. Res. Technol. 2022, 19, 1537–1562. [Google Scholar] [CrossRef]
  3. Abedi, H.R.; Hanzaki, A.Z.; Azami, M.; Kahnooji, M.; Rahmatabadi, D. The high temperature flow behavior of additively manufactured Inconel 625 superalloy. Mater. Res. Express 2019, 6, 116514. [Google Scholar] [CrossRef]
  4. Sing, S.L.; Huang, S.; Goh, G.D.; Goh, G.L.; Tey, C.F.; Tan, J.H.K.; Yeong, W.Y. Emerging metallic systems for additive manufacturing: In-situ alloying and multi-metal processing in laser powder bed fusion. Prog. Mater. Sci. 2021, 119, 100795. [Google Scholar] [CrossRef]
  5. Yuan, L.; Ding, S.; Wen, C. Additive manufacturing technology for porous metal implant applications and triple minimal surface structures: A review. Bioact. Mater. 2019, 4, 56–70. [Google Scholar] [CrossRef]
  6. Khorasani, A.M.; Goldberg, M.; Doeven, E.H.; Littlefair, G. Titanium in biomedical applications—Properties and fabrication: A review. J. Biomater. Tissue Eng. 2015, 5, 593–619. [Google Scholar] [CrossRef]
  7. Navi, N.U.; Tenenbaum, J.; Sabatani, E.; Kimmel, G.; David, R.B.; Rosen, B.A.; Eliaz, N. Hydrogen effects on electrochemically charged additive manufactured by electron beam melting (EBM) and wrought Ti–6Al–4V alloys. Int. J. Hydrogen Energy 2020, 45, 25523–25540. [Google Scholar] [CrossRef]
  8. Ataee, A.; Li, Y.; Brandt, M.; Wen, C. Ultrahigh-strength titanium gyroid scaffolds manufactured by selective laser melting (SLM) for bone implant applications. Acta Mater. 2018, 158, 354–368. [Google Scholar] [CrossRef]
  9. Depboylu, F.N.; Yasa, E.; Poyraz, Ö.; Minguella-Canela, J.; Korkusuz, F.; De los Santos López, M.A. Titanium based bone implants production using laser powder bed fusion technology. J. Mater. Res. Technol. 2022, 17, 1408–1426. [Google Scholar] [CrossRef]
  10. Wang, D.W.; Zhou, Y.H.; Shen, J.; Liu, Y.; Li, D.F.; Zhou, Q.; Yan, M. Selective laser melting under the reactive atmosphere: A convenient and efficient approach to fabricate ultrahigh strength commercially pure titanium without sacrificing ductility. Mater. Sci. Eng. A 2019, 762, 138078. [Google Scholar] [CrossRef]
  11. Wysocki, B.; Maj, P.; Krawczyńska, A.; Rożniatowski, K.; Zdunek, J.; Kurzydłowski, K.J.; Święszkowski, W. Microstructure and mechanical properties investigation of CP titanium processed by selective laser melting (SLM). J. Mater. Process. Technol. 2017, 241, 13–23. [Google Scholar] [CrossRef]
  12. Li, X.P.; Van Humbeeck, J.; Kruth, J.-P. Selective laser melting of weak-textured commercially pure titanium with high strength and ductility: A study from laser power perspective. Mater. Des. 2017, 116, 352–358. [Google Scholar] [CrossRef]
  13. Na, T.W.; Kim, W.R.; Yang, S.M.; Kwon, O.; Park, J.M.; Kim, G.H.; Kim, H.G. Effect of laser power on oxygen and nitrogen concentration of commercially pure titanium manufactured by selective laser melting. Mater. Charact. 2018, 143, 110–117. [Google Scholar] [CrossRef]
  14. Attar, H.; Calin, M.; Zhang, L.C.; Scudino, S.; Eckert, J. Manufacture by selective laser melting and mechanical behavior of commercially pure titanium. Mater. Sci. Eng. A 2014, 593, 170–177. [Google Scholar] [CrossRef]
  15. Gu, D.; Hagedorn, Y.C.; Meiners, W.; Meng, G.; Batista, R.J.S.; Wissenbach, K.; Poprawe, R. Densification behavior, microstructure evolution, and wear performance of selective laser melting processed commercially pure titanium. Acta Mater. 2012, 60, 3849–3860. [Google Scholar] [CrossRef]
  16. Dong, Y.P.; Tang, J.C.; Wang, D.W.; Wang, N.; He, Z.D.; Li, J.; Yan, M. Additive manufacturing of pure Ti with superior mechanical performance, low cost, and biocompatibility for potential replacement of Ti-6Al-4V. Mater. Des. 2020, 196, 109142. [Google Scholar] [CrossRef]
  17. Loginov, Y.N.; Stepanov, S.I.; Ryshkov, N.M.; Yudin, A.V.; Tretyakov, E.V. Effect of SLM parameters on the structure and properties of CP-Ti. In AIP Conference Proceedings; AIP Publishing LLC: Melville, NY, USA, 2018; p. 040052. [Google Scholar] [CrossRef]
  18. Pfaff, A.; Jäcklein, M.; Schlager, M.; Harwick, W.; Hoschke, K.; Balle, F. An empirical approach for the development of process parameters for laser powder bed fusion. Materials 2020, 13, 5400. [Google Scholar] [CrossRef] [PubMed]
  19. Ferro, P.; Meneghello, R.; Savio, G.; Berto, F. A modified volumetric energy density–based approach for porosity assessment in additive manufacturing process design. Int. J. Adv. Manuf. Technol. 2020, 110, 1911–1921. [Google Scholar] [CrossRef]
  20. Oliveira, J.P.; Lalonde, A.D.; Ma, J. Processing parameters in laser powder bed fusion metal additive manufacturing. Mater. Des. 2020, 193, 108762. [Google Scholar] [CrossRef]
  21. Ahmed, N.; Barsoum, I.; Haidemenopoulos, G.; Al-Rub, R.A. Process parameter selection and optimization of laser powder bed fusion for 316L stainless steel: A review. J. Manuf. Process. 2022, 75, 415–434. [Google Scholar] [CrossRef]
  22. Mohr, G.; Altenburg, S.J.; Hilgenberg, K. Effects of inter layer time and build height on resulting properties of 316L stainless steel processed by laser powder bed fusion. Addit. Manuf. 2020, 32, 101080. [Google Scholar] [CrossRef]
  23. Pauzon, C.; Leicht, A.; Klement, U.; Forêt, P.; Hryha, E. Effect of the process gas and scan speed on the properties and productivity of thin 316L structures produced by laser-powder bed fusion. Metall. Mater. Trans. A 2020, 51, 5339–5350. [Google Scholar] [CrossRef]
  24. Zhang, Z.; Yang, X.; Song, F.; Yao, X.; Zhang, T.; Liu, S.; Tang, H. Assessment of microstructural evolution and associated tensile behavior in thin-walled Ti6Al4V parts manufactured via selective laser melting. Mater. Charact. 2022, 194, 112481. [Google Scholar] [CrossRef]
  25. Chaudry, M.A.; Mohr, G.; Hilgenberg, K. Experimental and numerical comparison of heat accumulation during laser powder bed fusion of 316L stainless steel. Prog. Addit. Manuf. 2022, 7, 1071–1083. [Google Scholar] [CrossRef]
  26. Montufar, E.B.; Tkachenko, S.; Casas-Luna, M.; Škarvada, P.; Slámečka, K.; Diaz-de-la-Torre, S.; Kaiser, J. Benchmarking of additive manufacturing technologies for commercially-pure-titanium bone-tissue-engineering scaffolds: Processing-microstructure-property relationship. Addit. Manuf. 2020, 36, 101516. [Google Scholar] [CrossRef]
  27. EOS Titanium TiCP Grade 2, EOS GmbH Electro Optical Systems, Finland. 2016. Available online: www.eos.info (accessed on 21 January 2023).
  28. Bertoli, U.S.; Wolfer, A.J.; Matthews, M.J.; Delplanque, J.P.R.; Schoenung, J.M. On the limitations of volumetric energy density as a design parameter for selective laser melting. Mater. Des. 2017, 113, 331–340. [Google Scholar] [CrossRef]
  29. Zhang, Z.; Ali, U.; Mahmoodkhani, Y.; Huang, Y.; Shahabad, S.I.; Kasinathan, A.R.; Toyserkani, E. Experimental and numerical investigation on the effect of layer thickness during laser powder-bed fusion of stainless steel 17-4PH. Int. J. Rapid Manuf. 2020, 9, 212. [Google Scholar] [CrossRef]
  30. EOS Titanium TiCP Grade 2, EOS GmbH Electro Optical Systems. Finland. 2009. Available online: https://www.3dimpuls.com/sites/default/files/dok_book/m_materials_en.pdf (accessed on 21 January 2023).
  31. EOS Titanium TiCP Grade 2, EOS GmbH Electro Optical Systems. Finland. 2017. Available online: https://www.eos.info/03_system-related-assets/material-related-contents/metal-materials-and-examples/metal-material-datasheet/titan/ticp_9011-0036_m404_material_data_sheet_12-17_flexline_en.pdf (accessed on 21 January 2023).
  32. EOS Titanium TiCP Grade 2, EOS GmbH Electro Optical Systems. Finland. 2000. Available online: https://www.carpentertechnology.com/hubfs/7407324/Material%20Saftey%20Data%20Sheets/Ti%20CP%20Grade%202.pdf (accessed on 21 January 2023).
Figure 1. (a) The most effective L-PBF process parameters. Reprinted with permission from Oliveira et al. [20]; [Mater. Des]; [Elsevier]; [2020]. (b) Specified porosity regions at laser power-scan speed graph. Reprinted with permission from Ahmed et al. [21]; [J. Manuf.Process]; [Elsevier]; [2022].
Machines 11 00272 g001
Figure 2. (a) Design of prismatic sample geometry with 0.4 mm and 0.5 mm thin walls; (b) Manufactured samples with 60 µm layer thickness.
Machines 11 00272 g002
Figure 3. (a) Nine as-built tensile test samples; (b) Dimensions of machined tensile test samples.
Machines 11 00272 g003
Figure 4. (a) Measurement of wall thicknesses at 40 µm layer thickness. (b) Measurement of wall thicknesses at 60 µm layer thickness.
Machines 11 00272 g004
Figure 5. Porosity types classified between the nearly same VED values. (a) Almost fully dense part with 35 J/mm3 VED. (b) Small pores with 35 J/mm3 VED value. (c) Almost fully dense with 30 J/mm3 VED value. (d) Lack of fusion porosity with 25 J/mm3 VED value. (e) Almost fully dense with 57 J/mm3 VED value. (f) Keyhole porosity with 56 J/mm3 VED value.
Machines 11 00272 g005
Figure 6. Laser power and scan speed graphs present density results. Boundary lines separate almost full dense parts from keyhole and lack of fusion porous parts. VED and LED values are shown per graph (a) 40 µm layer thickness (LT) and 90 µm hatch distance (HD); (b) 40 µm LT and 110 µm HD; (c) 60 µm LT and 90 µm HD; (d) 60 µm LT and 110 µm HD.
Machines 11 00272 g006
Figure 7. (a) Presentation of layer thickness. Reproduced with permission from Oliveira et al. [20]; [Mater. Des]; [Elsevier]; [2020]. (b) Dimensional error and parameter set graph of Cp-Ti thin walls that have blue and orange bars present 0.4 mm and 0.5 mm thin walls, respectively. 40 µm LT is presented from 1 parameter set to S40 (EOS Ti6Al4V standard 40 µm LT parameter set), while 60 µm LT includes the parameter sets from 41 to S60 (EOS Ti6Al4V standard 60 µm LT parameter set).
Machines 11 00272 g007
Figure 8. Hardness values of highly dense Cp-Ti samples were compared to Cp-Ti material data (195 HV) at the Vickers hardness test.
Machines 11 00272 g008
Figure 9. Yield strength, elongation, and VED values graph for Cp-Ti tensile test results.
Machines 11 00272 g009
Figure 10. (a) Stress–strain graph of tensile test sample. (b) Elastic modulus of tensile test sample.
Machines 11 00272 g010
Figure 11. (a) Necking of tensile test sample’ fracture. (b) Top view of tensile fracture.
Machines 11 00272 g011
Table 1. Previous L-PBF process parameter optimization studies for Cp-Ti and their density results.
Ref.MaterialLaser Spot Size (µm)Laser Power (W)Layer Thick. (µm)Scanning Speed (mm/s)Hatch Distance (µm)VED (J/mm3)Density
[10]Cp-Ti (Grade 1)641223040012085Almost Full
[11]Cp-Ti -5025333807598.7%
[12]Cp-Ti (Grade 1)5050- 25030---Over 99%
[8]Cp-Ti (Grade 1)-1003038512072Almost Full
[13]Cp-Ti (Grade 1)120120- 44030100012033–122Almost Full
[14]Cp-Ti (Grade 2)8016510013810012099.5%
[15]Cp-Ti (Grade 2)709050100–400-9099.5%
[16]Cp-Ti-2103010001205899.5%
[17]Cp-Ti (Grade 1)60–70250–34050700–800100–12052–9798.2%
Table 2. L-PBF AM process parameter sets and VED ranges of Cp-Ti samples.
Parameter SetLaser Power (W)Scan Speed (mm/s)Hatch Distance (µm)Layer Thick. (µm)VED (J/mm3)
Density 80 Sets15040090
110
40
60
19–104
600
800
1000
1200
20040090
110
40
60
25–139
600
800
1000
1200
25040090
110
40
60
32–173
600
800
1000
1200
30040090
110
40
60
38–208
600
800
1000
1200
Tensile TestC125012001104047
C220010001104045
C320014001104032
Table 3. Tensile test results of three different parameter sets.
Tensile ParametersVED (J/mm3)UTS (MPa)Yield Strength (MPa)Elongation (%)
C14754240520.0
C24554242719.7
C33254241919.4
Disclaimer/Publisher’s Note: The statements, opinions and data contained in all publications are solely those of the individual author(s) and contributor(s) and not of MDPI and/or the editor(s). MDPI and/or the editor(s) disclaim responsibility for any injury to people or property resulting from any ideas, methods, instructions or products referred to in the content.

