1. Introduction
It is erroneously understood that the costs of, for example, building construction, vehicle production, energy installations, software, etc. are those necessary to obtain the fully finished product (the design and production phases). However, beyond this conception, it must be taken into account that the costs of maintaining the product throughout its useful life [
1] can represent between 30% and 60% of the total operating costs [
2]. This is also the case in the field of renewable energies, for example in the wind energy sector, which makes it necessary to implement maintenance strategies in order to reduce the wear and tear on wind turbines (WT). However, this problem does not only affect the economy; it is also related to the impact on the environment, as losses are also responsible for the release of greenhouse gases.
Industrial maintenance is the set of technical-organisational measures, which may or may not be elaborated in advance, whose purpose is to maintain the functionality of the equipment and guarantee an optimum state of the machinery over time, with the following objectives: cost savings (reduce corrective and preventive maintenance costs as much as possible, extend the useful life of the machines), energy savings (improve machine performance), maximum production (maximum machine availability), quality (ensure the quality of the product obtained through the operation of the machines), occupational safety (for the technicians who operate the machines), and environmental conservation (minimising emissions) [
3].
There are three types of maintenance: corrective, preventive, and predictive, and five main stages that make up the life cycle of a product [
4]. Another possible classification of the types of maintenance according to the way of acting on the product is the one proposed by D. Sillivant [
5], who differentiates between reactive maintenance, in which the product is used until it is damaged, and proactive maintenance, in which maintenance actions are planned or carried out as a result of the observation and study of certain indicators. Historically, maintenance has evolved from corrective maintenance, which was only performed when products were damaged, to current methods, which use tools to perform preventive maintenance, including predictive or prognosis maintenance [
6].
It has been proven that applying only corrective maintenance is very inefficient, which is why preventive and predictive maintenance methods are so popular today [
7]. A balanced compromise between the two maintenance strategies, proactive and reactive (or corrective and preventive), is called condition-based maintenance (CBM), which is based on continuous monitoring and detection of failures and determining the necessary maintenance tasks before a failure occurs. This is achieved through condition monitoring systems (CMS), which involve the acquisition of data from the sensors, their pre-processing, subsequent evaluation, and finally the interpretation of the result. The first documented references to the concept of predictive maintenance date back to the 1990s and can be classified as a proactive type of maintenance. This type of maintenance consists of performing maintenance by observing and analysing in advance (and, in some cases, in real time) certain parameters of product behaviour. Depending on whether the data is observed in real time or not, we can differentiate between three types of predictive maintenance: those based on existing sensors, those based on supply sensors, and those based on signal techniques [
8].
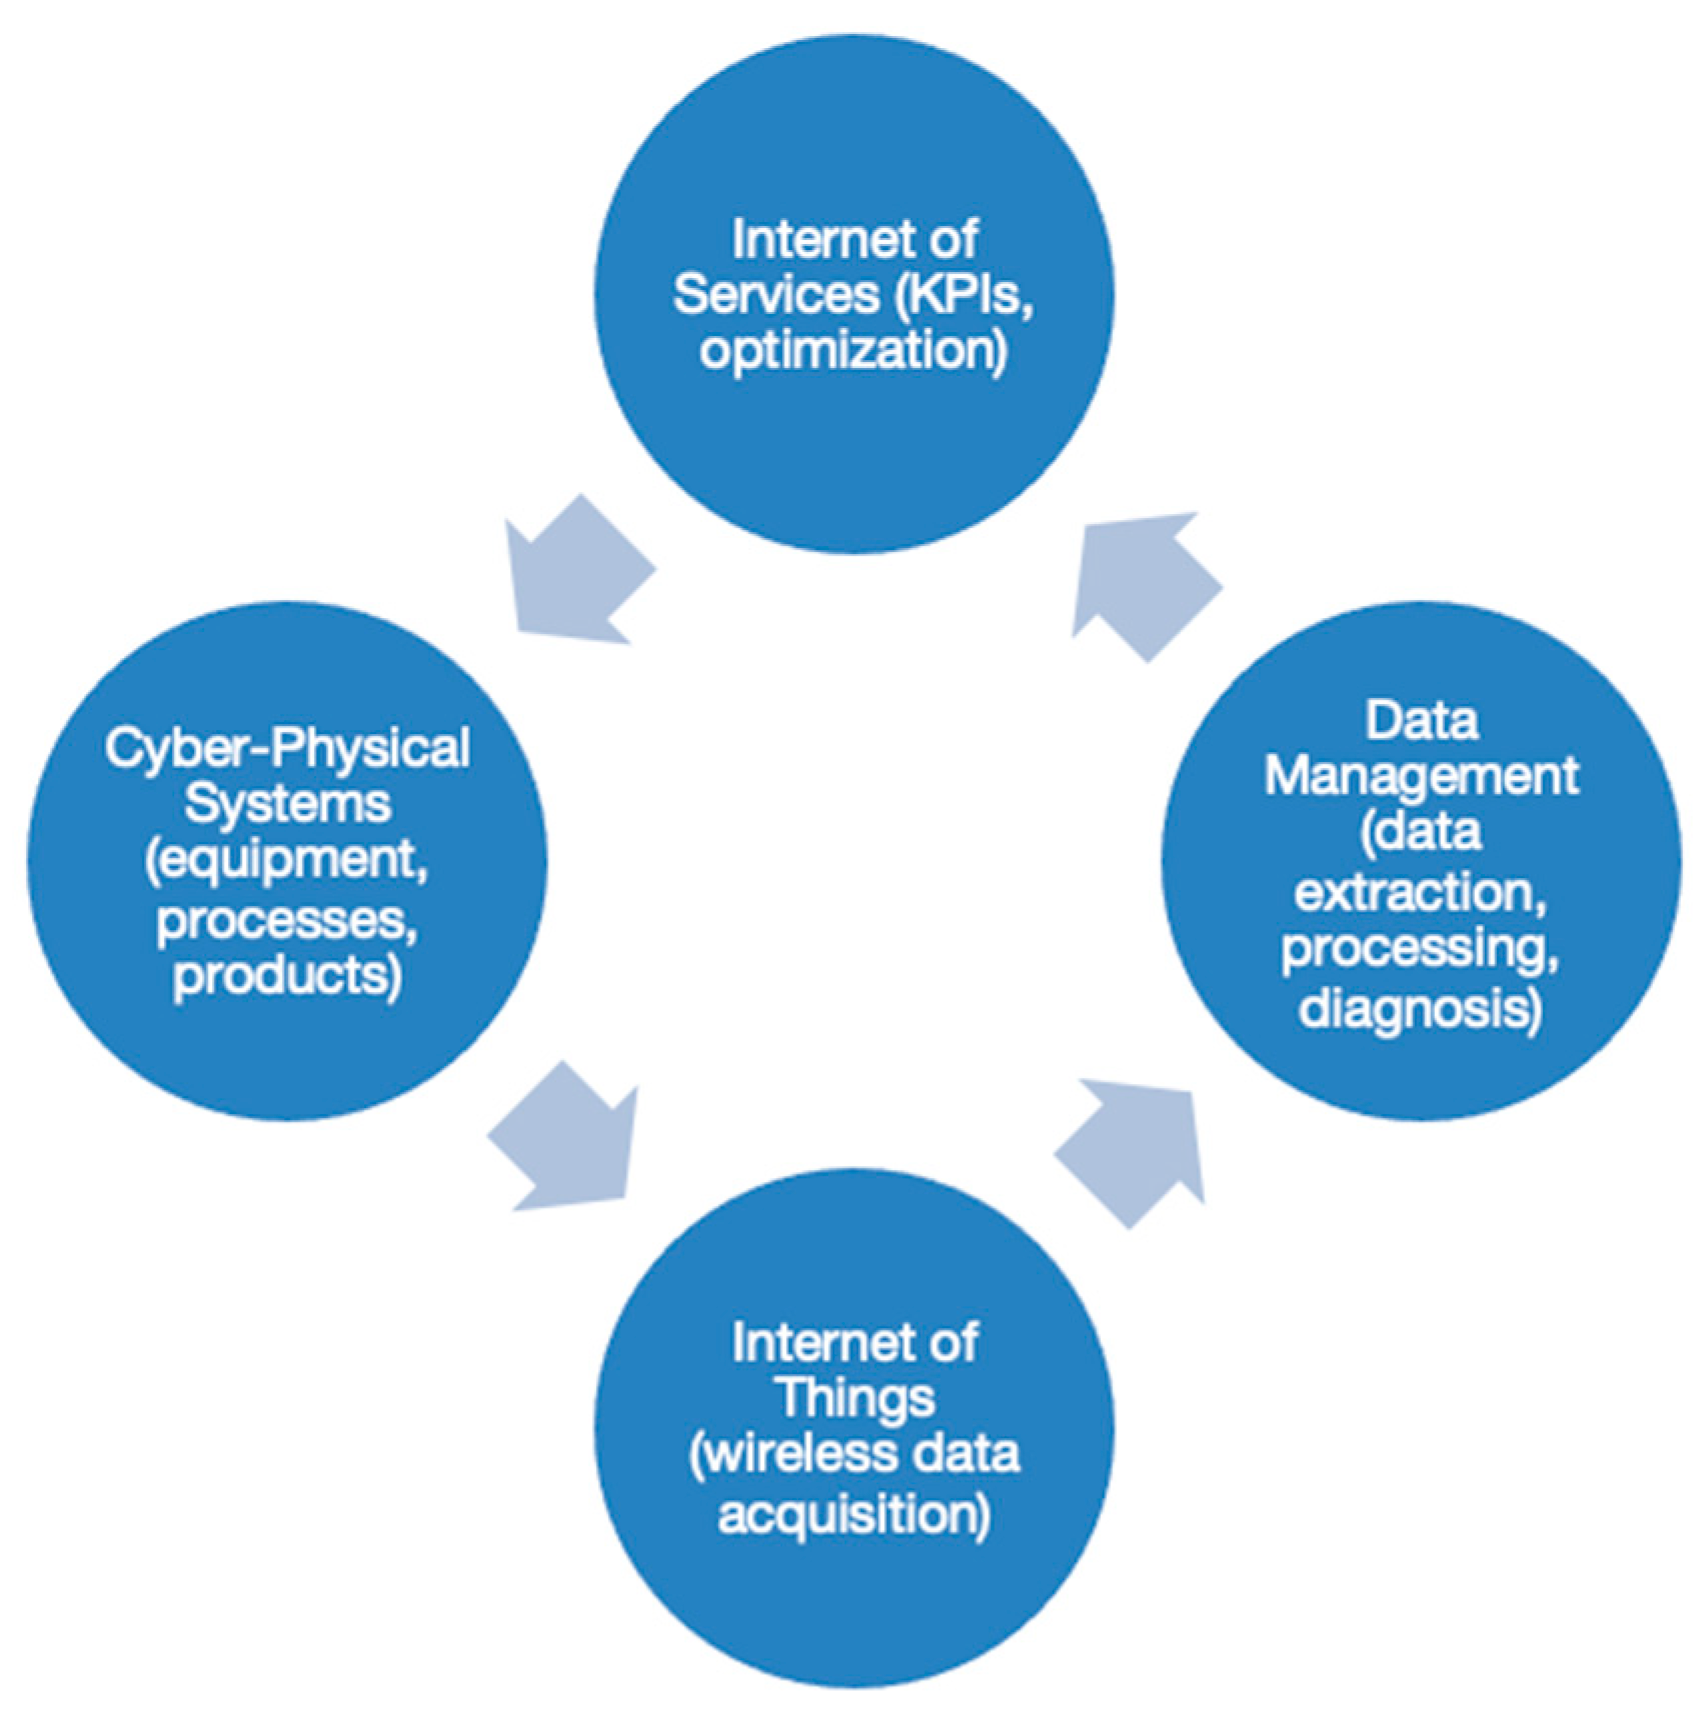
The implementation of predictive maintenance in a 4.0 industry (see
Figure 1) changes the processes compared to classical maintenance [
9]. One of the main problems is the large amount of data that is acquired and has to be processed. This leads to the big data paradigm, which must be addressed with data management methods such as: Cross Industry Standard Process for Data Mining (CRISP-DM), Sample, Explore, Modify, Model, and Access (SEMMA), and the Team Data Science Process (TDSP) [
10]. The first two models have been in use for about two decades, but changes in industrial processes and data analysis modelled around new industries have led to the need to incorporate new management models such as TDSP.
2. Literature Review
In this section, we present and briefly discuss some interesting works related to clustering techniques applied to different fields. The purpose is to show how clustering algorithms could be applied to our data and, at the same time, to point out possible alternatives that could be further investigated. The list of reviewed papers is presented in
Table 1, while a brief description of each paper follows in the subsections.
2.1. Silhouette Analysis for Performance Evaluation in Machine Learning with Applications to Clustering
This paper focuses on the K-means clustering methods, more specifically kernel K-means, a nonlinear extension that can identify clusters that are not linearly separable by using kernel functions such as Gaussian, polynomial, or hyperbolic tangent. To eliminate the partiality depending on the kernel function that has been used, the performance was evaluated by normalised mutual information, a supervised method that needs a training set. Since a training set is not always available, this paper investigates the development of an unsupervised method, the Silhouette index, to assess performance.
2.2. Segmentation of Retail Consumers with Soft Clustering Approach
In this paper, an intuitionistic fuzzy clustering algorithm is proposed to better segment customers shopping in a supermarket. Although the paper deals with data from another application, the approach is of great interest as it uses soft computing methods, which are well adapted for boundary data. This data is the hardest to assign, as they are close to more than one group. The results in this study show that soft computing methods are a good alternative for segmentation and generate more reliable results than traditional clustering models.
2.3. Identifying a Home System of Practices for Energy Use with K-Means Clustering Techniques
This paper focuses on the study of the variety of human behaviours in relation to energy consumption using K-means cluster analysis. This analysis aims to identify practises and routines in energy use, using real-time energy consumption data, and how they differ during COVID-19 lockdown. The results are used to predict energy consumption to assist in the development of net energy balance and grid stabilisation.
2.4. Fault-Tolerant Cooperative Control of Large-Scale Wind Farms and Wind Farm Clusters
This work focuses on the search for an effective method to detect faults in offshore wind farms, namely on-line fault detection, diagnosis, and accommodation methods, in order to improve performance and reliability. The proposed method is a fault-tolerant cooperative control scheme based on signal correction that detects, diagnoses, and accommodates mild and severe power loss faults.
2.5. Research Gap and Purpose of This Paper
One of the main problems that arises when working with alarms and warnings is having to deal with their high number of occurrences. The SCADA system records hundreds of alarms and warnings from all systems. When these events have been analysed, it becomes apparent that they are evenly distributed over the entire SCADA runtime, and it is extremely difficult to clearly associate them with hardware failures. For this reason, entering alarm information to label the signals is often unreliable, and it is desirable to work with an unsupervised methodology.
The main objective of this work is to explore how clustering algorithms can help identify unusual behaviour in wind turbines in order to apply more effective predictive maintenance. The data will be explored alone, for each WT, and as a whole as a wind farm, using the K-means algorithm applied to existing SCADA data.
The silhouette method is used to determine the ideal number of clusters based on the available data set. Although K-means has been widely used to investigate the behaviour of clusters, its application to SCADA data through passive predictive maintenance techniques applied to single wind turbines and wind turbine farms deserves new approaches such as the one suggested in this article. The data used in this paper (see
Section 3.2. Data background) has been used in previous papers, such as [
15,
16,
17], but the clustering approach was not used in these previous works.
3. Materials and Methods
Previous work using the same database attempted to identify failures in advance using different approaches. In [
15], a classification approach is used. The feature selection of variables was investigated, and the results were evaluated using a k-NN model. The data imbalance and the lack of warnings or alarms made this approach useless in practical applications. A different approach, focusing on normality models, was then used. The results in [
16] show that extreme learning machines (ELM) are good candidates for predicting one variable (sensor data) from others and then evaluating the error made by the model. If the error is above a threshold, it can be concluded that some malfunction is starting to occur as the model deviates from the real data. Finally, in [
17], the previous idea was modified by using at the same time the information of the same variable available from all the WTs of the wind farm. This made it possible to detect failures by calculating the difference between a signal and the median signal (reference).
The approach followed in this work consists of applying the K-means algorithm to a set of wind turbine SCADA data. These data are obtained from the different sensors on the WTs, which can be, for example: wind speed, wind turbine temperature, power delivered, blade pitch angle, etc. By applying the K-means algorithm to different groups of data, it is hoped to obtain clusters that, once interpreted, will help to understand the behaviour of the wind turbine in order to be able to apply predictive maintenance strategies. This approach is simple, following the results from [
17], and will help to understand the different behaviours of the WTs in the wind farm.
The method for obtaining these results consists, in this order, of: setting up tests for the growth of the data for different variables, writing the complete script code (which includes the K-means algorithm function), graphically representing these results in a readable form, and, finally, interpreting the results. To obtain the results, the Matlab software is used, which has the function Kmeans(X, k), where X corresponds to the SCADA data matrix selected and k is the number of clusters.
3.1. K-Means Algorithm
The K-means algorithm is a widely used and well-known algorithm that has been previously applied to solve different computational problems in areas such as geostatistics [
18] or image classification and segmentation [
19]. It was first used by James McQueen in 1967 [
20], although its conception is due to Hugo Steinhaus in 1957 [
21].
Automatic object classification is developed from three types of algorithms: supervised classification, unsupervised classification, and semi-supervised classification. K-Means is an unsupervised classification algorithm, i.e., the data is classified according to its internal structure, properties, and characteristics. In contrast, supervised classification algorithms use a label associated with each available datapoint, which indicates whether the classification has been performed correctly.
In this way, using the K-means algorithm, a series of objects can be grouped into K clusters based on the characteristics of these objects. This grouping is done by minimising the sum of the distances (generally quadratic) between each object and the centroid of its group. This clustering consists of three steps:
Step one: Initialisation. Select the number of groups (K) and assign a random group to each sample (random value between 1 and K).
Step two: Assignment of objects to centroids. Each sample in the dataset is assigned to its nearest centroid by calculating the minimum squared Euclidean distance.
Step three: Update of centroids. The position of the centroid of each group is updated by taking as a new centroid the average position of the objects that belong to this group.
Steps two and three are repeated until the centroids no longer move or move below a defined limit distance. This algorithm solves an optimisation problem, namely, the objective is to minimise the sum of quadratic distances from each object to the centroid of its group.
The objects
are represented as
d-dimensional real vectors
, and the K-means algorithm constructs K groups where the sum of distances to the objects, within each group
to their centroid
is minimised. Mathematically, this problem is formulated as follows [
22]:
where
is the number of elements in
and
stands for the Euclidean norm. The result is K groups with their corresponding centroid
. The solution of Equation (1) is found iteratively by modifiying the compositon of the groups
and the corresponding centroids
.
3.2. Data Background
The database used in the experiments is part of a three-year SCADA database of five wind turbines. The SCADA data of each wind turbine is collected via an open communications platform (OPC), following the IEC 61400-25 format, resulting in a structure determined as follows: (i) wind turbines are represented by logical devices; (ii) physical systems or subsystems are represented by nodes. Data are collected with a frequency of every 5 min, and only statistical values (minimum, maximum, mean, and standard deviation) are reported. The database contains 312 analogue variables from 78 different sensors. All events in the database are originally labelled with one of the following three numbers: “0” indicates normal operation, “1” indicates a warning status (in this case the turbine is running but should be checked as soon as possible), and “2” indicates an alarm status (in this case the turbine is stopped). Since the number of alarms is extremely low, in practise warnings and alarms are grouped together in one class, so that the labels (and classes) are reduced to two. In the experiments, only some of the variables will be used (as properly indicated in each test). The database was provided by Smartive (
http://smartive.eu accessed on 9 January 2023) and has been used in other publications [
15,
16,
17].
The data set is stored in a local database that has been recording SCADA values over the years. The data set is a structured table with the entries for each time interval in rows with as many columns as sensor readings. Failure events are recorded in a different table because they are recorded in a different format. An example of the data format generated is shown in
Table 2, where each of the variable names corresponds to:
wgdc_avg_TriGri_PwrAt: average active power in W.
wtrm_avg_Bbx_OilPres: average oil pressure in the gearbox in Pa.
wnac_avg_WSpd1: average wind speed in m/s.
Table 2.
Example of the set of data analysed. The three listed variables (in columns) are: (i) the average active power of the turbine, in W; (ii) the average oil pressure in the gearbox in Pa; and (iii) the average wind speed in m/s, respectively.
Table 2.
Example of the set of data analysed. The three listed variables (in columns) are: (i) the average active power of the turbine, in W; (ii) the average oil pressure in the gearbox in Pa; and (iii) the average wind speed in m/s, respectively.
| Date_Time | wgdc_avg_TriGri_PwrAt | wtrm_avg_Bbx_OilPres | wnac_avg_WSpd1 |
|---|
| 7 January 2016 12:00:00 | 1306.12 | 2.12 | 1295.83 |
| 7 January 2016 12:05:00 | 1487.13 | 1.76 | 1333.45 |
| 7 January 2016 12:10:00 | 1762.05 | 1.45 | 1198.54 |
| 7 January 2016 12:15:00 | 1521.42 | 1.89 | 1227.86 |
| 7 January 2016 12:20:00 | 1449.98 | 2.01 | 1192.21 |
3.3. Data Pre-Processing
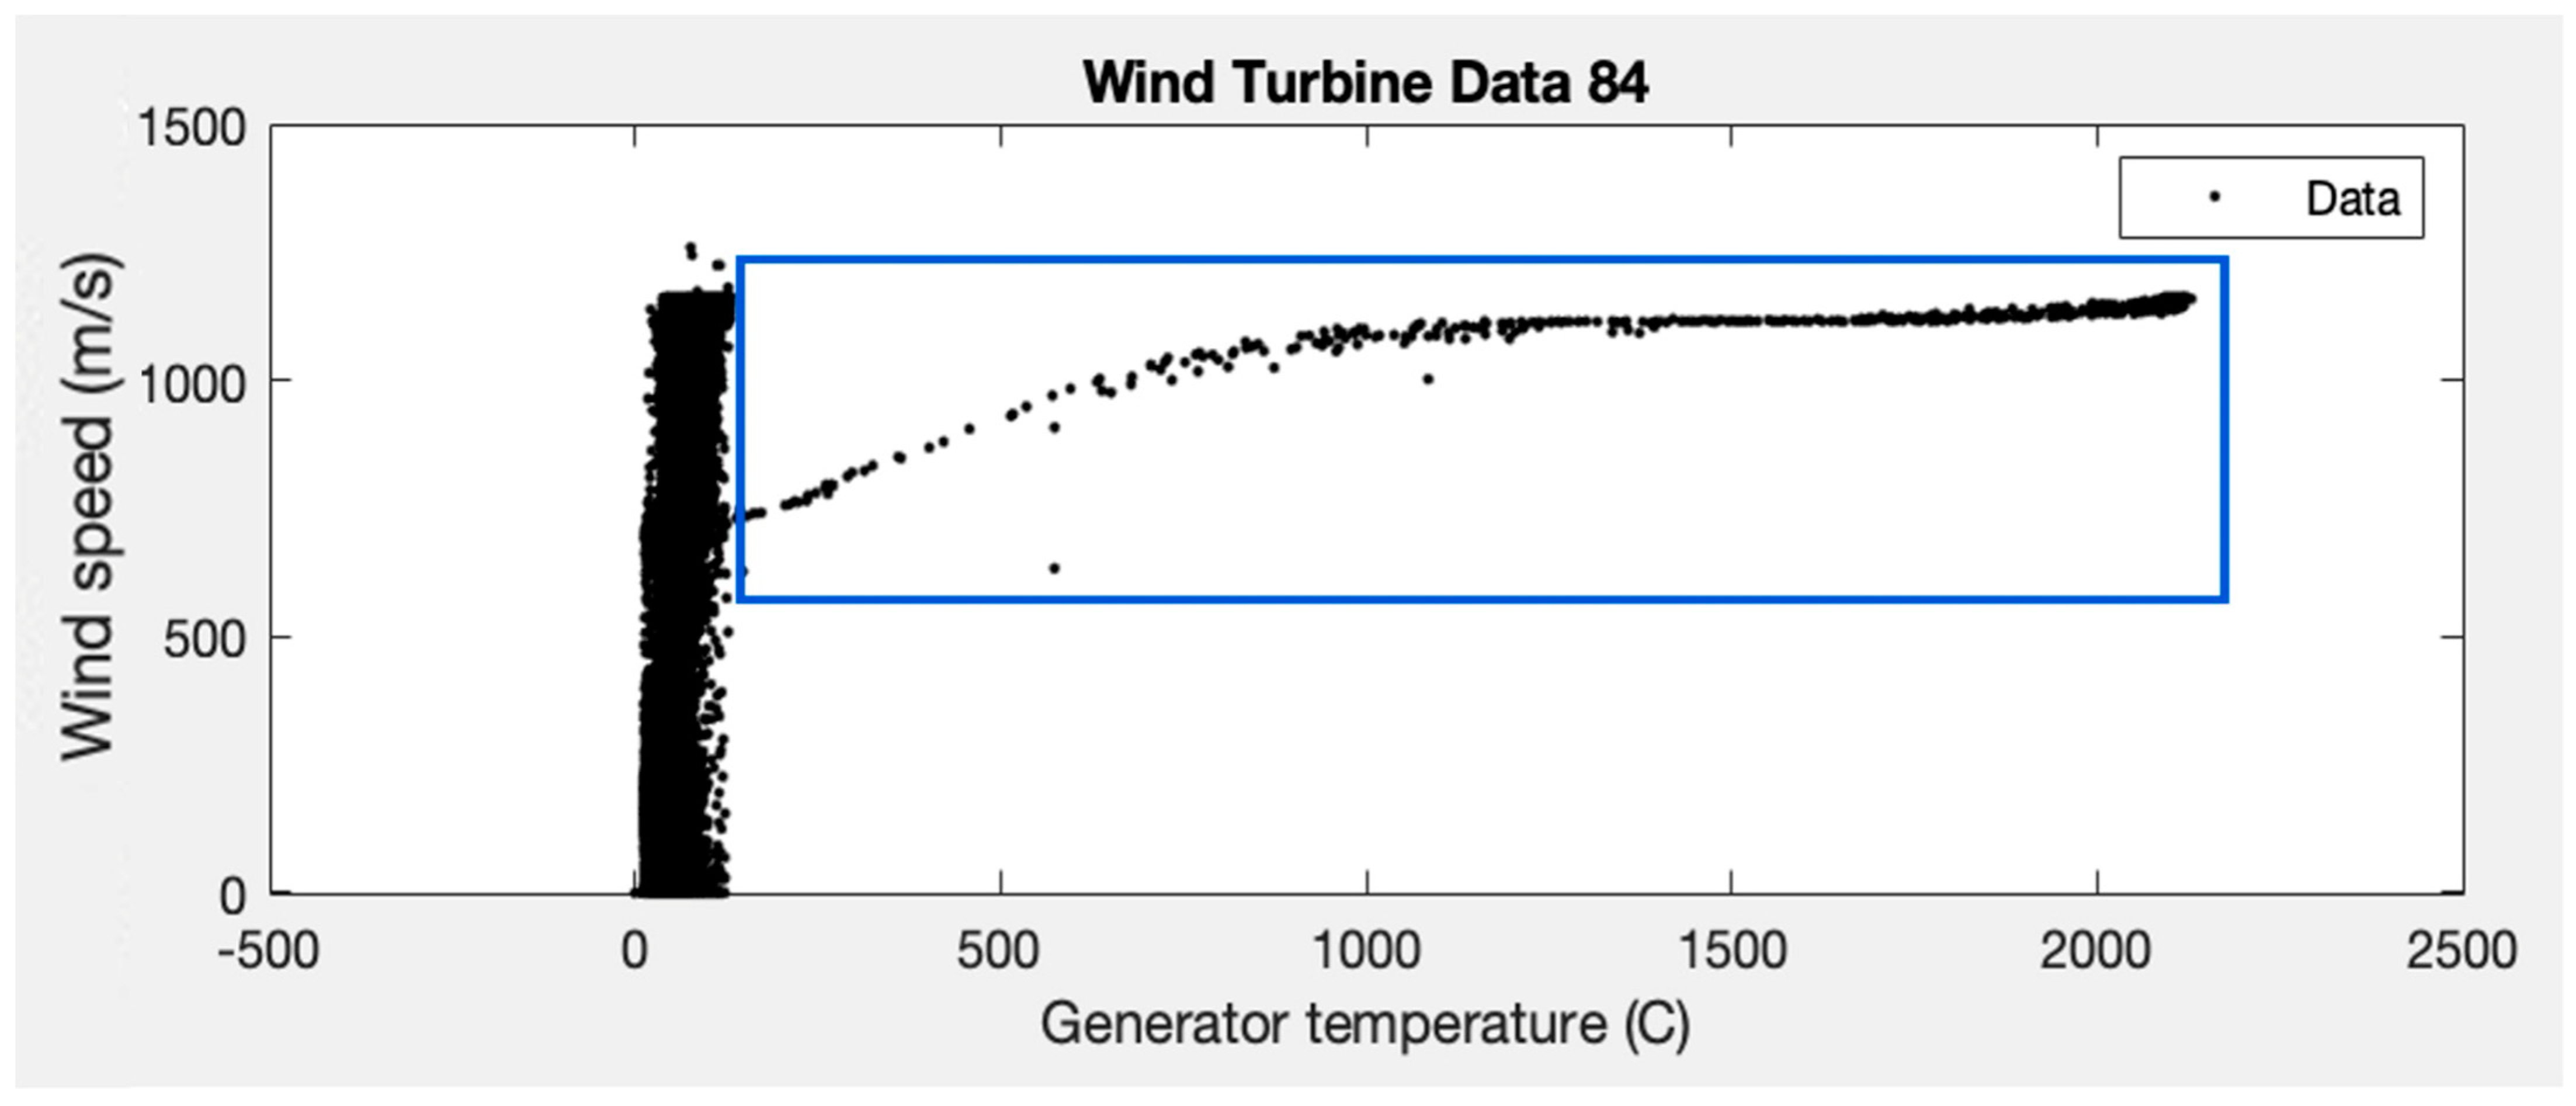
Originally, SCADA data were available for five wind turbines (80, 81, 82, 83, and 84), but it can be observed that wind turbine 84 shows erratic behaviour (see
Figure 2). The values of the wind speed and generator temperature variables of WT#84 are plotted below:
It can be seen that there are points that exceed 2000 °C of average temperature (inside the blue rectangle), values that are far from the expected ones (<100 °C), and only seen in this wind turbine (this behaviour has already been reported in [
16]). Given this circumstance, it was decided not to use the data from this wind turbine in order not to distort the results obtained with the data from the rest of the wind turbines.
4. Results
4.1. Test 1
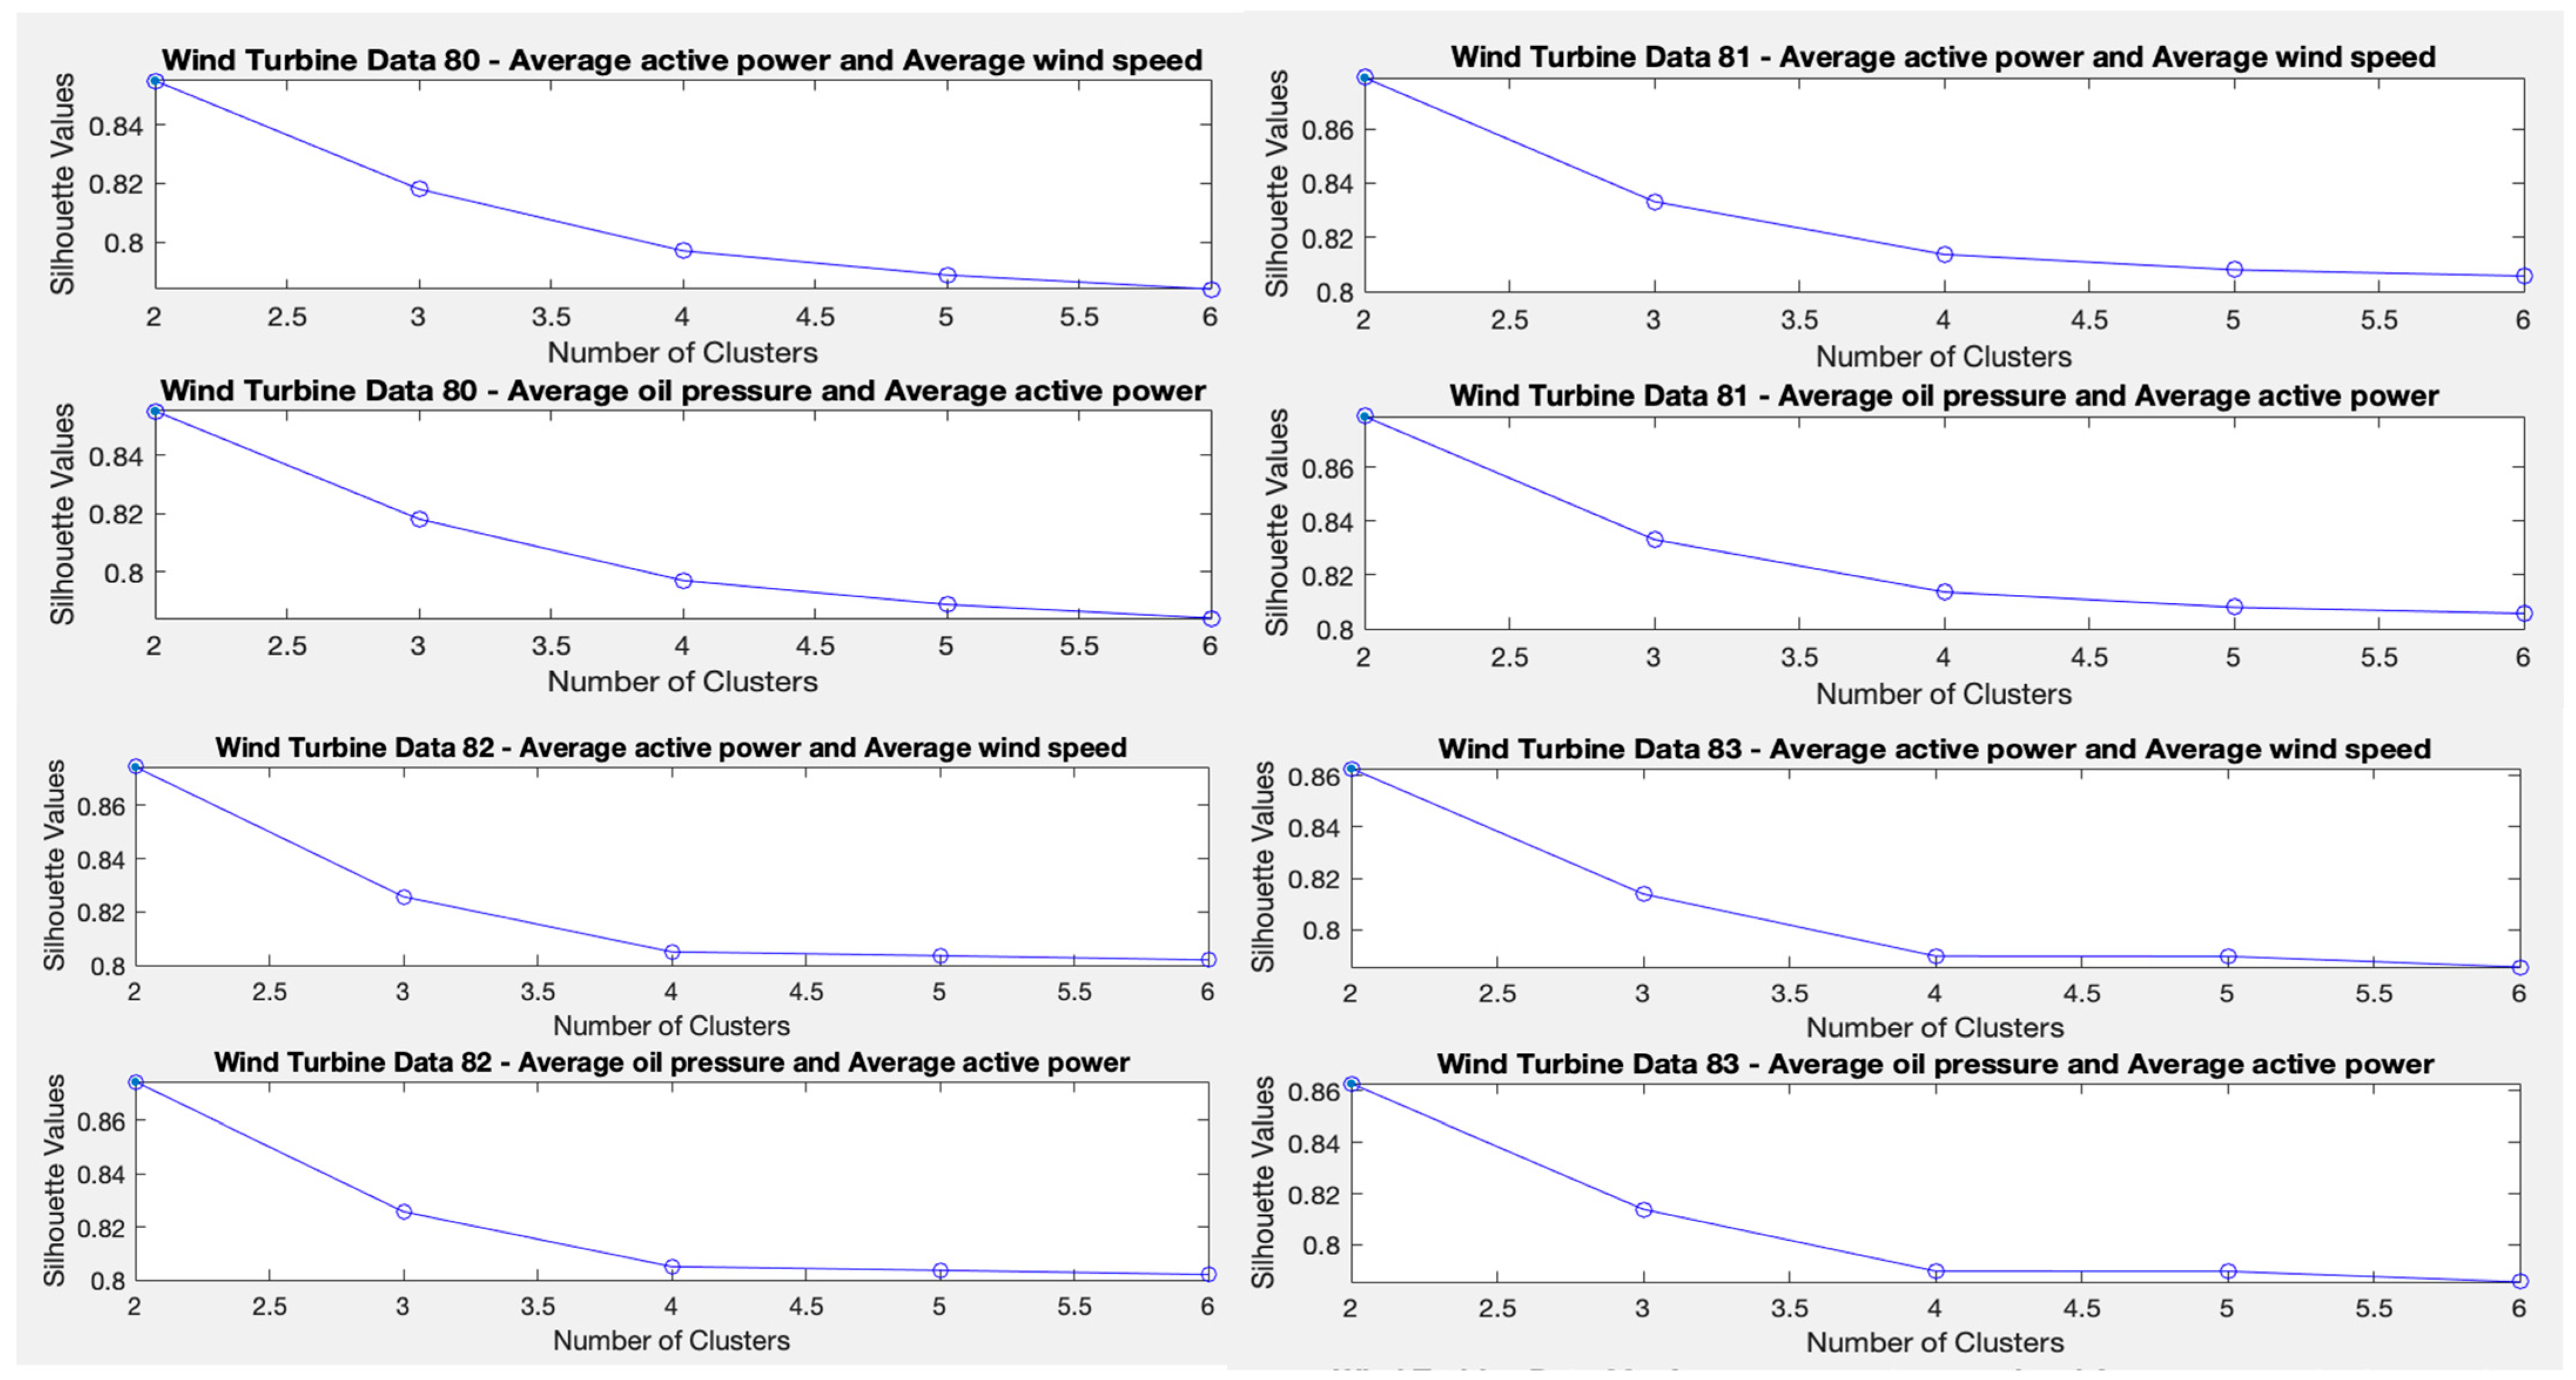
To determine the optimal number of clusters, the Matlab software tool “evalclusters” is used, which consists of creating a clustering criterion evaluation object. The K-means algorithm will be used as a function parameter (as we are investigating the use of the K-means algorithm) and also the “silhouette” criterion (as it is an unsupervised method like K-means). The higher the value of the result, the better the quality of each cluster. The silhouette criterion is an object consisting of the sample data (X), the clustering data (OptimalY), and the silhouette criterion values (CriterionValues) used to evaluate the optimal number of data clusters (OptimalK).
The silhouette value for each point (observation in X) is a measure of the similarity of that point to other points in the same cluster, compared to points in other clusters. If most of the points have a high silhouette value, then the clustering solution is adequate. If many points have a low or negative silhouette value, then the clustering solution may have too many or too few clusters.
This method is applied to the four wind turbines separately and to the following sets of variables: first to the variables average active power and average wind speed, and second to the variables average oil pressure and average active power. In this way, the ideal number of clusters is obtained for each test and for each wind turbine. The criterion is based on obtaining the highest silhouette value. A single cluster (
) is not considered because the objective is to identify at least two different states of the wind turbine: the normal state/fault state. The results indicate that the ideal number of clusters is two, as shown in
Figure 3.
4.2. Test 2
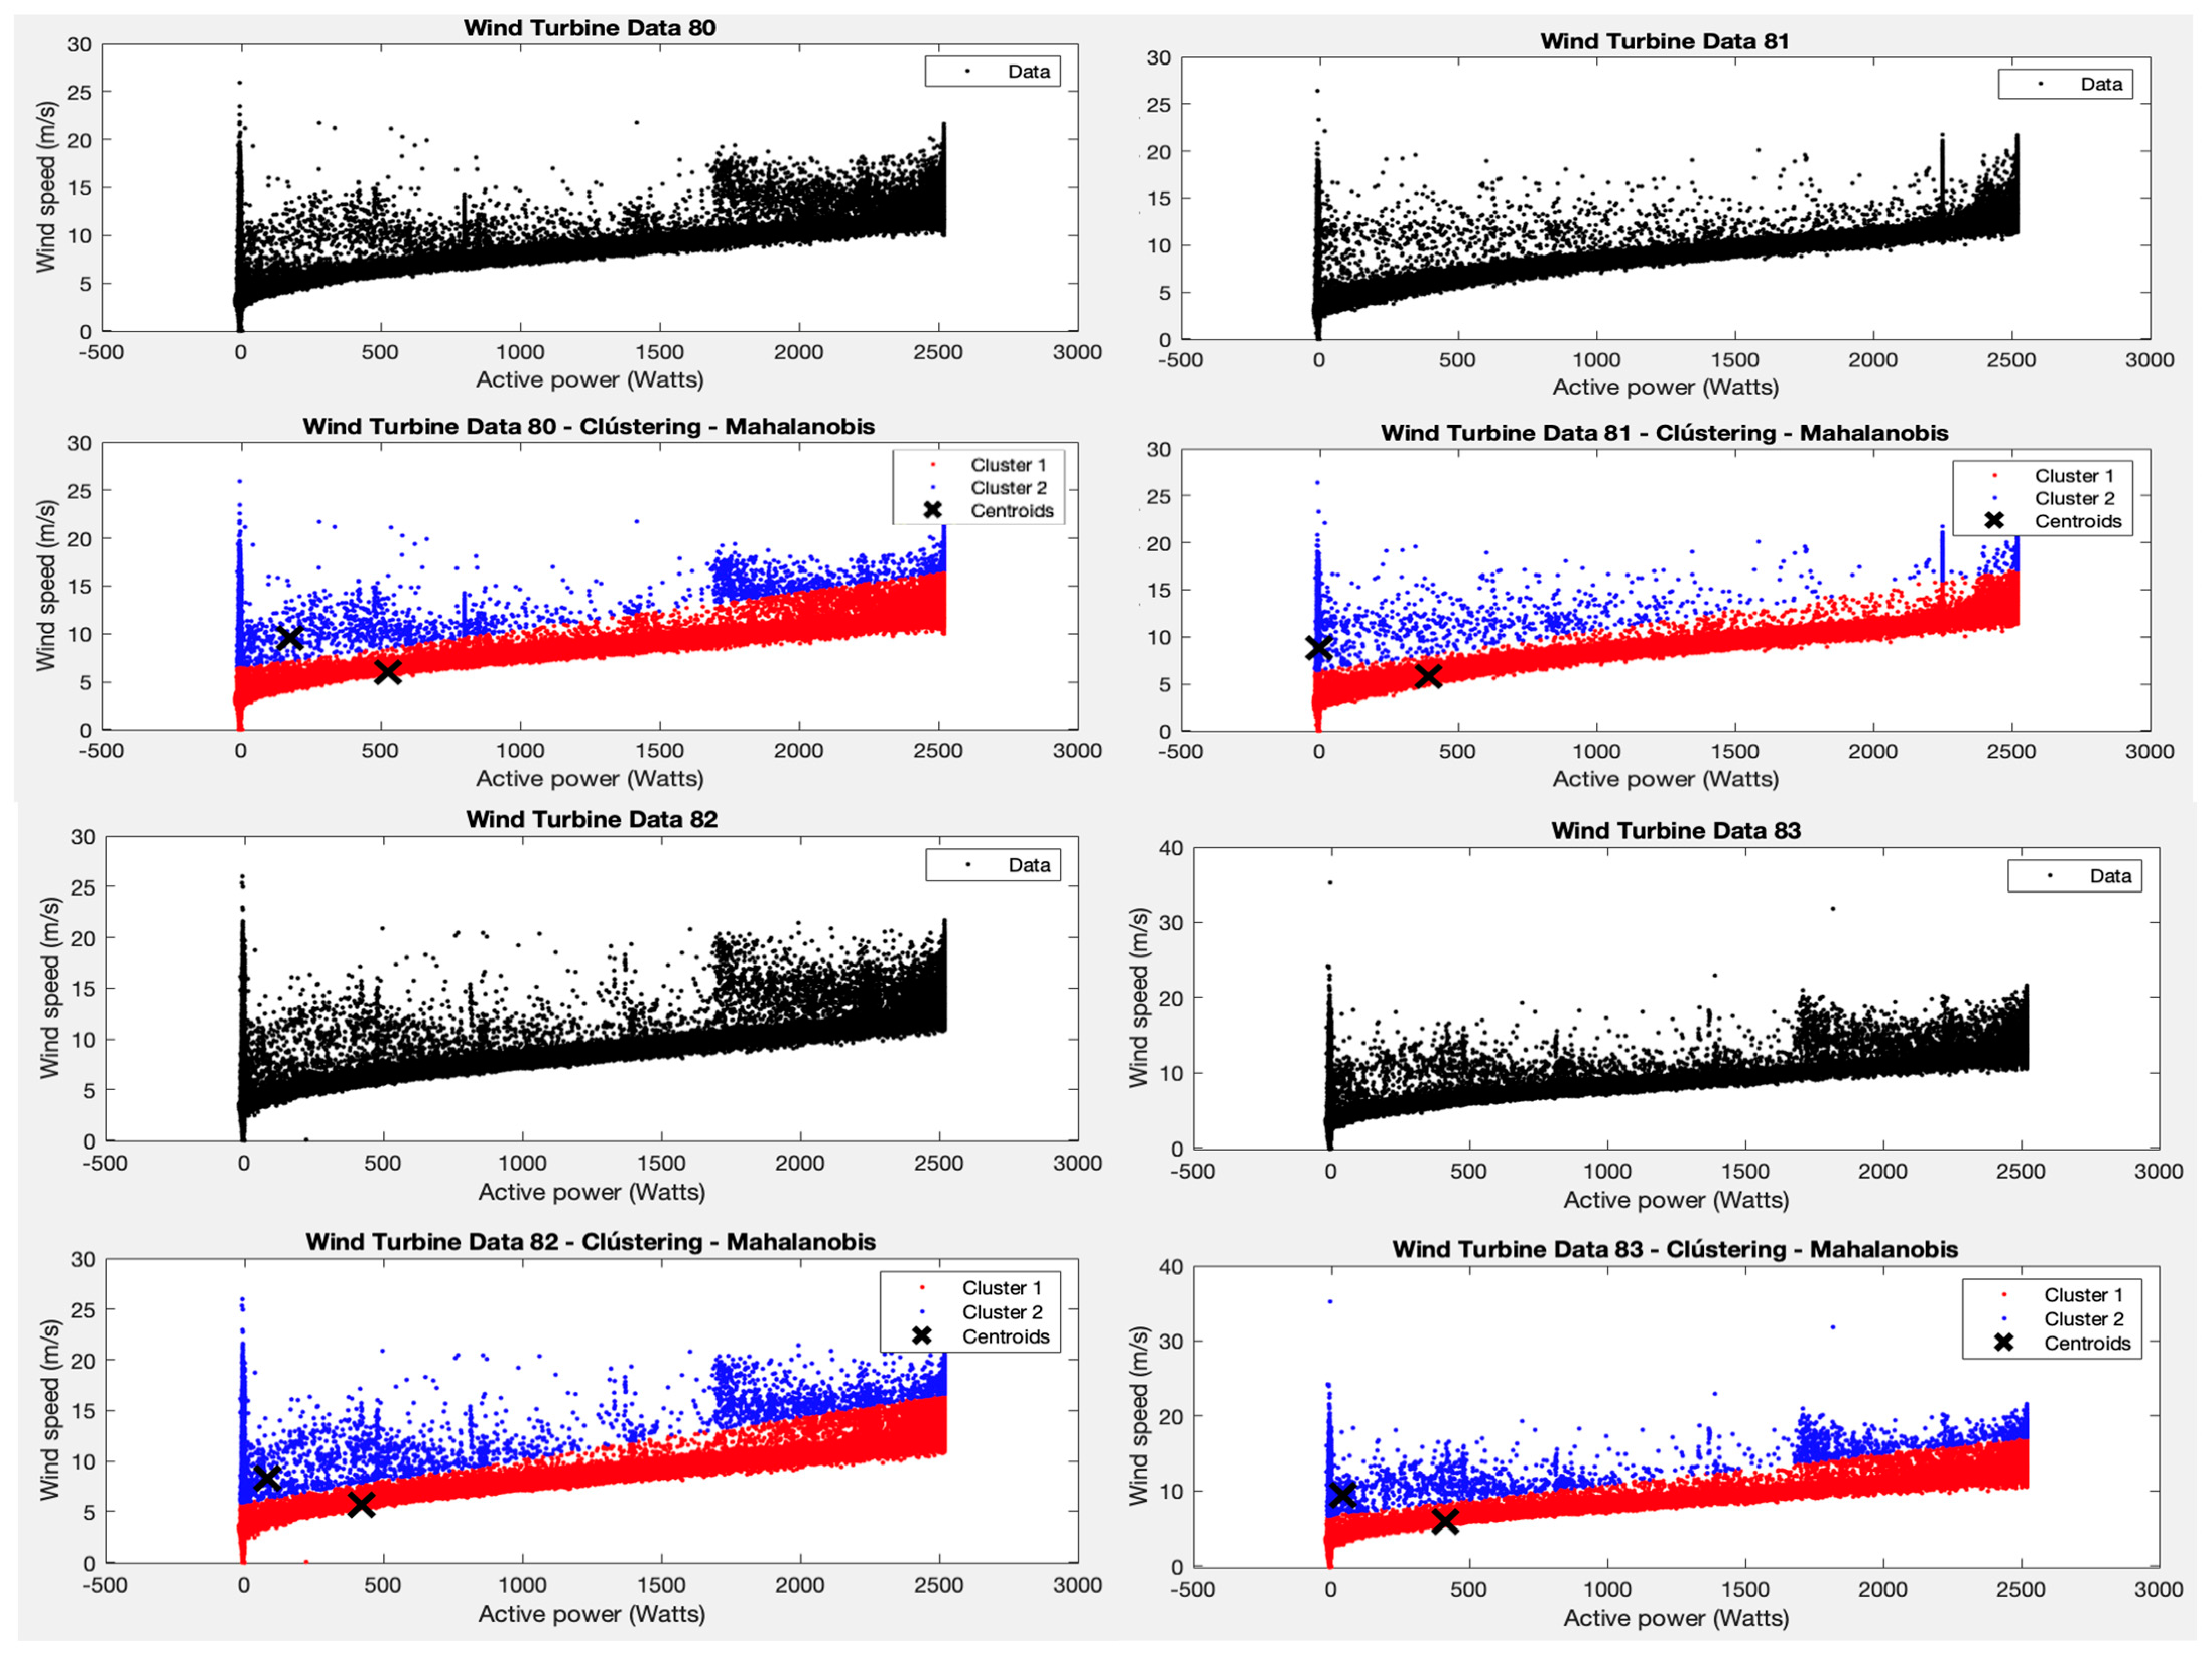
Following the results of test 1, two clusters are forced, but now the Mahalanobis distance is applied as an argument to the K-means algorithm function. Two clear clusters are obtained, as shown in
Figure 4, one for the area where most of the points are grouped (with average powers between 0–2500 W and average wind speeds between 1–15 m/s) and one for the rest of the points.
However, it cannot be asserted that points outside these ranges represent wind turbine failure values, as with only two clusters and the parameters applied to the algorithm, the filtering is too strict. The variability in the points (wind speed—active power pairs) is high and can be due to many reasons. Here, the specialists have to analyse the most divergent points in order to determine whether the wind turbines worked correctly or not in these cases.
From the results of cluster 1 for all wind turbines, it can be seen that the centroid is found at an average power of about 500 W and an average wind speed of about 6 m/s. The points in this cluster follow a trend as one would expect, where more wind speed means more active power generated, with no unusual discontinuities as observed in cluster 2.
4.3. Test 3
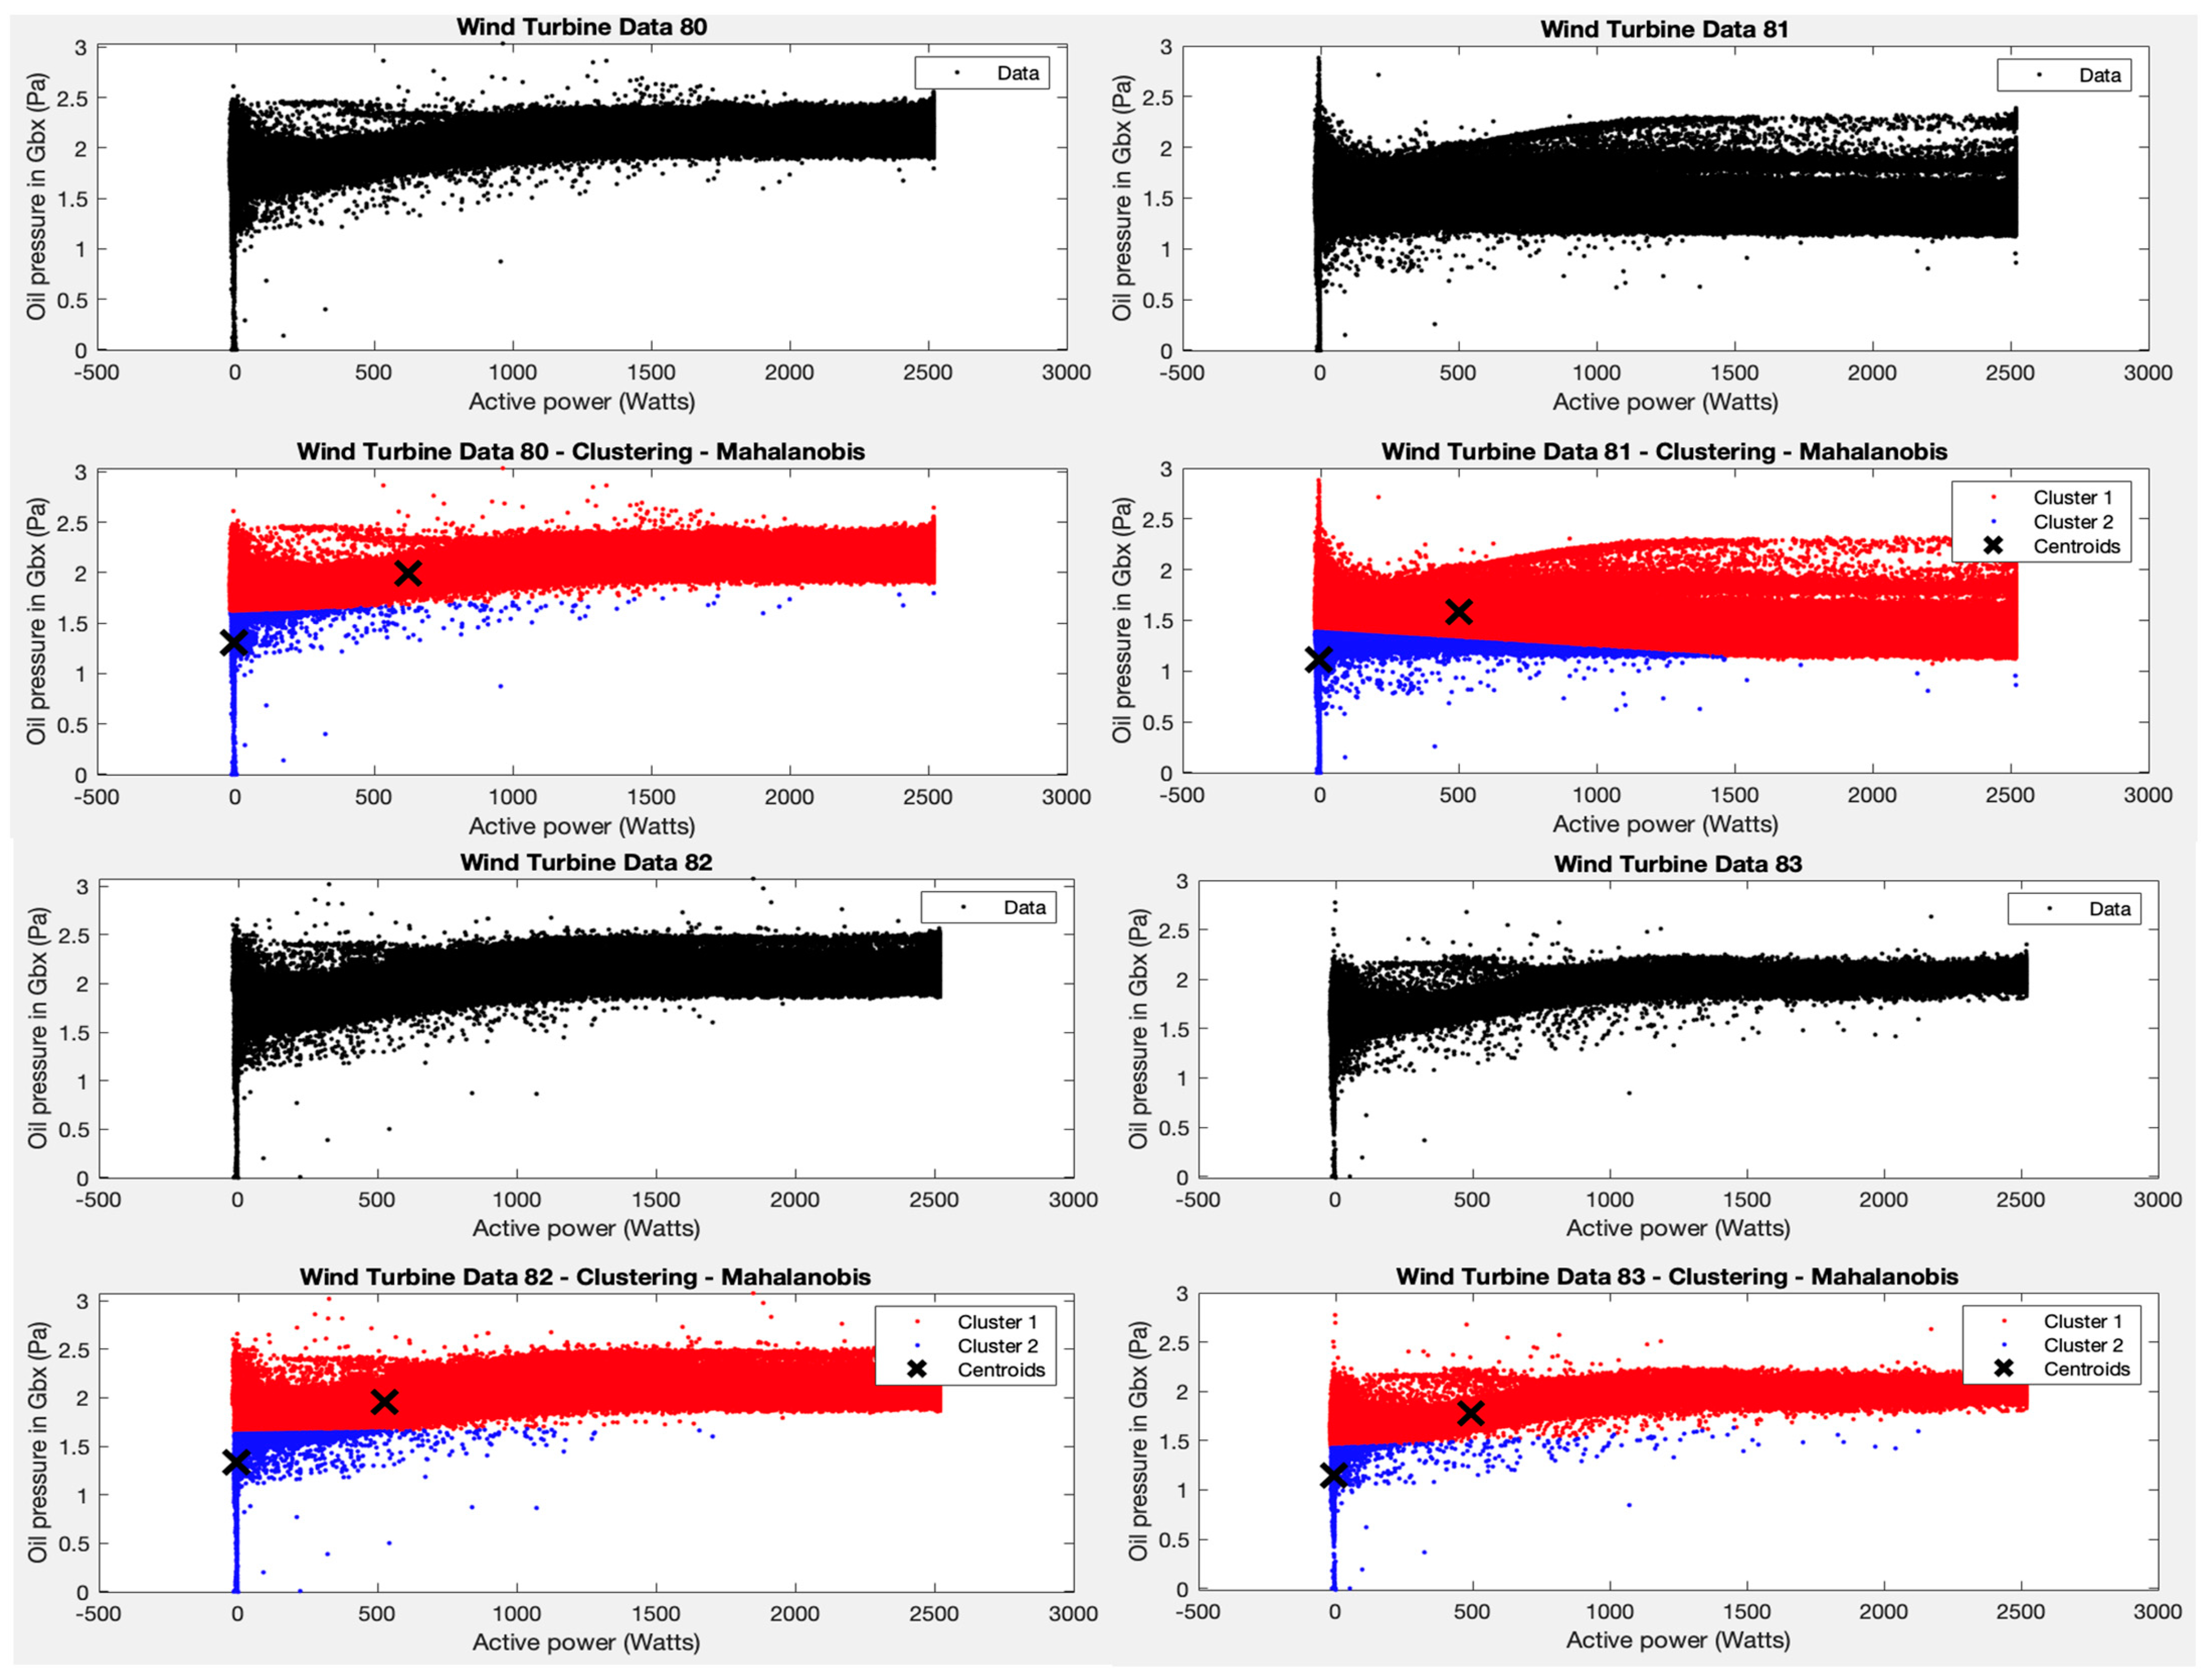
Test 3 is then considered, and the K-means algorithm is applied to the variables average oil pressure and average active power, and a coherent result is also obtained, i.e., the two clusters identified by the algorithm split the data into one group containing the points with an average oil pressure above 1.5 Pa (with average power between 0–2500 W) and the rest of the points (See
Figure 5).
As in the previous case, however, it is not possible to claim that points outside these ranges represent wind turbine failure values. Deep analysis made by specialists should be used to decide on the specific, more divergent points.
4.4. Test 4
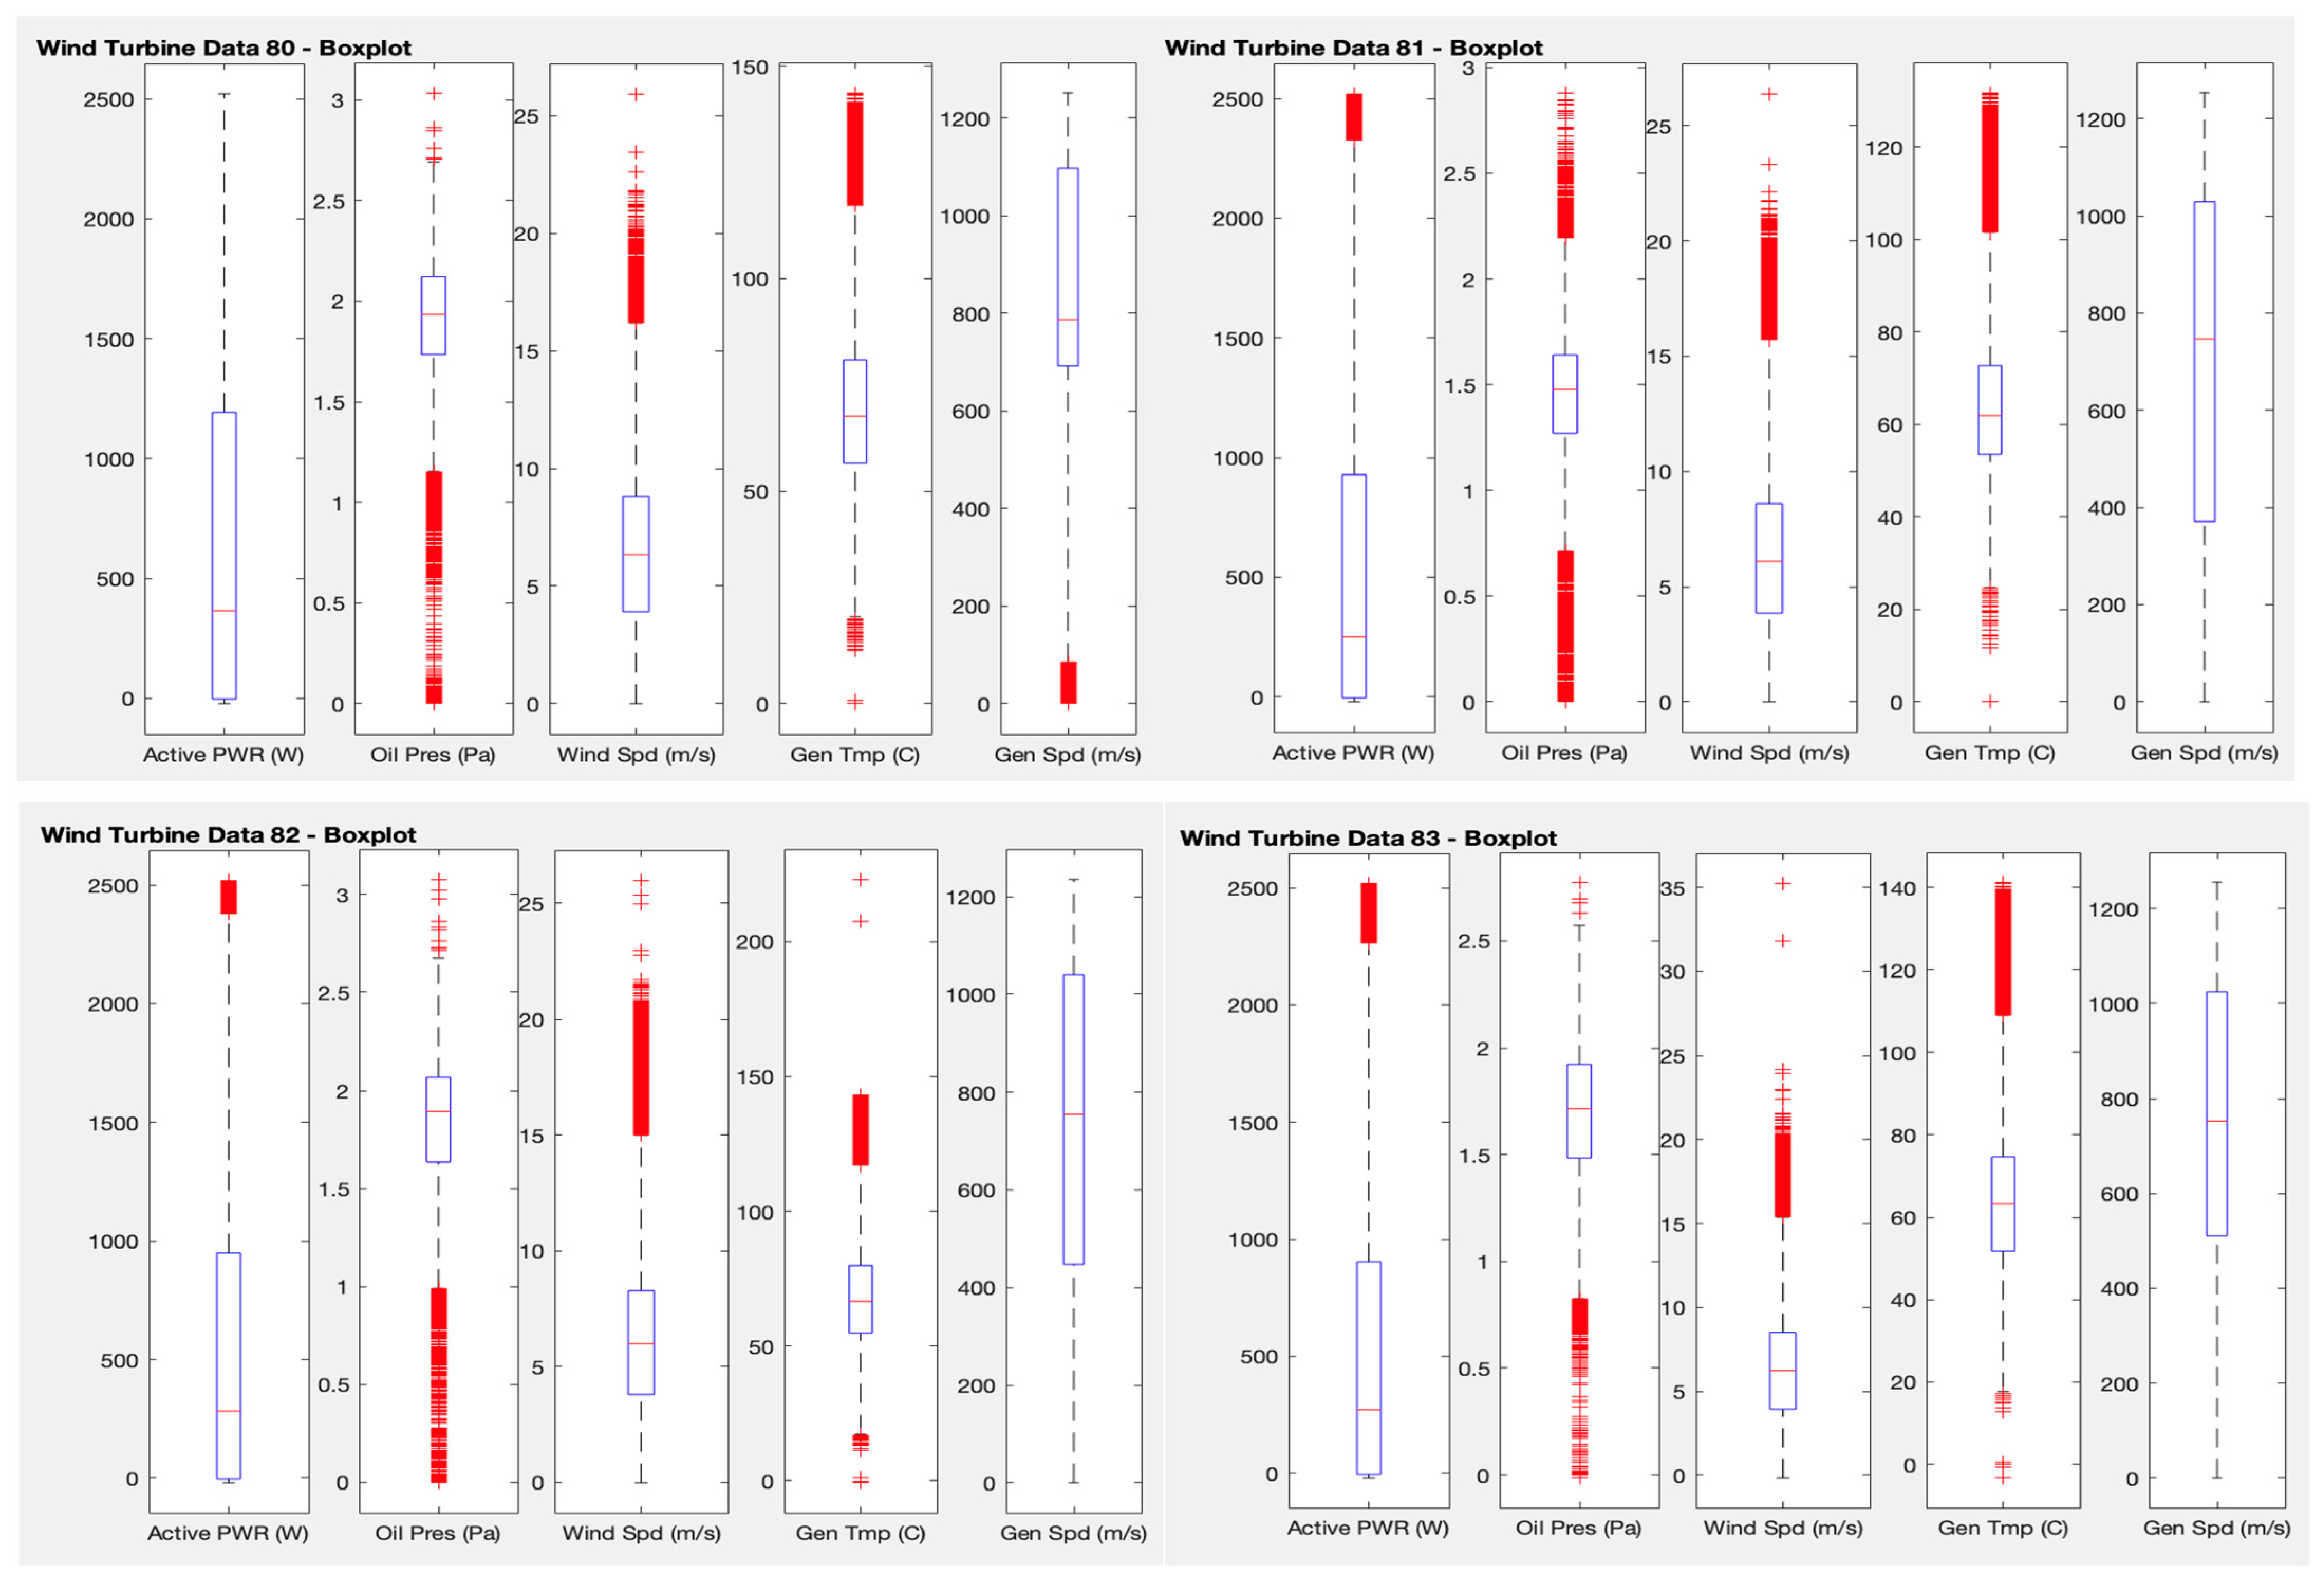
Following the investigation of possible outliers, another analysis is introduced in this test. A boxplot of the variables used in the previous tests is plotted, using the SCADA data of the four wind turbines separately, to see mean values, quartiles, maxima and minima, and, above all, outliers. The interest here is to visualise the points that have a very different behaviour from the rest of the points.
The Matlab software tool is used, which has the function boxplots(x), where x corresponds to the selected SCADA data matrix, in this case average active power, average oil pressure, average wind speed, average generator temperature, and average generator speed. This function returns a box with the average, 25th and 75th quartiles, maximum and minimum, and outliers. Boxplot draws points as outliers if they are greater than q3 + w × (q3 − q1) or less than q1 − w × (q3 − q1), where q1 and q3 are the 25th and 75th percentiles of the sample data, respectively. The default value for w corresponds to approximately ±2.7σ, a 99.3 percent coverage if the data are normally distributed.
Figure 6 shows that, for all the wind turbines, most of the points (between quartiles 25 and 75) are between 0 and 1200 W of average power, 1.25 and 2.2 Pa of average oil pressure, 4 and 8 m/s of average wind speed, 50 and 80 degrees Celsius of average generator temperature, and 400 and 1100 m/s of average generator speed. From these values, the outliers of each variable are observed (in red).
Performing a more specific analysis of the outliers for each of the variables and comparing between wind turbines, it can be seen that for the average power variable, values above 1800 W are considered outliers. For the average oil pressure, values lower than 1 and higher than 2.2 are considered outliers. For the average wind velocity, velocities above 15 m/s are outliers. For the average temperature of the generator, values below 30 and above 110 degrees Celsius are considered outliers. Finally, with regard to the average generator speed, values below 100 m/s, which only occur for wind turbine 80, are considered outliers. The information provided by this type of exploration could be used by a specialist to check if, for example, the WT80 has a problem at specific points where the generator speed is too low.
4.5. Test 5
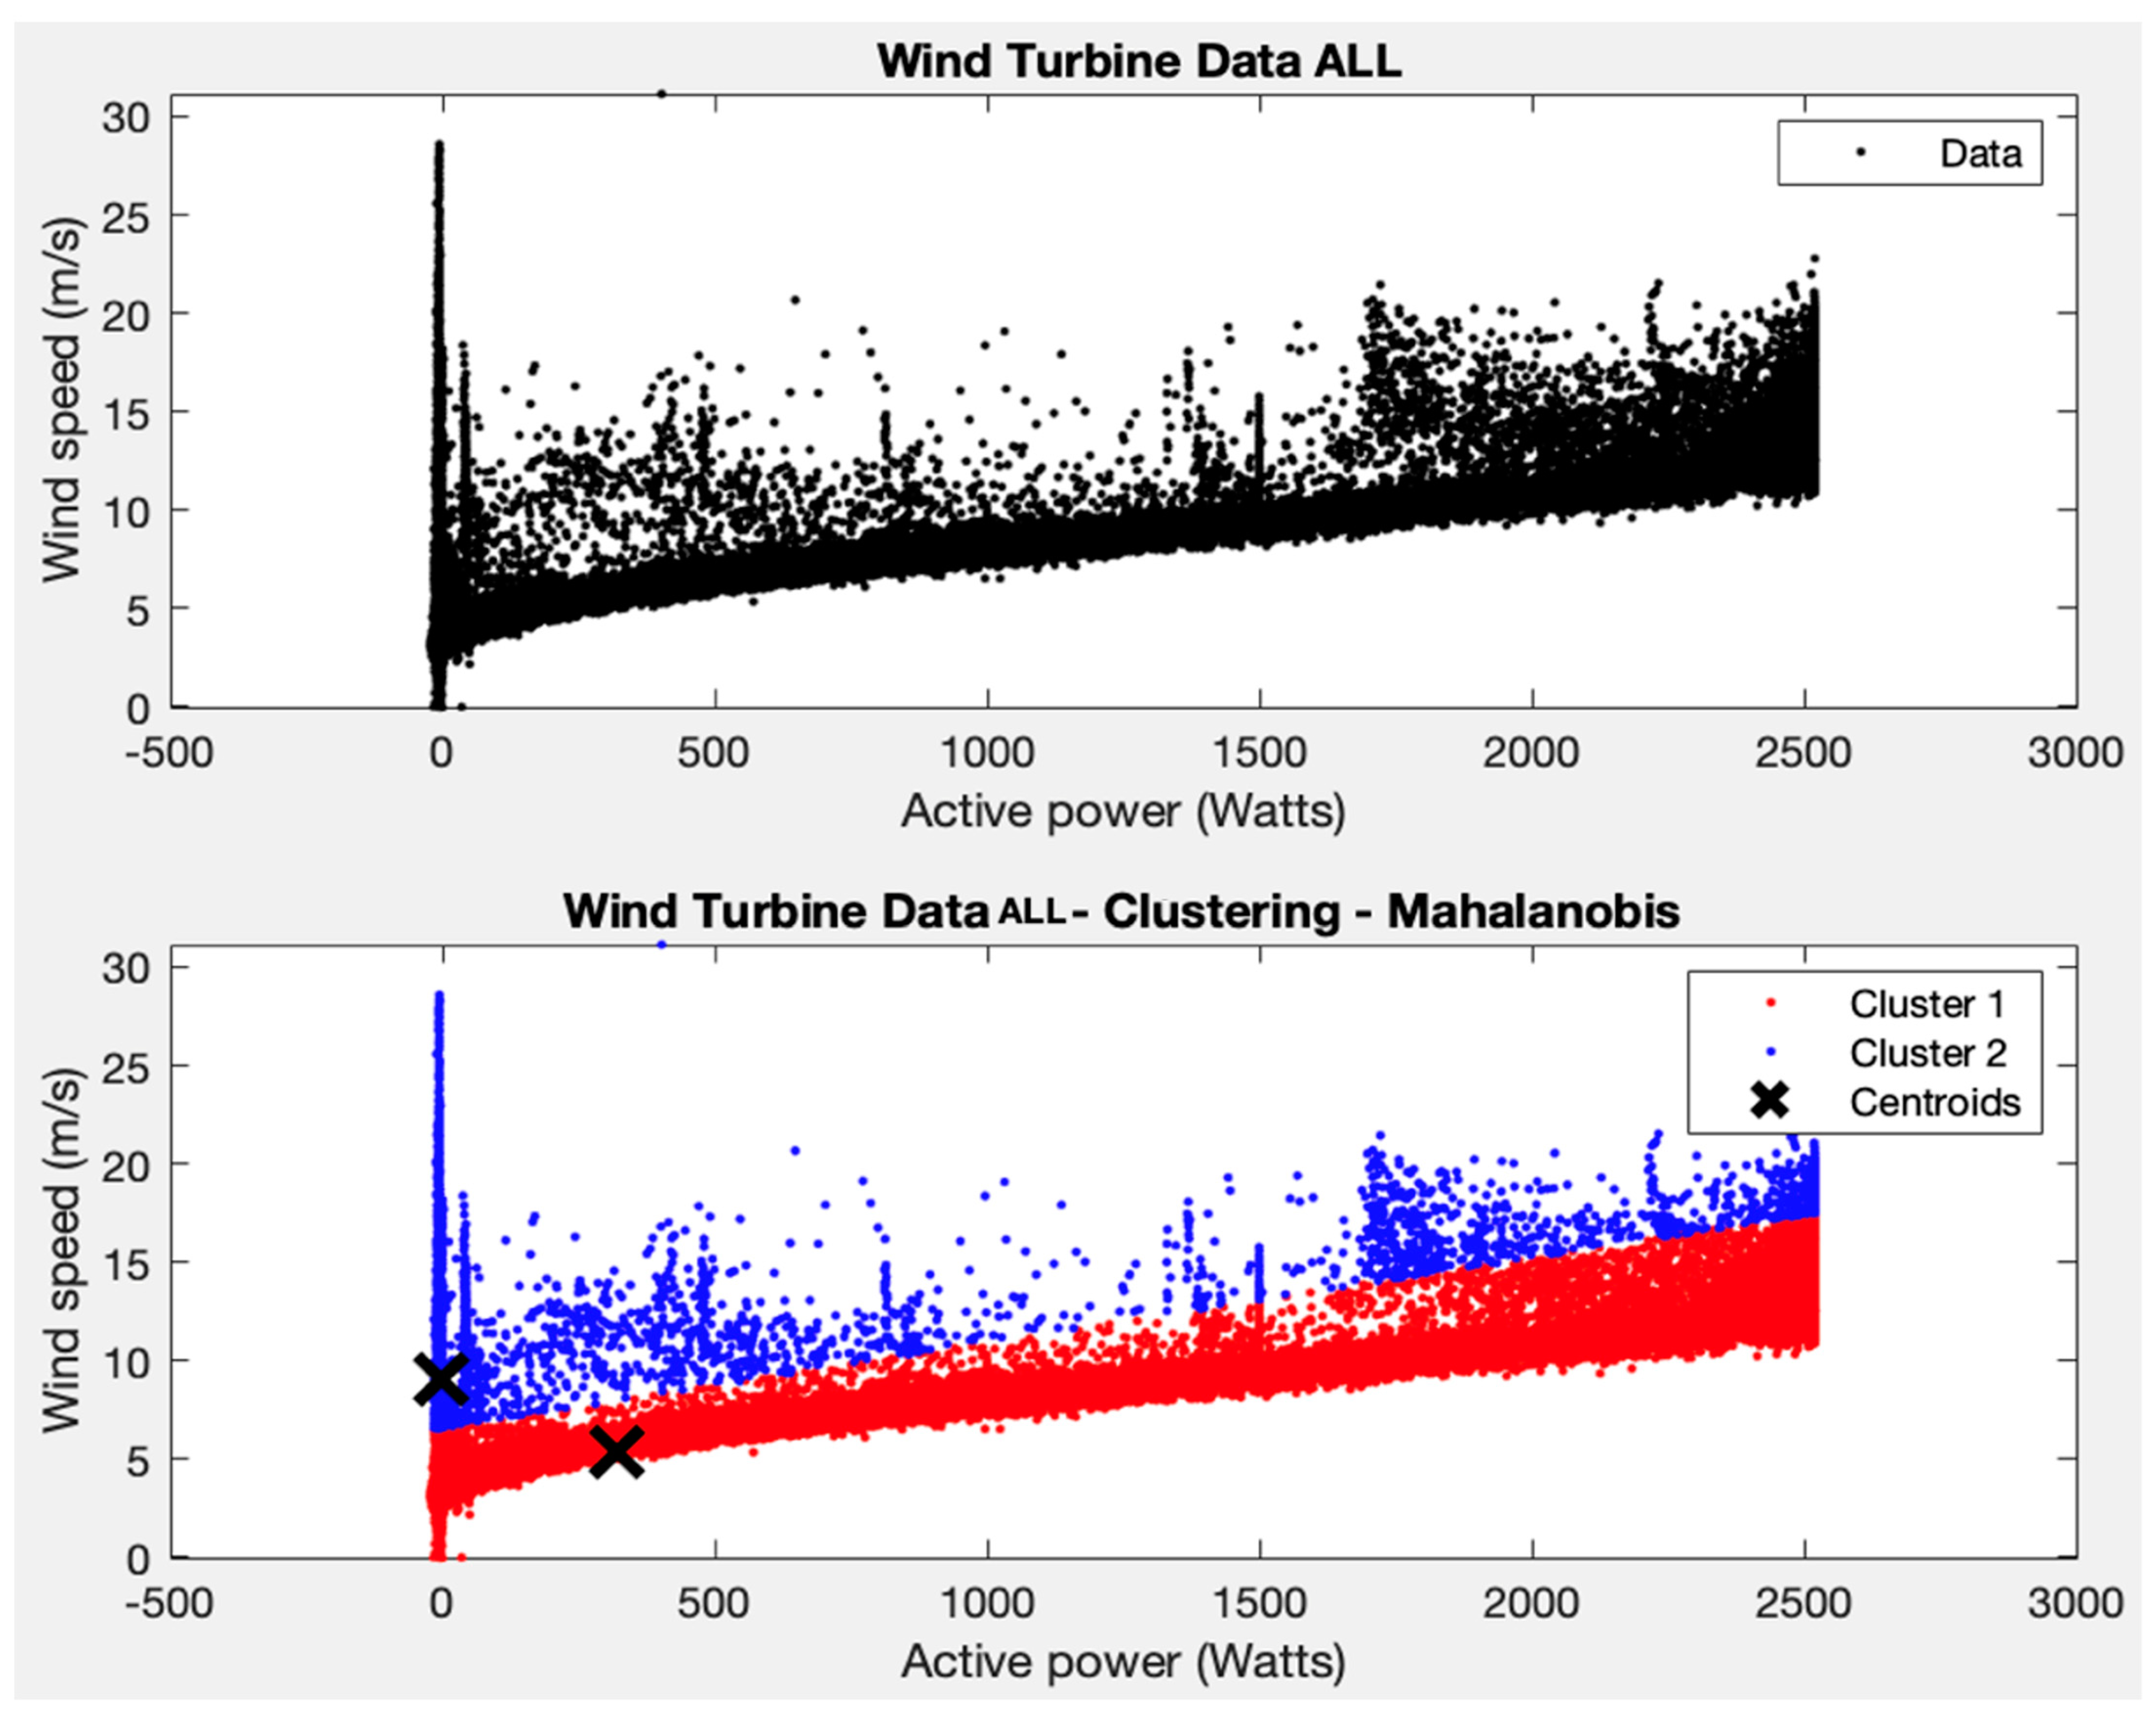
This test consists of repeating test 2 not for each individual WT but for the aggregated data of all the WTs of the windfarm, in order to have a global view of the behaviour of the whole wind farm, and to analyse possible clusters in the variables average active power and average wind speed. The main objective here is to check for the consistency of the WTs in the wind farm, which could allow the use of neighbouring wind turbines to detect abnormal behaviour in a particular WT, as proposed in [
17].
Two clusters are imposed and the K-means algorithm is applied, obtaining a coherent result for the variables average active power and average wind speed (see
Figure 7). Two groups are obtained, one for the area where most of the points are grouped (with average powers between 0–2500 W and average wind speeds between 1–15 m/s) and the other for the rest of the points.
However, it cannot be asserted that points outside these ranges represent wind turbine failure values, as with only two clusters and the parameters applied to the algorithm, the filtering is too strict and errors could occur, making the maintenance of the wind turbine inefficient.
If the centroid of cluster 1 is considered for the individual wind turbines, they have an average power of around 500 W and an average wind speed of around 6 m/s. The behaviour is very similar to what happened in test 2 for the separate wind turbines. This indicates that all turbines have similar behaviours and therefore it is very unlikely that there are points with unusual behaviour.
4.6. Test 6
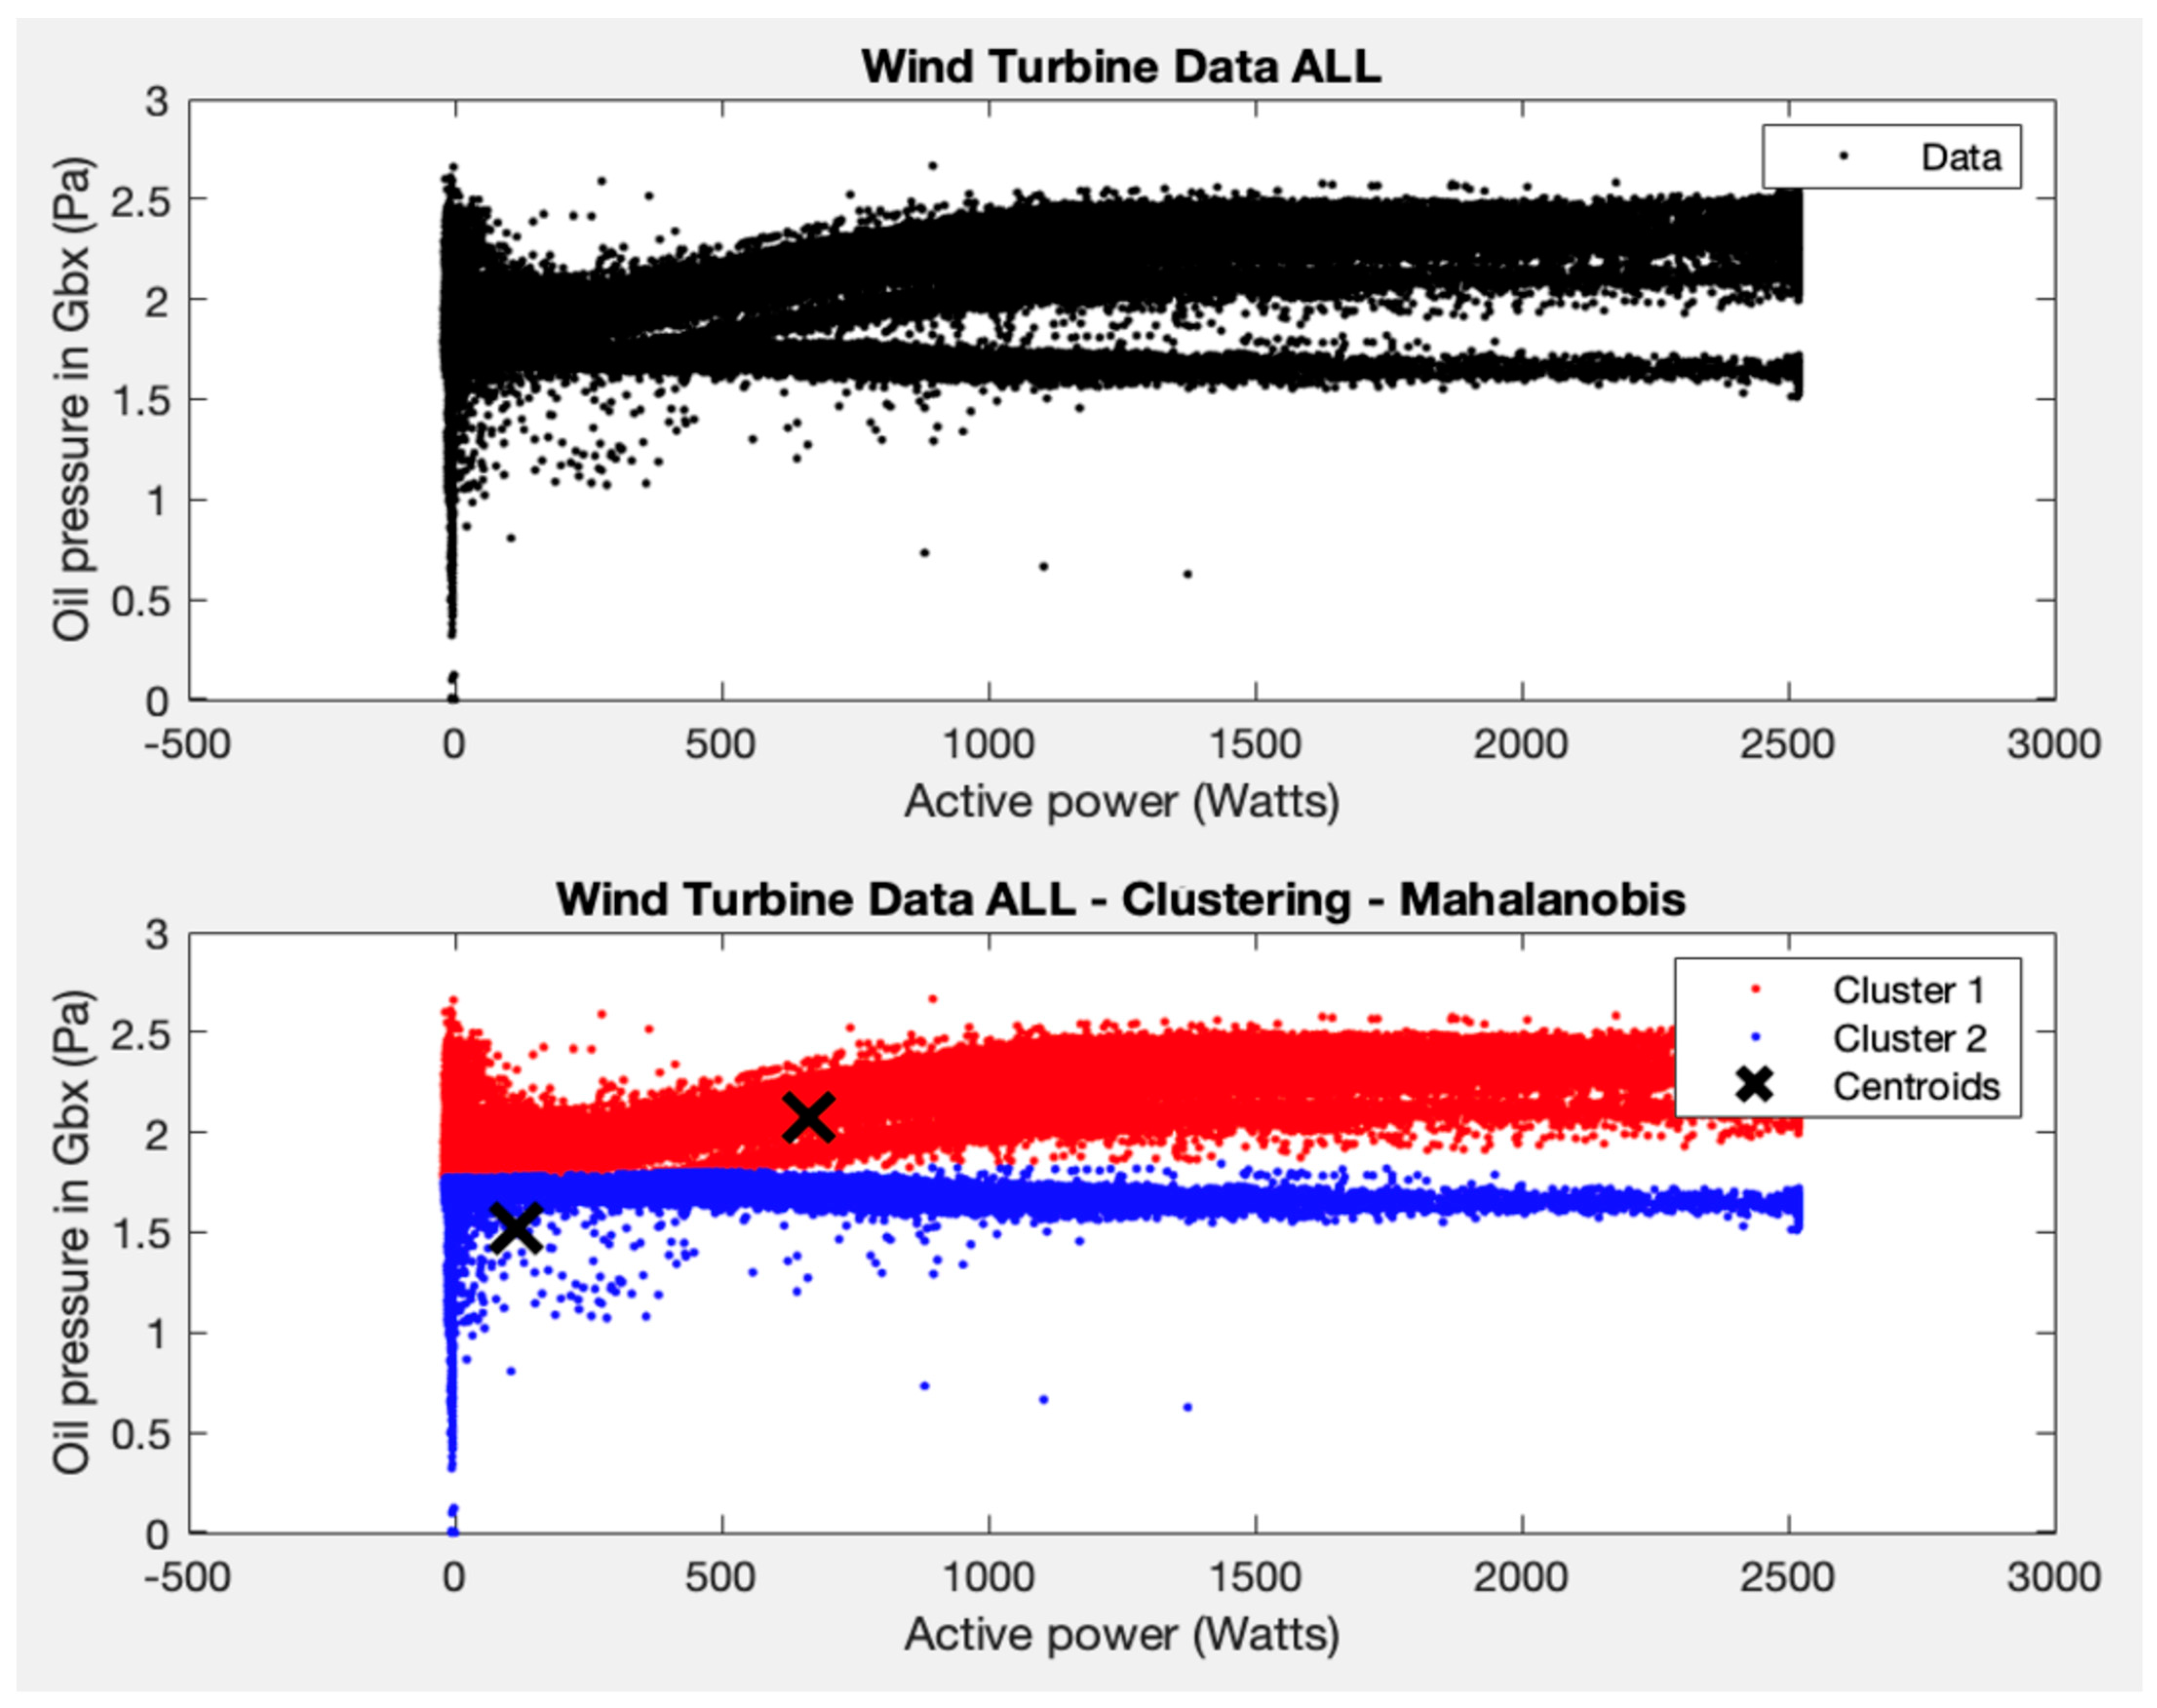
This test consists of repeating test 3 to have a global vision of the behaviour of the entire wind farm and to analyse possible clusters in the variables average oil pressure and average active power. As in the previous test, the interest is in checking the WTs of the wind farm as a whole.
Two clusters are formed, and the K-means algorithm is applied. A coherent result is also obtained (see
Figure 8), one for the area where most of the points are grouped (with average power between 0–2500 W and average oil pressure between 1.5–2.5 Pa), and another for the rest of the points.
Looking at the centroid of the cluster that groups these ranges of values in the different wind turbines, the average power is around 500 W and the average oil pressure is 2 Pa. The results obtained are very similar to the results obtained in test 3, with the particularity that the two horizontal arms that appear in different clusters are due to the points of wind turbine 81, which are more dispersed in terms of oil pressure than the rest of the wind turbines. It is important to detect this type of behaviour, as it allows specialists to check whether a problem is occurring in the WT.
5. Discussion
Once the results obtained from each of the tests have been presented, it is time to interpret and analyse them in detail. Six different tests are presented to evaluate the behaviour of the K-means algorithm on a set of wind turbine SCADA data. Initially, SCADA data is available for five wind turbines, but one of them, wind turbine 84, shows erratic behaviour and is discarded in order not to distort the results obtained from the SCADA data of the rest of the healthy wind turbines.
In tests 1, 2, 3, and 4, each wind turbine is analysed separately, while in tests 5 and 6, tests 2 and 3 are repeated, but now the data from the four healthy turbines are analysed together to get a complete insight into the wind farm.
Test 1 aims to determine the optimal number of clusters, and for this purpose, the function “evalclusters”, included in the Matlab software, is used. The K-means algorithm and the silhouette criterion are used as parameters of this function. The higher the value of the “silhouette”, the better the quality of each cluster. The ideal number of clusters, according to this assessment method, is two.
In test 2, and following the results obtained in test 1, the K-means algorithm is applied using the Mahalanobis distance to the variables average wind speed and average active power. It is observed that, given the distribution of the points, presenting two different groupings allows for a reading in which the majority of points are grouped with average powers between 0–2500 W and average wind speeds between 1–15 m/s. The second cluster corresponds to the rest of the points that do not fall within these ranges of values for the variables chosen for this test. Although it cannot be affirmed that the points of this second cluster represent failure values of the wind turbine, it’s interesting to note that points very far away from the centroids could indicate some possible strange behaviour that the specialists would later investigate. This is one of the interesting results that brings new information to the managers of the wnd park.
It can be observed that the centroid of the majority group 1 in the different wind turbines is found at average powers around 500 W and with an average wind speed around 6 m/s. This helps identify the normal behaviour of the WTs and provides a reference for what should be expected.
Next, test 3 is considered, and the K-means algorithm is applied to the variables average oil pressure and average active power. Two groups are observed, one for the area where most of the points are grouped, with average power between 0–2500 W and average oil pressure between 1. 5–2.5 Pa, and a second minority group for the rest of the points. If we observe the centroid of the cluster that groups these ranges of values in the different wind turbines, this is found in average powers around 500 W and an average oil pressure of 2 Pa. In that case, some points in cluster 2 could indicate possible problems, specifically those that are far away from the centroid. Again, a specialist can check what happens at these specific points to better understand the behaviour of the WTs.
Test 4 proposes to obtain a boxplot of the variables used in the previous tests to see mean values, quartiles, maxima and minima, and, above all, outliers. Observing the results obtained, it can be seen that in the four wind turbines, most of the points, i.e., those between quartiles 25 and 75, are between 0 and 1200 W of average power, 1.25 and 2.2 Pa of average oil pressure, 4 and 8 m/s of average wind speed, 50 and 80 degrees centigrade of average temperature of the generator, 400 and 1100 m/s of average speed of the generator. If we analyse the outliers for each of the variables and compare between wind turbines, we can see that for the average power variable, values above 1800 W are considered outliers. Regarding the average oil pressure, values below 1 and above 2.2 are considered outliers. Regarding the average wind velocity, velocities above 15 m/s are outliers. Regarding the average temperature of the generator, it is considered that readings below 30 and above 110 degrees Celsius are outliers. Finally, with respect to the average speed of the generator, values below 100 m/s, which are only present in wind turbine 80, are considered outliers. These results can provide a set of rules for the managers of the wind farm to set up internal warnings in the system and generate work orders if required.
As indicated at the beginning of this section, up to test 4, the SCADA data of the wind turbines are analysed separately, while in tests 5 and 6 the SCADA data of the wind turbines were analysed together to obtain an overall view of the park. In test 5, and following the results obtained in test 1, the K-means algorithm is applied, forcing two clusters, and a coherent result is obtained for the variables average active power and average wind speed. Specifically, two clusters are obtained and two groups are observed: one for the area where the majority of the points with average powers between 0–2500 W and average wind speeds between 1–15 m/s are grouped, and a second minority group for the rest of the points. As was the case in test 2, it is not possible to state that the points outside these ranges represent values of wind turbine failure since we are probably applying an excessively strict model. All WTs have similar behaviour, and, again, some points in group 2 could be indicative of a malfunction, which should be investigated and confirmed by a specialist.
In test 6, and following the results obtained in test 1, test 3 is repeated, but with data from all the wind turbines. The K-means algorithm is applied, forcing two groups, and a coherent result is obtained for the variables average oil pressure and average active power. Specifically, a majority group is obtained with average powers between 0–2500 W and average oil pressure between 1.5–2.5 Pa, and a second minority group is formed for the remaining points. It can be seen that the centroid of the majority group that groups these ranges of values in the different wind turbines is found at an average power of around 500 W and an average oil pressure of 2 Pa. Grouping all the WTs of the park together allows us to detect the two horizontal arms that appear in different groups, which are due to the points of WT81. This different behaviour could be explained by the deterioration of some components or by a sensor problem, for example. Its identification is of great interest, as a work order could now be deployed and the WT could be checked. Avoiding major damage and turbine downtime helps contain maintenance costs, which makes green energy more competitive.
6. Conclusions
Working with alarms and warnings in the SCADA data environment of wind turbines poses a number of challenges, including managing their frequency of occurrence. The SCADA system records hundreds of alarms and warnings from all systems simultaneously. Analysis of these events reveals that they are widely dispersed throughout the SCADA runtime and that it is very difficult to link them to specific hardware failures. Therefore, it is preferable to use an unsupervised methodology, as it is often unreliable to enter information on data labels to classify the data.
The main objective of this work has been to investigate whether and how clustering algorithms can be useful to detect possible strange behaviours of wind turbines. The K-means algorithm and the boxplots of the analysed variables have been used to determine outliers or to identify these strange behaviours of the wind turbines that allow us to carry out predictive maintenance and prediction of the wind turbine.
In the case of the K-means algorithm and forcing two groups, it is observed that for the variables average active power and average wind speed (test 2), first, and for the variables average oil pressure and average active power (test 3), later, the groups where most of the points are grouped together are identified, which would imply a correct operation of the wind turbines. While one of the clusters groups most of the points and explains the correct behaviour of the WTs, the second cluster in these experiments groups the points with the highest dispersion in one of the variables. The points in this cluster that are further away from the centroid could represent inadequate performance and should be reviewed and analysed by a specialist. This is a possible way to detect anomalous behaviour in some systems or subsystems in wind turbines, but it is necessary that a specialist explore these points in depth to confirm or deny this supposed anomalous behaviour.
Analysing the wind turbine data together as a whole, thus obtaining an overall view of the wind farm, it can be seen that the results obtained are consistent with the analyses carried out individually but allow the identification of turbines that have a slightly different specific behaviour. Here, wind turbines that behave differently from neighbouring wind turbines can be identified as the points are analysed together. If a wind turbine behaves differently, it is very likely that a cluster will capture these points. In this way, once again, these cases can be investigated in more detail and turbine maintenance can be improved.
Boxplot rules could be derived to help wind farm managers detect potential wind turbine faults. The simple graphical representation allows the creation of these rules, which could be applied at no cost and provide further information to the maintenance team.
Efficiently grouping wind turbines in a wind farm can reduce the human effort required to analyse data, while reducing the computational burden on monitoring and maintenance systems. The application of the K-means algorithm to wind turbine SCADA data for its predictive power can be a good starting point, but at the same time, this strategy needs to be supervised by a specialist to obtain more definitive and robust data that can be successfully applied to sustainable, efficient, and effective predictive maintenance, which can improve the paradigm of the industrial maintenance world as we know it today.
However, this study has limitations. Firstly, only one type of clustering algorithm was used in the analysis of the data. There are other algorithms that can be applied to SCADA data [
23], such as the fuzzy C-means algorithm, which is a variation of the K-means algorithm, self organising maps (SOM) or feed-forward neural networks trained using extreme learning machines. Moreover, these strategies can also be complemented by introducing pre-processing and post-processing tools, which help optimise the performance of the algorithms. Finally, only a few combinations of features were tested, while many others are still not investigated in this work. These aspects should be taken into account if such a system is to be implemented in a real case.

 ,
, 


