Article

Research of Car Cooler Thermal Performance Depending on the Mileage of Cooler and Coolant

by
Marek Lipnický
* and
Zuzana Brodnianská
Faculty of Technology, Technical University in Zvolen, Studentska 26, 960 01 Zvolen, Slovakia
*
Author to whom correspondence should be addressed.
Machines 2023, 11(2), 255; https://doi.org/10.3390/machines11020255
Submission received: 9 January 2023 / Revised: 6 February 2023 / Accepted: 7 February 2023 / Published: 8 February 2023
(This article belongs to the Special Issue Heat Transfer and Energy Harvesting in Fluid System)

Abstract

:
The effect of car cooler mileage and coolant mileage on cooler thermal performance was experimentally investigated. The water–ethylene-glycol-based coolant with mileages of 0 km, 50,000 km, and 100,000 km was circulated in new and used car coolers with mileages of 0 km and 100,000 km, respectively. The heating and cooling time of coolants, heat transfer rate, and thermal performance were evaluated. The coolant with a mileage of 0 km in the new cooler achieved a heating time of 41 min and 30 s, which is 8 min less time compared to the coolant with mileage of 100,000 km in the used cooler. When the operating temperature was reached earlier, the engine ran more efficiently and consumed less fuel. The coolant with 0 km mileage in the new cooler achieved a cooling time of 4 min and 30 s, which is 3 min and 30 s less time compared to the coolant with 50,000 km mileage in the new cooler. The new coolant in the new cooler achieved the shortest heating time and cooling time and the highest thermal performance (η = 0.79). The used cooler with the new coolant only achieved a one-time decrease compared to the new cooler and new coolant. The coolant with 50,000 km and 100,000 km mileage for the new cooler and used cooler reached a drop of 1.01 to 1.02 times compared to the new cooler. Coolant and coolers with higher mileage have no significant effect on the thermal performance of the cooler and the correct cooling function of the car engine.

1. Introduction

Engine cooling systems and the use of appropriate coolants are essential attributes for the proper operation of various engines and machines. Antifreeze coolants circulate in cooling systems and protect metal surfaces from corrosion. The most used antifreeze mixtures are based on ethylene glycol EG and propylene glycol PG [1]. The authors Gollin and Bjork investigated different types of coolants, including nanofluids, cooler materials and their geometrical parameters, size, and number of fans [2]. The aim was to find a suitable compromise between performance, size, shape, and weight for a car cooler. Patil et al. [3] reported that improvements in heat transfer can be achieved by varying the geometry and material of fins and tubes, the fluid flow arrangement, and the type of coolant in different proportions. The compact shape of the car cooler leads to reduced air resistance, overall car weight, and lower fuel consumption. Authors Weir and Greaney, as well as Greaney and Cozzone [4,5], compared the performance of EG and PG based coolants. The advantage of PG compared to EG is lower toxicity for humans and animals. The study was conducted in extreme ambient temperatures ranging from −43 °C to 49 °C. However, after an extensive series of tests, no significant performance differences were found between EG and PG. The different physical properties of PG have no effect on heat transfer, cold start, and cool performance. Gollin and Bjork [1] concluded that the most efficient coolant in terms of heat transfer is undiluted water, then a 50:50 mixture of EG and water, then a 50:50 mixture of PG and water, but the use of only water poses a risk of corrosion and freezing. Research by Cozzone [6] found that the heat transfer of PG is comparable to EG under normal and heavy-duty engine operation. The advantage of the water and EG mixture is the reduction in specific heat, the increase in boiling point of water and the reduction in freezing point. Rebsdat and Mayer [7] concluded that the amount of EG in the coolant mixture plays a fundamental role in producing an efficient coolant. The specific heat capacity of a mixture of water and EG decreases with increasing volumetric amount of EG. The freezing point temperature decreases with increasing volumetric amount of EG. Lee [8] investigated the thermal performance during transient operation of a diesel engine system with two different cooling systems. A mixture of water and EG (50:50) was used to investigate the effect of coolant on the diesel engine system.
Nowadays, there is a great emphasis on accurate diagnostic systems to prevent or quickly resolve faults and find a more efficient repair option. One of the main diagnostic groups are thermal imaging devices, which are used to visualize temperature fields on surfaces. In the present paper, a thermal imaging camera was used to detect the temperature changes on the heat transfer surface of the car cooler as the coolant was heated and cooled. A thermal imaging camera can be used not only to investigate the cooling circuit, but also to detect malfunctioning of the brake circuit, high-rolling resistance of the bearings, misfire of the mixture in the engine cylinder, malfunctioning of the thermostat, malfunctioning of the air conditioner and the direction of air flow to the air vents, damaged wiring, etc. Jedliński [9] dealt with the assessment of the technical condition of the vehicle engine using thermal imaging techniques. He described the advantages of using thermal imaging technology in terms of a non-invasive way of recording temperatures and temperature fields without the importance of disassembly. The authors Styla and Pietrzyk [10] proposed a methodology for inspecting heating, ventilation, and air conditioning circuits using thermal imaging cameras. Thermal images make it possible to mark the areas of the car with the highest heat losses. They also reasoned that all such areas lead to inadequate use of thermal energy. For example, when the engine temperature is reduced, fuel consumption increases. Bougeard [11] used thermal imaging technology to obtain surface temperatures and then determine the values of the heat transfer coefficients. He investigated the changes in convective heat transfer coefficients with changing fin spacing and changing airflow velocity to the car cooler with two rows of staggered tubes. He found that the staggered arrangement increased the heat transfer coefficient in the second row of tubes. An experimental study by Ay et al. [12] was carried out using infrared thermal imaging to monitor the heat distribution inside tubular finned heat exchangers. The results show that thermography allows the location and size of boundary layer regions to be quickly detected. The visualization of temperature fields on the finned surface and on fins with embedded vortex generators was addressed in [13]. The purpose of using fins with embedded vortex generators is to improve heat transfer in finned tube heat exchangers. Wei and Agelin-Chaab also used a thermal imaging technique to record thermal characteristics [14]. They proposed and experimentally investigated a new concept of hybrid cooling for battery applications in the automotive industry. Mraz et al. [15] dealt with liquid cooling of automotive headlights using a heat exchanger. As in our case, they used a thermal imaging technique to monitor the temperature and heat distribution of the heat exchanger.
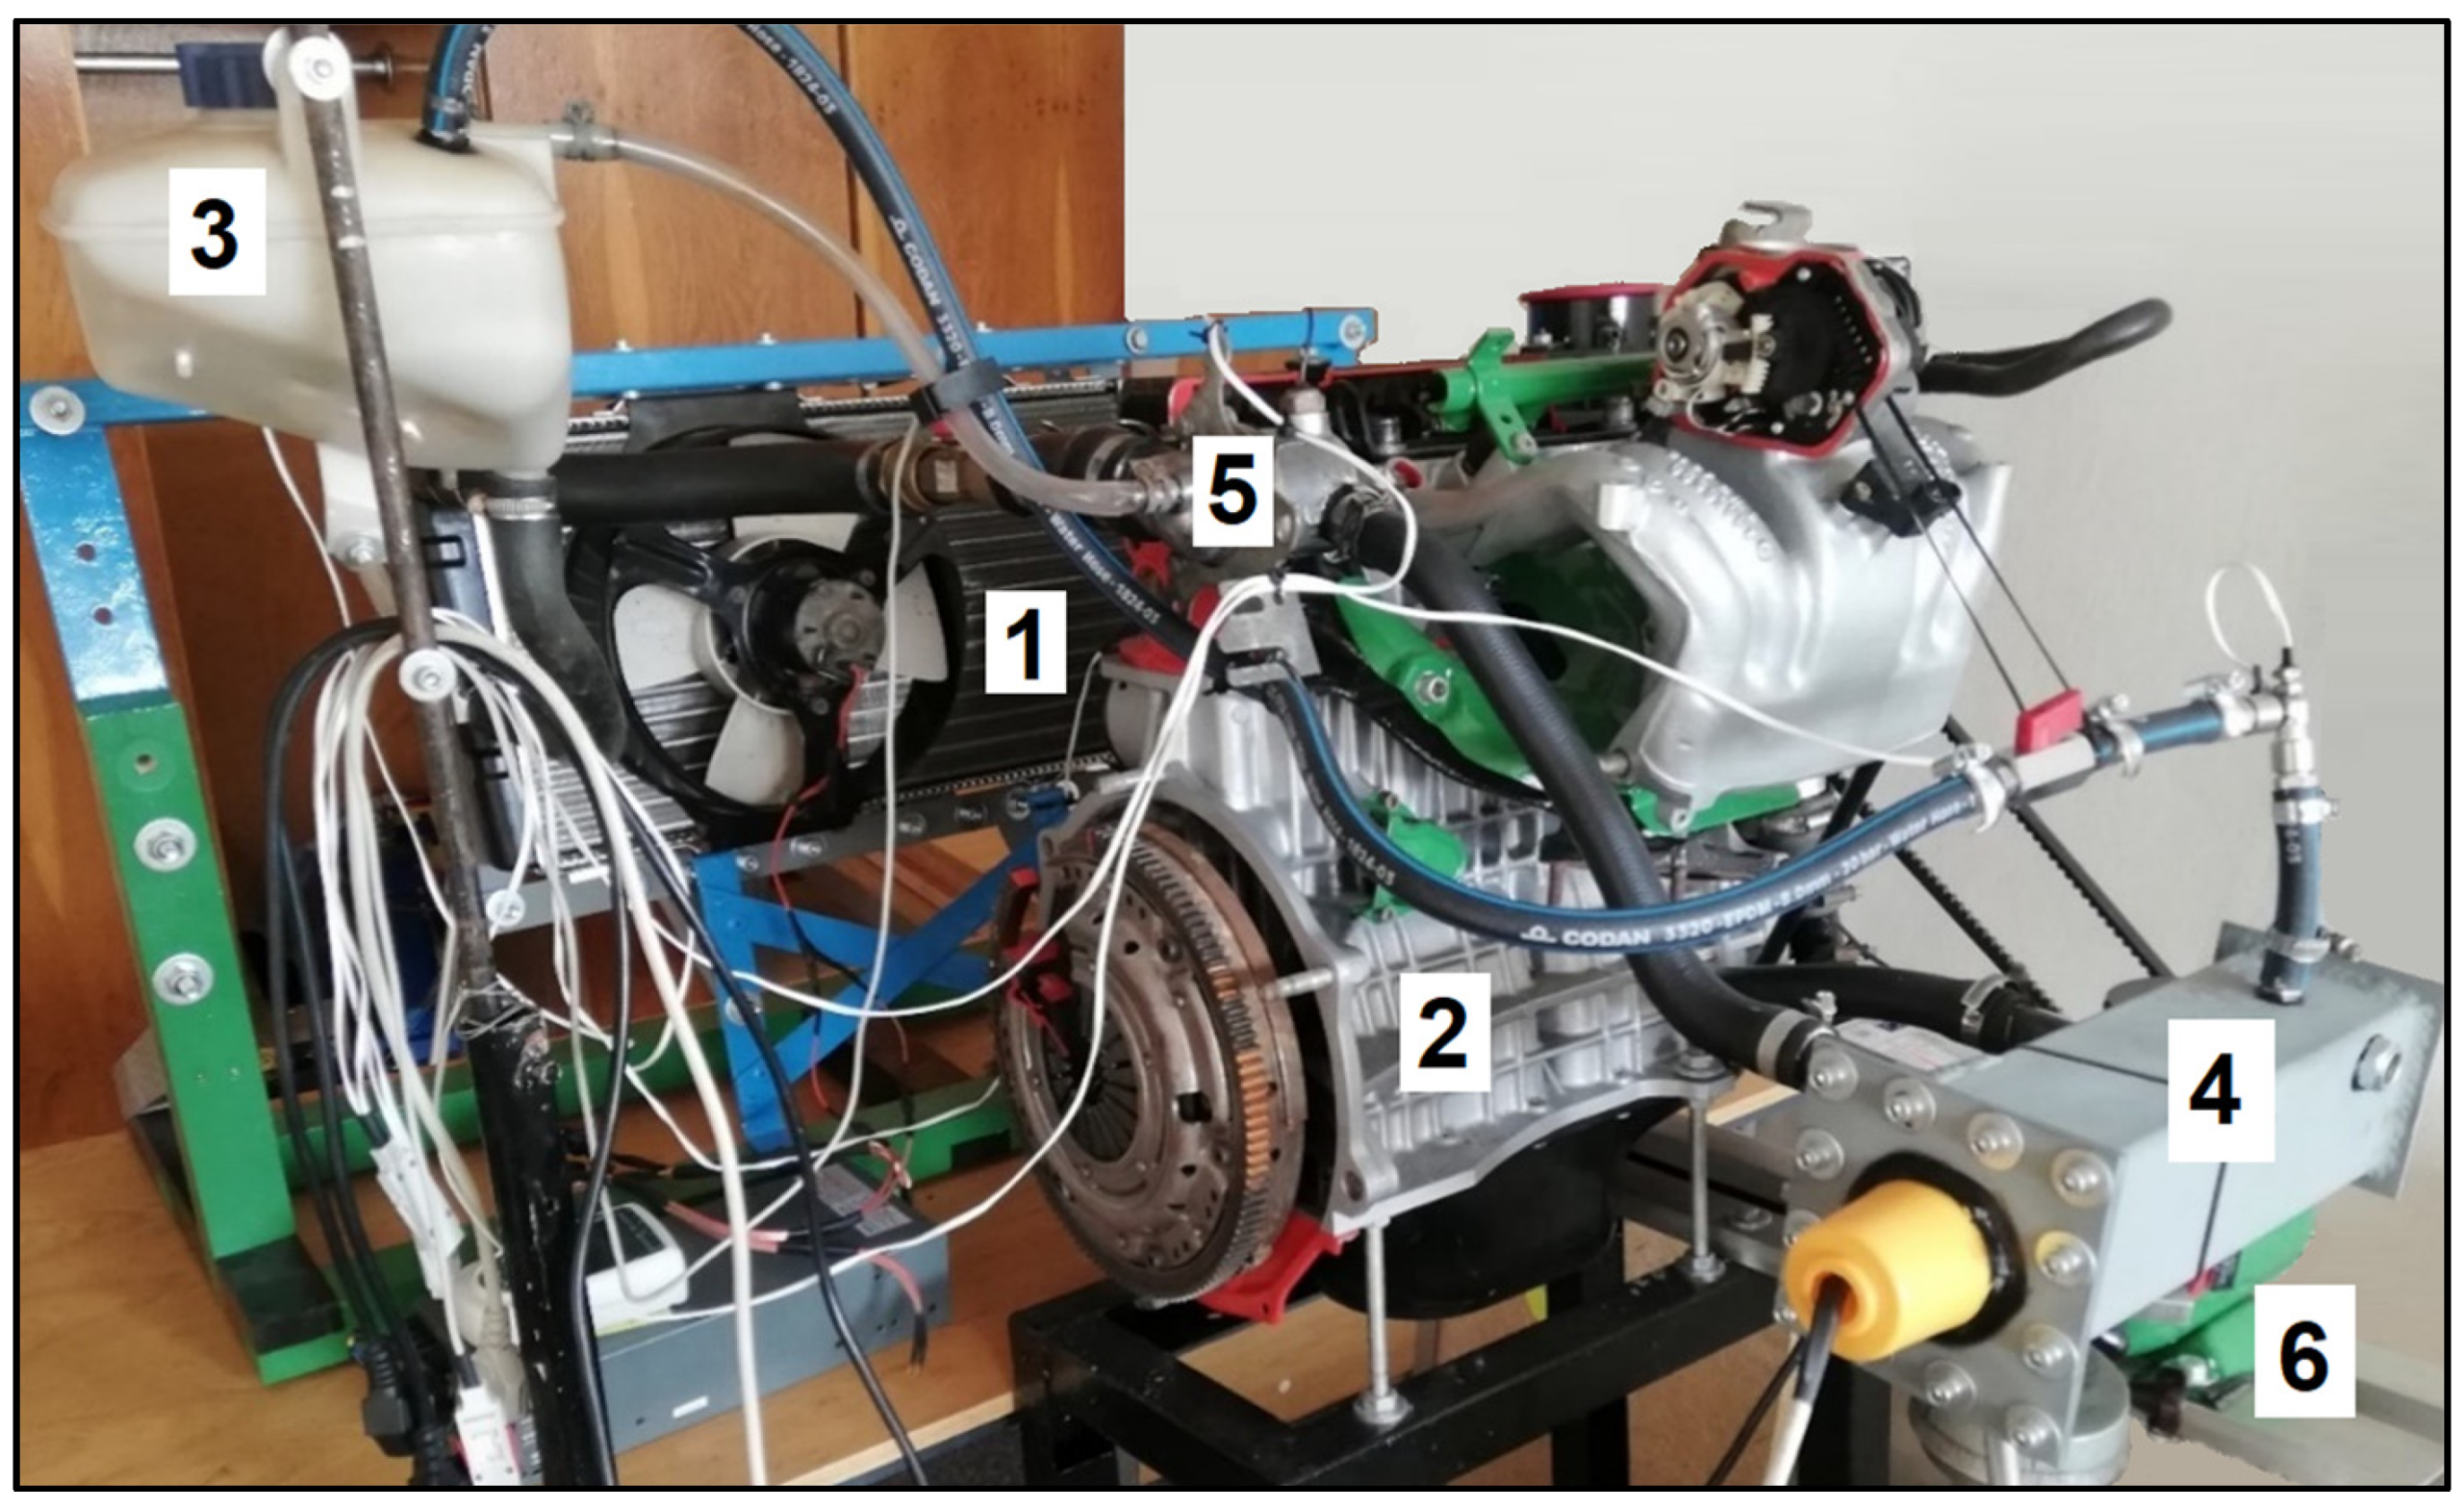
In the literature, the experimental setups mostly consist of the cooler, coolant tank, coolant heater, water pump, fan, and sensors of physical quantities. A different volume of coolant was circulated in the cooling systems. Hussein et al. [16] used three litres of nanofluid as a coolant and measured the temperatures at the inlet and outlet of the cooler, as well as the surface of the car cooler. The flow meter and ten thermocouples of type K were used for measurement of flow rate and temperatures, respectively. The same experimental setup was used by Ali et al. [17], but with a flow regulator of nanofluid. The car cooler consisted of 32 aluminium vertical tubes with fins. They investigated the heat transfer performance of the cooler. With the coolant inlet temperature rising from 45 °C to 55 °C, the heat transfer rate increased up to 4%. In our research, we used the coolant temperature at the inlet to the coolers in the range from 80 to 90 °C, as it is in a real engine cooling circuit. The coolant tank with a volume of 22 litres was used by Heris et al. [18]. PT-100 temperature sensors were used to measure the inlet and outlet temperature of the cooler and the temperature on its heat exchange surface. The fin-and-tube car cooler consisted of 40 tubes of circular cross-section. Coolant in a 17-L tank was circulated through the cooling circuit using a circulation pump [19]. The cooler consisted of 32 aluminium vertical tubes, and the temperature of the coolant at the inlet to the cooler was varied in the range from 60 °C to 70 °C.
High demand for energy resources leads to continuously rising prices, and this leads to efforts to reduce overall energy consumption.
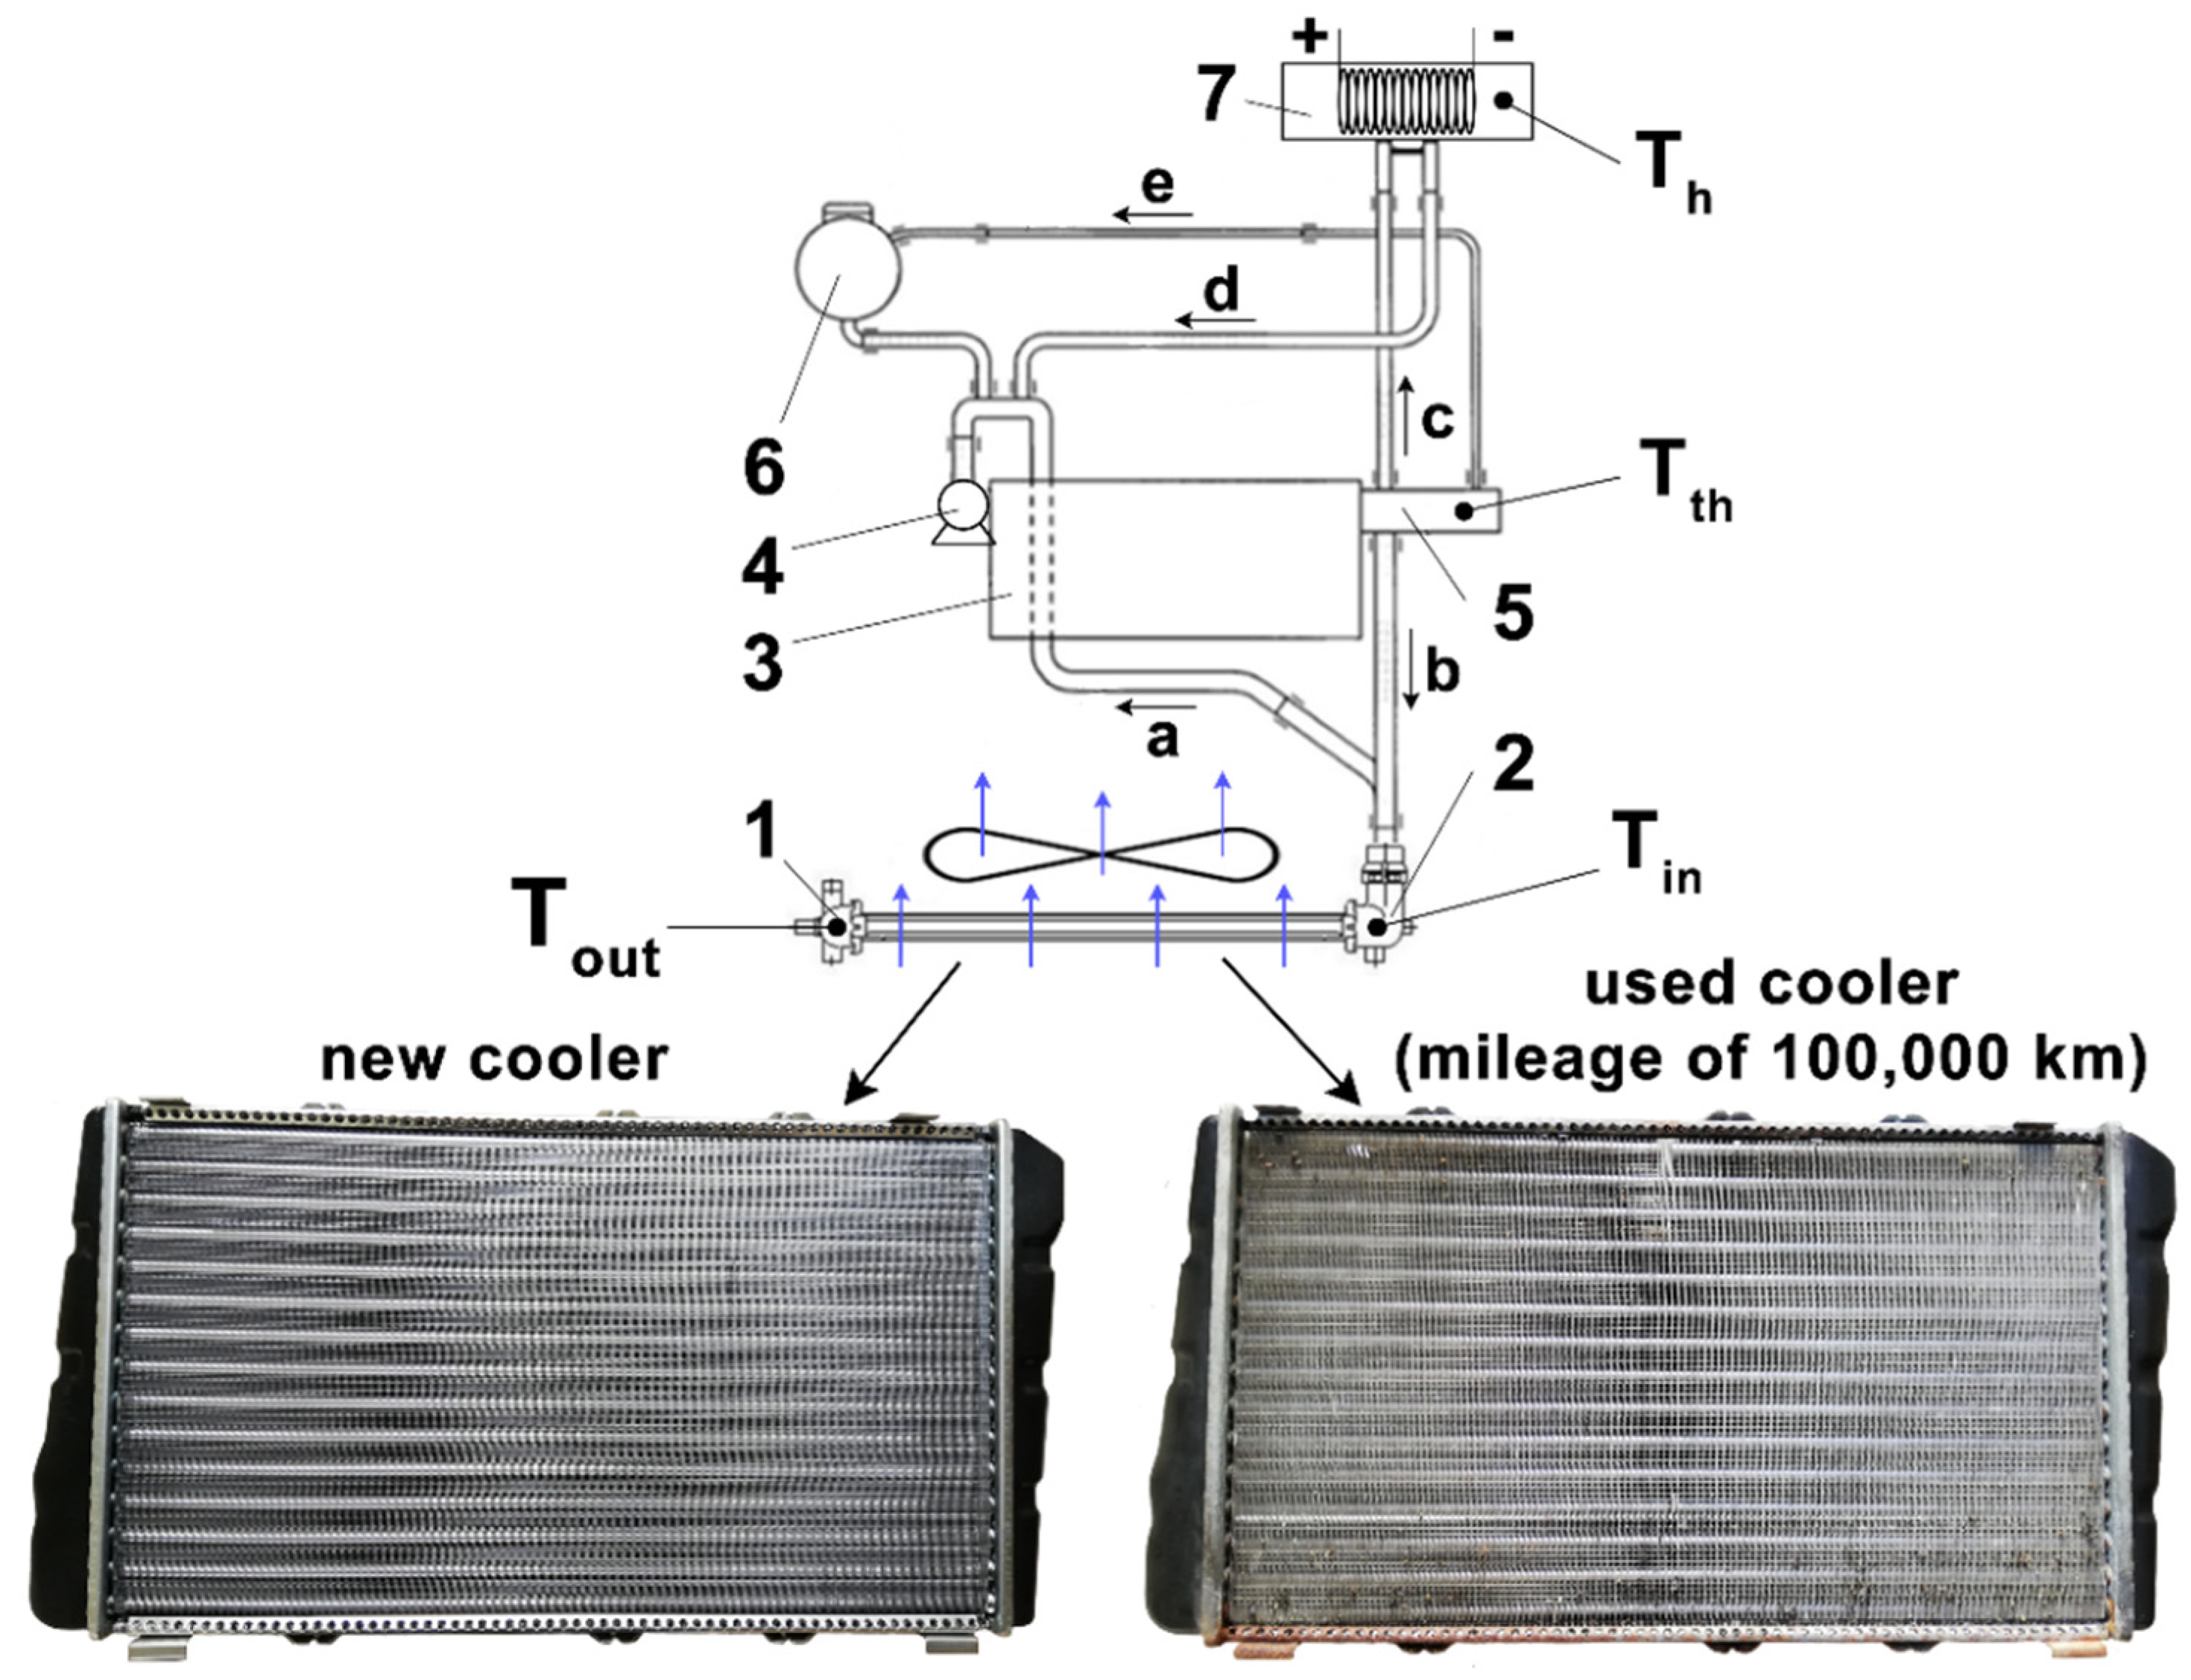
The previous literature has minimally investigated the mileage of the car cooler and coolant, and this motivated us to experimental measurements. These aspects can affect the proper operation of the engine, the lifetime of the components, and the ecological and economical operation of the car. The experimental research of the new cooler and the used cooler with mileages of 0 km and 100,000 km, respectively, was carried out in laboratory conditions. The coolant mixture of G12+ (ethylene glycol) and water in the ratio of 50:50 was investigated in terms of mileages of 0 km, 50,000 km, and 100,000 km. The heating and cooling time of the coolant, inlet and outlet cooler temperatures, heater and thermostat temperatures, and the thermal performance of the coolers were evaluated. In addition, the thermal images were analysed in terms of the distribution of temperature fields on the car coolers.

2. Materials and Methods

2.1. Experimental Setup of the Engine Cooling Circuit

The experimental setup of the engine cooling circuit constructed for the laboratory research is shown in Figure 1.
The laboratory experimental setup can operate in short and long cooling circuits (Figure 2). The cooling circuit is filled with coolant through the expansion tank (6). The water pump (4) is activated by an electric motor and a frequency converter. The water pump pulley is connected to the electric motor pulley by a V-belt with a tensioning mechanism. The coolant flows only in a short cooling circuit at temperature up to 80 °C. In this case, the water pump (4) pumps the coolant through the engine block (3), to the thermostat (5), and to the heater (7). The heated coolant flows from the heater to the engine block (d). In the upper part of the heater is a nozzle for connecting the return pipe (e) to the expansion tank (6) in the event that the heater (7) becomes aerated or overflows. The outlet nozzle of the heater is connected to the water pump by a hose. When the operating temperature reaches 80 °C, the thermostat (5) opens and the coolant flows (b) into the cooler (1). The cooled coolant flows through the cooler outlet pipe (a) to the water pump (4) and back into the short cooling circuit until the temperature drops below 80 °C. The air generated by the fan passes through the cooler perpendicular to its axis. The fan is driven by an electrical power supply (12 V; 80 A). The fan with a diameter of 250 mm consists of four blades. Sensors for measuring the coolant temperature are mounted in the experimental setup in the inlet pipe and outlet pipe of the cooler: Tin, Tout, in the thermostat Tth, and in the heater Th. The flow meter is installed in the pipe between the thermostat and the inlet pipe of the cooler (b). The new cooler and used cooler with mileage of 0 km and 100,000 km were used for the experimental investigation (Figure 2). The used cooler was worn out in terms of internal and external fouling, corrosion of tubes and fins, and deformed and missing fins. The engine was operated at a constant revolution of 900 RPM representing idling. The mentioned revolutions represent the condition where the car is stationary in traffic jams, crossroads, etc.
The G12+ water–ethylene-glycol-based (50:50) coolant was examined in terms of mileage for 0 km, 50,000 km, and 100,000 km for the new cooler and the used cooler. The G12+ coolant is an ethylene-glycol-based coolant containing organic corrosion inhibitors without silicates. The physical properties of the water–ethylene-glycol mixture (50:50) are listed in Table 1.
The Škoda Felicia 1.3 MPI pressure cooler consisted of 30 aluminium tubes arranged in two in-line rows of 15 tubes and plastic side chambers (Figure 3). The tubes with an internal diameter of 5 mm were arranged with a spacing of 15 mm and 18 mm in the horizontal and vertical direction, respectively. The plain fins with a thickness of 0.1 mm were arranged with a spacing of 1 mm along the tubes for more intensive heat dissipation. The circular tubes were inserted into the holes in the chambers and sealed with rubber sealing elements. The car cooler consisted of two dividing planes and three coolant passages with counter flow. The hot coolant inlet to the cooler was at the top of the chamber and the cold coolant outlet from the cooler was at the bottom of the chamber. Above the cold coolant outlet was a threaded outlet for an M22 × 1.5 thermal switch. The nominal power of the car cooler was 33.3 kW.
The coolant temperature at the inlet and outlet of the cooler Tin, Tout, in the thermostat Tth, and in the heater Th were measured with NTC ZA 9040-FS resistance temperature sensors. The coolant flow was measured using the FVA 915 VTH coolant flow sensor in the pipe between the thermostat and inlet pipe of the cooler. The fan air temperature was measured with a FHA 646-1 sensor. The sensors were connected to an ALMEMO 2590-4S data-logger. Thermal images of the temperature fields were recorded with a FLIR E5-XT thermal imaging camera. The inlet and outlet coolant temperature in the cooler (Thot,in and Thot,out), the air temperature (Tcold,in), and the mass flow rate calculated from the coolant flow rate and pipe cross-section ( m ˙ hot), were substituted into Equations (1) and (2).
The thermal performance of the examined car coolers is expressed in terms of [21]:
η = Q ˙ Q ˙ m a x = m ˙ h o t · c p , h o t ( T h o t , i n T h o t , o u t ) C m i n ( T h o t , i n T c o l d , i n )
whereas the C m i n = C h o t for the smaller heat capacity rate of the hot coolant side:
C m i n = m ˙ h o t · c p , h o t
where Q ˙ / Q ˙ m a x is the ratio of actual heat transfer rate to the maximum theoretical heat transfer rate; m ˙   is the mass flow rate; C is the heat capacity rate; cp is the specific heat capacity at constant pressure; subscripts hot and cold correspond to hot coolant and cold air, respectively; and subscripts in and out correspond to the inlet and outlet of coolant and air, respectively.
The maximum heat transfer rate uncertainty was 6.5% for the lowest temperature difference between the inlet and outlet of the hot coolant.

2.2. Coolant Heater Design for Laboratory Conditions

2.2.1. Literature Review of Coolant Heaters Designed by Different Authors

Several authors have used coolant heated in the heater instead of heat obtained from the combustion process of the engine. The authors [16] installed a 1500 W electric heater in a plastic bucket 400 mm high and 300 mm in diameter. A voltage regulator (0 ÷ 220 V) was used to supply power and control the temperature in the car cooler in the range of 60 °C to 80 °C. In [22], the setup includes a safety valve to suddenly increase the pressure and the heater is connected to the cooling circuit by a vent pipe. In the event of a pressure increase, the coolant circulates through the vent pipe back to the expansion tank. A heater with heating coils was used by Yadav and Singh [23]. The water in the 40-L tank was heated to a temperature of 65 °C to 75 °C. At the beginning of testing, Hoseini et al. [24] filled the reservoir containing the heating coil with 8 litres of coolant. The test coolant was filled to approximately 25% of the reservoir volume. Heating of the coolant and maintaining the temperature in the range of 40 °C to 80 °C was provided by a copper electric heating coil with a controller. The connection between the reservoir and the components was made by means of insulated pipes with a diameter of 19 mm. The reservoir was equipped with a drain valve at the bottom to ensure complete drainage of the coolant from the circuit in event of replacement with another type, thus preventing unwanted mixing of the two types of coolant in the circuit. Peyghambarzadeh et al. [25] used two 6000 W coil heaters to control the temperature between 50 °C and 80 °C. The Pt-100 probes installed on the pipe to record the inlet and outlet temperatures of the coolant in cooler, inlet, and outlet temperature of the air in the tank were used to switch the heaters on/off. Heris et al. [18] solved the problem of heating the coolant by using six 18,000 W coils with a controller to maintain the temperature between 30 °C and 60 °C. Three-layer insulated pipes with a diameter of 19 mm were used as connecting pipes. In our case, 3 different sizes of braided rubber hoses with diameters of 16 mm, 19 mm, and 32 mm were used as connecting pipes. Goudarzi and Jamali [26] used a tank with a capacity of 18 litres of coolant. Six electric coils in the tank were used to increase the temperature of the coolant, and the temperature was gradually increased to a value of approximately 80 °C. The experiment by Vasudevan Nambesan et al. [27] was conducted at constant flow rate and inlet coolant temperature ranging from 40 °C to 70 °C. The tank had a volume of 90 L. The coolant was heated in the tank using two electric coils with a power of 1000 W. Ali et al. [17] used a 6000 W Omega-CH-OTS-604/240 V heater with a built-in temperature controller immersed in the tank. Subhedar et al. [28] inserted a 33 L tank filled with coolant from 25% to 30% of the total volume into the experimental setup. The coolant was heated using two 3000 W rod heaters mounted in the tank. The temperature was controlled in the range of 40 °C to 90 °C. Khan et al. [29] used a 4.5 kW electric heater in the tank to heat the coolant. The tank was located between the water pump and the inlet pipe of the cooler, and a pipe with a bypass valve was connected to it. In our case, the tank was separated, and the heater located between the thermostatic valve and the water pump took care of heating the coolant.

2.2.2. Novelty Design and Construction of the Coolant Heater

In the presented experimental research, there was no combustion process in the car engine. For this reason, a new coolant heater was constructed that maintained the original coolant volume as in real automobile engine operation. The heater consisted of an 80 × 80 × 300 mm aluminium profile (Figure 4a). The iron profile was closed on both sides, on one side by welding and on the other side by a removable lid (8). The coolant was heated by means of a heating coil (10) with two branches with a power of 1000 W. The power of the heating coil could be controlled by means of a potentiometric power controller. The coolant entered the heater through the inlet nozzle (1) and the heated coolant exited through the outlet nozzle (2). The heater was filled with coolant during the operation. A vent valve (4) for adjustable venting of the short cooling circuit was located at the top of the heater. Air bubbles or excess coolant were returned to the expansion tank. A drain valve (3) was located at the bottom of the heater, which was used to drain the coolant completely from the chamber if necessary. A sealing paper (7) was inserted between the flange (5) and the removable lid (8) to prevent leakage of the coolant, to which a layer of sealant (6) was applied on both sides. A sealing O-ring (9) was inserted between the removable lid (8) and the heating coil (10) to prevent leakage of the coolant. The removable lid (8) was fixed to the flange (5) by means of 12 screws.
The electrical wiring diagram of the heater is shown in Figure 4b. The power supply and temperature control of the heating coil were handled by using a TRIAC BTA16 triac controller. Capacitor C2 was charged via resistor R2, trimmer Trim, and potentiometer Pot. When the voltage at its terminals reached the breakdown voltage of the diac (approximately 32 V), the diac went into a conductive state, and this voltage was connected to the control electrode G of the triac. This voltage pulse opened the triac. The voltage across the capacitor dropped, but the open triac remained open until the supply voltage dropped below the holding voltage. The greater the resistance of R2, the trimmer, and the potentiometer, the longer it took to charge the capacitor, so the triac was open for a shorter time. The trimmer was used for coarse adjustment of resistance while the potentiometer was used for fine adjustment and desired voltage regulation.
Thermal images of the heater inlet and outlet nozzles during coolant heating are shown in Figure 5. To achieve a coolant temperature in the thermostat above 80 °C, it is necessary to heat the coolant in the heater above 88 °C. The heater nozzles, on which the surface temperature was measured with a thermal imaging camera, had a matte black surface. This surface is the most accurate for thermal imaging measurements.

3. Results and Discussion

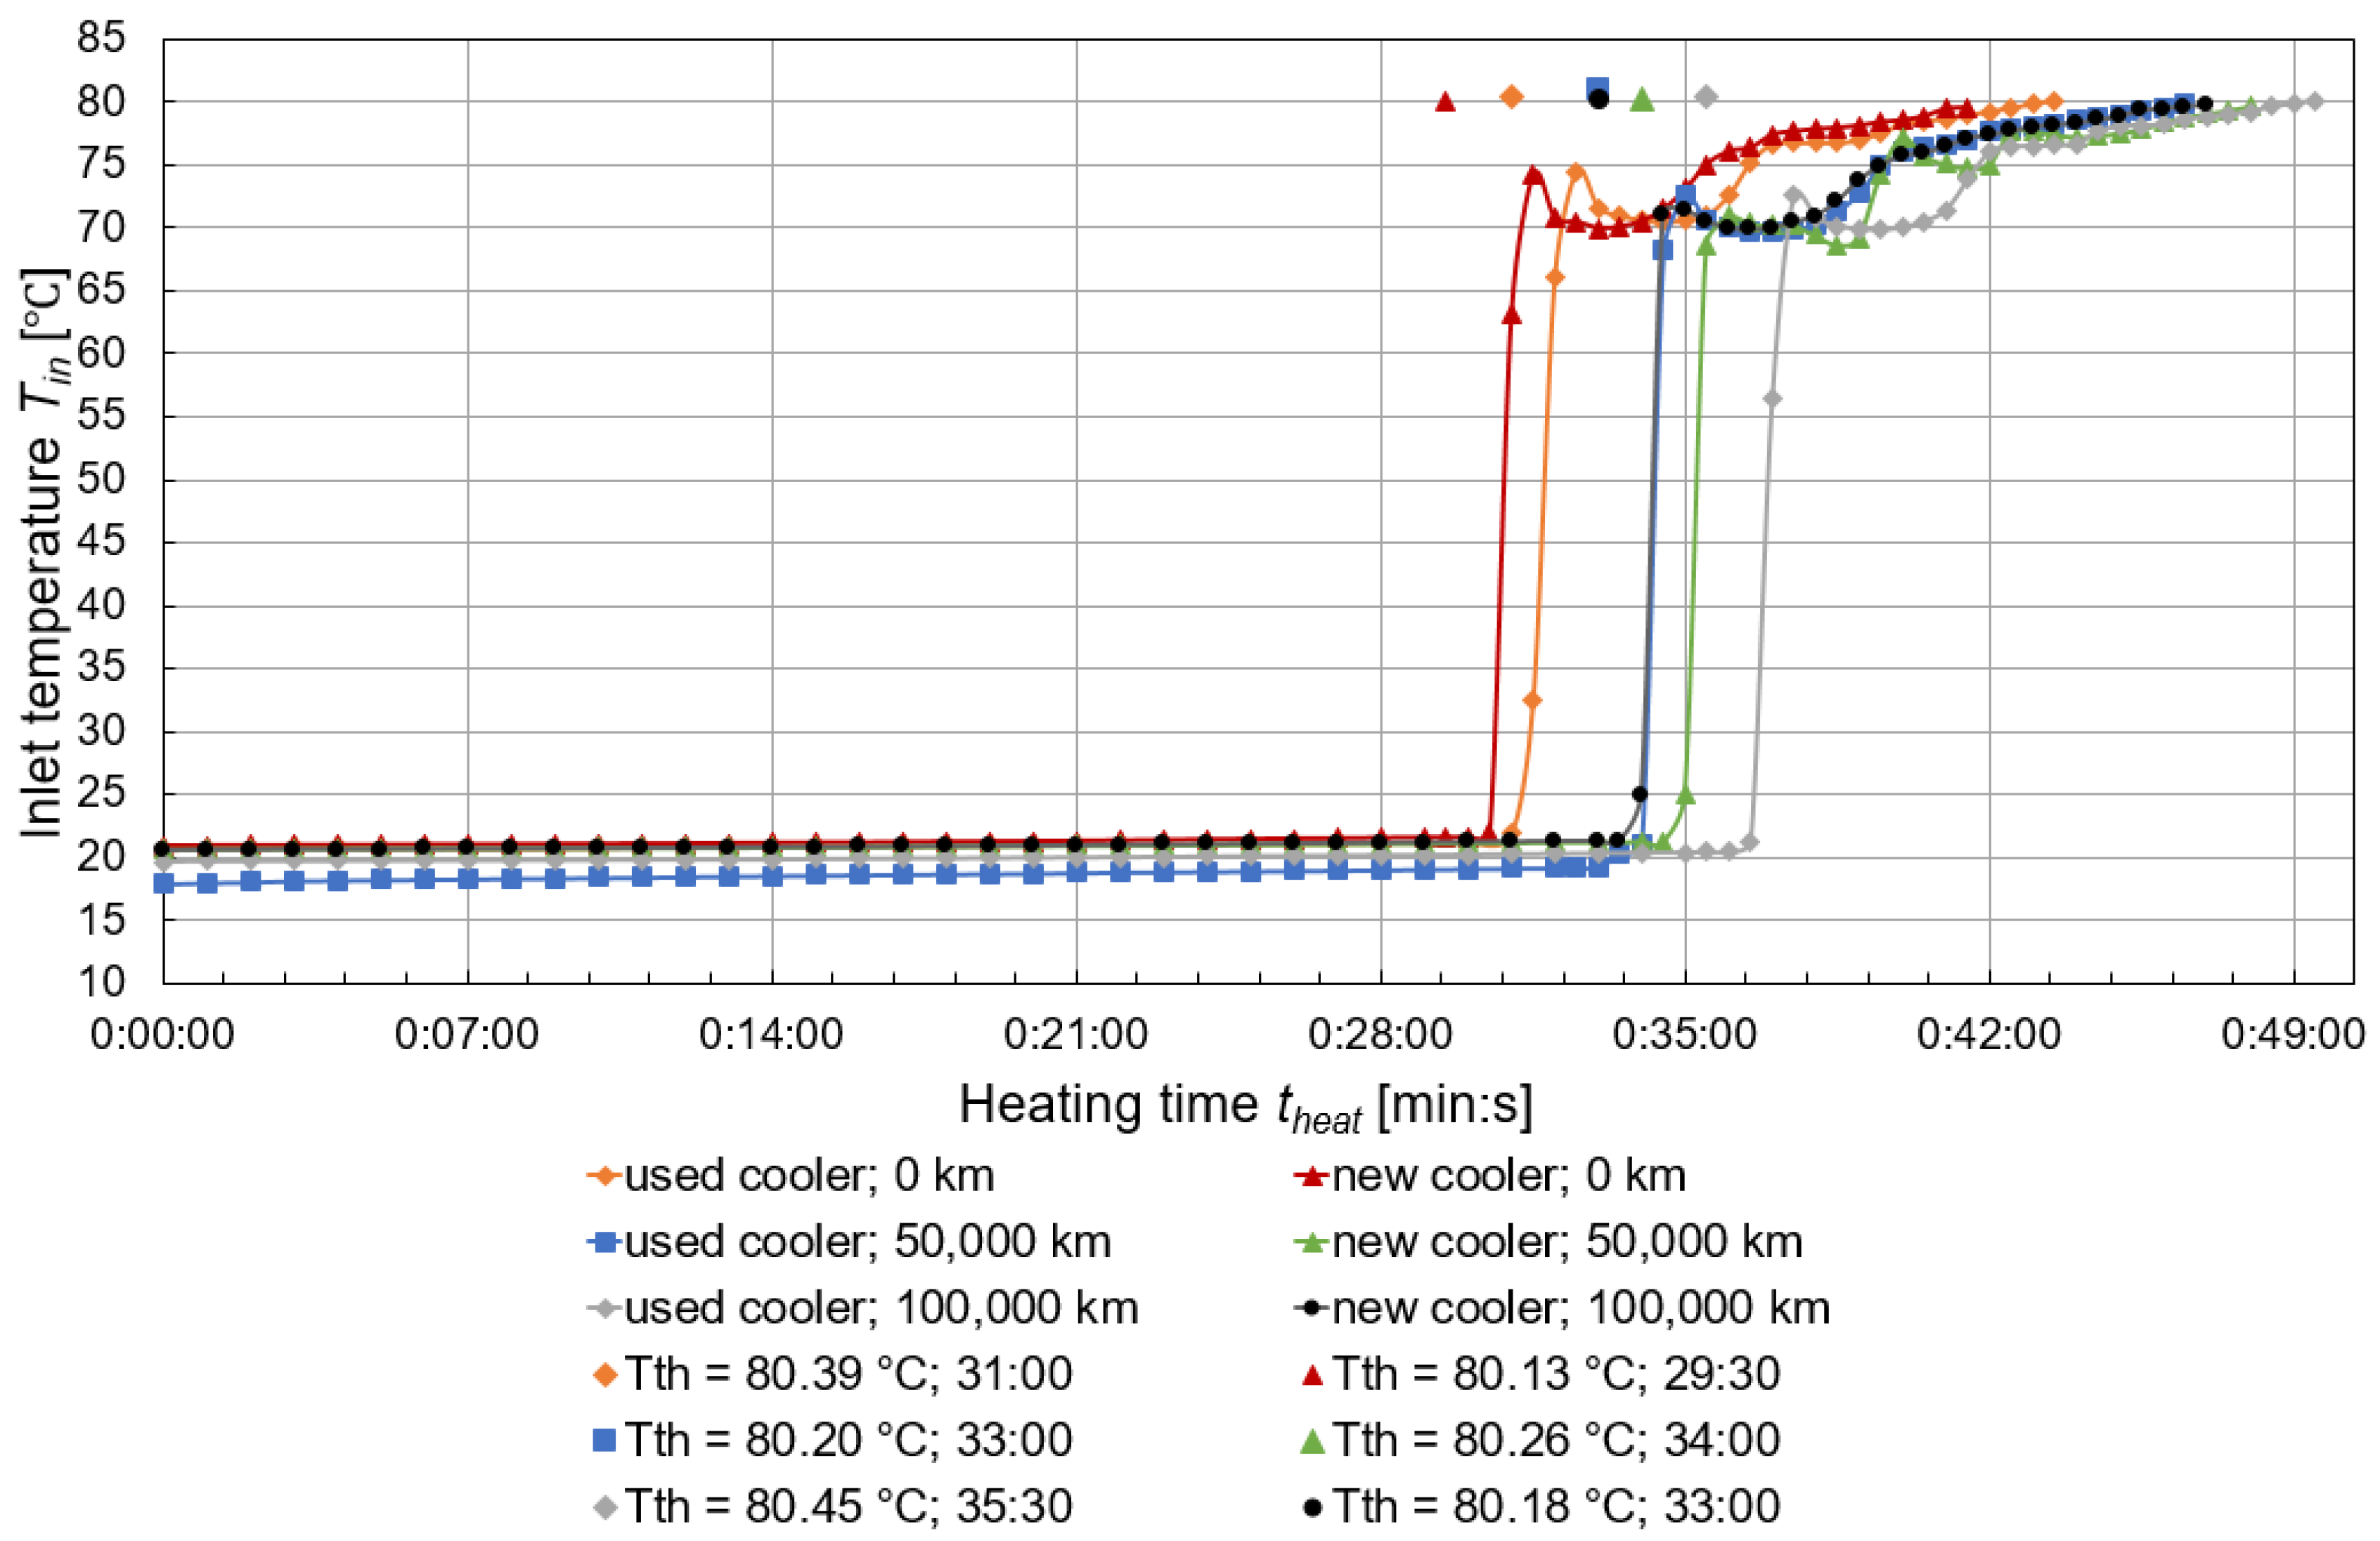
A comparison of the heating and cooling times of the coolant of the new cooler and the used cooler as their mileages were varied is shown in Figure 6 and Figure 7. The heating time varied depending on the mileage of the car cooler and the coolant of the vehicle. The coolant with a mileage of 0 km in the new cooler took the shortest time to heat up (41 min and 30 s) and conversely, the coolant with 100,000 km in the used cooler (100,000 km mileage) took the longest time to heat up (49 min and 30 s). The coolant gradually warmed from approximately 20 °C to 80 °C when the thermostat was opened and the coolant drained into the cooler. All coolants tested initially achieved a significant temperature rise in the range of 56 °C to 71 °C, then a slight decrease and a further temperature rise up to 80 °C. The thermostat temperature Tth when the thermostat was first opened for all examined cooler and coolant mileage is shown in dots (Figure 6). The cooling process in the car cooler took place from the first time the thermostat was opened, but only by free convection, because the coolant was already flowing into the cooler, but not at full mass flow. In general, the longer coolant warm-up was due to the engine idle revolution settings of 900 RPM. As the engine revolutions increased, the coolant warm-up time became shorter.
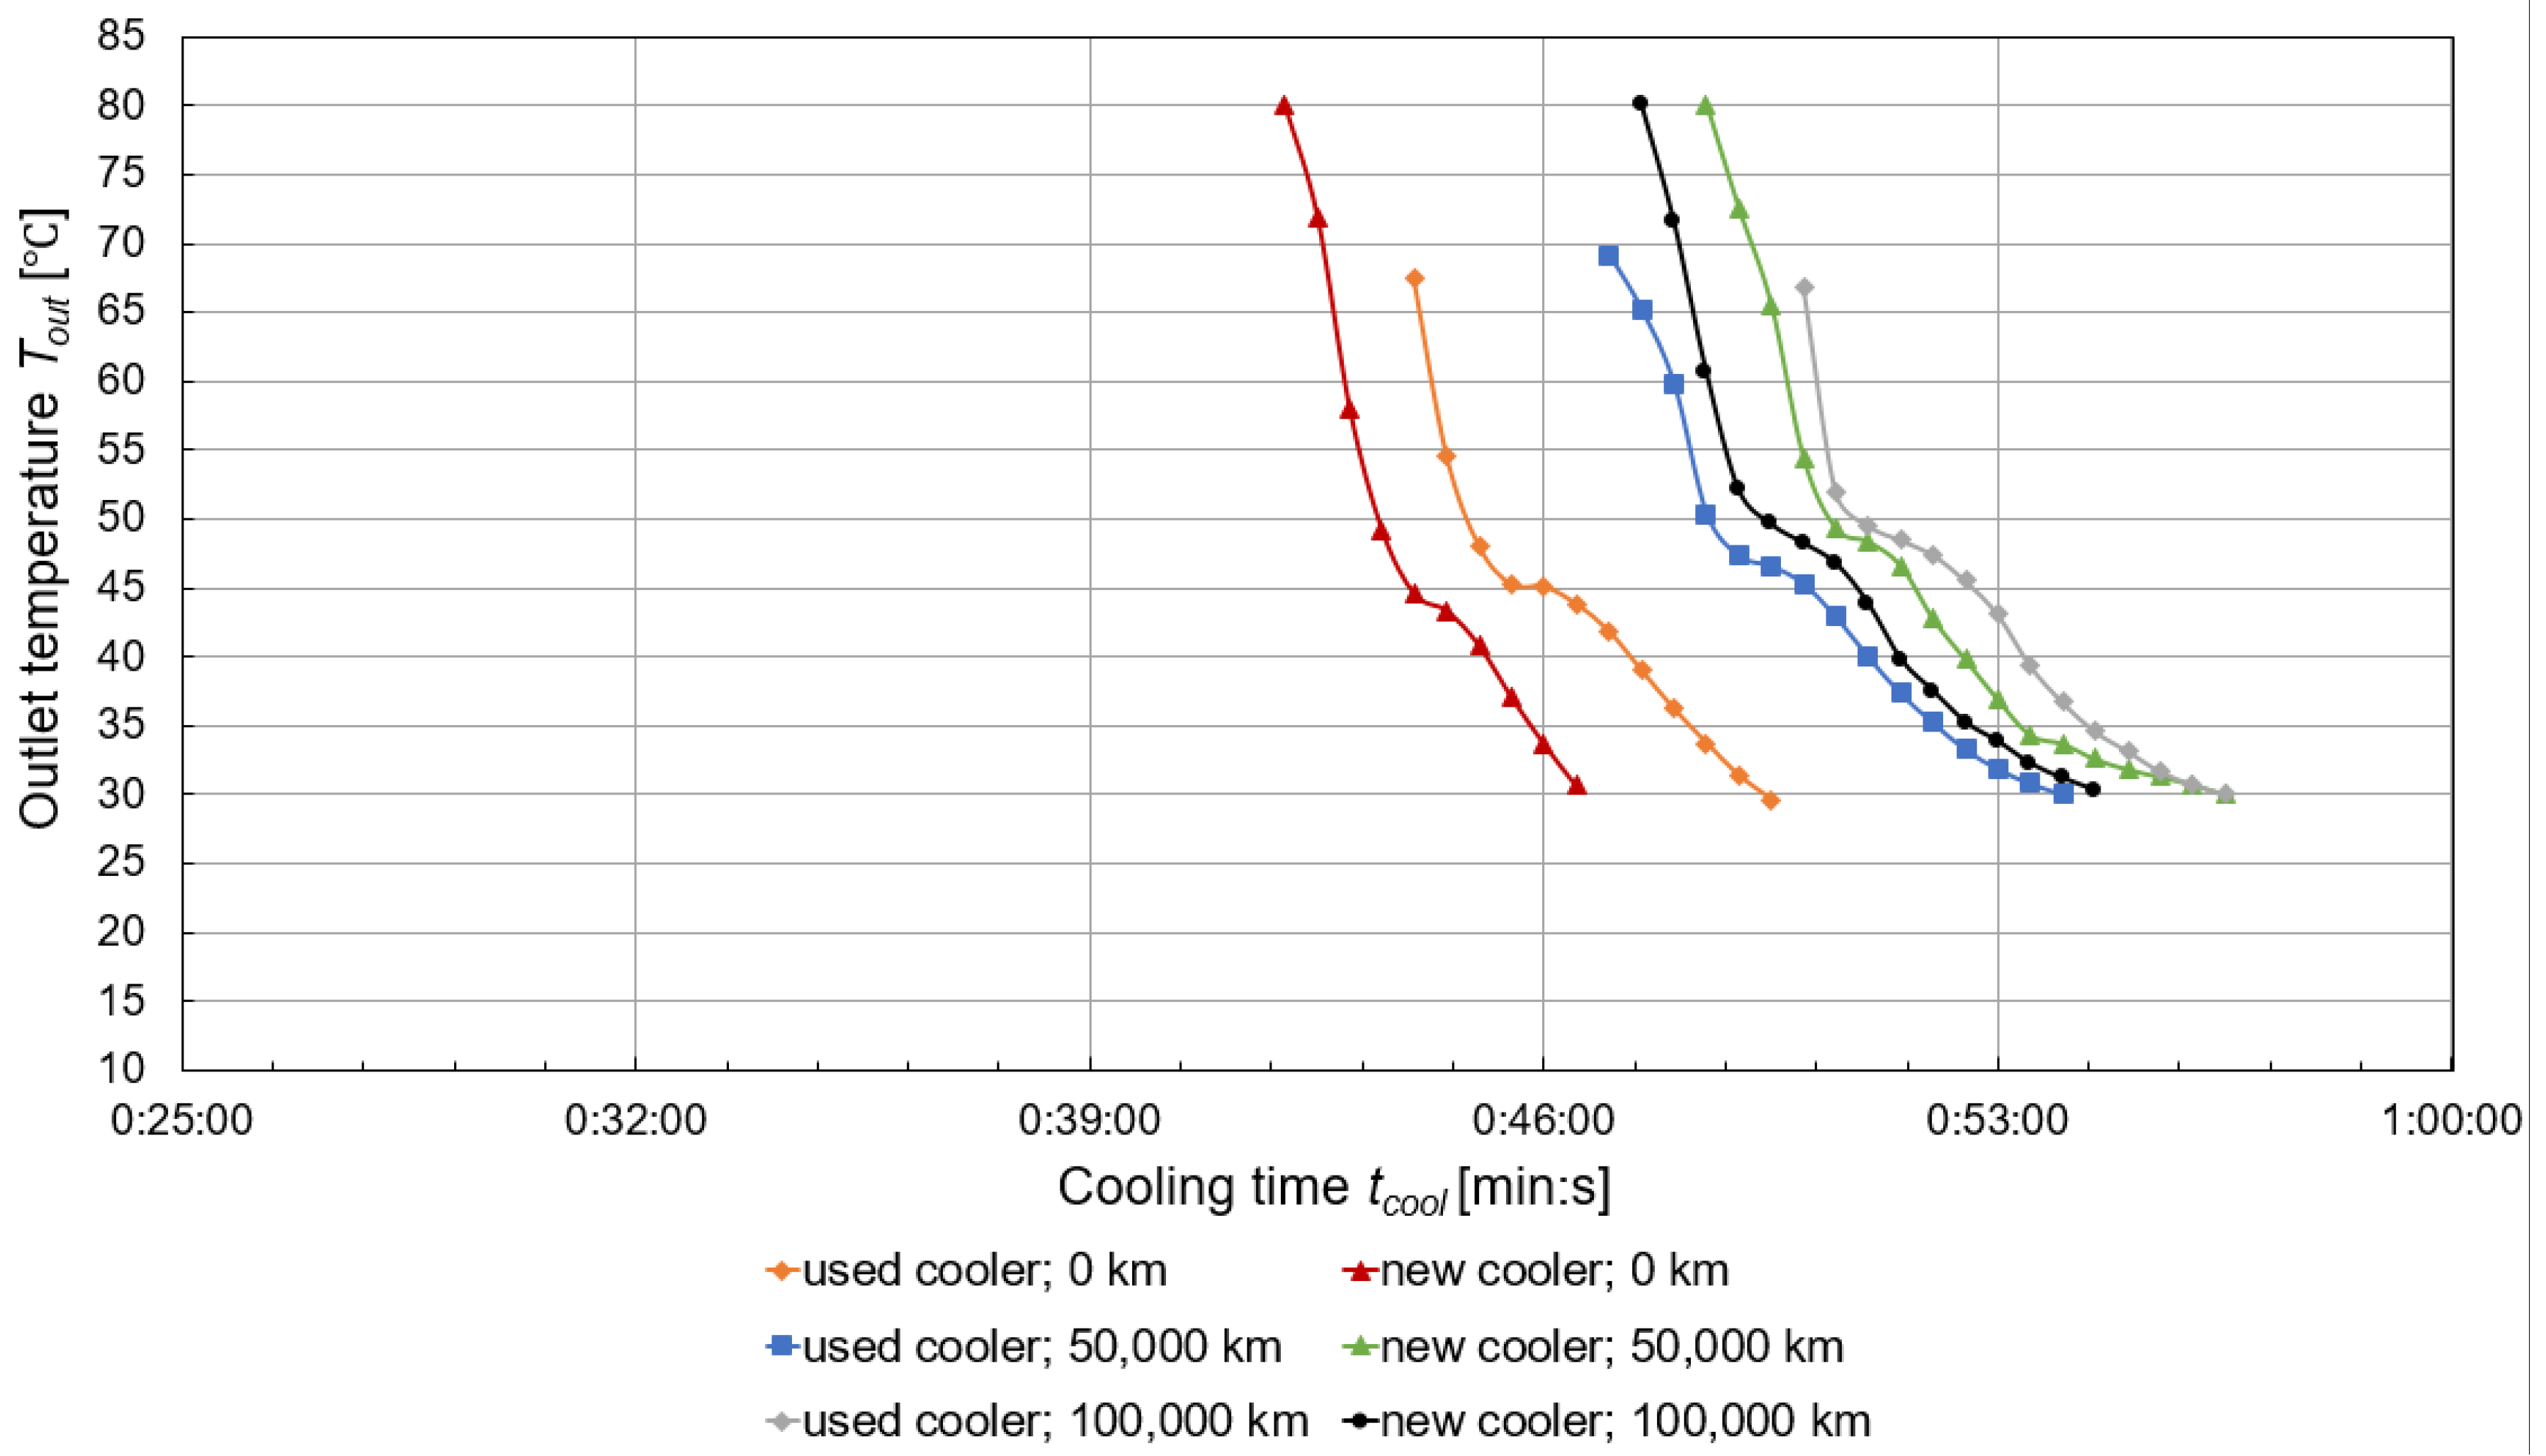
The cooling process was started by starting the fan and then recorded until the cooler outlet temperature was approximately 30 °C (Figure 7). In terms of cooling time, the new cooler and coolant with a mileage of 0 km cooled the fastest (4 min and 30 s), while the new cooler and coolant with a mileage of 50,000 km cooled the slowest (8 min).
The heating and cooling time of the used and new cooler depending on the mileage of the coolant is shown in Table 2. The used cooler (100,000 km mileage) and the coolant with a mileage of 100,000 km took the longest to warm up to the thermostat opening temperature. This may be due to the presence of impurities in the coolant (sediment, gasket particles) or the presence of engine oil. As the coolant mileage decreased, the coolant warm-up time for the used cooler also decreased. In the case of the new cooler, the longest warm-up time was achieved at 50,000 km mileage. The new coolant in the new cooler achieved the shortest warm-up time and cooling time. The new cooler was not yet fouling and was free of corrosion, and the heat from the coolant was transferred more efficiently through the tubes to the surroundings.
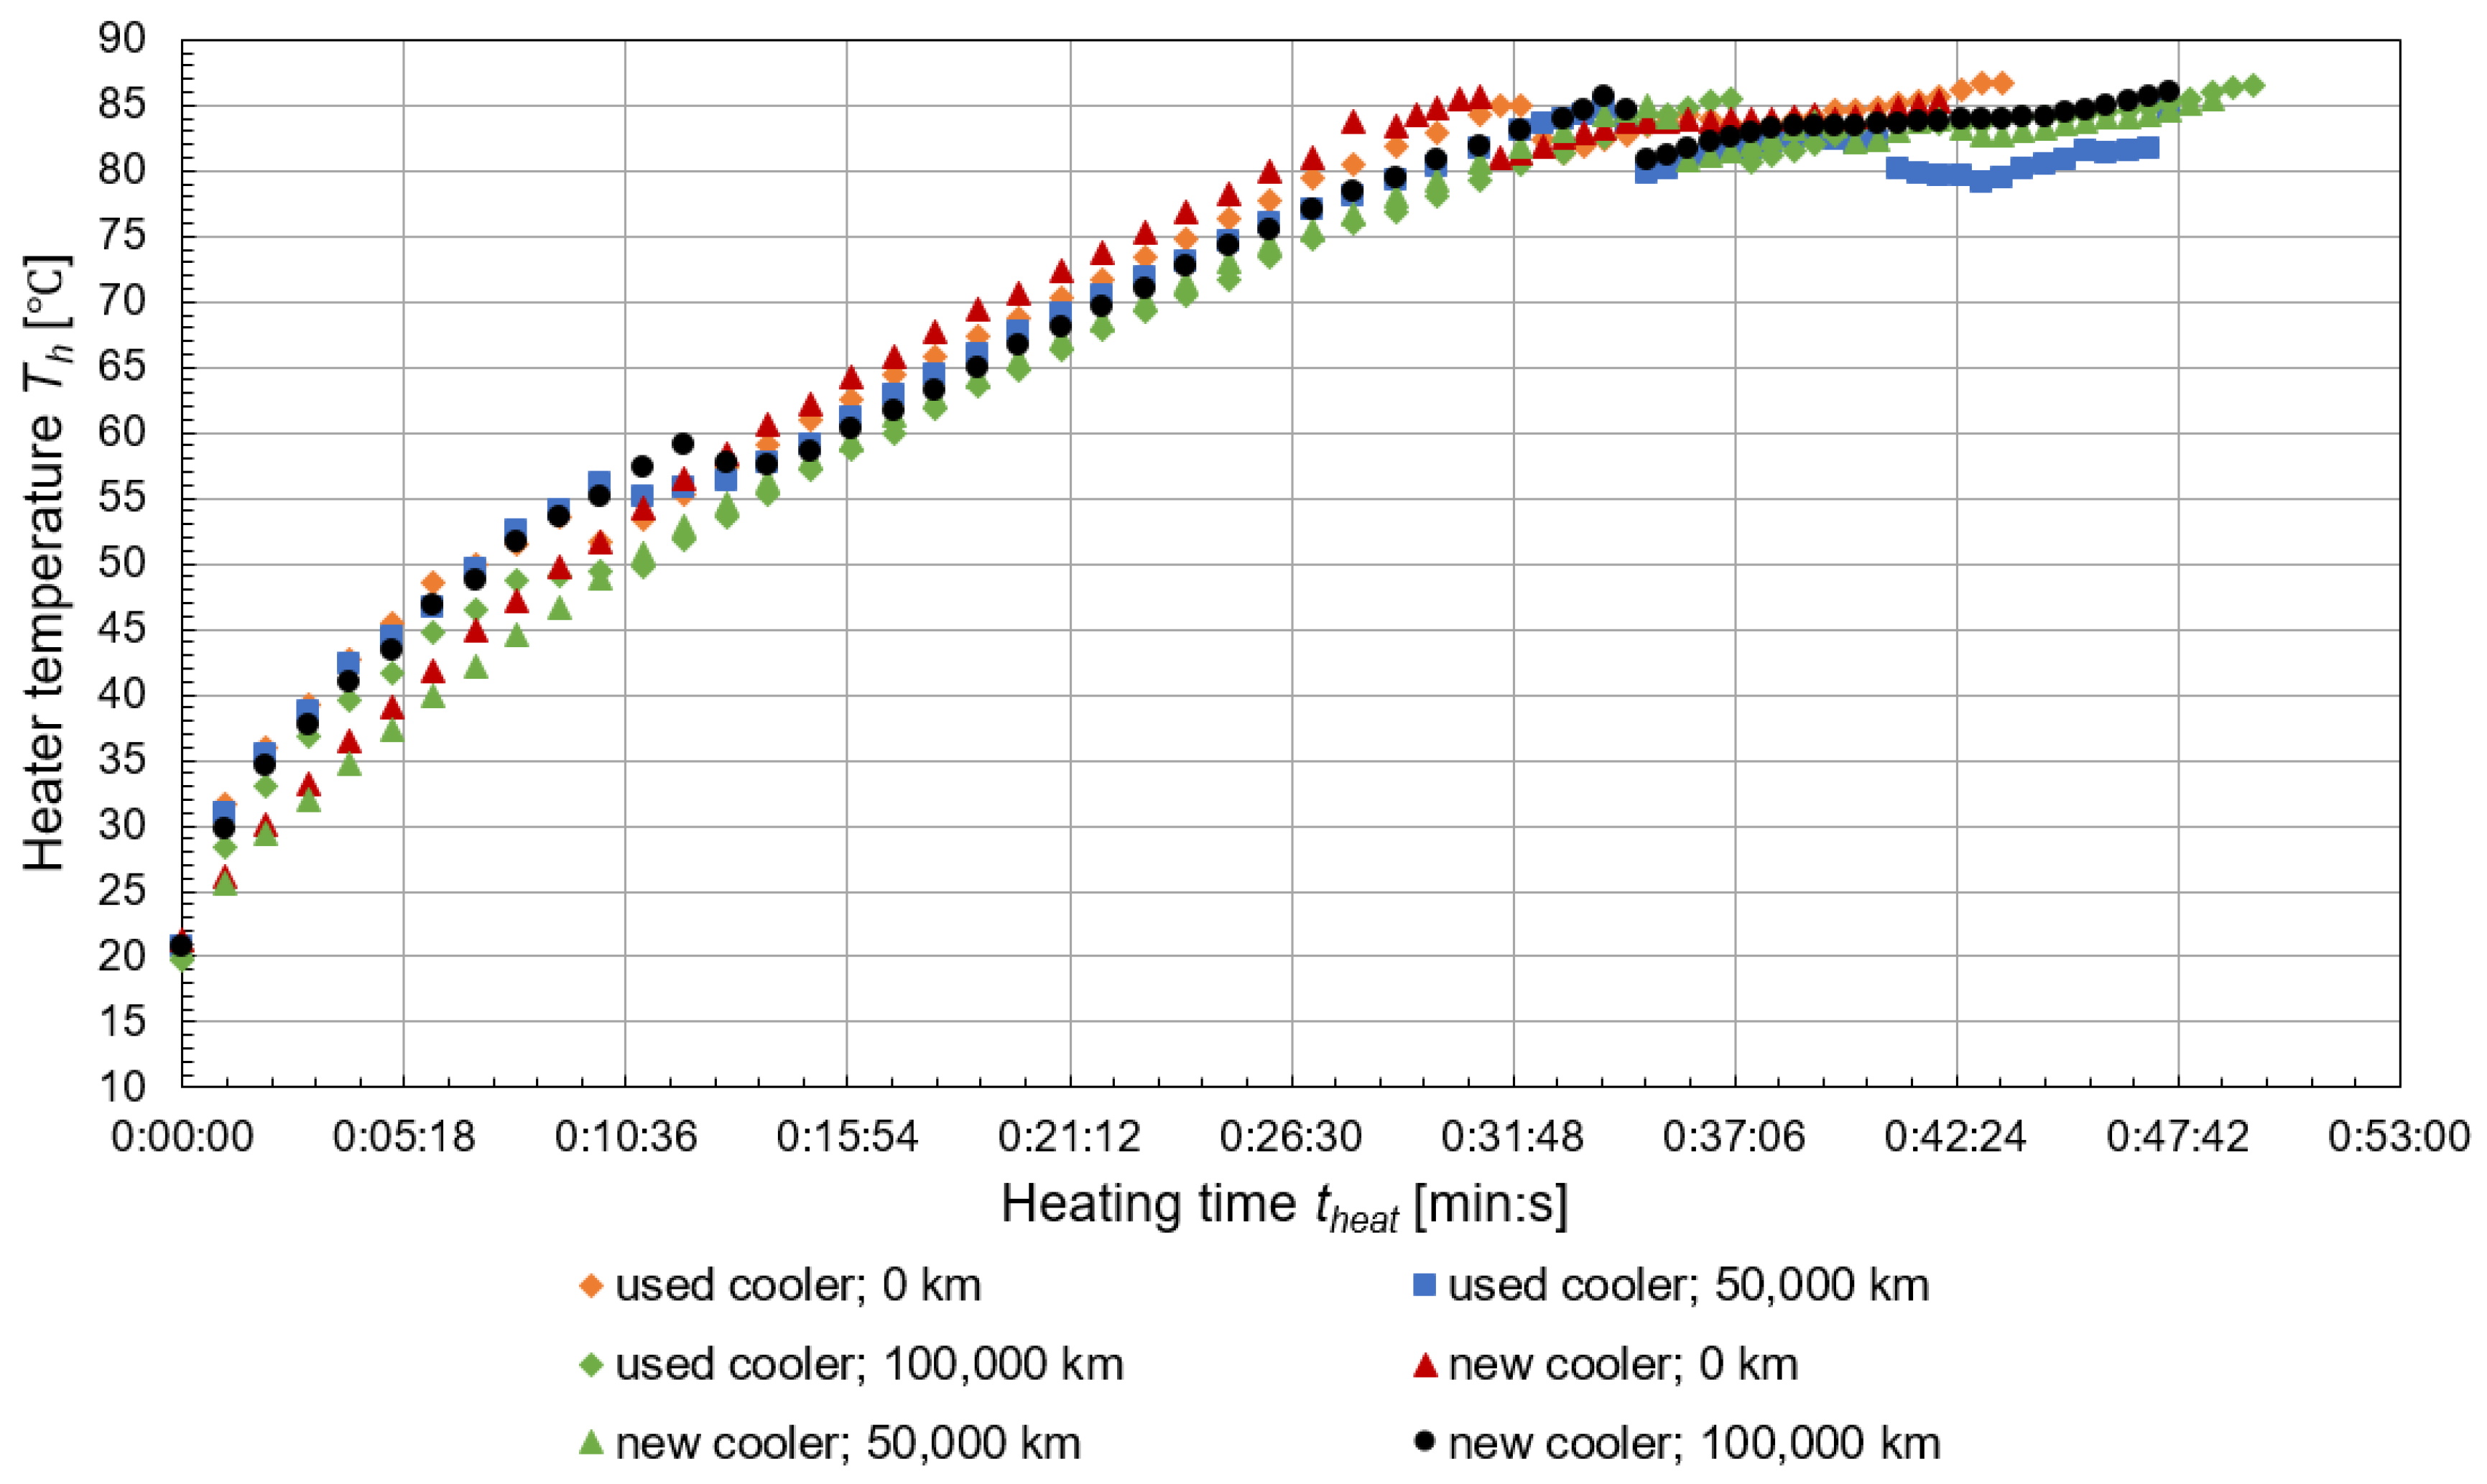
The temperature distribution of the heater Th when heating the coolant is shown in Figure 8. The rising curves represent the process of heating the coolant until the thermostat was opened. The coolant was continuously heated after reaching an operating temperature above 80 °C to create conditions consistent with realistic operating conditions. The slight fluctuation of the heater temperature around 80 °C was due to the correction of the operating temperature by draining part of the hot coolant volume into the cooler.
The values of heating time theat and thermostat temperature Tth at different thermostat positions were recorded for the cooler and coolant under study (Table 3). The first thermostat opening occurred when the coolants were heated to operating temperature (first opening), the full thermostat opening occurred at maximum coolant flow (full opening), and the thermostat closing occurred when the operating temperature dropped below 80 °C. The earliest first opening, full opening, and closing of the thermostat were achieved by the coolant with a mileage of 0 km and the new cooler. The latest first opening, full opening, and closing of the thermostat were achieved by the coolant with a mileage of 50,000 km and the new cooler, as well as the coolant with a mileage of 100,000 km and the used cooler. The used cooler with used coolants created conditions for longer warm-up due to impurities, the presence of oil in the coolant, and the corrosiveness of the cooler.
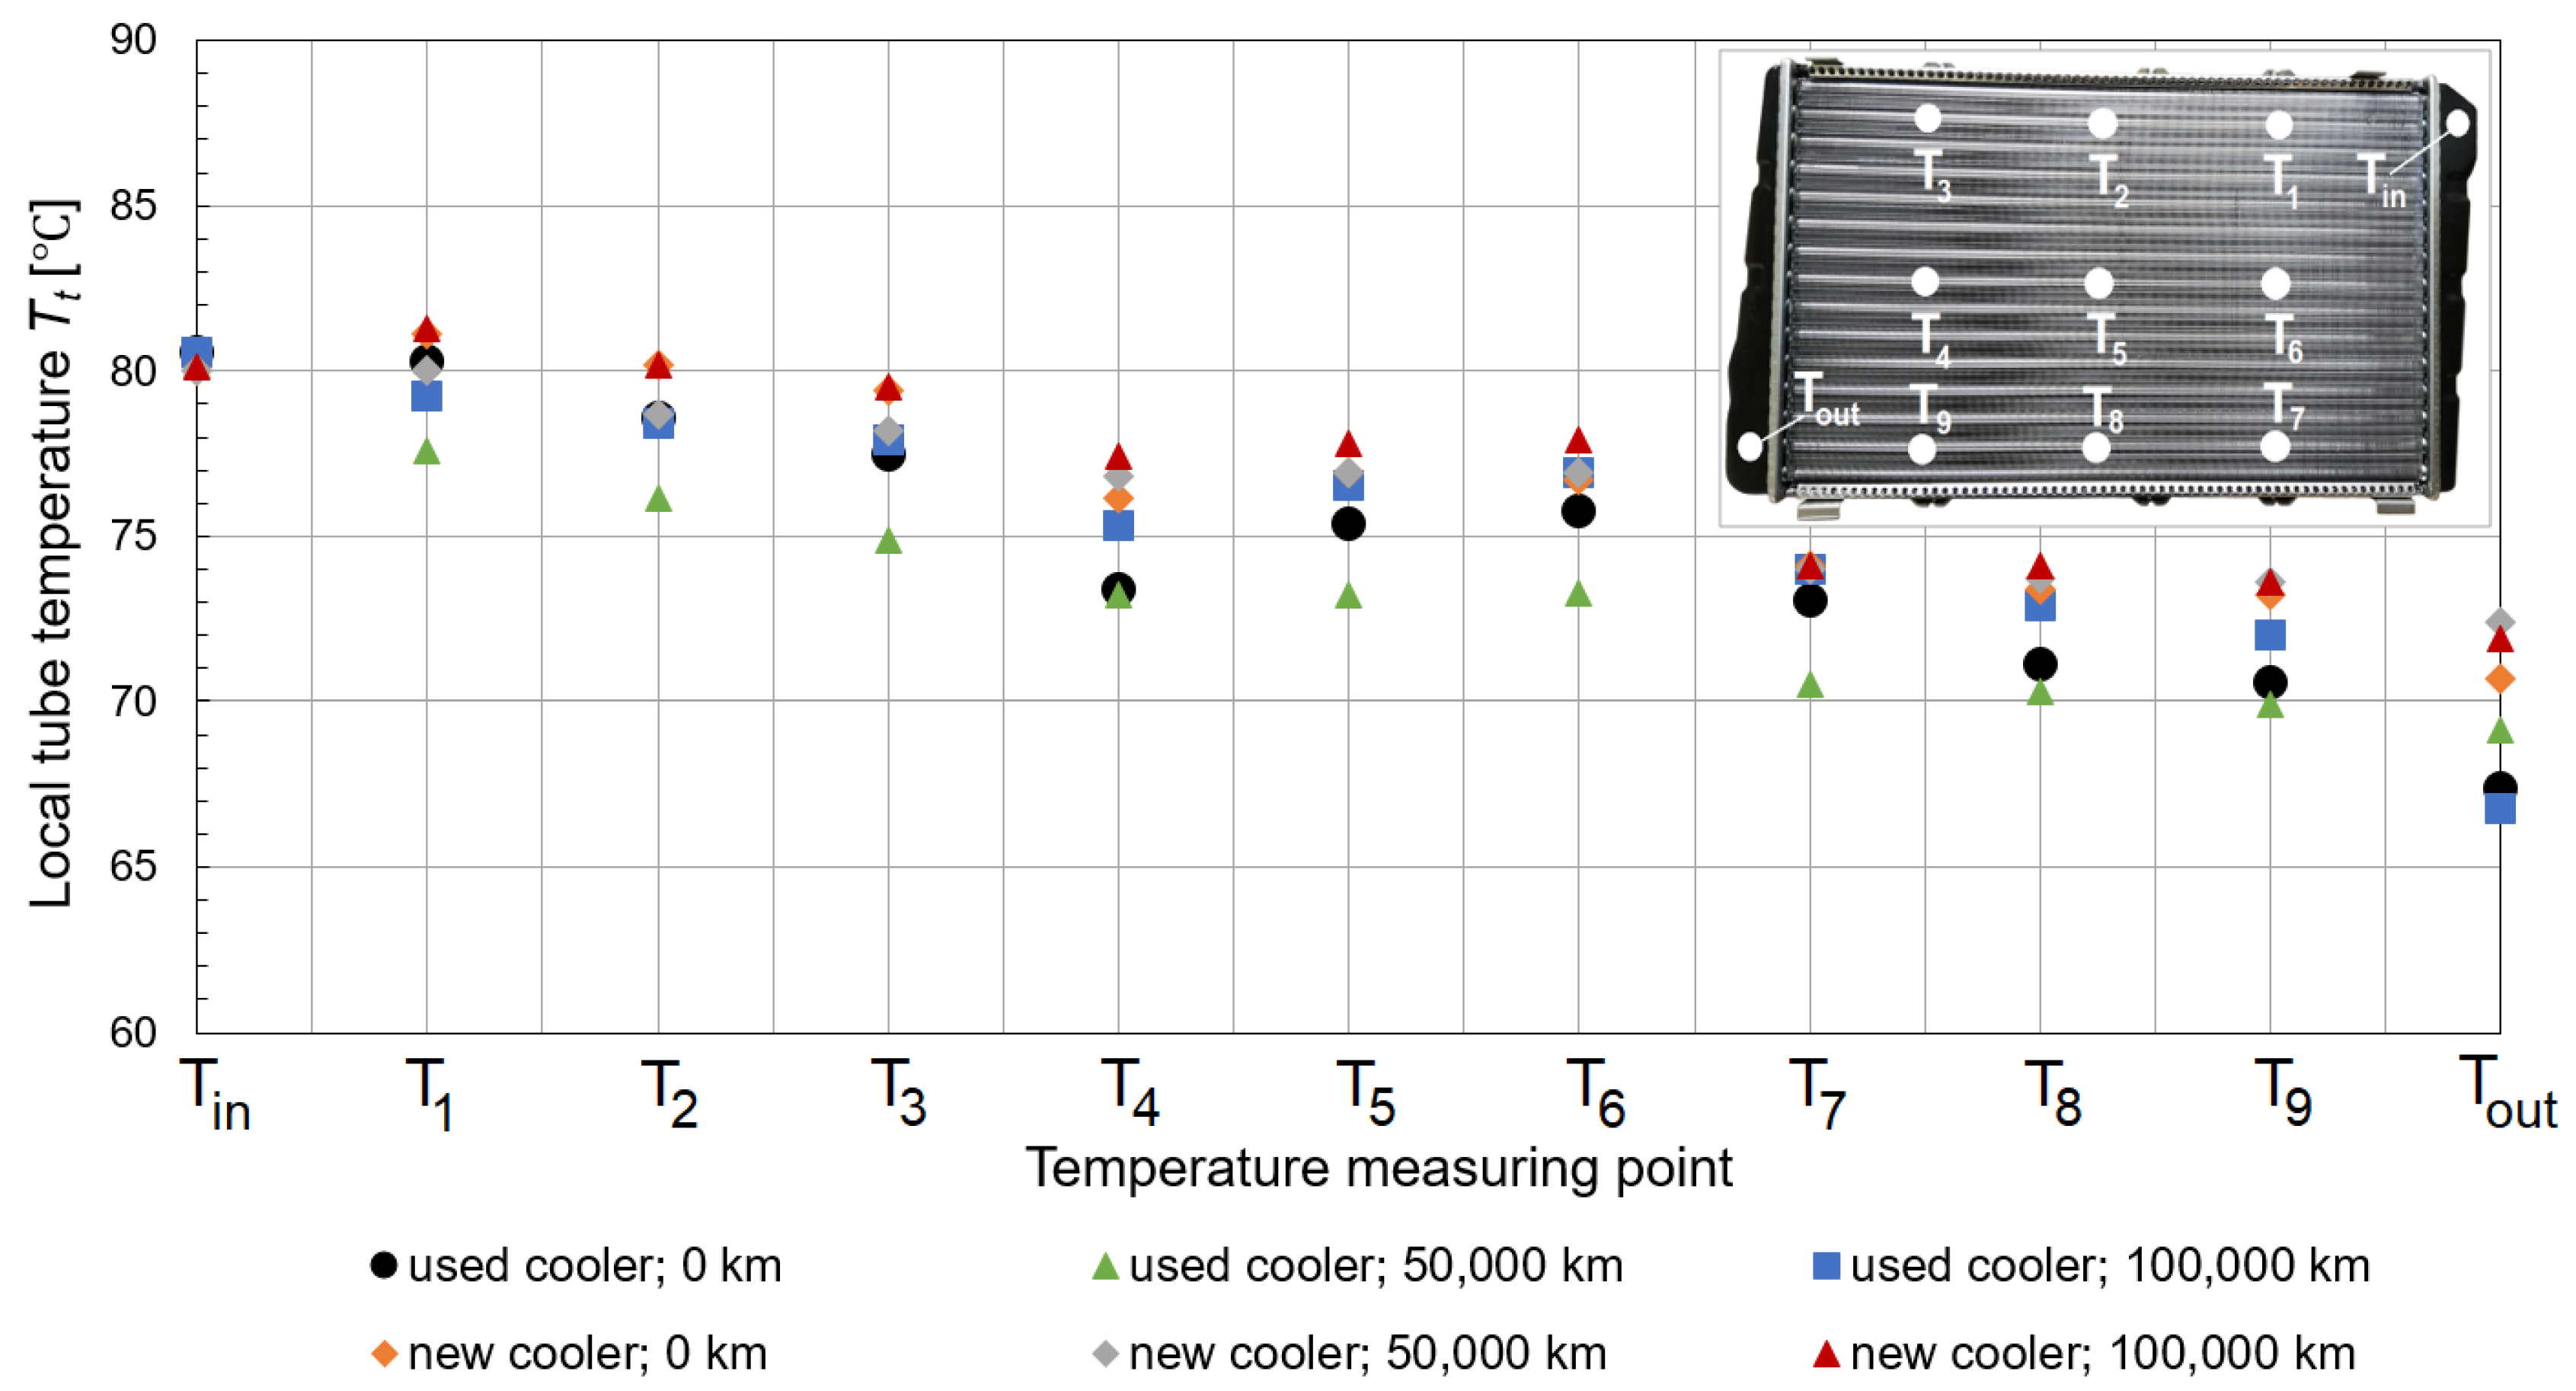
The local tube temperatures Tt at local points T1 to T9 and the inlet and outlet temperatures after the thermostat was fully opened and before the fan was started were recorded (Figure 9). The distribution of measurement points along the tubes was based on the direction of coolant flow (Figure 3). The new cooler and the used cooler with 0 km mileage of coolant flow maintained the highest temperature before the cooling process. This means that the new coolant (with a mileage of 0 km) maintained satisfactory physical properties for proper engine operation. On this basis, it can be concluded that coolant mileage is more important than cooler mileage. The combination of the used cooler and the used coolant further deteriorated the heat transfer properties of the coolant. Particularly in winter, it is necessary to maintain a suitable engine operating temperature.
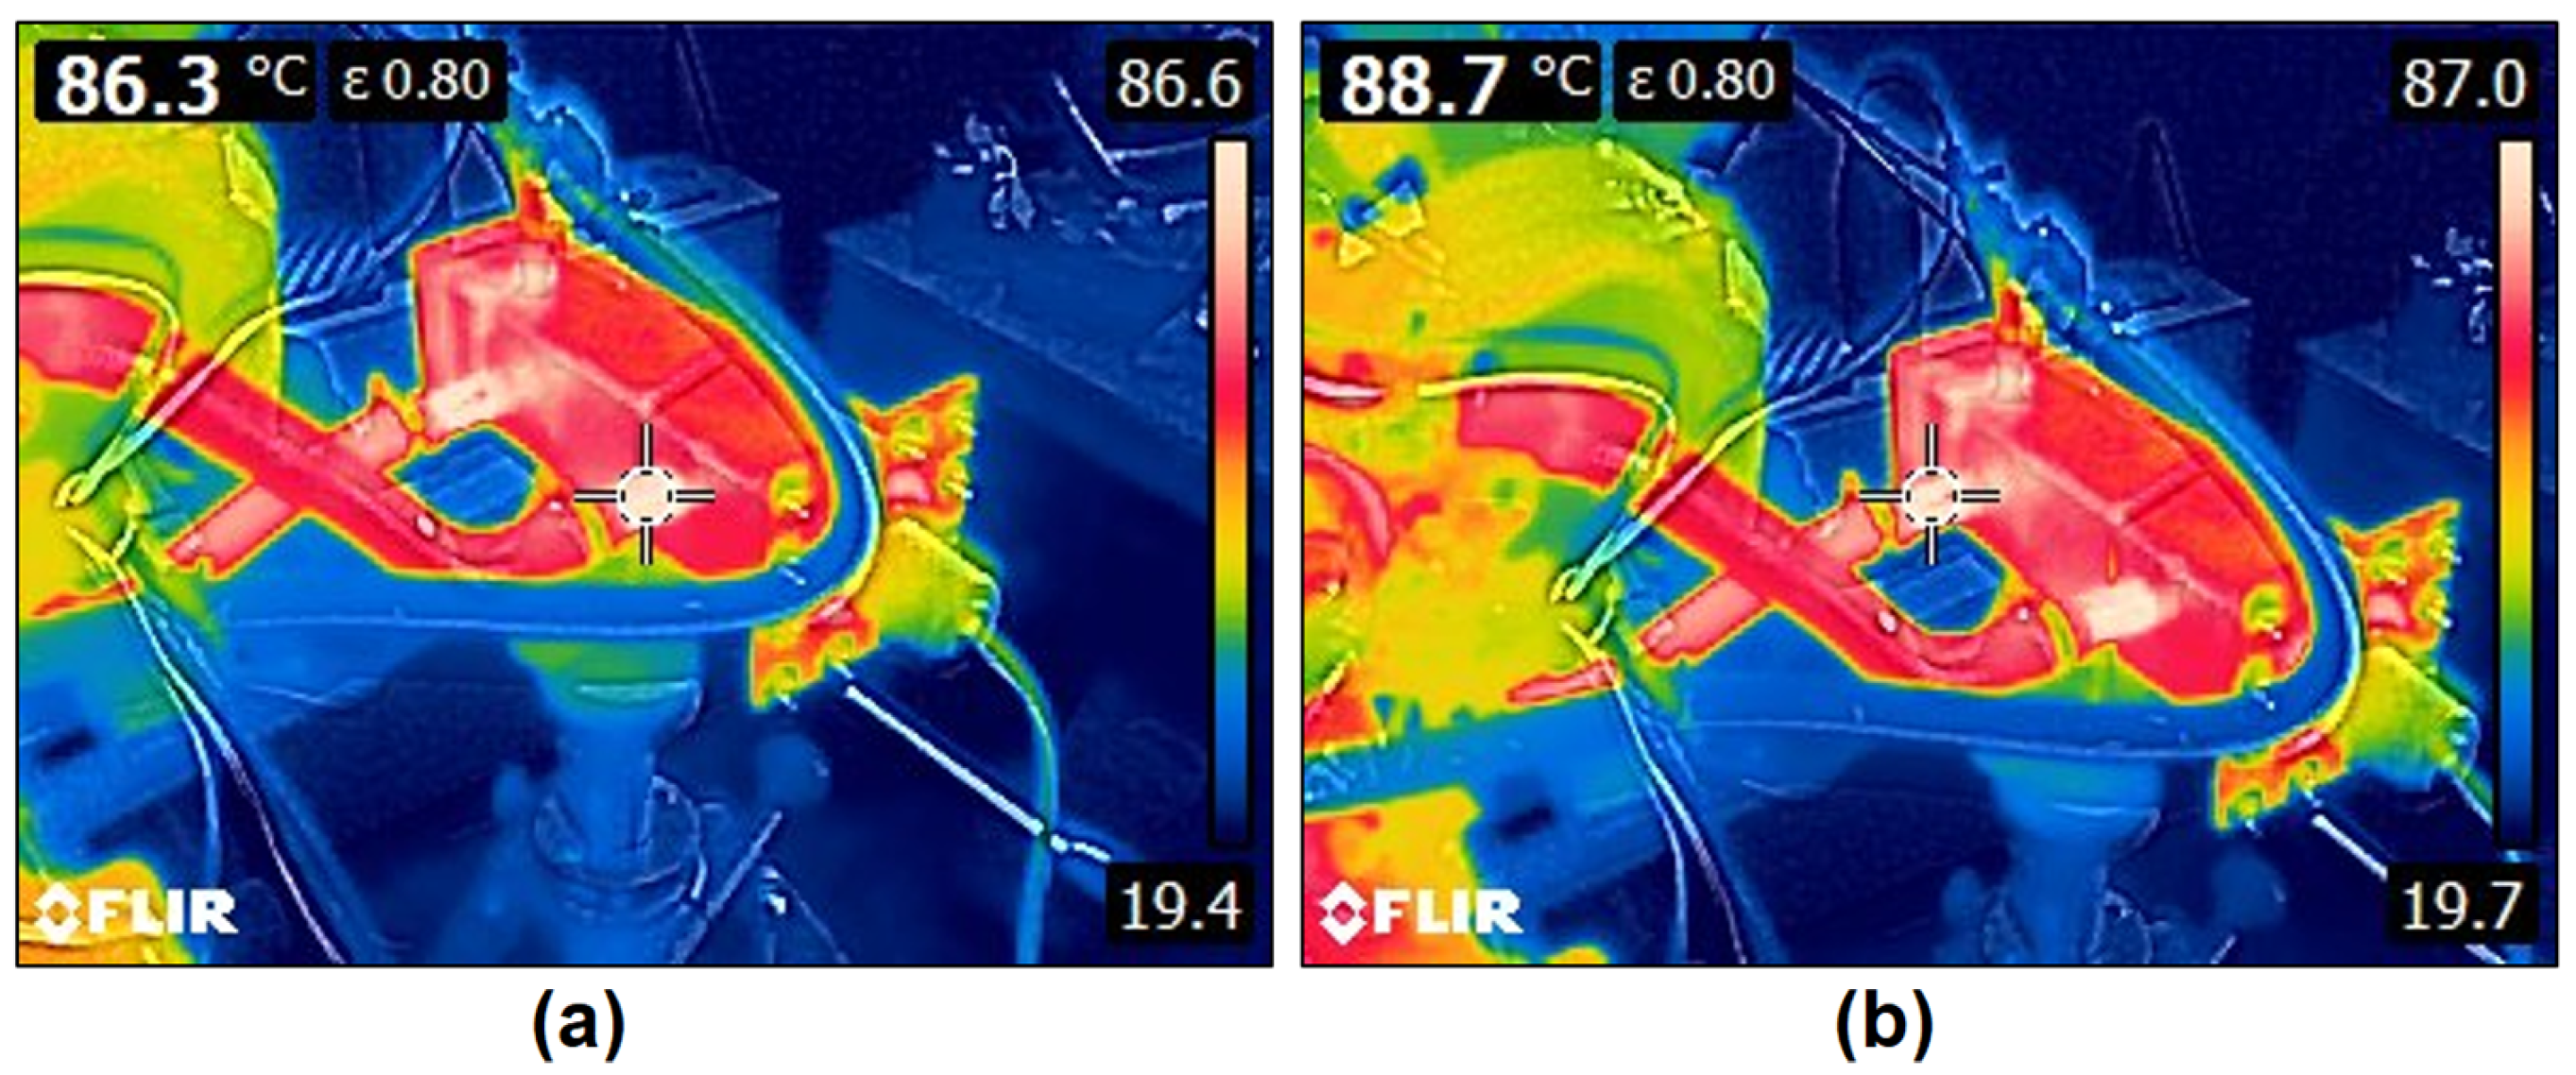
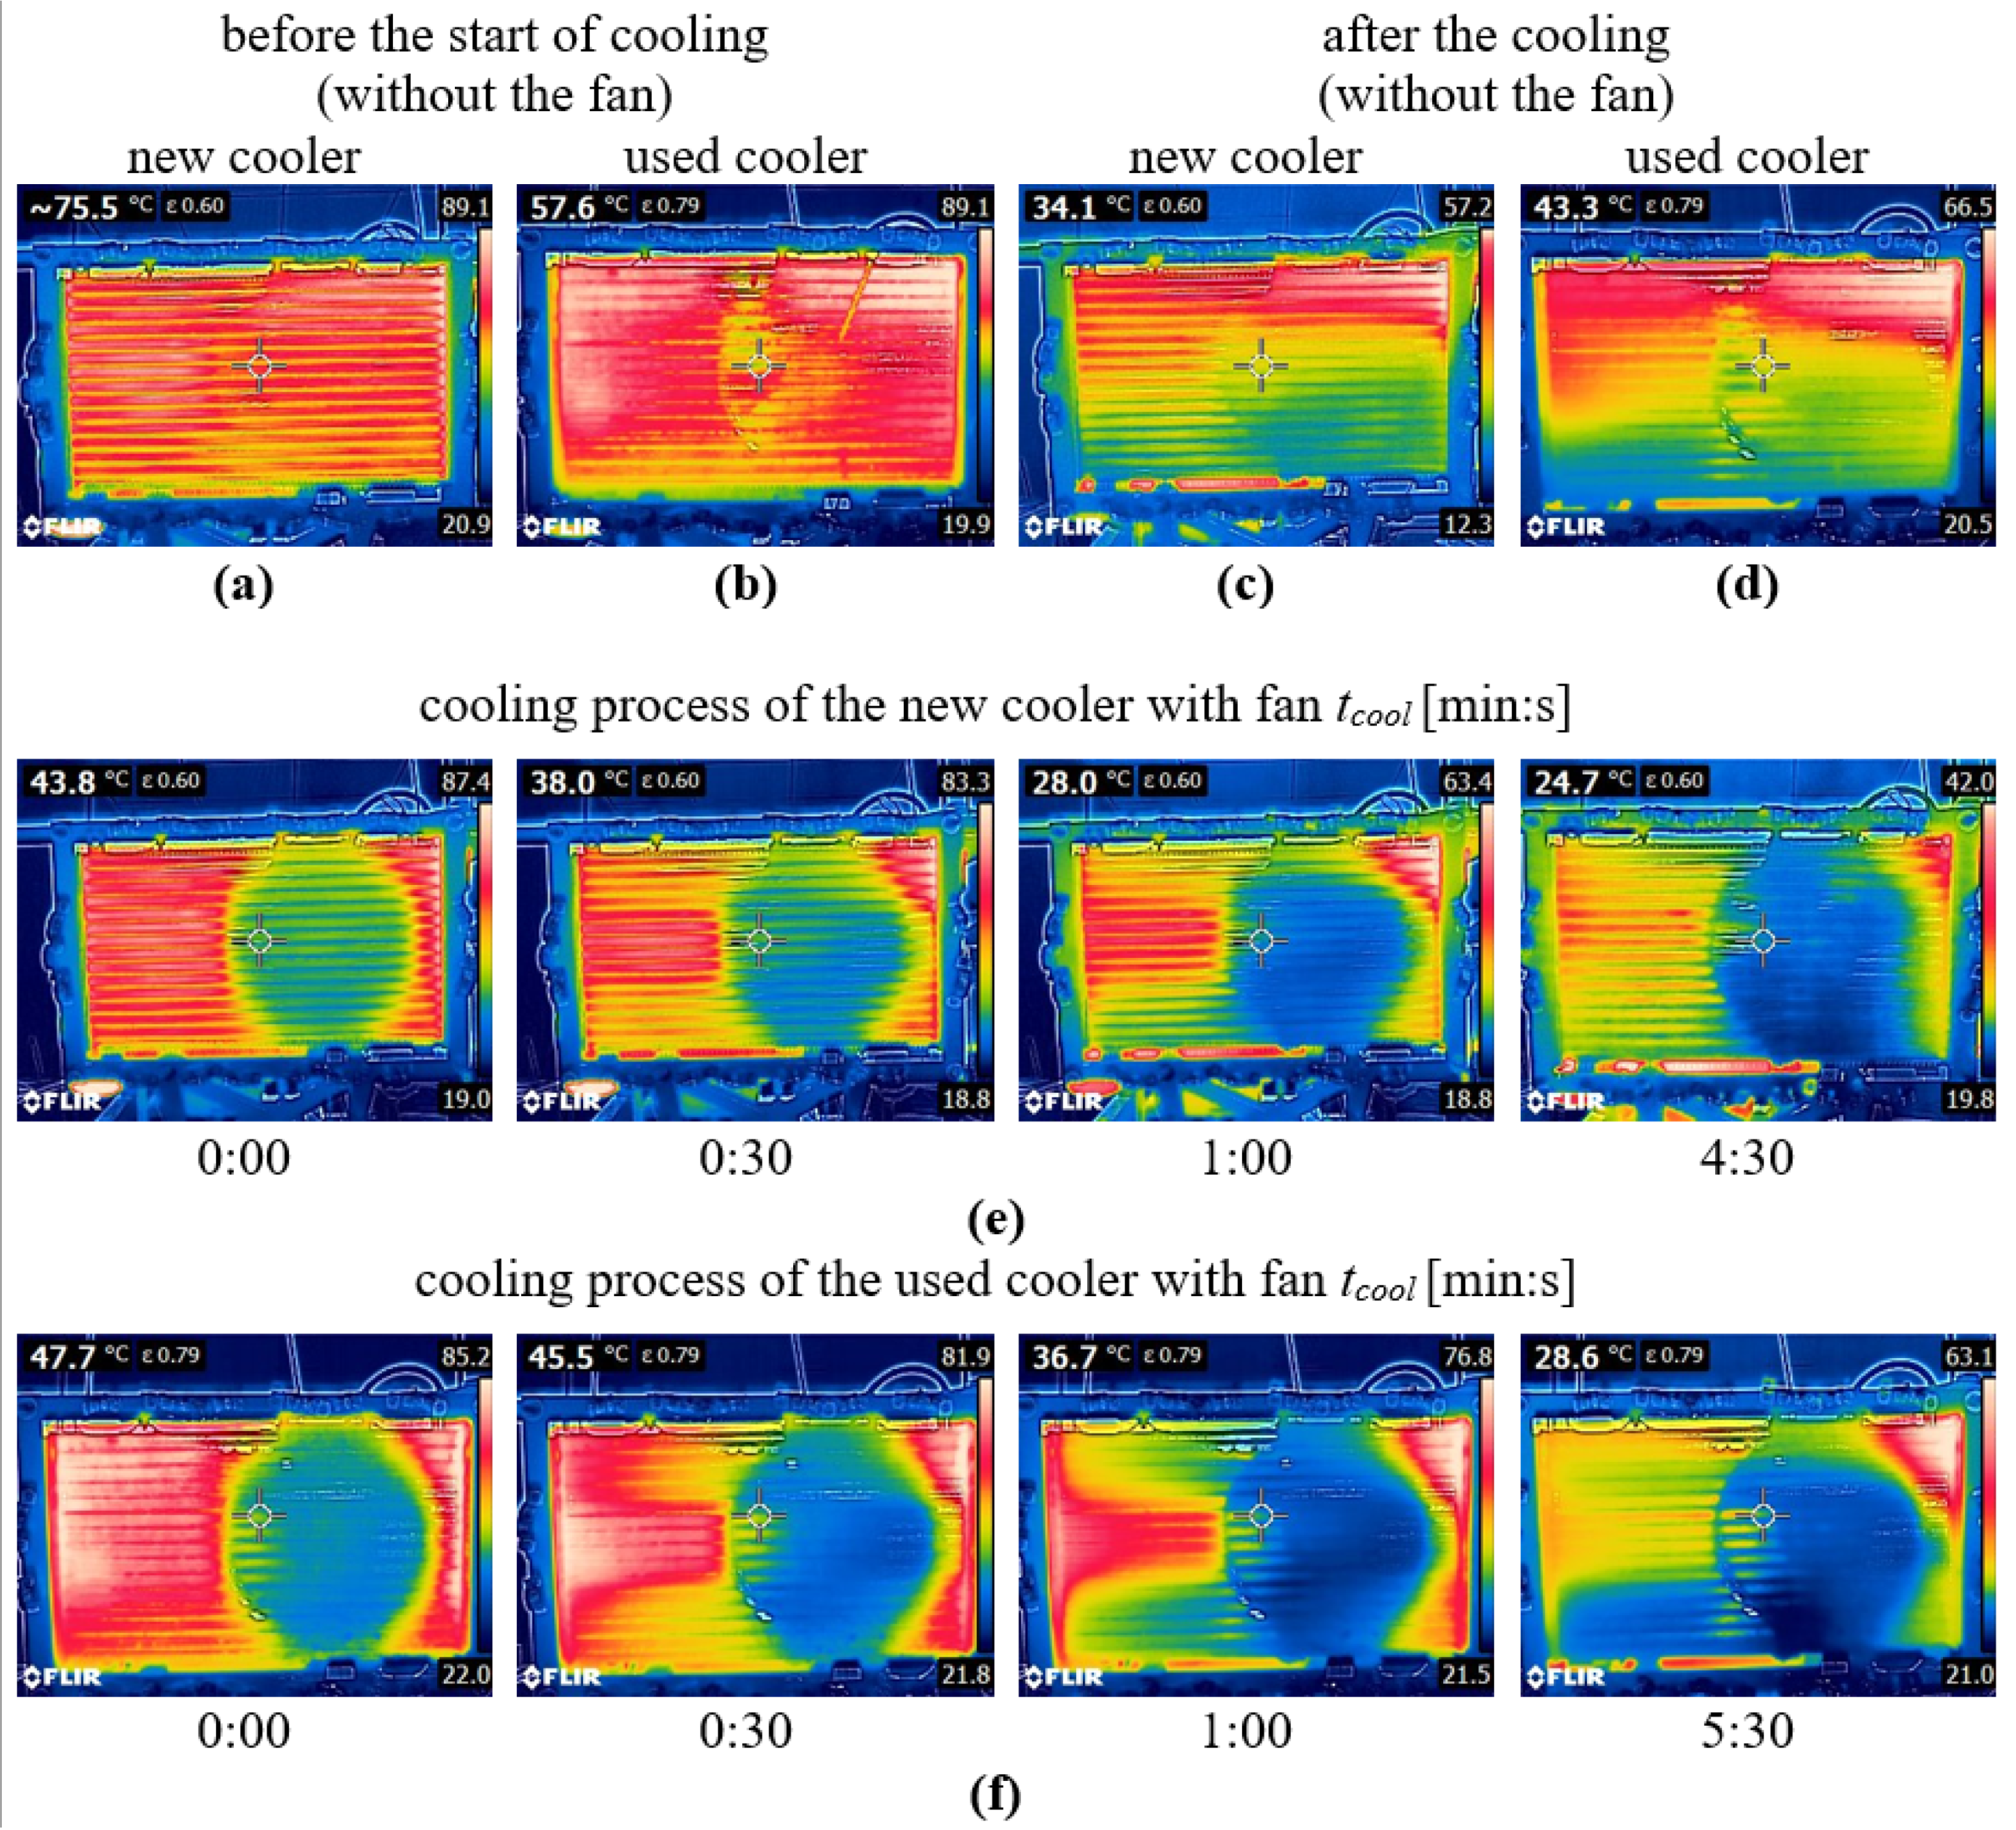
Thermal images of the new and used car coolers for coolant mileage of 0 km before the start of cooling, during coolant cooling, and after fan cooling were recorded (Figure 10). The emissivity of the thermal imaging camera was set to εs = 0.60 for the new cooler (polished metal surface) and εs = 0.79 for the used cooler (oxidized surface). To verify the correctness of the measurements, control measurements were first made using thermocouples in the sensed area and the emissivity adjusted according to the actual temperature in the sensed area according to a contact sensor.
Prior to the start of cooling of the new cooler, the temperature was uniformly distributed over the entire surface of the cooler (Figure 10a). At the inlet of the coolant into the first chamber of the five tubes (top right), a temperature above 80 °C and a gradual decrease in temperature in the direction of the coolant flow were observed. At the bottom of the cooler, the coolant temperature dropped to approximately 60 °C as a result of cooling through the tubes and fins of the cooler. Conversely, on the used cooler, there were visible areas of lower temperature (approximately 50 °C) where the fins were damaged or oxidised (Figure 10b). When the fan was started at cooling time 0, forced air convection cooling occurred immediately (Figure 10e). The area cooled most significantly by the fan is clearly visible in the thermal images, and the temperature in this area dropped between 20 °C and 40 °C. As the cooling time increased, the air flowing from the fan also affected the remaining surface of the cooler, especially its upper and lower surfaces. In these areas, the surface temperature dropped to 30 °C in a cooling time of 30 s and to 20 °C in a cooling time of 1 min. On further cooling, the flowing air affected the middle left part of the cooler even more effectively. The outlet temperature of the cooler dropped below 30 °C at a cooling time of 4 min and 30 s, at which time cooling was terminated (Figure 10e). Comparing the new cooler and the used cooler, it took 5 min and 30 s for the used cooler to cool to a cooler outlet temperature below 30 °C (Figure 10f). From the thermal images, it can be concluded that the local temperature during the cooling process of the new cooler was 3.9 °C to 8.7 °C lower compared to the used cooler. This means that the new cooler achieves a more efficient cooling process of the new coolant compared to the used cooler with 100,000 km of mileage. When the fan is switched off, a more pronounced cooling of the lower part of the cooler can be observed, while hot coolant is again entering the upper inlet chamber (Figure 10c,d). Even after the cooling, the used cooler reached a local temperature 9.3 °C higher compared to the new cooler.
The thermal performance of the new cooler and the used cooler at the start and the end of coolant cooling with different mileages was calculated according to Equations (1) and (2). The measured and calculated values of inlet and outlet coolant temperature, current, and maximum heat transfer rate are included in the calculation and are shown in Table 4. The correct cooling process is also indicated by the increasing temperature differences ΔT of the coolant at the inlet and outlet of the cooler, ranging from 7.7 °C to 13.8 °C at the start of the cooling process and from 34.2 °C to 38.5 °C at the end of the cooling process. At the start of cooling, the examined coolers and coolants achieved a thermal performance η in the range of 0.127 to 0.228. At the end of the cooling, the thermal performance increased by 3.43 times to 6.09 times to values in the range of 0.773 to 0.790. The maximum thermal performance of 0.228 and 0.790 at the start and the end of cooling was achieved for the new cooler with new coolant (0 km mileage). The used cooler with new coolant only achieved a 1.1-time decrease compared to the new cooler and new coolant at the start of cooling. Similar results for the mentioned comparison were also achieved at the end of cooling—a one-time decrease in thermal performance of the used cooler and new coolant. The coolant with 50,000 km mileage achieved a 1.80- and 1.68-time decrease for the new and used cooler at the start of cooling, and 1.02 times decrease for the new and used cooler at the end of cooling compared to the new cooler (0 km mileage). The coolant with mileage of 100,000 km reached a decrease of 1.47 and 1.24 times for the new and used cooler at the start of cooling, and 1.02 and 1.01 times for the new and used cooler at the end of cooling compared to the new cooler (0 km mileage).
From the results, it can be concluded that the used cooler with a mileage of 100,000 km does not have a significant effect on thermal performance and the correct cooling process. The used coolants with 50,000 km and 100,000 km mileage also do not achieve significant differences compared to the new cooler and the new coolant.

4. Conclusions

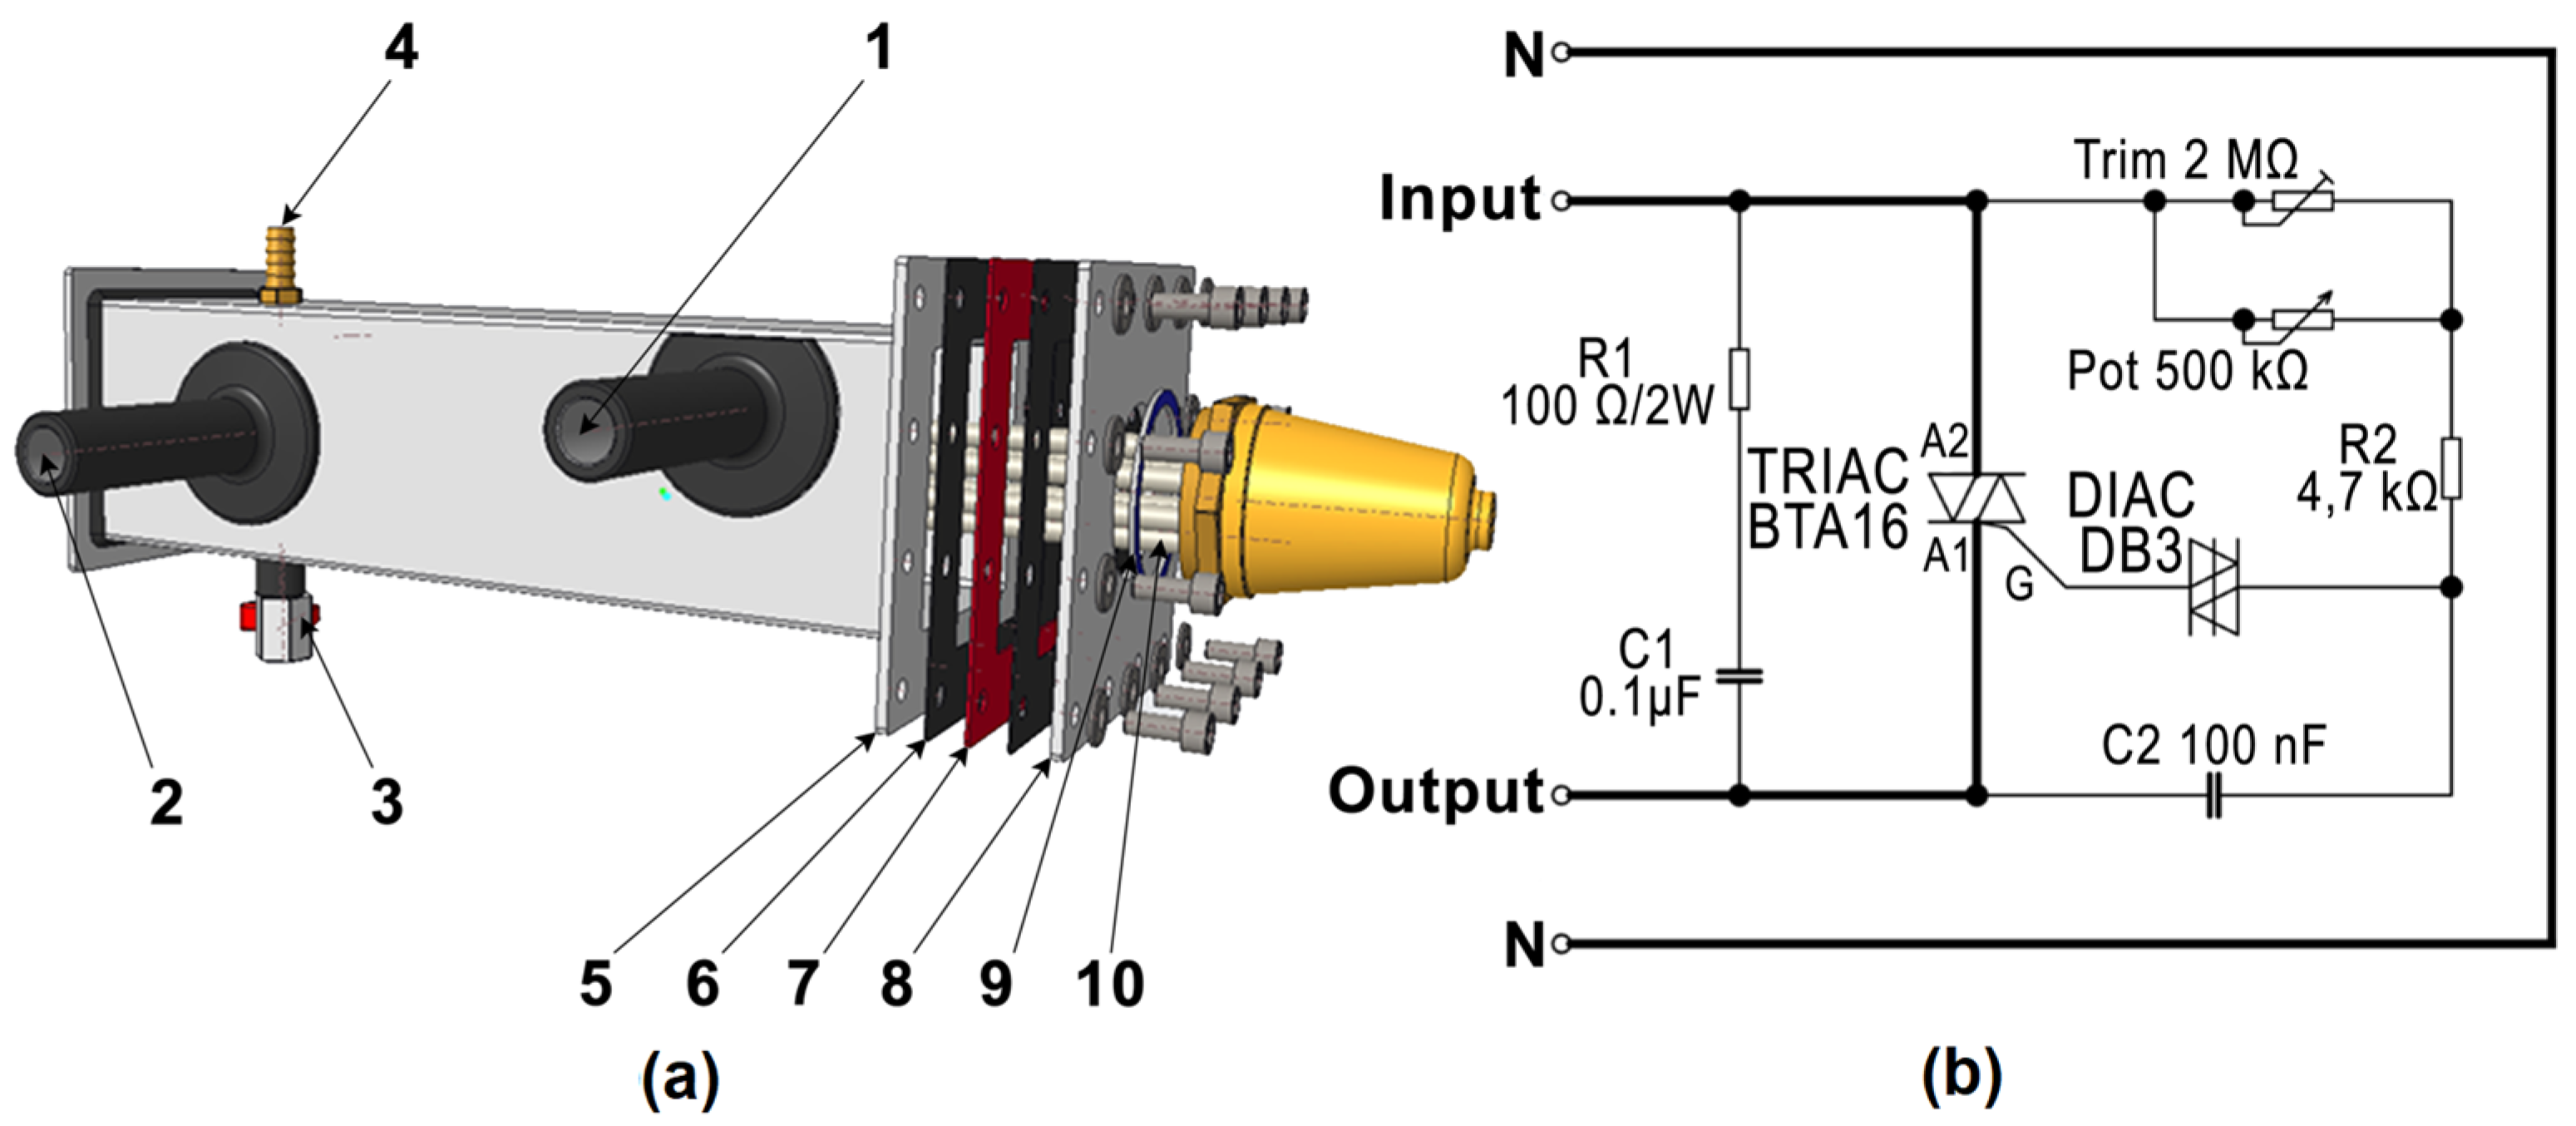
The effect of the cooler and coolant mileage on the cooler thermal performance was investigated in laboratory conditions. A novelty heater design was constructed to heat the coolant. Coolant based on water and ethylene glycol G12+ (50:50) was investigated in terms of the mileages of 0 km, 50,000 km, and 100,000 km. The new cooler with 0 km mileage was compared with the used cooler with 100,000 km mileage. The coolant inlet and outlet temperatures in the cooler, heater and thermostat temperatures, temperature distribution on the surface of the cooler, coolant flow rate, and temperature and velocity of the air were experimentally recorded.
In terms of heating time, the coolant with 0 km mileage in the new cooler took the shortest time to heat up (41 min and 30 s), and, conversely, the coolant with 100,000 km mileage in the used cooler (100,000 km mileage) took the longest time to heat up (49 min and 30 s). Reaching operating temperature earlier leads to more efficient engine operation and lower fuel consumption and pollution. The new cooler and used cooler with 0 km mileage of coolant maintained the highest local tube temperatures prior to the cooling process. This means that the new coolant retains satisfactory physical properties for correct engine operation. In terms of cooling time, the new cooler and coolant with 0 km mileage cooled the fastest (4 min and 30 s), while the new cooler and coolant with 50,000 km mileage cooled the slowest (8 min). A faster cooling process is especially necessary in summer and when the vehicle’s engine is subjected to higher demands.
The new coolant in the new cooler achieved the shortest heating time and cooling time and the highest values of thermal performance at the start and end of cooling, η = 0.228 and η = 0.790, respectively. The used cooler with new coolant achieved only a one-time decrease compared to the new cooler and new coolant at the end of cooling. The coolant with 50,000 km mileage achieved a 1.02-time decrease for the new and used cooler at the end of the cooling compared to the new cooler. The coolant with a mileage of 100,000 km reached a decrease of 1.02 and 1.01 times for the new and used cooler, respectively, at the end of cooling compared to the new cooler. The coolant and cooler with higher mileage have no significant effect on the thermal performance of the cooler and the proper cooling function of the car engine. The correct heat transfer properties of the coolant are maintained, and the cooling process continues to run properly even after several years of mileage. Finally, it should be noted that the use of coolants is only possible if they are not contaminated with engine oils.
If the internal combustion engine is in good condition and there is no oil leakage into the cooling circuit or, in the event of a leak, the entry of impurities from the external environment, the cooling mixture stably maintains its heat exchange properties and protects the cooling circuit against corrosion and the formation of deposits. In the case of a slightly degraded heat exchange surface of the car cooler, on which dust and insects are accumulated, of which the fins are oxidized and defective, although the efficiency of the cooling process is reduced, the car cooler is still able to safely dissipate excess heat and keep the engine running. We see potential for further research in the study of other types of engine coolers and coolant mixtures (e.g., tubes arranged inline and staggered, different geometrical parameters, the use of nanofluids as coolants with different mileage), use of a thermostat with opening at a temperature of more than 80 °C, and the corrosion and fouling of internal and external heat exchange surfaces.

Author Contributions

Conceptualization, Z.B.; methodology, Z.B.; formal analysis, M.L.; investigation, M.L.; resources, M.L.; data curation, M.L.; writing—original draft preparation, Z.B.; writing—review and editing, M.L.; supervision, Z.B.; project administration, Z.B. All authors have read and agreed to the published version of the manuscript.

Funding

The paper was written based on the research intention and solution of the research grant project “Progressive Research into Utility Properties of Materials and Products Based on Wood (LignoPro)”, ITMS 313011T720, supported by the Operational Programme Integrated Infrastructure (OPII), funded by the ERDF.

Data Availability Statement

Not applicable.

Conflicts of Interest

The authors declare no conflict of interest.

References

  1. Gollin, M.; Bjork, D. Comparative Performance of Ethylene Glycol/Water and Propylene Glycol/Water Coolants in Automobile Radiators. SAE Tech. Pap. 1996, 960372, 115–123. [Google Scholar]
  2. Huang, Y.; Chen, J.; Li, M.; Zhang, B.; Zhang, L. Comparative Study on the Performance of Flat Tube Type and Wasp-Waisted Tube Type Radiators. Int. J. Heat Technol. 2016, 34, 647–652. [Google Scholar]
  3. Patil, V.R.; Patil, S.S.; Kumbhar, V.; Kolhe, K. Review of Problems of Heat Transfer in Car Radiator and Suggested Solutions. Int. J. Sci. Dev. Res. 2017, 2, 94–98. [Google Scholar]
  4. Weir, T.W.; Greaney, J.P. Comparison of Extended Life Coolants in Laboratory Testing. SAE Tech. Pap. 1997, 971803, 314–319. [Google Scholar]
  5. Greaney, P.J.; Cozzone, E. Comparative Performance of Aqueous Propylene Glycol and Aqueous Ethylene Glycol Coolants; SAE Technical Paper 1999-01-0134; SAE: Warrendale, PA, USA, 1999; pp. 1–6. [Google Scholar]
  6. Cozzone, G. Effect of Coolant Type on Engine Operating Temperatures; SAE Technical Paper 1999-01-0135; SAE: Warrendale, PA, USA, 1999; pp. 1–6. [Google Scholar]
  7. Rebsdat, S.; Mayer, D. Ethylene glycol. Ullmann’s Encycl. Ind. Chem. 2012, 13, 531–546. [Google Scholar]
  8. Lee, G. Multi-Disciplinary Analysis of Working Fluids on Thermal Performance of the High-Power Diesel Engine System. Machines 2022, 10, 1023. [Google Scholar] [CrossRef]
  9. Jedliński, R. Endoscopy and thermography in the process of maintenance of automotive vehicles. J. Pol. CIMAC 2007, 2, 203–210. [Google Scholar]
  10. Styla, S.; Pietrzyk, W. The identification of operational failures of the heating, ventilation and air-conditioning circuit in the car by means of thermovision methods. Teka Comm. Mot. Power Ind. Agric. 2011, 11, 354–362. [Google Scholar]
  11. Bougeard, D. Infrared thermography investigation of local heat transfer in a plate fin and two-tube rows assembly. Int. J. Heat Fluid Flow 2007, 28, 988–1002. [Google Scholar]
  12. Ay, H.; Jang, J.; Yeh, J. Local heat transfer measurements of plate finned-tube heat exchanger by infrared thermography. Int. J. Heat Mass Transf. 2002, 45, 4069–4078. [Google Scholar] [CrossRef]
  13. Lin, Ch.; Jang, J. Conjugate heat transfer and fluid flow analysis in fin-tube heat exchanger with wave-type vortex generators. J. Enhanc. Heat Transf. 2002, 9, 123–136. [Google Scholar]
  14. Wei, Y.; Agelin-Chaab, M. Development and experimental analysis of a hybrid cooling concept for electric vehicle battery packs. J. Energy Storage 2019, 25, 100906. [Google Scholar] [CrossRef]
  15. Mraz, K.; Bartuli, E.; Kroulikova, T.; Astrouski, I.; Resl, O.; Vancura, J.; Kudelova, T. Case study of liquid cooling of automotive headlights with hollow fiber heat exchanger. Case Stud. Therm. Eng. 2021, 28, 101689. [Google Scholar] [CrossRef]
  16. Hussein, A.M.; Bakar, R.A.; Kadirgama, K. Heat transfer augmentation of a car radiator using nanofluids. Heat Mass Transf. 2014, 50, 1553–1561. [Google Scholar] [CrossRef]
  17. Ali, H.M.; Ali, H.; Liaquat, H.; Maqsood, H.T.B.; Nadir, M.A. Experimental Investigation of Convective Heat Transfer Augmentation of Car Radiator Using ZnO-Water Nanofluids. Energy 2015, 84, 317–324. [Google Scholar]
  18. Heris, S.Z.; Shokrgozar, M.; Poorpharhang, S.; Shanbedi, M.; Noie, S.H. Experimental Study of Heat Transfer of a Car Radiator with CuO/Ethylene Glycol-Water as a Coolant. J. Dispers. Sci. Technol. 2014, 35, 677–684. [Google Scholar]
  19. Ramadhan, A.I.; Azmi, W.H.; Mamat, R. Heat transfer characteristics of car radiator using trihybrid nanocoolant. Mater. Sci. Eng. 2020, 863, 012054. [Google Scholar]
  20. Engineering ToolBox. Ethylene Glycol Heat-Transfer Fluid Properties. Available online: https://www.engineeringtoolbox.com/ethylene-glycol-d_146.html (accessed on 11 December 2022).
  21. Tuncer, A.D.; Sözen, A.; Khanlari, A.; Gürbüz, E.Y.; Variyenli, H.I. Analysis of thermal performance of an improved shell and helically coiled heat exchanger. Appl. Therm. Eng. 2021, 184, 116272. [Google Scholar]
  22. Wang, T.T. Investigation of Advanced Engine Cooling Systems—Optimalization and Nonlinear Control. Ph.D. Dissertation, Clemson University, Clemson, SC, USA, 2016. [Google Scholar]
  23. Yadav, J.P.; Singh, B.R. Study on performance evaluation of automotive radiator. Samriddhi—J. Phys. Sci. Eng. Technol. 2011, 2, 47–56. [Google Scholar] [CrossRef]
  24. Hoseini, S.M.; Jamnani, M.S.; Peyghambarzadeh, S.M.; Hashemabadi, S.H. Experimental Study of Water and Ethylene Glycol Mixture Heat Transfer in the Automobile Radiator. In Proceedings of the 13th Iranian National Chemical Engineering Congress and 1st International Regional Chemical and Petroleum Engineering, Kermanshah, Iran, 25–28 October 2010. [Google Scholar]
  25. Peyghambarzadeh, S.M.; Hashemabadi, S.H.; Nakari, M.; Vermahmoudi, Y. Experimental study of overall heat transfer coefficient in the application of dilute nanofluids in the car radiator. Appl. Therm. Eng. 2013, 52, 8–16. [Google Scholar] [CrossRef]
  26. Goudarzi, K.; Jamali, H. Heat transfer enhancement of Al2O3-EG nanofluid a car radiator with wire coil inserts. Appl. Therm. Eng. 2017, 118, 510–517. [Google Scholar]
  27. Vasudevan Nambesan, K.P.; Parthiban, R.; Ram Kumar, K.; Athul, U.R.; Vivek, M.; Thirumalini, S. Experimental study of heat transfer enhancement in automobile radiator using Al2O3/water-ethylene glycol nanofluid coolants. Int. J. Automot. Mech. Eng. 2015, 12, 2857–2865. [Google Scholar] [CrossRef]
  28. Subhedar, D.G.; Ramani, B.M.; Gupta, A. Experimental investigation of heat transfer potential of Al2O3/Water-Mono Ethylene Glycol nanofluids as a car radiator coolant. Case Stud. Therm. Eng. 2018, 11, 26–34. [Google Scholar] [CrossRef]
  29. Khan, A.; Ali, H.M.; Nazir, R.; Ali, R.; Munir, A.; Ahmad, B.; Ahmad, Z. Experimental investigation of enhanced heat transfer of a car radiator using ZnO nanoparticles in H2O-ethylene glycol mixture. J. Therm. Anal. Calorim. 2019, 138, 3007–3021. [Google Scholar] [CrossRef]
Figure 1. Experimental setup of the engine cooling circuit in the laboratory. 1—cooler with fan, 2—engine block of Škoda Felicia 1.3 MPI (50 kW) with water pump, 3—expansion tank, 4—heater, 5—thermostat, 6—electric motor.
Machines 11 00255 g001
Figure 2. Experimental setup of the cooling circuit and car coolers investigated. 1—car cooler with fan, 2—cooler quick coupler, 3—engine block, 4—water pump, 5—thermostat, 6—expansion tank, 7—heater, a—coolant flow from the cooler to the water pump and engine block, b—coolant flow from the thermostat to the cooler, c—coolant flow from thermostat to the heater, d—heated coolant flow from the heater to the water pump and engine block, e—coolant flow from the thermostat to the expansion tank, Tin—coolant temperature sensor at the cooler inlet, Tout—coolant temperature sensor at the cooler outlet, Tth—coolant temperature sensor in the thermostat, Th—coolant temperature sensor in the heater.
Machines 11 00255 g002
Figure 3. Basic dimensions of the Škoda Felicia cooler and direction of coolant flow (dimensions are in mm).
Machines 11 00255 g003
Figure 4. Coolant heater. (a) Main parts, (b) electrical wiring diagram. 1—nozzle for the coolant inlet, 2—nozzle for the heated coolant outlet, 3—drain valve, 4—vent valve, 5—flange, 6—sealant, 7—sealing paper, 8—lid, 9—O-ring, 10—heater coil.
Machines 11 00255 g004
Figure 5. Coolant thermal images of the heater during coolant heating. (a) Recording the surface temperature of the inlet nozzle; (b) recording the surface temperature of the outlet nozzle.
Machines 11 00255 g005
Figure 6. Comparison of the coolant heating time of the new cooler and the used cooler when changing the mileage of the coolant.
Machines 11 00255 g006
Figure 7. Comparison of the coolant cooling time of the new cooler and the used cooler when changing the coolant mileage.
Machines 11 00255 g007
Figure 8. Temperature distribution in the heater when heating and cooling the coolant.
Machines 11 00255 g008
Figure 9. Local temperature distribution along the tubes during coolant flow before fan start.
Machines 11 00255 g009
Figure 10. Thermal images recorded before, during, and after the cooling process of the new and used car coolers for coolant with a mileage of 0 km. (a) new cooler before the start of cooling without the fan; (b) used cooler before the start of cooling without the fan; (c) new cooler after the cooling without the fan; (d) used cooler after the cooling without the fan; (e) cooling process of the new cooler with fan; (f) cooling process of the used cooler with fan.
Machines 11 00255 g010
Table 1. Physical properties of the water–ethylene glycol “Reprinted and adapted with permission from Ref. [20]. 2003, Engineering ToolBox”.
Water–Ethylene Glycol (50:50)
Thermal Conductivity
[W/(m·K)]
Density
[kg/m3]
Specific Heat Capacity
[J/(kg·K)]
Dynamic Viscosity
[kg/(m·s)]
Freezing Point
[°C]
Boiling Point
[°C]
0.4105033000.004−36.8107.2
Table 2. Coolant heating and cooling time.
Mileage
[km]
Heating Time
[min:s]
Cooling Time
[min:s]
New cooler041:304:30
50,00048:008:00
100,00047:007:00
Used cooler043:305:30
50,00046:307:00
100,00049:306:30
Table 3. Change thermostat position and temperature with increase in heating time for the new cooler and the used cooler when coolant mileage changes.
Coolant Mileage
[km]
Thermostat
Position
New Cooler (0 km)Used Cooler (100,000 km)
theat
[min:s]
Tth
[°C]
theat
[min:s]
Tth
[°C]
0First open29:3080.1331:0080.39
50,00034:0080.2533:0080.20
100,00033:0080.1235:3080.45
0Fully open42:0081.6343:3082.58
50,00048:3081.9246:3082.02
100,00047:3082.1649:3082.44
0Close43:0579.7744:4079.79
50,00049:4579.9948:1079.95
100,00048:4079.6250:3079.94
Table 4. Thermal performance of the investigated car coolers at the start and at the end of coolant cooling.
Cooler
Coolant Mileage
New
0 km
New
50,000 km
New
100,000 km
Used
0 km
Used
50,000 km
Used
100,000 km
Start of cooling
Thot,in [°C]80.5880.0780.0380.5680.1280.19
Thot,out [°C]66.7772.4270.767.471.9369.13
ΔT [°C]13.817.659.3313.168.1911.06
Q ˙ [W]32,80218,17022,16131,25819,45326,270
Q ˙ m a x [W]143,891142,679142,584143,843142,798142,964
η [-]0.2280.1270.1550.2170.1360.184
End of cooling
Thot,in [°C]66.0164.2965.8869.1365.1365.82
Thot,out [°C]29.6530.0730.2830.6630.1630.04
ΔT [°C]36.3634.2235.638.4734.9735.78
Q [W]86,36381,28084,55891,37583,06184,985
Qmax [W]109,284105,198108,975116,694107,193108,832
η [-]0.7900.7730.7760.7830.7750.781
Disclaimer/Publisher’s Note: The statements, opinions and data contained in all publications are solely those of the individual author(s) and contributor(s) and not of MDPI and/or the editor(s). MDPI and/or the editor(s) disclaim responsibility for any injury to people or property resulting from any ideas, methods, instructions or products referred to in the content.

