Article

Prony Method Estimation as a New Approach for Surge Comparison Testing in Turn Insulation Diagnostics for Three Phase Stator Windings

by
Luis Alonso Trujillo Guajardo
1,*,
Luis Humberto Rodríguez Alfaro
1,
Johnny Rodríguez Maldonado
1,
Mario Alberto González Vázquez
1,
Fernando Salinas Salinas
1 and
Meng Yen Shih
2
1
Universidad Autónoma de Nuevo León, UANL, FIME, Av. Universidad S/N Ciudad Universitaria, San Nicolás de los Garza C.P. 66451, N.L., Mexico
2
Universidad Autónoma de Campeche, UAC, Campeche C.P. 24085, Mexico
*
Author to whom correspondence should be addressed.
Machines 2023, 11(2), 241; https://doi.org/10.3390/machines11020241
Submission received: 9 January 2023 / Revised: 28 January 2023 / Accepted: 31 January 2023 / Published: 6 February 2023

Abstract

:
This article presents an evaluation of Prony method estimation and its implementation considerations for surge comparison test application in turn insulation diagnostics for three-phase stator windings. Surge testing diagnostics compares recorded surge voltage signals of motor winding, and a diagnostic is then defined with a defined value of EAR (error area ratio), which evaluates the difference between signals to determine a turn insulation diagnostic. First, an overview of surge testing is presented. Next, the Prony method and the considerations for its implementation in surge testing are described. Then, a numerical simulation is used to define a simulated turn fault surge voltage signal, where its parameters can be obtained with Prony method estimation and compared with EAR to evaluate its performance. Lastly, recorded surge test signals from two tested motors are used to validate Prony method estimation application for surge test diagnostics, where twelve recorded surge signals for no-fault and fault conditions were analyzed. The summary results of the surge signals parameter estimation are presented in the results and discussion section.

Graphical Abstract

1. Introduction

In recent years, the impulse test or surge comparison test (SCT) has been used widely as a periodic maintenance test for electric motors, and as a part of the sequence insulation testing in electrical motor manufacturing and repair industry. The SCT can be found as part of an insulation tester main sequence of testing, or also only as solo insulation SCT equipment, where the SCT equipment is designed to induce a voltage between adjacent windings and detect arcs that indicate a weak insulation [1,2,3]. The main objective of this particular test is to detect winding insulation faults such as turn-to-turn, coil-to-coil, phase-to-phase, and also wrong number of turns and connections where a condition of the turn insulation could be defined if the stator winding is tested right after a coil winding process or during a routine maintenance program of a motor [4,5,6].
Some of the advances and recent research in SCT have been presented in the literature, where several methods and techniques are evaluated. For example, in [6], a sensitivity analysis of EAR index ratio including the examination of zero crossings of the waveform is proposed; in [7], the parameter identification of the equivalent circuit constants considering an identification environment and diagnosis algorithm is proposed; in [8], an analysis is performed using the zero crossing time (ZCT) signal of the stator current for detection of short circuit faults by detecting a weak turn insulation; in [9], a wavelet transform (WT) and artificial neural network (ANN) approach is used to detect and classify faults based on features extracted from high frequency measurements of the admittance, current, or voltage; also, in [10], an evaluation of motor insulation using a classifier based on ANN is performed; in [11], a transient model for an induction machine with stator winding turn faults and the steady-state equivalent circuits are presented, from which the sequence components of the line currents can be estimated as a function of fault severity, and in [12], online surge testing is proposed. Also, other parametric methods such as the generalized likelihood ratio test (GLRT), maximum likelihood estimation (MLE) and the subspace spectral estimation technique reduces the noise effects on parameter estimation results. Nevertheless, these techniques have one point in common, which is the complexity of the practical implementation due to its considerations and calculations. In other related topics, a deep-learning-based remaining useful life (RUL) prediction method is proposed to address sensor malfunction problem of diagnostic tools in [13], when there is an exploration of data from multiple sensors, and in [14], a blockchain-based decentralized federated transfer learning method is proposed for collaborative machinery fault diagnosis, where a collaborative access of academy and industry data privacy of fault diagnose models is very necessary. As it is described, limited research related to SCT signal analysis has been developed. However, nowadays, there is no research aimed at improving the accuracy by using alternative methods instead of %EAR index ratio to compare the surge voltage signals being measured during a SCT for diagnostics in detecting weak turn insulation in electric motors.
Recently, in [15], a problematic field experience using SCT was exposed, where related standards such as IEEE 522 and IEC 60034-15 offer some guidance for performing the SCT and indicate recommended test voltages on windings, but neither offers an acceptable diagnostic criteria when comparing resulting surge waveforms from different tested phases. It is well known that one of the main problems with predictive maintenance diagnostics is that the interpretation of the results after a test is required, so the main and common problem during SCT for low-voltage and medium-voltage electric motors, as presented in [15], is to define an accurate diagnostic of weak turn insulation. Therefore, to overcome this, another approach in SCT diagnostics is required, where an IEEE standard with diagnostic criteria of surge waveforms comparisons could be defined for different winding configurations and rated power of motors to accurately diagnose a condition of turn insulation using SCT, so Prony method estimation could be an adequate approach.
The paper is organized as follows. First, an overview of surge testing and EAR method are described in Section 2. The Prony method and its application considerations in surge testing are discussed in Section 3. Then, in Section 4, an evaluation of the Prony method as a tool for surge testing diagnostics is performed which considers a numerical simulation, and a study case which considers two tested motors and their recorded surge test signals as the experimental validation of the method, where twelve recorded surge signals for no-fault and fault conditions were analyzed to validate the methodology. Finally, the advantages of the Prony method for this application and future work recommendations are discussed in Section 5.
The main contribution of this article is that the Prony method is proposed as an alternative diagnostic tool in SCT diagnostics to improve the accuracy and sensitivity of SCT diagnostics in motor winding assessment by considering the recorded surge signals parameters of amplitude, frequency, phase angle and damping in a SCT of a motor winding, mainly due to the increase in the use of electric motors in transportation applications, where the electric motor and its insulation system will be subject of extra stress during operating conditions [16], so an improvement in the accuracy of SCT diagnostics and in compliance standards will be needed. The methodology was validated by using simulated and real surge data signals obtained from an SCT tester, and its effectiveness is presented.

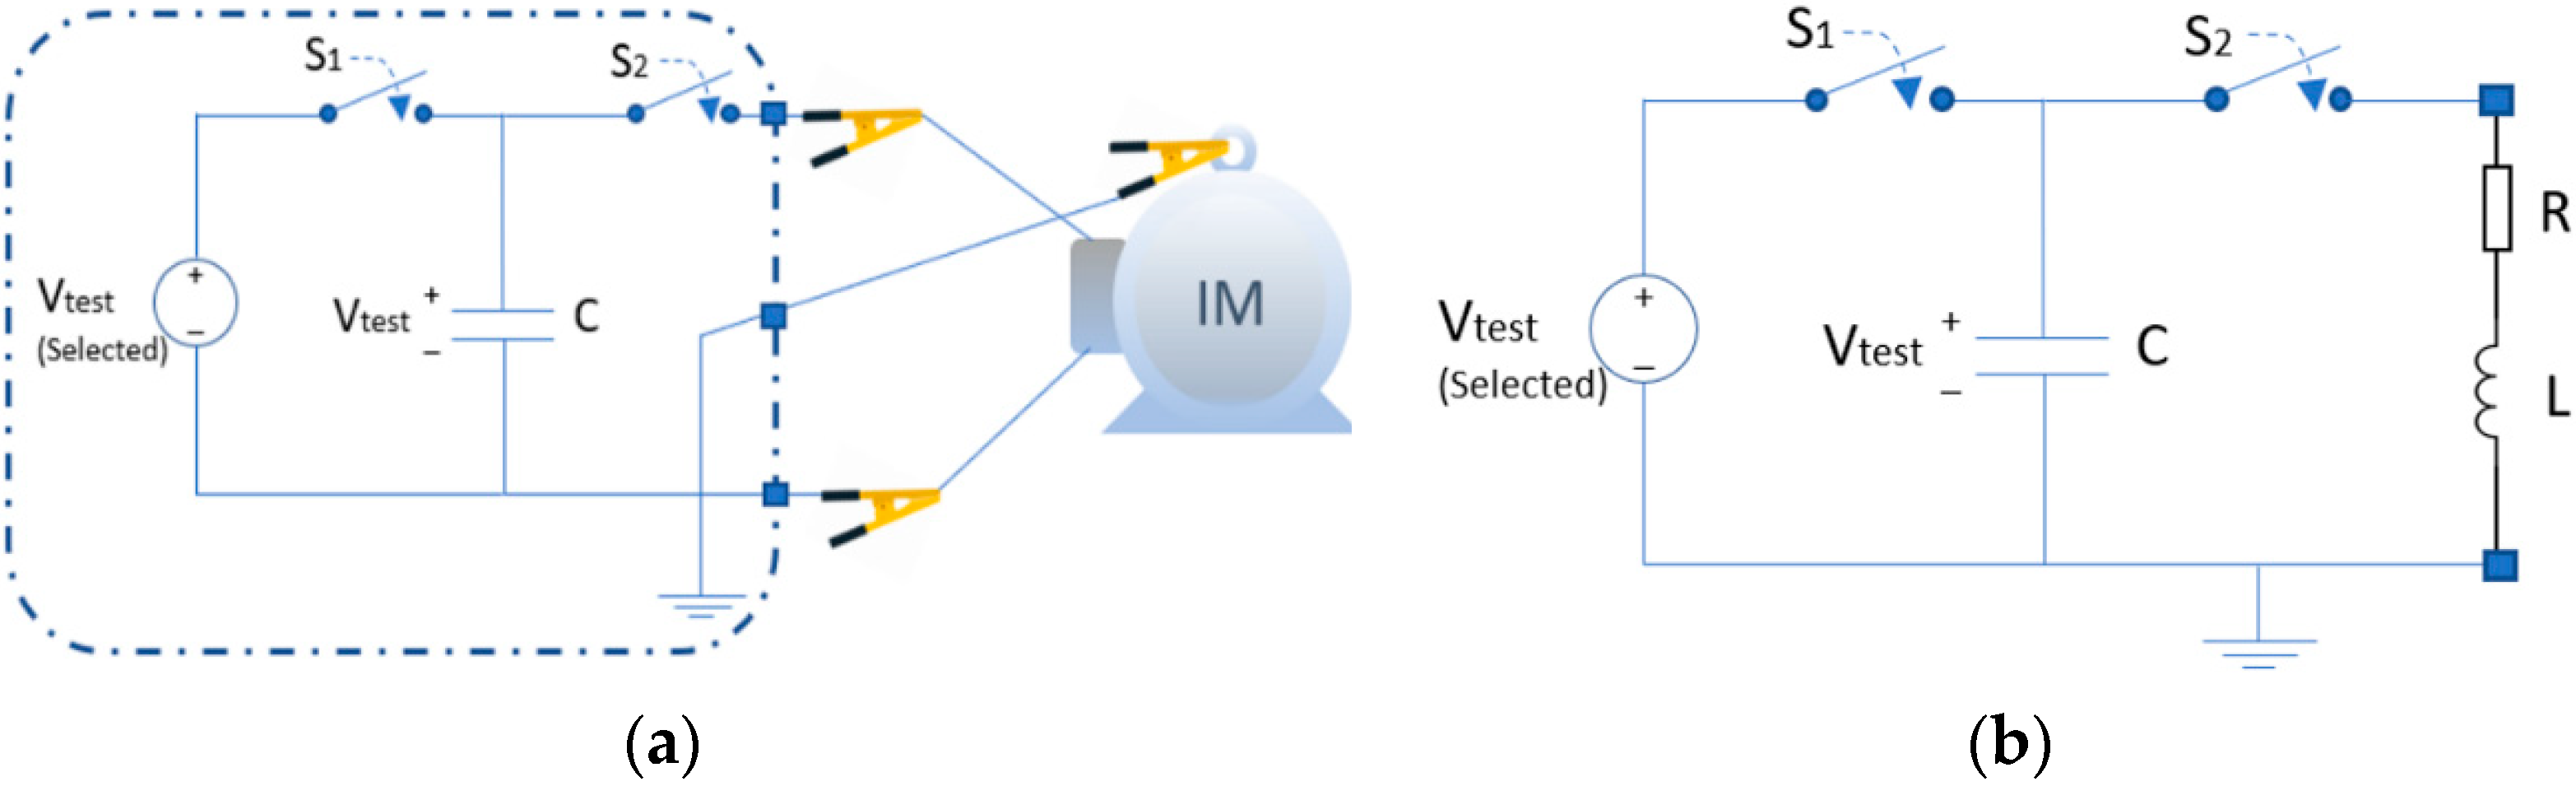
2. Surge Comparison Test Overview

In this section, the fundamentals of the SCT will be addressed. It should be mentioned that SCT is commonly used due to the fact that 80% of electrical failures in induction motors begin with a turn-to-turn insulation breakdown [2], and this is why the SCT is part of the main sequence testing of motor insulation testers. First, the fundamentals are described, then the conventional diagnostic method %EAR index, which is commonly used in motor insulation testers, is presented. [2,4,5,6,17].

2.1. Surge Testing Fundamentals

The SCT can measure the integrity of the turn insulation. Its principle is based on injecting a current with a fast rise time (60–200 ns) into the stator windings [17,18,19] at a test voltage previously selected for the nominal operating voltage of the motor winding under test. A capacitor is used within the tester to charge up the energy required to be injected in the stator winding (joules capacity could be different between testers) at a specific test voltage [20]. The test voltage typically used for SCT is two times the rated voltage of the motor plus one thousand volts, where the stator winding is tested in pairs Phase AB, BC and CA, so the result will be three measured and recorded underdamped voltage signals (surge waveforms), where the calculated %EAR index is typically used to determine a diagnostic, so a weak turn insulation of the stator winding can be detected.
The SCT process is explained using the equivalent circuit in Figure 1 and is as follows: First, a surge capacitor (C) is charged at a specific test voltage (Vtest). Recommended test voltages can be found in [21], then once the test voltage is defined, a pair of stator phases are selected for tests (AB, BC and CA), then the capacitor energy for the test voltage is discharged into the winding with a fast rise time, so during an SCT an RLC series circuit is established. Due to RLC series circuit characteristics, an oscillatory energy transfer occurs between motor winding inductance (L) and capacitor (C), until the total energy used during the test is dissipated in the overall resistance values (R) of stator winding under test. Finally, during the test, the voltage drop signal in each pair of stator phases is measured (during each capacitor discharge applied), and the voltage measured will be an underdamped signal. The SCT concludes when the three voltage underdamped signals are recorded and the %EAR index is calculated.
It should be mentioned that when a weak turn-to-turn insulation exists in the winding, a change in the inductance of the motor (L) will occur mainly due to the voltage applied which it will discharge between weaken insulated turns, so the frequency and magnitude of the three underdamped signals (AB, BC and CA) measured will be different if compared with each other. In Figure 2, a signal example of an SCT result is presented where a weaken turn insulation exist in a stator winding, because the surge signal BC is shifted to the left, which means that a change in frequency occurs, and also a change in amplitude could be observed if the surge signal BC is compared with AB and CA.
The frequency of the surge signals can be obtained if the RLC series circuit is solved, so the damped resonant frequency of the measured signal is presented in (1).
f = 1 2 π 1 L C R 2 4 L 2
where R is the overall resistance of the winding, L is the winding inductance, and C is the surge capacitance. If the three surge signals are compared and they are identical, there are no turn insulation deficiencies in the motor winding.

2.2. Analytical Method (Error Area Ratio)

The algorithm commonly used for the detection of frequency shifts and amplitude differences between the surge waveforms being recorded during an SCT for the purpose of detecting a turn insulation failure based on a pass/fail criterion is the percentage error area ratio (%EAR) index [4,17,18,19]. This method is one of the most effective methods for analyzing the recorded surge waveforms during the test because it is very sensitive in detecting the change between surge waveforms, because a comparison between specific points of data of two signals is performed. The %EAR1–2 equation to compare two surge signals obtained from two pair of phases (AB = 1, BC = 2, CA = 3) being tested in a three-phase motor winding is defined in (2) as follows:
% E A R 1 2 = i = 1 N | A i B i | i = 1 N | A i |   ×   100
where A i is a digitized data sample of the first recorded surge waveform or reference, B i is the corresponding digitized data sample of the second surge waveform, i is the summation index for each data sample, N is the number of samples of the surge waveforms. When two surge waveforms during an SCT are identical, the %EAR is 0, and if a difference exists, for example, a typical value above of 5–10% indicate a turn insulation degradation. The recommended %EAR for lap windings is between 5–10% and for concentric windings is defined for 20% or more, according to [20], for most of stator windings. The selected %EAR pass/fail criteria will be defined according to the degree of reliability established by the electric motor manufacturer or maintenance workshop, or by the predictive maintenance department of the electric motor user.

3. Prony Method for Surge Comparison Testing Application

The Prony method is proposed as an additional diagnostic algorithm to estimate the parameters of the surge waveforms recorded during an SCT. The method is a signal processing technique based on signal estimation which builds a series of damped complex exponentials or sinusoids to approximate a uniformly sampled recorded signal. The algorithm and its practical implementation are shown in [22,23] and it has been used for power quality analysis [24,25,26], stability studies applied to power system and nuclear power plants [27,28] and has also been evaluated and patented for its application in power system protection in distance relay algorithms [29,30,31]. Recently, the Prony method has been used to obtain radar cross section (RCS) data which indicates the amount of signal reflected on an object by an electromagnetic wave applied by radar, one of the essential parameters for military aircraft design [32]. It has also been proposed and validated in motor current signal analysis application for broken rotor bar diagnostics [33]. The Prony method is proposed for this application, mainly because the surge waveforms obtained during an SCT are underdamped signals with minimum noise, as is observed in Figure 2, and the signal model used in Prony method estimation is a sum of exponentially decaying signals, as presented in (3). Due to surge signal characteristics (underdamped, lower quantity of components or frequencies, minimum of other frequencies besides surge fundamental frequency), the Prony method will be a good alternative for increasing the sensitivity and accuracy of the SCT diagnostics, so a good estimation of surge signal parameters could be obtained, hence a comparison between the estimated parameters of each of the surge waveforms (error parameter ratio, EPR) could be defined as a more accurate pass/fail criteria.
As is well known in Prony method literature, the parameters of a signal y(t) in (3) can be obtained by digitizing the signal and obtaining the samples [y(1) y(2)… y(n)] with a sampling frequency fs.
y ( t ) Real   signal = n = 1 N A n e σ n t cos ( 2 π f n t + θ n ) Prony   Model   Signal
The Prony model signal in (3) will approximate to the sampled data y(n) using the following linear combination of N complex exponentials:
y L = n = 1 N B n λ n L
B n = A n 2 e j θ n
λ n = e ( σ n + j 2 π f n ) T
The Prony model signal in (3) has four elements: magnitude An, damping factor σn, frequency fn, and the phase angle θn. So, using the Euler theorem and total time t = LT, where L is the length of the signal and T is the time between samples, (3) can be rewritten as (4), where each exponential term in (4) is a unique signal mode of the original signal y(t).
The Prony method can therefore be implemented for SCT, and each of the following aspects must be considered for each surge voltage signal under analysis:
(1)
The sampling frequency (fs), sampling time (Ts), and length of the signal under analysis (L) must be known, as well as the order (p) of the linear prediction model (LPM), where an initial value of p for the surge signal measurement for analysis must be selected, starting with p = 1, then p = 2… L.
(2)
A Toeplitz matrix “ Y ” with the data of the surge signal “y(t)” must be defined as (5).
Y = [ y [ p ] y [ p 1 ] y [ 1 ] y [ p + 1 ] y [ p ] y [ 2 ] y [ 2 p 1 ] y [ 2 p 2 ] y [ p ] ]
(3)
A vector “ a ” (coefficients of characteristic polynomial) using (5) is calculated in (6).
[ a [ 1 ] a [ 2 ] a [ p ] ] = [ y [ p ] y [ p 1 ] y [ 1 ] y [ p + 1 ] y [ p ] y [ 2 ] y [ 2 p 1 ] y [ 2 p 2 ] y [ p ] ] 1 · ( [ y [ p + 1 ] y [ p + 2 ] y [ 2 p ] ] )
(4)
Calculate the roots from vector “ a “, and the resulting roots vector “ z “ will be used in (7) and (8) to calculate damping:
σ = l n | z | T s
and frequency:
f = 1 2 π T s t a n 1 ( I m ( z ) R e ( z ) )
(5)
Obtain vandermonde matrix “Z” of vector “ z ” using (9).
Z = [ z 1 0 z 2 0 z p 0 z 1 1 z 2 1 z p 1 z 1 p 1 z 2 p 1 z p p 1 ]
(6)
Obtain vector “h” in (10) using vandermonde matrix “Z” and signal vector “ y ”.
[ h 1 h 2 h p ] = [ z 1 0 z 2 0 z p 0 z 1 1 z 2 1 z p 1 z 1 p 1 z 2 p 1 z p p 1 ] 1 ·   [ y [ 1 ] y [ 2 ] y [ p ] ]
(7)
The resulting vector “h” obtained in (10) will be used in (11) and (12) to calculate amplitude and phase angle.
A = | h |
θ = t a n 1 ( I m ( h ) R e ( h ) )
To obtain good estimation results it is necessary to: (1) Obtain the order p of the linear prediction model (LPM). The order is obtained by evaluating the mean square error (MSE) of the full signal data p = 1, 2…L, where L is the total data samples of the full signal. (2) The MSE for each value of p selected in step (1) is calculated in (13), where MSE is obtained with the reconstructed Prony model signal y ^ in (3), which is formed using the estimated parameters calculated from a selected value of p, and the real sampled surge waveform y , so the MSE of lesser magnitude is selected for the corresponding p value, and the selected value is considered the optimum estimate of the model signal parameters, so the estimated signal parameters will be considered for the corresponding analysis.
M S E p = x p = 1 L j = 1 N s ( y ^ j y j ) 2
Some important details in Prony estimation have to be considered to be able to implement the parametric estimation method in SCT, mainly because the accuracy of Prony estimation depends on the level of signal distortion, the observation data window and the number of samples used in the estimation process, as well as the order of the model [34], so an accurate estimate of the signal parameters can be achieved in the following conditions: (1) the recorded surge sampled signal is analyzed, (2) the sampling rate is known, (3) if noise in the signal exists, the signal must be filtered, (4) if a greater number of samples of digitized surge signals are considered, this will cause an increase in computational burden, (5) the model order (p) has the lowest value, (6) other frequencies may appear during Prony estimation, hence, only the estimated dominant harmonic (EDH) of the optimum set of parameters estimated should be considered, i.e., the EDH with greater amplitude.

4. Study Case for Surge Signal Analysis Using Prony Method Estimation

In this section, an assessment of simulated case of an SCT and real data measurement of surge waveforms recorded during an SCT of two electric motors to evaluate the %EAR index and the Prony method is presented. First, the simulated case is presented and considers non-fault and fault surge waveforms. Then, the real case is presented, where recorded surge signals are obtained from two motor windings under test, both of these motors had a turn insulation fault and rewinding was performed; therefore, surge waveforms for fault (before rewind) and non-fault conditions (after rewind) for each motor were recorded and used for the analysis. For this analysis, the conventional diagnostic criteria %EAR index results were evaluated and compared with the Prony method estimation results. This will allow the enhancement of the proposed method application to be highlighted, compared to the conventional method.

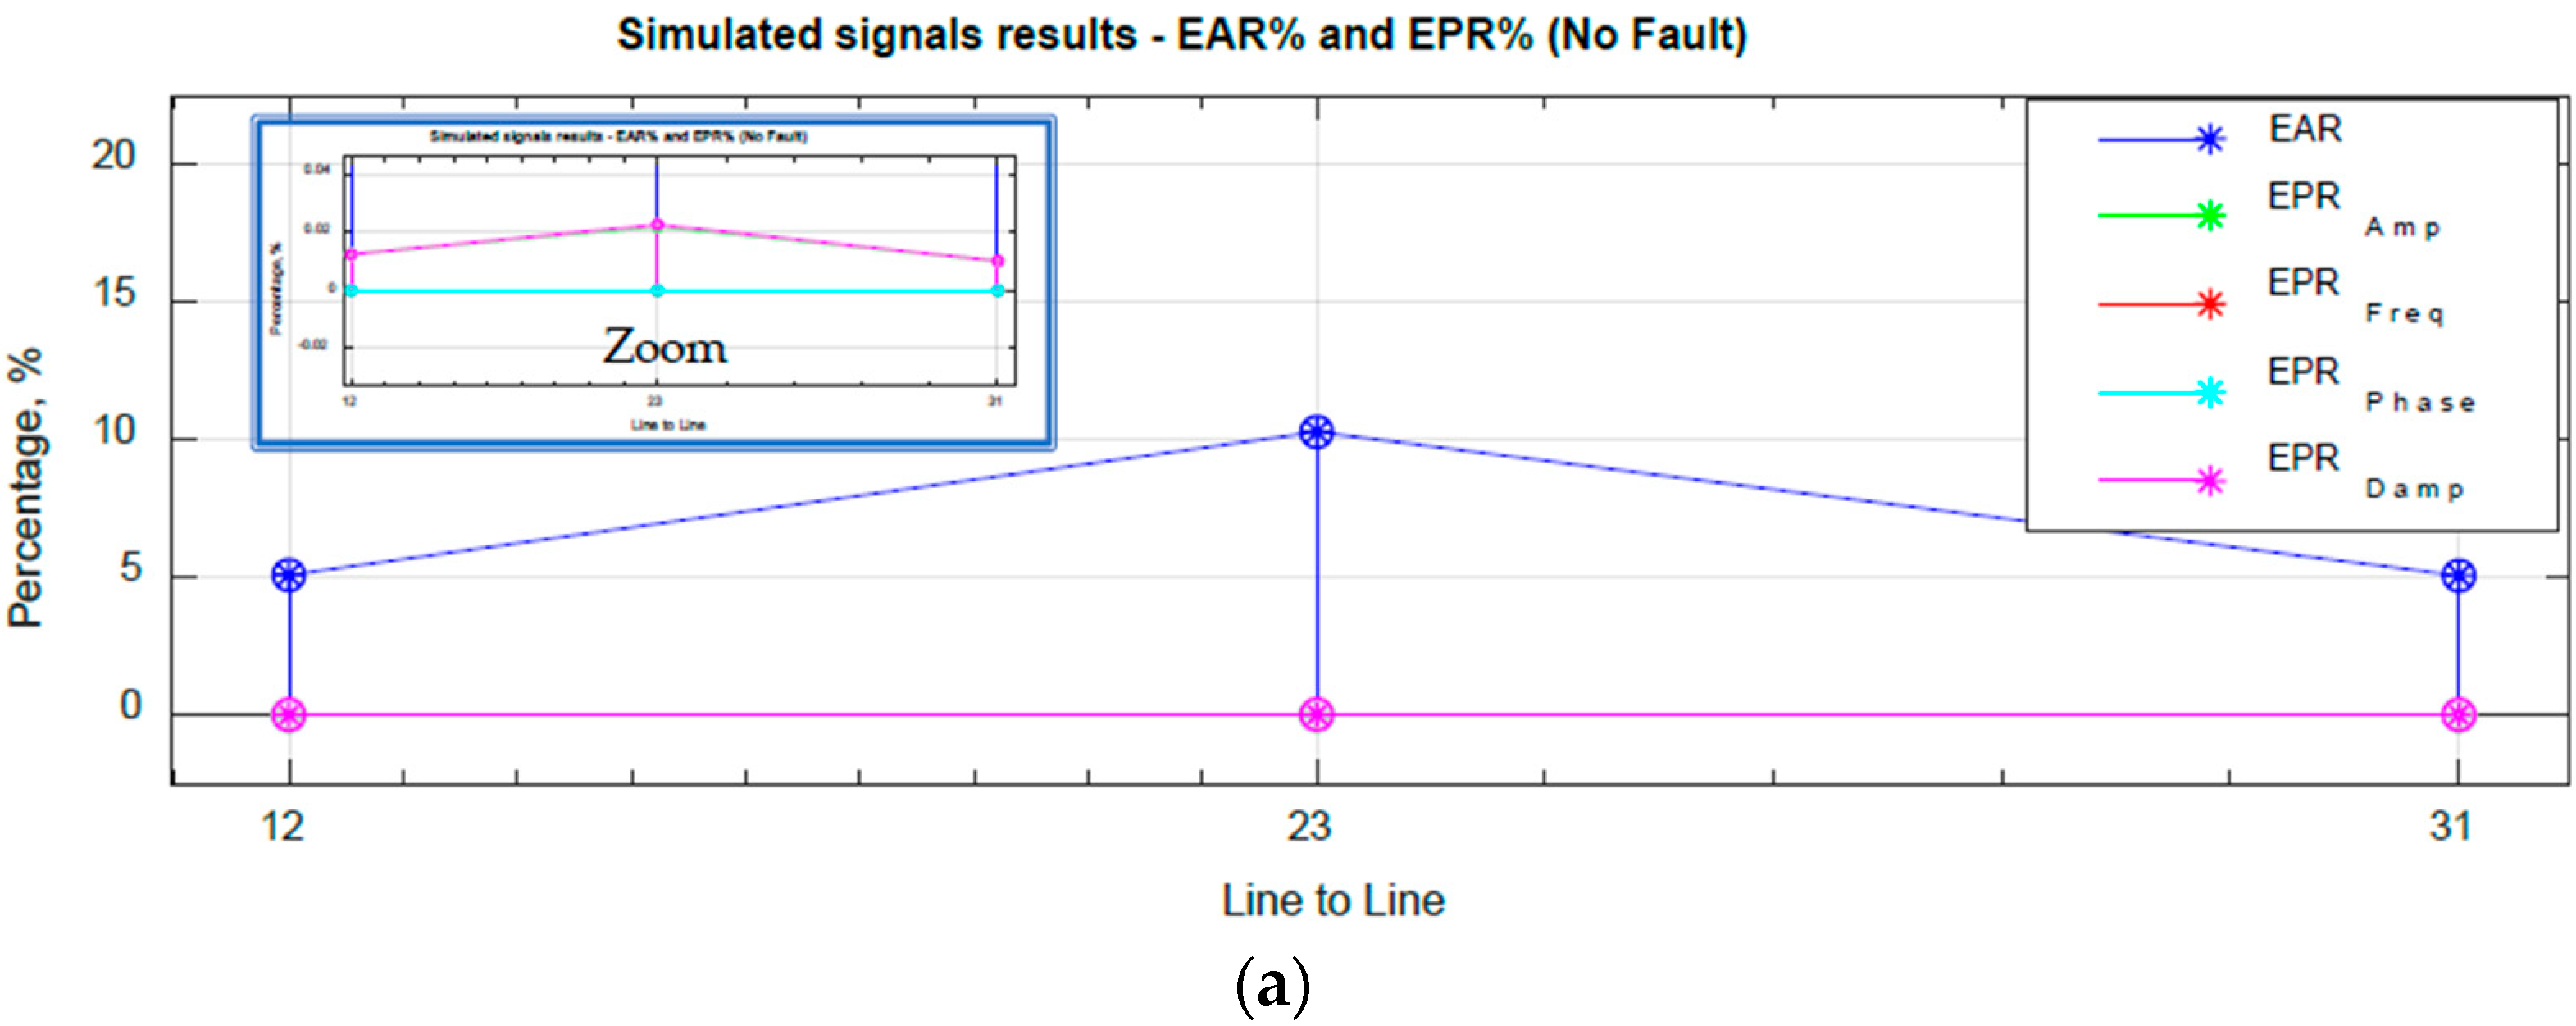
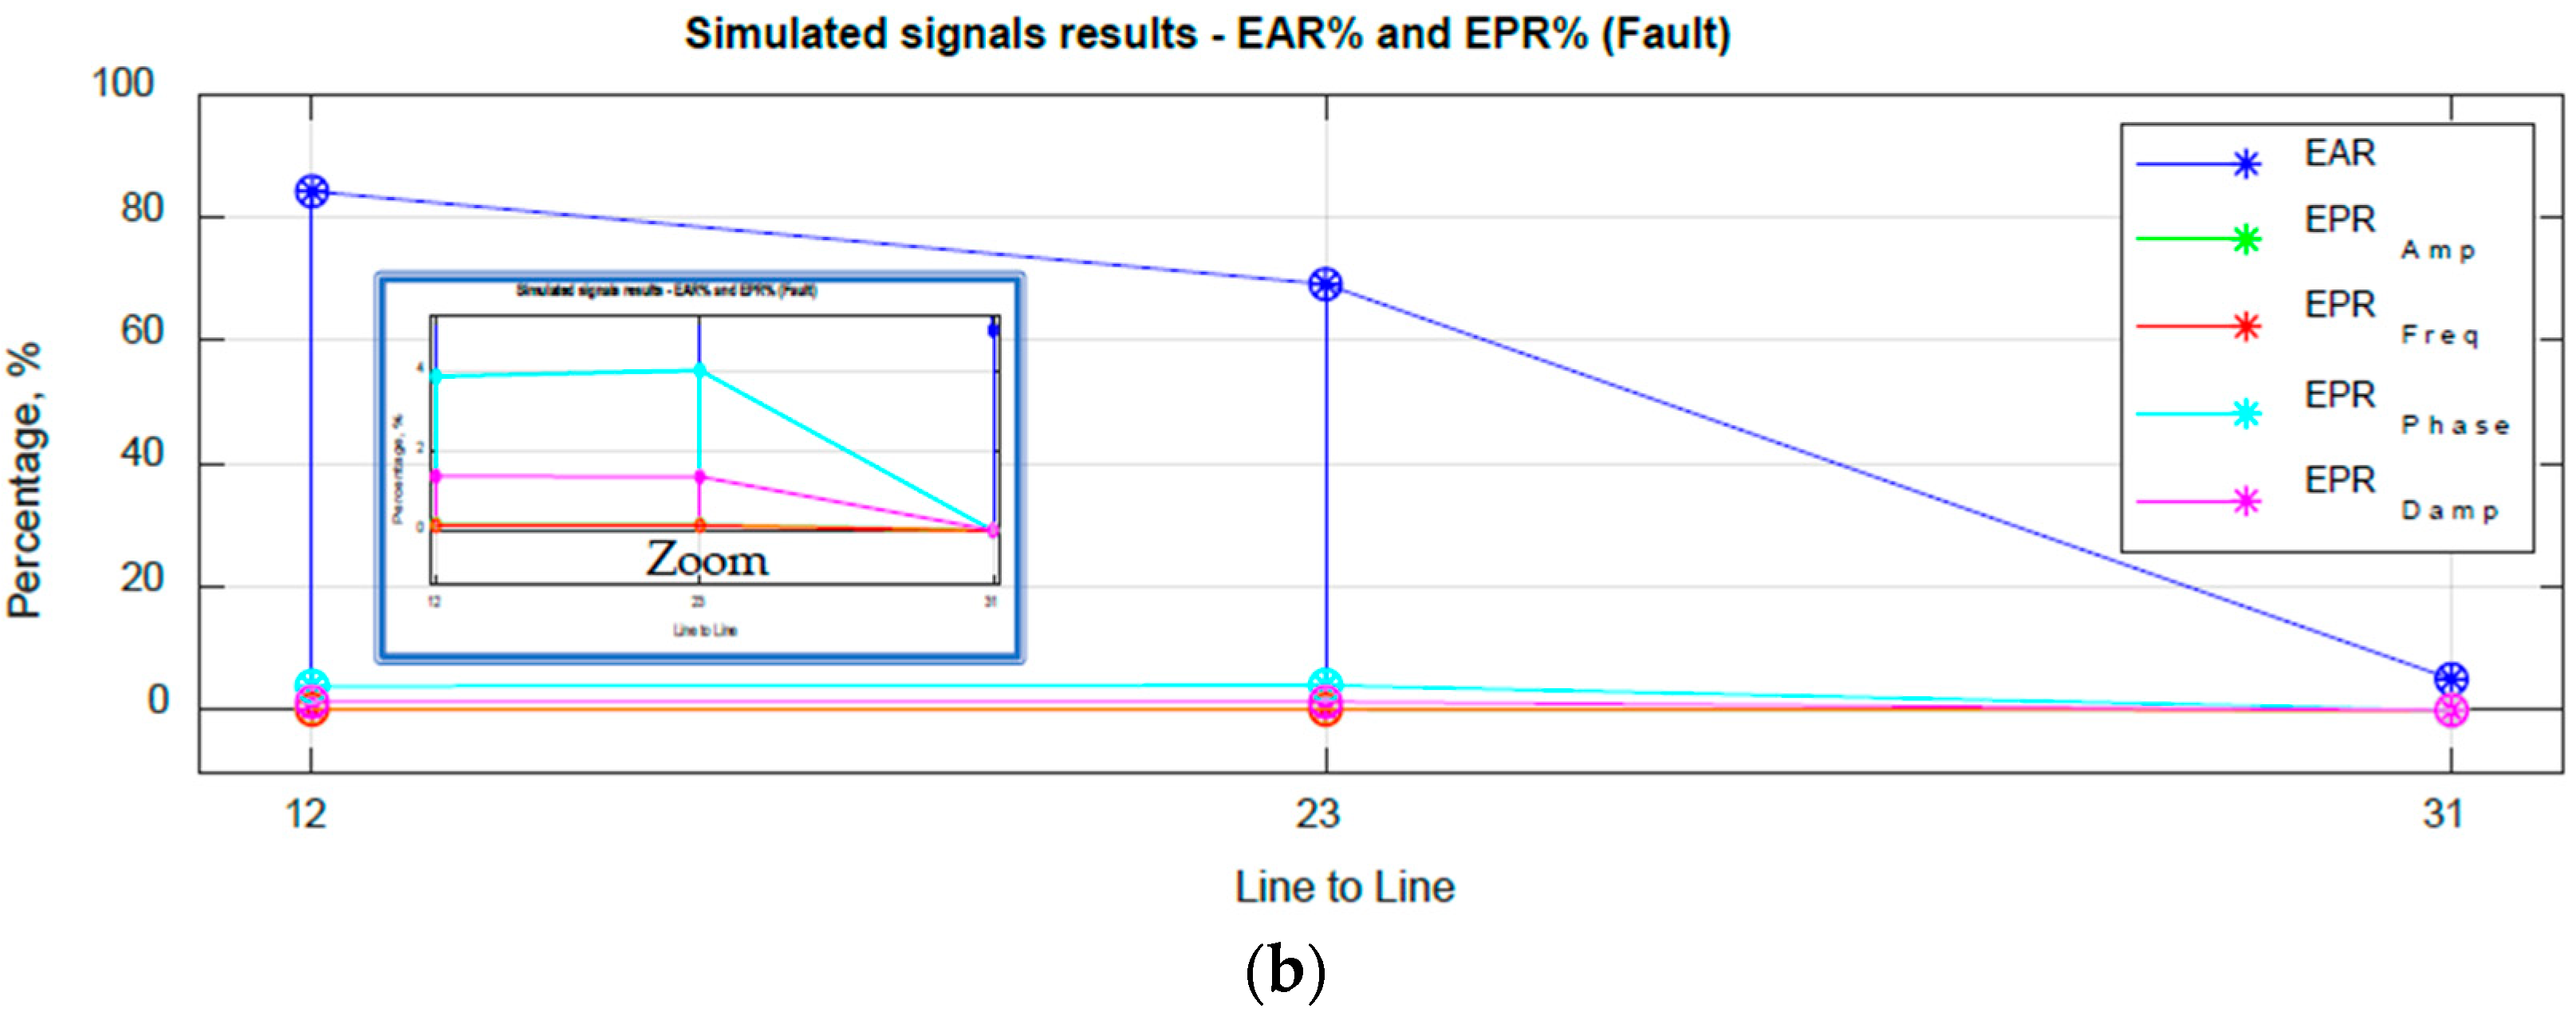
4.1. Assessment of Numerical Simulation of Surge Signals

For this analysis, the surge signals for non-fault and fault conditions were obtained using PSIM® software. The equivalent circuit of SCT, which is used to obtain the equivalent simulated surge signals (underdamped signal) for non-fault and fault conditions is defined in Figure 3. The measurement considered is from the Vab voltmeter for each pair of phases being measured, as it is normally recorded from an SCT insulation tester.
The parameters used for the equivalent circuit simulation are typical values of a surge insulation tester and induction motor stator winding, so a good approximation of the real surge signal could be obtained. The equivalent circuit parameters used to obtain the simulated surge waveforms are presented in Table 1. Two scenarios are presented: (1) non-fault and (2) fault. The surge waveforms (Vab, Vbc, Vca) were measured for both scenarios. It should be mentioned that a change in inductance (turn-to-turn insulation fault) was considered in a fault scenario, so a shift in the waveform (frequency change) could be observed and needed to be present in the signal; this is a typical characteristic of surge signals when a motor under test has a turn-to-turn fault. Both scenarios of SCT waveforms for analysis are presented in Figure 4.
(1) Error Area Ratio index results: the surge simulated waveforms in Figure 4, which are obtained from the simulated equivalent circuit of SCT in Figure 3, are used to calculate the %EAR index using (2). Both scenarios presented (no-fault and fault) were considered for the calculation of %EAR index and are presented in Table 2.
It was observed that for a no-fault scenario, the difference between %EAR was about 5% from each other, where a minimum difference between signals could be observed, but in the fault scenario, the difference between %EAR had an average of 52.75%, so in Figure 4b, an amplitude and frequency change in the signal can be observed. This simulated signal emulates a questionable integrity of the turn insulation of a motor winding, which in this simulated case emulates an unreliable turn insulation and is considered to be a turn-to-turn insulation fault.
(2) Prony method estimation results: In order to evaluate the performance of the Prony method for SCT, the signal parameters of the simulated signals in Figure 4 were estimated using the Prony algorithm and considerations for its implementation in SCT, which are described in Section 3. The surge signal (Vab, Vbc and Vca) parameters (frequency, amplitude, phase angle and damping) obtained are shown in Table 3, and the three sets of signal parameters were compared with each other for both scenarios of analysis (no-fault and fault scenario), so a proposed error parameter ratio index could be used (%EPR), as presented in (14):
% E P R 12 = | P ( 1 ) | | P ( 2 ) | | P ( 1 ) |   ×   100
where P is the parameter ( A , f ,   σ ,   θ ) selected for calculation, and the index 1, 2 or 3 indicates the voltage surge signal (ab = 1, bc = 2, ca = 3) that corresponds to the estimated parameters, so three calculations of %EPR are needed for each parameter, % E P R 12 ,   % E P R 23 ,     % E P R 31 . To validate the results, the surge voltage signals, simulated and estimated, are presented in Figure 5.
In Figure 5, it can be observed that the estimated signals using the Prony method correspond to the simulated signals with minimum error, where the Prony estimated signal model (Estimated) is reconstructed using the estimated parameters, which are presented in Table 3, and then compared with the simulated signal obtained from the simulation in Figure 3. As can be observed, the error between signals is minimum, and the signals are the same, so this confirms that the estimated parameters correspond to the simulated signal.
The estimated frequency of the signals for Vab, Vbc, Vca is 23.008 kHz, 23.010 kHz and 23.005 kHz in a no-fault scenario, and Vab, Vbc, Vca is 23.008 kHz, 22.971 kHz and 23.005 kHz in a fault scenario, respectively. The average MSE percentage value between simulated and estimated signals of the no-fault scenario was calculated, which was 8.00 × 10⁻¹⁴% and for the fault scenario it was 1.10 × 10⁻¹⁴%, hence, a good estimation was obtained.
In Table 4, the percentage error of each parameter estimated (%EPR) of the surge simulated signals is presented. The calculated error using the estimated parameters indicates if a significance difference was detected in the analyzed signals. When the %EPR results in Table 4 are compared with the %EAR index in Table 2, it can be observed for both scenarios that the sensitivity and accuracy of the diagnostic criterion for SCT will be increased if the calculated %EPR is used to determine a diagnostic condition of the turn insulation.
In Figure 6, it is evident that the %EPR for each parameter has a very low value in comparison with the %EAR for a no-fault and fault condition, as shown in Table 2 and Table 4. Also, it is important to observe that, for the fault condition, an increase in %EPRFreq, %EPRPhase and %EPRDamp occurs. For a no-fault condition, the %EPRAmp, %EPRFreq, %EPRPhase and %EPRDamp have a minimum value; the calculated results using %EPR means that the estimated parameters obtained from the signals analyzed in Figure 4 correspond to the no-fault and fault condition assessment using %EPR.

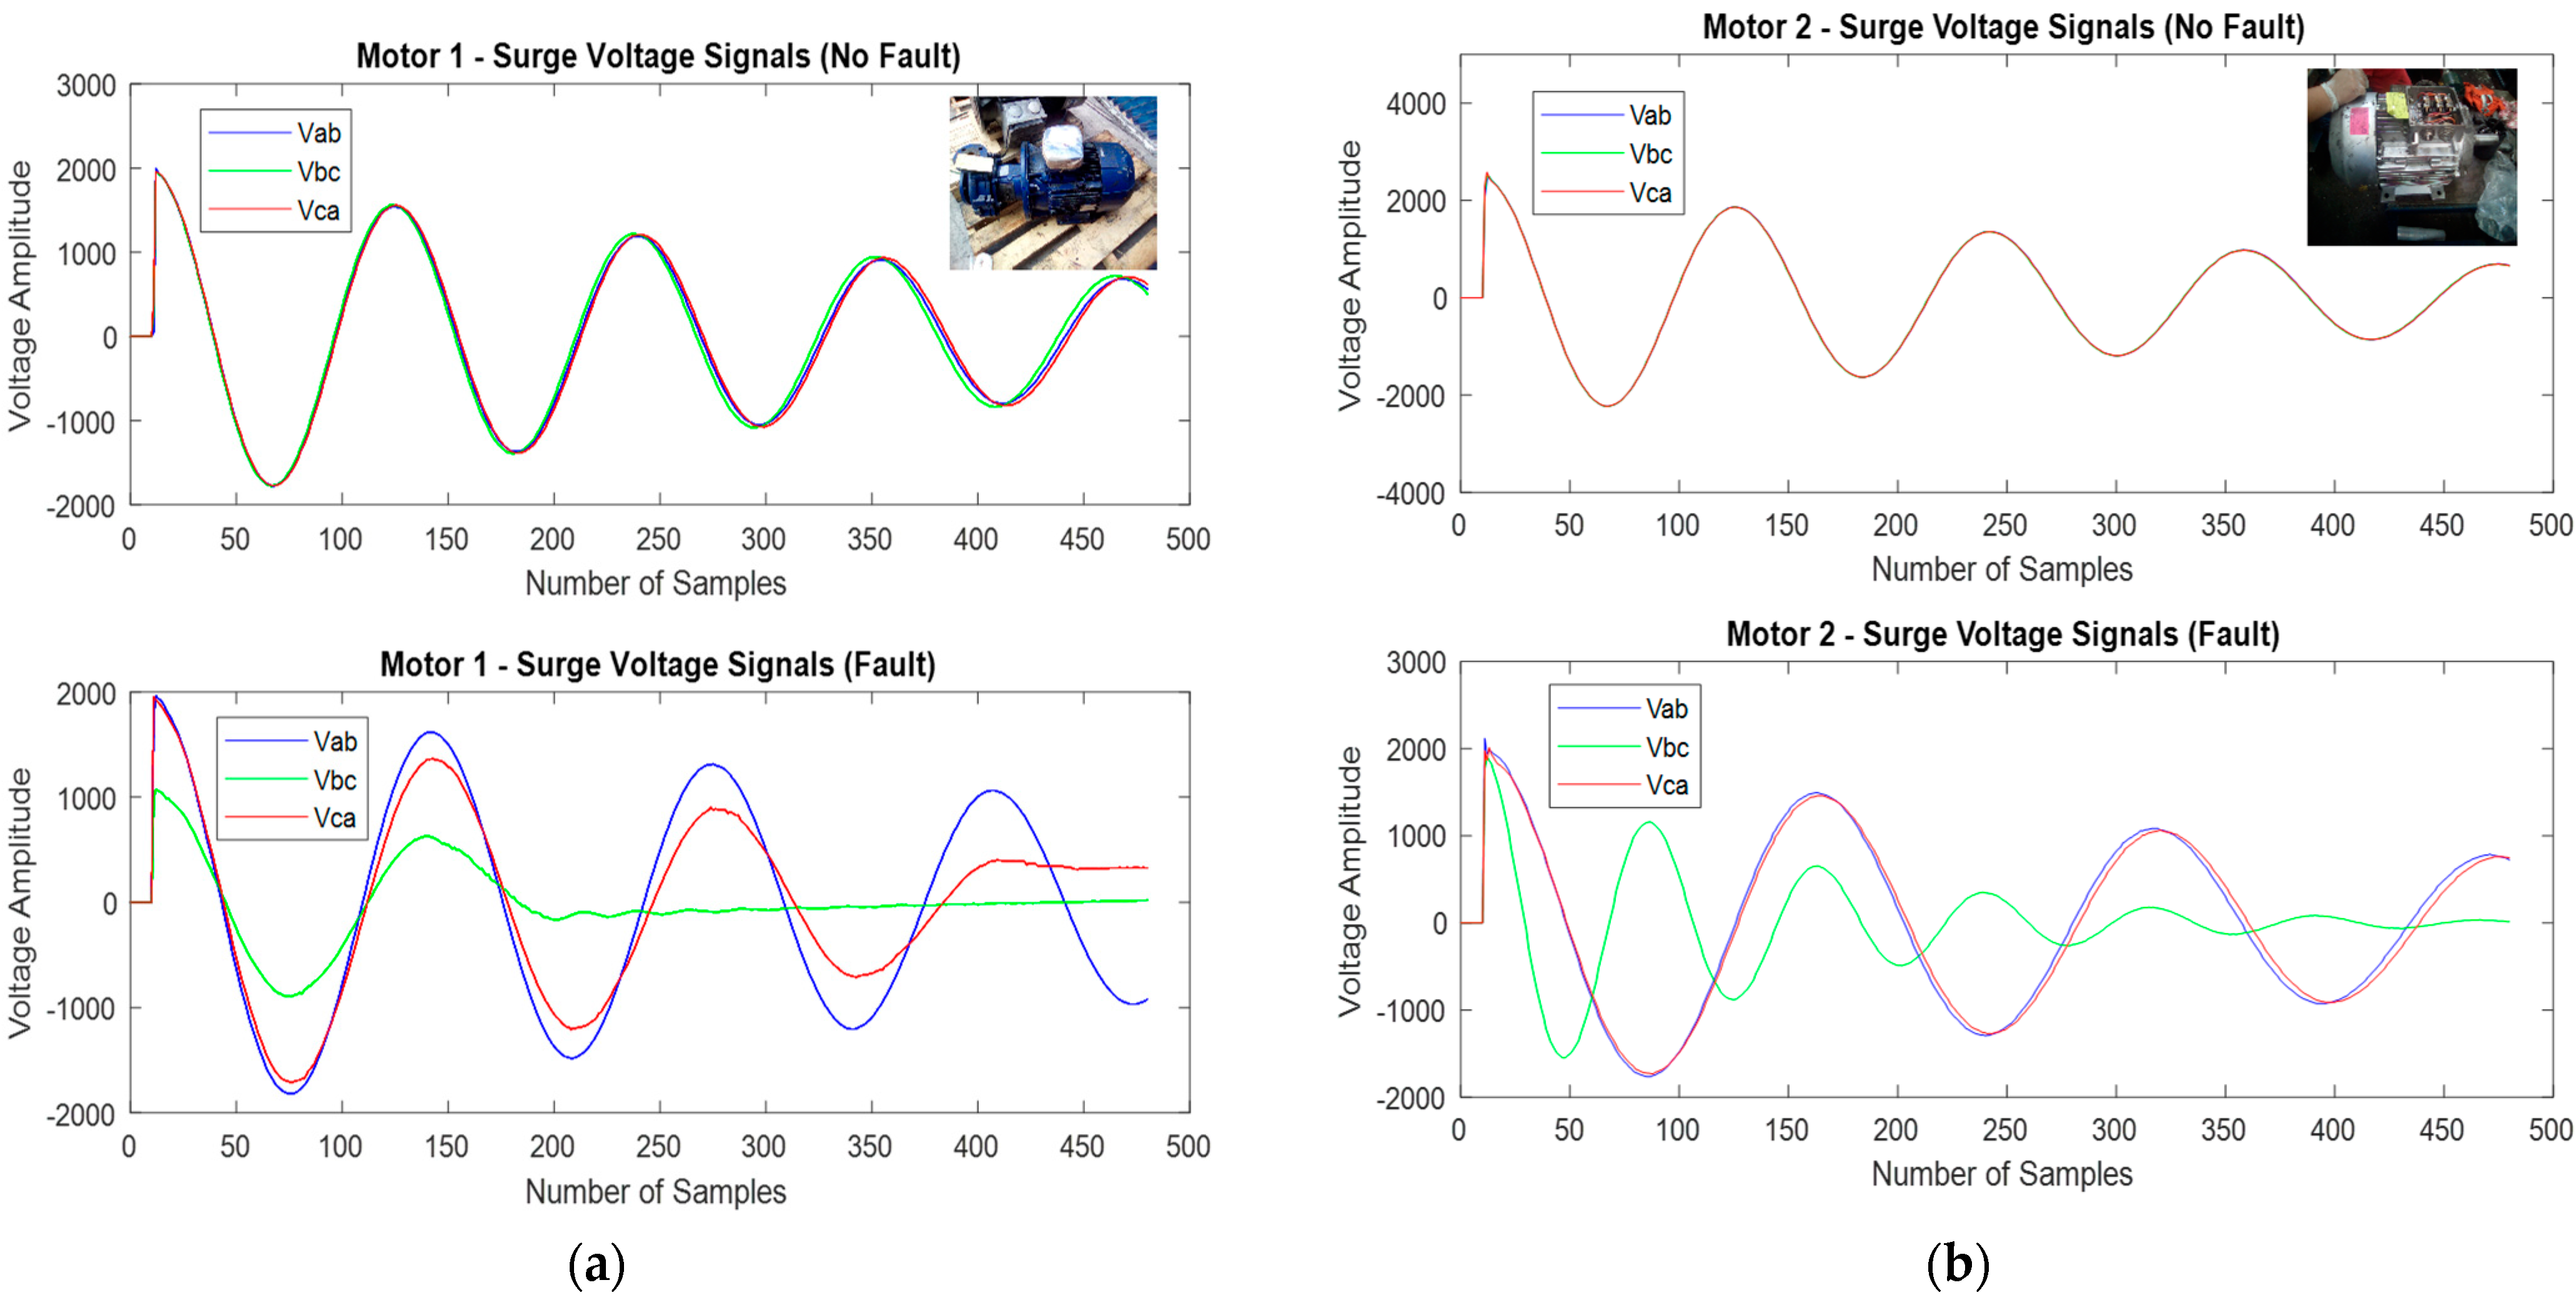
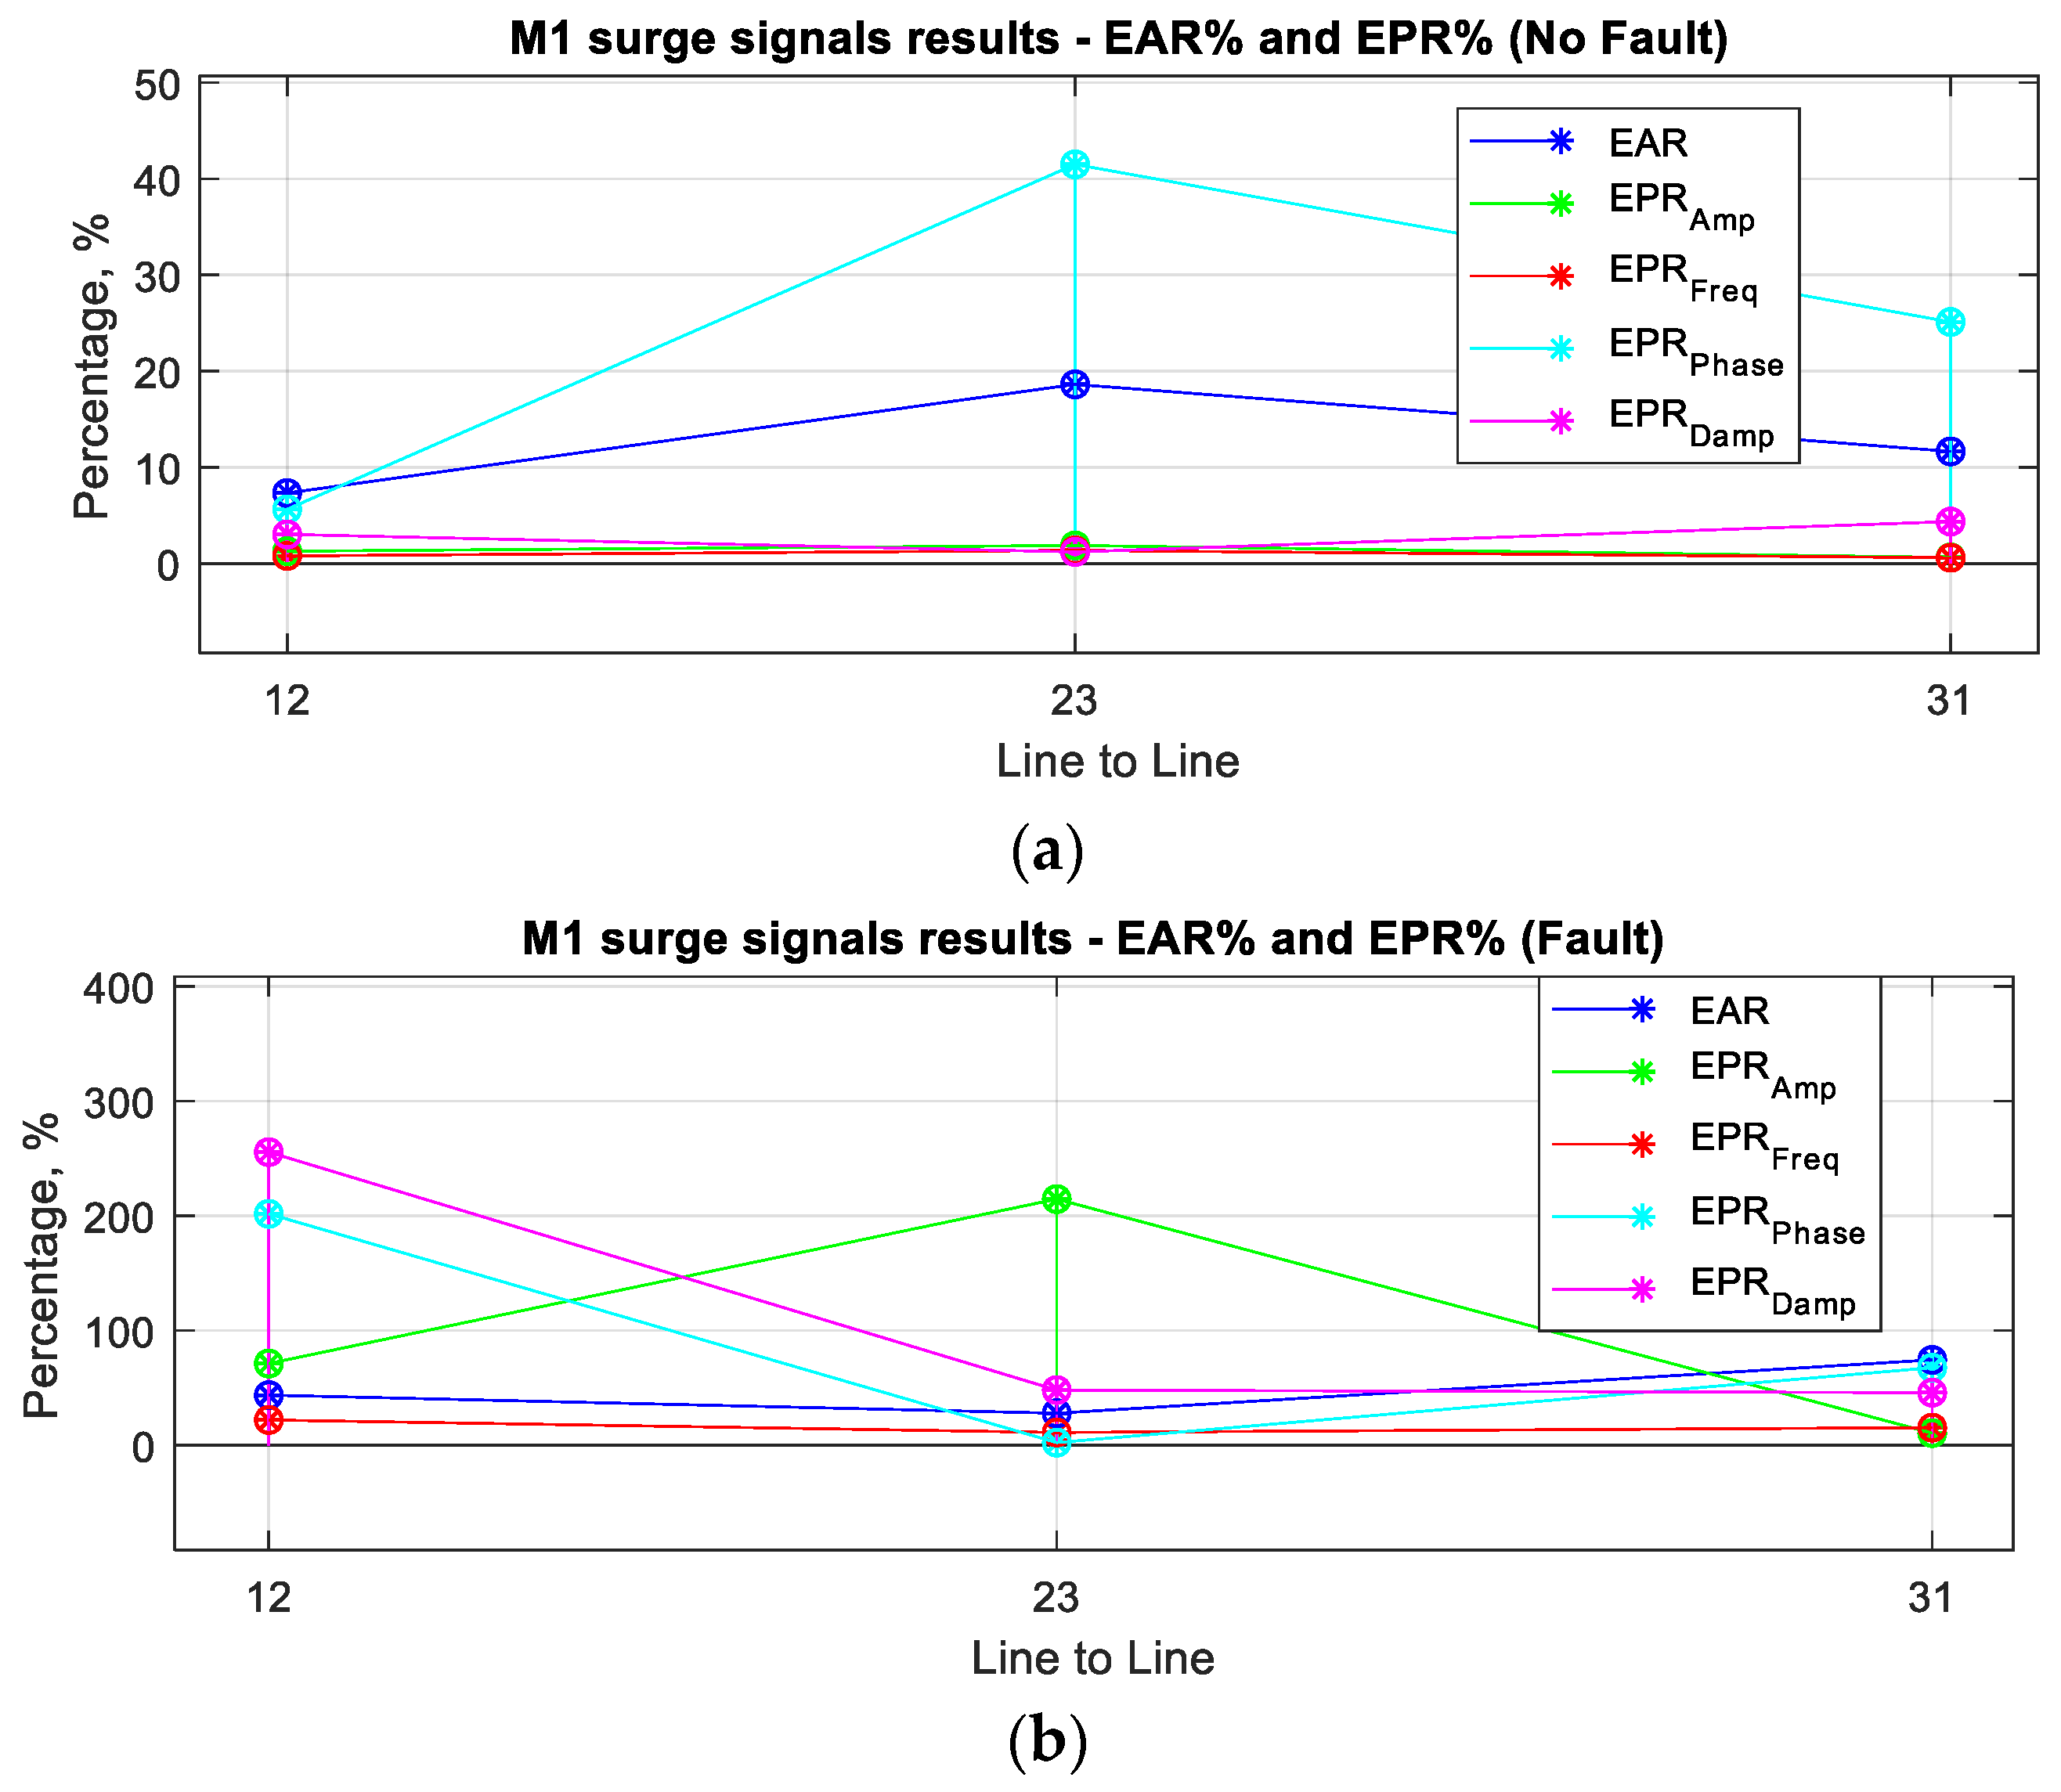
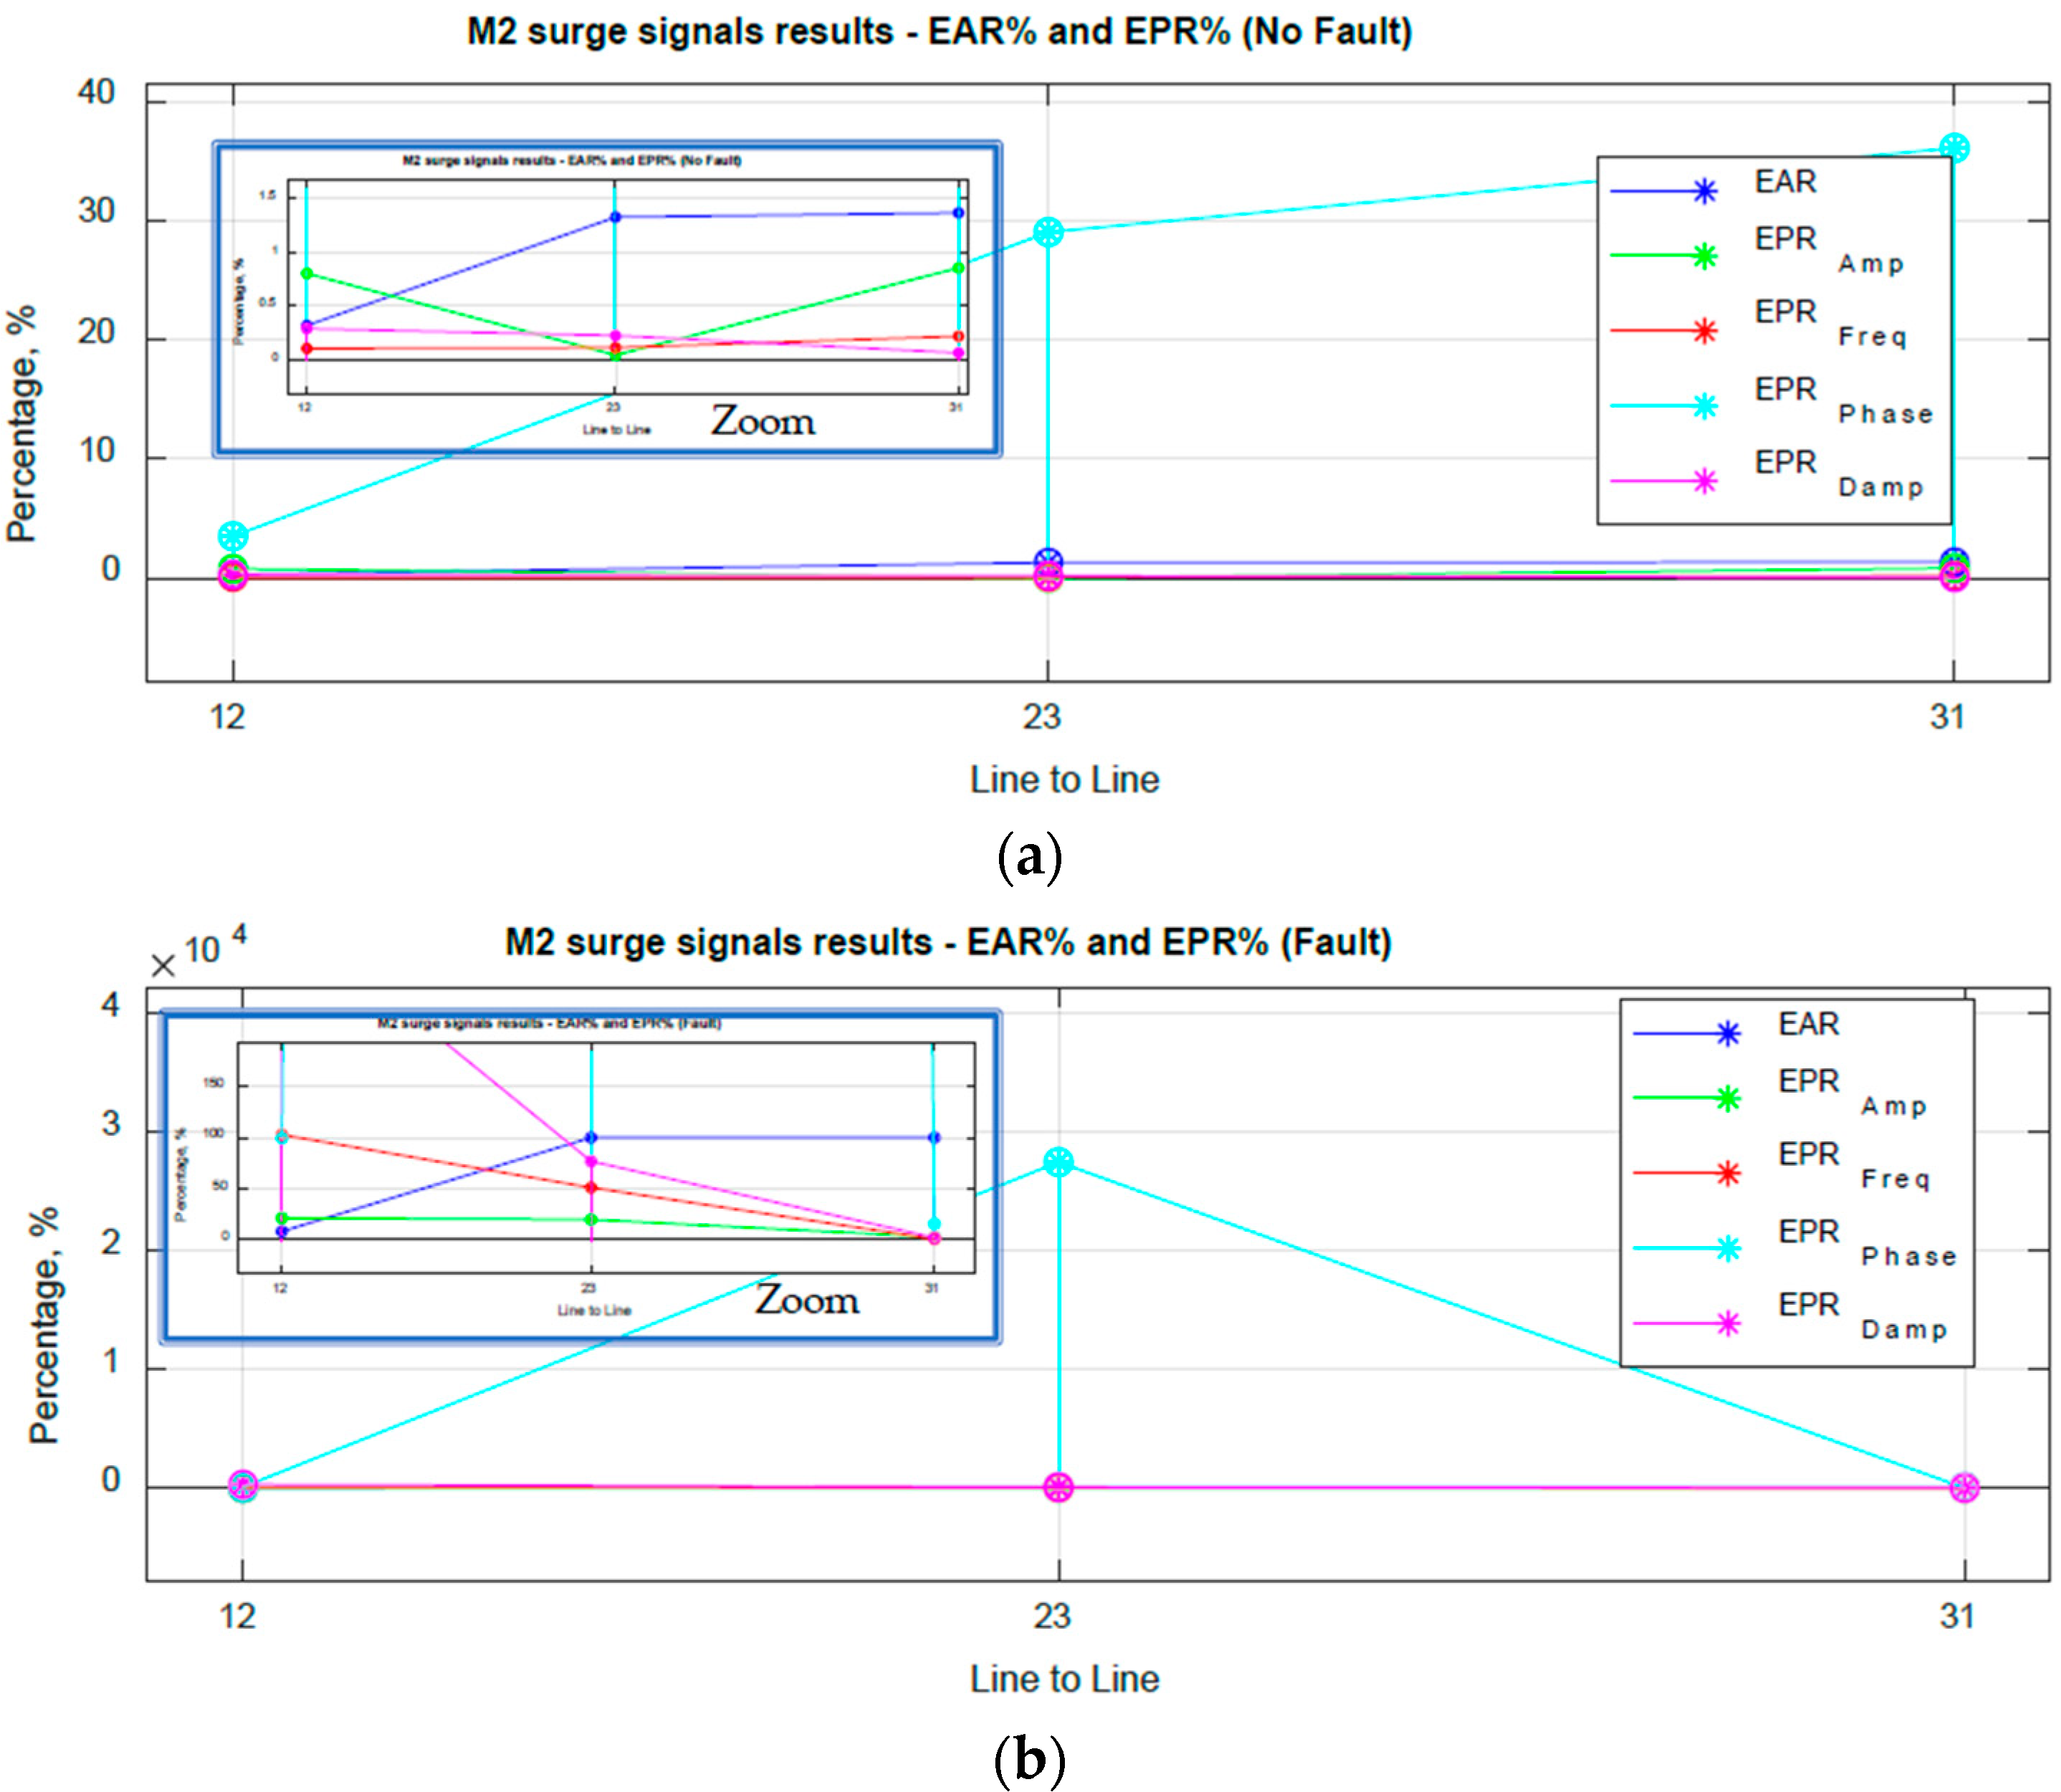
4.2. Assessment of Real Surge Signals from Tested Motor Windings

In this section, two motors of 460 V and 5 HP with random-wound single-layer winding were tested using a commercial insulation tester to perform an SCT during a maintenance routine. The surge waveforms used for the analysis were recorded and exported by the insulation tester and the recorded data was used for the analysis. An electric motor maintenance and repair company (Grupo Marro de México) provided us with the recorded data of the two tested motors for analysis. The sampling rate of the surge signals was 10MS/s (Mega samples per second) and 480 samples of full length surge waveform; this value could be different between insulation testers. Also, it should be mentioned that the motors were disassembled, and for each tested motor stator winding (no rotor installed), two diagnostic scenarios using the recorded real surge waveforms were analyzed: (1) winding insulation damaged: a fault where each motor was detected to have an insulation failure during maintenance routine. (2) Repaired motors (rewinding): no-fault after rewinding of each motor (see Figure 7). For purposes of the analysis and validation of the proposed method, two different types of fault were analyzed, a phase-to-phase short (Motor 1) and turn-to-turn short (Motor 2). This type of faults is not physically evident when the winding of the motor is exposed, which is why turn insulation testing is frequently used in the industry and electric motor repair companies.
(1) Error Area Ratio index results: The %EAR index of the recorded surge waveforms from the tested motors was calculated using (2). The results are presented in Table 5, and the signals used for analysis for both motors are presented in Figure 7.
In the Motor 1 results, a no-fault scenario has an average of 7.5% of difference between %EAR Line-Line. There is a minimum difference between signals, so a slight change in frequency can be observed (see Figure 7a). In Figure 7a, in the Motor 1 results fault scenario, an amplitude and frequency change in one of the signals can be observed. This is an indication of a phase-phase short. For the surge signals of the Motor 2 no-fault scenario in Figure 7b, a minimum difference between signals could be observed. In the fault scenario, the difference between %EAR has an average of 61.02%, so in Figure 7b, an amplitude and frequency change can be observed in the signal. This is an indication of a turn-to-turn fault.
(2) Prony method estimation results: The performance of the Prony method considerations for SCT described in Section 3 was evaluated using the recorded surge signals from Figure 7. The estimated signal parameters (frequency, amplitude, phase angle and damping) using Prony method estimation were obtained from (7), (8), (11) and (12) and then compared with each other for both scenarios of no-fault and fault, so the %EPR in (14) was obtained and a diagnostic could be defined. The estimated signal parameters of the real surge waveforms are presented in Table 6.
The results presented in Table 6 correspond to the parameter estimation of the recorded signals in Figure 7. The following results for Motor 1 for no-fault were obtained; the estimated frequencies of the signals Vab, Vbc, Vca were 87.18 kHz, 87.86 kHz and 86.67 kHz, and their amplitudes 2048.09 V, 2074.11 V and 2035.44 V. As observed in the signals in Figure 7a, the difference between them can barely be detected, but a slight change in frequency and amplitude can be seen. Also, the estimated phase angle and damping corresponds to the signals in Figure 7a. In the Motor 2 results for no-fault, similar results in the estimated parameters as in Motor 1 for no-fault were obtained.
The estimated frequencies of the signals Vab, Vbc, Vca for Motor 2 for no-fault were 85.82 kHz, 85.91 kHz and 86.01 kHz, and their amplitudes 2649.04 V, 2627.71 V and 2626.54 V. It can be seen in Figure 7b for no-fault that a small difference between them goes almost undetected, but in the estimated parameters results, a slight difference between parameters can be detected, increasing the sensitivity of SCT.
In Figure 7a,b for the fault condition for Motor 1 and Motor 2, it can be clearly observed that a difference between signals exist, so when the estimation of the signal parameters is obtained, the difference observed in the signals can be corroborated in each of the parameters estimated (see Table 6). In order to validate the results in Table 6, each surge voltage signal (real and estimated) was compared with each other and presented in Figure 8. Where the MSE curve fitting of the signals was calculated and presented for each surge voltage signal, the average MSE percentage curve fitting results between real and estimated signals are calculated as follows: for Motor 1 for no-fault it was 4.93 × 10⁻²⁰% and for a fault condition it was 3.19 × 10⁻²⁰%; for Motor 2 for no-fault it was 4.56 × 10⁻²⁰% and for a fault condition it was 8.84 × 10⁻²⁰%. The results confirm that an accurate estimate of the surge signals parameters was achieved. In Table 7, the %EPR of each parameter estimated of the real surge signals is presented. It can be seen that the differences observed in the signals in Figure 7 and Table 6 are an indication of a no-fault or a fault condition. It was observed for each of the estimated parameters of the surge signals that for a no-fault condition, the calculated %EPR between parameters has a small value, and for the fault condition, the %EPR increases considerably, mainly because now the comparison is being made with the estimated parameters of the signals instead of the comparison of the full data signal. Also, the results in Table 7 compared with the %EAR index results from Table 5 corroborate the no-fault and fault condition diagnosis for the two motor stator windings analyzed, which is the expected result to validate the proposed method for SCT application as a new tool to improve the accuracy and sensitivity of the SCT diagnostics by using the signal parameters.
In Figure 9, it is evident that the %EPRAmp, %EPRFreq, and %EPRDamp has a low value in comparison with the %EAR for a no-fault condition of Motor 1, as shown in Table 7, but the %EPRPhase has a greater value which corresponds to the phase angle displacement between the signals of Motor 1 in Figure 8a. Also, it is important to observe that for the fault condition in Motor 1 in Figure 9b, there is no great change in %EPRFreq, because the fault signals in Figure 7a do not show a great change in frequency, but a change in amplitude, phase angle and damping could be observed. Therefore, the %EPRAmp, %EPRFreq, %EPRPhase and %EPRDamp validate the difference of parameters between signals.
In Figure 10, the %EPRAmp, %EPRFreq, and %EPRDamp also have a low value in comparison with the %EAR for a no-fault condition of Motor 2, as shown in Table 7, but the %EPRPhase has a greater value, which corresponds to the phase angle displacement between the signals of Motor 2 in Figure 8a. For the fault condition in Motor 2 in Figure 10b, there is a great change in %EPRFreq, %EPRPhase and %EPRDamp because the fault signals in Figure 7b show a great change in frequency, phase angle and damping, but there is not a great difference in amplitude, as can be observed in Figure 7b, so the %EPRAmp does not show a great value in comparison with the %EPRFreq, %EPRPhase and %EPRDamp, therefore the %EPRAmp, %EPRFreq, %EPRPhase and %EPRDamp validate the difference of parameters between signals.
It is evident that in the simulation results in Figure 6, a difference in magnitude of %EPR is minimum because the signals are obtained during simulation at a specified and equal Vtest, as is presented in Table 1. In the case of the M1 and M2 real surge data results in Figure 9 and Figure 10, a greater difference in magnitude of %EPR is observed when compared with the simulation results in Figure 6. The main reason will be that the %EPR is being calculated for each estimated parameter (amplitude, frequency, damping and phase angle) using Equation (14), and the %EAR is being calculated by comparing only the full data signal using Equation (2). The increase in the %EPR compared with the %EAR occurs because the differences between signal parameters, for example between damping or phase angle, could be greater than amplitude or frequency, and the %EPR will be of greater magnitude compared with %EAR, so this indicates that the sensitivity and accuracy of the diagnostic will be increased if an %EPR is defined as a diagnostic index limit for a specific type of fault.

5. Conclusions

In this work, the Prony method is proposed and validated as a new tool for the SCT diagnostics of induction motors. The performance of the method for SCT application showed good and promising results, where the signal parameters of each of the surge voltage signals were estimated, and then the %EPR of the estimated parameters of each signal was used to compare the results with %EAR index, where more sensitive and accurate results are obtained by using the parameters estimated instead of the data signal, as is presented in Table 2 and Table 4 using simulated signals, and in Table 5 and Table 7 using real recorded surge signals presented in Figure 6. The full Prony estimation process takes about 50 s using the recorded surge waveforms with a sampling rate of 10 MS/s. It is important to mention that the estimation calculation time could be reduced if the sampling rate is reduced, as is mentioned in Section 3, and so the Prony estimation method is a good option for its application in SCT diagnostics of electric motors, mainly because the results show that there is a minimum error in the estimated signal parameters, where the MSE curve fitting has a very low value, indicating a good estimation.
In the future, a wider study considering different types of turn insulation faults in a winding will be performed, where the remaining frequencies of the optimum set of estimated parameters for each type of fault could be the subject of further research, particularly where a fault classifier or a diagnostic criteria using %EPR could be defined for different types of faults within a range of motors rated power using the estimated parameters of the recorded surge signals, and with this information, the classification of faults can be determined, or a standard could be defined or updated, such as the IEEE std 522.
The main reason why the Prony method is proposed and evaluated as an alternative for this application, is to establish a more precise diagnostic in SCT, mainly because many insulation faults start as a turn-to-turn insulation weakness and there is no current standard that defines the %EAR index for a particular turn-insulation failure in the winding; only reference values of %EAR exist, and the %EAR reference values that exist nowadays are not consistent between referenced documents.
With the results obtained, it can be concluded that the use of the Prony method as a diagnostic tool in SCT could be feasible. The method could be implemented as new software or a software update in SCT insulation tester equipment for electric motors, with no need of hardware updates. It is important to emphasize that the differences between estimated parameters (%EPR index) can be used as a new tool to improve the accuracy and sensitivity of SCT diagnostic criteria, where a SCT standard or database to classify different types of stator and rotor winding faults could be defined. Also, it could be used to evaluate armature and field windings for DC motors, and this will be the subject of a future study.

6. Patents

The analysis and validation presented in this manuscript resulted in a patent entitled “Proceso de diagnóstico de aislamiento mediante prueba de impulso con estimador paramétrico de Prony (Turn insulation diagnostic process by surge test with Prony parametric estimator)” and the registered number at the Mexico patent office (IMPI) is: MX/a/2021/008381.

Author Contributions

Conceptualization, Methodology, Software, Validation, Resources, Data curation, Visualization, Investigation, Writing-Original draft preparation, Writing-Review & Editing, L.A.T.G.; Software, Resources, Visualization, Investigation, Writing-Review & Editing, L.H.R.A., J.R.M., M.A.G.V., F.S.S. and M.Y.S. All authors have read and agreed to the published version of the manuscript.

Funding

This research received no external funding.

Institutional Review Board Statement

Not applicable.

Informed Consent Statement

Not applicable.

Data Availability Statement

Not applicable.

Acknowledgments

The authors would like to thank Grupo Marro de México S.A. de C.V. for providing them with the signal records of the tested electric motors for the corresponding analysis.

Conflicts of Interest

The authors declare no conflict of interest.

Abbreviations

AbbreviationDefinition
EARError Area Ratio
SCTSurge Comparison Test
ZCTZero Crossing Time
WTWavelet Transform
ANNArtificial Neural Network
GLRTGeneralized Likelihood Ratio Test
MLEMaximum Likelihood Estimation
LPMLinear Prediction Model
MSEMean Square Error
EDHEstimated Dominant Harmonic
EPRError Parameter Ratio

References

  1. SKF Static Motor Analyzer Baker DX User Manual, SKF Baker Instrument Company, Fort Collins, CO, USA. Available online: https://www.perel.fi/files/item/103962038/pub-cm-71-030vi-en-baker-dx-user-manual.pdf (accessed on 30 November 2022).
  2. Dc step-voltage and surge testing of motors. SKF Baker Instrument Company, Fort Collins, CO, USA. Available online: https://fdocuments.in/document/dc-step-voltage-and-surge-testings-of-motors.html (accessed on 30 November 2022).
  3. Stone, G.C.; Boulter, E.A.; Culbert, I.; Dhirani, H. Off-line rotor and stator winding tests. In Electrical Insulation for Rotating Machines–Design, Evaluation, Aging, Testing, and Repair, 2nd ed.; John Wiley & Sons, Inc.: Hoboken, NJ, USA; Wiley-IEEE Press: Hoboken, NJ, USA, 2014; pp. 363–367. [Google Scholar]
  4. Wiedenbrug, E.; Frey, G.; Wilson, J. Impulse testing as a predictive maintenance tool. In Proceedings of the 2003 4th IEEE Int. Symp. on Diagnostics for Electric Machines, Power Electronics and Drives, Atlanta, GA, USA, 24–26 August 2003. [Google Scholar] [CrossRef]
  5. Narang, A.; Gupta, B.K.; Dick, E.P.; Sharma, D. Measurement and analysis of surge distribution in motor stator windings. IEEE Trans. Energy Convers. 1989, 4, 126–134. [Google Scholar] [CrossRef]
  6. Grubic, S.; Restrepo, J.; Habetler, T.G. Sensitivity Analysis of the Surge Test Applied to AC Machines. In Proceedings of the 2011 IEEE Int. Electric Machines & Drives Conference (IEMDC), Niagara Falls, ON, Canada; May 2011. [Google Scholar] [CrossRef]
  7. Nakamura, H. Diagnosis of Short-Circuit Faults in Stator Winding Inside Low-Voltage Induction Motor Using Impulse Voltage Test. Electr. Eng. Jpn. 2015, 191, 915–921. [Google Scholar] [CrossRef]
  8. Ukila, A.; Chenb, S.; Andennaa, A. Detection of stator short circuit faults in three-phase induction motors using motor current zero crossing instants. Electr. Power Syst. Res. 2011, 81, 1036–1044. [Google Scholar] [CrossRef]
  9. Gketsis, Z.E.; Zervakis, M.E.; Stavrakakis, G. Detection and classification of winding faults in windmill generators using Wavelet Transform and ANN. Electr. Power Syst. Res. 2009, 79, 1483–1494. [Google Scholar] [CrossRef]
  10. Guedes, A.S.; Silva, S.M.; Filho, B.; de, J.C.; Conceição, C.A. Evaluation of electrical insulation in three-phase induction motors and classification of failures using neural networks. Electr. Power Syst. Res. 2016, 140, 263–273. [Google Scholar] [CrossRef]
  11. Tallam, R.M.; Habetler, T.G.; Harley, R.G. Transient model for induction machines with stator winding turn faults. IEEE Trans. Ind. Appl. 2002, 38, 632–637. [Google Scholar] [CrossRef]
  12. Grubic, S.; Restrepo, J.; Habetler, T.G. A new concept for online surge testing for the detection of winding insulation deterioration in low voltage induction machines. IEEE Trans. Ind. Appl. 2011, 45, 2051–2058. [Google Scholar] [CrossRef]
  13. Li, X.; Xu, Y.; Li, N.; Yang, B.; Lei, Y. Remaining Useful Life Prediction With Partial Sensor Malfunctions Using Deep Adversarial Networks. IEEE/CAA J. Autom. Sin. 2023, 10, 121–134. [Google Scholar] [CrossRef]
  14. Zhang, W.; Wang, Z.; Li, X. Blockchain-based decentralized federated transfer learning methodology for collaborative machinery fault diagnosis. Reliab. Eng. Syst. Saf. J. 2023, 229, 108885. [Google Scholar] [CrossRef]
  15. Gaerke, T.; Lang, N. A Problematic Field Experience Using Surge Testing. In Proceedings of the 2020 IEEE Electrical Insulation Conf. (EIC), Knoxville, TN, USA, 22 June–3 July 2020. [Google Scholar] [CrossRef]
  16. Galea, M.; Giangrande, P.; Madonna, V.; Buticchi, G. Reliability-Oriented Design of Electrical Machines: The Design Process for Machines’ Insulation Systems MUST Evolve. IEEE Ind. Electron. Mag. 2020, 14, 20–28. [Google Scholar] [CrossRef]
  17. Wiedenbrug, E.; Frey, G.; Wilson, J. Impulse Testing And Turn Insulation Deterioration In Electric Motors. In Proceedings of the 2003 IEEE Conf. Rec. of Annual Pulp and Paper Industry Tech. Conf., Charleston, SC, USA, 16–20 June 2003. [Google Scholar] [CrossRef]
  18. Baranski, M.; Decner, A.; Polak, A. Selected Diagnostic Methods of Electrical Machines Operating in Industrial Conditions. IEEE Trans. Dielectr. Electr. Insul. 2014, 21, 2047–2054. [Google Scholar] [CrossRef]
  19. Ojaghi, M.; Sabouri, M.; Faiz, J. Diagnosis methods for stator winding faults in three-phase squirrel-cage induction motors. Int. Trans. Electr. Energy Syst. 2013, 24, 891–912. [Google Scholar] [CrossRef]
  20. Surge Comparison Tests Pass/Fail Recommendations. Available online: https://electrominst.com/wp-content/uploads/2016/08/Surge-Test-Pass-Fail-Recommendations-06072016R4.pdf (accessed on 30 November 2022).
  21. IEEE Std 522-2004; IEEE Guide for Testing Turn Insulation of Form-Wound Stator Coils for Alternating-Current Electric Machines. IEEE: Piscataway, NJ, USA, 2004; pp. 1–28. [CrossRef]
  22. Lobos, T.; Reziner, J.; Schegner, P. Parameter estimation of distorted signals using Prony method. In Proceedings of the 2003 IEEE Bologna Power Tech Conference Proceedings, Italy, Bologna, Italy, 23–26 June 2003. [Google Scholar] [CrossRef]
  23. Leonowicz, Z.; Lobos, T.; Rezmer, J. Advanced Spectrum Estimation Methods for Signal Analysis in Power Electronics. IEEE Trans. Ind. Electr. 2003, 50, 514–519. [Google Scholar] [CrossRef]
  24. Wrocław University of Science and Technology Digital Library. Parametric Methods for Time–Frequency Analysis of Electric Signals. Available online: https://www.dbc.wroc.pl/dlibra/publication/1877/edition/2021?language=pl (accessed on 30 November 2022).
  25. Qi, L.; Qian, L.; Woodruff, S.; Cartes, D. Prony Analysis for Power System Transients. EURASIP J. Adv. Signal Process. 2007, 2007, 048406-170. [Google Scholar] [CrossRef] [Green Version]
  26. Meunier, M.; Brouaye, F. Fourier transform, Wavelets, Prony Analysis: Tools for Harmonics and Quality of Power. In Proceedings of the 8th Int. Conf. on Harmonics and Quality of Power ICHQP’98, Greece, Athens, Greece, 14–16 October 1998. [Google Scholar] [CrossRef]
  27. Johnson, M.A.; Zarafonitis, I.P.; Calligaris, M. Prony analysis and power system stability-some recent theoretical and applications research. In Proceedings of the 2000 Power Engineering Society Summer Meeting, USA, Seattle, WA, USA, 16–20 July 2000. [Google Scholar] [CrossRef]
  28. Castillo, R.; Ramírez, J.R.; Alonso, G.; Ortiz-Villafuerte, J. Prony’s method application for BWR instabilities characterization. Nucl. Eng. Des. J. Elsevier 2014, 284, 67–73. [Google Scholar] [CrossRef]
  29. Trujillo Guajardo, L.A. Prony filter vs conventional filters for distance protection relays: An evaluation. Electr. Power Syst. Res. 2016, 137, 163–174. [Google Scholar] [CrossRef]
  30. Guajardo, L.A.T.; Enríquez, A.C.; Ospina, G.M.I. Prony method implementation in distance relays to mitigate the effect of series-compensated transmission lines. Springer Electr. Eng. 2016, 99, 227–239. [Google Scholar] [CrossRef]
  31. Trujillo Guajardo, L.A. Relevador De Protección De Distancia Con Estimador Fasorial De Prony (MX Patent No. 351620 B). México Patent Office, Instituto Mexicano de la Propiedad Industrial, IMPI. 2017. Available online: https://vidoc.impi.gob.mx/visor?usr=SIGA&texp=SI&tdoc=E&id=MX/a/2014/012486 (accessed on 27 January 2023).
  32. Ahn, S.; Koh, J. RCS Prediction Using Prony Method in High-Frequency Band for Military Aircraft Models. Aerospace 2022, 9, 734. [Google Scholar] [CrossRef]
  33. Trujillo Guajardo, L.A.; Platas Garza, M.A.; Rodríguez Maldonado, J.; González Vázquez, M.A.; Rodríguez Alfaro, L.H.; Salinas Salinas, F. Prony Method Estimation for Motor Current Signal Analysis Diagnostics in Rotor Cage Induction Motors. Energies 2022, 15, 3513. [Google Scholar] [CrossRef]
  34. Ribeiro, P.F.; Duque, C.A.; Ribeiro, P.M.; Cerqueira, A.S. Spectral Estimation. In Power Systems Signal Processing for Smart Grids, 1st ed.; Wiley: London, UK, 2014; pp. 254–270. [Google Scholar]
Figure 1. Surge comparison test circuit. (a) Surge test motor connection (b) Equivalent circuit.
Machines 11 00241 g001
Figure 2. Surge comparison test signals (turn insulation failure example).
Machines 11 00241 g002
Figure 3. Surge comparison test equivalent circuit simulation.
Machines 11 00241 g003
Figure 4. Surge waveforms obtained from simulation of surge comparison equivalent circuit (a) No fault (b) Fault.
Machines 11 00241 g004
Figure 5. Simulated surge waveforms estimation (a) No fault (b) Fault.
Machines 11 00241 g005
Figure 6. EAR% and EPR% index results comparison of simulated signals. (a) No fault. (b) Fault.
Machines 11 00241 g006aMachines 11 00241 g006b
Figure 7. Tested motors and resulting surge waveforms from SCT (a) Motor 1 (b) Motor 2.
Machines 11 00241 g007
Figure 8. Real surge waveforms curve fitting estimation Motor 1 and Motor 2 (a) No fault (b) Fault.
Machines 11 00241 g008aMachines 11 00241 g008b
Figure 9. EAR% and EPR% index results comparison of M1 surge signals. (a) No fault (b) Fault.
Machines 11 00241 g009
Figure 10. EAR% and EPR% index results comparison of M2 surge signals. (a) No fault (b) Fault.
Machines 11 00241 g010
Table 1. Equivalent circuit parameters.
ParametersNo Fault ScenarioFault Scenario
Overall Resistance, R (Ω)280280
Winding Inductance,
Lab, Lbc, Lca (mH)
10.5, 10.4, 10.610.5, 12.4, 10.6
Surge Capacitance, C1 (µF)0.00450.0045
Test Voltage, Vtest (V)25002500
Switching frequency S1, S2 (Hz)10001000
Simulation time step, (Sec)0.00000010.0000001
Table 2. Error area ratio index results.
%Ratiorea RatioNo Fault ScenarioFault Scenario
EAR 125.0984.20
EAR 2310.2969.14
EAR 315.075.07
Table 3. Estimated signal parameters of simulated surge waveform (No fault and Fault).
Estimated Signal ParametersNo FaultFaultSignals
Frequency (Hz)23,008.0223,008.02Vab
23,010.9022,971.12Vbc
23,005.6823,005.68Vca
Amplitude2500.312500.31Vab
2500.312503.60Vbc
2500.312500.31Vca
Phase (rad)−0.133099−0.133099Vab
−0.133099−0.127911Vbc
−0.133099−0.133099Vca
Damping−13,205.63−13,205.63Vab
−13,207.28−13,387.39Vbc
−13,204.29−13,204.29Vca
Table 4. Error parameter ratio percentage of line-to-line estimated signal parameters of simulated surge waveforms (No fault and Fault).
Estimated Signal
Parameters
EPR (%)
No FaultFaultLines
Frequency (Hz)0.01250.1603L1-L2
0.0220.1504L2-L3
0.01010.0101L3-L1
Amplitude00.1315L1-L2
00.1314L2-L3
00L3-L1
Phase (rad)03.8978L1-L2
04.0559L2-L3
00L3-L1
Damping0.01241.3763L1-L2
0.02261.3677L2-L3
0.01010.0101L3-L1
Table 5. Error area ratio index results from tested motors.
%Error Area Ratio
(Line-Line)
Motor 1
FaultNo Fault
EAR 1243.687.32
EAR 2327.9118.62
EAR 3174.4111.65
%Error Area Ratio
(Line-Line)
Motor 2
FaultNo Fault
EAR 128.460.32
EAR 231001.33
EAR 311001.37
Table 6. Estimated signal parameters of recorded surge waveforms. (No fault and Fault).
Motor 1
Estimated Signal
Parameters
VabVbcVca
No FaultFaultNo FaultFaultNo FaultFault
Frequency (Hz)87,184.4475,122.0187,865.0458,589.5586,675.0265,113.59
Amplitude2048.091904.942074.11547.822035.441723.16
Phase (rad)0.054120.383900.051081.158060.072281.18490
Damping−23,663.52−19,266.73−22,949.13−68,487.07−22,676.50−35,561.65
MSE Curve fitting5.40 × 10−203.34 × 10−207.55 × 10−201.46 × 10−211.86 × 10−206.10 × 10⁻²⁰
Motor 2
Estimated Signal
Parameters
VabVbcVca
No FaultFaultNo FaultFaultNo FaultFault
Frequency (Hz)85,827.3564,832.1485,918.12131,426.9586,016.3064,095.47
Amplitude2649.042083.442627.712530.112626.542022.63
Phase (rad)0.098990.078280.102490.000330.072740.093057
Damping−28,408.73−21,322.28−28,326.12−90,076.64−28,390.32−20,809.97
MSE Curve fitting5.47 × 10−206.96 × 10−203.64 × 10−206.56 × 10−214.57 × 10−201.23 × 10⁻²⁰
Table 7. Error parameter ratio percentage of real surge waveforms. (No fault and Fault).
Motor 1
Estimated Signal ParametersEPR L-L, (%)
1-2
EPR L-L, (%)
2-3
EPR L-L, (%)
3-1
No FaultFaultNo FaultFaultNo FaultFault
Frequency (Hz)0.780622.0071.354311.1350.587715.370
Amplitude1.270771.2411.8644214.540.621210.549
Phase (rad)5.6289201.6541.5022.317225.11467.600
Damping3.0189255.461.187948.0754.352545.821
Motor 2
Estimated Signal ParametersEPR L-L, (%)
1-2
EPR L-L, (%)
2-3
EPR L-L, (%)
3-1
No FaultFaultNo FaultFaultNo FaultFault
Frequency (Hz)0.1057102.710.114251.2310.21961.1493
Amplitude0.805221.4390.044520.0570.85673.0062
Phase (rad)3.535499.56929.02027,482.0936.07315.878
Damping0.2907322.450.226676.8970.06482.4618
Disclaimer/Publisher’s Note: The statements, opinions and data contained in all publications are solely those of the individual author(s) and contributor(s) and not of MDPI and/or the editor(s). MDPI and/or the editor(s) disclaim responsibility for any injury to people or property resulting from any ideas, methods, instructions or products referred to in the content.

