Article

Melt Pool Monitoring and X-ray Computed Tomography-Informed Characterisation of Laser Powder Bed Additively Manufactured Silver–Diamond Composites

1
Additive Manufacturing of Functional Materials (AMFM) Research Group, School of Engineering, University of Wolverhampton, Telford Innovation Campus, Telford TF2 9NT, UK
2
Additive Analytics Ltd., Telford TF3 1EB, UK
3
Aceon Group, Telford TF3 3BJ, UK
4
School of Engineering and Applied Science, Aston University, Aston Triangle, Birmingham B4 7ET, UK
*
Author to whom correspondence should be addressed.
Machines 2023, 11(12), 1037; https://doi.org/10.3390/machines11121037
Submission received: 29 September 2023 / Revised: 24 October 2023 / Accepted: 18 November 2023 / Published: 21 November 2023
(This article belongs to the Special Issue Fundamentals and Applications of 3D Printing for Novel Materials)

Abstract

:
In this study, silver (Ag) and silver–diamond (Ag-D) composites with varying diamond (D) content are fabricated using laser powder bed fusion (L-PBF) additive manufacturing (AM). The L-PBF process parameters and inert gas flow rate are optimised to control the build environment and the laser energy density at the powder bed to enable the manufacture of Ag-D composites with 0.1%, 0.2% and 0.3% D content. The Ag and D powder morphology are characterised using scanning electron microscopy (SEM). Ag, Ag-D0.1%, Ag-D0.2% and Ag-D0.3% tensile samples are manufactured to assess the resultant density and tensile strength. In-process EOSTATE melt pool monitoring technology is utilised as a comparative tool to assess the density variations. This technique uses in-process melt pool detection to identify variations in the melt pool characteristics and potential defects and/or density deviations. The resultant morphology and associated defect distribution for each of the samples are characterised and reported using X-ray computed tomography (xCT) and 3D visualisation techniques. Young’s modulus, the failure strain and the ultimate tensile strength of the L-PBF Ag and Ag-D are reported. The melt pool monitoring results revealed in-process variations in the build direction, which was confirmed through xCT 3D visualisations. Additionally, the xCT analysis displayed density variations for all the Ag-D composites manufactured. The tensile results revealed that increasing the diamond content reduced Young’s modulus and the ultimate tensile strength.

1. Introduction

Silver (Ag) is a desirable material for many applications due to its antimicrobial and high thermal and electrical conductive properties [1,2,3,4,5,6]. Therefore, Ag is receiving increasing academic and industry interest as a base and alloying element for thermal, biomedical and electronics applications [1,2,3,7,8]. Diamond (D) also has unique and desirable properties, including high hardness, excellent thermal conductivity, high electrical resistivity and high wear resistance [9,10,11,12]. Ag and D have excellent thermal conductivity properties of 430 W/(m·K) and 2200 W/(m·K), with a density of 10.49 g/cm3 and 3.52 g/cm3 and electrical resistivity of 1.6 × 10⁻⁸ Ω·m and 1.0 × 10⁻¹⁸ Ω·m, respectively. Hence, the combination of silver and diamond for numerous applications would be highly beneficial as the material could simultaneously meet the requirements of many industries for high thermal conductivity and electrified transport applications due to the thermal performance and lower density. However, due to diamond’s high melting point and strong covalent bonds, it is notoriously difficult to process using conventional manufacturing methods, and silver’s high reflectivity at infrared laser wavelengths makes it challenging to laser weld or manufacture using laser powder bed fusion (L-PBF) additive manufacturing (AM).
Additionally, the scarcity and relatively high cost of both materials limit their use in most applications. The variability in and cost of natural D restricted its use in engineering applications until material manufacturing breakthroughs enabled the fabrication of consistent synthetic diamond in the 1950s and 1980s [13]. The use of precious metal Ag pre-dates 1000 B.C. [14], and due to its ductile nature, it can be manufactured using forging, lost-wax casting, rolling, hand fabrication and machining techniques. However, Ag is also relatively expensive when compared with other engineering metallic materials. For example, while 1 kg of atomised aluminium (Al) can cost GBP44, 1 kg of atomised Ag can cost more than GBP933. In order to mitigate this high cost of Ag, a customised small build chamber (120 mm × 120 mm × 120 mm) is utilised in this study in comparison to most studies, which utilise a large (250 mm × 250 mm × 325 mm) build chamber. As such, a small batch of materials are required to prepare the build parts. A small geometry tensile bar is also considered to prepare to mitigate the limitation. While copper–diamond (Cu-D) metal-matrix composites (MMC) have seen investigation [15,16] and L-PBF Cu-D has been reported [17], the fabrication of Ag-D MMCs has seen limited investigation [18,19,20], with the L-PBF of Ag-D yet to be reported.
For example, Nakagawa et al. investigated the thermal diffusivity of sintered pure silver and potential for the improved low-temperature cooling of heat exchangers for quantum computing and nanoelectric applications [21]. Using laser flash thermal diffusivity techniques, the results reported that the thermal diffusivity of sintered pure Ag was 52%, 50% and 38% depending on the particle size, which could be attributed to the sintered pure Ag surface area, bond strength (between powder particles) and pore volume effects on the thermal transfer [21]. However, the bonding strength between the particles for some investigated materials was equivalent to the material that is currently most widely used for ultra low temperature cooling [21]. Bonilla-Gameros et al. investigated healthcare-associated infections and antibiotic-resistant pathogens and the developments in the design and manufacture of Ag-based antibacterial surfaces utilising Ag compounds for pathogen biofilm prevention [5].
Plasma processes (magnetron, sputtering and atmospheric pressure) alongside 3D printing are highlighted as promising technologies for the controlled release of Ag ions; however, the lack of regulation related to Ag-based components is still a challenge [5]. Due to the biocompatibility and chemical inertness of D, Yang et al. investigated D in relation to protective coating for neural interface devices and they stated that the D interface potential for various medical conditions included spinal cord injury, hearing loss and visual impairment, among many others. However, in vivo research and investigation is still required [9]. Mashali et al. conducted a literature review of the thermal–physical properties of diamond nanofluids for potential enhanced thermal performance for automotive and electronic cooling applications and reported that the most critical parameter for improved fluid thermal performance was diamond nanoparticle content [10].
Moreover, the creation of Ag-D composites using in situ reduction/deposition, cold-pressing and vacuum-sintering techniques for antibacterial and thermal management applications has also been investigated in the research [19,22,23,24]. Xu et al. prepared a Ag-D composite in solution and investigated the antibacterial ability against Escherichia coli (E. coli) bacteria. The Ag-D composite displayed a broad spectrum and efficient antibacterial properties. At a relatively low Ag-D solution content, E. coli growth was almost inhibited, showing potential as a biomedical implant coating [19]. Lee et al. prepared Ag-D composites through plating and hot-pressing techniques and investigated the resultant thermal conductivity and coefficient of the thermal expansion properties for potential microelectronic thermal management applications. At 20% D vol.%, the composite displayed the maximum thermal conductivity at 420 W/m·K, with the thermal conductivity decreasing with D content above 20 vol.%. Below 40 vol.% of D, the density of the composites was reported as 96% [24]. More recent research has investigated combining D MMCs and advanced manufacturing AM techniques. The layer-by-layer AM processes enable the fabrication of complex metal parts that are not feasible with more traditional machining, forming and casting technologies, and therefore, due to traditional manufacturing limitations, AM is seeing increasing investigations.
Constantin et al. utilised direct energy deposition AM to process a copper–diamond (Cu-D) composite with a titanium (Ti)-based coating. With a Cu 25 vol.%, a thermal conductivity of 330 W/m·K and density of 96% were reported. High energy density was required to create dense composites and, as such, 900 W laser power and 12.7 mm/s were required; however, no D graphitisation was displayed [16]. Gan et al. studied the L-PBF fabrication of Cu-Sn-Ti-D composites for potential abrasive tooling applications with comparative hot-pressed sintered samples. The optimum L-PBF process parameters were reported as a 260 W laser power, 300 mm/s scan speed and 90 µm layer thickness, resulting in the highest density of 91.95%.
L-PBF improved the D bonding relative to the sintered samples without D carbonisation [25]. Ma et al. fabricated an Al-D composite utilising L-PBF and Al12Si-D 10 vol.% powder mixes, and they reported that a 300 W laser power with 30 µm layer thickness and a hatch distance of 105 µm were utilised while the scan speeds were varied between 600 mm/s to 1600 mm/s. A higher energy density increased the composite density with a maximum density of 90%. D 10 vol.% was reported, with the thermal conductivity being negatively affected by a low composite density [26]. The examples discussed confirm the clear benefits of Ag-D composites and the demand for various applications with significant potential implications for the thermal management and biomedical industries. However, the studies also highlight the future challenges related to further research and regulations related to Ag and D and densification challenges for AM metal-matrix composites (MMCs).
L-PBF AM is the most mature and commercially adopted metal 3D printing technology [27], which utilises laser energy to selectively melt material in a layer-by-layer process. However, the development of an L-PBF-processable Ag-D MMC that possesses unparalleled thermal conductivity performance and desirable mechanical properties, with a significantly lighter weight (than the base metal), is yet to materialise and would permit a step change in efficiency for many industries, enabling the development of the next generation of technologies; the feasibility of L-PBF AM of a Ag-D MMC is yet to be reported, leaving a gap in the knowledge. Accordingly, this study investigates the direct fabrication of Ag-D MMCs utilising L-PBF techniques with Ag samples manufactured as a base sample. The diamond content is then increased from 0.1 to 0.3 wt.% and the process parameters such as the turbine pressure and scan speed are optimised to ensure feasible L-PBF Ag-D fabrication. The Ag and D powder morphology and composition are investigated using a scanning electron microscopy (SEM) analysis and the pore morphology and distribution are investigated and compared using in-process melt pool monitoring (MPM), X-ray computed tomography (xCT) and 3D visualisation techniques.

2. Material and Methods

The AM investigations reported in this study were carried out using a standard sterling silver (Ag alloy), Ag-D0.1, Ag-D0.2 and Ag-D0.3 wt.% powders comprising Ag alloy with a composition of 92.53% Ag, 5.26% Cu, 1.77% Ge and the remainder ((Mg) and germanium (Ge) balance) and chemical vapour deposition (CVD) synthetic diamond powder supplied by Cookson Gold and Element 6.

2.1. Laser Powder Bed Fusion (L-PBF)

All builds were performed using an EOS M290 (ESO GmbH, Tettnang, Germany) industrial L-PBF system in an argon environment with a 0.1% oxygen concentration in the process chamber, which featured a 400 W laser with a 100 µm spot size. The procedure was performed on substrates that were heated, and the L-PBF process was carried out using varied laser scan speeds ranging between 200 mm/s and 400 mm/s, a layer thickness (t) of 30 µm and a laser power (P) of 370 W as shown in Table 1 and Table 2. The gas flow across the scanning region was altered by changing the turbine pressure settings (defined in the EOS Print control software) within the standard operating range (0.6 to 1 mbar). Once manufacture and thermal conditioning was complete, non-contact Wire Electrical Discharge Machining (W-EDM) was employed to remove the built samples from the build plate. Zwick Roell 1474 material test equipment (Zwick Roell, Ulm, Germany) with a 100 kN maximum load capability used for mechanical testing.

2.2. Melt Pool Monitoring

Melt pool monitoring systems generally comprise two photodiodes placed to the right and left of the scanner on the build chamber’s exterior. The photodiodes are in a fixed position in relation to the machine, capturing all spatially and temporally integrated light generated at any given time over the entire process but not moving with the melt. Both the melt temperature and the size of the melt pool have an influence on the MPM’s reaction, or the number of photons that are captured by the photodiodes. A 50 kHz sampling rate is used for both photodiodes. The EOS State in-process melt pool monitoring technology was utilised to comparatively evaluate the process build variations, with the sample density analysed using a Bruker Skyscan 2211 X-ray nanotomograph (Bruker, Billerica, MA, USA).

2.3. Density and Pore Defect Analysis

Electrical and mechanical performance can be significantly impeded where the porosity and pore morphology are not controlled [28]. The optimisation of L-PBF parameters, the particle distribution and the powder feedstock composition are paramount to mitigating the undesired porosity content [28]. Topographical and surface inspection techniques including digital microscopy and SEM analysis are well-deployed density and porosity evaluation methods. However, such approaches are limited to the outer surface of the specimen, providing only extremity-related density and pore characteristics. Nondestructive yet invasive techniques including X-ray computed tomography (xCT) present the capability to interrogate the internal pore distribution; as such, xCT was conducted to construct a 3D visualisation of the porosity morphology and distribution and investigate any resultant pore defect variations with an increased diamond addition, scan speed and turbine pressure.

X-ray Computed Tomography (xCT)

xCT is a nondestructive analysis technique that is increasingly deployed for the purposes of additive manufacture pore defect analysis [29,30]. Non-uniform powder-layer delivery and porosity defects are directly attributable to inadequate powder feedstock properties, including particle volume distribution (PVD) and restrictive flowability. Furthermore, scanning strategy parameters and a material–laser interaction can also contribute to the occurrence of pore defects [30]. An xCT analysis was performed in this study through a Bruker Skyscan 2211 X-ray nanotomograph. It is important to keep in mind that although an xCT sample analysis is a useful, nondestructive tool for pore defect research, the operator-led scanning and threshold settings are independent, and as a result, xCT techniques should be used for a relative rather than absolutive analysis. Any changes in density and porosity flaws may be ascribed to AM feedstock materials, manufacturing process parameters or postprocessing methods like annealing by making sure the xCT scanning and threshold settings are kept constant across the examined samples. For this reason, all the Ag and Ag-D MMCs were interrogated with the same xCT scanning threshold and reconstruction parameters, thus ensuring the revealed porosity differences were the result of Ag-D variations in the AM material feedstock.

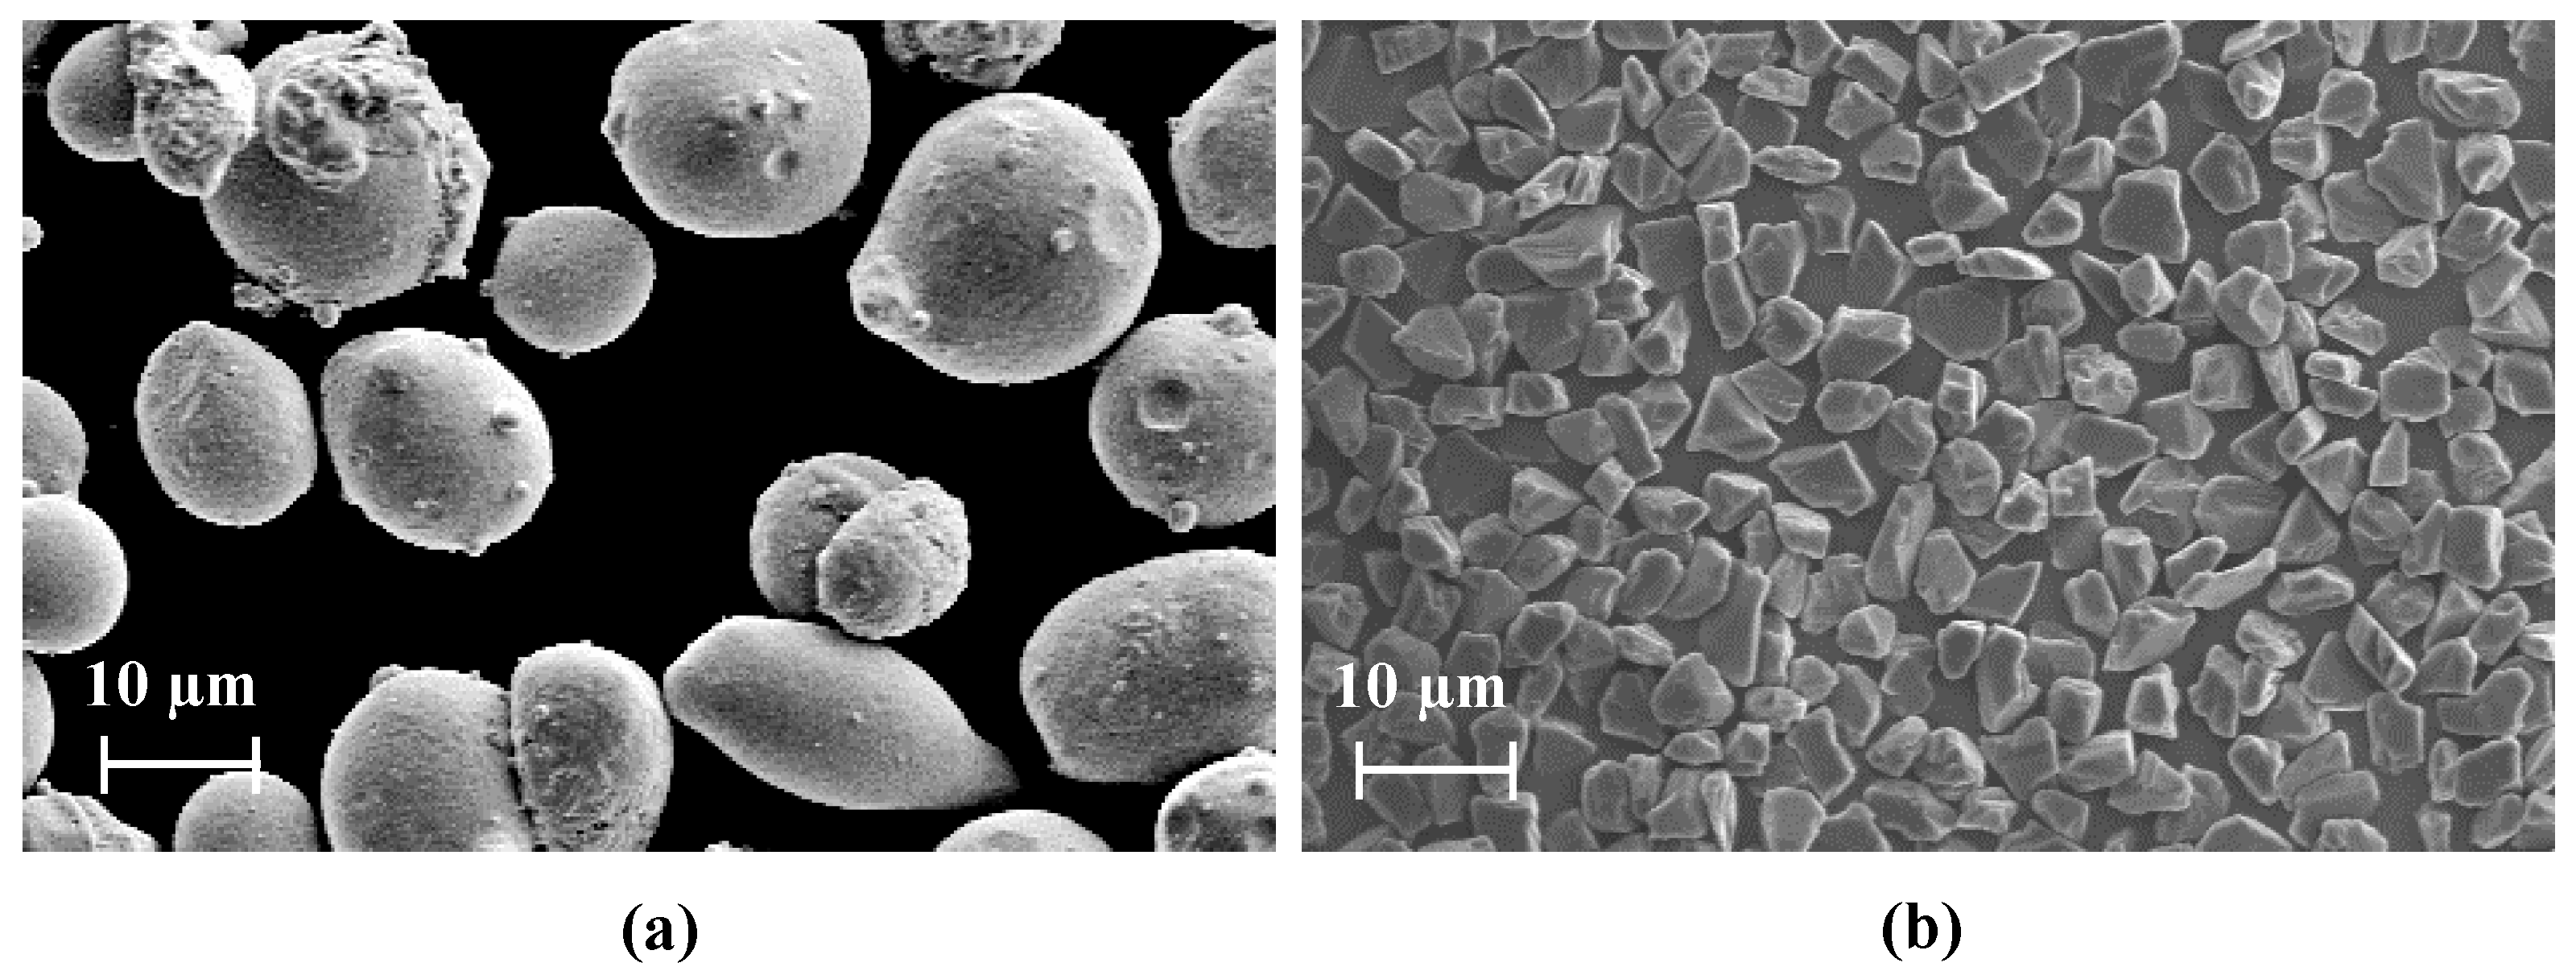
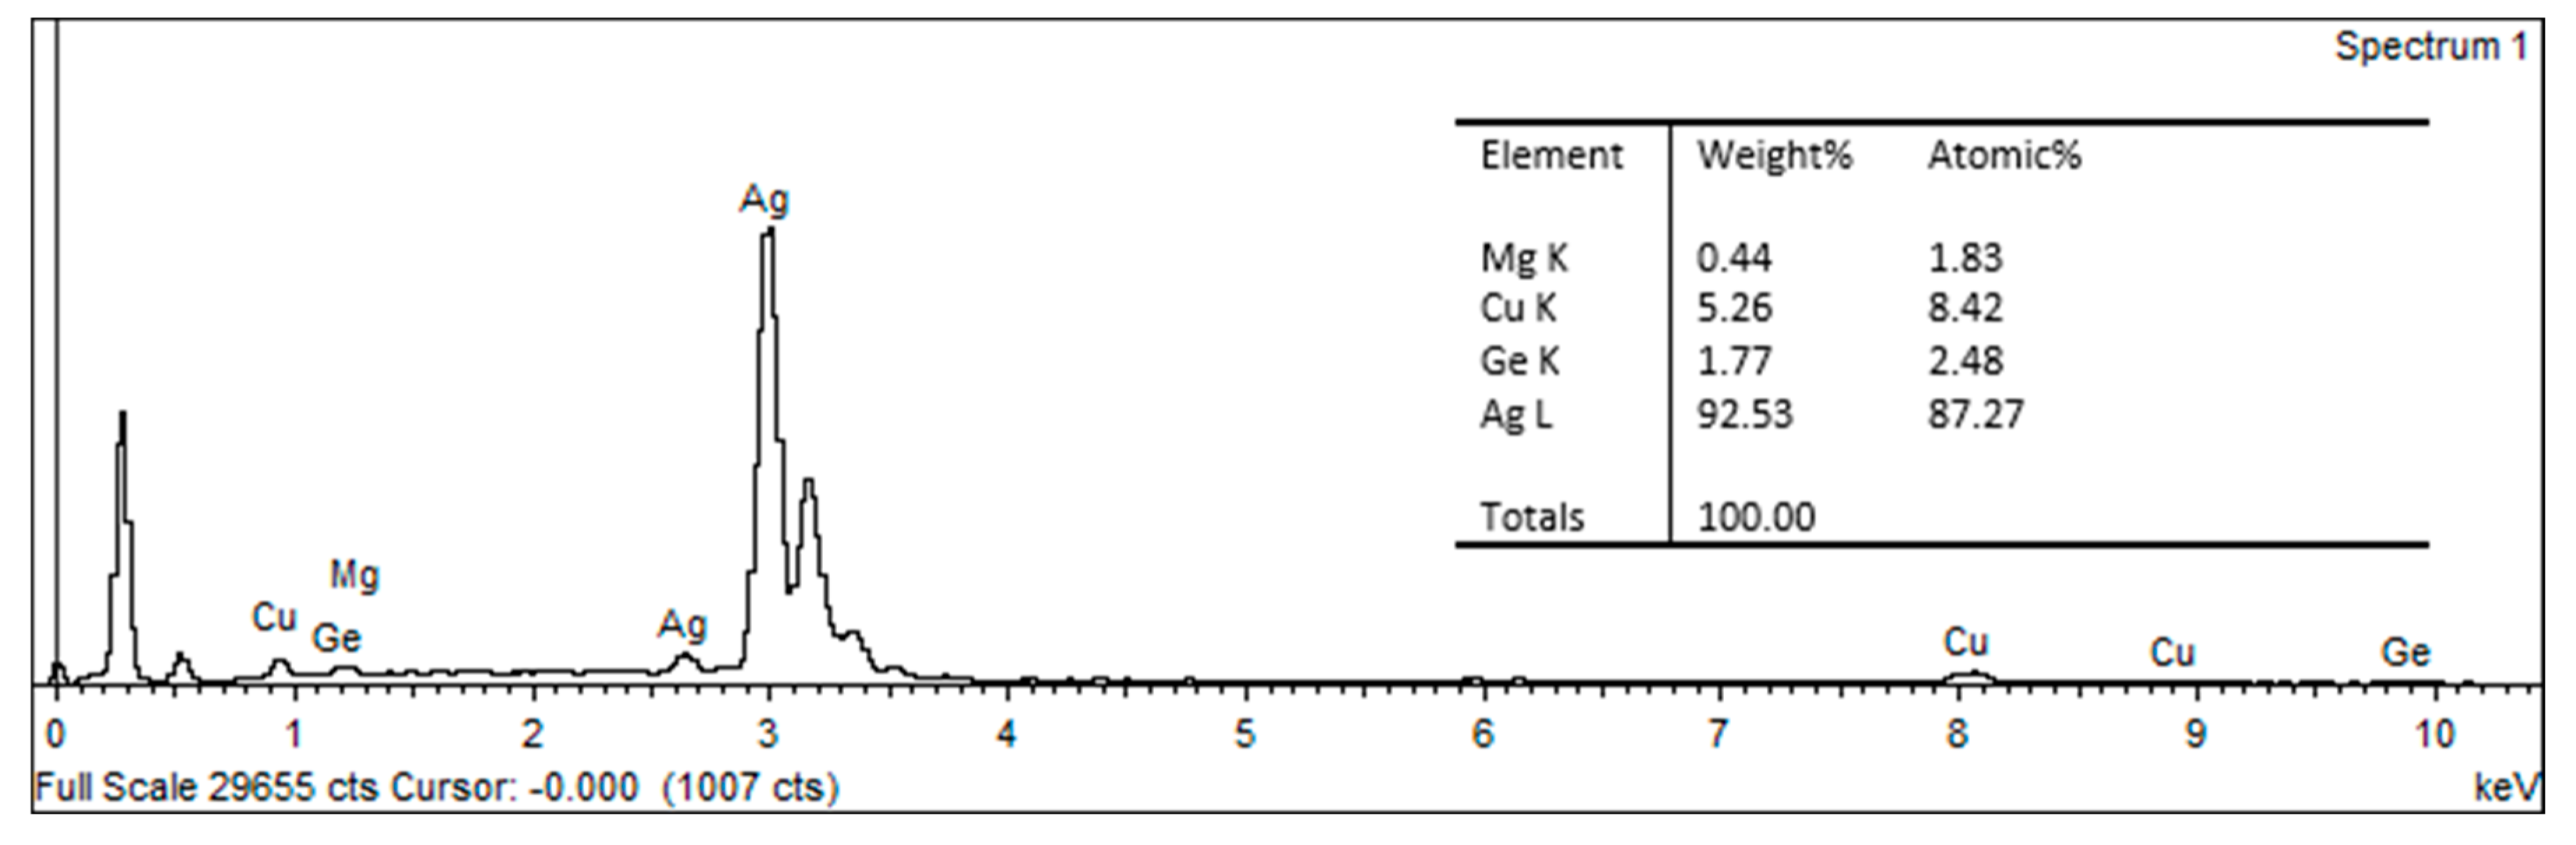
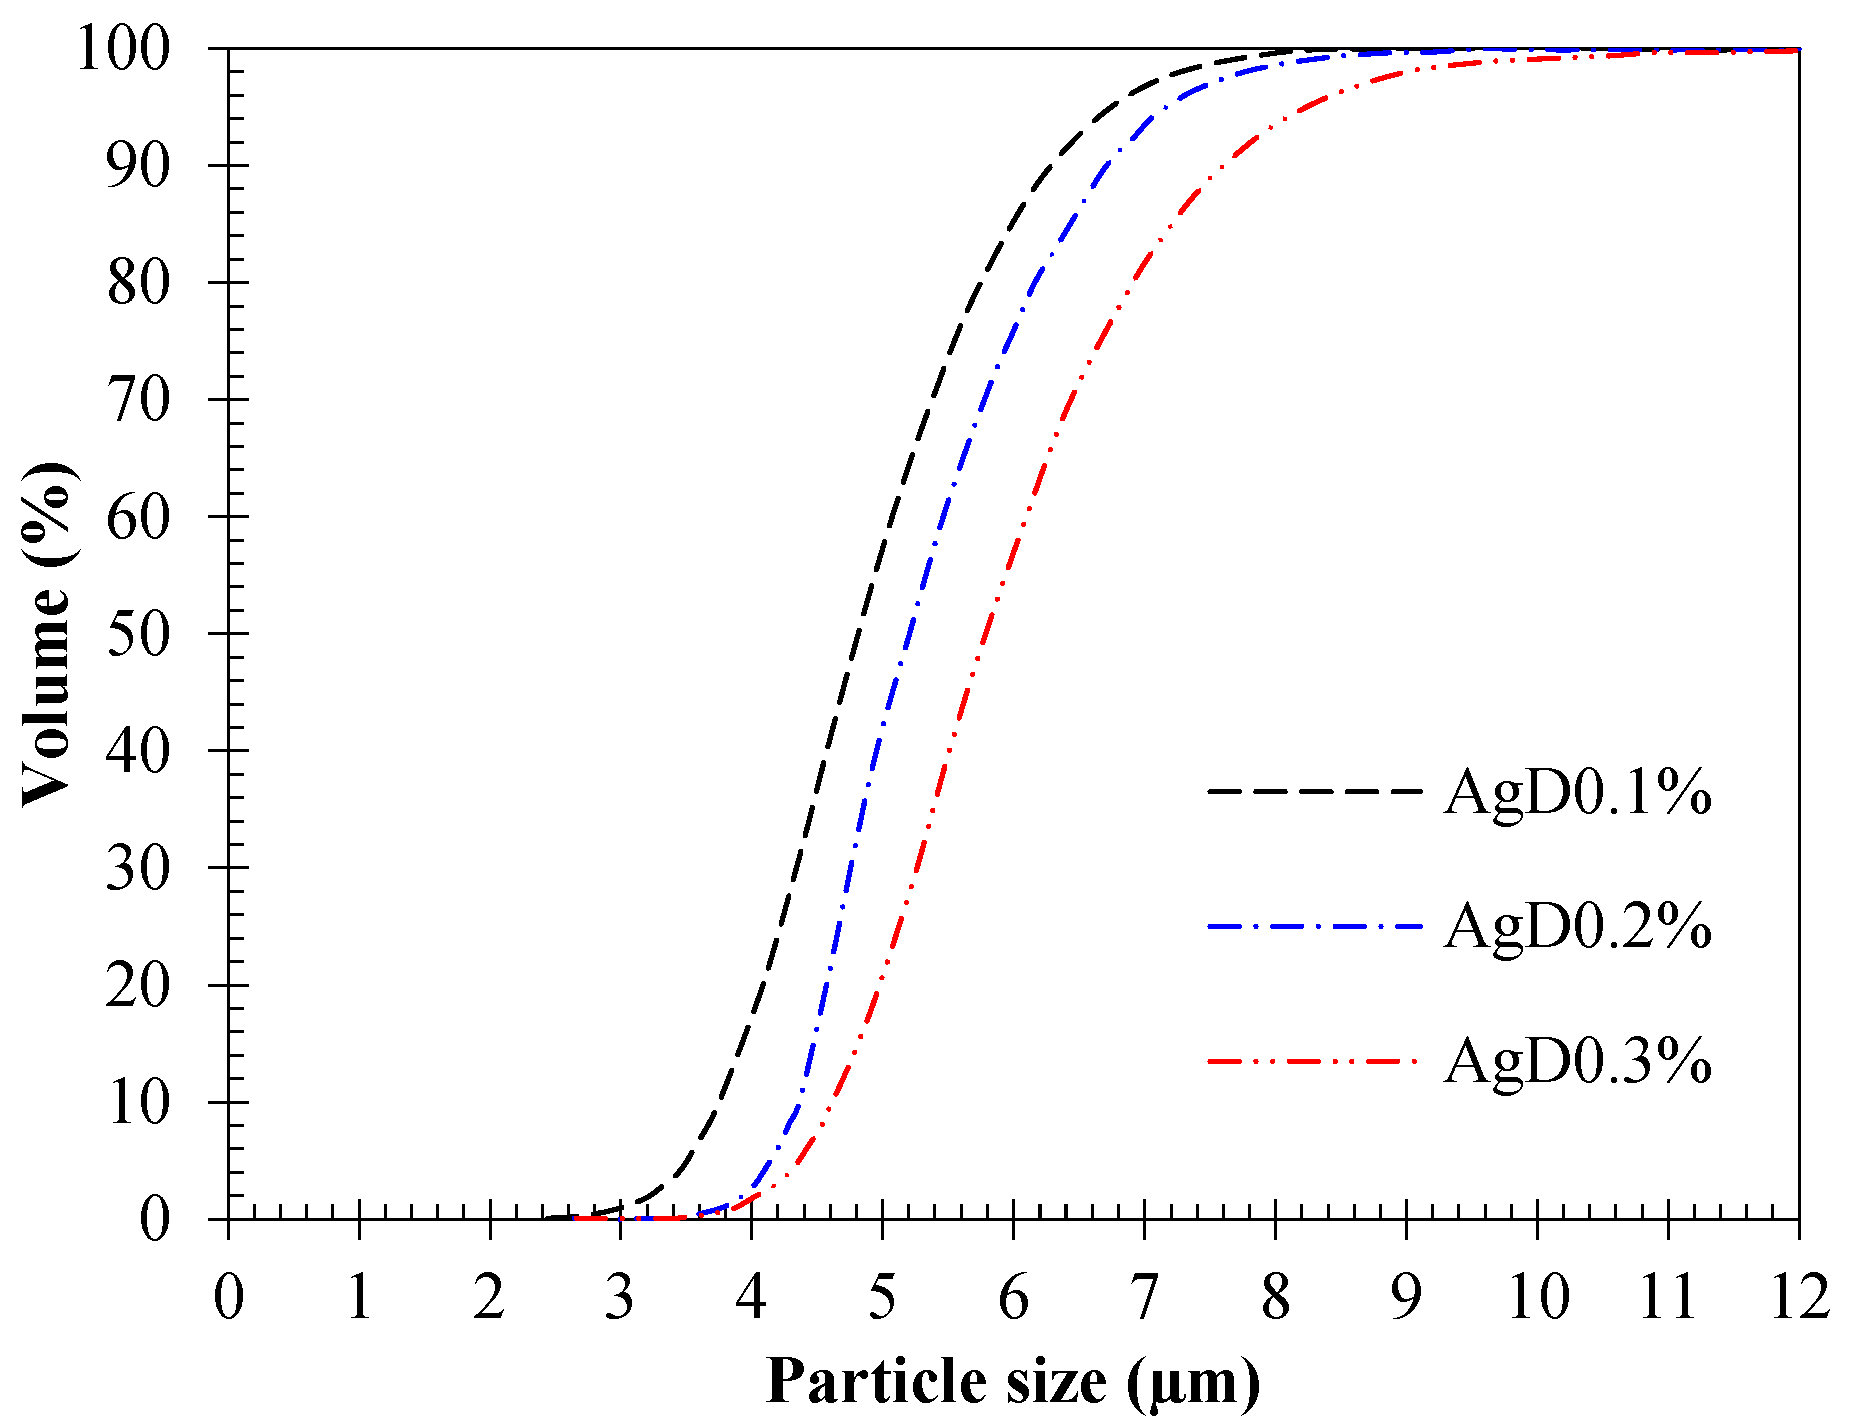
2.4. Powder Characterisation

The atomised Ag alloy and D powders morphology and elemental content were analysed using SEM-EDX. The silver powder was found to be nearly spherical with the presence of some satellite particles attached to the surface, while the diamond particles revealed an irregular morphology as shown in Figure 1. An EDX analysis was performed to identify the actual composition of the Ag alloy samples as presented in Figure 2.
A Retsch Technology Camsizer X2 was employed to evaluate the particle size distribution. The Ag-D powder was mixed at different percentages by sieving for the dry measurement and the sample was conveyed into the equipment by using a powder dispenser and brush blade recoating technique. The L-PBF Ag-D powder feedstock volume fractions were analysed at D10, D50 and D90 to reveal the variation in the particle size distribution, which might hinder the processability of the powder, Figure 3 and Table 3. The Ag-D0.1% powder was shown to have a PVD of D10 of 3.7 μm, D50 of 4.8 μm and D90 of 5.2 μm, while Ag-D0.3% featured a PVD of D10 of 4.6 μm, D50 of 5.9 μm and D90 of 7.6 μm. It was found that the D10, D50 and D90 values heightened with an increasing diamond content, Table 3. Overall, the values showed that 90% of the Ag-D particles were below 8 µm. Positively, the Ag-D particles dominantly displayed that a powder with a spherical shape is preferred for the L-PBF process to increase the packing density, provide homogenous powder deposition as well as improve the flowability of the powder [31]. However, it needs to be mentioned that the presence of small satellite particles on the surface may hinder the maximum packing density.

3. Results and Discussion

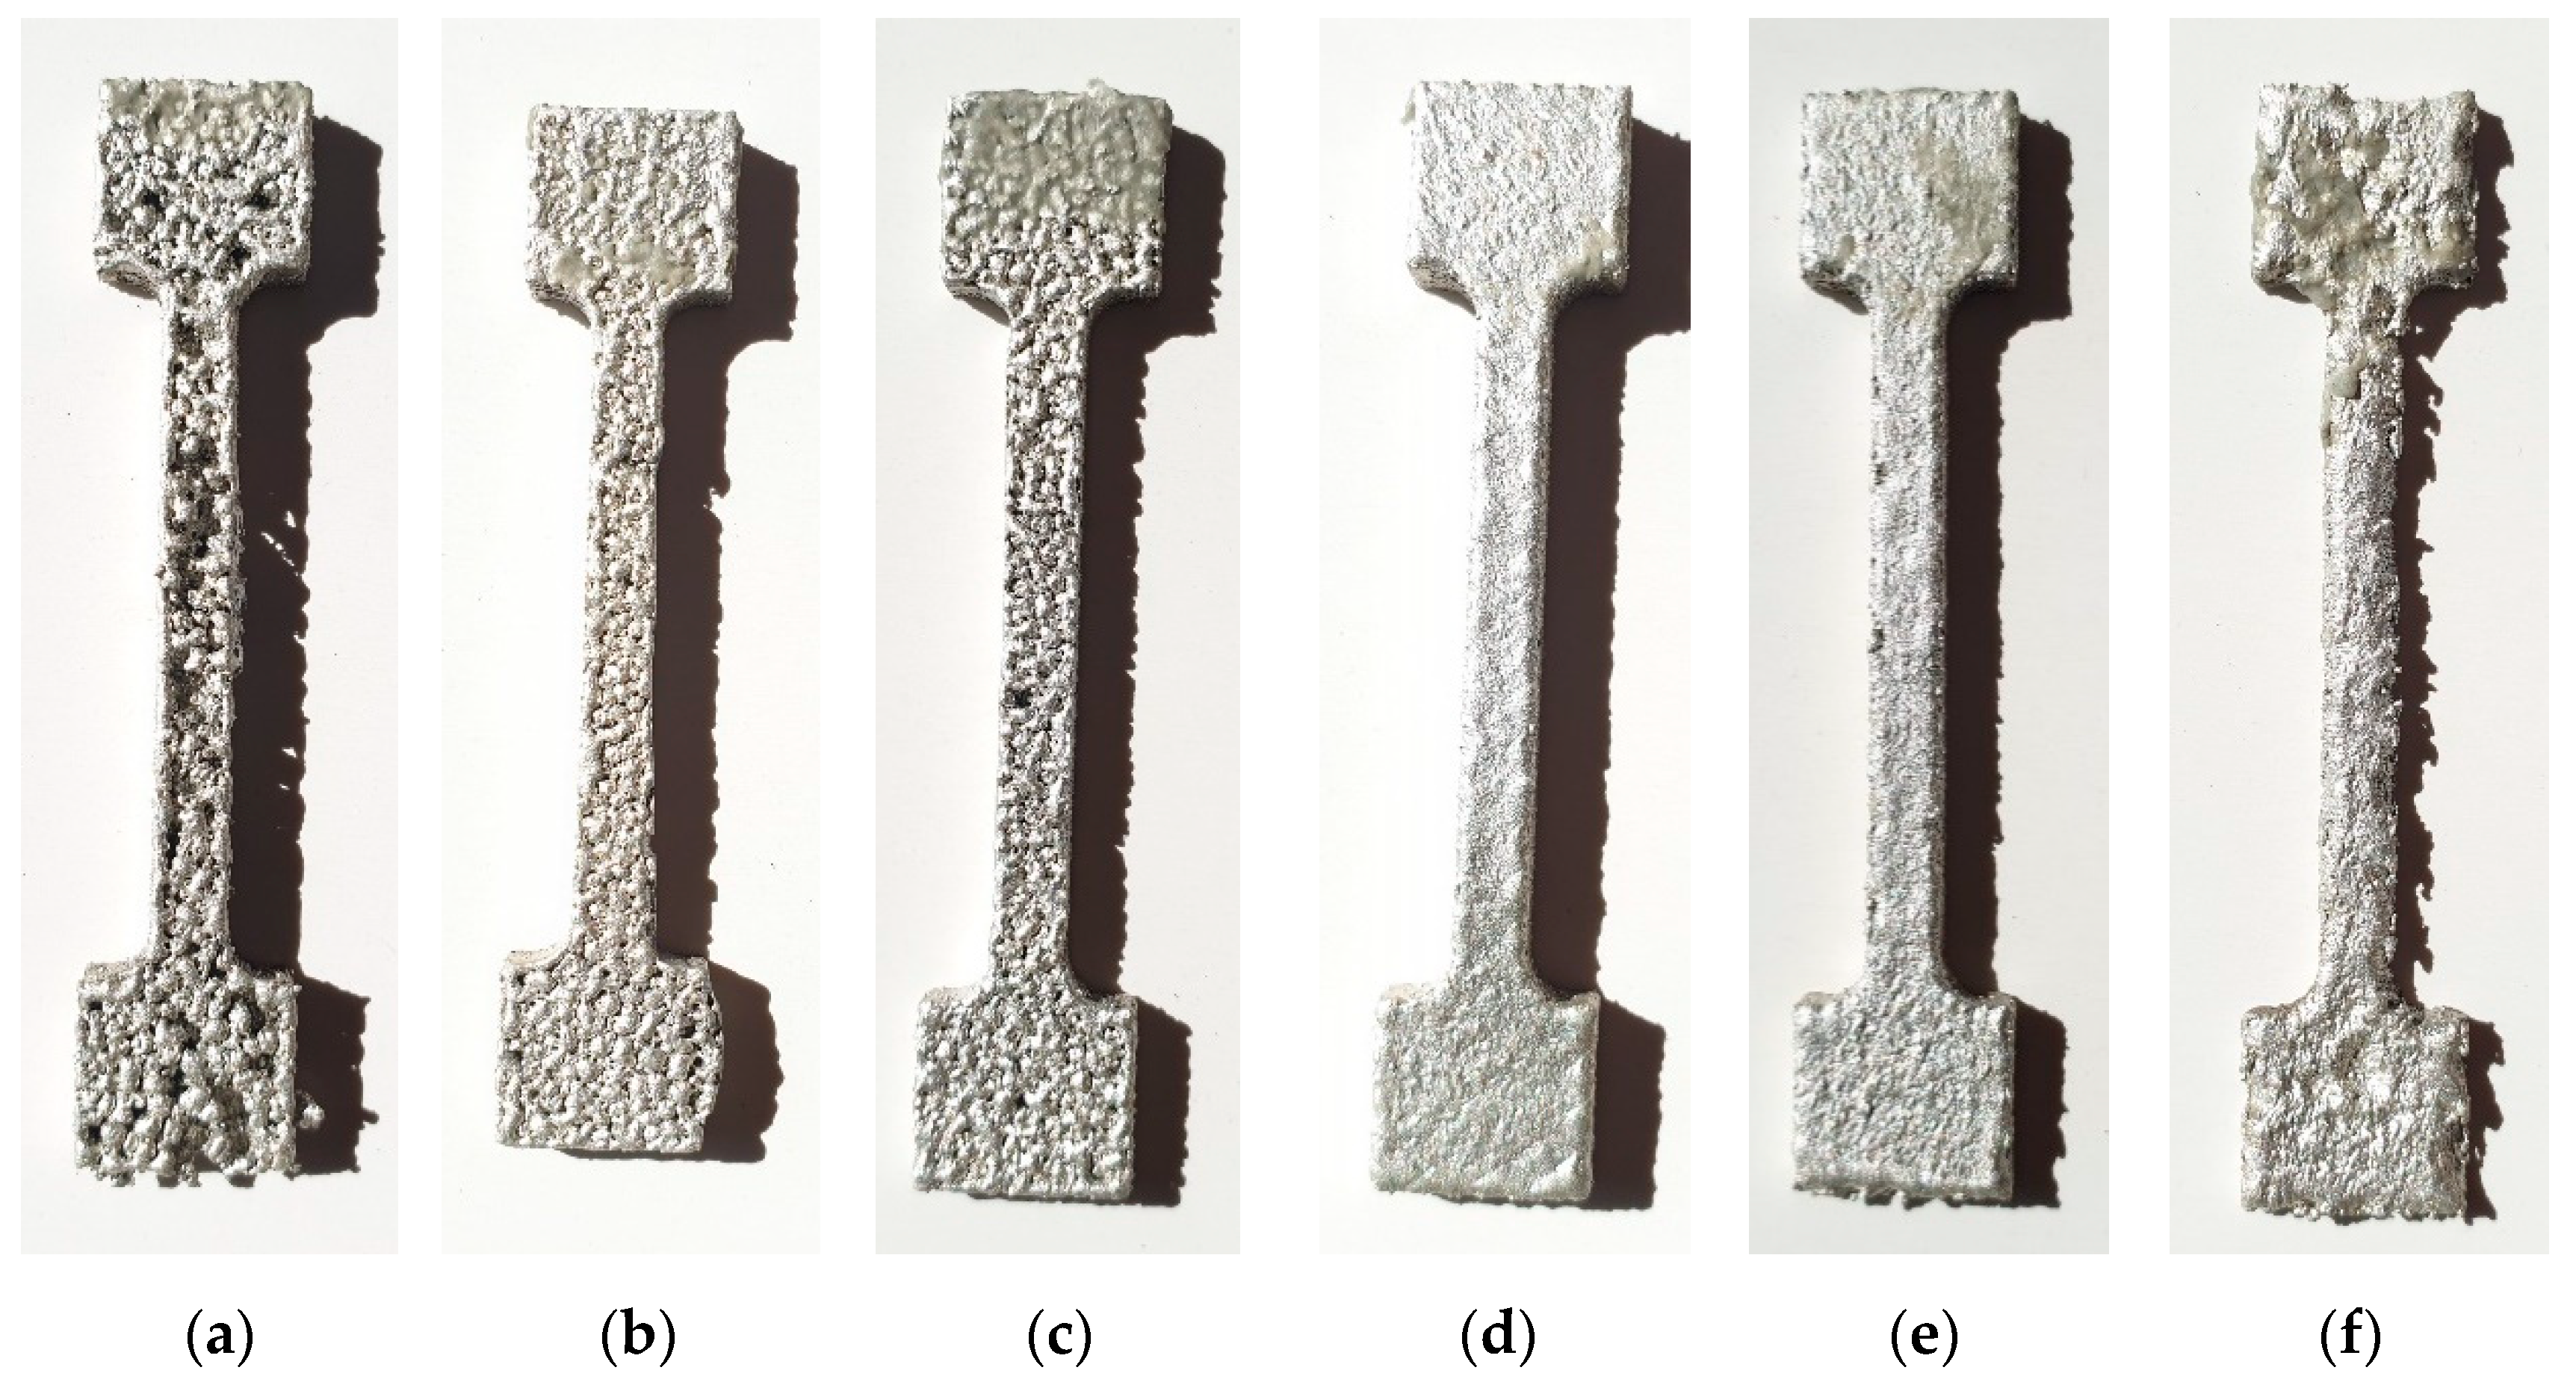
3.1. L-PBF Sample Fabrication

The L-PBF process parameters were previously reported by authors [27,32,33] (listed in Table 1) and were used for the preliminary sample preparation. It was observed that the Ag sample was prepared successfully with a smooth surface finish as presented in Figure 4.
It is well known that changing the L-PBF process parameter can significantly influence the final material performance [34]. To prepare the silver–diamond build successfully at various diamond percentages, the laser power, hatch distance and layer thickness were kept constant whilst the turbine pressure and scan speed parameters were adjusted to ascertain the effects of the diamond addition and to aid in successful sample fabrication.

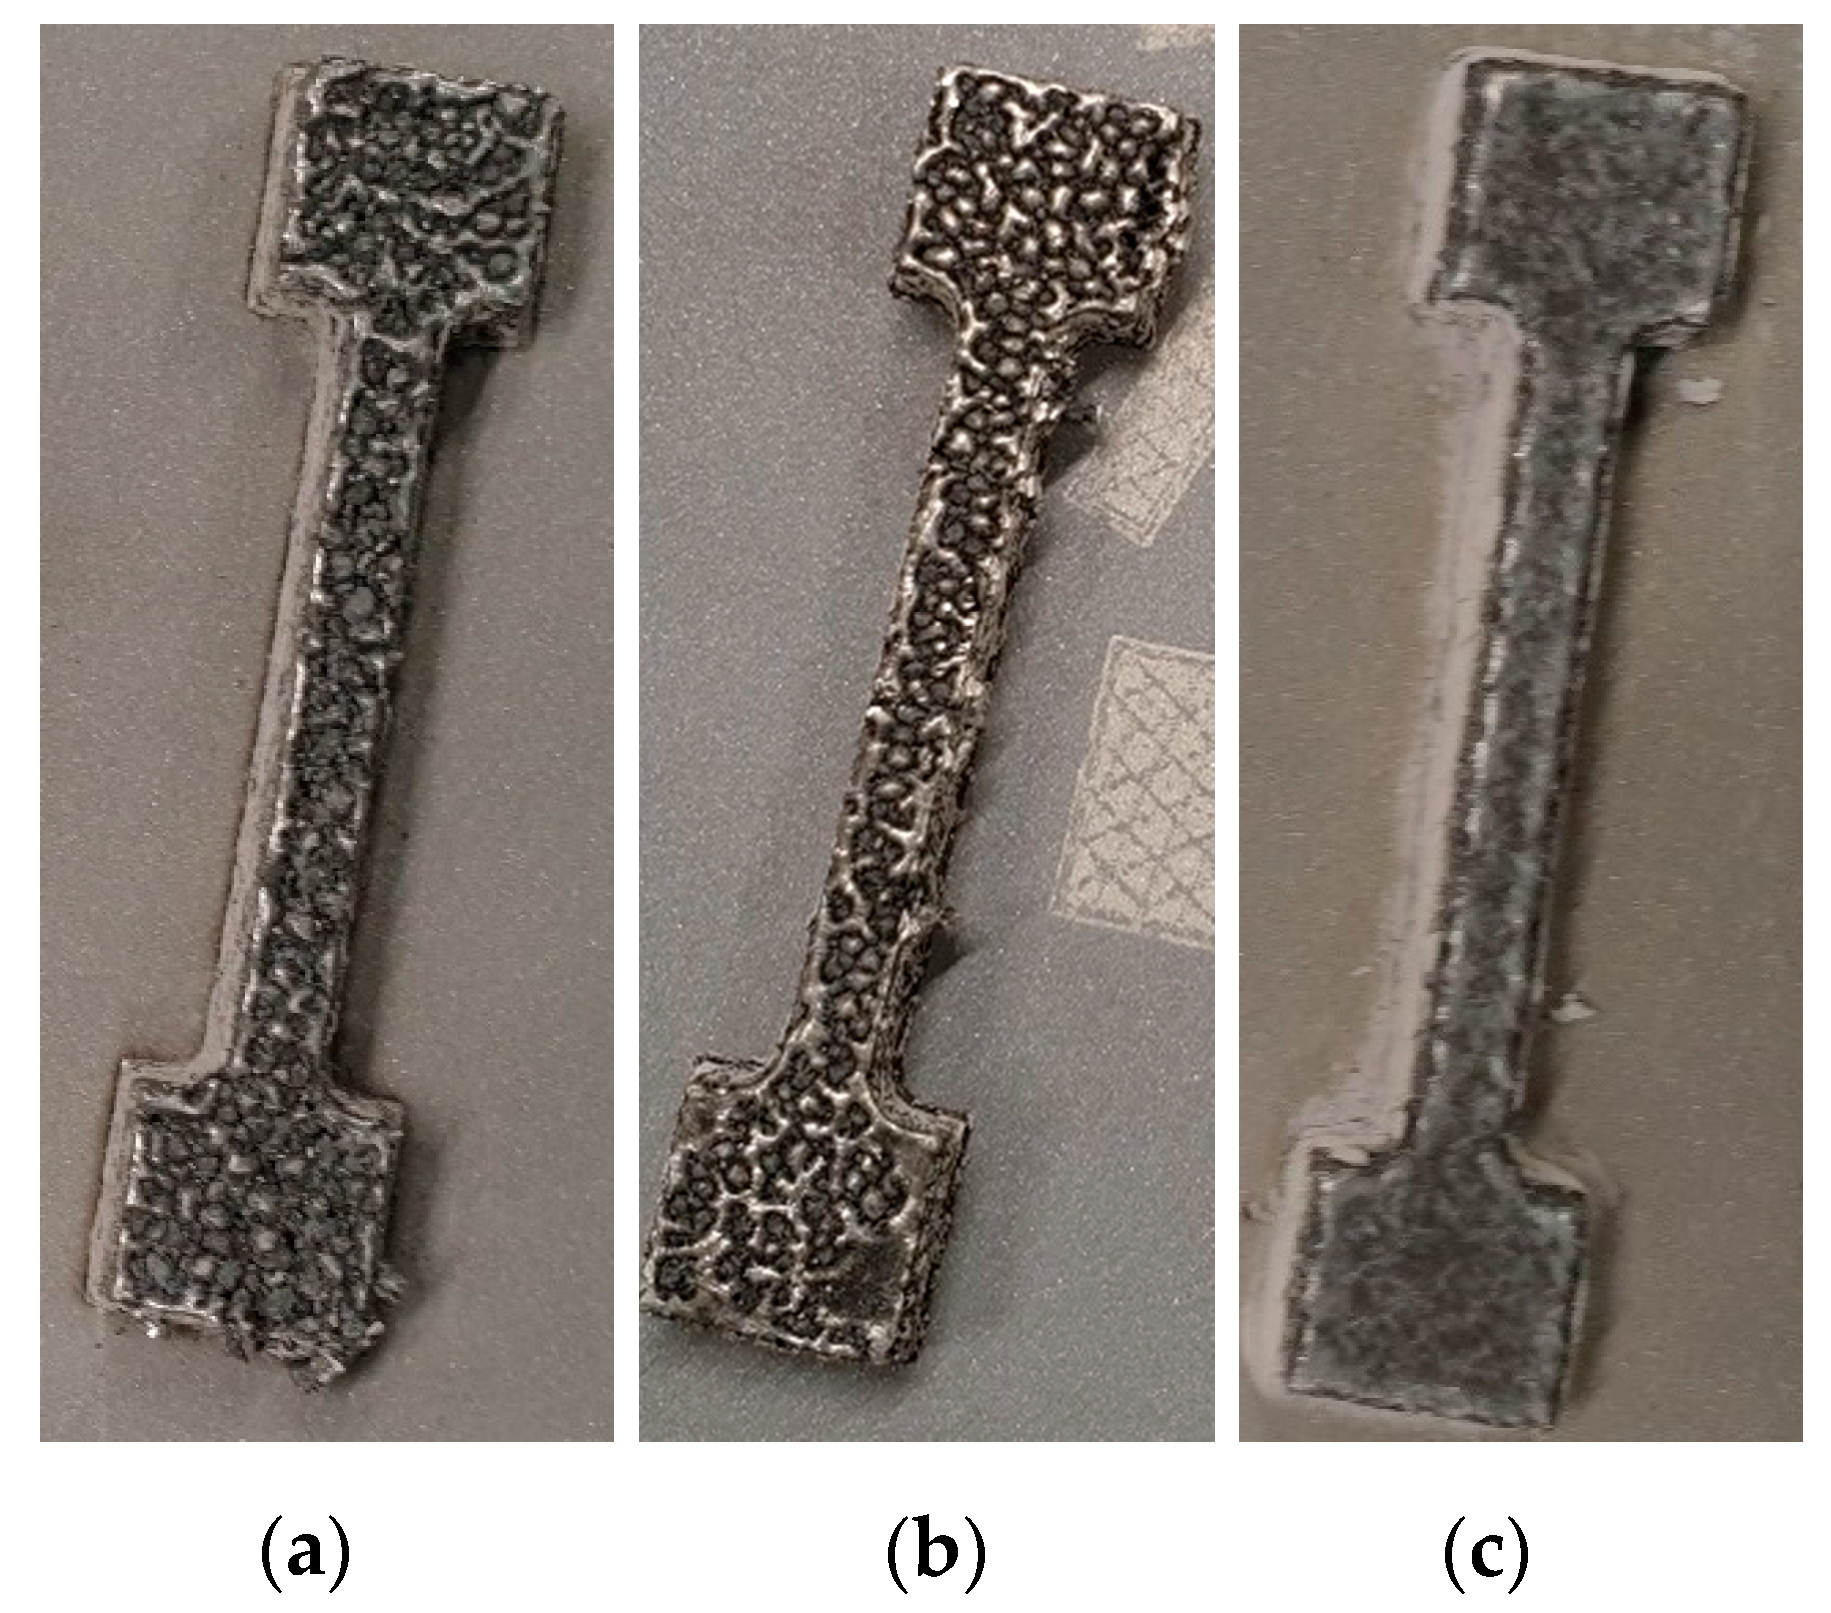
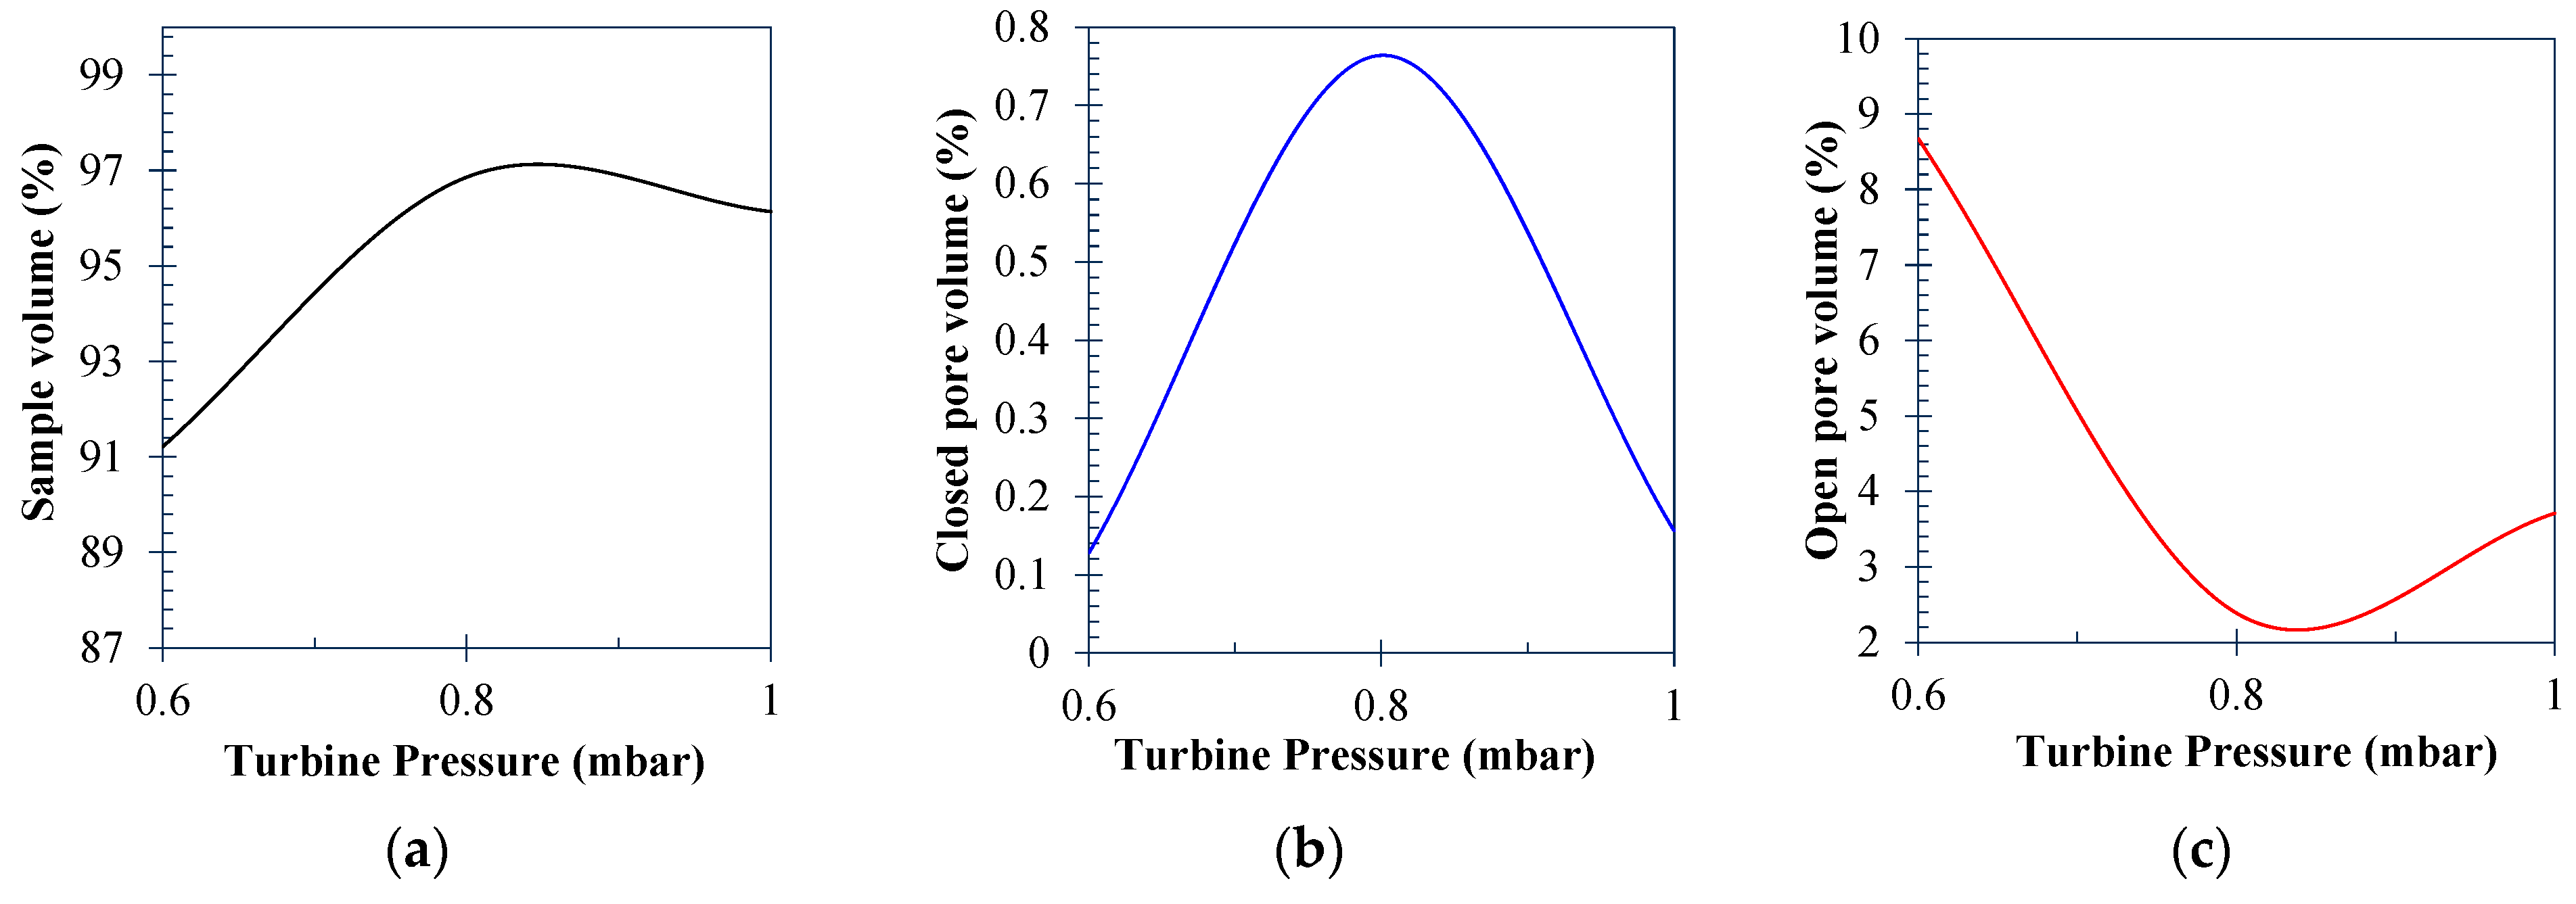
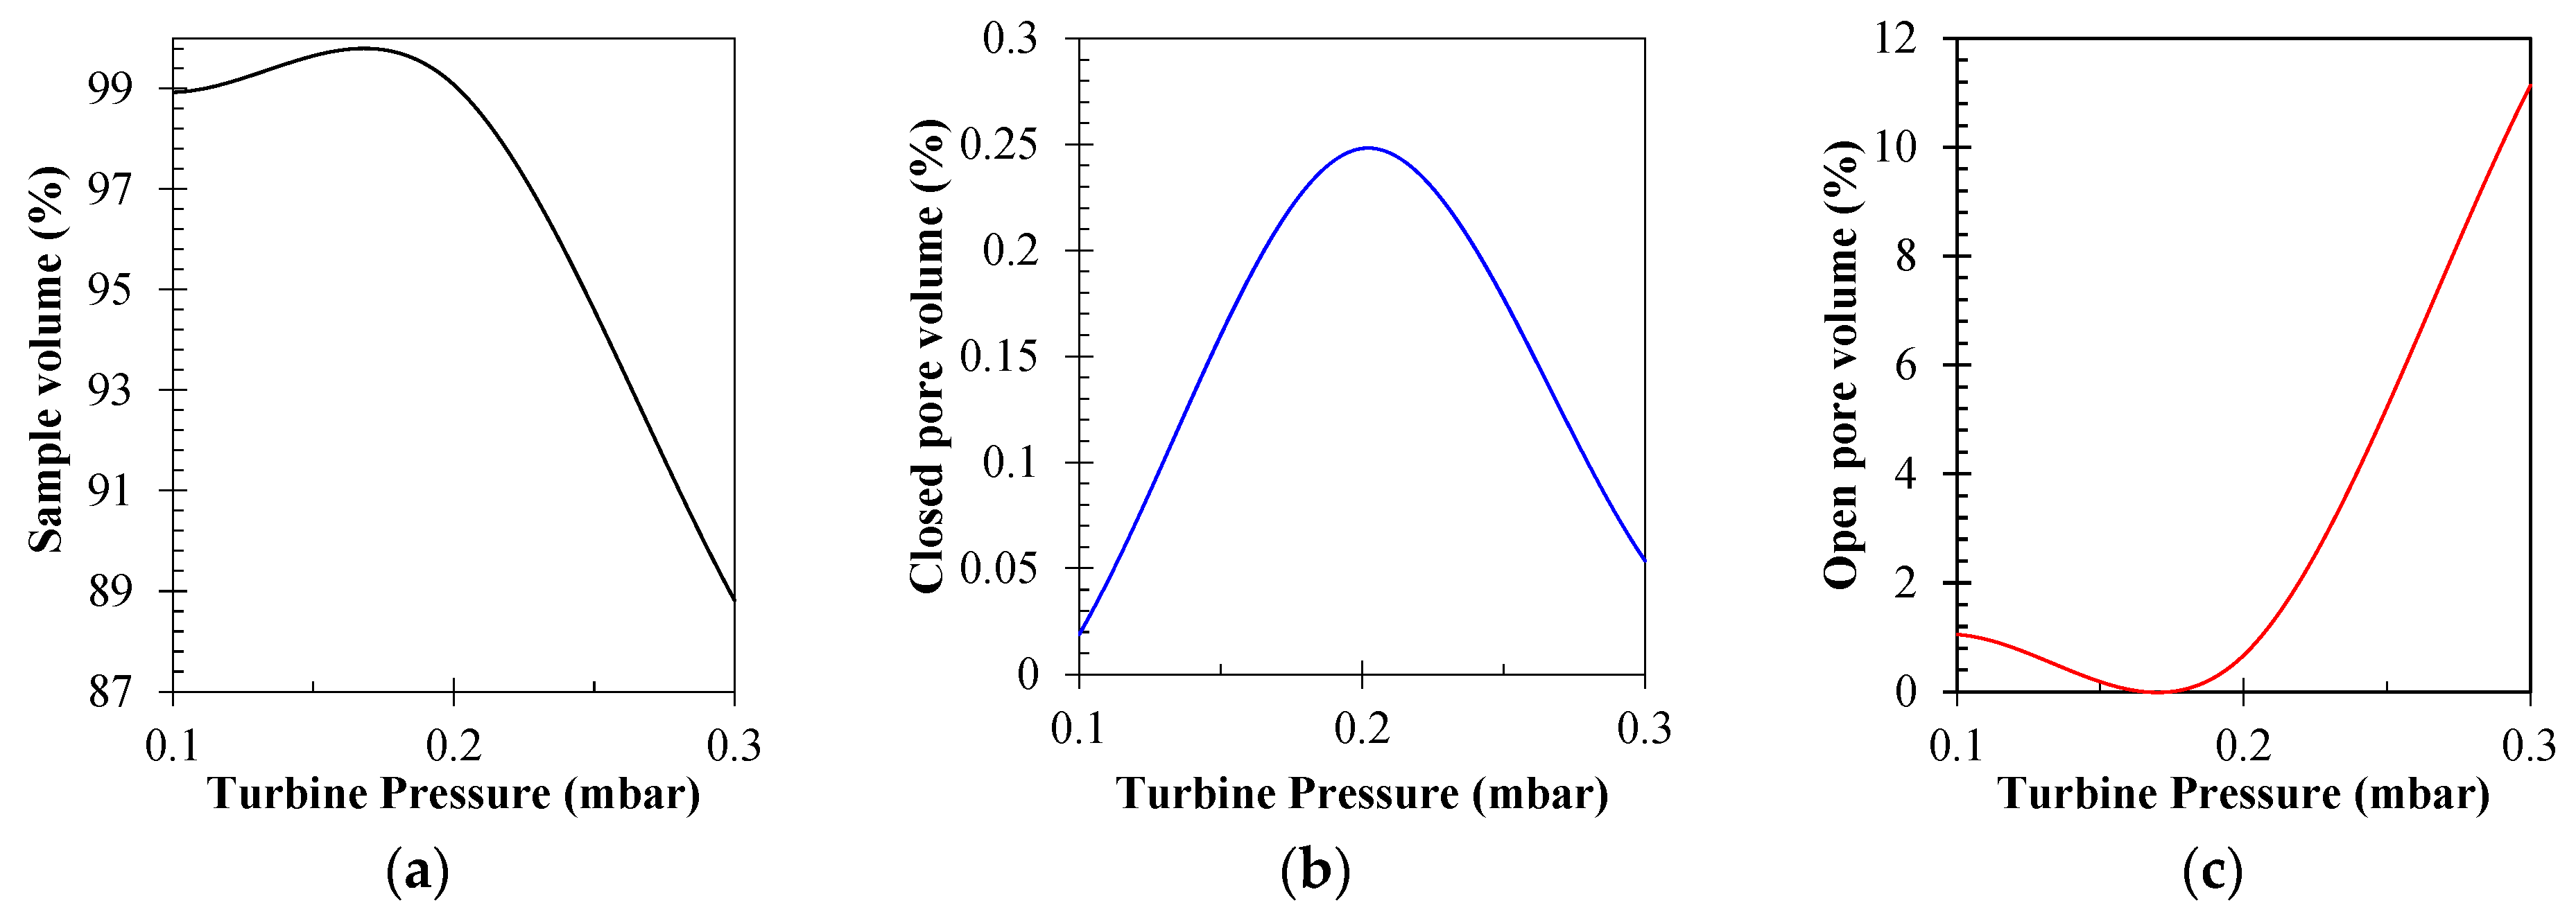
3.1.1. L-PBF Turbine Pressure Optimisation

Although not considered a standard L-PBF parameter, the optimisation of the turbine pressure settings was considered in this study due to the potential carbonisation of the diamond powder during the L-PBF, affecting the laser process. Additionally, the relatively low particle size distribution under investigation could be affected by the flow of inert gas across the powder bed during L-PBF processing. Incorrect powder motion in L-PBF caused by turbine pressure could be a contributor to defects and print variability. Laser processing can cause powder particles and melt pool contamination to be drawn into the laser-illuminated zone (LIZ), affecting the subsequent layer processing. As such, the as-built Ag-D samples containing 0.1%Diamond with an increasing turbine pressure are shown in Figure 5. Despite the identical fabrication parameters being used for all the Ag-D samples, clear variation was observed on the surface throughout with an increasing turbine pressure from 0.6 mbar to 1 mbar, particularly with the higher turbine pressure (1.0 mbar). It was found that the sample provided a dark and uneven surface at low pressure such as 0.60 mbar and 0.8 mbar compared to the higher pressure. The rough surface at low pressure indicates a less dense structure, while the higher-pressure effect on Ag-D0.1% revealed an increase in the specimen density. Additionally, increasing the turbine pressure can accelerate building while lowering the stability of the molten pool and the surface roughness as seen in Figure 5c.

3.1.2. L-PBF Scan Speed Optimisation

The Ag-D0.1, Ag-D0.2 and Ag-D0.3 samples at different scan speeds and turbine pressures are shown in Figure 6. L-PBF process parameters require optimisation to successfully fabricate fully dense samples. One of the ways to improve surface quality and density is to modulate the turbine pressure, which in this case is between 0.6 and 1 mbar. The results show that a higher turbine pressure of 1 mbar significantly improved the surface quality and density as shown in Figure 6a–c. Consequently, the turbine pressure at 1 mbar is considered suitable for further analysis.
In addition to the turbine pressure, scan speeds play a key role in the laser powder bed fusion of metallic alloys. To further optimise the L-PBF processing of Ag-D, the scan speed was decreased from 400 to 200 mm/s; this technique can improve the surface wetting and promote uniform liquid solidification without inducing the balling effect. This is one of the primary defects when it comes to L-PBF that results in porosity defects reducing the part’s density. Here, the resulting sample revealed a smooth surface finish (Figure 6d), indicating that the balling effect is significantly reduced. As a result, the combination of the turbine pressure at 1 mbar and the 200 mm/s scan speed can be considered optimum for the L-PBF of Ag-D [35]. The rough surface at a high scan speed is due to an irregular and unstable molten pool and the occurrence of irregular scan tracks, which in turn increases the surface roughness and porosity of the printed sample.
In addition, irregular surfaces at a high scan speed could also be explained by the presence of balling on the top surface of the samples. A high scan speed also promotes capillary instability in the molten-metal pool leading to the splashing of small liquid droplets on the surface and hence improper deposition of the following layer and inhomogeneity in the layer. These optimal parameters informed the further processing of the Ag-D0.2% and Ag-D0.3%. Nevertheless, it can be seen from Figure 6d–f that the surface of the printed samples worsened as the diamond content in the Ag matrix increased.
Apart from the scan speed and turbine pressure, other critical process parameters include the hatch spacing, laser power and layer thickness. These process parameters inform the building rate and fabrication efficiency when it comes to L-PBF. The top surface of the polished samples revealed gaps between adjacent scan tracks at a higher hatch spacing (140 μm). The intralayer overlap decreases at 140 µm hatch spacing, and the interlayer bonding mostly holds the component together. Although building with high hatch spacings can increase the rate of fabrication, a smaller layer thickness is needed to achieve both inter- and intralayer overlap [36]. Consequently, a smaller layer thickness of 30 μm was employed throughout this study. The layer thickness influences the heat and mass transfer, affecting the cooling rate within the melt pool. On the contrary, adopting a higher layer thickness can lead to insufficient energy density at the powder bed to sufficiently melt the feedstock, resulting in balling phenomena. This in turn will lead to inadequate bonding between powders, leading to a partially sintered material on the subsequent layers [37,38]. A higher porosity for L-PBF parts usually indicates a lower laser power and a faster scan speed. The energy input into the material is reduced as the result of both a reduction in the laser power and an increase in the scan speed. This results in a reduction in the laser energy density at the melt pool leading to porosity due to incomplete consolidation and ultimately causing the L-PBF process to fail [39].

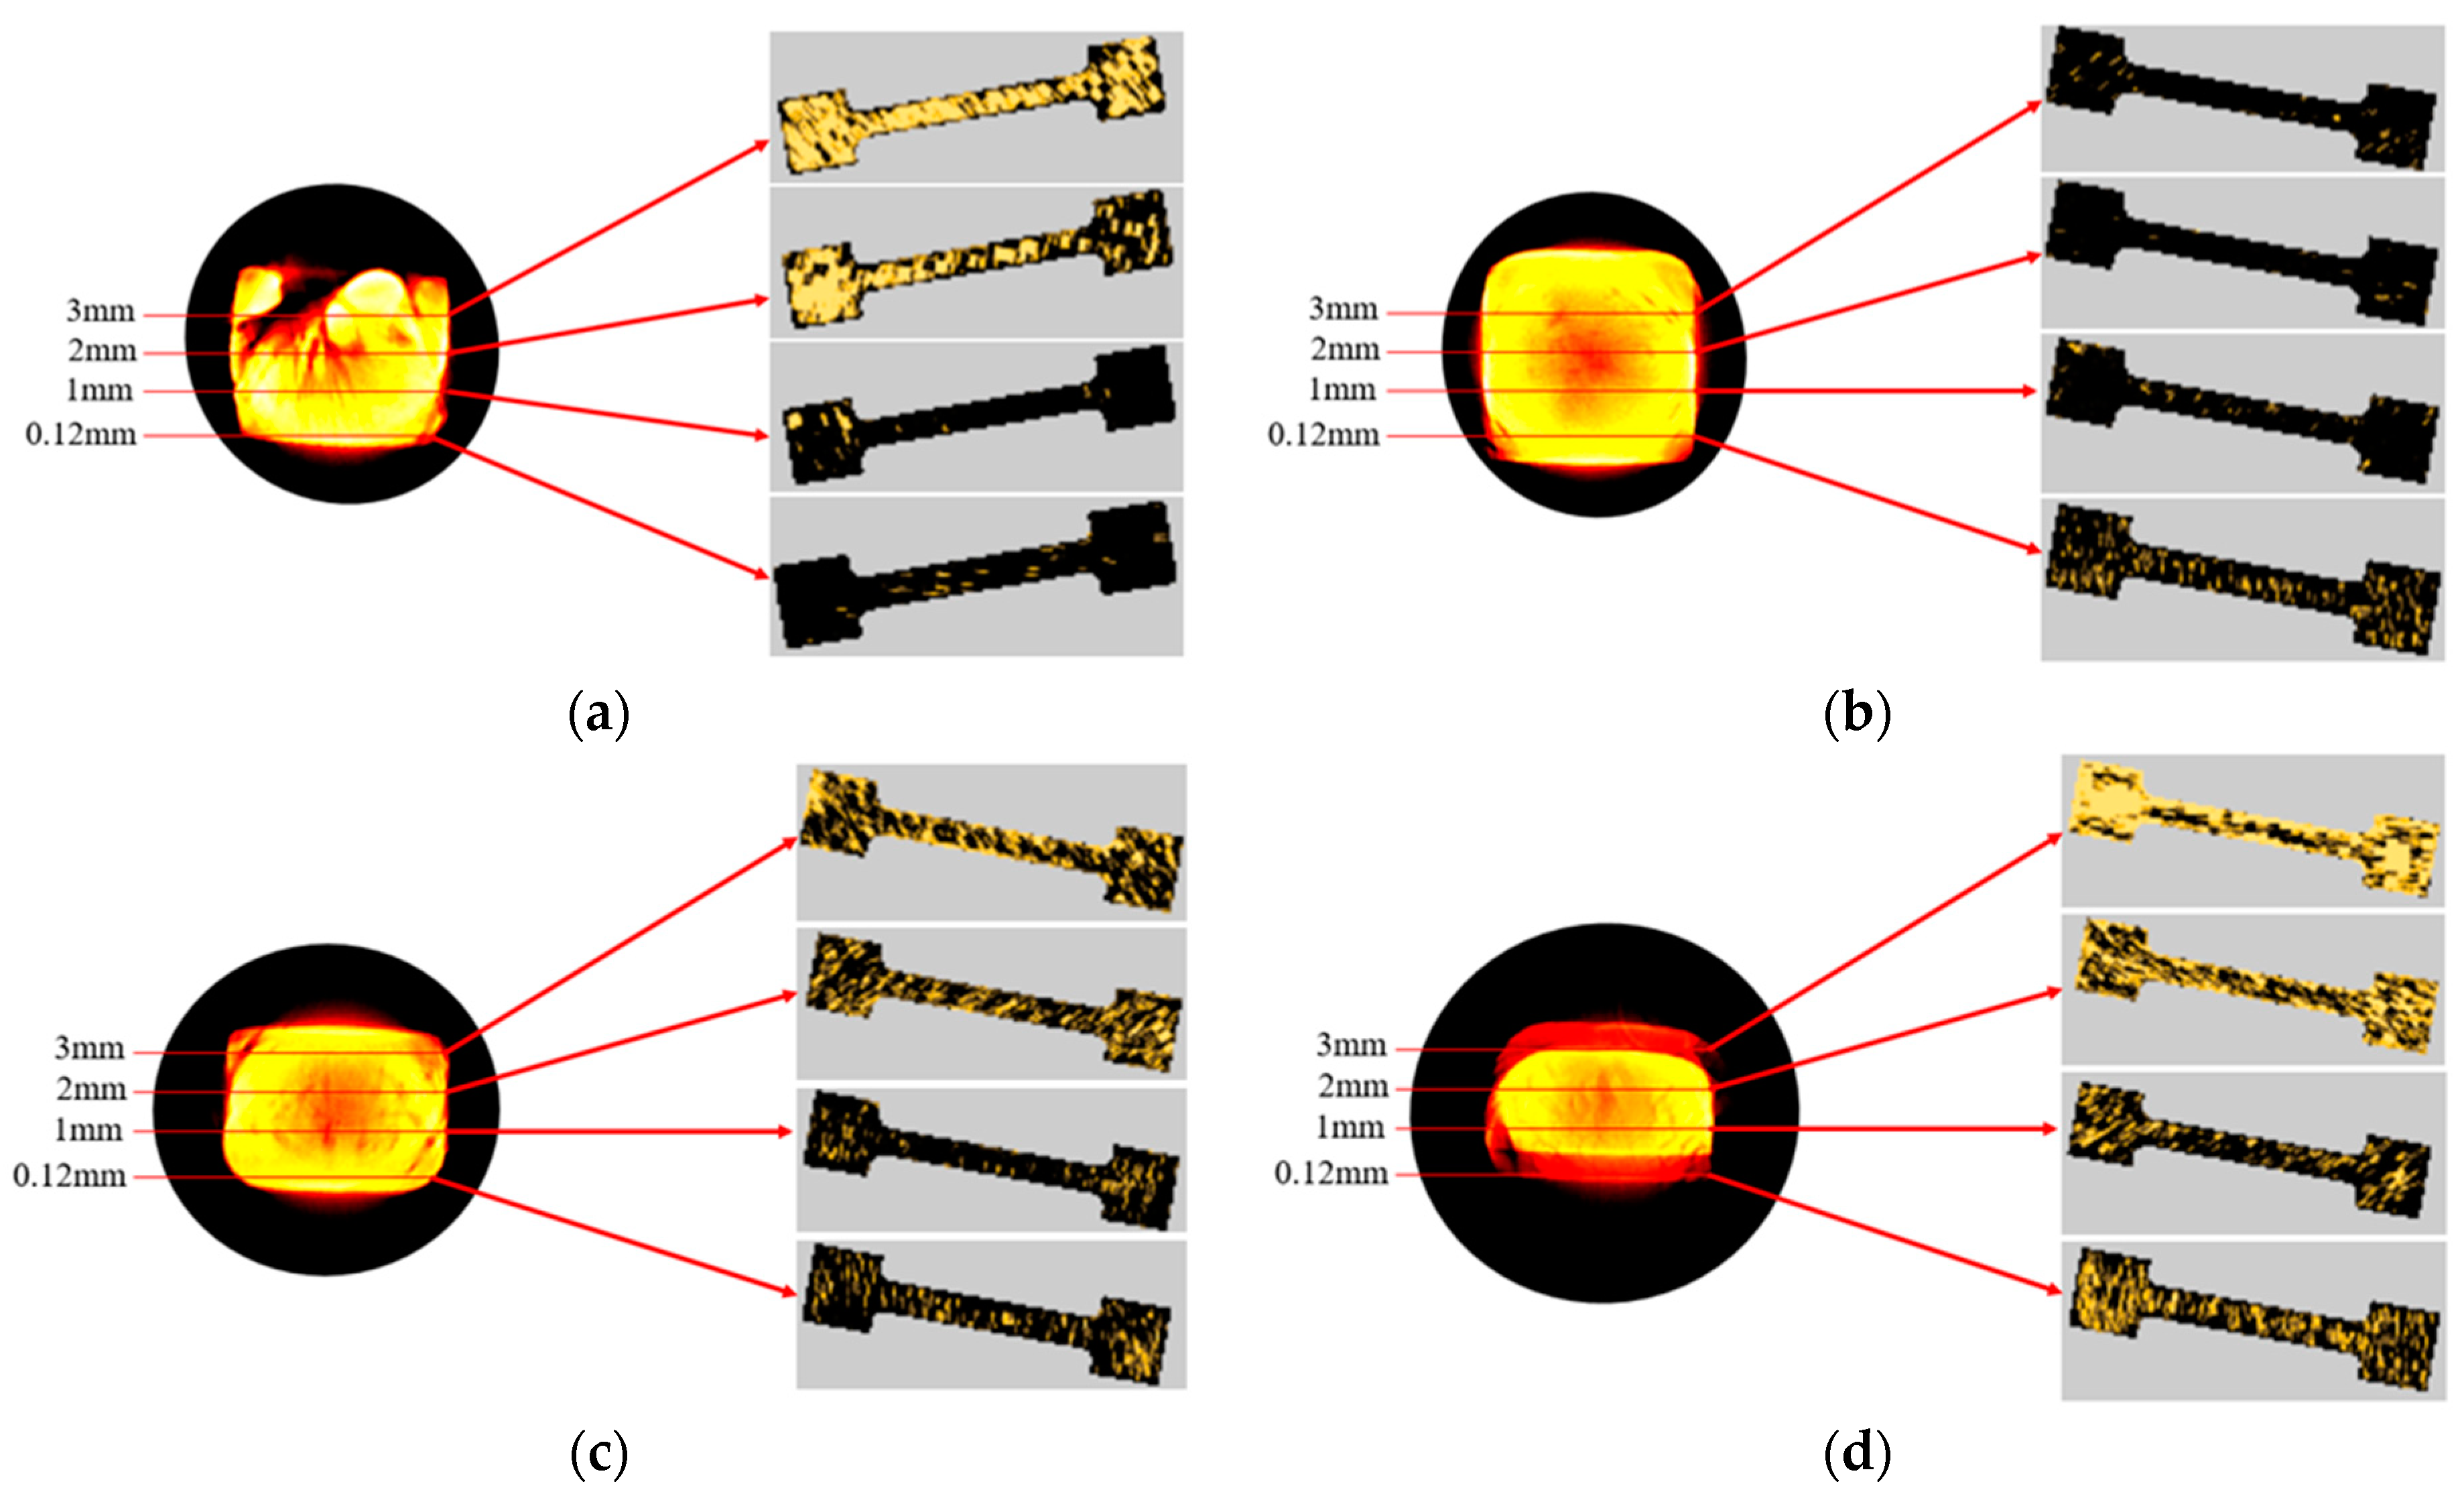
3.2. In-Process Melt Pool Monitoring

In AM processes, a wide range of parameters influence the melt pool behaviour. The impact of processing parameters on the melt pool form of different samples at various build heights are presented in Figure 7a–d. The melt pool dimension increased when decreasing the scan speed from 400 mm/s to 200 mm/s for sample 3 and sample 4 as presented in Figure 7a,b, respectively. This change in the melt pool dimension could be ascribed to the reduction in the energy density. Dilip et al. investigated the influence of process parameters on Ti6Al4V via melt pool monitoring and they reported that the depth of the melted region decreased with an increasing scan speed and eventually resulted in a balling phenomenon occurrence due to the reduction in energy density [40]. However, the melt pool dimension decreased with an increasing diamond content for sample 5 and sample 6 at 200 mm/s, indicating non-linear behaviour.
For sample 4, both the melt pool width and length increased with increasing the build height and revealed a dense and darker surface built in comparison to the other samples (see Figure 7b). The dense structure could be attributed to the thermal accumulation within the previous layers, thus increasing the overall temperature of the melt pool during multi-layer printing. It was also found that the sample morphology changed significantly with increasing the build height, which suggested discontinuity temperatures [41]. It is clear that the influence of the building height on the discontinuity temperature was significant.
The resulting temperature fluctuation may be occurring due to variations in the relative angle between the thermal imager and the moving melt pool. As observed in Figure 7c,d, melt pool monitoring did not reveal any significant change with the increase in the vertical build position. The surface roughness of the preceding layer may also account for small variations in the melt pool dataset at various build height positions, thereby limiting the impact of the Z-axis increment. It is well known that during L-PBF, the top surface’s height varies at various areas due to the final layer’s rough surface [42]. As a result, the effect of altering the building height on melt pool dimensions may be negated by a non-uniform powder recoating method for succeeding layers that may be bigger than the nominal layer thickness. Increasing the diamond content showed a decrease in the melt pool width as observed in Figure 7c,d. This change might be attributed to the increased volume of diamond impeding the interaction between the laser and the Ag powder, which in turn led to decreased powder absorption in the melt pool and a decrease in the melt pool width.

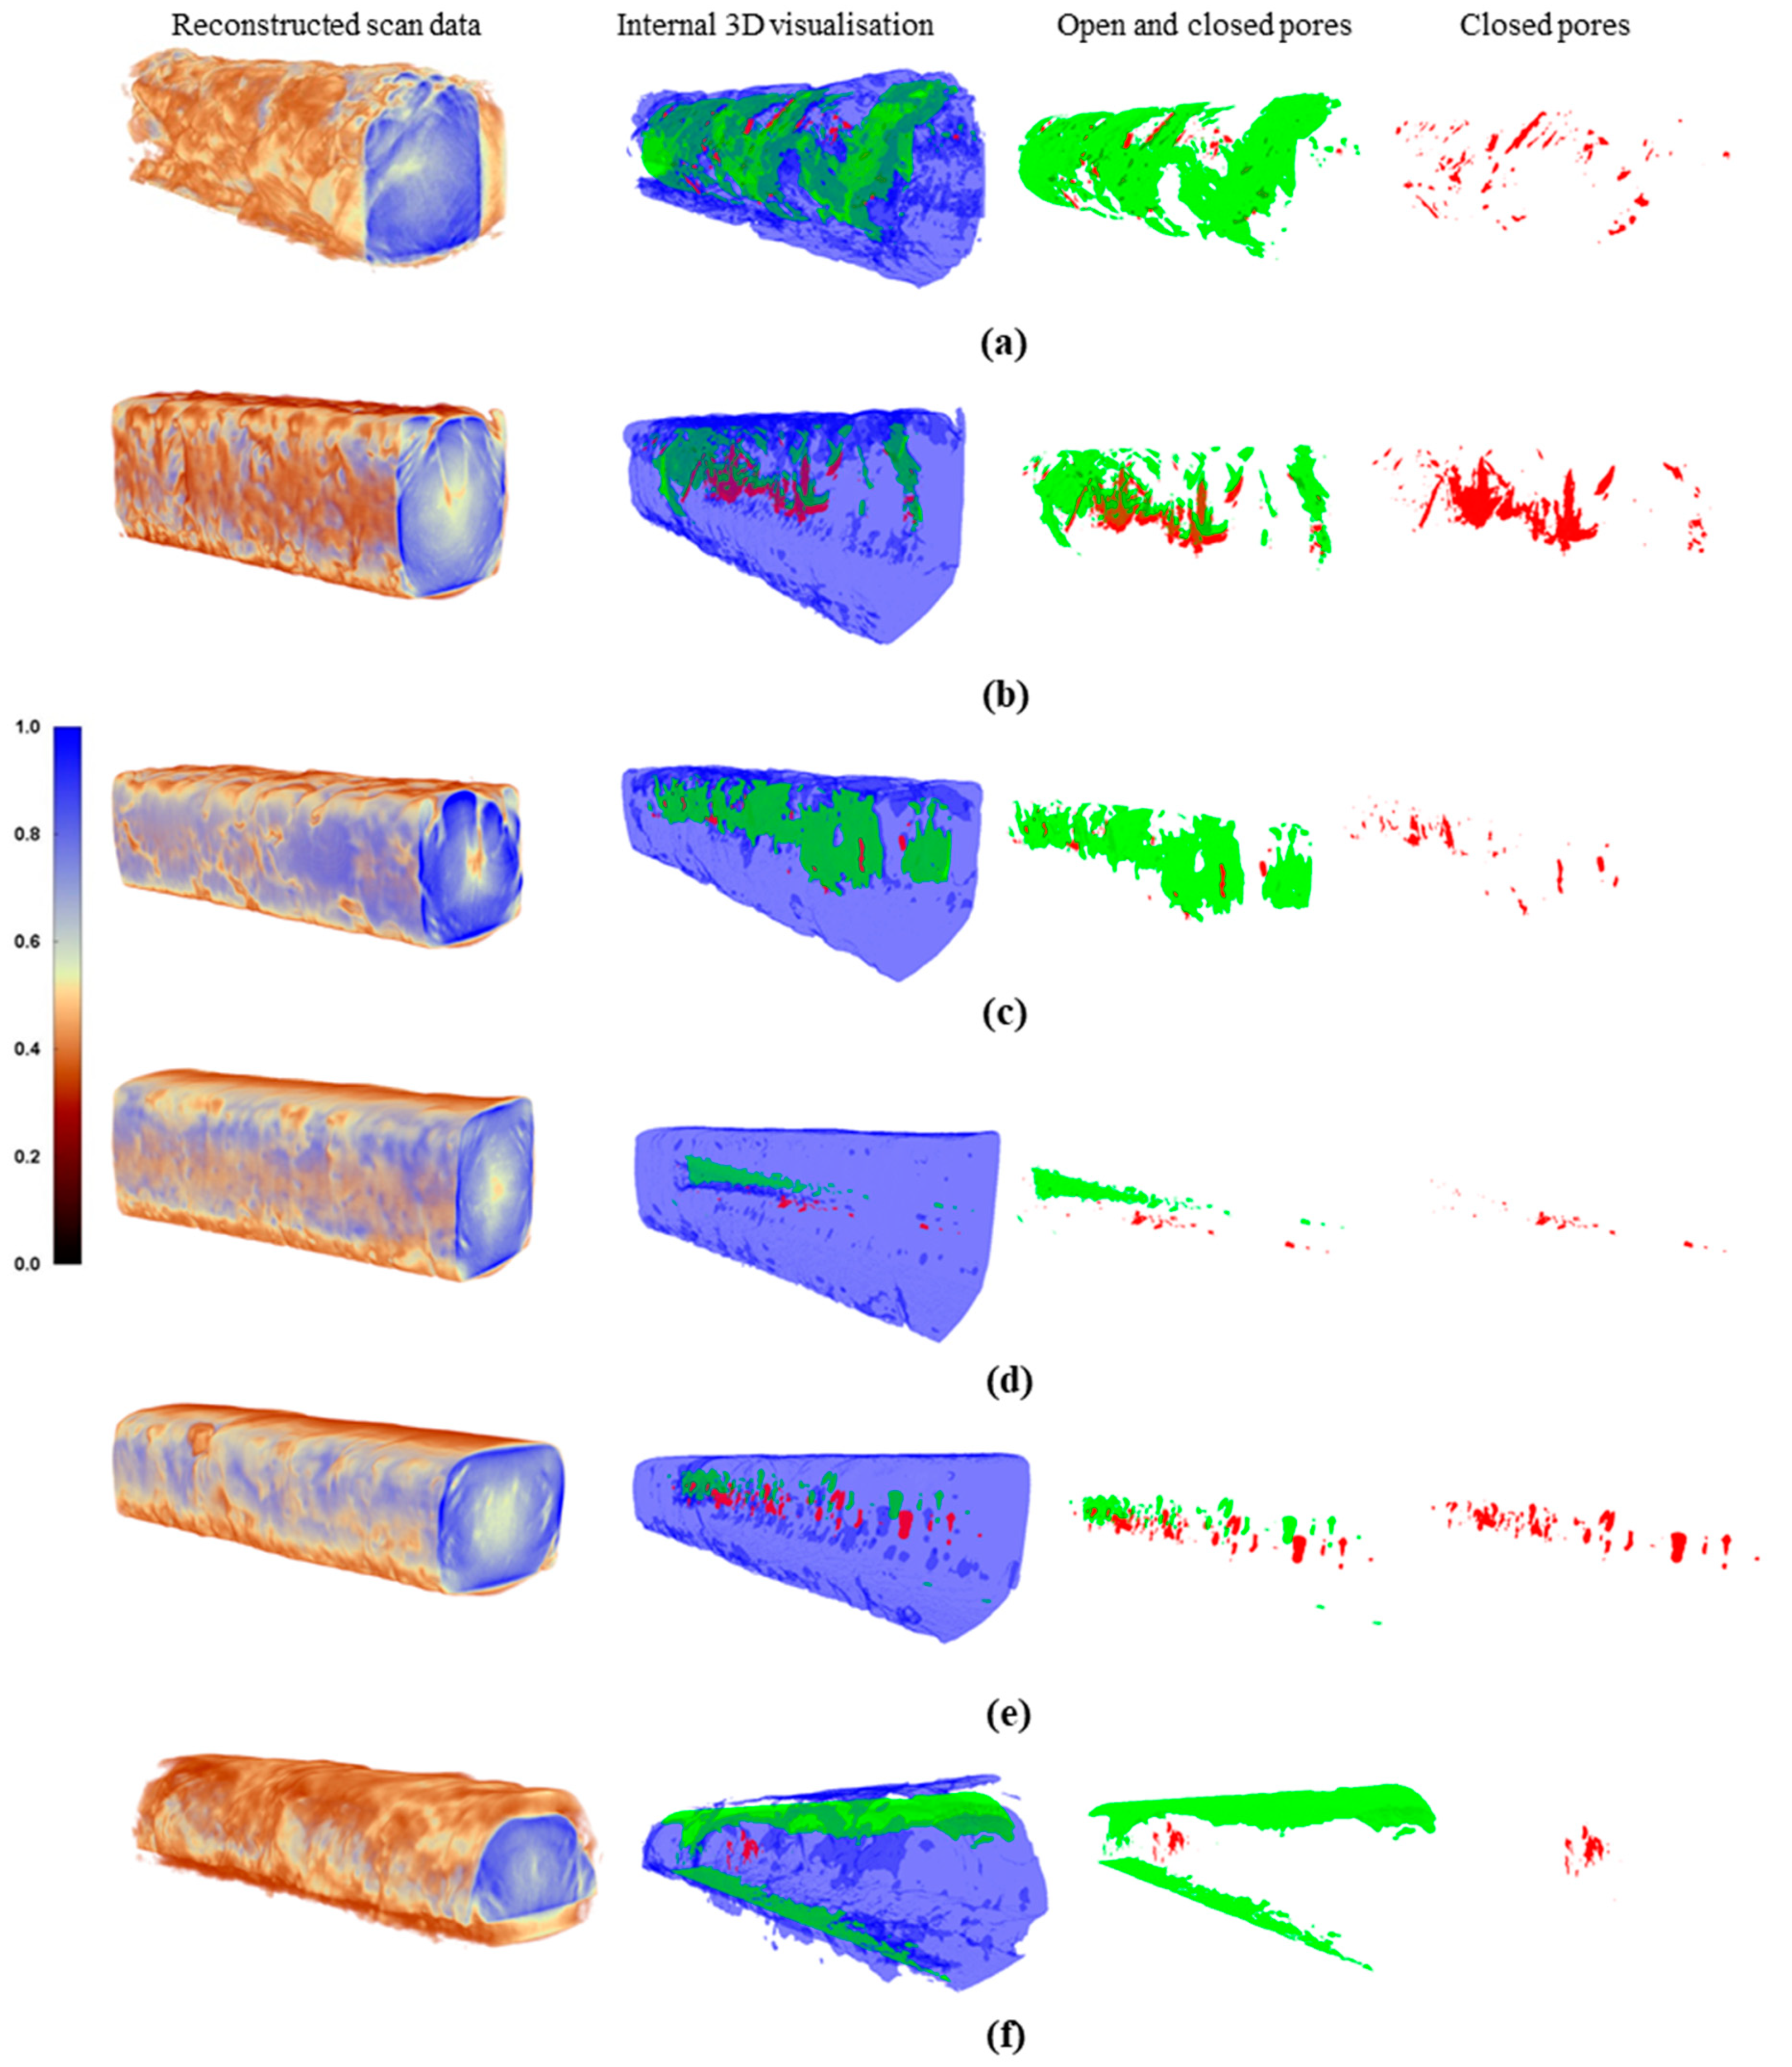
3.3. X-ray Computed Tomography and 3D Visualisation

All the samples had varying X-ray absorption rates; hence, 3D visuals were produced for several manufactured Ag-D samples at various turbine pressures and scan speeds (see Figure 8a–f). Distinct regions of porosity and increased material density were visualised through the algorithmic interpretation of the X-ray absorption rates, with porous (low absorption rates) and dense (high absorption) represented by 0 (black) and 1 (blue), respectively. In order to evaluate the form and distribution of the pore defects, internal closed pore porosity voids for the as-built samples were studied and highlighted in red, as seen in the following figures. As-built samples containing lower diamond content, a lower scan speed and a higher turbine pressure (sample 4) were shown to correspond with significantly lower pore defects as seen in Figure 8d,e, while the other as-built samples revealed higher pore defects.
As the diamond concentration rises, there is a noticeable fluctuation in the number of open and closed pores observed, as presented by the xCT data and 3D visualisations in Figure 8d–f. For all the Ag-D compositions, a lower scan speed decreased the pore content and pore size, but the addition of D considerably increased the average pore size and pore content. Pore defects have been found to have a detrimental influence on a material’s mechanical performance [32,43]; thus, it seems that the Ag-D0.1% (sample 4, see Figure 8d) showed less pore defects that would provide stronger mechanical stability, which correlated well with the mechanical properties in Section 3.5. The reduced porosity revealed by xCT for sample 4 could be attributed to the consequence of a better packing density and layer delivery from reduced powder PVD in the Ag-D alloy system.

3.4. xCT Porosity Defect Analysis

The xCT porosity data for the L-PBF Ag-D in situ alloys at different turbine pressures are displayed in Figure 9a–c. As the turbine pressure increased, the sample volume rose from 91% to 96%. The closed pore volume increased up to a turbine pressure of 0.8 mbar before dropping to 0.15% for a turbine pressure of 1 mbar. The open pore volume showed the reverse pattern of the closed pore volume; initially, the open pore volume decreased from 0.6 to 0.8 mbar and then increased to 3.8% for the 1 mbar produced. This result suggested that the 1 mbar turbine pressure provides the optimum turbine pressure to build dense built materials.
The xCT porosity data for the SLM Ag-D in situ alloys at D 0.1%, 0.2% and 0.3% are shown in Figure 10a–c. The sample volume decreased from 99% to 89% with increasing the diamond content. The closed pore volume increased up to 0.2% of the diamond content and then decreased to 0.05% for the 0.3% containing diamond. The open pore volume showed the opposite trend of the closed pore volume, where it decreased initially from 0.1% to 0.2% and then increased to 11% for the Ag-D0.3% built. Overall, the xCT revealed that both the open and closed pore volumes were to be minimal for the 0.1% diamond content, which indicates increased structure density values in comparison to the other diamond contents investigated. These results correlated well with the melt pool monitoring data as well as the X-ray computed tomography and 3D visualisation.

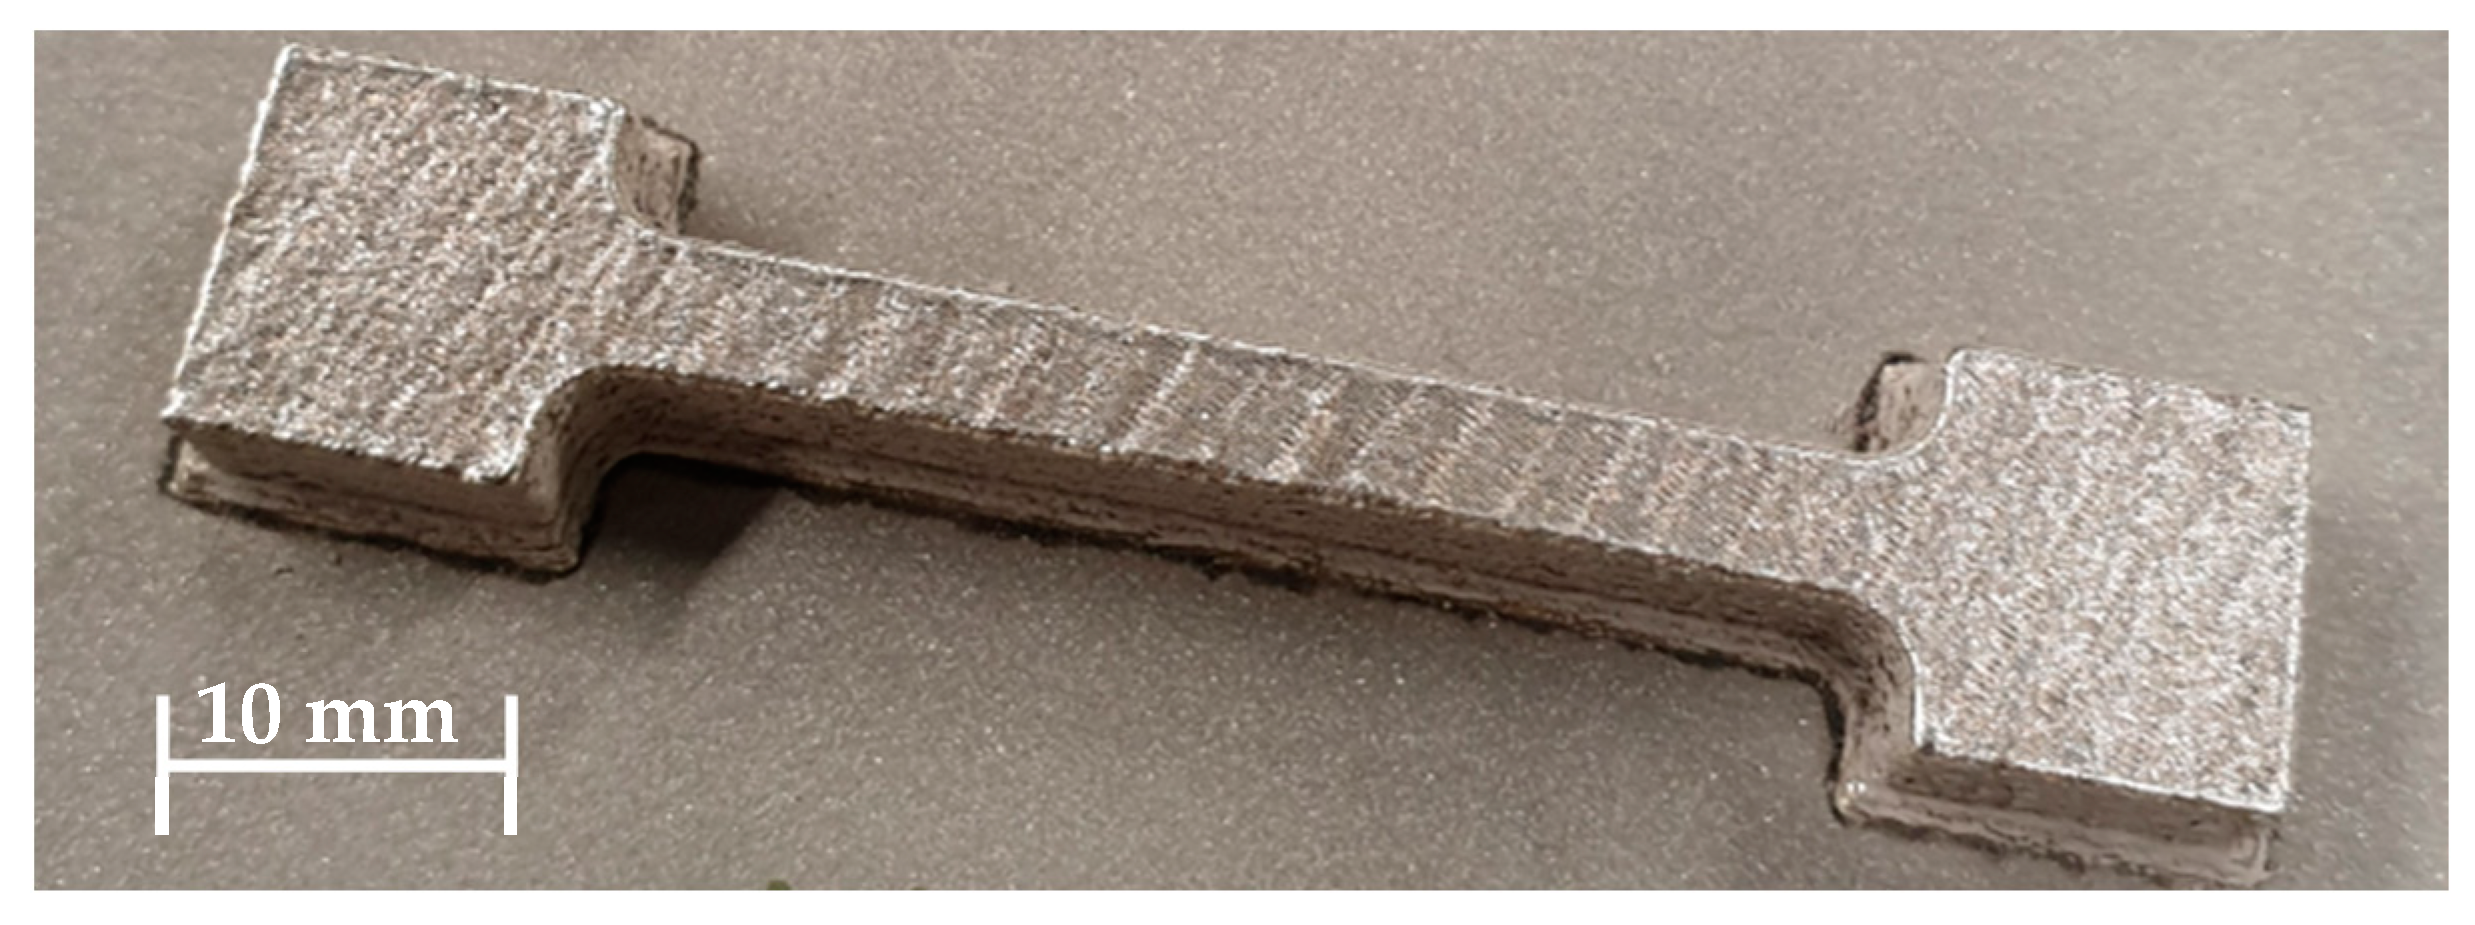
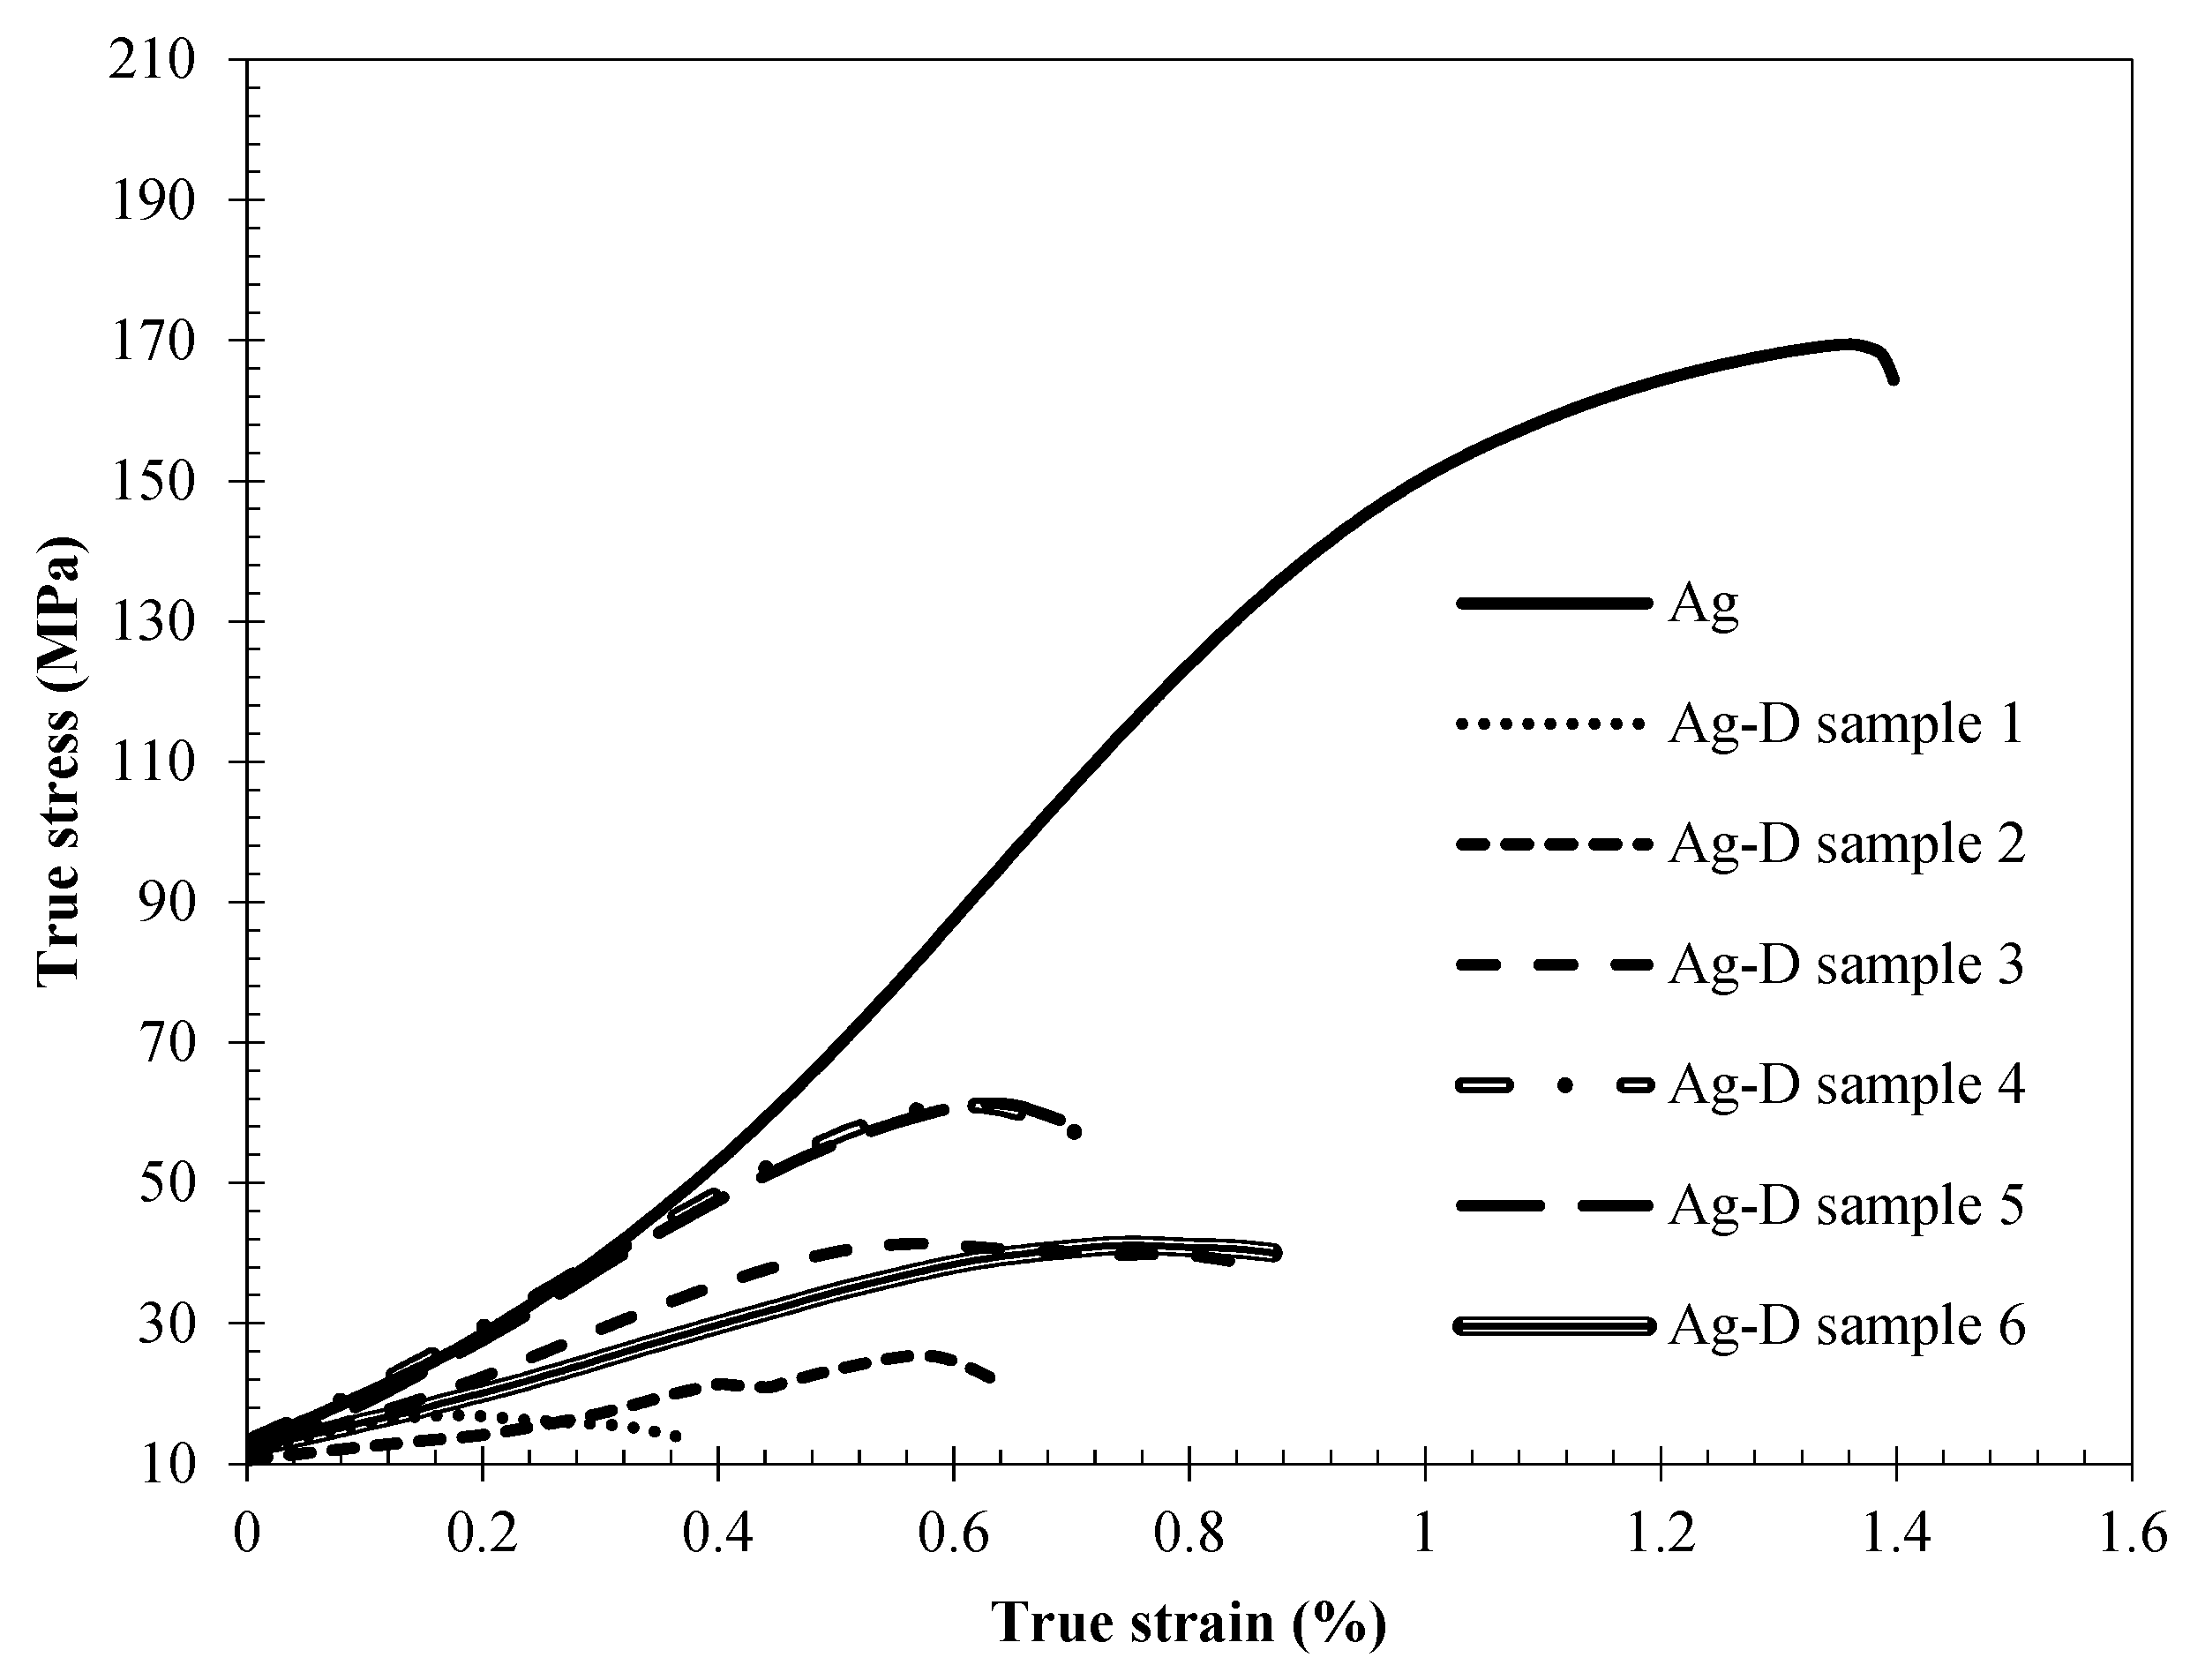
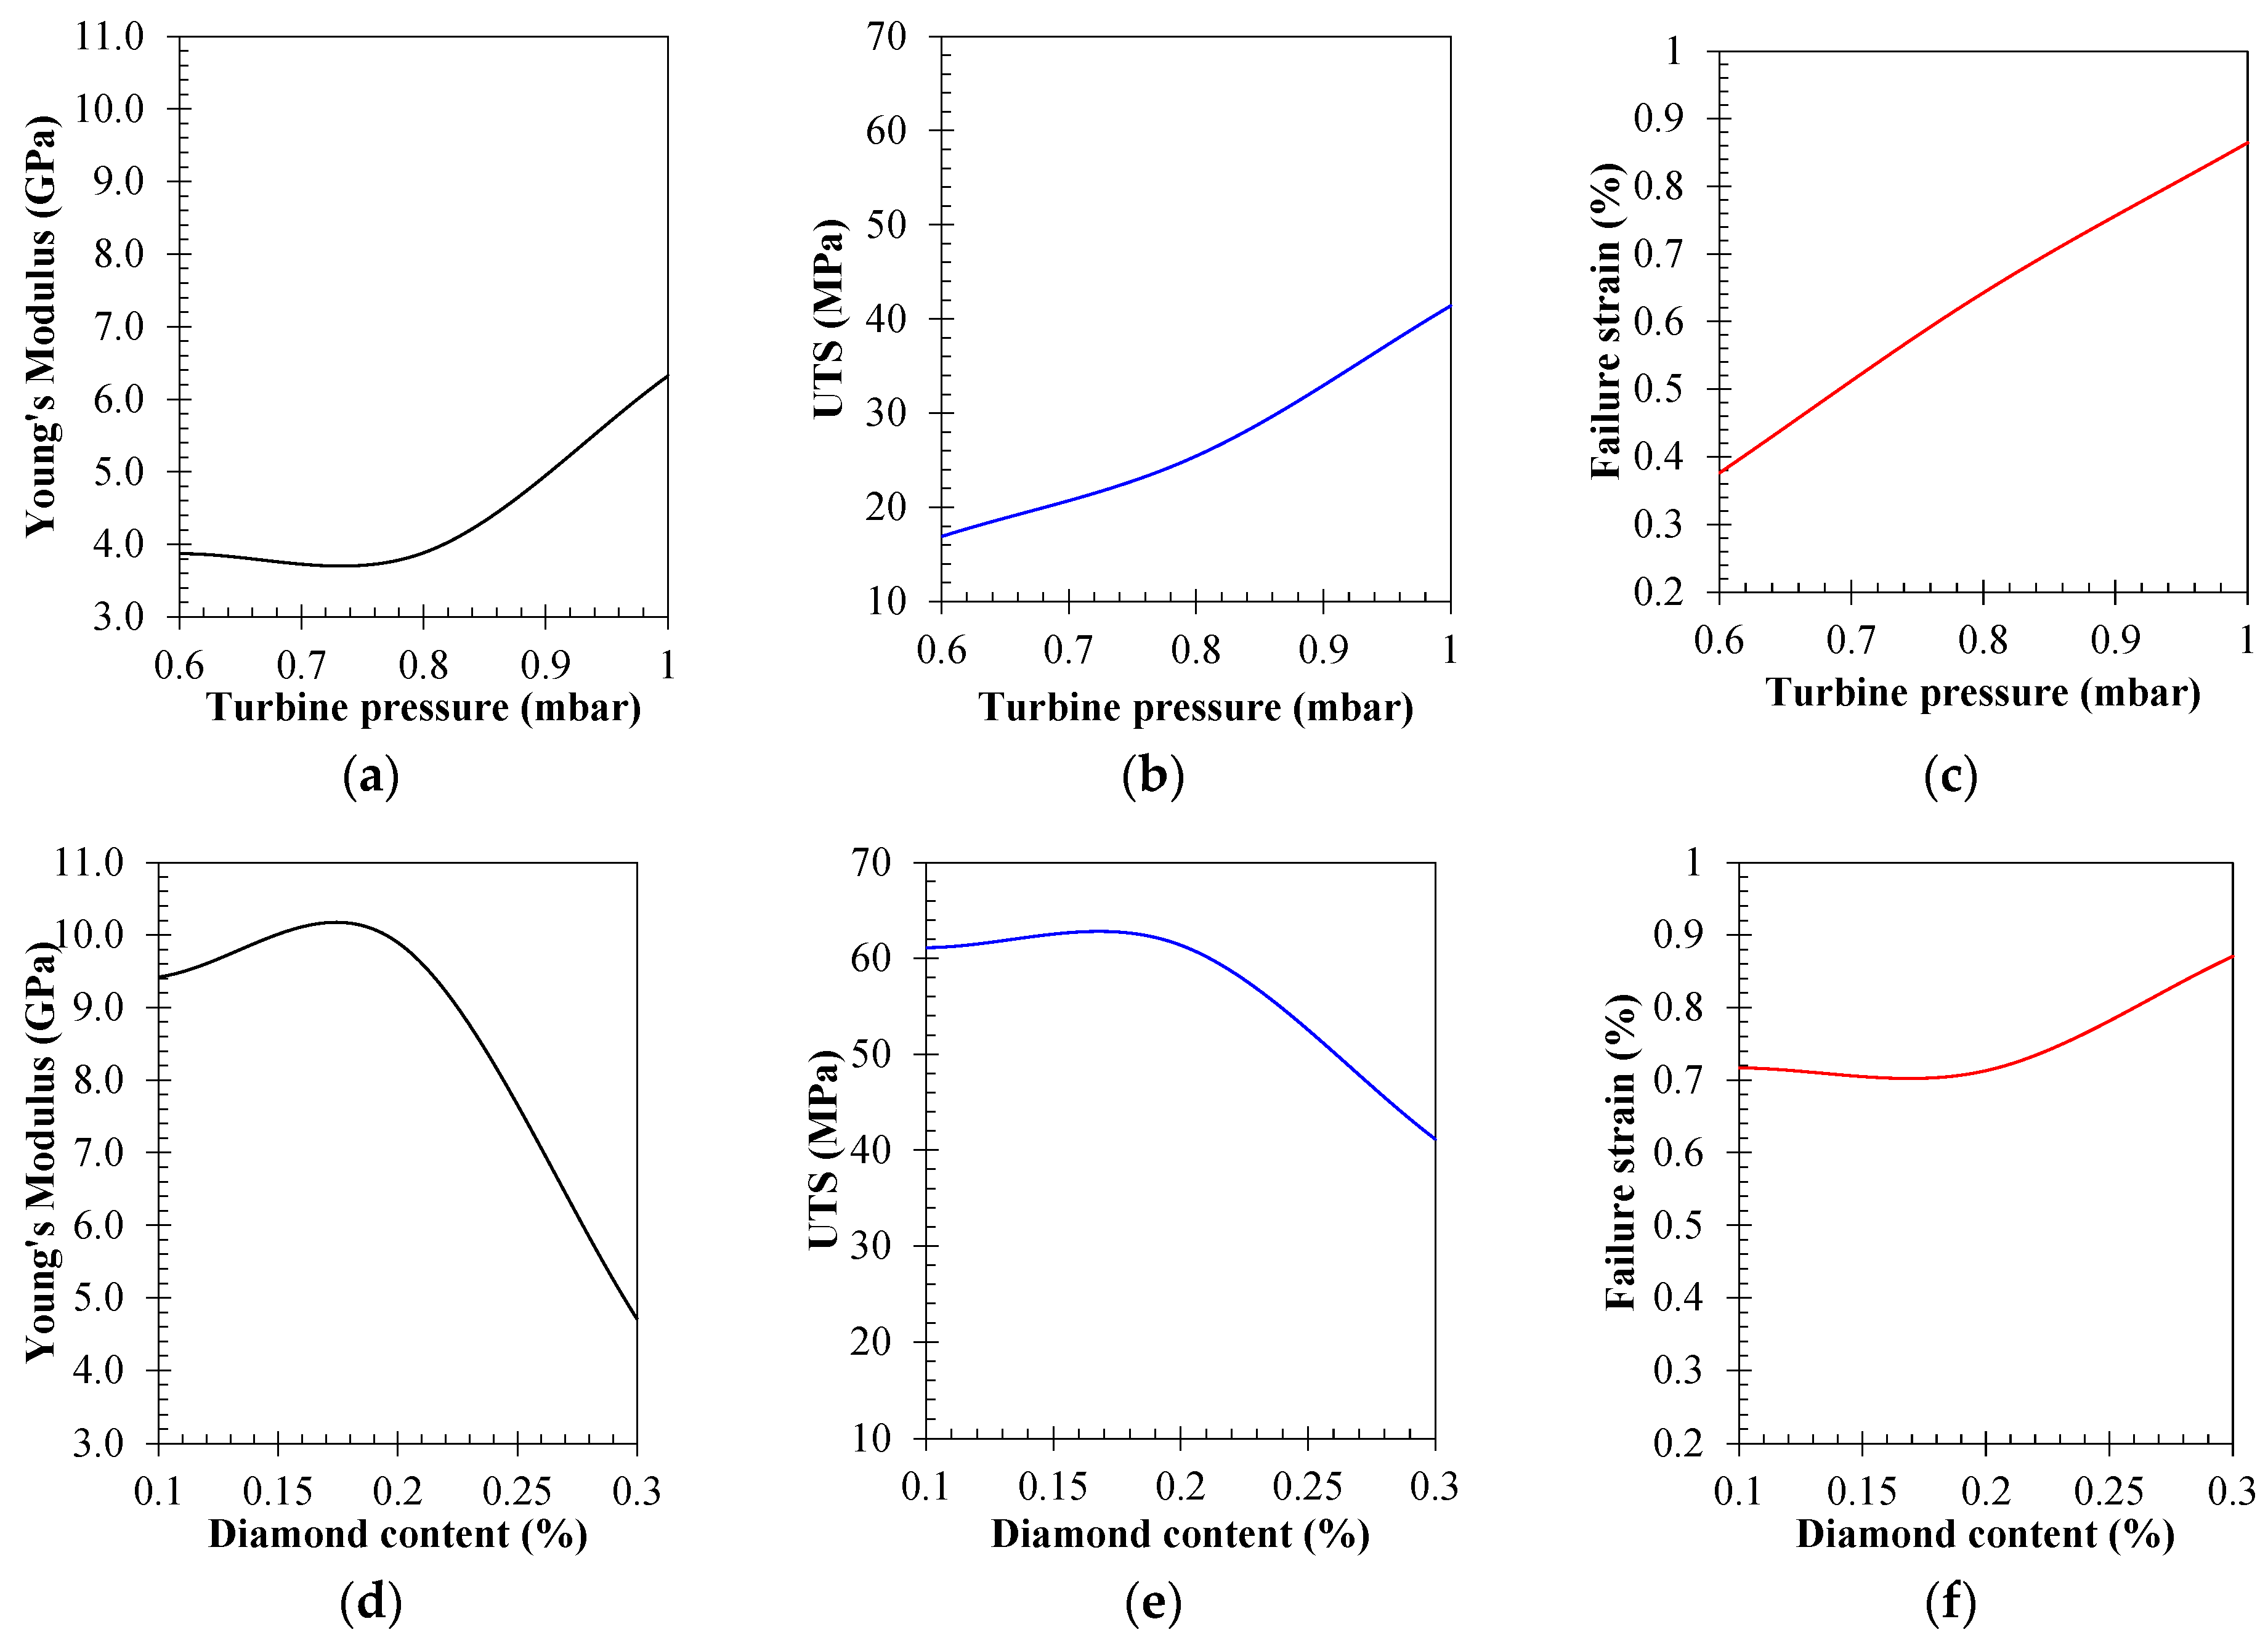
3.5. Mechanical Performance

The addition of D to Ag is a promising composition; coupled with the design freedoms of additive manufacturing positions this MMC as one of the most desirable for thermal, mechanical and biomedical applications. No literature studies investigated the interaction between Ag and D for L-PBF. Accordingly, Figure 11 presents the true stress–strain ( σ ε ) curve for the additive manufacture of Ag-D with increasing D content between 0.1 and 0.3% with varying turbine pressures and scanning speeds. The corresponding performance parameters of Young’s modulus (E), the failure strain ( ε f ) and the ultimate tensile strength (UTS) are shown in Figure 12.
The σ − ε graph clearly indicates that the addition of diamond considerably reduces the elastic and plastic capacity of the MMC. The base Ag sample exhibited heightened ductility as presented graphically, Figure 12a–f. The specimens comprising 0.1% diamond content, processed using a constant scanning speed of 400 mm/s and an increase in the turbine pressure from 0.6 mbar to 1.0 mbar, resulted in a significantly heightened E, UTS and ε f , increasing by 63%, 145% and 129%, respectively, and hence indicating the strong influence of increasing the turbine pressure to 1.0 mbar. It was revealed that each E, UTS and ε f did heighten with an increased turbine pressure and was approximately linear, Figure 12a–c. It is evident that the increase in the turbine pressure towards a Young’s modulus of 0.1% diamond content in samples manufactured using a 400 mm/s scan speed is not insignificant and, depending on the desired material ductility, can induce improved failure strain and UTS capacity. It can be observed however that the increase in the turbine pressure between 0.8 mbar and 1.0 mbar has influence towards the E, UTS and ε f values, hence the motivation to pursue a turbine pressure of 1.0 mbar.
The mechanical testing of the specimens with increasing diamond content of the MMC revealed a decreased E and UTS with an increased ε f of −52%, −33% and +21%, respectively. As previously determined using xCT, as the diamond concentration rises, as does the occurrence and average size of the open and closed pores. The mechanical testing broadly supports this with the observed E and UTS reduction; however, between 0.1% and 0.2% diamond content does not appear to considerably influence the mechanical performance of the metal-matrix composite, Figure 12d–f. A substantial difference in the E and UTS values in the Ag-D MMCs was observed in terms of the turbine pressure and the diamond content. However, similar trends were observed in both cases. Several factors such as the preparation of the specimen, molecular structure, intermolecular bonding forces and compositions influence these behaviours. More detailed investigations are required to explore the underlying mechanism and to understand the behaviour of different materials in terms of the mechanical properties.

4. Conclusions

In this study, Ag-D in situ structures with varying diamond content at different turbine pressures and scan speeds were fabricated using L-PBF additive manufacturing (AM). The tensile specimens were made using varying turbine pressures and scan speeds, and their effects on the melt pool morphology were studied. The resultant pore defect distribution and mechanical performance were reported for as-built Ag-D samples through X-ray computed tomography (xCT) and quasi-static mechanical testing with the resulting stress–strain curve. The samples made with Ag-D0.1% and a 0.6 mbar to 1 mbar turbine pressure showed unsuccessful smooth surface development. In order to further optimise the process parameters, the scan speed was reduced from 400 mm/s to 200 mm/s for Ag-D0.1%. The sample was successfully manufactured with a smooth surface finish, which is regarded as the ideal process parameter for construct fabrication.
Sample 4 containing 0.1%Diamond with a 200 mm/s scan speed and 1 mbar turbine pressure showed a smooth, dense and dark surface morphology compared to the other samples.
An xCT analysis revealed heightening porosity (open pores and closed pores) with increasing D content. Increasing the Ag content from 0.1% to 0.2% showed the open pore volume decreased by 1% and then increased by 10% for 0.3% diamond content. However, the closed pore volume revealed the opposite trend for the as-built samples. These results also indicated that the Ag-D0.1% composite shows a low number of open and closed pores, which indicated increased density. Similar closed pore volume behaviour was observed at different turbine pressures for the Ag-D metal-matrix composite as-built samples.
The as-built 0.1% diamond samples exhibited an increase in the E, UTS and ε f of 63%, 145% and 129%, respectively, for the specimens manufactured featuring a constant scanning speed of 400 mm/s and an increasing turbine pressure between 0.6 mbar and 1.0 mbar. Interestingly, increasing the diamond content from 0.1% to 0.3% significantly reduced the E and UTS of the tensile specimen by 52% and 33%, respectively, whilst exhibiting an ε f increased by 21%.
Therefore, the sets of parameters such as 200 mm/s and 1.0 mbar turbine pressure could be recommended to produce denser parts in the Ag-D0.1% MMC using laser powder bed fusion. However, further optimisation is necessary in order to manufacture Ag-D0.2% and Ag-D0.3% successfully. In addition, more detailed analyses are required in order to investigate the grain size and distribution of D particles on Ag-D MMCs, which would provide more in-depth knowledge of the properties and performance of Ag-D MMCs.

Author Contributions

Conceptualization, methodology J.R., A.A. (Arun Arjunan) and A.B.; software, validation, formal analysis, investigation, resources, data curation, writing—original draft preparation, writing—review and editing, visualization, supervision, project administration, funding acquisition, J.R., A.A. (Abul Arafat), A.A. (Arun Arjunan), A.V. and A.B. All authors have read and agreed to the published version of the manuscript.

Funding

Innovate UK Knowledge Transfer Partnership KTP013117 (University of Wolverhampton/AceOn).

Data Availability Statement

The data that support the findings of this study are available from the corresponding author upon reasonable request.

Acknowledgments

This research was conducted with support from the Innovate UK Knowledge Transfer Partnership, AceOn Group Ltd., the University of Wolverhampton, Element Six Ltd., Additive Analytics Ltd. and EOS GmbH.

Conflicts of Interest

Author J.R. was employed by the Additive Analytics Ltd. The remaining authors declare that the research was conducted in the absence of any commercial or financial relationships that could be construed as a potential conflict of interest.

References

  1. Bradley, D. Every silver-lined solar cell. Mater. Today 2009, 12, 10. [Google Scholar] [CrossRef]
  2. Bradley, D. Silver nanowires, at a stretch. Mater. Today 2012, 15, 361. [Google Scholar] [CrossRef]
  3. Maharubin, S.; Hu, Y.; Sooriyaarachchi, D.; Cong, W.; Tan, G.Z. Laser engineered net shaping of antimicrobial and biocompatible titanium-silver alloys. Mater. Sci. Eng. C 2019, 105, 110059. [Google Scholar] [CrossRef] [PubMed]
  4. van Hengel, I.A.; Riool, M.; Fratila-Apachitei, L.E.; Witte-Bouma, J.; Farrell, E.; Zadpoor, A.A.; Zaat, S.A.; Apachitei, I. Selective laser melting porous metallic implants with immobilized silver nanoparticles kill and prevent biofilm formation by methicillin-resistant Staphylococcus aureus. Biomaterials 2017, 140, 1–15. [Google Scholar] [CrossRef] [PubMed]
  5. Bonilla-Gameros, L.; Chevallier, P.; Sarkissian, A.; Mantovani, D. Silver-based antibacterial strategies for healthcare-associated infections: Processes, challenges, and regulations. An integrated review. Nanomed. Nanotechnol. Biol. Med. 2020, 24, 102142. [Google Scholar] [CrossRef] [PubMed]
  6. Gohar, G.A.; Manzoor, T.; Shah, A.N. Investigation of thermal and mechanical properties of Cu-Al alloys with silver addition prepared by powder metallurgy. J. Alloys Compd. 2018, 735, 802–812. [Google Scholar] [CrossRef]
  7. Yang, K.-H.; Narayan, R.J. Biocompatibility and functionalization of diamond for neural applications. Curr. Opin. Biomed. Eng. 2019, 10, 60–68. [Google Scholar] [CrossRef]
  8. Mashali, F.; Languri, E.M.; Davidson, J.; Kerns, D.; Johnson, W.; Nawaz, K.; Cunningham, G. Thermo-physical properties of diamond nanofluids: A review. Int. J. Heat Mass Transf. 2019, 129, 1123–1135. [Google Scholar] [CrossRef]
  9. Tyagi, A.; Walia, R.; Murtaza, Q.; Pandey, S.M.; Tyagi, P.K.; Bajaj, B. A critical review of diamond like carbon coating for wear resistance applications. Int. J. Refract. Met. Hard Mater. 2018, 78, 107–122. [Google Scholar] [CrossRef]
  10. Stoupin, S. Novel diamond X-ray crystal optics for synchrotrons and X-ray free-electron lasers. Diam. Relat. Mater. 2014, 49, 39–47. [Google Scholar] [CrossRef]
  11. Element, C.; Technologies, S. Diamond Handbook Element6. Available online: https://e6cvd.com/media/wysiwyg/pdf/Element_Six_CVD_Diamond_handbook_2022.pdf (accessed on 2 September 2023).
  12. Taylor, S.L. An Investigation of the Mechanical and Physical Properties of Copper-Silver Alloys and the Use of These Alloys in Pre-Columbian America. Ph.D. Thesis, Massachusetts Institute of Technology, Cambridge, MA, USA, 2013. [Google Scholar]
  13. Xie, Z.; Guo, H.; Zhang, X.; Huang, S. Enhancing thermal conductivity of Diamond/Cu composites by regulating distribution of bimodal diamond particles. Diam. Relat. Mater. 2019, 100, 107564. [Google Scholar] [CrossRef]
  14. Constantin, L.; Kraiem, N.; Wu, Z.; Cui, B.; Battaglia, J.-L.; Garnier, C.; Silvain, J.-F.; Lu, Y.F. Manufacturing of complex diamond-based composite structures via laser powder-bed fusion. Addit. Manuf. 2021, 40, 101927. [Google Scholar] [CrossRef]
  15. Constantin, L.; Fan, L.; Pontoreau, M.; Wang, F.; Cui, B.; Battaglia, J.-L.; Silvain, J.-F.; Lu, Y.F. Additive manufacturing of copper/diamond composites for thermal management applications. Manuf. Lett. 2020, 24, 61–66. [Google Scholar] [CrossRef]
  16. Jhong, Y.-S.; Tseng, H.-T.; Lin, S.-J. Diamond/Ag-Ti composites with high thermal conductivity and excellent thermal cycling performance fabricated by pressureless sintering. J. Alloys Compd. 2019, 801, 589–595. [Google Scholar] [CrossRef]
  17. Xu, T.; Wu, L.; Yu, Y.; Li, W.; Zhi, J. Synthesis and characterization of diamond–silver composite with anti-bacterial property. Mater. Lett. 2014, 114, 92–95. [Google Scholar] [CrossRef]
  18. Hutsch, T.; Schubert, T.; Weißgärber, T.; Kieback, B. Silver/diamond composite material—Powder metallurgical route and thermo-physical properties. Key Eng. Mater. 2017, 742, 151–157. [Google Scholar] [CrossRef]
  19. Nakagawa, H.; Miseki, Y.; Akoshima, M. Gas adsorption, thermal and structural properties of sinters made of fine silver powder for ultra-low-temperature heat exchangers. Cryogenics 2019, 102, 1–8. [Google Scholar] [CrossRef]
  20. Faqir, M.; Batten, T.; Mrotzek, T.; Knippscheer, S.; Massiot, M.; Buchta, M.; Blanck, H.; Rochette, S.; Vendier, O.; Kuball, M. Improved thermal management for GaN power electronics: Silver diamond composite packages. Microelectron. Reliab. 2012, 52, 3022–3025. [Google Scholar] [CrossRef]
  21. Lan, W.-C.; Ou, S.-F.; Lin, M.-H.; Ou, K.-L.; Tsai, M.-Y. Development of silver-containing diamond-like carbon for biomedical applications. Part I: Microstructure characteristics, mechanical properties and antibacterial mechanisms. Ceram. Int. 2013, 39, 4099–4104. [Google Scholar] [CrossRef]
  22. Lee, M.-T.; Chung, C.-Y.; Yen, S.-C.; Lu, C.-L.; Lin, S.-J. High thermal conductive diamond/Ag–Ti composites fabricated by low-cost cold pressing and vacuum liquid sintering techniques. Diam. Relat. Mater. 2014, 44, 95–99. [Google Scholar] [CrossRef]
  23. Lee, M.-T.; Fu, M.-H.; Wu, J.-L.; Chung, C.-Y.; Lin, S.-J. Thermal properties of diamond/Ag composites fabricated by eletroless silver plating. Diam. Relat. Mater. 2011, 20, 130–133. [Google Scholar] [CrossRef]
  24. Gan, J.; Gao, H.; Wen, S.; Zhou, Y.; Tan, S.; Duan, L. Simulation, forming process and mechanical property of Cu-Sn-Ti/diamond composites fabricated by selective laser melting. Int. J. Refract. Met. Hard Mater. 2019, 87, 105144. [Google Scholar] [CrossRef]
  25. Ma, Y.; Ji, G.; Li, X.P.; Chen, C.Y.; Tan, Z.Q.; Addad, A.; Li, Z.Q.; Sercombe, T.B.; Kruth, J.P. On the study of tailorable interface structure in a diamond/Al12Si composite processed by selective laser melting. Materialia 2019, 5, 100242. [Google Scholar] [CrossRef]
  26. Munsch, M.; Schmidt-Lehr, M.; Wycisk, E. Additive Manufacturing New Metal Technologies. AM Power Insights 2020, 6. Available online: https://ampower.eu/insights/new-metal-technologies/ (accessed on 2 September 2023).
  27. Robinson, J.; Stanford, M.; Arjunan, A. Correlation between selective laser melting parameters, pore defects and tensile properties of 99.9% silver. Mater. Today Commun. 2020, 25, 101550. [Google Scholar] [CrossRef]
  28. Fieres, J.; Schumann, P.; Reinhart, C. Predicting failure in additively manufactured parts using X-ray computed tomography and simulation. Procedia Eng. 2018, 213, 69–78. [Google Scholar] [CrossRef]
  29. Ortega, N.; Martínez, S.; Cerrillo, I.; Lamikiz, A.; Ukar, E. Computed tomography approach to quality control of the Inconel 718 components obtained by additive manufacturing (SLM). Procedia Manuf. 2017, 13, 116–123. [Google Scholar] [CrossRef]
  30. Bayat, M.; Thanki, A.; Mohanty, S.; Witvrouw, A.; Yang, S.; Thorborg, J.; Tiedje, N.S.; Hattel, J.H. Keyhole-induced porosities in Laser-based Powder Bed Fusion (L-PBF) of Ti6Al4V: High-fidelity modelling and experimental validation. Addit. Manuf. 2019, 30, 100835. [Google Scholar] [CrossRef]
  31. Tan, J.H.; Wong, W.L.E.; Dalgarno, K.W. An overview of powder granulometry on feedstock and part performance in the selective laser melting process. Addit. Manuf. 2017, 18, 228–255. [Google Scholar] [CrossRef]
  32. Robinson, J.; Stanford, M.; Arjunan, A. Stable formation of powder bed laser fused 99.9% silver. Mater. Today Commun. 2020, 24, 101195. [Google Scholar] [CrossRef]
  33. Robinson, J.; Arjunan, A.; Stanford, M.; Lyall, I.; Williams, C. Effect of silver addition in copper-silver alloys fabricated by laser powder bed fusion in situ alloying. J. Alloys Compd. 2021, 857, 157561. [Google Scholar] [CrossRef]
  34. Liverani, E.; Toschi, S.; Ceschini, L.; Fortunato, A. Effect of selective laser melting (SLM) process parameters on microstructure and mechanical properties of 316L austenitic stainless steel. J. Mater. Process. Technol. 2017, 249, 255–263. [Google Scholar] [CrossRef]
  35. Sun, D.; Gu, D.; Lin, K.; Ma, J.; Chen, W.; Huang, J.; Sun, X.; Chu, M. Selective laser melting of titanium parts: Influence of laser process parameters on macro- and microstructures and tensile property. Powder Technol. 2019, 342, 371–379. [Google Scholar] [CrossRef]
  36. Su, X.; Yang, Y. Research on track overlapping during Selective Laser Melting of powders. J. Mater. Process. Technol. 2012, 212, 2074–2079. [Google Scholar] [CrossRef]
  37. Zhang, B.; Dembinski, L.; Coddet, C. The study of the laser parameters and environment variables effect on mechanical properties of high compact parts elaborated by selective laser melting 316L powder. Mater. Sci. Eng. A 2013, 584, 21–31. [Google Scholar] [CrossRef]
  38. Olakanmi, E.O.T.; Cochrane, R.F.; Dalgarno, K.W. A review on selective laser sintering/melting (SLS/SLM) of aluminium alloy powders: Processing, microstructure, and properties. Prog. Mater. Sci. 2015, 74, 401–477. [Google Scholar] [CrossRef]
  39. Read, N.; Wang, W.; Essa, K.; Attallah, M.M. Selective laser melting of AlSi10Mg alloy: Process optimisation and mechanical properties development. Mater. Des. 2015, 65, 417–424. [Google Scholar] [CrossRef]
  40. Dilip, J.J.S.; Zhang, S.; Teng, C.; Zeng, K.; Robinson, C.; Pal, D.; Stucker, B. Influence of processing parameters on the evolution of melt pool, porosity, and microstructures in Ti-6Al-4V alloy parts fabricated by selective laser melting. Prog. Addit. Manuf. 2017, 2, 157–167. [Google Scholar] [CrossRef]
  41. Cheng, B.; Lydon, J.; Cooper, K.; Cole, V.; Northrop, P.; Chou, K. Melt pool sensing and size analysis in laser powder-bed metal additive manufacturing. J. Manuf. Process. 2018, 32, 744–753. [Google Scholar] [CrossRef]
  42. Esmaeilizadeh, R.; Ali, U.; Keshavarzkermani, A.; Mahmoodkhani, Y.; Marzbanrad, E.; Toyserkani, E. On the effect of spatter particles distribution on the quality of Hastelloy X parts made by laser powder-bed fusion additive manufacturing. J. Manuf. Process. 2019, 37, 11–20. [Google Scholar] [CrossRef]
  43. Zhang, B.; Liu, S.; Shin, Y.C. In-Process monitoring of porosity during laser additive manufacturing process. Addit. Manuf. 2019, 28, 497–505. [Google Scholar] [CrossRef]
Figure 1. Scanning electron microscopy (SEM) data for powders showing (a) silver and (b) diamond.
Machines 11 01037 g001
Figure 2. Sterling silver (Ag) energy dispersive X-ray (EDX) element analysis.
Machines 11 01037 g002
Figure 3. Particle volume distribution (PVD) for Ag-Dia0.1, Ag-Dia0.2 and Ag-Dia0.3 powders.
Machines 11 01037 g003
Figure 4. Ag as built (12 mm × 61.5 mm × 4 mm) on build platform using parameters in Table 1.
Machines 11 01037 g004
Figure 5. As built on build platform Ag-D0.1% composite samples showing effects of D addition and turbine parameter for (a) Ag-D0.1 turbine 0.60 mbar, (b) Ag-D0.1 turbine 0.80 mbar and (c) Ag-D0.1 turbine 1.0 mbar. Dimension of the sample is 12 mm × 61.5 mm × 4 mm.
Machines 11 01037 g005
Figure 6. Ag-D in situ composite samples showing effects of D addition and turbine and scan speed parameter adjustments: (a) Ag-D0.1, turbine 0.60 mbar and 400 mm/s scan speed, (b) Ag-D0.1 turbine 0.80 mbar and 400 mm/s scan speed, (c) Ag-D0.1 turbine 1.0 mbar and 400 mm/s scan speed, (d) D0.1 turbine 1.0 mbar and 200 mm/s scan speed, (e) D0.2 turbine 1.0 mbar and 200 mm/s scan speed and (f) D0.3 turbine 1.0 mbar and 200 mm/s scan speed.
Machines 11 01037 g006
Figure 7. Melt pool monitoring visuals for (a) sample 3 Ag-D, (b) sample 4 Ag-D, (c) sample 5 Ag-D and (d) sample 6 Ag-D in situ composite sample showing light radiation throughout the build, where build height was 0.12 mm, 1 mm, 2 mm and 3 mm as shown.
Machines 11 01037 g007
Figure 8. X-ray computed tomography data of (a) sample 1, (b) sample 2, (c) sample 3, (d) sample 4, (e) sample 5 and (f) sample 6 showing reconstructed data coded for internal visualisation, highlighting overall porosity distributed as open and closed pores. Each sample features different print parameters and Ag concentration as highlighted in Table 2.
Machines 11 01037 g008
Figure 9. xCT pore defect data for L-PBF D0.1% sample showing (a) sample volume, (b) closed pore volume and (c) open pore volume.
Machines 11 01037 g009
Figure 10. xCT pore defect data for SLM Ag-D 0.1, 0.2 and 0.3% samples showing (a) sample volume, (b) closed pore volume and (c) open pore volume.
Machines 11 01037 g010
Figure 11. True stress–strain curves for L-PBF of Ag and Ag-D composite samples.
Machines 11 01037 g011
Figure 12. Mechanical performance of L-PBF Ag and Ag-D composite samples for (a,d) Young’s modulus (E), (b,e) ultimate tensile strength (UTS) and (c,f) failure strain ( ε f ) at varying turbine pressures and increasing diamond content percentage, respectively.
Machines 11 01037 g012
Table 1. Initial L-PBF process parameters used for Ag.
Laser Power
(W)
Scan Speed
(mm/s)
Hatch Distance
(mm)
Layer Thickness
(µm)
Turbine
(mbar)
3704000.14300.60
Table 2. Initial L-PBF process parameters used for Ag and Ag-D composite fabrication.
SampleDiamond Content (wt.%) Scan Speed (mm/s)Turbine (mbar)
10.14000.60
20.14000.80
30.14001.0
40.12001.0
50.22001.0
60.32001.0
Table 3. Percentile size distribution D10, D50 and D90 for Ag-D0.1%, Ag-D0.2% and Ag-D0.3% powder.
Sample NameD10 (µm)D50 (µm)D90 (µm)
Ag-D0.1%3.74.85.2
Ag-D0.2%4.35.16.7
Ag-D0.3%4.65.97.6
Disclaimer/Publisher’s Note: The statements, opinions and data contained in all publications are solely those of the individual author(s) and contributor(s) and not of MDPI and/or the editor(s). MDPI and/or the editor(s) disclaim responsibility for any injury to people or property resulting from any ideas, methods, instructions or products referred to in the content.

