Article

Influence of Piston Mass and Working Pressure on the Impact Performance of a Hydraulic Rock Drill Using the Stress Wave Method

1
College of Mechanical Engineering, Guangdong Ocean University, Zhanjiang 524088, China
2
Guangdong Provincial Key Laboratory of Intelligent Equipment for South China Sea Marine Ranching, Guangdong Ocean University, Zhanjiang 524088, China
3
Guangdong Provincial Marine Equipment and Manufacturing Engineering Technology Research Center, Zhanjiang 524088, China
*
Author to whom correspondence should be addressed.
Machines 2023, 11(11), 987; https://doi.org/10.3390/machines11110987
Submission received: 3 September 2023 / Revised: 11 October 2023 / Accepted: 22 October 2023 / Published: 25 October 2023

Abstract

:
To optimize and improve the impact performance of a hydraulic rock drill, it is helpful to test the stress waves of the drill and analyze the impact energy, impact frequency, and energy utilization rate. For this study, a stress wave test bench was designed and built, according to international standards, in order to study the impact process of a hydraulic rock drill under the working pressures of 18 MPa and 23 MPa. The impact energy, impact frequency, and energy utilization rate of two different hydraulic rock drill pistons in low, middle, and high gear were analyzed using a control variable method. The results demonstrate that the impact stress waves of the rock drill periodically occur in the drill rod, and then decay exponentially until they become close to zero. Moreover, the amplitude of the incident stress wave determines the rock-breaking ability of the drill. The impact energy of the short piston is greater than that of the long piston, with a maximum average value of 346.1 J; the impact frequency of the long piston is higher than that of the short piston, with a maximum average value of 62 Hz; and the energy utilization rate of the short piston is higher than that of the long piston, with a maximum average value of 56.92%, which is close to the theoretical ideal efficiency. Therefore, it can be concluded that the impact performance of a hydraulic rock drill can be effectively tested using the proposed horizontal bench, and that piston characteristics and the working pressure are the main factors affecting impact performance. Accordingly, when developing a hydraulic rock drill, it is advisable to select a shorter piston and a higher working pressure, thus allowing the drill to provide good impact performance.

1. Introduction

The hydraulic rock drill is the external working mechanism of a rock drill jumbo and is the most important component for rock drilling [1]. It is widely used in mining, tunnel excavation, urban construction, and other engineering operations [2]. A hydraulic rock drill uses oil as its working medium, converting the pressure energy of the oil into the impact energy of the piston, and then transmits this energy through the drill rod into the rock in the form of a stress wave [3]. Previous research has generally focused on improving the impact performance and energy utilization of hydraulic rock drills.
Through experimentation, Jaho Seo et al. [4] established a hydraulic rock drill simulated calculation model. They analyzed the effect of working pressure on the impact performance of the rock drill, and concluded that the pressure was the main factor affecting the impact frequency and impact energy, which verified the reliability of the analysis model. Giuffrida et al. [5] carried out simulated calculations on the working process of a hydraulic rock drill and found that the impact frequency of the rock drill increased with an increase in working pressure, while the impact efficiency was affected by the comprehensive effects of pressure, flow, and so on. Chang-heon Song et al. [6,7] used the Taguchi method to determine the main design parameters affecting the impact performance of rock drills. They concluded that the main factors affecting the impact force were the supply pressure in the impact system and the diameter of the impact piston rod. Hu et al. [8] established a dynamic simulation model of a hydraulic rock drill and tested two hydraulic rock drills: YYG138 and YYG150. The simulated results were consistent with their test results. Yang et al. [9] established a dynamic simulation model of a hydraulic impact system; analyzed the dynamic characteristics of the impact mechanism; obtained the piston chamber pressure, flow characteristic curve, and its impact on the impact performance; and optimized the working parameters of the impact system on the basis of an orthogonal test to improve the system’s efficiency. Ji Hong et al. [10,11] established a dynamic model for the impact system of a hydraulic rock drill. Using state-space description theory and a linear system method, they deduced the existing range of piston vibrations in one impact period and analyzed the influence of the design parameters on impact performance. Laforgia et al. [12] established a detailed parametric simulation model to simulate the physical phenomena occurring during rock drill operation. The simulated results for pressure and frequency were consistent with the test. It was concluded that, when the actual input flow was used to replace its average value, the results of the simulation model did not change.
Research on the modeling and simulation of hydraulic rock drills has generally focused on the interactions between mechanisms of the hydraulic rock drill, the working process of the hydraulic impact system, and the influence of the component’s design parameters on piston motion; however, detailed analyses of stress wave transmission during piston impact are not typically conducted.
Dutta et al. [13] established a basic equation describing the generation, transmission, and reflection of stress waves and compiled a calculation program. Using the finite difference method and the transmission–reflection relationship of stress waves, they calculated the stress wave generated by the impact hammer and drill rod. Wu [14] established a stress wave propagation and impact energy transmission analysis model for a hydraulic rock drill that accounted for the local deformation of the impact end of the piston rod joint. The results indicated that, when the local deformation was within the normal range, it had little impact on the energy transmission efficiency of the hydraulic rock drill. Nygrena et al. [15,16] studied the energy transmission of the incident wave through the elastic joint of a uniform rod, which maximized the energy transmission efficiency of the input and output rods under given, continuous incident wave conditions. They obtained the optimal junction point for different types of incident waves in order to determine the impedance characteristics and energy transmission efficiency of the optimal joint. Lundberg et al. [17] established the force–drilling relationship of the non-linear rock breaking process, using a three-dimensional elastic–plastic finite element model to simulate the impact hammer and rock. Under good drilling conditions, the rock’s elastic response had a significant impact on the drilling efficiency and determined the pattern of drilling efficiency change. Chiang et al. [18] established a non-linear elastic rock–point interaction model for a down-the-hole drill. They corrected the calculation model using the error between the variable parameters obtained using a quasi-static tunneling test method and model analysis. Analyzing the stress–strain model, Kahraman et al. [19,20] found that the uniaxial compressive strength of rock properties, the Brazilian tensile strength, the point load strength, and the Schmidt value were the main parameters affecting the impact penetration rate. Assuming that driving speed depends on many factors (e.g., rock hardness, in-situ stress, and so on), Zhang et al. [21] analyzed the influence of impact force and torque on rock-drilling performance accounting for rocks with different properties. They proposed a drillability index evaluation model and rock classification rules suitable for the working parameters of the rock drill. Arffman et al. [22] studied the efficiency of a low-pressure impactor using a numerical simulation method. They investigated the effect of turbulence velocity fluctuations on impactor performance by comparing the ratios between the simulated and experimental impactor efficiencies. Joo Young et al. [23,24] studied the hydraulic circuit and impact processes of a hydraulic rock drill, as well as the dynamic effect of rock hardness on impact performance. They found that the energy utilization rate of the rock drill decreased with an increase in hardness.
Studies on the working processes of hydraulic rock drills usually consider the rock drill as a whole power output unit, analyzing the stress wave propagation, energy transmission, and rock-breaking effect during rock drilling. Such research has not considered the effects of the characteristics of the piston performing the work, nor has it compared the applicability of multiple pistons with respect to one model. Research on the impact performance of hydraulic rock drills remains limited, as well as research on improving the energy utilization of rock drills.
For this study, a test method for the impact machines and tools specified in international standards [25,26] was used to determine a suitable piston for drilling, as well as to improve the impact performance of the hydraulic rock drill. A stress wave test bench was designed and built in order to test and analyze the transmission characteristics of the stress spectrum during the impact process of the hydraulic rock drill. Using the control variable method, the impact energy, impact frequency, and energy utilization rate of rock drills operating in three gears (i.e., low, middle, and high) were analyzed. This was achieved under the condition that the body size of the hydraulic rock drill had already been determined; that is, the stroke of the three gears was fixed, and two pistons of different sizes under working pressures of 18 MPa and 23 MPa were used.

2. Rock-Drilling Process

A hydraulic rock drill is usually composed of an impact system, a shank adapter rebound absorption system, a rotary system, and a head. When the rock drill is installed on the trolley in preparation for rock drilling, it also needs to be equipped with an auxiliary water supply, dust prevention, propulsion systems, and so on [2]. The operational process of the hydraulic rock drill comprises four functions: propulsion, impact, rotation, and flushing (see Figure 1).
During the impact drilling process of a hydraulic rock drill, the hydraulic cylinder exerts a continuous pushing force on the rock drill: the drill rod bit is always in contact with the rock wall, ready to transmit the incident energy of the drill rod to the rock at any time to seamlessly drill the next blast hole. The impact system is the core component of the hydraulic rock drill. When the hydraulic pump supplies pressured oil to the rock drill, the pressure energy of the liquid is converted into the impact energy of the impact piston. The impact energy is then transmitted to the rock through the drill rod in the form of a stress wave, causing the rock to break. In the slewing function, the hydraulic motor outputs torque through the transmission gear to cause the drill bit to rotate to a new position after each impact, peeling off the cracked rock surface while waiting for the next impact. During drilling, the pressured water from the auxiliary water pump reaches the drill bit through the cleaning head and is sprayed out, thereby washing the rock debris out of the drill hole; washing is an essential function to improve drilling efficiency.
Hydraulic rock drills are often used in harsh construction environments, such as in mining and tunnelling operations. For this reason, testing and analysis of the impact process, impact energy, and impact frequency cannot be completed in an on-site manner.

3. Construction of Experimental Platform

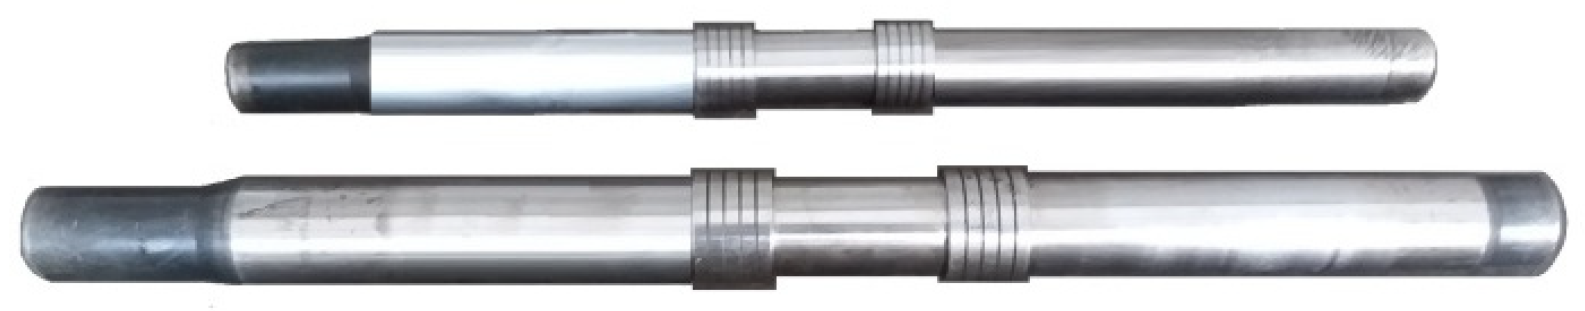
3.1. Introduction to the Test Bench

Due to the harsh working environment in which the hydraulic rock drill operates, the piston is enclosed within the body. Therefore, to measure the displacement and speed of the piston, some parts must be disassembled and may be damaged. For this reason, measurements cannot take place in real-time under actual working conditions, and performance testing can only be carried out under laboratory conditions. According to the provisions of international standards ISO/TS 17104-2006 and ISO2787-1984 [25,26], the impact performance of a rock drill should be tested using the stress wave method, which is a test method used for impact machinery and other products. The so-called ‘stress wave method’ refers to the method of directly testing the stress in the measuring rod to determine the impact energy. The advantages of this method include speed, accuracy, and a wide testing range.
An impact performance test system for a hydraulic rock drill was designed, according to the abovementioned international standards, by our research institute. The system is shown in Figure 2. The rock drill, drill rod, and energy absorption device to be tested were installed on the horizontal bench. Pressure sensors and flow meters were installed on the oil circuit of the hydraulic rock drill transmission system in order to measure the pressure and flow of the rock drill during operation. One end of the drill rod was connected to the shank adapter, while the other end was placed in the energy absorption device. Strain gauges were pasted on both sides of the drill rod, forming a measuring bridge to detect the stress wave signal in the drill rod; as such, the drill rod must be of a sufficient length to accurately capture the incident stress wave. The propulsion hydraulic cylinder was supplied by an independent hydraulic system. The propulsion cylinder exerts thrust on the mobile base, such that the shank adapter/drill rod is always in contact with the energy absorption device.
The energy absorption device featured a circular tube structure constructed from 45 steel, possessing an elastic modulus of 2.06 × 10¹¹ Pa, a density of 7850 kg/m3, and a Poisson’s ratio of μ = 0.3. The tail of the energy-absorbing circular tube was equipped with multiple layers of rubber pads, employing IIR rubber with an elastic modulus of 7.8 × 10⁶ Pa, a density of 920 kg/m3, and a Poisson’s ratio of μ = 0.47. One end of the drill rod was affixed to the rock drill, while the other end was inserted into the energy absorption device and linked to a series of disc-shaped friction plates. These friction plates were set at a specific inclination angle, with the spaces between them filled by an asphalt mixture characterized by an elastic modulus ranging from 1.2 to 1.4 × 10⁹ Pa, a density of 1250 kg/m3, and a Poisson’s ratio of μ = 0.35. The structural configuration is shown in Figure 3.
For the experiment, we adopted a hydraulic rock drill with a working pressure of 18–25 MPa and working flow of 60–120 L/min developed by the author’s team, as shown in Figure 4. The gear regulator is a cylindrical and rotatable component found on a hydraulic rock drill, featuring three grooves of varying lengths. As shown in Figure 5, there were four oil ports located below the gear regulator. The oil inlet, situated on the right side, connected to the hydraulic pump, while the remaining three outlets were linked to the piston chamber of the rock drill. The rotary gear regulator can open different oil passages, and the positioning of the oil port dictates the stroke of the rock drill piston. Consequently, the corresponding piston strokes were categorized into three gears: high (52 mm), medium (56 mm), and low (60 mm).
Once the size of the hydraulic rock drill body had been determined—that is, once the low, middle, and high gear strokes were fixed—two pistons of different sizes were designed for this model. As shown in Figure 6, the diameter, material, and production process of the two pistons were the same. Their stress spectrum, impact energy, impact frequency, and energy utilization ratio were tested and analyzed, and the change in impact performance of the hydraulic rock drills when the piston mass and piston driving conditions were changed was studied.

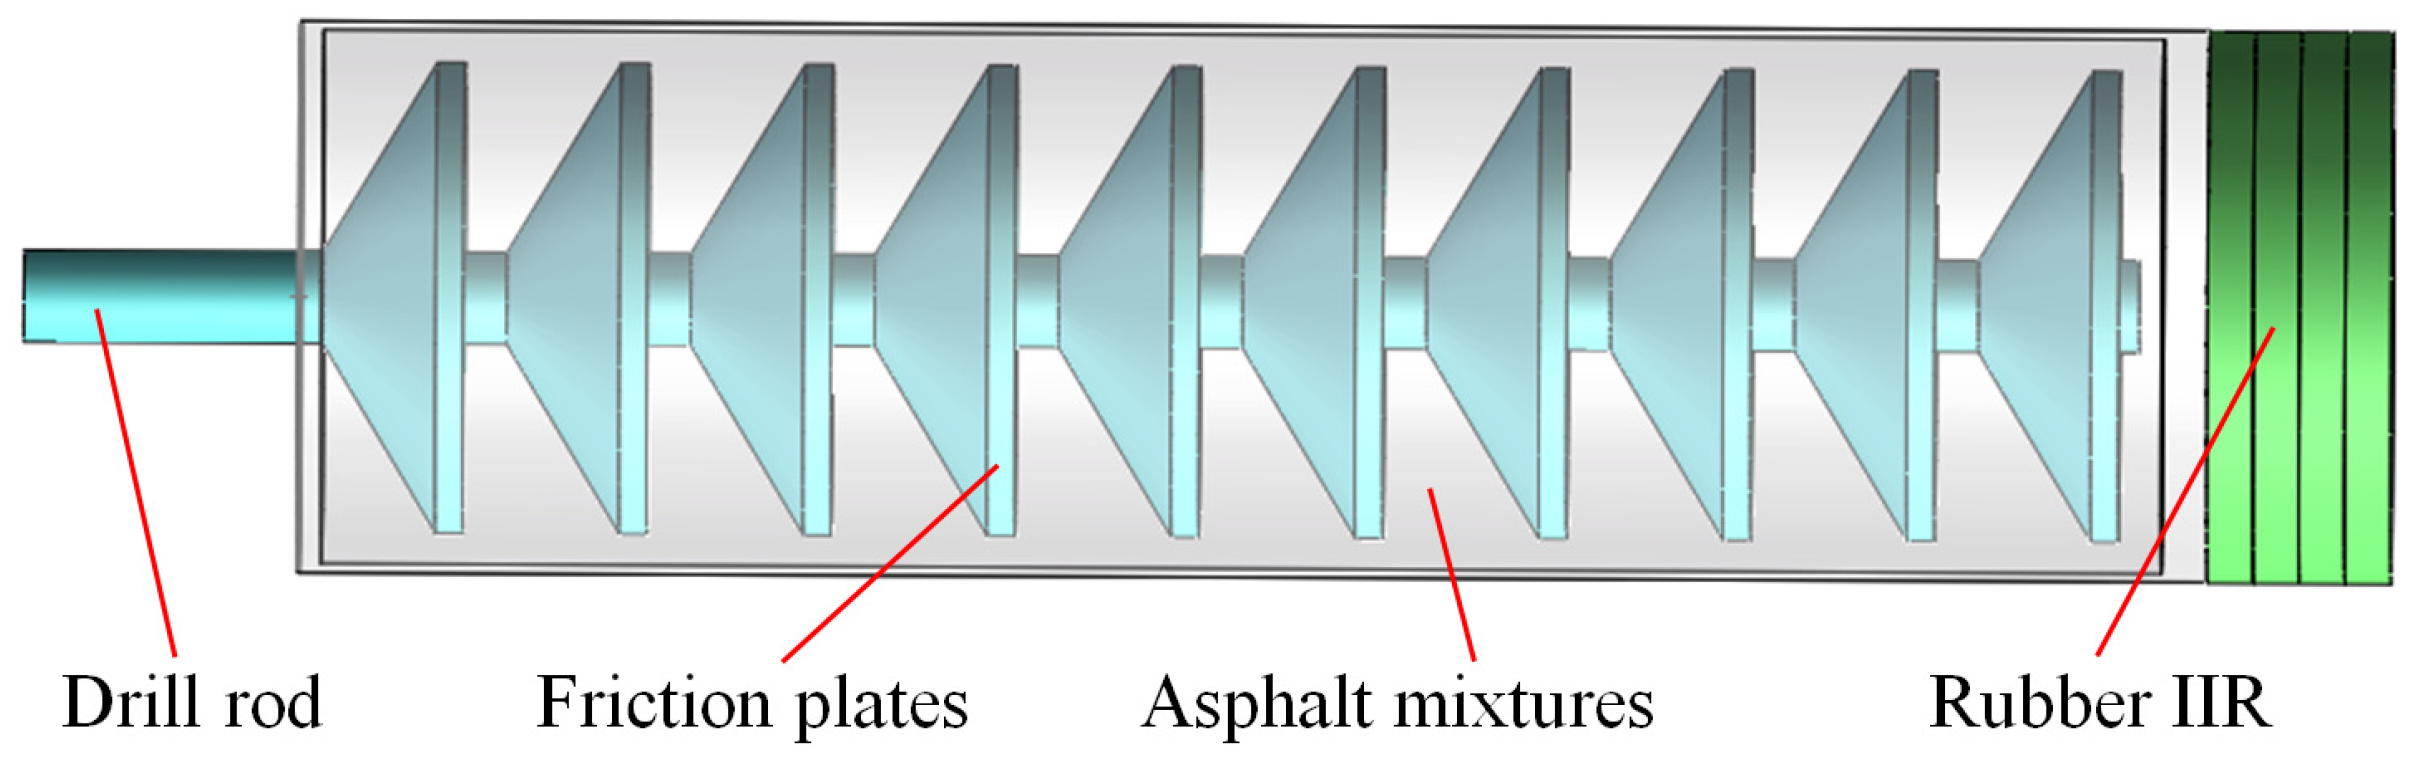
3.2. Impact Energy Transfer Process

The performance of drilling operations is influenced not only by the inherent characteristics of the rock drill but also by various factors, such as the properties of the rock material [27], the diameter of the drilling hole, the flushing of rock debris, the material properties of the drill, and structural parameters [21,28]. In this study, the drill rod and drill bit are considered to be an integrated system which is fully engaged in rock chiseling. The main focus is on the impact of the piston on the performance of the rock drill. Additionally, an energy absorption device was devised to investigate the impact performance of the rock drill. When the rock drill piston impacts the drill rod, the mass of the piston can be expressed as:
M p = ρ A h L = E c 2 A R R L = m R c L R
where ρ is the piston density, Ah is the piston cross-section, L is the piston length, E is the elastic modulus, c is the wave velocity, R is the fluctuation inertia ratio of drill rod to piston, AR is the drill rod cross-section, and mR is the drill rod fluctuation inertia.
With the cross-sectional area and wave inertia of both the piston and the drill rod being equal, the stress wave exhibits an infinitely proportional decreasing order with a wavelength of 2L/c [29]. Consequently, the incident energy of the drill rod is:
E i = A R c E 0 2 L / c σ R 2 d t = A R c E 1 4 E 2 c 2 V P 2 2 L c = m R 1 4 V P 2 2 M P R m R = 1 2 M P V P 2
This suggests that the incident energy equals the piston impact energy, resulting in the full energy being incident upon the drill rod.
Once the stress wave traverses through the energy absorption device, a significant portion of the energy is converted into frictional losses, with a smaller portion being reflected as energy. In accordance with international standards, an energy absorption exceeding 90% signifies the rationality and feasibility of the energy absorption device [25,26]. The combination of friction plates and the asphalt mixture within the energy absorption device creates a series of lower friction coefficient points (f1, f2fn), which collectively fulfills the energy absorption requirements.
The energy absorption device takes the form of a multi-point series combination based on the principles of impact dynamics [30]. To further ascertain the optimal distribution of fn across multiple friction points, we assume the transmission energy coefficient T E n = K ( const ) , then f = 1 K 2 n , R E n = 1 n ( 1 K ) 2 . As the number of points increases, it becomes evident that the total reflected energy coefficient (REn) rapidly diminishes. This phenomenon elucidates why the energy absorption device adopts an elongated tube structure, featuring multiple internal friction points arranged in series.
The conservation of energy can be expressed as, T E + R E + F E = 1 , where TE is the transmission energy coefficient, RE is the reflection energy coefficient, and FE is the friction energy coefficient. When the values are set to K = 0.01, n = 10, f10 = 0.205, and REn = 0.081, the total reflected energy falls below 10% of the total energy, thereby complying with international standards [26]. Consequently, the energy absorption device is suitable for assessing the impact performance of rock drills. It is important to note that the total energy mentioned here refers to the incident energy, representing the impact energy imparted by the piston.

3.3. Experimental Calibration

As the signal data in a test system can be affected by many factors, in order to ensure the accuracy of the test results it was first necessary to calibrate the equipment. The calibration work was carried out on a vertical test bench; in particular, the free-falling weight calibration method specified in the international standard [25] was used to calibrate the impact stress and impact energy of the test system, as shown in Figure 7. In the calibration system, the calibration tube was a seamless steel pipe which guided the falling of the drop hammer, where the areas of the end face of the drop hammer and the end face of the measuring rod were equal. A hammer-hanging mechanism was set on the calibration pipe rack, the drop hammer was lifted to a height of 2 m, and the equipment was then calibrated.
At the start of calibration, the drop hammer was released, causing the drop hammer to fall freely along the wall of the calibration pipe and hit the drill rod, thus enabling calculation of the maximum stress produced by the measuring rod, σmax:
σ max = φ E C V p = φ E C 2 g h
where E is the elastic modulus of the drill rod, C is the wave velocity, g is the acceleration due to gravity, h is the height of the falling hammer, and φ is the stress coefficient.
Indeed, the stress wave signal is of an analog nature, whereby analog signals exhibit continuous changes in both time and amplitude; whereas digital signals manifest as discrete entities in both time and amplitude. To convert analog signals into digital ones, the process of amplitude quantization is indispensable. Quantization is an integral component of the analog-to-digital (A/D) conversion process.
From the quantized value nmax of the wave peak point in the stress sampling, the stress calibration coefficient can be obtained as follows:
B s = σ max n max
According to the calibration coefficient, the maximum stress of the drill rod is σmax = Bs·nmax.
The impact energy of the drop hammer can be determined by integrating the quantized value of each sampling point of the stress wave, as follows:
E p = A C E σ 2 d t = A C E B s 2 n 2 Δ t = C s S
where A is the area of the drill-rod end face, n is the quantized value of each sampling point in the stress wave, C S = A C E B s 2 is the calibration coefficient of the impact energy, and S = n 2 Δ t is the integral of the square of the quantized value in the stress wave.
Simultaneously, the same calibration method was used to calibrate the energy. From m g h = A C E B E 2 S , the stress calibration coefficient is
B E = m g h × E A × C × S
The calibration coefficient of energy can be obtained, by further derivation, as
C E = m g h S
Thus, the impact energy of the drop hammer can be determined as
E P = C E S
Under the same conditions, the results obtained by the two calibration methods detailed above were consistent. The stress wave curve obtained through calibration is shown in Figure 8. We determined the characteristic indices of the instrument and the measuring system, and eliminated system error as much as possible, thereby improving the accuracy of the measurement. The calibrated energy absorption device and measuring rod were lifted out of the calibration bench and installed on the horizontal bench. The impact performance of the hydraulic rock drill was then tested, and the stress, impact energy, and impact frequency of the drill rod were measured.

4. Data Collection

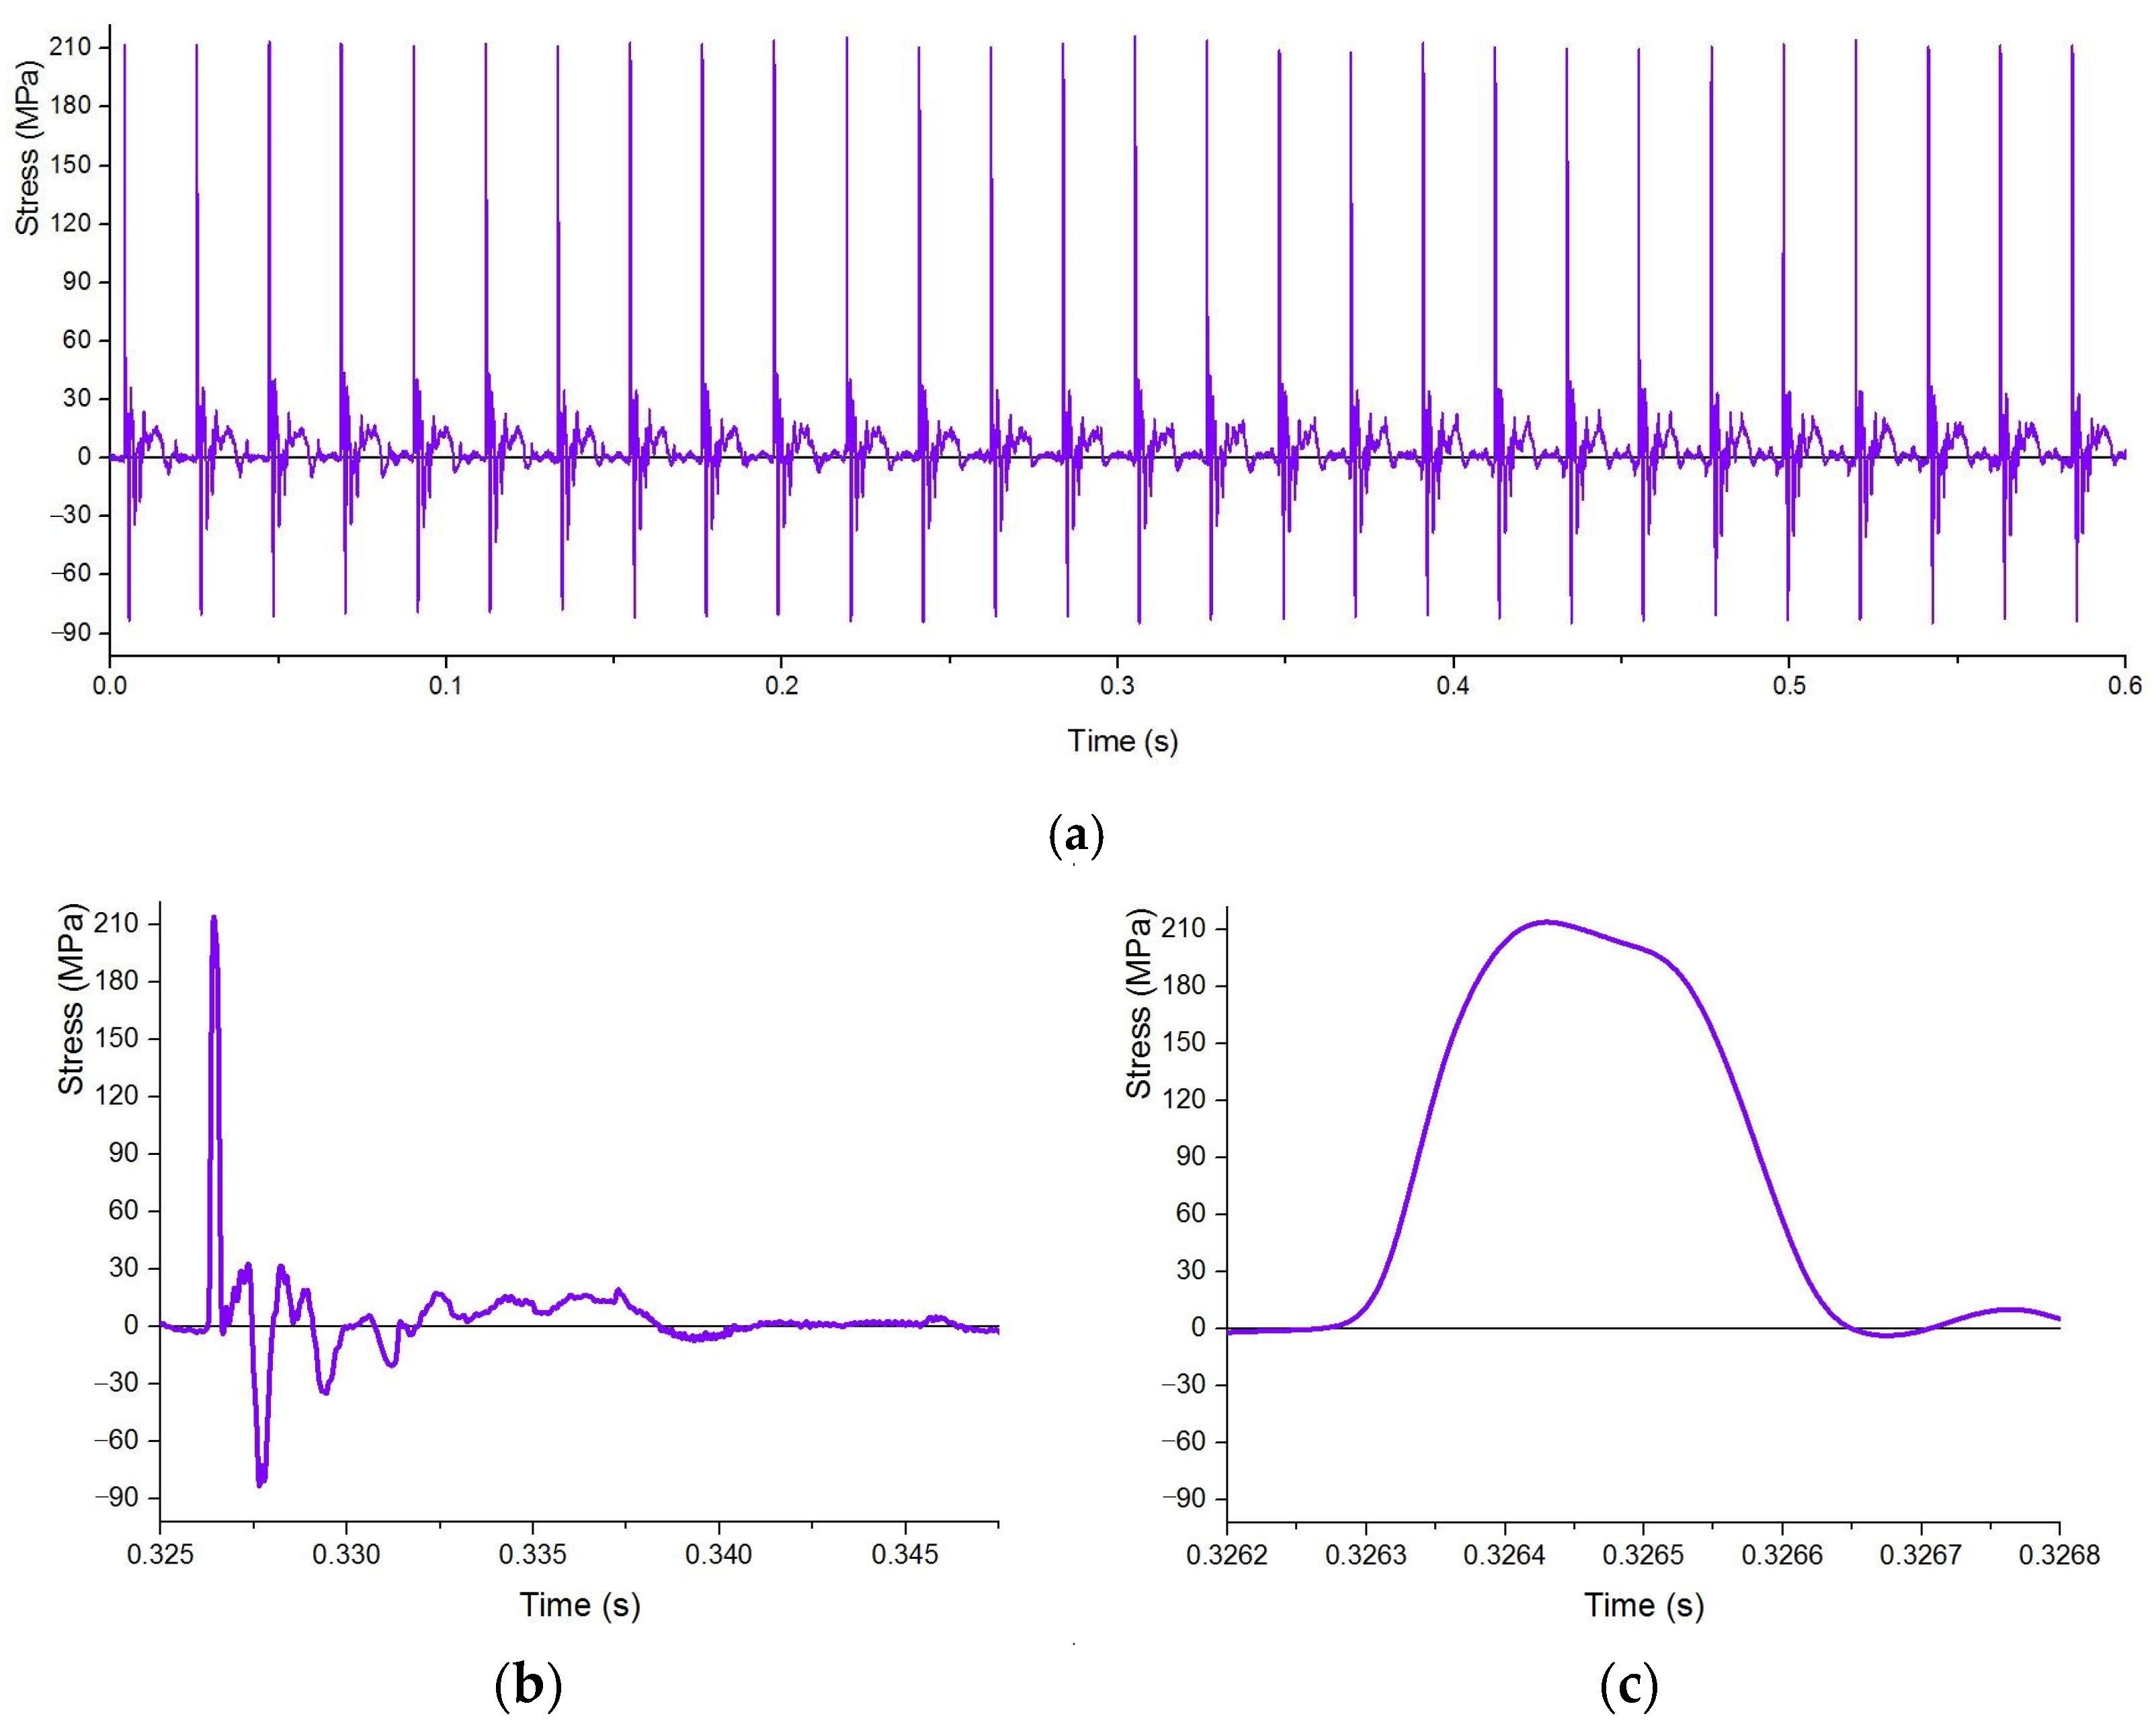
4.1. Stress Spectrum
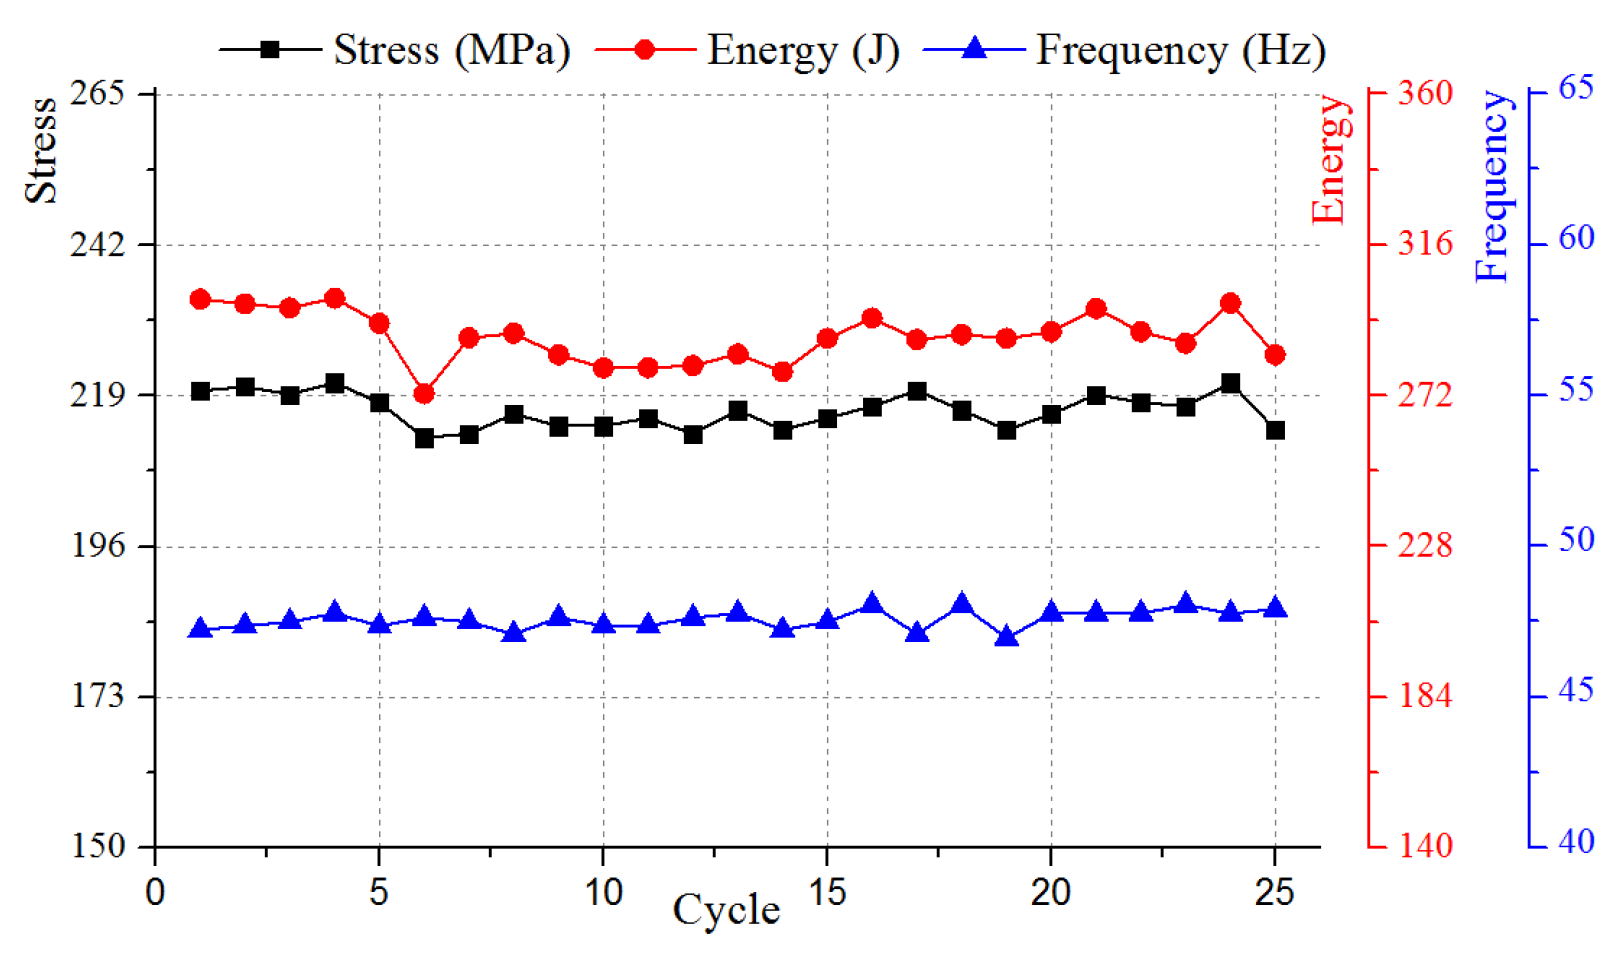
During the hydraulic rock drill test, one end of the drill rod abutted the head of the hydraulic rock drill, while the other end was placed in the tubular energy absorption device. As such, the drill rod could not accurately obtain the incident stress spectrum of the piston, as shown in Figure 9. When the high-speed rock drill piston impacts the shank adapter, the impact energy of the piston is transmitted to the drill rod by the shank adapter and the extension sleeve through the impact, in the form of a stress wave. The stress wave generated in the drill rod causes the resistance of the resistance strain gauge to change. The consequent electrical signal is then amplified and sent to the waveform recorder to record the impact waveform data.
In Figure 10, the propagation process for a group of stress waveforms in the drill rod is depicted. Figure 10a shows the stress spectrum in the drill rod when the long piston is in the low gear under 18 MPa. The average impact frequency of the piston was 47.6 Hz and the average incident maximum stress was 216.4 J. As shown in Figure 10b, when the stress wave of the drill rod was transmitted to the energy absorption device—that is, when it was actually chiseled into the rock—the stress immediately and suddenly decreased. Each string of stress waves presented one or two reflections in the high-amplitude region, forming a low-amplitude region that attenuates exponentially. The high-amplitude stress determines the rock-breaking ability. As shown in Figure 10c, the incident stress gradually increased to the point where the attenuation was close to zero. The front part of the waveform had a limited period in which it increased, resulting in a certain slope, while the fall of the waveform also took a certain amount of time. The most desirable effect of percussive drilling is that as much energy is concentrated in the high-amplitude area as possible to break the rock, while less energy is required in the low-amplitude area. Each time the piston impacts the drill rod, the first incident stress waveform in the stress spectrum is the most important stress element in the rock-drilling process, and the single-impact energy can be obtained by integrating over this period of time. Therefore, the magnitude and duration of the incident stress peak determine the magnitude of the single-impact energy.

4.2. Impact Results

The impact energy and impact frequency are key impact performance indicators of a hydraulic rock drill. For the hydraulic rock drill shown in Figure 4, two pistons with different characteristics (i.e., one long and the other short) were designed, as shown in Figure 6. The stress waves, impact energy, and impact frequencies of the hydraulic rock drill at three strokes—namely, high (52 mm), middle (56 mm), and low (60 mm) gear—were measured under the working pressures of 18 MPa and 23 MPa. Each sampled data point intercepted 25 consecutive impact cycles.
The output stress, impact energy, and impact frequency for the long piston under working pressures of 18 MPa and 23 MPa are shown in Figure 11, Figure 12, Figure 13, Figure 14, Figure 15 and Figure 16.
The output stress, impact energy, and impact frequencies of the short piston under the working pressures of 18 MPa and 23 MPa were also measured, as shown in Figure 17, Figure 18, Figure 19, Figure 20, Figure 21 and Figure 22.
Comparing the measurement results for the different rock drills in Figure 11, Figure 12, Figure 13, Figure 14, Figure 15 and Figure 16 and Figure 17, Figure 18, Figure 19, Figure 20, Figure 21 and Figure 22, for the same piston in the same gear, when the working pressure of the hydraulic rock drill increased, the impact energy and impact frequency of the piston also increased. In the same gear and at the same working pressure, the impact frequency decreased when the piston mass increased; however, the impact energy increased gradually and then decreased. In order to facilitate analysis of the main factors affecting the impact performance of the hydraulic rock drill, this performance was further analyzed according to the change in piston mass and driving conditions.

5. Impact Performance Analysis

5.1. Impact Performance When Piston Mass Changes

As shown in Figure 23, for the long piston at 23 MPa and in the low gear, the impact energy was maintained at a high level (with an average of 346.11 J and a maximum of 358.95 J). At 18 MPa and in the high gear, the impact energy was maintained at a low level (at an average value of 177.98 J and a minimum value of 143.22 J). In particular, the output impact energy fluctuated greatly. The impact frequency is shown in Figure 24. At 23 MPa and in the high gear, the impact frequency was maintained at a high state (with an average of 61.99 Hz and a maximum of 62.30 Hz). At 18 MPa and in the low gear, the impact frequency was maintained at a low state (at an average value of 47.56 Hz and a minimum value of 46.95 Hz).
For the short piston, as shown in Figure 25, at 23 MPa and in the low gear, the impact energy was maintained at a high level (with an average of 334.97 J and a maximum of 351.19 J). At 18 MPa and in the high gear, the impact energy remained at a low state (at an average value of 176.38 J and a minimum value of 160.01 J). Again, the output impact energy fluctuated greatly. The impact frequency is shown in Figure 26. At 23 MPa and in the high gear, the impact frequency was maintained at a high state (with an average of 58.86 Hz and a maximum of 59.85 Hz). At 18 MPa and in the low gear, the impact frequency was maintained at a low state (at an average value of 41.39 Hz and a minimum value of 40.35 Hz).
Therefore, in terms of impact frequency, that of the long piston was higher than that of the short piston when in the same gear. With an increase in piston mass, the reduction in piston stroke is greater than the reduction in acceleration [10,11], such that the time required for one piston cycle becomes smaller and the impact frequency increases. The impact energy of both pistons in the low gear was greater than that in the high gear; this is because the piston stroke in the low gear is long and the impact speed is high, which causes the impact energy to be high.
Comparing the two pistons of different mass, the impact energy of the long piston in the low gear was greater than that of the short piston in the low gear. This is due to the higher mass of the long piston, as piston mass was the main influencing factor. However, the impact energy of the short piston was greater than that of the long piston when in the high gear, as the piston speed was the main influencing factor in this case. Once the design parameters of the rock drill were fixed, the driving condition of the piston—namely, the working pressure—determined the impact speed.

5.2. Impact Performance When Working Pressure Changes

Figure 27 shows the impact energy in the three gears for both the long and short pistons when the working pressure was 18 MPa. When the long piston was in the low gear, the impact energy always remained high (with an average value of 289.14 J and a maximum value of 300.13 J). When the short piston was in the high gear, the impact energy remained low (at an average value of 176.38 J), while the minimum value occurred when the long piston was in the high gear (with a minimum value of 143.22 J). The output impact energy fluctuated greatly. The impact frequency is shown in Figure 28: when the long piston was in the high gear, the impact frequency was maintained at a high state (with an average of 56.55 Hz and a maximum of 57.09 Hz). When the short piston was in the low gear, the impact frequency was maintained at a low state (at an average value of 41.39 Hz and a minimum value of 40.35 Hz).
Figure 29 shows the impact energy in the three gears, for both the long and short pistons, when the working pressure was 23 MPa. When the long piston was in the low gear, the impact energy always remained high (with an average of 346.11 J and a maximum value of 358.95 J). When the long piston was in the high gear, the impact energy remained at a low state (at an average value of 209.94 J and a minimum value of 196.83 J). Overall, the output impact energy presented a certain fluctuation. The impact frequency is shown in Figure 30. When the long piston was in the high gear, the impact frequency was maintained at a high state (with an average of 61.99 Hz and a maximum of 62.3 Hz). When the short piston was in the low gear, the impact frequency was maintained at a low state (at an average value of 48.21 Hz and a minimum value of 47.91 Hz).
Therefore, considering impact frequency and impact energy, when both pistons work in any gear, the impact frequency and impact energy at a working pressure of 23 MPa were greater than those at 18 MPa. As such, increasing the working pressure can improve the impact frequency and impact energy of a rock drill.
Comparing the working pressures of 18 MPa and 23 MPa, when the working pressure was 18 MPa, the impact energy of the long piston in the low and middle gears was greater than that of the short piston. In this case, the piston mass was the main factor affecting the impact energy. When the working pressure was 23 MPa, the impact energy of the short piston was greater than that of the long piston. In this case, the main factor affecting the impact energy was the working pressure of the driving piston. Therefore, when the working pressure of the liquid medium in the hydraulic rock drill is adjustable, it is advisable to select a piston with a smaller mass and a higher working pressure. The hydraulic rock drill can then achieve a high impact energy and frequency.

5.3. Energy Utilization Rate

Analysis of the energy utilization rate is of great significance for the development of rock drills with good impact performance. The energy utilization rate of the hydraulic rock drill was obtained by combining the impact energy and impact frequency results for the drill. The impact power and energy utilization rates of the hydraulic rock drill are calculated as follows [31,32,33]:
P i = 10 3 · E · f
η ( % ) = 60 P i Δ p Q × 100
where Pi is the impact power, E is the impact energy, f is the impact frequency, Δ p is the difference between the inlet and outlet oil pressures, and Q is the inlet oil flow. Table 1 provides a comparison of the obtained results.
Table 1 displays the energy utilization rates for the long and short pistons for the considered hydraulic rock drill at different working pressures. Different travel gears were analyzed, and it can be seen that the energy utilization rates in the short piston tests were above 53%, with the maximum value being 56.92%. According to the comparative literature, the hydraulic rock drill designed by Joo Young [23,24], with high pressure (210 bar) and large flow (120 L/min) parameters, obtained a sufficient drilling efficiency and impact force. Nygrena [15,16] concluded that the ideal energy utilization efficiency is close to 60% under very good drilling conditions, but could fall to less than 40% under poor drilling conditions. Our model rock drill, therefore, provides good impact performance. Although the impact power of the long piston was greater than that of the short piston, the energy utilization rate of the short piston was higher than that of the long piston. Therefore, when developing a hydraulic rock drill, a smaller-sized piston should be selected for a higher working pressure. Our hydraulic rock drill obtained good results, in terms of impact energy, impact frequency, and energy utilization rate.

6. Conclusions

The stress wave test bench detailed in this paper can effectively test the impact process of a hydraulic rock drill. Our measurements showed that the stress wave is periodically incident in the drill rod and decays exponentially until it is close to zero; moreover, the amplitude of the incident stress wave determines the rock-breaking ability of the drill. In order to improve the impact performance of hydraulic rock drills, the impact energy, impact frequency, and energy utilization rates of two different pistons in the hydraulic rock drill at working pressures of 18 MPa and 23 MPa were analyzed using a control variable method. It was concluded that the piston characteristics and driving conditions are the main factors affecting the impact performance. In order to obtain a desirable impact performance, once the body size of the hydraulic rock drill has been determined and cannot be changed, it is advisable to develop a smaller-sized piston—taking into consideration the appropriate working pressure and gear for drilling—which will allow the final hydraulic rock drill to provide an optimal impact performance.

Author Contributions

Conceptualization, Z.Y.; methodology, G.Y.; investigation, J.L.; resources, Z.Y.; data curation, J.L.; writing—review and editing, Z.Y.; supervision, G.Y.; project administration, G.Y. All authors have read and agreed to the published version of the manuscript.

Funding

This research was funded by The Guangdong Marine Economic Development (six major marine industries) Special Project, grant number GDNRC [2021]42, Doctoral Research Start-up Project of Guangdong Ocean University, grant number 060302062103, and the Zhanjiang Key Laboratory of Modern Marine Fishery Equipment, grant number 2021A05023.

Data Availability Statement

Data sharing not applicable.

Conflicts of Interest

The authors declare no conflict of interest.

References

  1. Long, R.; Sun, S.; Lian, Z. Research on the hard-rock breaking mechanism of hydraulic drilling impact tunneling. Math. Probl. Eng. 2015, 16, 153648. [Google Scholar] [CrossRef]
  2. Ma, W.; Geng, X.; Jia, C.; Gao, L.; Liu, Y.; Tian, X. Percussion characteristic analysis for hydraulic rock drill with no constant-pressurized chamber through numerical simulation and experiment. Adv. Mech. Eng. 2019, 4. [Google Scholar] [CrossRef]
  3. Li, Y. Research on the matching of impact performance and collision coefficient of hydraulic rock drill. Shock Vib. 2021, 2021, 6651860. [Google Scholar] [CrossRef]
  4. Seo, J.; Noh, D.K.; Lee, G.H.; Jang, J.S. A percussion performance analysis for rock-drill drifter through simulation modeling and experimental validation. Int. J. Precis. Eng. Man. 2016, 17, 163–170. [Google Scholar] [CrossRef]
  5. Giuffrida, A.; Laforgia, D. Modelling and Simulation of a Hydraulic Breaker. Int. J. Fluid Power 2005, 6, 47–56. [Google Scholar] [CrossRef]
  6. Song, C.; Chung, J.; Kim, J.H.; Oh, J.Y. Design optimization of a drifter using the taguchi method for efficient percussion drilling. J. Mech. Sci. Technol. 2017, 31, 1797–1803. [Google Scholar] [CrossRef]
  7. Song, C.H.; Kwon, K.B.; Cho, M.G.; Oh, J.Y.; Shin, D.Y.; Cho, J.W. Development of lab-scale rock drill apparatus for testing performance of a drill bit. Int. J. Precis. Eng. Man. 2015, 16, 1405–1414. [Google Scholar] [CrossRef]
  8. Hu, Q.; Yang, C.; Zheng, H.; Chen, M. Dynamic simulation and test research of impact performance of hydraulic rock drill with no constant-pressurized chamber. Automat. Constr. 2014, 37, 211–216. [Google Scholar] [CrossRef]
  9. Yang, S.Y.; Ou, Y.B.; Guo, Y.; Wu, X.M. Analysis and optimization of the working parameters of the impact mechanism of hydraulic rock drill based on a numerical simulation. Int. J. Precis. Eng. Man. 2017, 18, 971–977. [Google Scholar] [CrossRef]
  10. Yang, Z.Y.; Ji, H.; Li, Y.G. Analysis on the main design parameters influencing the impact efficiency of dual-chamber-controlled hydraulic drifter. Int. J. Precis. Eng. Man. 2018, 19, 1781–1791. [Google Scholar] [CrossRef]
  11. Yang, Z.Y.; Ji, H.; Li, Y.G. Existence scope of only primary vibration within one impact period of a hydraulic drifter piston via point transformation. J. Adv. Mech. Des. Syst. 2018, 12, JAMDSM0123. [Google Scholar] [CrossRef]
  12. Ficarella, A.; Giuffrida, A.; Laforgia, D. Numerical investigations on the working cycle of a hydraulic breaker: Off-design performance and influence of design parameters. Int. J. Fluid Power 2006, 7, 41–50. [Google Scholar] [CrossRef]
  13. Dutta, P.K. The determination of stress wave forms produced by percussive drill pistons of various geometrical designs. Int. J. Rock Mech. Min. 1968, 5, 501–510. [Google Scholar] [CrossRef]
  14. Changming, W. An analytical study of percussive energy transfer in hydraulic rock drills. Min. Sci. Technol. 1991, 13, 57–68. [Google Scholar] [CrossRef]
  15. Nygren, T.; Andersson, L.E.; Lundberg, B. Optimization of elastic junctions with regard to transmission of wave energy. Wave Motion 2001, 240, 467–481. [Google Scholar] [CrossRef]
  16. Nygren, T.; Andersson, L.E.; Lundberg, B. Synthesis of elastic junctions with wave transmission properties of a given junction. Wave Motion 1999, 30, 143–158. [Google Scholar] [CrossRef]
  17. Lundberg, B.; Okrouhlik, M. Efficiency of a percussive rock drilling process with consideration of wave energy radiation into the rock. Int. J. Impact. Eng. 2006, 32, 1573–1583. [Google Scholar] [CrossRef]
  18. Chiang, L.E.; Elas, D.A. Modeling impact in down-the-hole rock drilling. Int. J. Rock Mech. Min. 2000, 37, 599–613. [Google Scholar] [CrossRef]
  19. Kahraman, S.A.İ.R.; Bilgin, N.; Feridunoglu, C. Dominant rock properties affecting the penetration rate of percussive drills. Int. J. Rock Mech. Min. 2003, 40, 711–723. [Google Scholar] [CrossRef]
  20. Li, X.; Rupert, G.; Summers, D.A.; Santi, P.; Liu, D. Analysis of impact hammer rebound to estimate rock drill ability. Rock Mech. Rock Eng. 2000, 33, 1–13. [Google Scholar] [CrossRef]
  21. Zhang, K.; Hou, R.; Zhang, G.; Zhang, G.; Zhang, H. Rock drillability assessment and lithology classification based on the operating parameters of a drifter: Case study in a coal mine in China. Rock Mech. Rock Eng. 2016, 49, 329–334. [Google Scholar] [CrossRef]
  22. Arffman, A.; Marjamäki, M.; Keskinen, J. Simulation of low pressure impactor collection efficiency curves. J. Aerosol Sci. 2011, 42, 329–340. [Google Scholar] [CrossRef]
  23. Oh, J.Y.; Lee, G.H.; Kang, H.S.; Song, C.S. Modeling and performance analysis of rock drill drifters for rock stiffness. Int. J. Precis. Eng. Man. 2012, 13, 2187–2193. [Google Scholar] [CrossRef]
  24. Oh, J.Y.; Song, C.H.; Kim, D.J.; Kim, J.G.; Park, J.Y.; Cho, J.W. Numerical investigation of performance of hydraulic percussion drifter. Int. J. Precis. Eng. Man. 2016, 17, 879–885. [Google Scholar] [CrossRef]
  25. DD ISO/TS 17104-2006; Rotary Tool for Threaded Fasteners-Hydraulic Impulse Tools-Performance Test Method. ISO: Geneva, Switzerland, 2006.
  26. DD ISO 2787-1984; Rotary and Percussive Pneumatic Tools-Performance Tests. ISO: Geneva, Switzerland, 1984.
  27. Babitsky, V. Dynamics should be sexy. In On the Waves of a Pulsating World, 1st ed.; Gruzenberg, A., Ed.; Springer: Cham, Switzerland, 2019; pp. 119–123. [Google Scholar]
  28. Sun, F.; Chen, L.; Li, Y.; Wang, Z.; Xiao, B.; Chen, Z. Fidelity performance of coring bits during drilling and cutting in deep extreme environments. Appl. Sci. 2023, 13, 8173. [Google Scholar] [CrossRef]
  29. Zhao, T.W. Wave theory analysis of impact drilling process. In Dynamics of Percussive Drilling; Qing, Q.Y., Ed.; Metallurgical Industry Press: Beijing, China, 1996; pp. 99–116. [Google Scholar]
  30. Zhao, T.W. Testing the impact performance of rock drill. In Dynamics of Percussive Drilling; Qing, Q.Y., Ed.; Metallurgical Industry Press: Beijing, China, 1996; pp. 203–213. [Google Scholar]
  31. Song, H.; Shi, H.; Li, G. Numerical simulation of the energy transfer efficiency and rock damage in axial-torsional coupled percussive drilling. J. Petrol. Sci. Eng. 2021, 196, 107675. [Google Scholar] [CrossRef]
  32. Song, H.; Shi, H.; Chen, Z.; Li, G.; Chen, H. Numerical study on impact energy transfer and rock damage mechanism in percussive drilling based on high temperature hard rocks. Geothermics 2021, 96, 102215. [Google Scholar] [CrossRef]
  33. Hashiba, K.; Fukui, K.; Liang, Y.Z.; Koizumi, M.; Matsuda, T. Force-penetration curves of a button bit generated during impact penetration into rock. Int. J. Impact Eng. 2015, 85, 45–56. [Google Scholar] [CrossRef]
Figure 1. Working process of a hydraulic rock drill.
Machines 11 00987 g001
Figure 2. Impact performance test system for the rock drill.
Machines 11 00987 g002
Figure 3. Energy absorption device.
Machines 11 00987 g003
Figure 4. Hydraulic rock drill.
Machines 11 00987 g004
Figure 5. Gear regulator.
Machines 11 00987 g005
Figure 6. Hydraulic rock drill long and short pistons.
Machines 11 00987 g006
Figure 7. Calibration of rock drill test system.
Machines 11 00987 g007
Figure 8. Calibrated stress wave curve.
Machines 11 00987 g008
Figure 9. Test bench for hydraulic rock drill.
Machines 11 00987 g009
Figure 10. Stress wave of drill rod under 18 MPa long piston, low gear. (a) Impact stress spectrum; (b) transmitted stress wave; and (c) incident stress wave.
Machines 11 00987 g010
Figure 11. Long piston, high gear, 18 MPa.
Machines 11 00987 g011
Figure 12. Long piston, high gear, 23 MPa.
Machines 11 00987 g012
Figure 13. Long piston, middle gear, 18 MPa.
Machines 11 00987 g013
Figure 14. Long piston, middle gear, 23 MPa.
Machines 11 00987 g014
Figure 15. Long piston, low gear, 18 MPa.
Machines 11 00987 g015
Figure 16. Long piston, low gear, 23 MPa.
Machines 11 00987 g016
Figure 17. Short piston, low gear, 18 MPa.
Machines 11 00987 g017
Figure 18. Short piston, low gear, 23 MPa.
Machines 11 00987 g018
Figure 19. Short piston, middle gear, 18 MPa.
Machines 11 00987 g019
Figure 20. Short piston, middle gear, 23 MPa.
Machines 11 00987 g020
Figure 21. Short piston, high gear, 18 MPa.
Machines 11 00987 g021
Figure 22. Short piston, high gear, 23 MPa.
Machines 11 00987 g022
Figure 23. Impact energy of long piston.
Machines 11 00987 g023
Figure 24. Impact frequency of long piston.
Machines 11 00987 g024
Figure 25. Impact energy of short piston.
Machines 11 00987 g025
Figure 26. Impact frequency of short piston.
Machines 11 00987 g026
Figure 27. Impact energy at 18 MPa.
Machines 11 00987 g027
Figure 28. Impact frequency at 18 MPa.
Machines 11 00987 g028
Figure 29. Impact energy at 23 MPa.
Machines 11 00987 g029
Figure 30. Impact frequency at 23 MPa.
Machines 11 00987 g030
Table 1. Comparison of results.
PistonGearPressure
(MPa)
Flow
(L/min)
Average Stress
(MPa)
Average Impact Energy
(J)
Average Frequency
(Hz)
Power
(Kw)
Efficiency
(%)
Long pistonlow1887.4216.7289.147.613.7651.62
2392.0239.1334.951.217.7250.25
middle1874.4198.5241.052.612.6853.82
2380.1216.4286.457.216.3853.35
high1866.2172.1178.056.69.9049.85
2370.8188.1209.962.013.0147.94
Short pistonlow1867.5218.8273.141.411.3155.85
2378.6243.9346.148.216.1553.60
middle1864.6199.7226.048.010.8555.99
2373.6229.4302.453.116.0656.92
high1855.7177.9176.453.49.4456.49
2361.6201.2223.458.913.1655.73
Disclaimer/Publisher’s Note: The statements, opinions and data contained in all publications are solely those of the individual author(s) and contributor(s) and not of MDPI and/or the editor(s). MDPI and/or the editor(s) disclaim responsibility for any injury to people or property resulting from any ideas, methods, instructions or products referred to in the content.

