Article

Optimization Design of Aspect Ratio and Solidity of a Heavy-Duty Gas Turbine Transonic Compressor Rotor

1
Advanced Gas Turbine Laboratory, Institute of Engineering Thermophysics, Chinese Academy of Sciences, Beijing 100190, China
2
Innovation Academy for Light-Duty Gas Turbine, Chinese Academy of Sciences, Beijing 100190, China
3
Key Laboratory of Advanced Energy and Power, Chinese Academy of Sciences, Beijing 100190, China
4
School of Engineering Science, University of Chinese Academy of Sciences, Beijing 100049, China
*
Author to whom correspondence should be addressed.
Machines 2023, 11(1), 82; https://doi.org/10.3390/machines11010082
Submission received: 8 December 2022 / Revised: 29 December 2022 / Accepted: 3 January 2023 / Published: 9 January 2023
(This article belongs to the Special Issue Aerodynamic Design and Optimization for Turbomachinery)

Abstract

:
To investigate the influence of blade aspect ratio and solidity on the performance of heavy-duty gas turbine transonic compressors, a multi-objective optimization design platform was built by adopting the blade parameterization method based on the superposition of thickness distribution on the suction surface, the Kriging surrogate model, and the NSGA-II optimization method. The spanwise distribution of solidity and number of blades were the optimization variables. The multi-objective optimization was carried out with isentropic efficiency and stall margin as the objective parameters for the inlet stage transonic rotor of an F-class heavy-duty gas turbine compressor. The results show that the isentropic efficiency and stall margin at design condition with a constant mass flow rate can be improved by 0.96% and 18.7%, respectively, and the total pressure ratio can also increase. The analysis shows that, for regions where the shock wave–boundary layer interaction is obvious, increasing the solidity can reduce the shock wave loss, the shock wave–boundary layer interaction loss, and the end wall loss, and reducing the aspect ratio can reduce the blade boundary layer loss. The spanwise distributions of solidity and aspect ratio determine the stall margin by affecting the radial matching of the load of each blade section. Tip solidity near the tip region needs to be determined according to the pressure field established by the bulk of the flow.

1. Introduction

A heavy-duty gas turbine has a single shaft, a constant speed, a high flow capacity, and a high efficiency. The performance of the inlet transonic stage of the axial compressor is the key factor that restricts the development of heavy-duty gas turbine compressors towards a high throughflow rate, a high efficiency, and a wide stall margin. Compared with the rear stage subsonic compressor, the inlet stage transonic compressor has a smaller hub-tip ratio and a higher inlet Mach number, which makes the complex three-dimensional flow phenomena, such as shock wave-boundary layer interactions, interactions between tip leakage flow and mainstream, and end wall and blade suction surface boundary layer development more rapid and obvious. Therefore, inlet stage transonic compressors have higher design requirements [1]. Not only the aerodynamic performance parameters but also the structural parameters such as weight, axial length, and number of parts of the compressor should be considered in the design process.
Solidity is an important parameter in the empirical correlation model of compressor loss and deviation angle; it has a considerable influence on the compressor blade load, flow turning angle, and stall margin [2]. The transonic blade is more sensitive to solidity. In recent years, the average solidity of transonic compressors has been greatly increased [3,4], which also reflects the demand for compressors to have a high efficiency, a wide stall margin, and a higher load. The increase in solidity means that the chord length increases or the number of blades increases. Increasing the number of blades has little effect on solidity, but it will inevitably lead to an increase in manufacturing and maintenance costs. By increasing the chord length, which results in a low aspect ratio design, it is possible to increase design solidity while also lowering the number of blades. In the early design period of the transonic compressor, a high aspect ratio was once the first choice for designers. In the development process of J93, Smith found that a high aspect ratio design brought serious stall margin problems, which made it difficult for the design to achieve the expected performance. After communicating with Rolls-Royce, Smith [5] realized that the low aspect ratio design plays a key role in the flow control near end wall area and stall margin improvement. Although the high aspect ratio design can reduce the percentage of tip clearance relative to the spanwise height, it will increase the tip clearance relative to the chord. Therefore, the low aspect ratio of the blade has been an important trend in axial flow compressor design in recent years [6,7]. Wennerstrom [8] was the first to describe the three-dimensional flow field structure, the shock wave loss, the shock wave unsteady effect, and other aerodynamic benefits generated by the low aspect ratio design at that time, as well as the structural benefits such as engine weight reduction and structural strength. Ward et al. [9] applied the low aspect ratio design to the inlet stage transonic compressor blades of the Siemens SGT-400 gas turbine. The number of blades was reduced successfully, the compressor flow rate and efficiency were improved, and the robustness of the blade structure was enhanced. To further improve the performance of modern advanced heavy-duty gas turbine compressors, the proper spanwise distributions of solidity and aspect ratio need to be investigated more deeply.
Therefore, the inlet stage transonic rotor of an F-class heavy-duty gas turbine compressor was taken as the research object in this paper. The spanwise distributions of solidity and aspect ratio were controlled by changing the number of rotor blades and the spanwise distribution of chord length. Under the premise that the design mass flow rate remains constant and the total pressure ratio at the design mass flow point does not decrease, the blade parameterization method based on superimposing thickness on the suction surface and the Kriging surrogate optimization method were used to conduct the multi-objective optimization design with the goal of improving the isentropic efficiency and stall margin at design condition. The influence of spanwise distributions of solidity and aspect ratio on the aerodynamic performance of a high flow capacity and a high load transonic axial compressor rotor was studied.

2. Optimization Methods

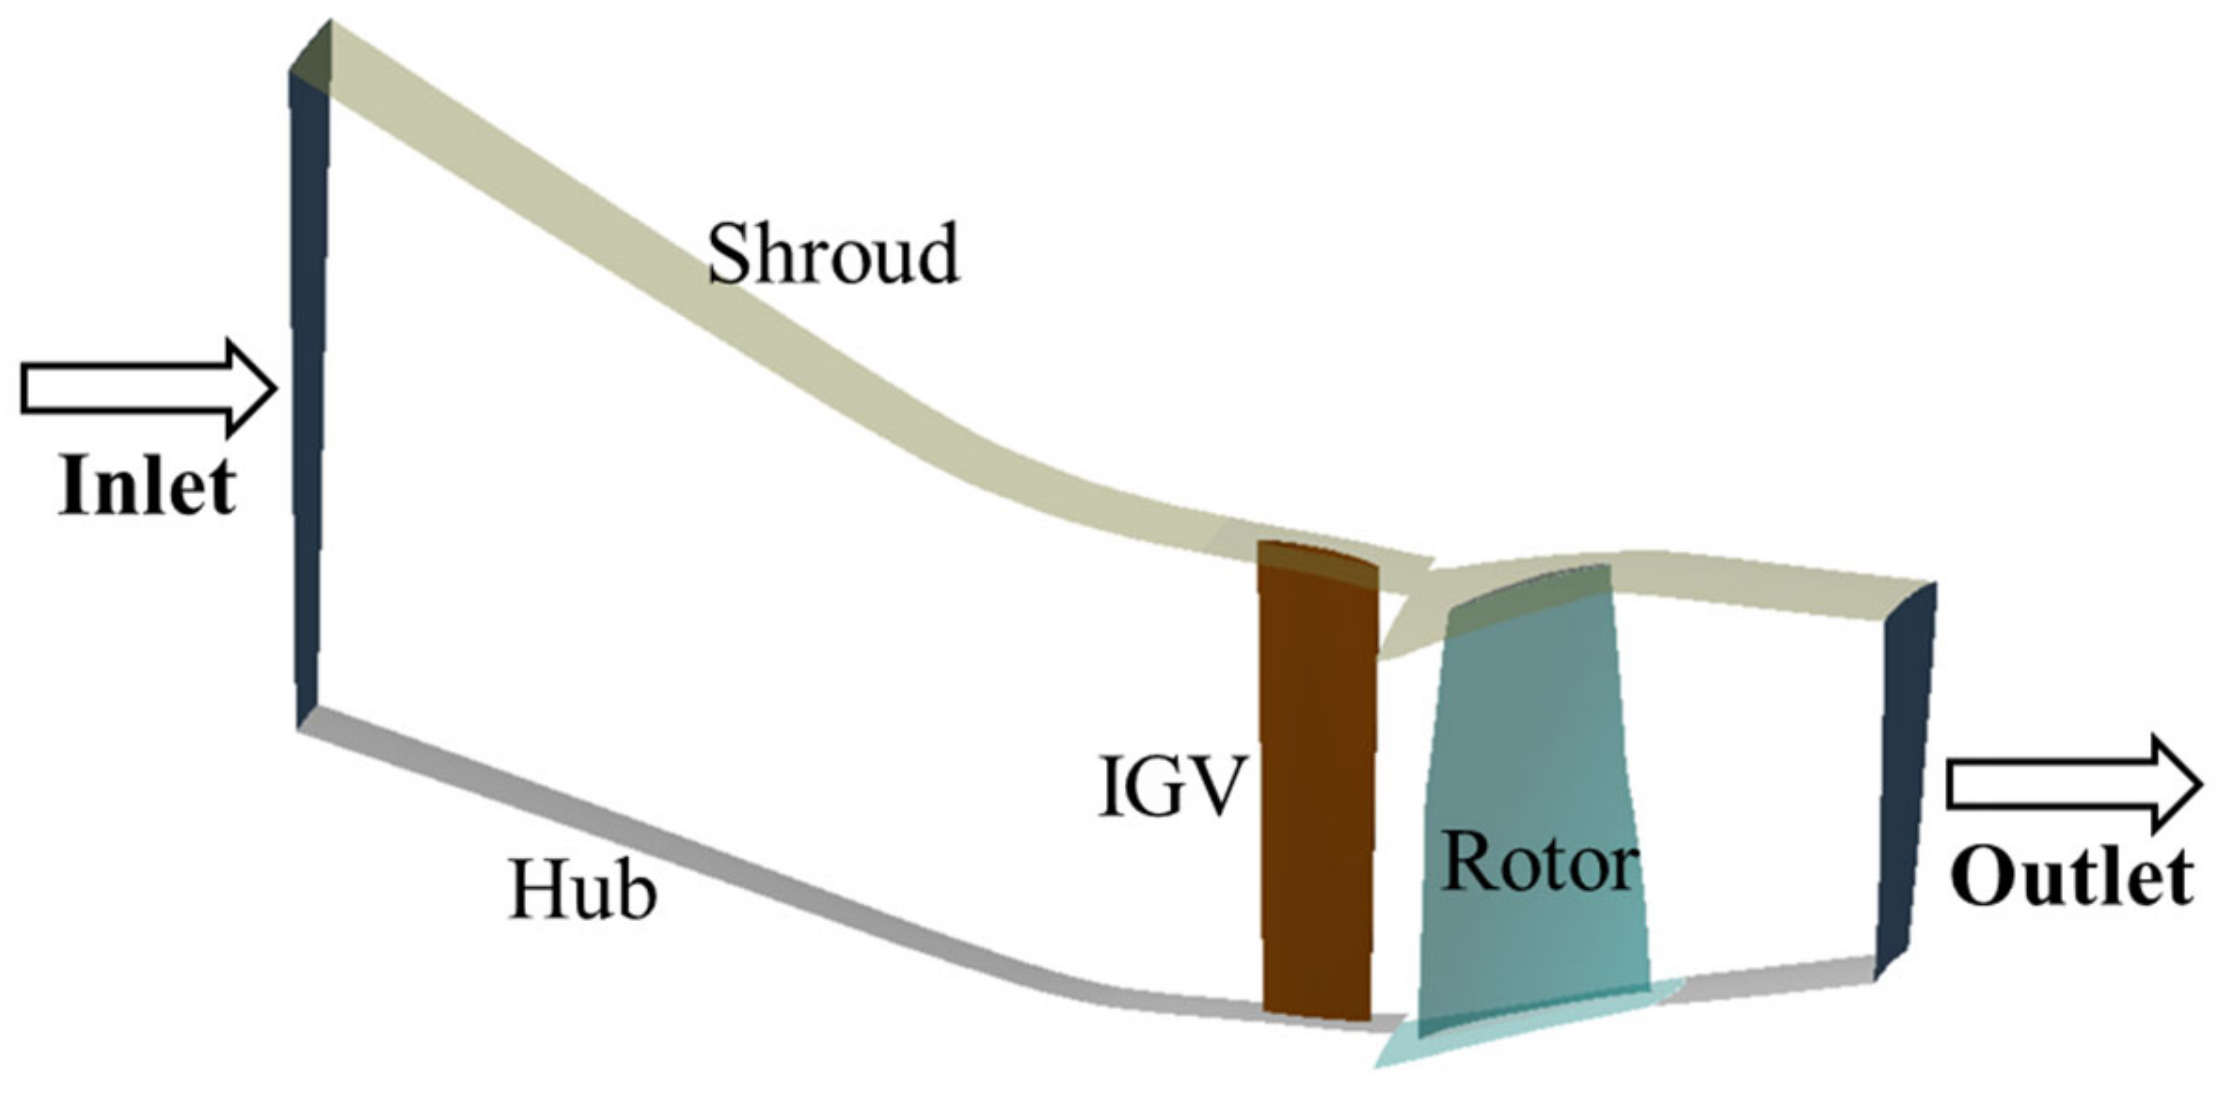
2.1. Research Object

In this work, the stacking method of the original transonic rotor of the F-class heavy-duty gas turbine compressor was linear stacking along the center of gravity. The design parameters of the inlet guide vane (IGV) and rotor blade are shown in Table 1. The isentropic efficiency of the rotor is 94.02%, the total pressure ratio is 1.46, and the comprehensive stall margin is 10.5% at a design mass flow of 630 kg/s. The isentropic efficiency of the CFD calculation of the original rotor is already high. Therefore, it is a challenging task to further improve the stall margin and isentropic efficiency of this transonic compressor rotor by optimization.

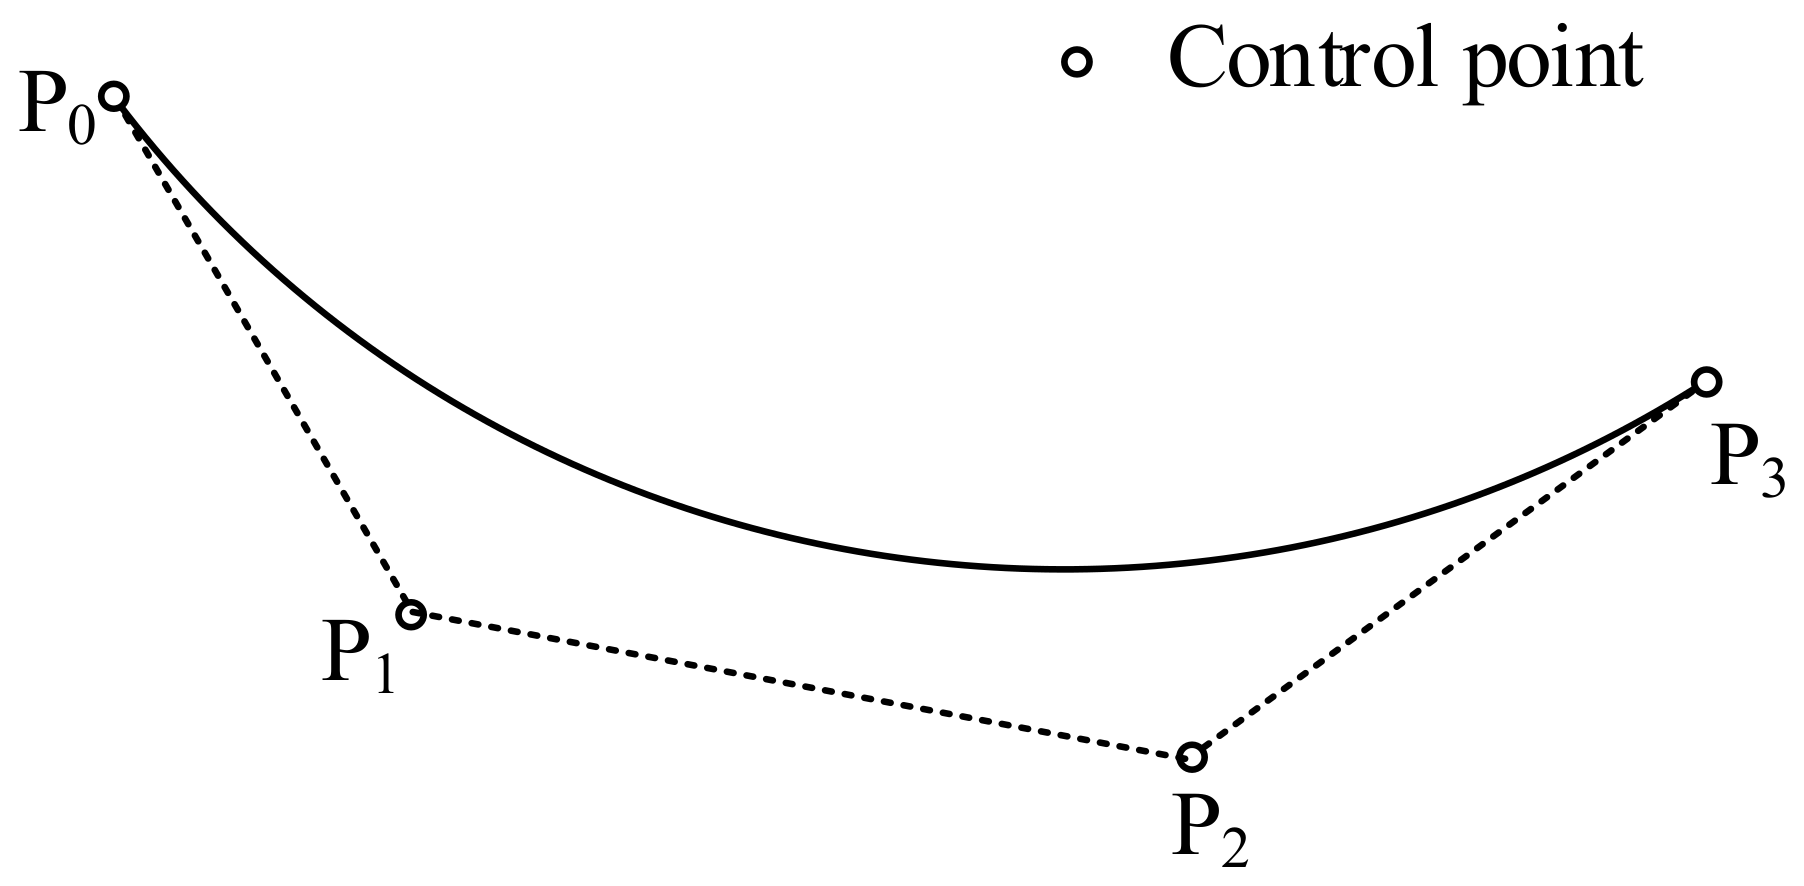
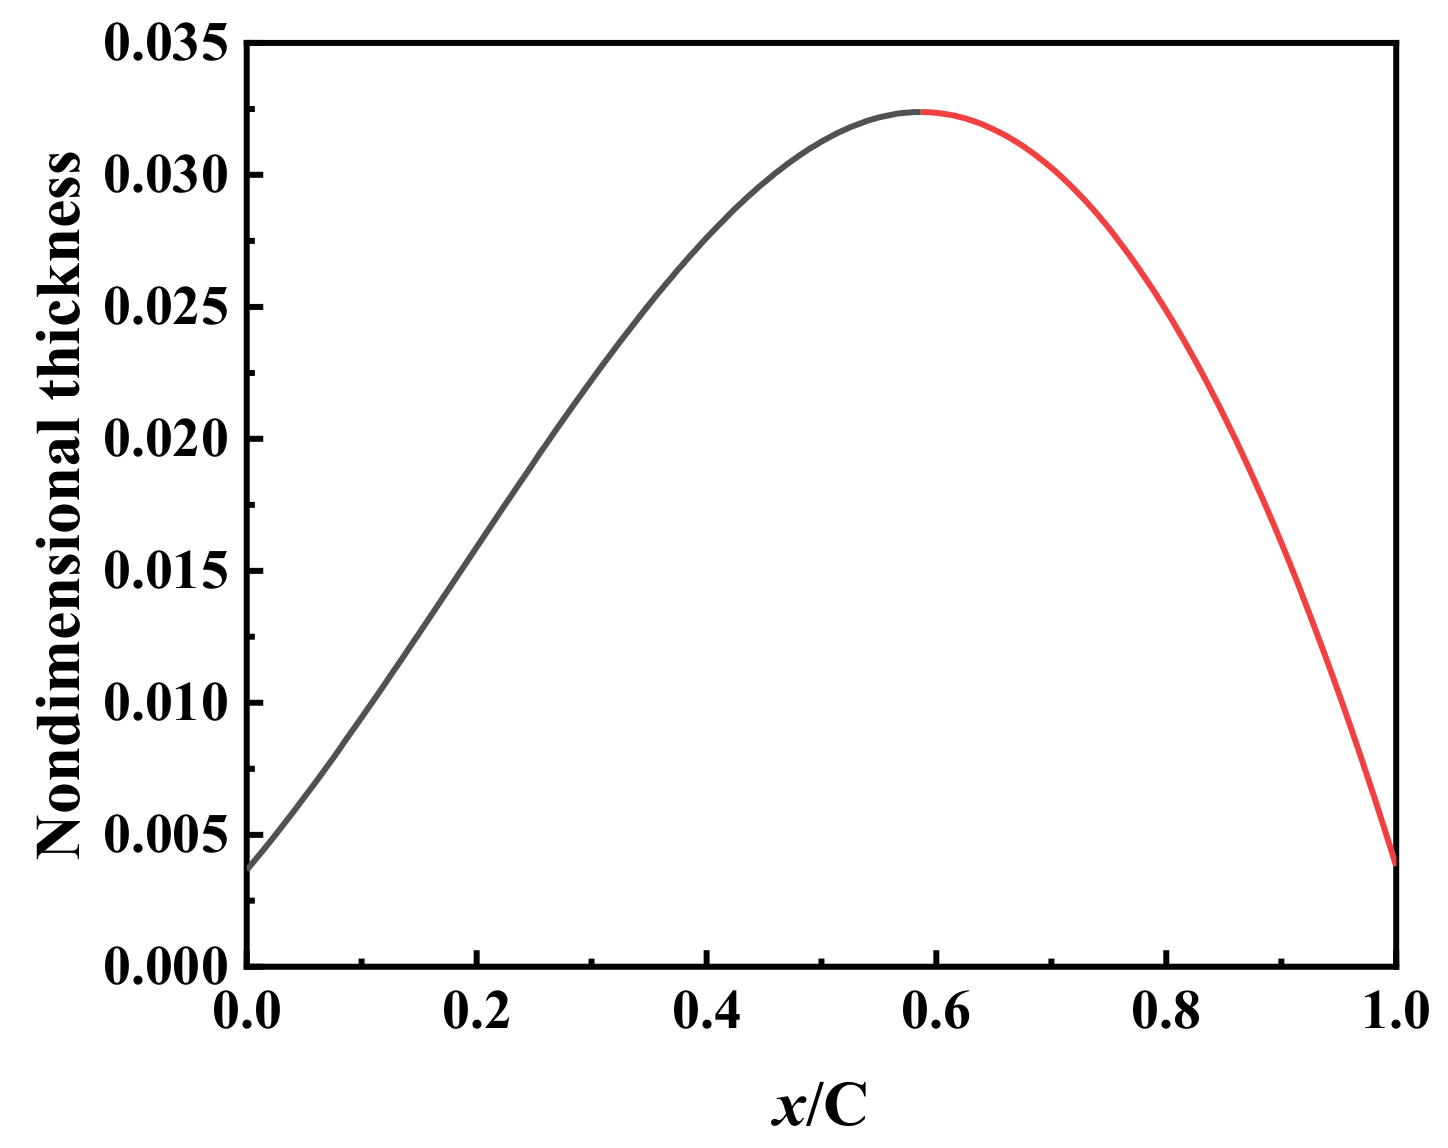
2.2. Parameterization Method

Transonic and supersonic blades pressurize the air flow in two ways: the shock wave and the expansion channel. The profile of the suction surface before the throat position affects the shock wave, and the profiles of the suction surface and the pressure surface after the throat position jointly affect the expansion channel. In addition, shock wave loss and boundary layer loss on the suction surface constitute the main part of the loss of supersonic and transonic blades. Therefore, the blade parameterization method that can directly control the suction surface profile is important for the optimization design of transonic and supersonic blades. At the same time, considering the blade strength problem induced by thickness, the parameterization method based on superimposing thickness on the suction surface was used to construct the rotor blade. The suction surface profile was constructed by two cubic Bezier curves, and the connection points meet the first-order and second-order continuous conditions. The form of the cubic Bezier curve is as follows:
B ( t ) = P 0 ( 1 t ) 3 + 3 P 1 t ( 1 t ) 2 + 3 P 2 t 2 ( 1 t ) + P 3 t 3 , t 0 , 1
where P0, P1, P2, and P3 are the four control points of the cubic Bezier curve. It can be seen in Figure 1 that the curve is tangent to the line segment P0P1 at the point P0 and to the line segment P2P3 at the point P3. The thickness distribution was constructed by two cubic polynomials. The two cubic polynomials were connected at the maximum thickness position, and the first-order and second-order continuity conditions were satisfied at the connection points. Figure 2 shows the thickness distribution represented by two cubic polynomials.

2.3. Optimization Objective

A multi-objective optimization aiming for a higher isentropic efficiency and a wider comprehensive stall margin at a design mass flow rate of 630 kg/s was carried out by minimizing the following objective functions.
O B F 1 = c 1 e c 2 η η r e f η r e f , O B F 2 = c 3 S M S M r e f S M r e f
where c1, c2, and c3 are the weight coefficients of the objective function; η and η r e f are the isentropic efficiency at the design flow point of the optimized rotor and the original rotor, respectively; S M , S M r e f are the comprehensive stall margin of the optimized rotor and the original rotor. Here, comprehensive stall margin is defined as
S M = ( π s t a l l / m s t a l l π d p / m d p 1 ) × 100 %
where π s t a l l is the total pressure ratio at the near stall condition, m s t a l l is the mass flow rate at the near stall condition, π d p is the total pressure ratio at the design mass flow rate condition, and m d p is the design mass flow rate. The near stall condition was defined as the last operating point converged with the maximum average static pressure at the rotor outlet.

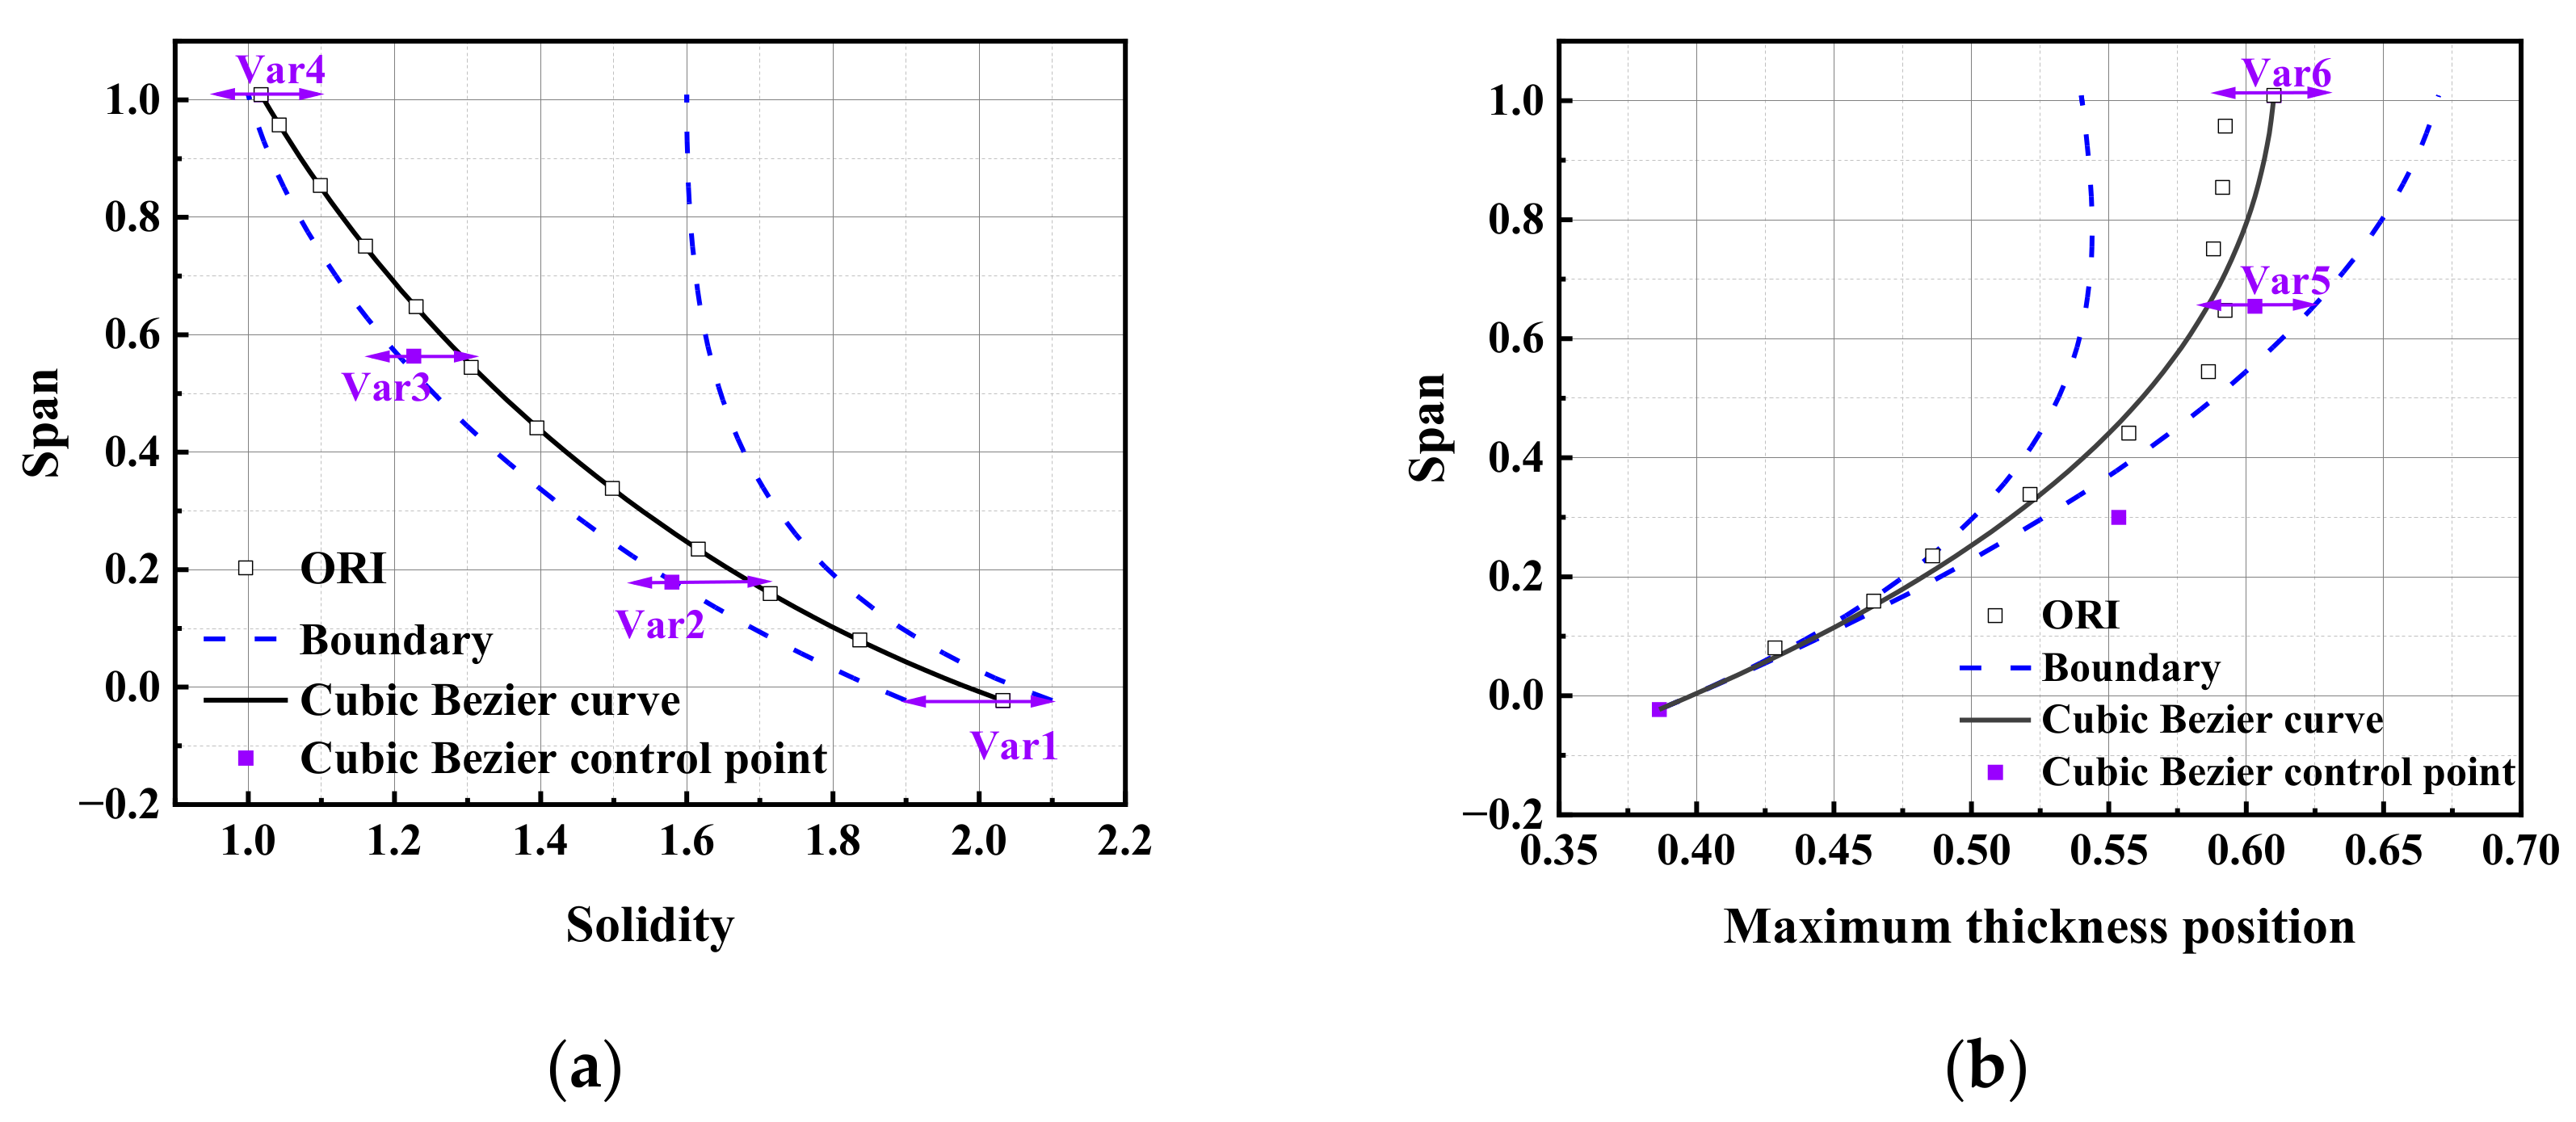
2.4. Optimization Variables

The number of rotor blades and the spanwise distribution of solidity were selected as the optimization variables to control the spanwise distributions of solidity and aspect ratio. For a certain solidity, the number of blades not only directly determines the aspect ratio, but also affects the total weight of rotor blades. The absolute deflection of the suction surface profile will become larger due to the profile’s proportional enlargement; thus, the throat position and throat area of each blade section will change accordingly. Therefore, to reduce the influence of throat width on the mass flow rate [10] and reduce the blade strength problem, the maximum absolute thickness of each airfoil was unchanged, and only the spanwise distribution of the maximum thickness position was controlled to adjust the throat and reduce the influence on the mass flow rate. At the same time, the absolute axial position of the rotor stacking line remains unchanged during the optimization process, and the blade sections remain linearly stacked along the center of gravity.
To ensure the continuous and smooth change of the blade profile along the spanwise direction, the spanwise distribution of solidity was represented by a cubic Bezier curve. The four control points were all control variables, namely, Var1, Var2, Var3, and Var4, as shown in Figure 3a. The absolute positions of the four control points in the spanwise direction were unchanged, and only the solidity values of the four control points were changed. The number of rotor blades varied from 21 to 27. Reducing the number of rotor blades is more conducive to a small aspect ratio design and weight reduction. The spanwise distribution of the maximum thickness position was represented by a cubic Bezier curve. Only two control points near the tip region were used as control variables, namely, Var5 and Var6, as shown in Figure 3b. The absolute positions of the two control points in the spanwise direction were unchanged, and only the maximum thickness position values of the two control points were changed. The variation ranges of solidity and the number of blades were determined according to the axial spacing constraint of the original blade row, and the variation ranges of the parameters were as large as possible. Therefore, there were seven optimization variables. The original parameter values and variation ranges are shown in Table 2.
In the optimization process, the rotor blade was expressed by 12 typical cross-section airfoils, and the remaining airfoils were obtained by spanwise interpolation. Firstly, the chord lengths of the 12 airfoils were determined according to the number of blades and the spanwise distribution of solidity; thus, the chord length scaling ratio of the original blade was determined. Considering that the suction surface is the key factor affecting shock wave loss and boundary layer loss, the suction surface profile was proportionally scaled based on the original suction surface according to the chord length. The maximum thickness position of each airfoil was interpolated from the spanwise distribution curve of the maximum thickness position. The stagger angle, inlet metal angle, and outlet metal angle of each airfoil remained unchanged during the optimization process.

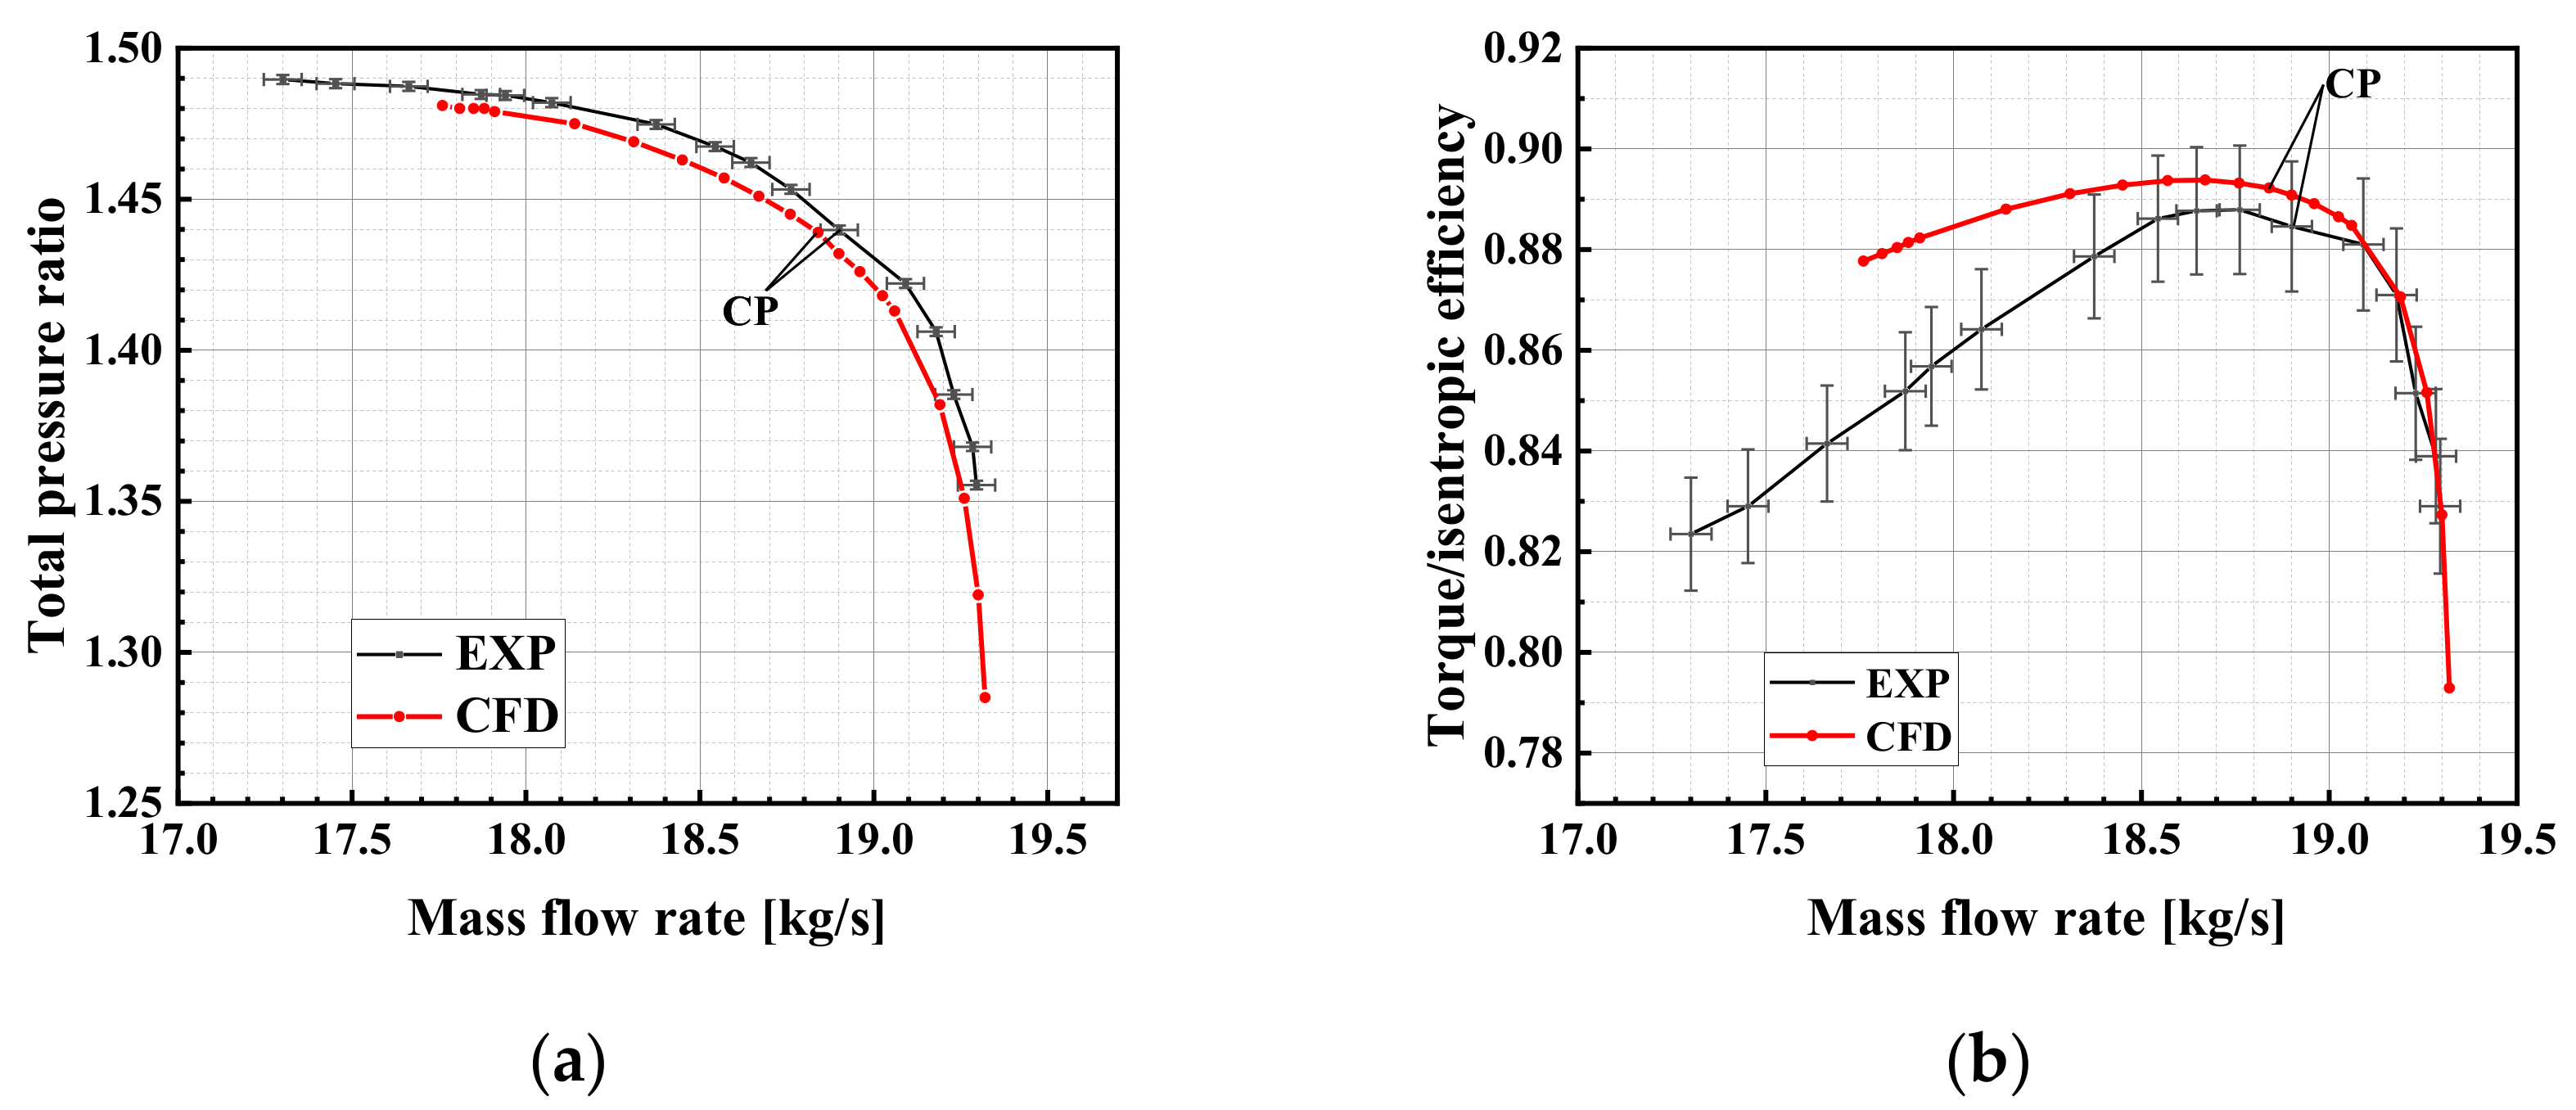
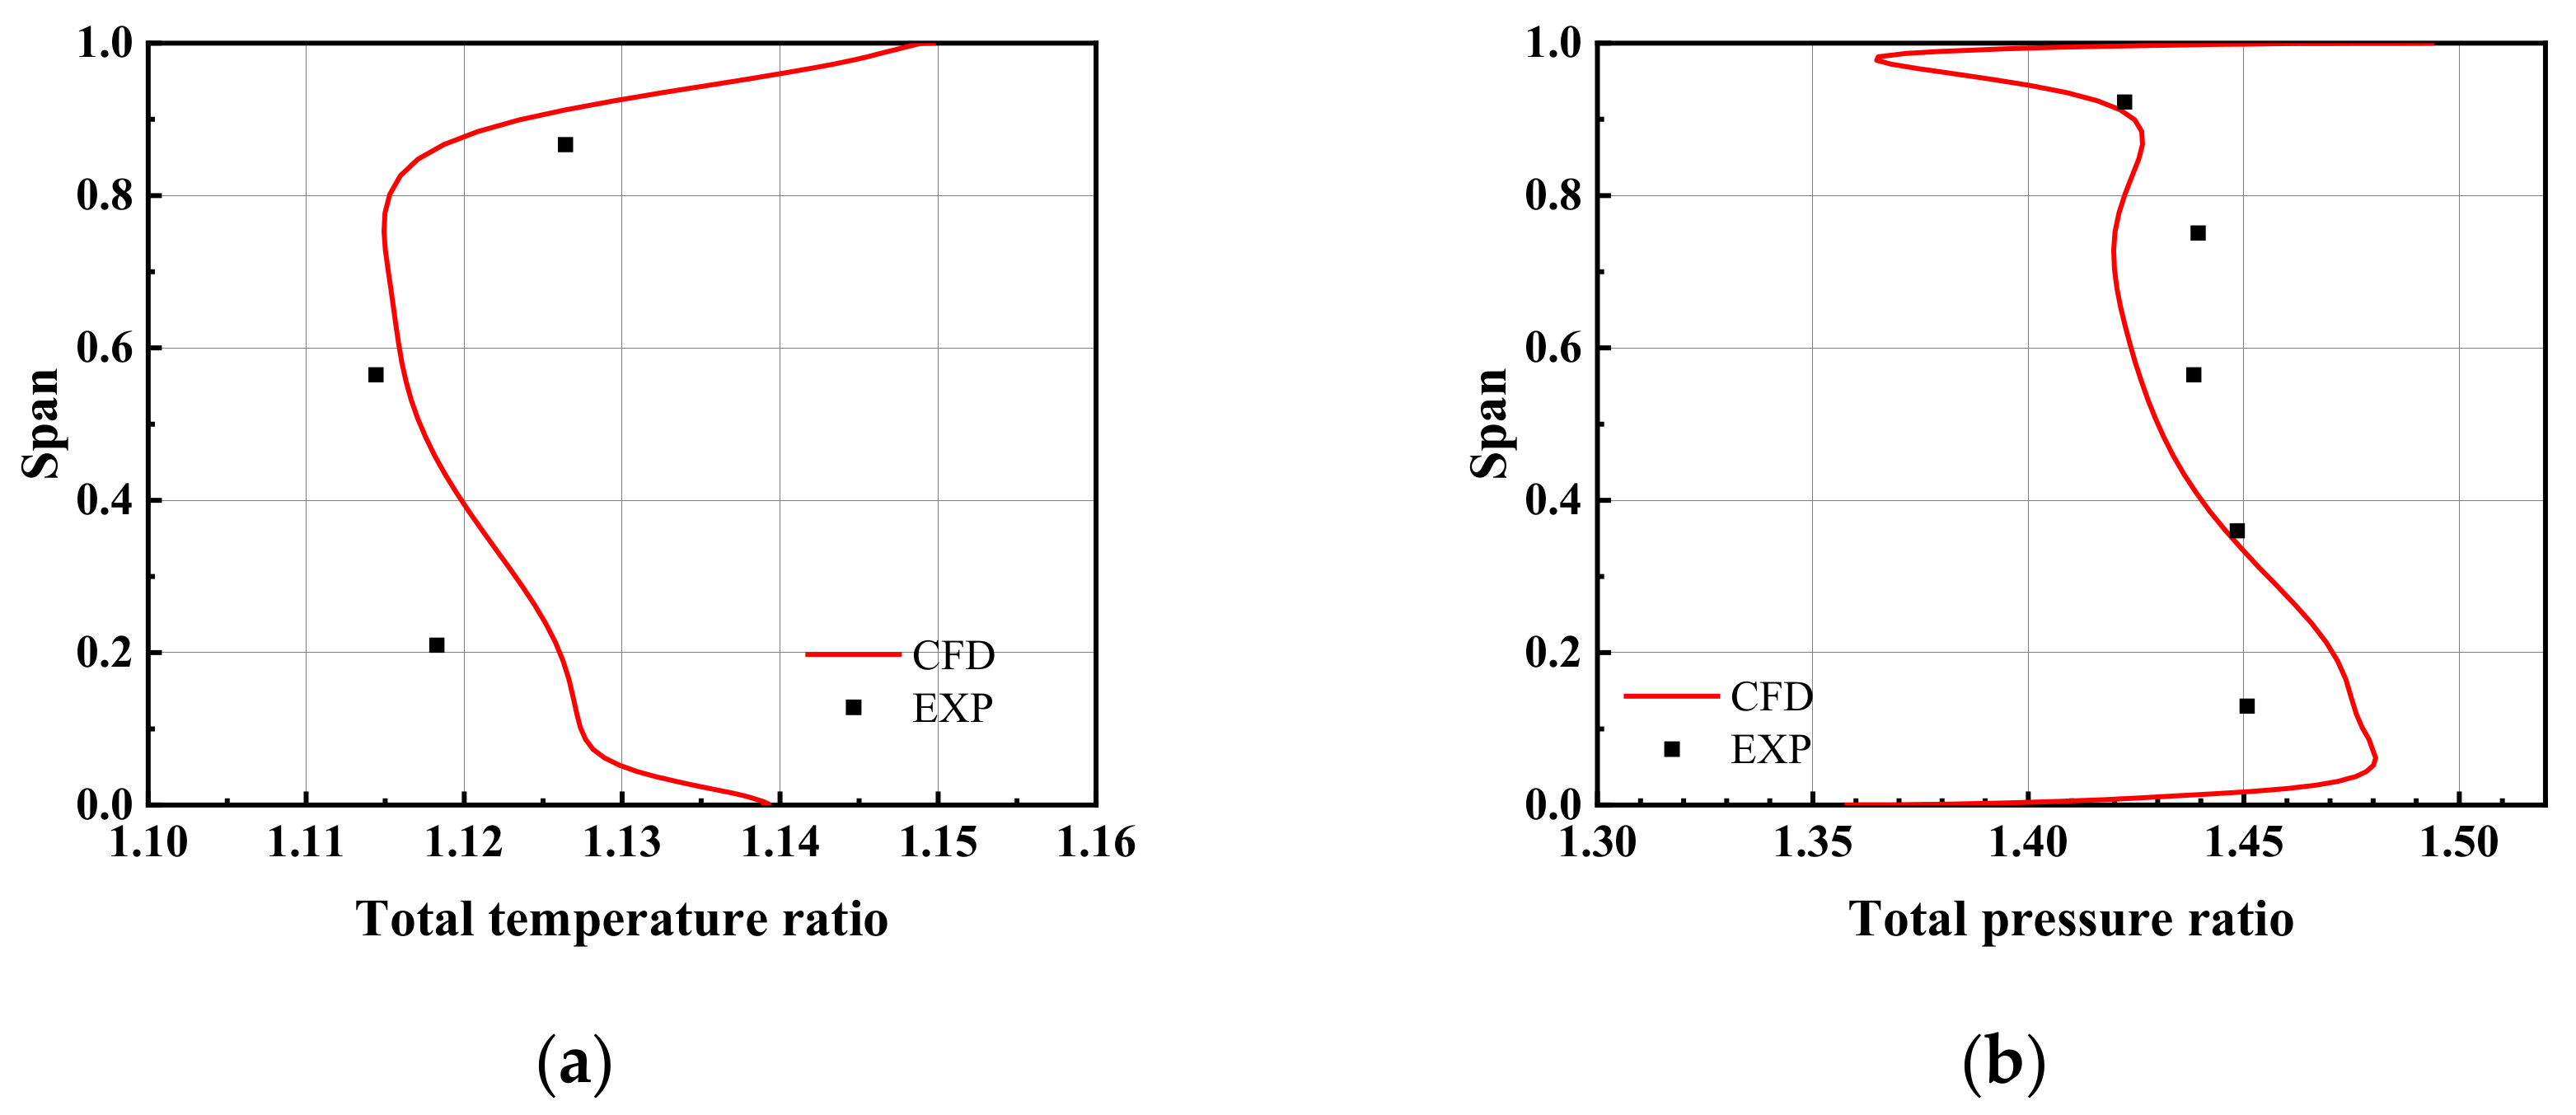
2.5. Numerical Calculation Method

The computational domain mesh was generated by AutoGrid5, and O4H topology was used to improve the orthogonality of grids. The three-dimensional numerical simulation solver FINE/Turbo was adopted. The Spalart–Allmaras turbulence model was selected to solve the steady RANS equations. The first grid layer spacing adjacent to the solid wall was adjusted to y+ < 3 in accordance with the requirements of the turbulence model. The spatial discretization scheme used for computation was the Jameson central scheme, and the temporal discretization scheme was the explicit 4-stage Runge–Kutta scheme. The Full Non-Matching Mixing Plane method was used for the IGV–Rotor interface. To speed up the convergence of computation, the local time stepping, residual smoothing, and multi-grid techniques were applied. The working fluid was perfect air. The total temperature, total pressure, airflow angle, and turbulent viscosity were applied as inlet boundary conditions. The average static pressure was applied as an outlet boundary condition. The spanwise distribution of static pressure was obtained by the radial equilibrium equation.
To verify the accuracy of the numerical calculation method, the experimental results and CFD results of the test rig of the original inlet 1.5-stage transonic compressor with a scale ratio of 5.8 were compared. The reduced-scale 1.5-stage transonic compressor includes blade rows of IGV, rotor, and stator. It can be seen in Figure 4 that the numerical characteristic curves of the total pressure ratio and isentropic efficiency are in good agreement with the experimental results, but there are some deviations in value and stall margin. The unsteady flow of the transonic compressor is more significant near the stall limit. It is difficult to accurately predict the unsteady boundary condition of the experiment near the stall limit by steady CFD [11]. The stall margin of steady CFD is smaller than that of the experiment, but the change trends of the stall margin are the same in both methods.
Figure 5 compares the radial distributions of the total temperature ratio and total pressure ratio at the same outlet positions and at the operating points with equal total pressure ratio marked as CP in Figure 4. The mass flow rate difference between the two points is less than 0.5%, and the isentropic efficiency difference is less than 0.8%. The CFD results are in good agreement with the overall trends of the experiment. The maximum deviation of the radial distribution is concentrated near the hub region, which is manifested by the fact that the numerical total pressure ratio is larger below 35% span and smaller between 35% and 90% span. The total temperature ratio of CFD near the hub region is also larger, which is the same trend as the CFD blind test results of Rotor37 [12]. The main reason for this difference is that CFD cannot accurately simulate the gap leakage at the rotor hub. The increase in the gap leakage flow at the hub affects the pressure rise and temperature rise within the entire span range and produces an obvious total pressure and total temperature loss near the hub [13].
The above results show that the numerical calculation method used here can accurately predict the performance and flow field of the 1.5-stage transonic compressor and can meet the requirements of compressor flow analysis and performance predictions. In this optimization process, to reduce the influence of the axial spacing constraint between blade rows and the aerodynamic matching of the airflow angle for the stator blade, only blade rows of IGV and rotor are included. The computational domain is shown in Figure 6. The total number of grids was 3.48 million.

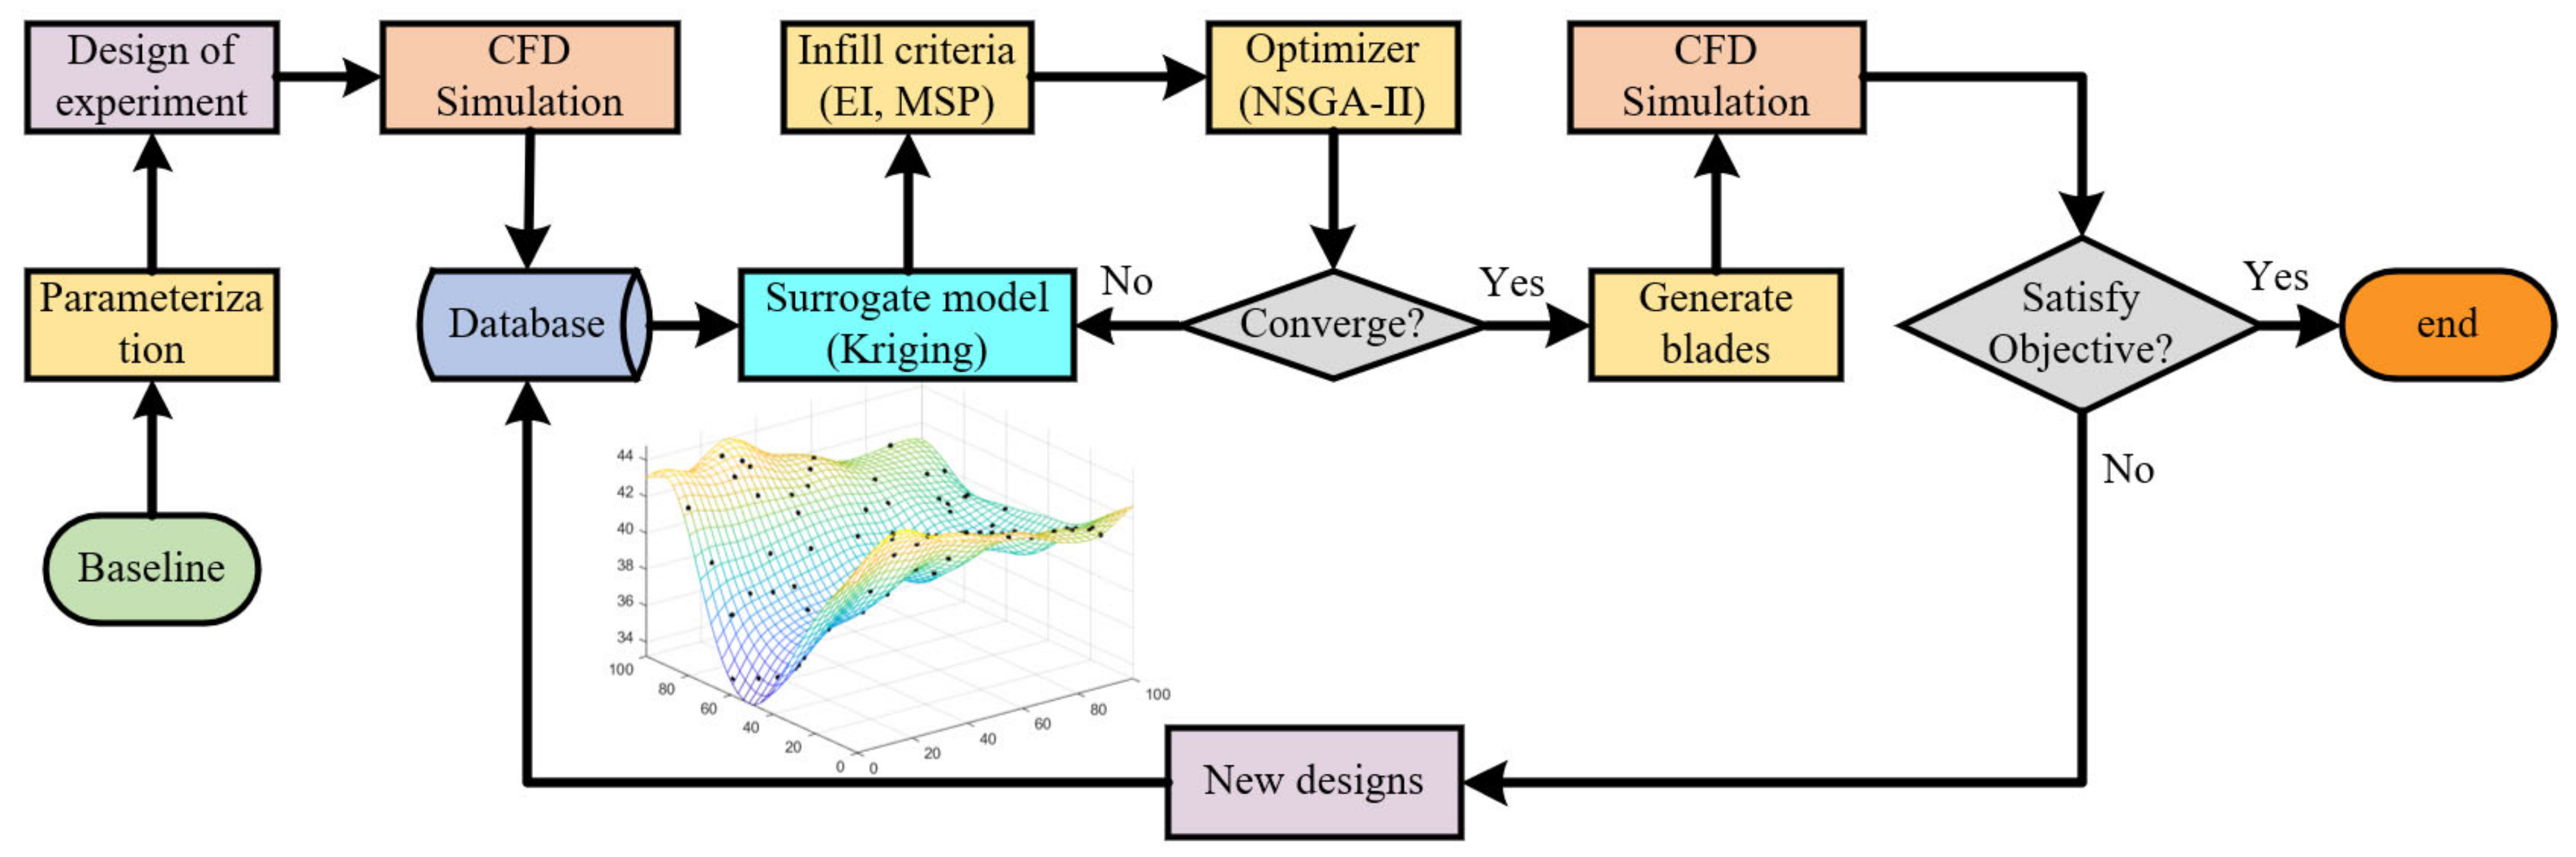
2.6. Aerodynamic Optimization Method

The optimization design method has been an important tool for designers in recent years. Researchers have combined the optimization method with three-dimensional CFD analysis tools to improve the performance of turbomachinery and have carried out many studies [14,15,16]. The total pressure ratio, efficiency, and stall margin of a transonic compressor are three mutually restricted performance parameters. Increasing one of the three parameters may lead to a decrease in the other two. Therefore, the aerodynamic optimization design of a compressor is a multi-objective optimization design problem that needs to be considered comprehensively. Current aerodynamic optimization methods include a gradient-based optimization algorithm based on an adjoint equation and a heuristic-based optimization algorithm [17]. Although the heuristic-based optimization method has a strong global search ability, it is difficult to apply it to high-dimensional optimization problems and has the disadvantage of high computational costs after it is combined with CFD analysis. The gradient-based optimization method can efficiently deal with high-dimensional nonlinear optimization problems [18], but it may easily fall into a local optimum when addressing multi-extremum problems [19]. Han [20,21] provided a reference for the surrogate optimization method based on the Kriging surrogate model in the efficient global aerodynamic optimization design method. It was shown that the surrogate optimization algorithm has a high design efficiency, globality, and robustness, but it suffers from a low local convergence accuracy and a low efficiency in high-dimensional optimization. Therefore, considering the optimization efficiency and CFD calculation cost, the Kriging surrogate optimization algorithm with high efficiency in low-dimensional optimization was adopted here. The flow chart of the aerodynamic optimization design is shown in Figure 7.
The in-house optimization platform was integrated with the MATLAB platform. The platform includes three-dimensional blade parameterization, grid meshing, numerical calculation, and numerical optimization. The Kriging surrogate optimization algorithm solves the sub-optimization problem defined by the optimization infill criterion by establishing a surrogate model of the objective function and the constraint function. The new sample points were obtained and added to the sample dataset to update the surrogate model until the resulting sample point sequence approaches the local or global optimal solution. The two performance parameters—the isentropic efficiency and the stall margin at design condition—were the optimization objectives. Therefore, the Kriging surrogate model of each objective was constructed. Minimization surrogate prediction (MSP) [22] and expected improvement (EI) [23] were used as the infill criteria. In the optimization process, the NSGA-II optimization algorithm was used to obtain the Pareto front on the current Kriging surrogate model according to the MSP infill criterion, and several sample points were then selected from the current Pareto front and added to the samples. The EI infill criterion was used to add the maximum improvement expectation point of the Kriging surrogate model of each target to the samples.

3. Results

The initial samples were extracted by the Latin hypercube method, and the number of initial samples was 70. In the sub-optimization process, the NSGA-II optimization algorithm was used to extract three samples on the current Pareto frontier, and the EI infill criterion was used to extract one sample for each optimization objective. Five samples were added in each round of optimization, and a total of 150 samples were obtained after 16 sub-optimization rounds. Figure 8 shows the Pareto frontier distribution of the isentropic efficiency and stall margin characteristics of the optimized samples at the design condition. Three optimized samples (OPT1, OPT2, and OPT3) were selected for analysis. These three samples have different performance characteristics, as shown in Figure 9. The stall margin, isentropic efficiency, and total pressure ratio at the design flow point are improved compared with the original design (ORI).
The isentropic efficiency of OPT1 at the design mass flow rate is the highest, with 22 blades, a 0.96% efficiency improvement, and a 10% stall margin improvement. The stall margin of OPT2 is the largest, with 27 blades, a 0.37% efficiency improvement, and a 18.7% stall margin improvement. The performance of OPT3 is between those of OPT1 and OPT2, with 25 blades, a 0.72% efficiency improvement, and a 16% stall margin improvement. The choked mass flow rates of the three optimized samples are slightly reduced: 0.2 kg/s for OPT1, 3.2 kg/s for OPT2, and 2 kg/s for OPT3. The isentropic efficiency and total pressure ratio within a flow range that is lower than the design mass flow rate are also significantly improved. A performance comparison of the three optimized samples at design condition is shown in Table 3.
The spanwise distributions of solidity and aspect ratio for the optimized samples and the original rotor are shown in Figure 10. The solidity of the three optimized samples increases differently along the blade span. OPT1 has the largest solidity below 80% span, but the solidity is the smallest above 80% span. Compared with ORI, the solidity of OPT1 increases from hub to tip, but the number of blades of OPT1 decreases, so the aspect ratio is the smallest. The solidity of OPT2 is the largest above 80% span, and the solidity below 80% span is the smallest among the three optimized samples. The solidity below 20% span is reduced compared with ORI, and the number of blades is still 27. The aspect ratio of OPT2 is also reduced. The solidity and aspect ratio of OPT3 are between those of OPT1 and OPT2. The maximum thickness positions of the three optimized samples do not deviate much from that of ORI. For OPT1 and OPT3, the maximum thickness positions move forward above 40% span. For OPT2, the maximum thickness position between 75% and 98% span moves backward.

4. Discussion

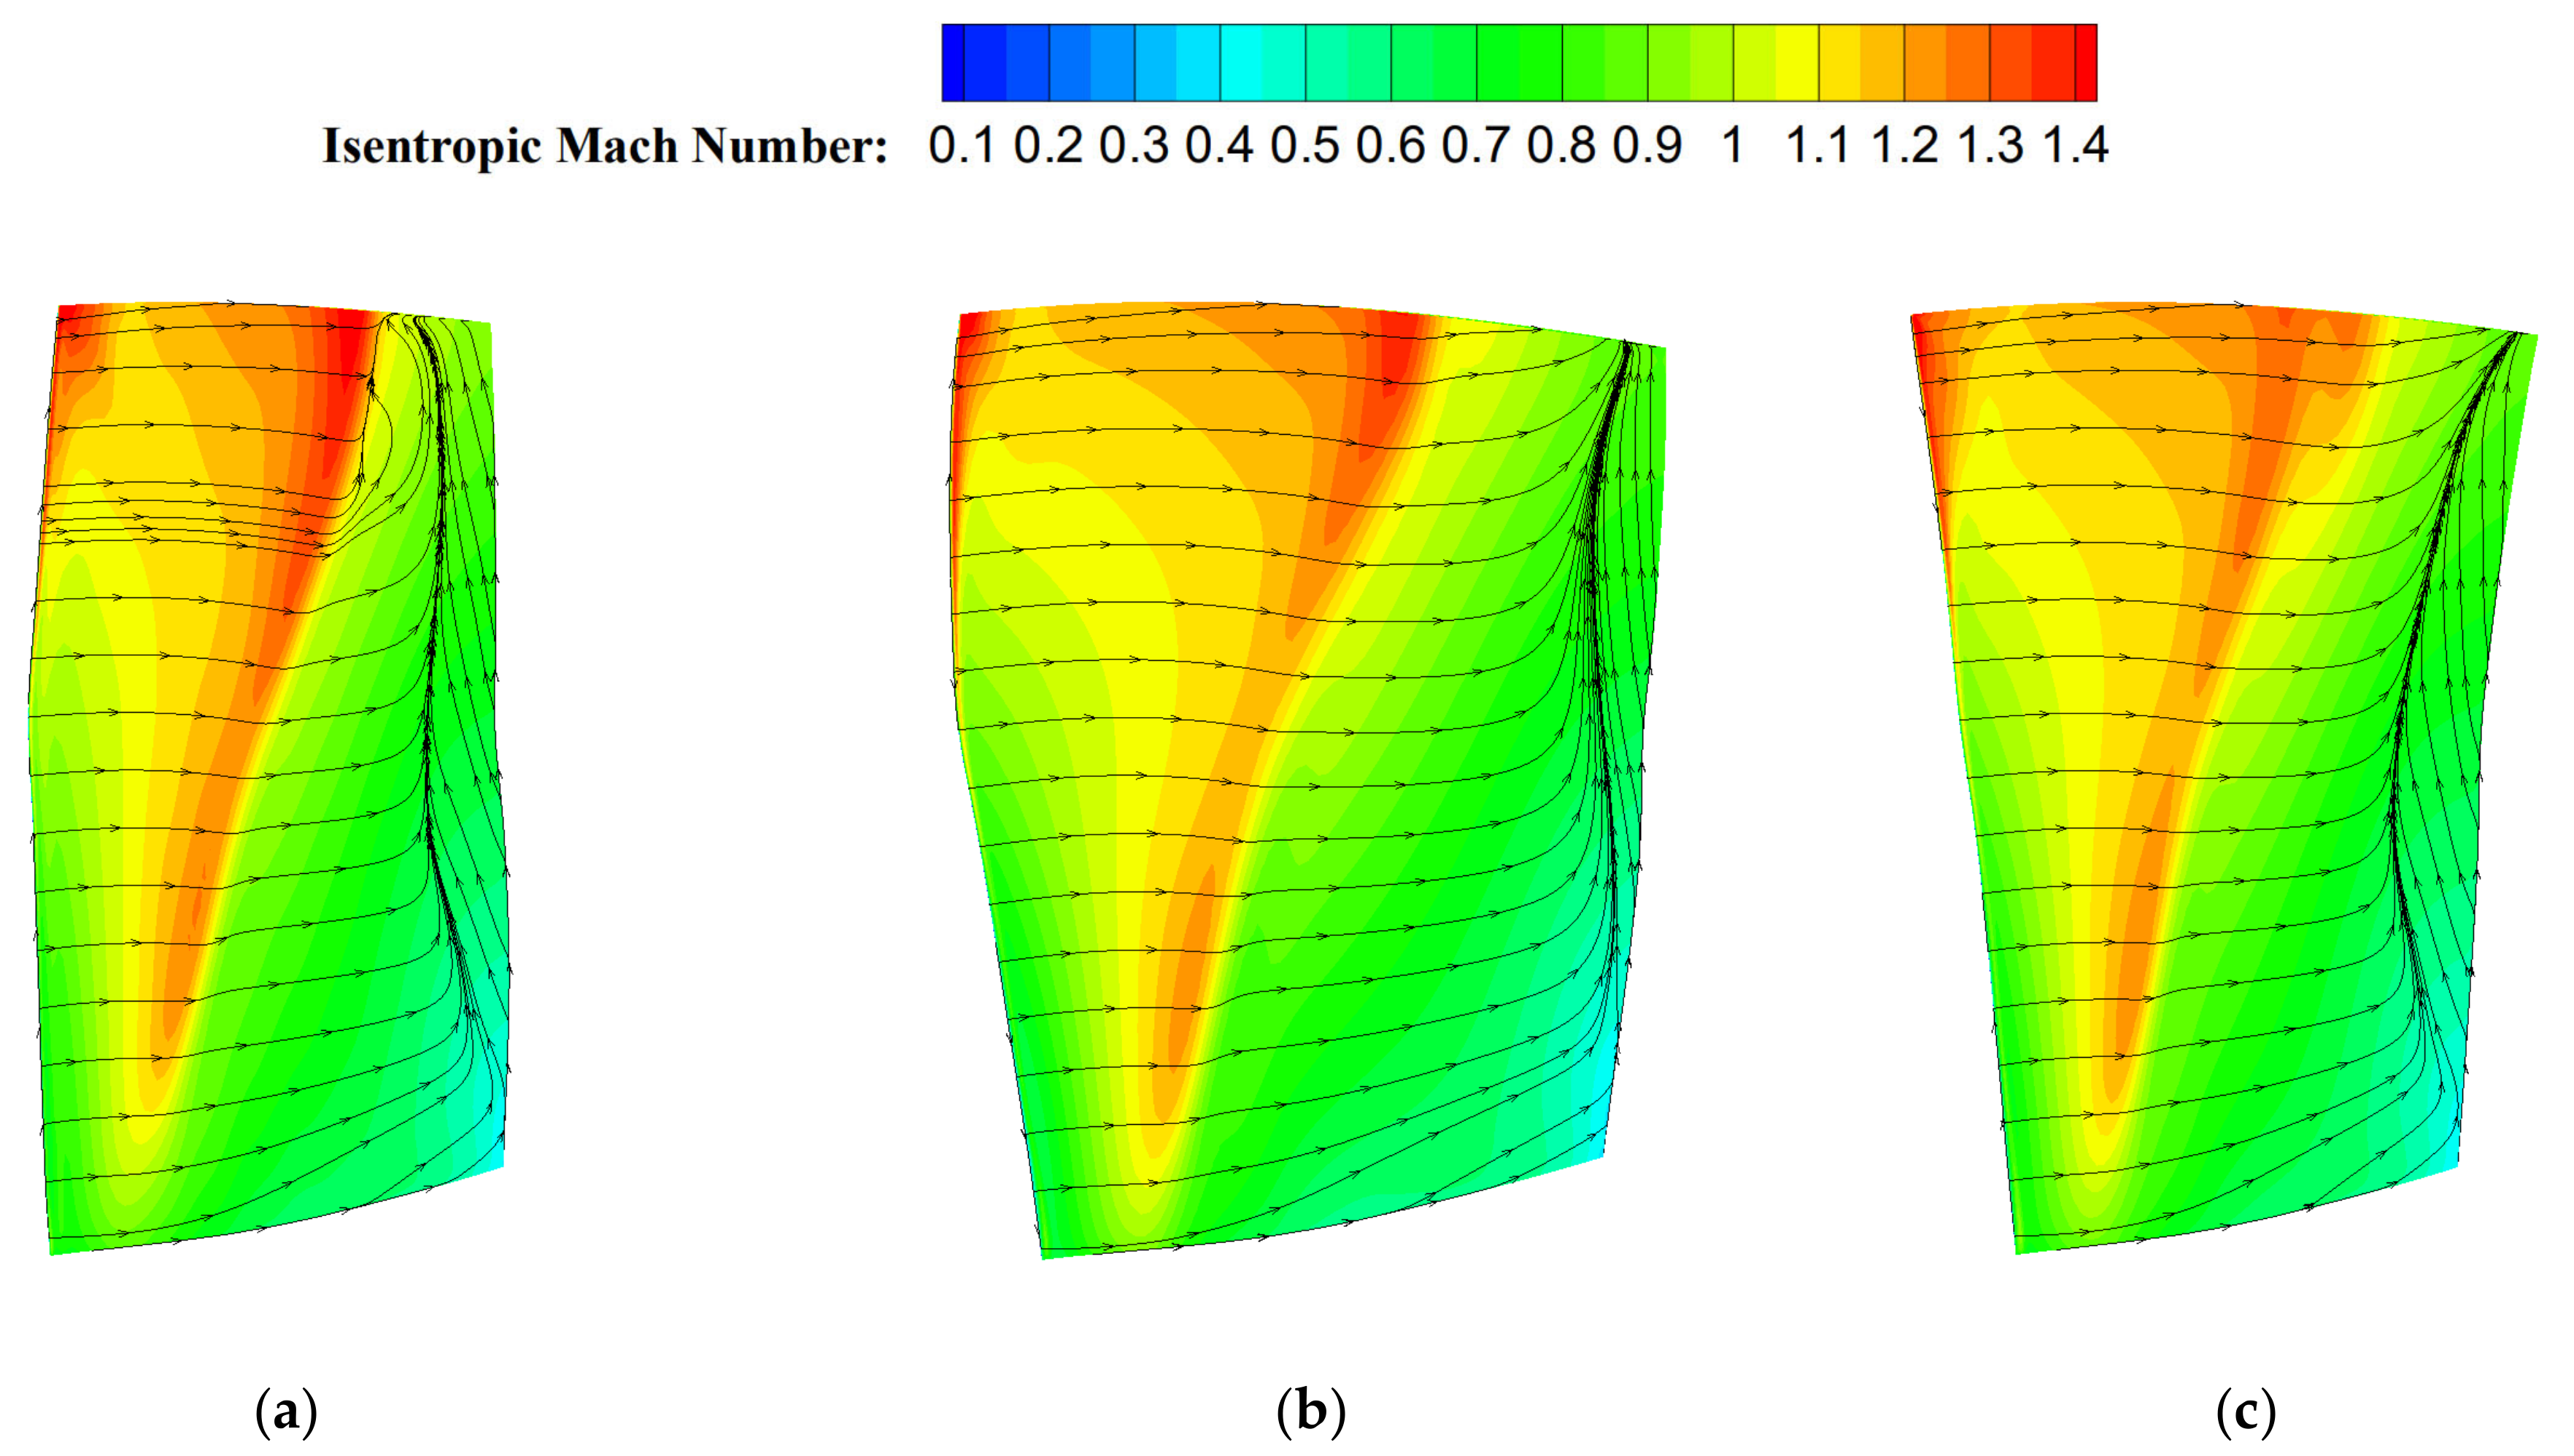
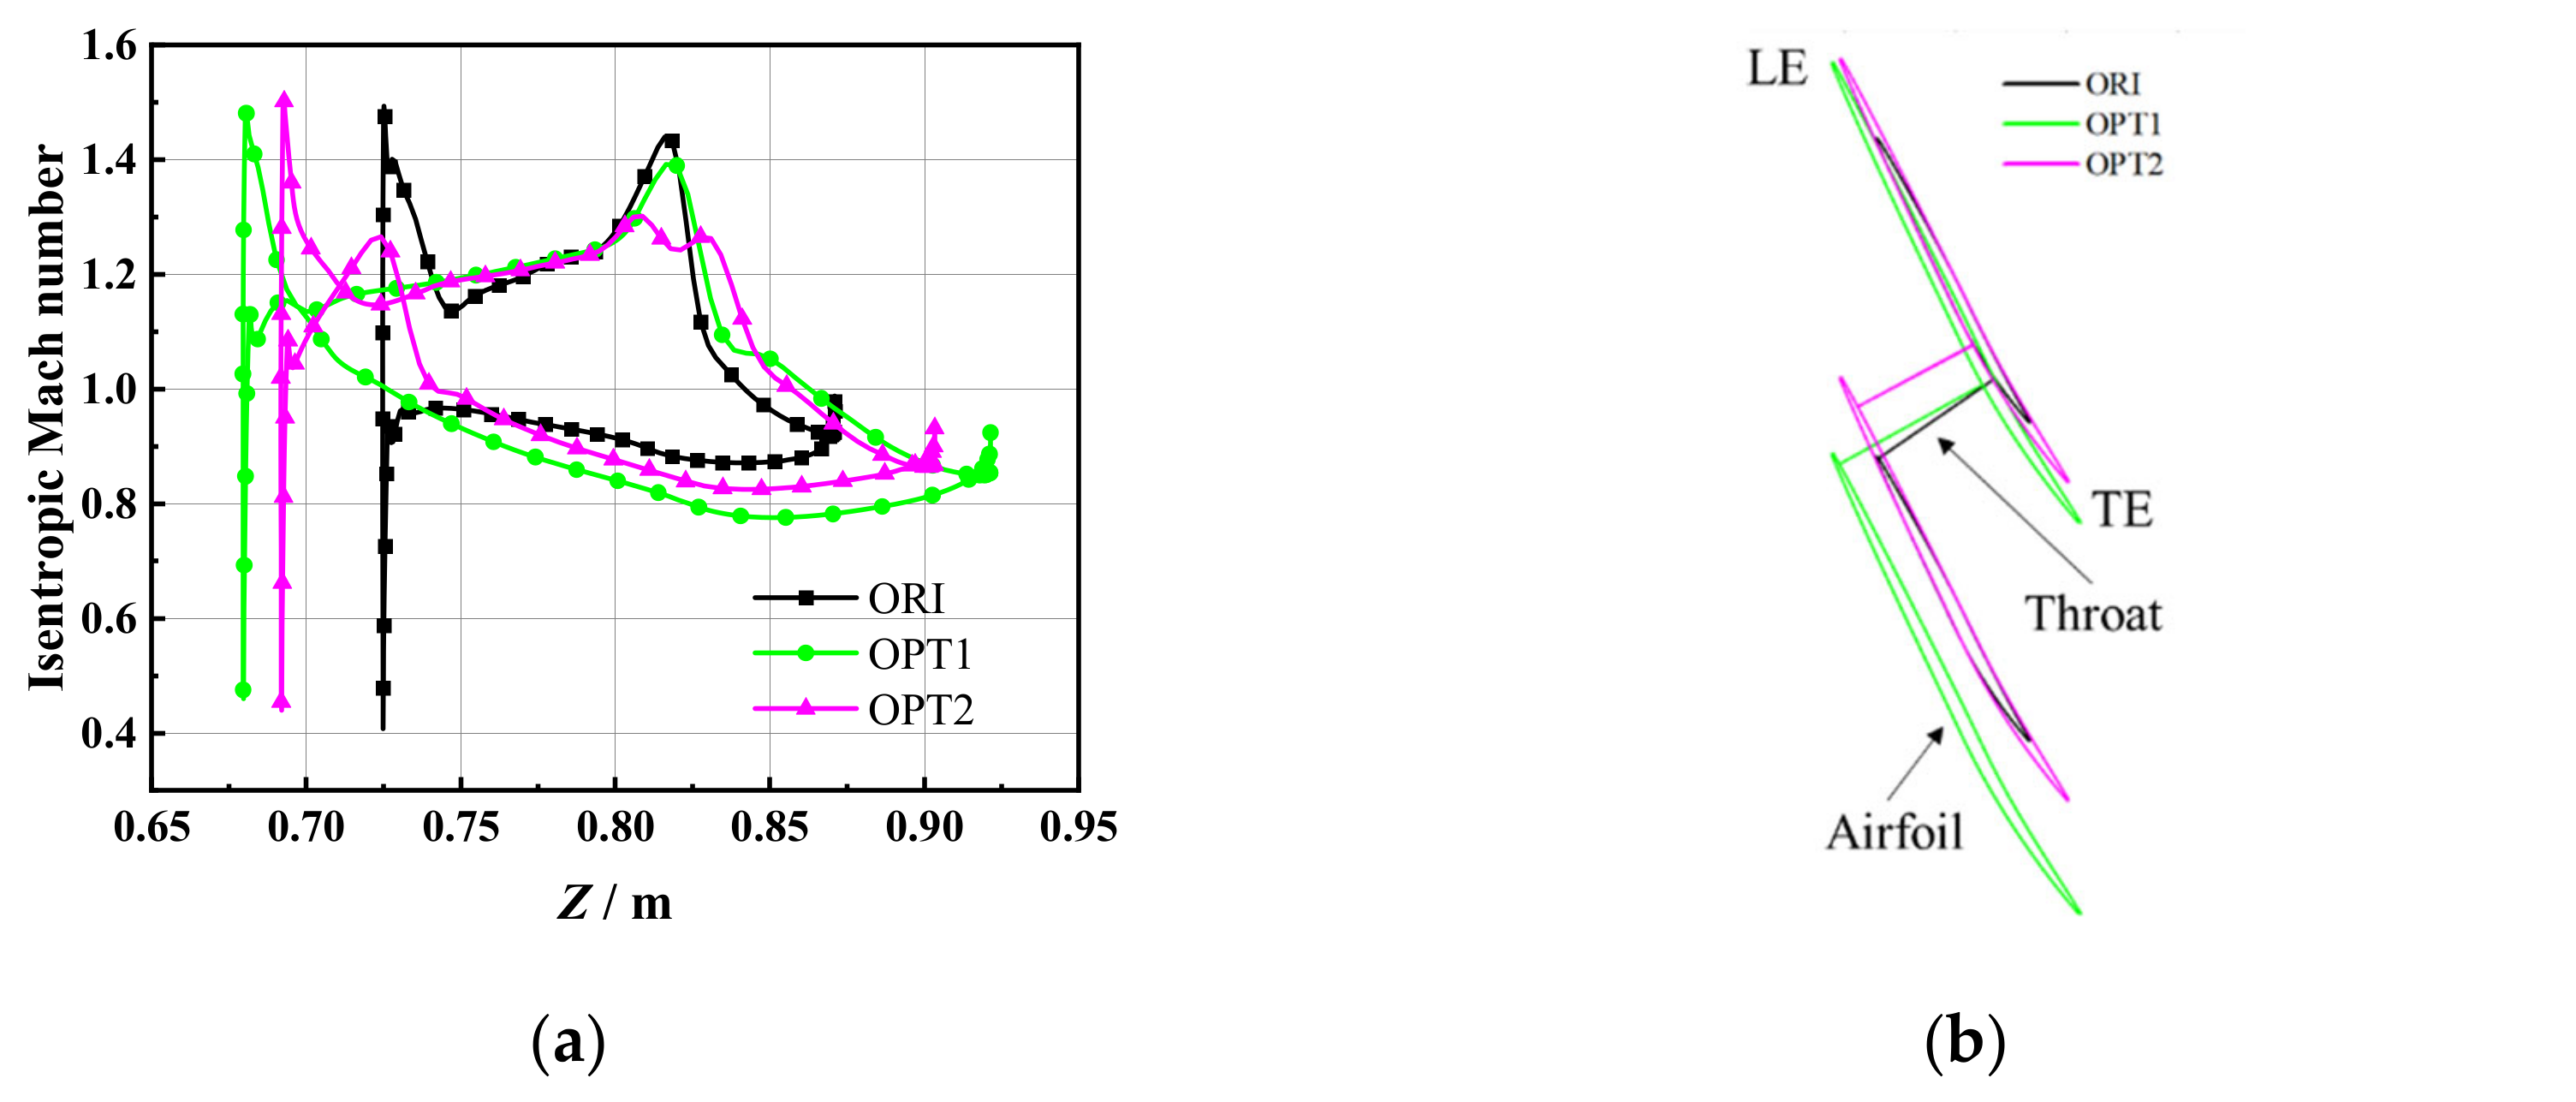
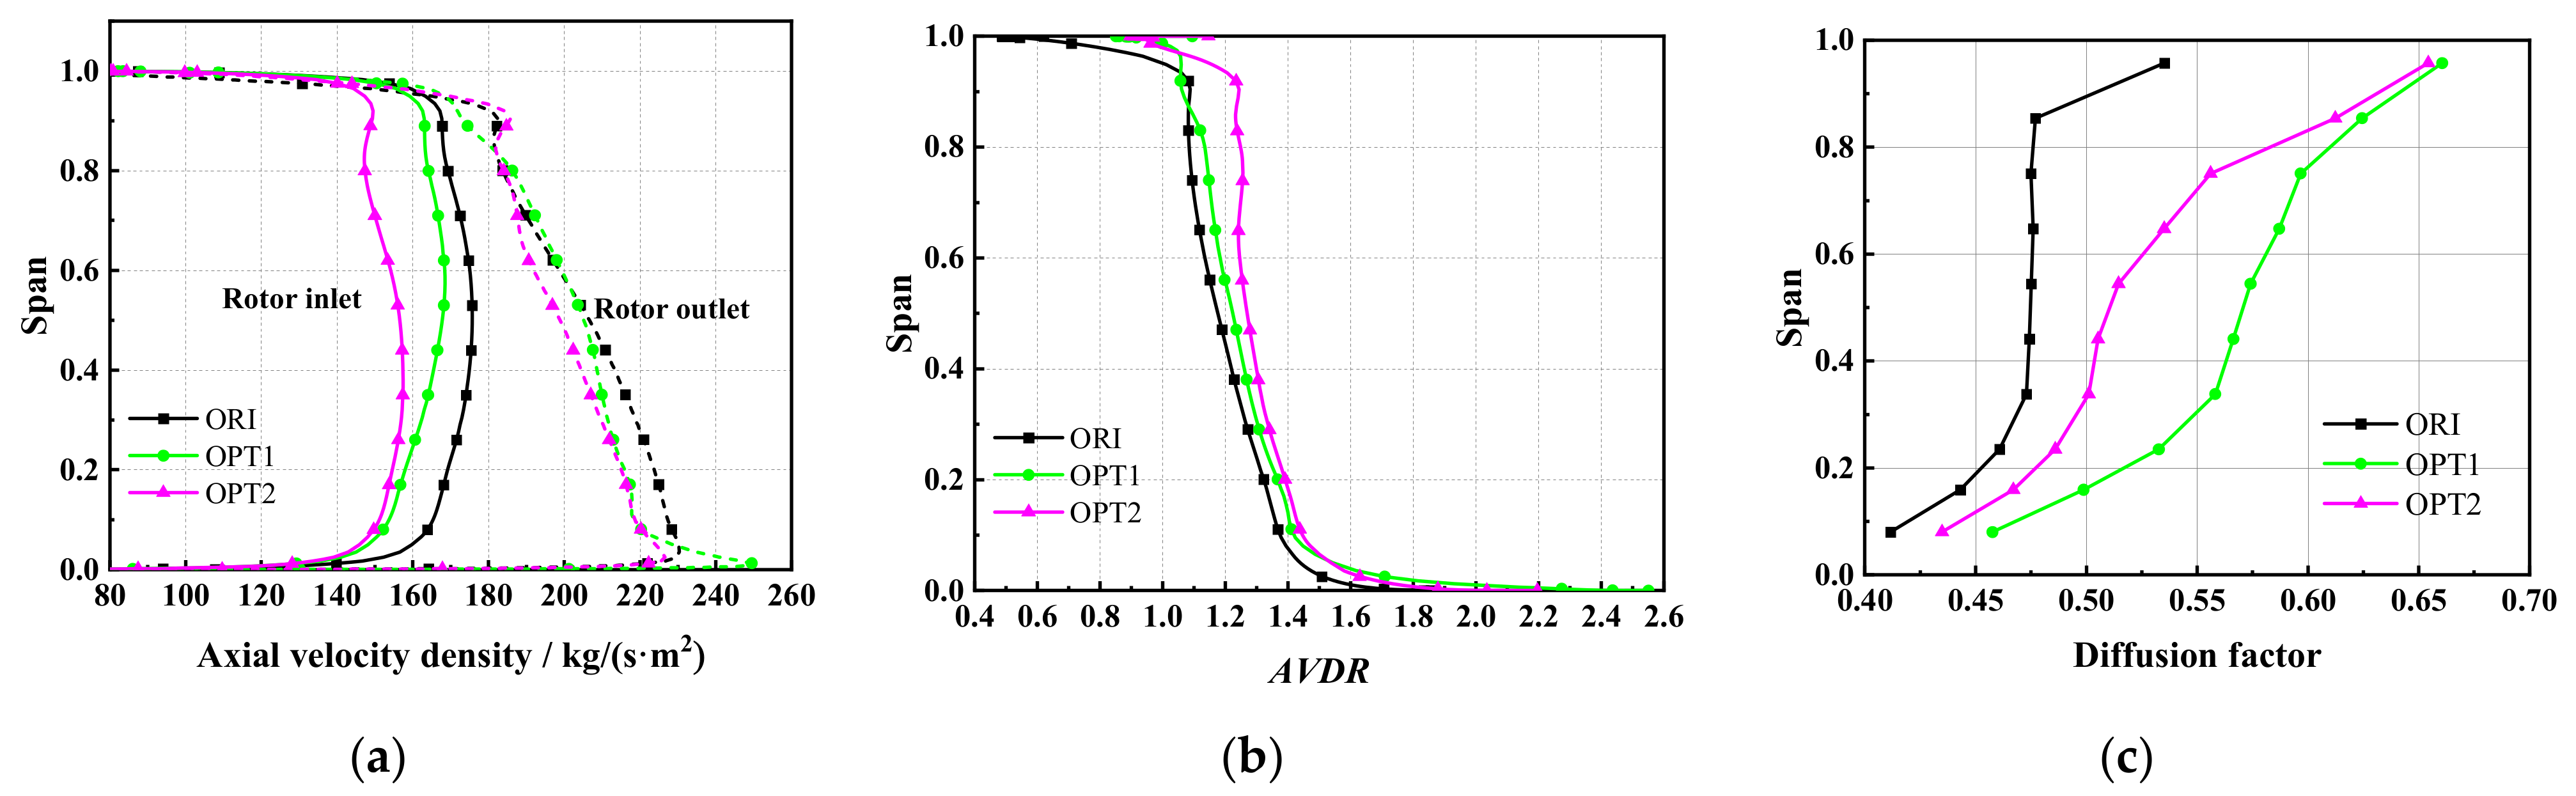
4.1. Flow Field Analysis

The spanwise distributions of the inlet relative flow angle and Mach number at the rotor inlet at design condition are shown in Figure 11. The inlet relative flow angle and Mach number of OPT1 and OPT2 are almost the same as those of ORI, but the solidities of OPT1 and OPT2 above 20% span are larger than that of ORI, which decreases the deviation angle under the same incoming flow conditions and increases the pressurization ability. Therefore, the temperature rise along the blade span between rotor inlet and the outlet increase for OPT1 and OPT2, as shown in Figure 12. Correspondingly, the entropy change of OPT1 above 25% span is reduced, the isentropic efficiency above 25% span is improved, and the isentropic efficiency improvement near the tip region is more significant. The entropy change of OPT2 above 70% span is reduced, and the isentropic efficiency near the tip region is also improved.
The contours of the isentropic Mach number and limiting streamlines on the rotor suction surface for ORI, OPT1, and OPT2 are shown in Figure 13. For ORI, the separation happens above 75% span, and the separation occurs near the 70% axial chord position. The separation line corresponds to the position where the shock wave interacts with the boundary layer on the suction surface, and the separation is induced by the strong shock wave. For the region below 75% span, no separation occurs after the interaction between the shock wave and the boundary layer, but the stagnation effect of the shock wave on the flow leads to a significant radial migration of the low-energy fluid in the boundary layer driven by the radial pressure gradient and gradually intensifies towards the tip region. At the same time, the boundary layer separation on the suction surface near the trailing edge tends to occur earlier near the hub region due to its interaction with the boundary layer separation on the hub under the condition of an adverse pressure gradient, and the boundary layer separation on the suction surface near the trailing edge occurs slightly within the entire span.
For OPT2, the intensity of the shock wave is weakened, the flow separation caused by the shock wave–boundary layer interaction disappears, and the radial migration of the low energy fluid and flow separation in the boundary layer near the trailing edge is also weakened. Therefore, the loss of OPT2 above 70% span is reduced compared with that of ORI. This indicates that increasing the solidity can effectively suppress the shock wave–boundary layer interaction and weaken the radial migration and boundary layer separation, thus improving the flow field near the tip region. However, due to the increase in chord length caused by the increase in solidity, the boundary layer separation loss on the suction surface increases due to the flow diffusion that occurs between 30% and 70% span. The flow field below 30% span is almost the same as that of ORI. The load of OPT2 increases along the blade span, so the isentropic efficiency of OPT2 is improved near the blade tip and is almost the same as that of the ORI along the left blade span.
OPT1 has both a smaller number of blades and a smaller aspect ratio. The intensity of the shock wave is weakened, and the separation phenomenon caused by the shock wave–boundary layer interaction disappears. The boundary layer separation near the trailing edge on the suction surface above 25% span is significantly weakened, and the entropy change between 25% and 97% span is the smallest. OPT1 has the largest solidity below 80% span, which indicates that a small aspect ratio design is more conducive to suppressing boundary layer separation and improving efficiency. Due to the weakened radial migration, the loss near the blade tip is also reduced, but the effect is less obvious than that of OPT2. The main reason is that, although the aspect ratio of OPT1 is smaller, the solidity of this region is smaller than that of OPT2. OPT1 has boundary layer characteristics similar to those of ORI and OPT2 below 25% span. The solidity and chord length of OPT1 are the highest below 25% span, so the absolute total loss within this region increases. Therefore, increasing the solidity and reducing the aspect ratio cannot improve the flow field near the hub end-wall region, and can even increase the total loss due to the increase in blade surface area.
The sensitivities of the flow field to aspect ratio and solidity for different span regions are different. Increasing solidity can effectively reduce the shock wave intensity and reduce the loss induced by the shock wave and its interaction with the boundary layer on the suction surface. For the tip region, increasing solidity is more conducive to improving the efficiency near the tip region. For the mid-span region, increasing solidity can reduce the shock wave loss and suppress the shock wave–boundary layer interaction, but it will increase the boundary layer separation loss due to flow diffusion, while reducing the aspect ratio is more conducive to reducing the boundary layer separation loss and improving the flow field within the mid-span region. Increasing solidity and reducing aspect ratio have no beneficial effect on the flow near the hub, and the increase in chord length will increase the absolute scale of separation near the hub end-wall region. Therefore, an efficient transonic rotor design needs to comprehensively consider the shock wave-boundary layer interaction loss, the end-wall loss, and the blade boundary layer separation loss if proper spanwise distributions of solidity and aspect ratio are to be selected.
Figure 14 shows comparisons of airfoil geometry and isentropic Mach number distribution on 98% blade span at the design operating point of three rotors. The absolute axial positions of the shock wave of OPT1 and OPT2 are close to that of ORI. Due to the decrease in aspect ratio and the increase in solidity, the diffusion passage length of the two optimized rotors behind the throat increases, and the diffusion capacity of the blade expansion channel increases. For OPT1, the absolute axial position of the throat almost does not change, while its relative position to the leading edge moves backward. For OPT2, the maximum thickness position of the tip section moves backward, the relative position of the gravity center also moves backward, and the absolute space position of the throat moves forward. Because of the highest solidity above 80% span, OPT2 has the largest stall margin.
Figure 15a shows the spanwise distributions of axial velocity density at the rotor inlet and outlet at the near stall point. The mass flow rate and total pressure ratio at the near stall point for each sample are different from each other. ORI has the largest mass flow rate, OPT1 has the largest total pressure ratio, and OPT2 has the smallest mass flow rate at the near stall point. The stall margins of OPT1 and OPT2 are both improved compared with that of ORI. The rotor inlet axial velocity density for OPT2 within the entire span is the smallest, and the axial velocity density difference between the inlet and outlet within most of the blade span is the largest, which indicates that the strong main flow capacity is kept even at the near stall condition. The AVDR (axial velocity density ratio) of OPT2 within most of the span is improved, as shown in Figure 15b, which indicates that the proportion of the blockage area in the flow channel increases, which is related to the fact that the mass flow rate at the near stall point deviates from the design condition further. The dispersion of the AVDR along the entire span is smaller. This indicates that the main flow of OPT2 is more uniform at the near stall condition. Under the actions of both centrifugal force and radial pressure equilibrium, the radial flow migration is weaker.
Figure 15c shows the spanwise distributions of the rotor diffusion factor. The diffusion factors for OPT1 and OPT2 increase from hub to tip. Compared with ORI, the diffusion factor of OPT2 increases within the entire span at the near stall point, but the slope above 50% span increases rapidly, which indicates that the aerodynamic load limitation occurs near the tip region. Wadia [24] points out that the blade near the tip end-wall region does not stall in the way of a two-dimensional cascade, and the pressure distribution near the tip end-wall region is usually not large enough to cause the separation of a two-dimensional airfoil. The stall of ORI also conforms to this feature.
The diffusion factor of OPT1 is the largest at the same height, which indicates that OPT1 has a higher pressure load in the mainstream region. The aspect ratio of OPT1 is minimum and the solidity is maximum below 80% span. The solidity of OPT1 above 80% span is lower than that of OPT2, but the diffusion factor at the same height is even larger than that of OPT2. This indicates that the tip region of OPT1 is much closer to the aerodynamic load limit, and the higher tip load level set by the radial pressure equilibrium at a smaller mass flow rate cannot be obtained. Therefore, OPT1 is still tip-sensitive. The flow field near the blade tip end-wall region is usually established by the mainstream. Therefore, combined with the load requirements set by the radial pressure equilibrium on each blade section, the reasonable spanwise distributions and matching of solidity and aspect ratio can maximize the rotor aerodynamic performance.

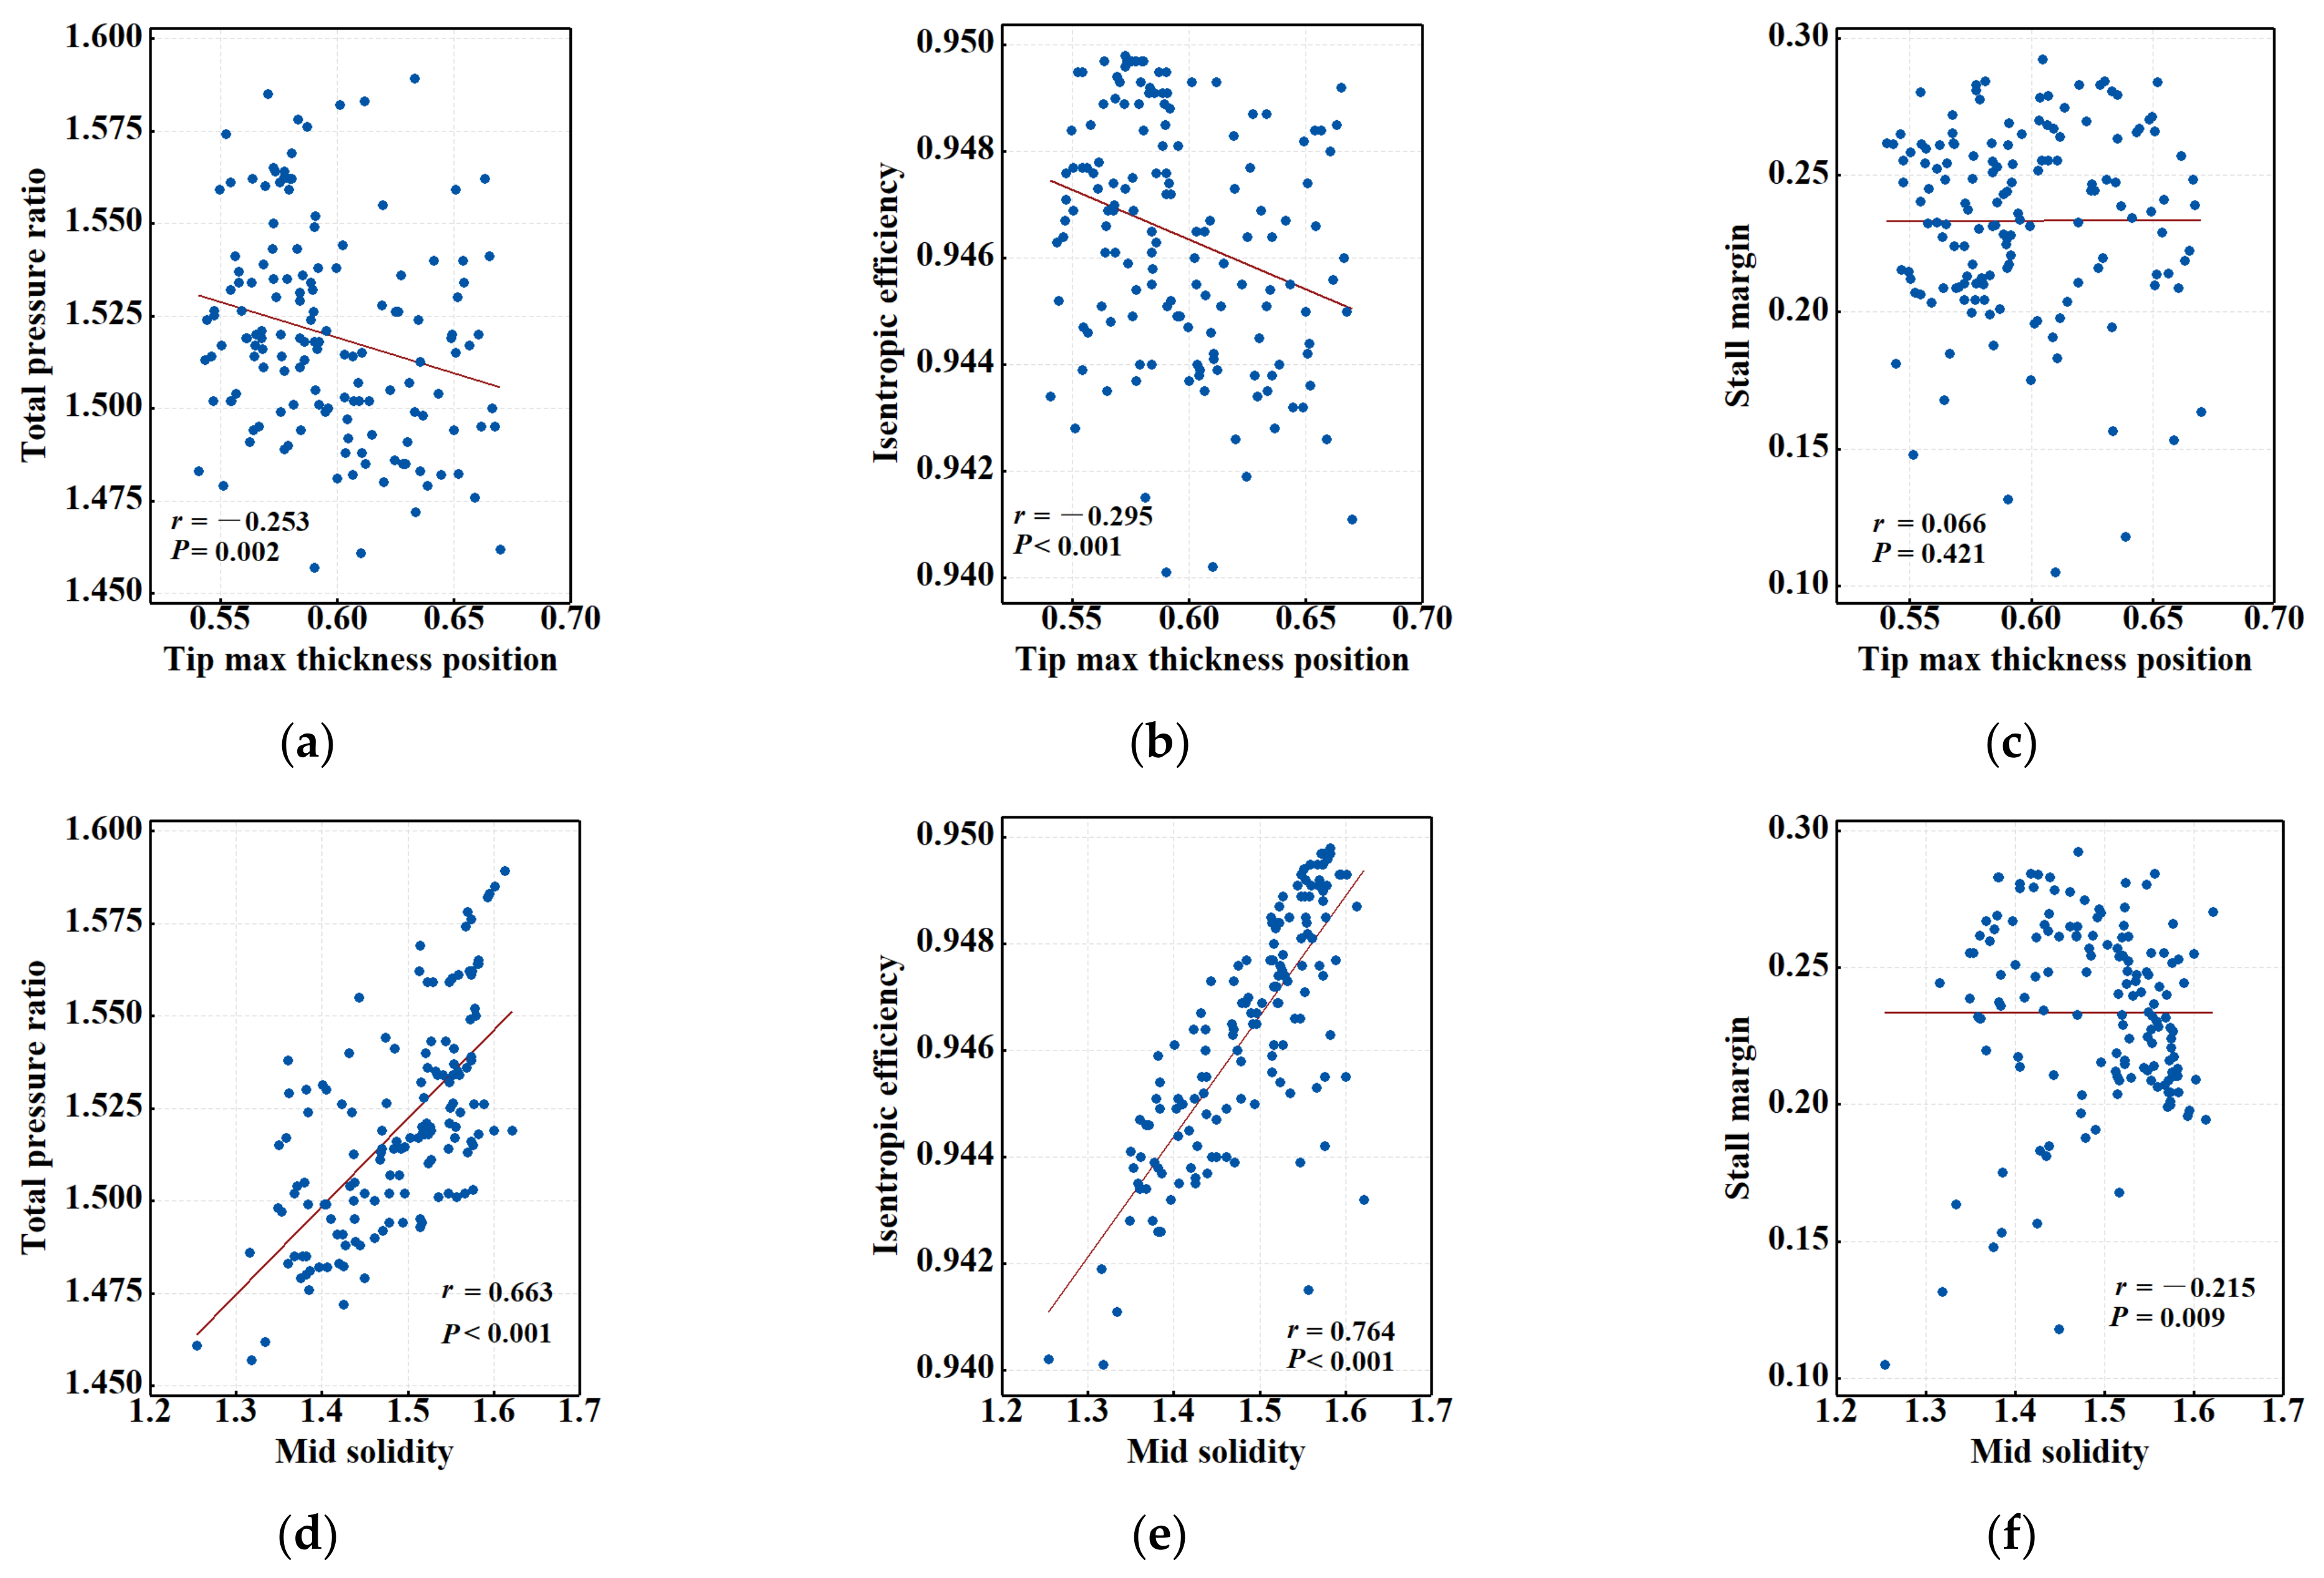
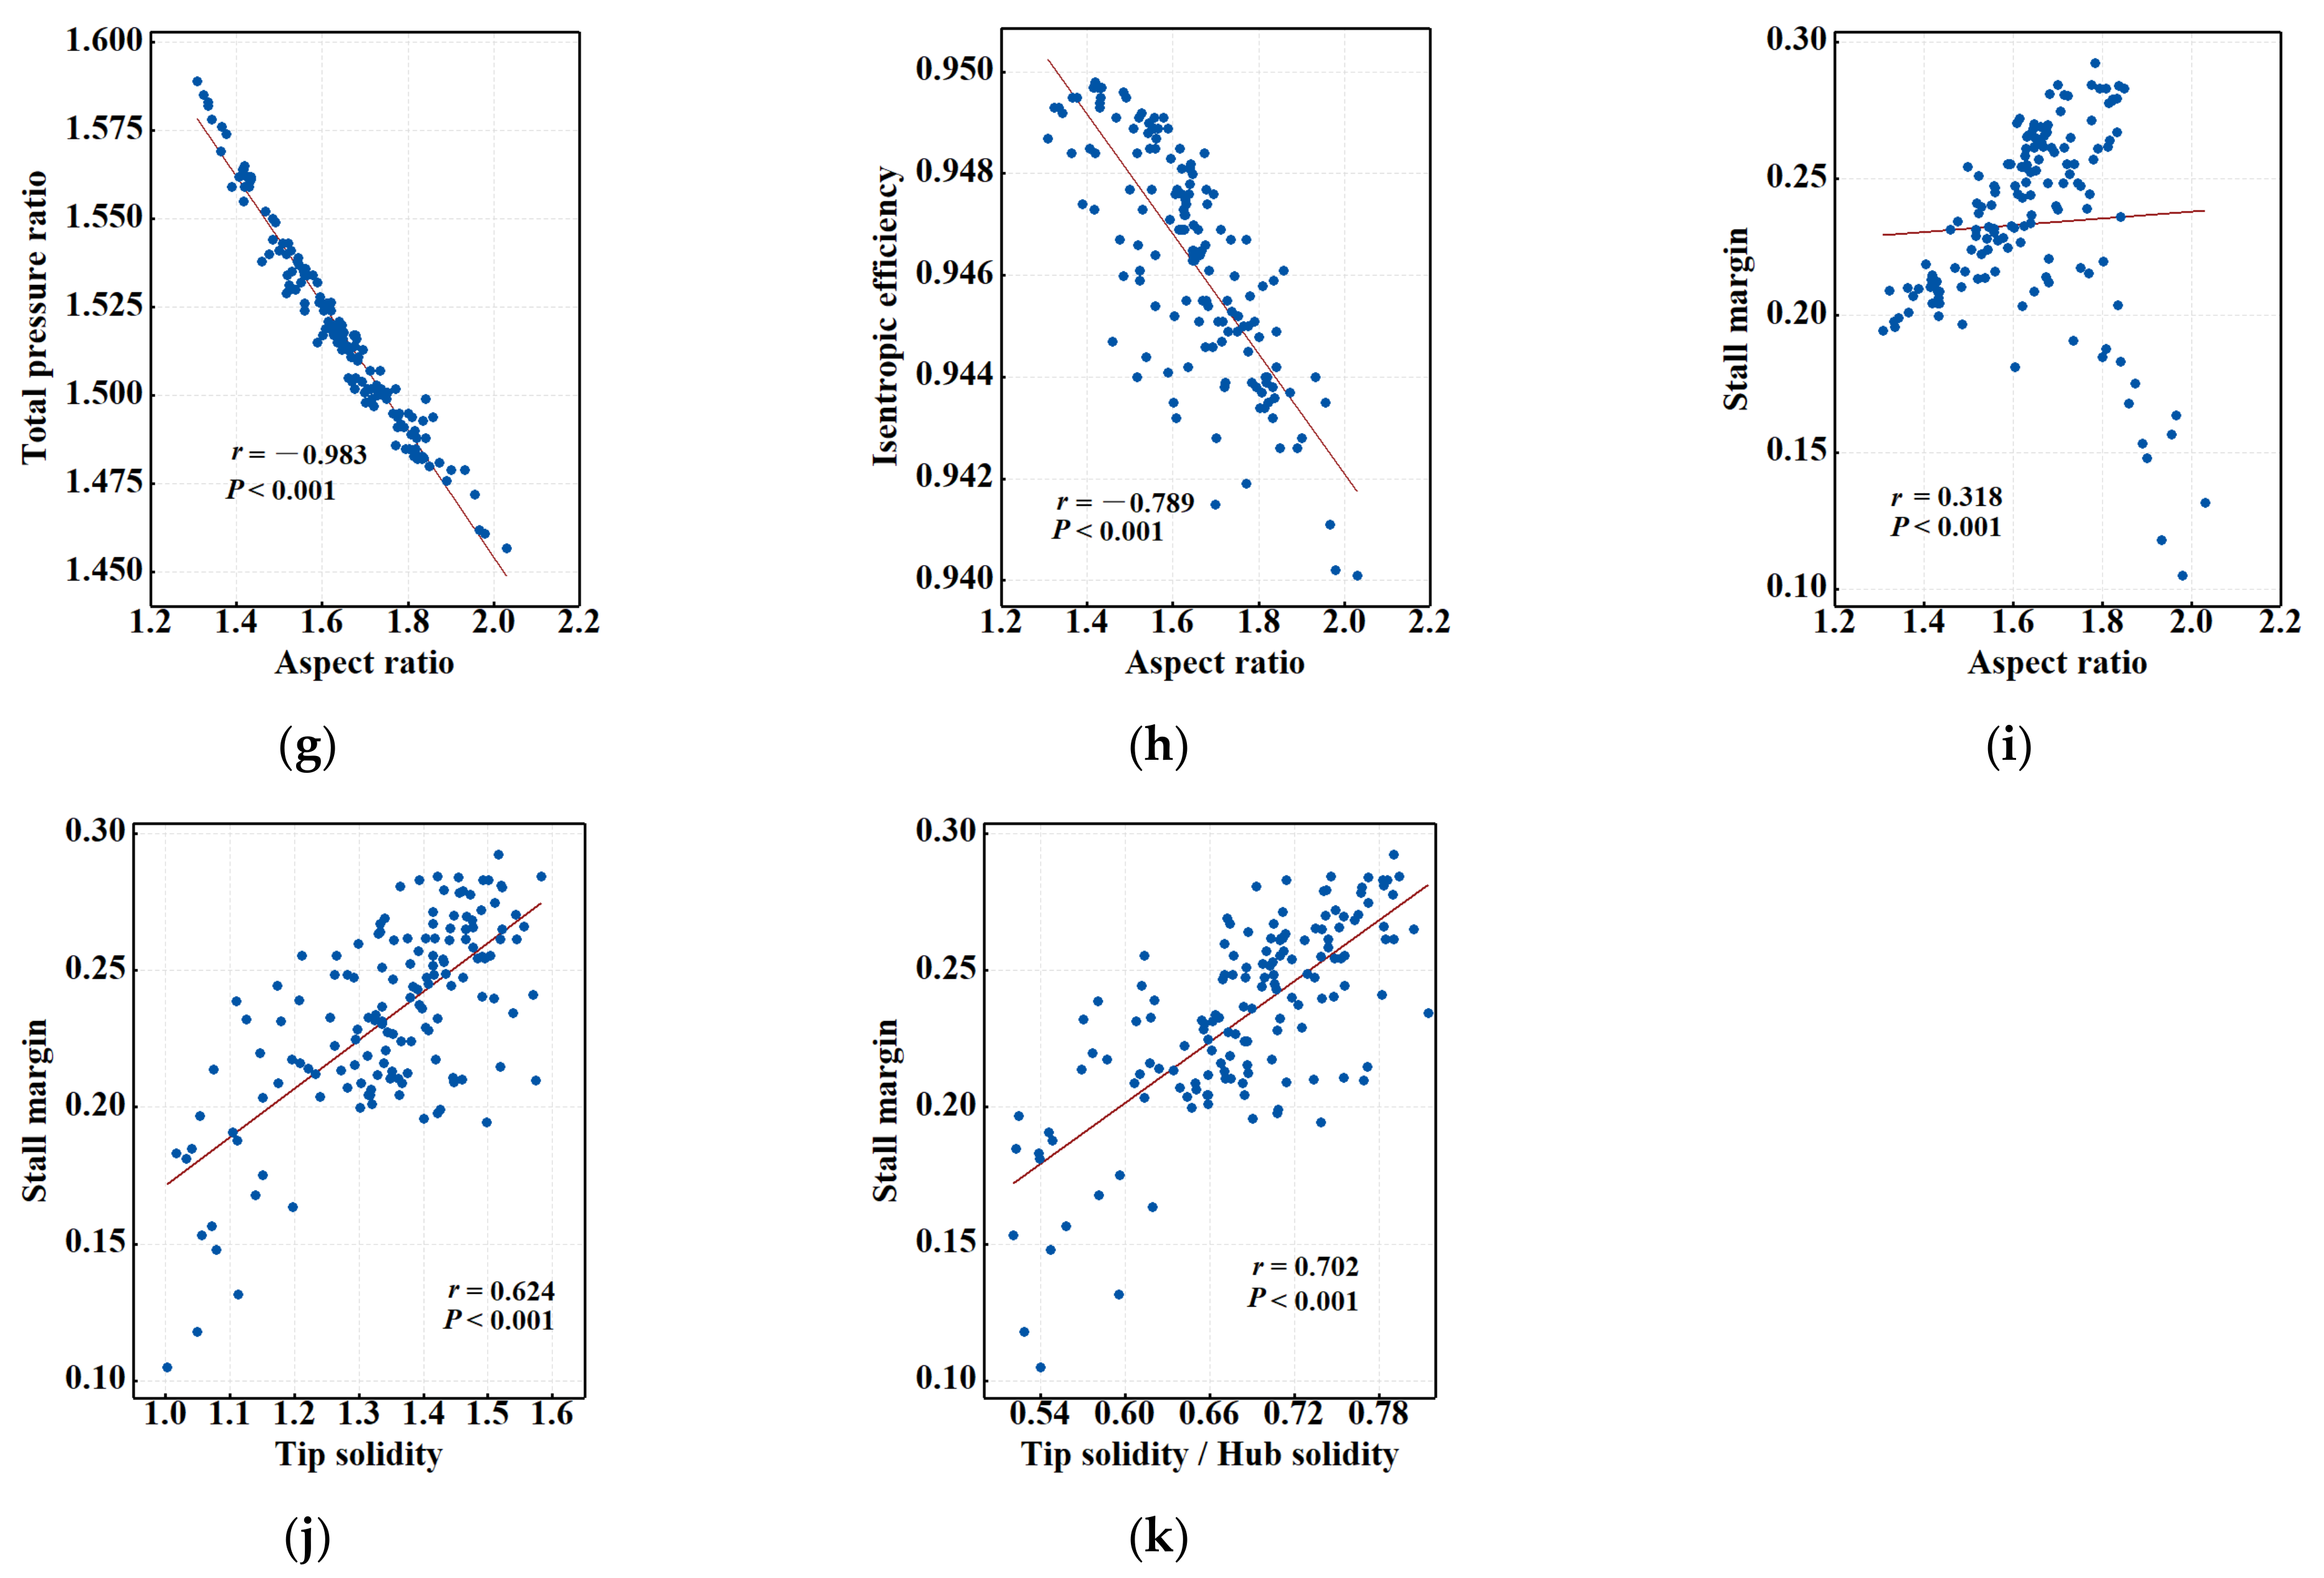
4.2. Parameter Sensitivity Analysis

In order to further determine the influence of the spanwise distributions of solidity and aspect ratio on the performance of the transonic compressor rotor, and to obtain the variation law of compressor performance with design parameters, correlation analyses of aspect ratio and solidity at the key span positions (such as the hub, mid, and tip) with total pressure ratio, isentropic efficiency, and stall margin were performed. Spearman’s rank correlation coefficient was used to evaluate the correlation between two variables. The calculation formula of Spearman’s rank correlation coefficient is shown as Equation (4). The range of Spearman’s rank correlation coefficient is [−1, 1]. The closer the absolute value is to 1, the stronger the correlation is. xi and yi are the ranks of two variables of sample points, x ¯ and y ¯ are the averaged values corresponding to the ranks of two variables, and n is the number of samples. In addition, the p value represents the significance level.
r = i = 1 n ( x i x ¯ ) ( y i y ¯ ) i = 1 n ( x i x ¯ ) 2 i = 1 n ( y i y ¯ ) 2
Since the change in the maximum thickness position is more obvious near the blade tip, the correlations between the blade tip maximum thickness position and the total pressure ratio, isentropic efficiency, and stall margin were analyzed, as shown in Figure 16. The correlation coefficients between the maximum thickness position and the total pressure ratio, isentropic efficiency, and stall margin are low. This indicates that the maximum thickness position based on the blade parameterization of superimposing thickness on the suction surface has no significant influence on the aerodynamic performance of this transonic compressor rotor.
The results of correlation analysis between aspect ratio, solidity, and aerodynamic performance parameters of the rotor are shown in Figure 16. Here, the aspect ratio is the averaged value along the blade span. Under the current constraints, the aspect ratio has a more significant effect on the total pressure ratio than the solidity, and the total pressure ratio has a strong negative correlation with the aspect ratio. The p value is within the range of 0.001, and the correlation coefficient is −0.983. Therefore, when considering the total pressure ratio at design condition, the absolute chord length represented by the aspect ratio is more important. The isentropic efficiency has a significant positive correlation with mid solidity, with a correlation coefficient of 0.764, while it has a significant negative correlation with the aspect ratio, with a correlation coefficient of −0.789. Therefore, increasing solidity and decreasing aspect ratio at the same time is more conducive to improving the isentropic efficiency with the increase in rotor load. The reason for this can be found from the flow field analysis in Section 4.1. Compared with the solidity, the aspect ratio is a quantity that does not reflect the number of blades and is mainly related with the absolute chord length. The correlation coefficients between the stall margin and the mid solidity and aspect ratio are low. This indicates that mid solidity and aspect ratio have no significant influence on the stall margin of this transonic compressor rotor. However, the ratio of the blade tip solidity to the hub solidity (equivalent to the ratio of the blade tip chord length to the hub chord length) has a significant positive correlation with the stall margin. This parameter reflects the stall margin reserved for the high pressure load near the blade tip region due to the radial pressure equilibrium. This value should be related to the pressure load determined by the main flow. When the ratio of the tip solidity to the hub solidity exceeds 0.65, the rotor stall margin can exceed 19%. Due to the small variation range of hub solidity, there is also a significant positive correlation between tip solidity and stall margin, but the correlation coefficient is smaller.

5. Conclusions

The influence of solidity and aspect ratio on the performance of the inlet stage transonic rotor of an F-class heavy-duty gas turbine compressor was studied. An in-house three-dimensional blade optimization design platform based on the Kriging surrogate optimization algorithm was built. The blade parameterization method based on superimposing thickness on the suction surface and the NSGA-II multi-objective optimization method were adopted. The number of blades, solidity, and maximum thickness position were taken as variables. Under the constraints that the design mass flow rate remains constant and the total pressure ratio at the design mass flow point does not decrease, the optimization was conducted to improve the stall margin and isentropic efficiency at the design mass flow rate. The following conclusions can be made:
(1)
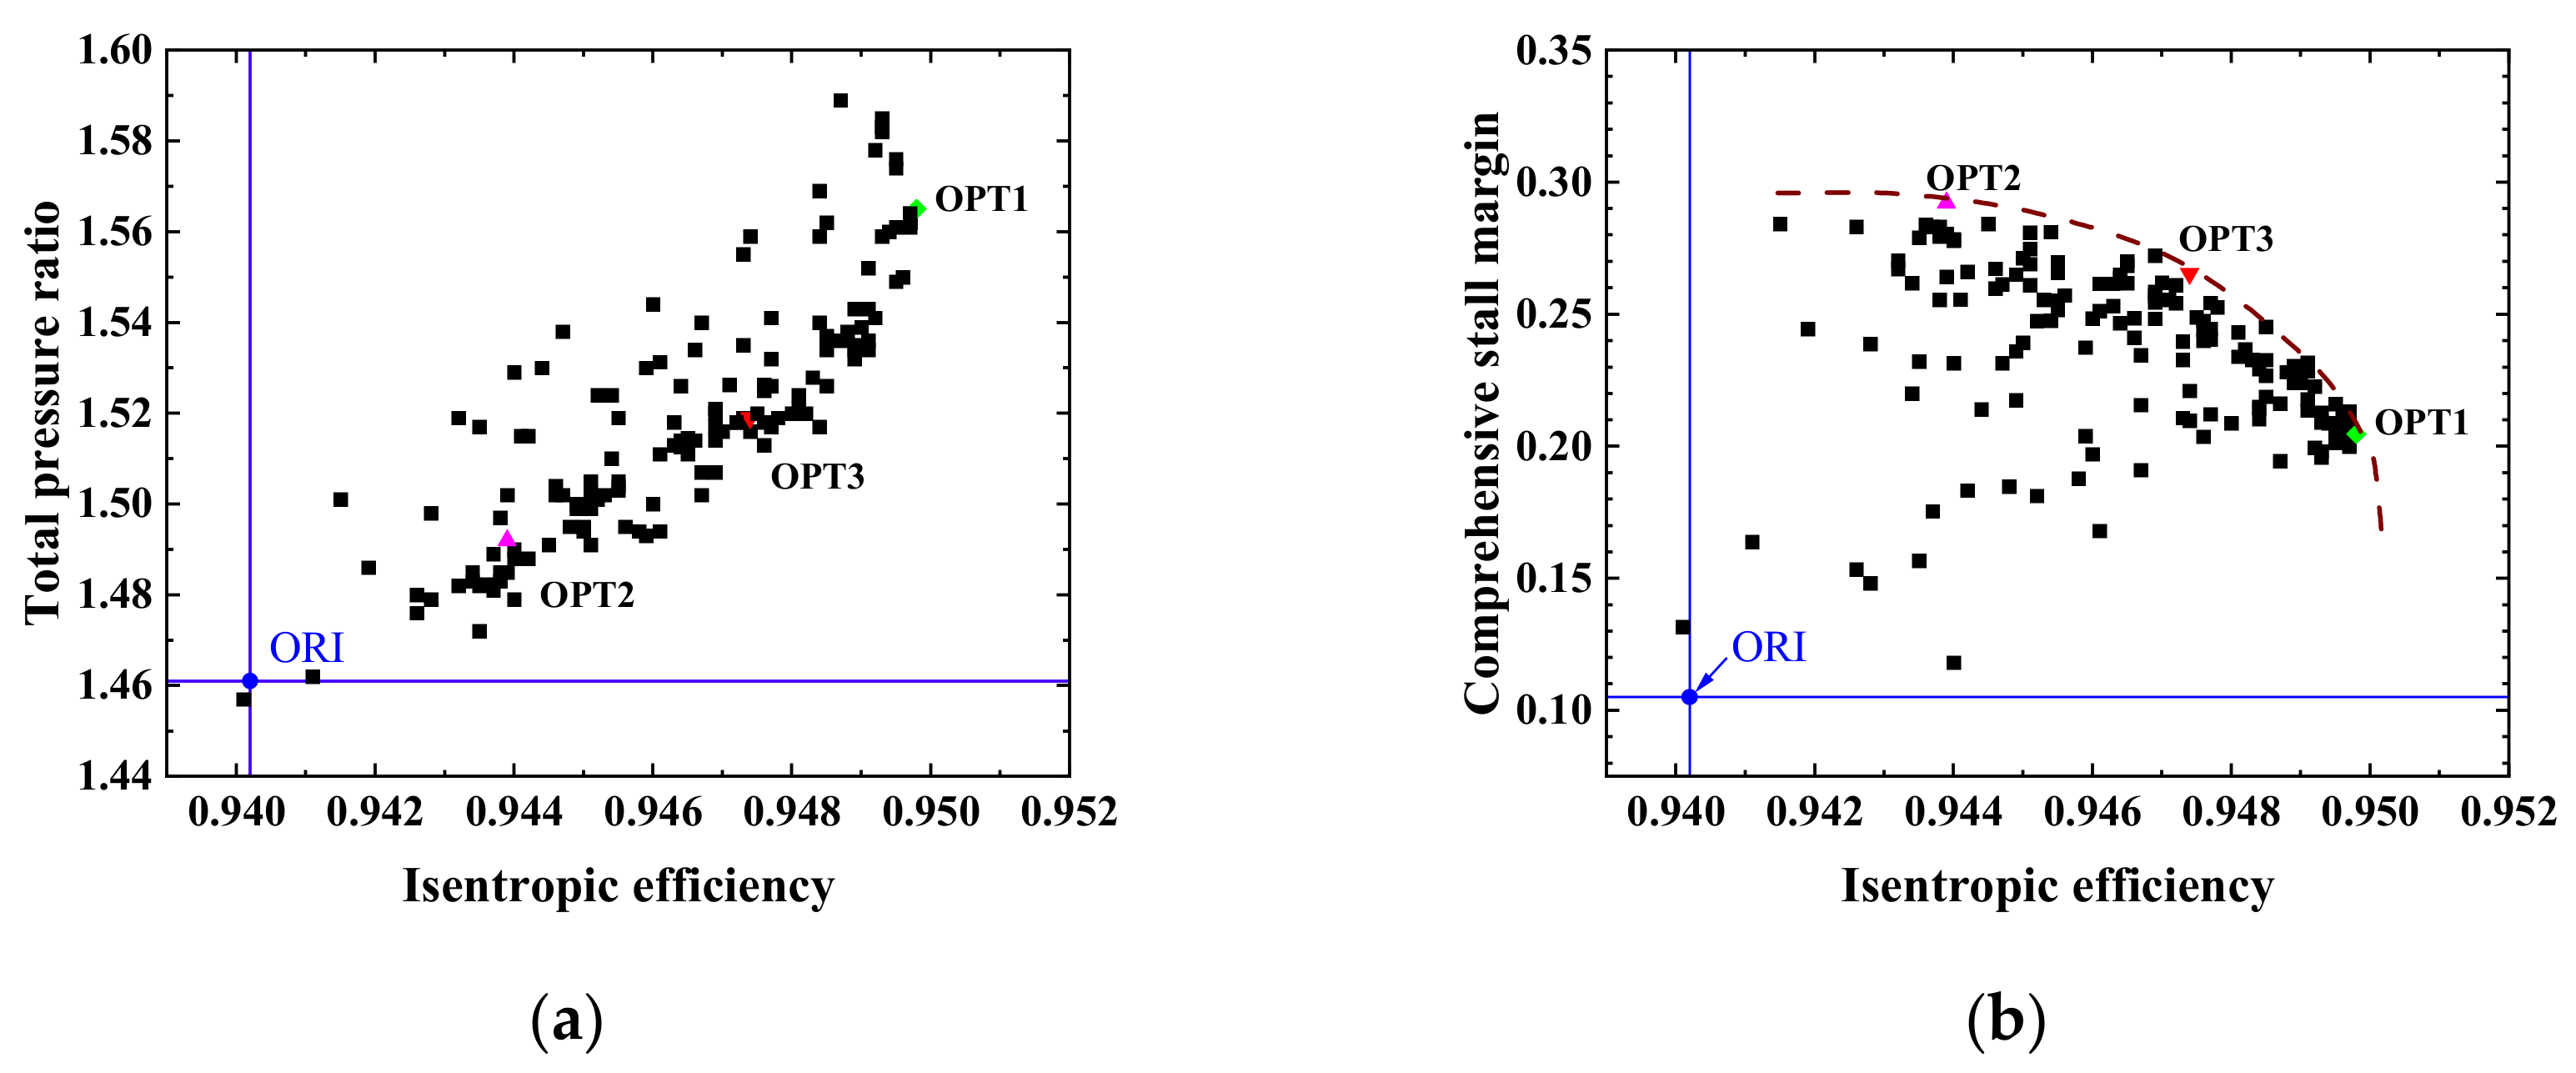
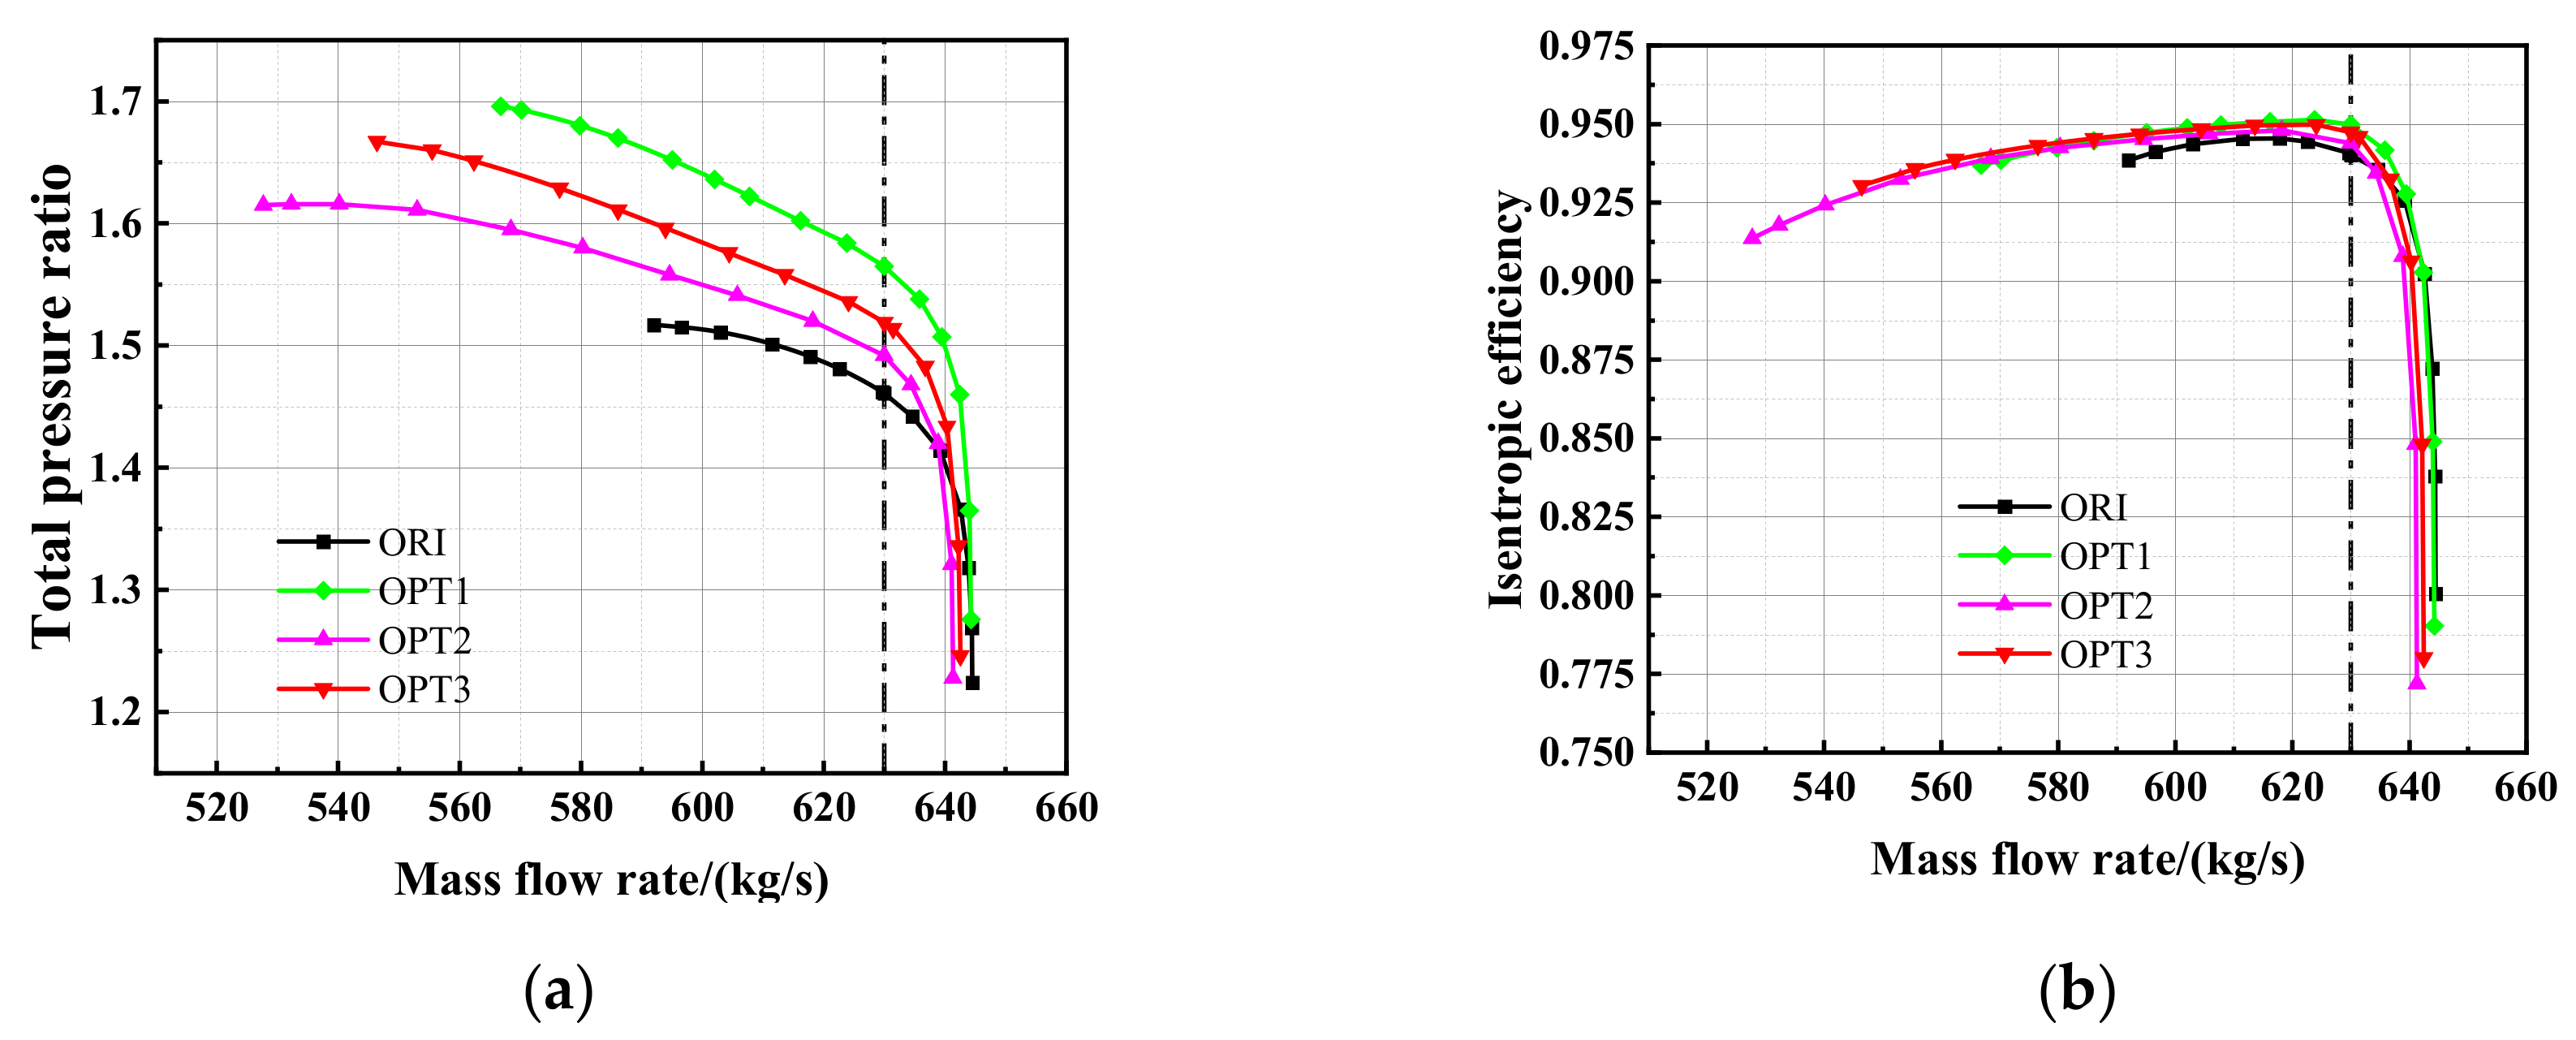
The blade optimization method based on superimposing thickness on the suction surface and the Kriging surrogate optimization method can be successfully applied to the optimization of a transonic compressor rotor. Reasonable spanwise distributions of solidity and aspect ratio can significantly improve rotor performance. For OPT1, with a maximum isentropic efficiency improvement of 0.96%, the stall margin is increased by 10%, and the total pressure ratio at the design mass flow rate is increased from 1.461 to 1.565. For OPT2, with a maximum stall margin improvement of 18.7%, the isentropic efficiency is increased by 0.37%, and the total pressure ratio at the design mass flow point is increased from 1.461 to 1.492.
(2)
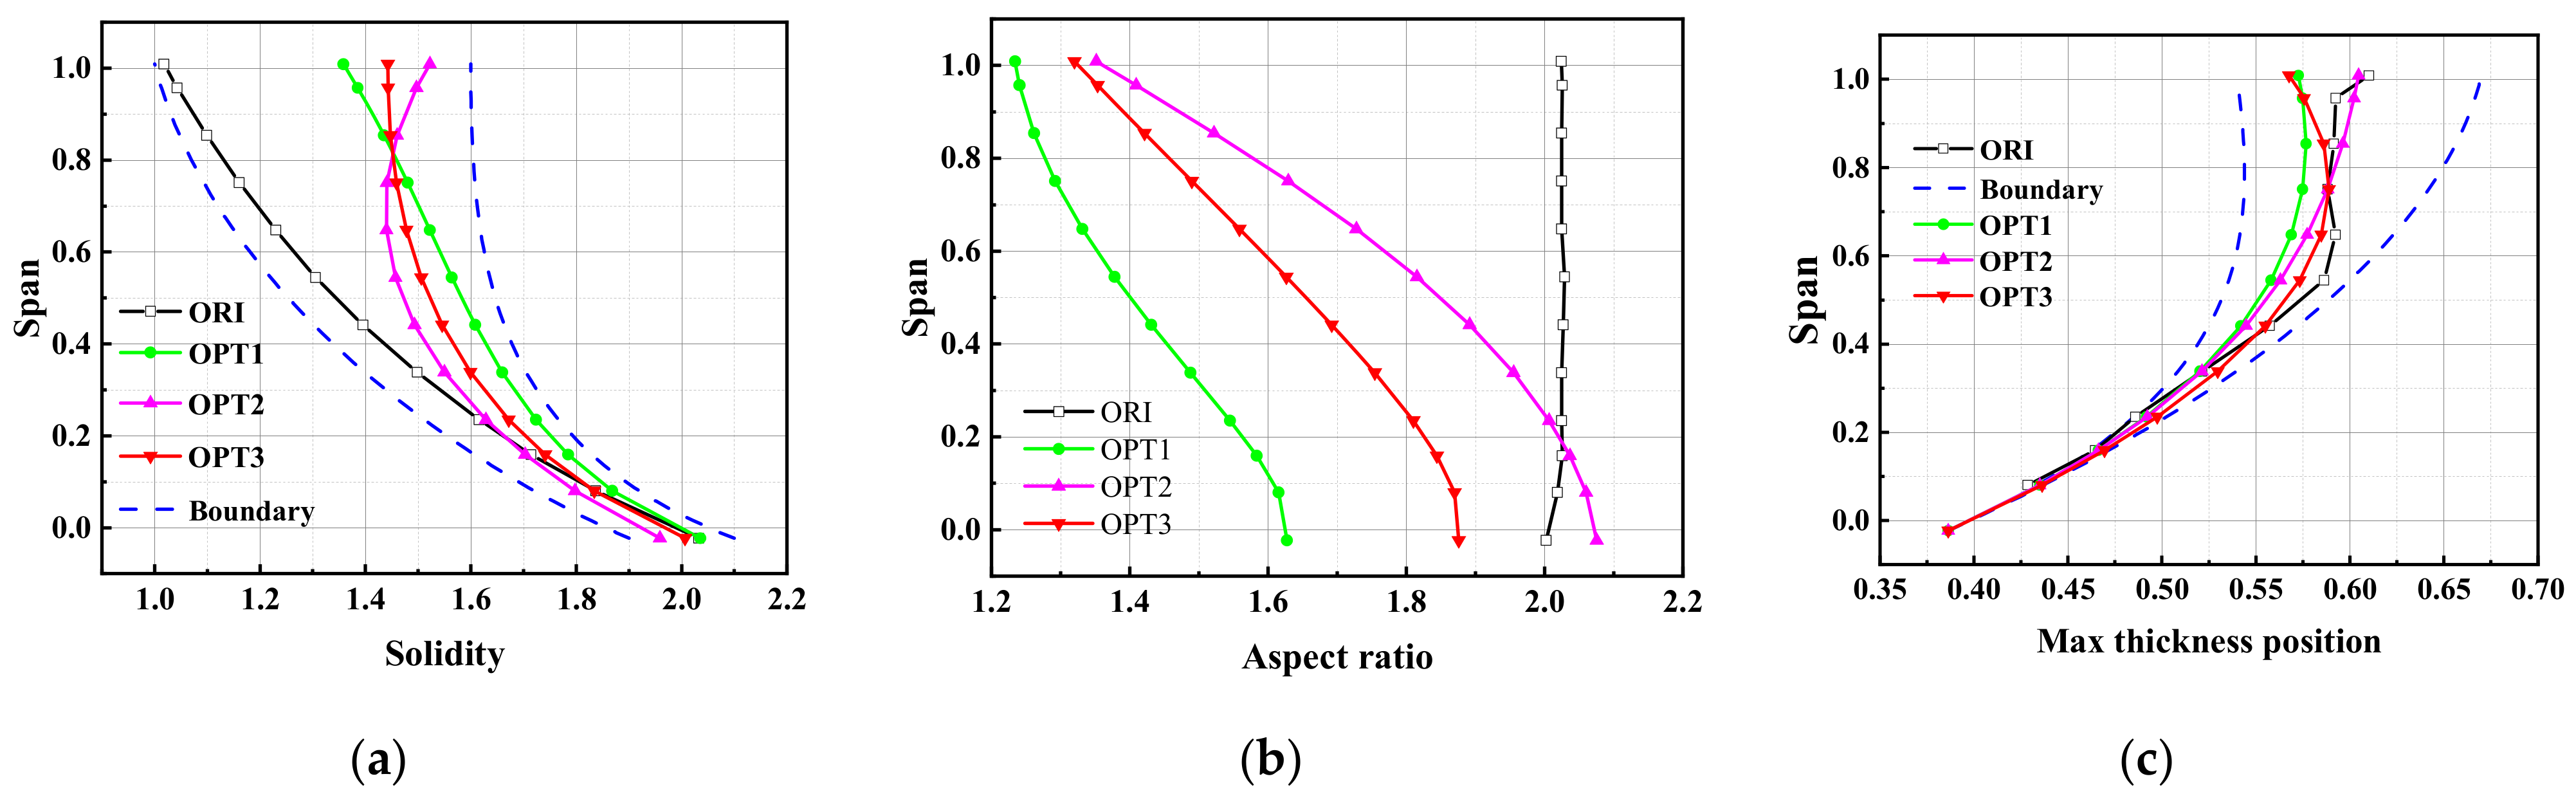
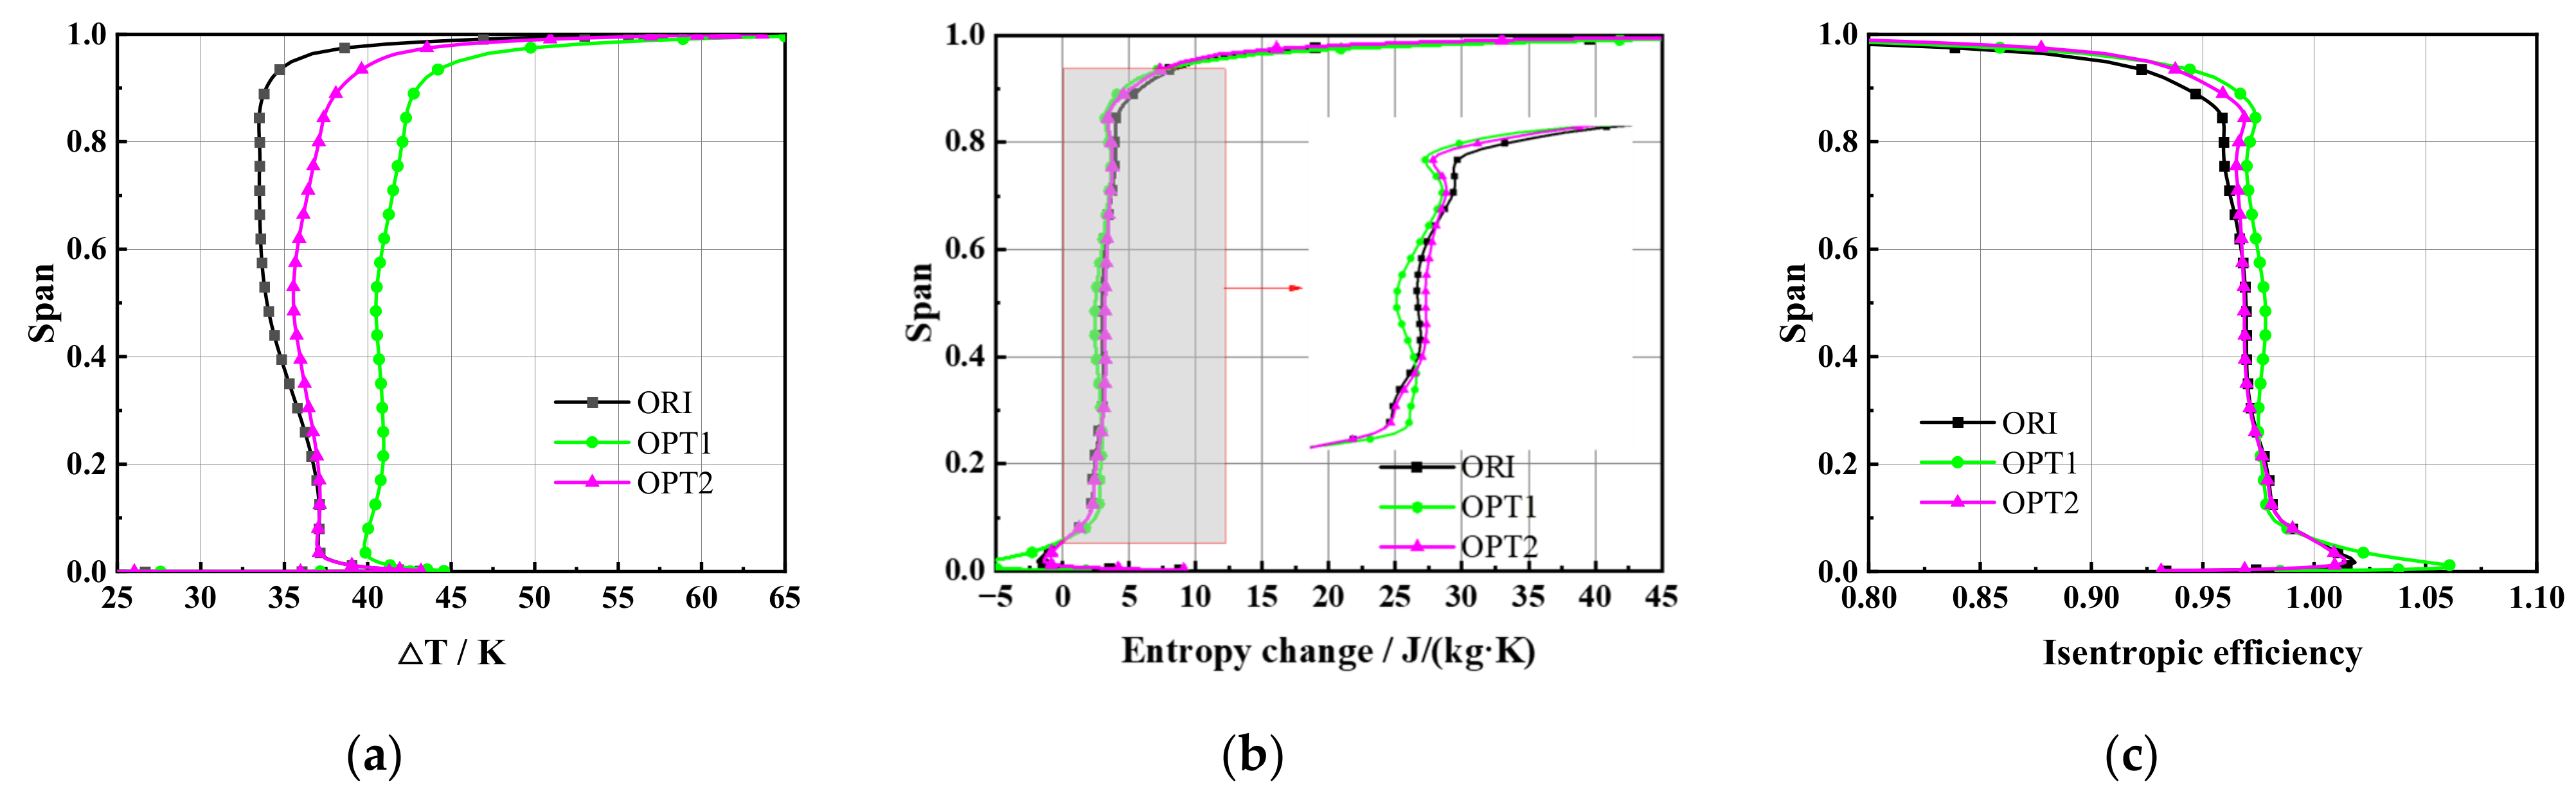
An increase in solidity can significantly reduce the shock wave intensity and suppress the boundary layer separation induced by a shock wave. The radial migration of low-energy fluid under the actions of centrifugal force and radial pressure equilibrium after a shock wave can be significantly weakened, while the boundary layer separation loss during flow diffusion under the adverse pressure gradient may be increased. The low aspect ratio design can effectively decrease the boundary layer separation loss during flow diffusion. Therefore, reducing the number of blades and increasing the solidity at the same time can reduce the shock wave loss and the boundary layer separation loss, and the isentropic efficiency of the compressor rotor may be improved. However, the design of a large solidity and a small aspect ratio cannot improve the flow field near the hub region, and the absolute loss is positively correlated with chord length.
(3)
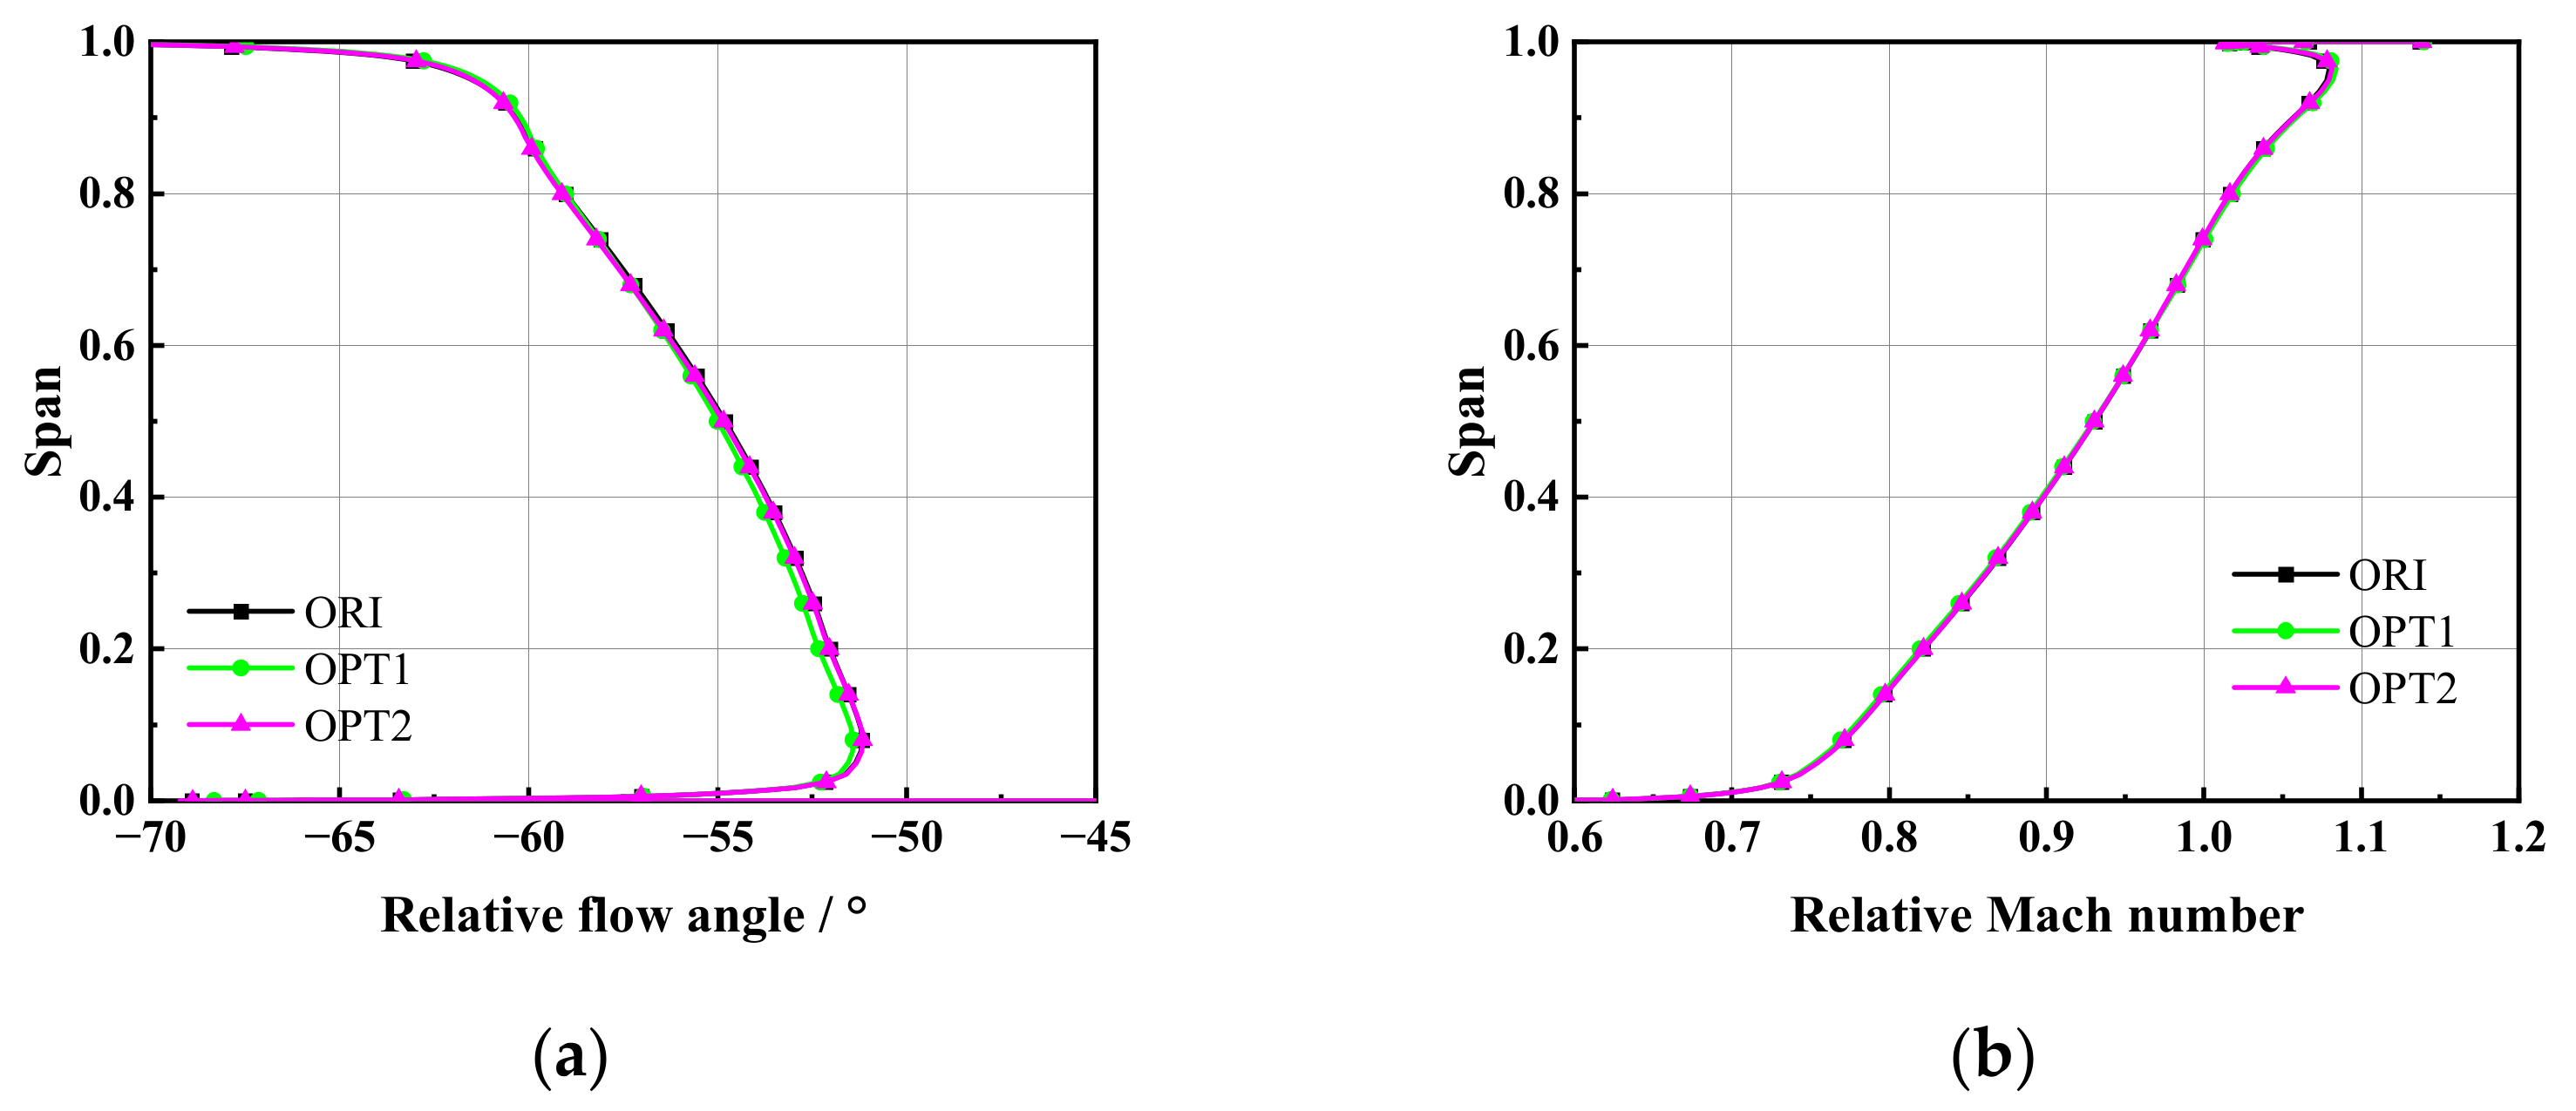
The main reason for the stall margin of an inlet stage transonic rotor is the radial matching of the limiting load of each blade section. The spanwise distributions of solidity and aspect ratio can significantly affect the load level of each blade section. With the load requirements set by the radial pressure equilibrium, the proper matching of spanwise distributions of solidity and aspect ratio can contribute to stall margin improvement.
(4)
There is a significant negative correlation between aspect ratio and total pressure ratio. To improve the total pressure ratio at the design mass flow point, the chord length represented by the aspect ratio is an important variable. There is a significant positive correlation between the ratio of the blade tip solidity to the hub solidity and the stall margin. To ensure that the transonic rotor has a sufficient stall margin, the ratio of the blade tip solidity to the hub solidity should not be less than 0.65.

Author Contributions

Conceptualization, S.L. and S.G.; methodology, S.L., Y.J. and S.G.; software, S.L., Y.J. and X.L.; validation, S.L.; formal analysis, S.L., Y.J. and S.G.; investigation, S.L. and S.G.; resources, S.L. and S.G.; data curation, S.L.; writing—original draft preparation, S.L.; writing—review and editing, S.L. and S.G.; visualization, S.L. and S.G.; supervision, S.G. and H.Z.; project administration, S.G. and H.Z.; funding acquisition, S.G. and H.Z. All authors have read and agreed to the published version of the manuscript.

Funding

This research was funded by the National Science and Technology Major Project of China, grant number 2017-II-0007-0021.

Data Availability Statement

Not applicable.

Conflicts of Interest

The authors declare no conflict of interest. The funders had no role in the design of the study, in the collection, analyses, or interpretation of data, in the writing of the manuscript, or in the decision to publish the results.

References

  1. Hah, C.; Wennerstrom, A.J. Three-Dimensional Flowfields Inside a Transonic Compressor with Swept Blades. J. Turbomach. 1991, 113, 241–250. [Google Scholar] [CrossRef]
  2. Lieblein, S.; Schwenk, F.C.; Broderick, R.L. Diffusion Factor for Estimating Losses and Limiting Blade Loadings in Axial-Flow-Compressor Blade Elements; NACA Research Memorandum, Lewis Flight Propulsion Laboratory: Cleveland, OH, USA, 1953.
  3. Chen, M.Z. Development of Fan/Compressor Techniques and Suggestions on Further Researches. J. Aerosp. Power 2002, 17, 1–15. [Google Scholar] [CrossRef]
  4. Obrecht, T. HP Compressor Preliminary Design; von Karman Institute for Fluid Dynamics: Waterloosesteenweg, Belgium, 2013. [Google Scholar]
  5. Smith, L.H. Axial Compressor Aerodesign Evolution at General Electric. J. Turbomach. 2002, 124, 321–330. [Google Scholar] [CrossRef]
  6. Law, C.H.; Wadia, A.R. Low Aspect Ratio Transonic Rotors: Part 1—Baseline Design and Performance. J. Turbomach. 1993, 115, 218–225. [Google Scholar] [CrossRef]
  7. Broichhausen, K.D.; Ziegler, K.U. Supersonic and Transonic Compressors: Past, Status and Technology Trends. In Proceedings of the Volume 6: Turbo Expo 2005, Parts A and B, ASMEDC, Reno, NV, USA, 1 January 2005; pp. 63–74. [Google Scholar]
  8. Wennerstrom, A.J. Low Aspect Ratio Axial Flow Compressors: Why and What It Means. J. Turbomach. 1989, 111, 357–365. [Google Scholar] [CrossRef]
  9. Ward, S.A.; Johnson-Hirt, M. SGT-400 Industrial Gas Turbine Power Enhancement to 15 MW Design and Product Validation. In Proceedings of the ASME 2010 Power Conference, ASMEDC, Chicago, IL, USA, 1 January 2010; pp. 267–276. [Google Scholar]
  10. Wadia, A.R.; Copenhaver, W.W. An Investigation of the Effect of Cascade Area Ratios on Transonic Compressor Performance. J. Turbomach. 1996, 118, 760–770. [Google Scholar] [CrossRef]
  11. Yamagami, M.; Kodama, H.; Kato, D.; Tsuchiya, N.; Horiguchi, Y.; Kazawa, J. Unsteady Flow Effects in a High-Speed Multistage Axial Compressor. In Proceedings of the Volume 7: Turbomachinery, Parts A and B, ASMEDC, Orlando, FL, USA, 1 January 2009; pp. 1651–1664. [Google Scholar]
  12. Cumpsty, N.A. Some Lessons Learned. J. Turbomach. 2010, 132, 041018. [Google Scholar] [CrossRef]
  13. Shabbir, A.; Celestina, M.L.; Adamczyk, J.J.; Strazisar, A.J. The Effect of Hub Leakage Flow on Two High Speed Axial Flow Compressor Rotors. In Proceedings of the ASME 1997 International Gas Turbine and Aeroengine Congress and Exhibition, Orlando, FL, USA, 2–5 June 1997; p. V001T03A053. [Google Scholar]
  14. Chen, N.X.; Zhang, H.W.; Xu, Y.J.; Huang, W.G. Blade Parameterization and Aerodynamic Design Optimization for a 3D Transonic Compressor Rotor. J. Therm. Sci. 2007, 16, 105–114. [Google Scholar] [CrossRef]
  15. Okui, H.; Verstraete, T.; Van den Braembussche, R.A.; Alsalihi, Z. Three-Dimensional Design and Optimization of a Transonic Rotor in Axial Flow Compressors. J. Turbomach. 2013, 135, 031009. [Google Scholar] [CrossRef]
  16. Yuan, H.; Wang, M.; Zhang, J.; Zhang, Y.; Lu, X. Integrated Optimization of a High-Lift Low-Pressure Turbine Cascade Based on Dynamic Support Vector Regression. Aerosp. Sci. Technol. 2022, 131, 107986. [Google Scholar] [CrossRef]
  17. Zhou, Z.; Huang, J.T.; Huang, Y.; Liu, G.; Chen, Z.B.; Wang, Y.T.; Jiang, X. CFD technology in aeronautic engineering field: Ap-plications, challenges and development. Acta Aeronaut. Astronaut. Sin. 2017, 38, 6–30. [Google Scholar] [CrossRef]
  18. Semlitsch, B.; Huscava, A. Shape Optimisation of Turbomachinery Components. In Proceedings of the 8th European Congress on Computational Methods in Applied Sciences and Engineering, Oslo, Norway, 5–9 June 2022; pp. 1–8. [Google Scholar]
  19. Gao, Z.H.; Wang, C. Aerodynamic shape design methods for aircraft: Status and trends. Acta Aerodyn. Sin. 2017, 35, 516–528. [Google Scholar] [CrossRef]
  20. Han, Z.H. Kriging surrogate model and its application to design optimization. Acta Aeronaut. Astronaut. Sin. 2016, 37, 3197–3225. [Google Scholar] [CrossRef]
  21. Han, Z.H.; Xu, C.Z.; Qiao, J.L.; Liu, F.; Chi, J.B.; Meng, G.Y.; Zhang, K.S.; Song, W.P. Recent progress of efficient global aerodynamic shape optimization using surrogate-based approach. Acta Aeronaut. Astronaut. Sin. 2020, 41, 30–70. [Google Scholar] [CrossRef]
  22. Han, Z.H.; Zhang, K.S. Surrogate-Based Optimization. In Real-World Applications of Genetic Algorithms; Roeva, O., Ed.; IntechOpen: London, UK, 2012; pp. 343–362. [Google Scholar]
  23. Jones, D.R.; Schonlau, M.; Welch, W.J. Efficient Global Optimization of Expensive Black-Box Functions. J. Glob. Optim. 1998, 13, 455–492. [Google Scholar] [CrossRef]
  24. Wadia, A.R.; Beacher, B.F. Three-Dimensional Relief in Turbomachinery Blading. J. Turbomach. 1990, 112, 587–596. [Google Scholar] [CrossRef]
Figure 1. Cubic Bezier curve and its control points.
Machines 11 00082 g001
Figure 2. Schematic diagram of thickness distribution.
Machines 11 00082 g002
Figure 3. Optimization variable definitions and variation ranges: (a) solidity; (b) maximum thickness position.
Machines 11 00082 g003
Figure 4. Performance lines of the reduced-scale 1.5-stage transonic compressor: (a) total pressure ratio; (b) torque/isentropic efficiency.
Machines 11 00082 g004
Figure 5. Spanwise distributions of total temperature ratio and total pressure ratio: (a) total temperature ratio; (b) total pressure ratio.
Machines 11 00082 g005
Figure 6. Computational domain.
Machines 11 00082 g006
Figure 7. Aerodynamic optimization flow chart.
Machines 11 00082 g007
Figure 8. Distributions of optimized sample points and Pareto front: (a) isentropic efficiency—total pressure ratio; (b) isentropic efficiency—comprehensive stall margin.
Machines 11 00082 g008
Figure 9. Compressor performance maps: (a) total pressure ratio characteristic line; (b) isentropic efficiency characteristic line.
Machines 11 00082 g009
Figure 10. Spanwise distributions of geometric parameters for optimized samples: (a) solidity; (b) aspect ratio; (c) max thickness position.
Machines 11 00082 g010
Figure 11. Spanwise distributions of the rotor inlet flow angle and Mach number: (a) relative flow angle; (b) relative Mach number.
Machines 11 00082 g011
Figure 12. Spanwise distributions of aerodynamic parameters between rotor inlet and outlet: (a) total temperature increases; (b) entropy change; (c) isentropic efficiency.
Machines 11 00082 g012
Figure 13. Contours of the isentropic Mach number and limiting streamlines on the rotor suction surface: (a) ORI; (b) OPT1; (c) OPT2.
Machines 11 00082 g013
Figure 14. Airfoil geometry and isentropic Mach number on 98% blade span: (a) isentropic Mach number distribution; (b) airfoil geometry and throat position.
Machines 11 00082 g014
Figure 15. Spanwise distributions of the AVDR and diffusion factor for rotors at the near stall point: (a) axial velocity density at the rotor inlet and outlet; (b) AVDR; (c) rotor diffusion factor.
Machines 11 00082 g015
Figure 16. Results of parameter correlation analysis: (a) tip max thickness position and total pressure ratio; (b) tip max thickness position and isentropic efficiency; (c) tip max thickness position and stall margin; (d) mid solidity and total pressure ratio; (e) mid solidity and isentropic efficiency; (f) mid solidity and stall margin; (g) aspect ratio and total pressure ratio; (h) aspect ratio and isentropic efficiency; (i) aspect ratio and stall margin; (j) tip solidity and stall margin; (k) ratio of tip solidity to hub solidity and stall margin.
Machines 11 00082 g016aMachines 11 00082 g016b
Table 1. Specification of the original rotor design.
ParameterValue
Mass flow rate630 kg/s
Flow coefficient0.57
Corrected speed3000 rpm
Tip relative Mach number (Rotor)1.08
Number of blades (IGV/Rotor)51/27
Mid Solidity1.35
Aspect Ratio1.98
Total pressure ratio1.46
Isentropic efficiency94.02%
Comprehensive stall margin10.5%
Table 2. Original parameter values and variation ranges.
VariableOriginal ValueUpper LimitLower Limit
Var12.031.92.1
Var21.581.51.64
Var31.231.11.6
Var41.021.01.6
Var50.600.550.65
Var60.610.540.67
Number of blades272127
Table 3. Performance comparison of optimized samples at design condition.
Number of BladesMean Aspect RatioDesign Mass Flow RateIsentropic EfficiencyStall MarginTotal Pressure Ratio
ORI271.98630 kg/s94.02%10.5%1.461
OPT1221.42630 kg/s94.98%20.5%1.565
OPT2271.78630 kg/s94.39%29.2%1.492
OPT3251.63630 kg/s94.74%26.5%1.519
Disclaimer/Publisher’s Note: The statements, opinions and data contained in all publications are solely those of the individual author(s) and contributor(s) and not of MDPI and/or the editor(s). MDPI and/or the editor(s) disclaim responsibility for any injury to people or property resulting from any ideas, methods, instructions or products referred to in the content.

