Article

Research on Edge Detection Model of Insulators and Defects Based on Improved YOLOv4-tiny

1
School of Electrical Engineering and Automation, Wuhan University, Wuhan 430072, China
2
State Grid Information & Telecommunication Group Co., Ltd., Beijing 102211, China
*
Author to whom correspondence should be addressed.
Machines 2023, 11(1), 122; https://doi.org/10.3390/machines11010122
Submission received: 9 December 2022 / Revised: 28 December 2022 / Accepted: 11 January 2023 / Published: 16 January 2023
(This article belongs to the Section Robotics, Mechatronics and Intelligent Machines)

Abstract

:
Edge computing can avoid the long-distance transmission of massive data and problems with large-scale centralized processing. Hence, defect identification for insulators with object detection models based on deep learning is gradually shifting from cloud servers to edge computing devices. Therefore, we propose a detection model for insulators and defects designed to deploy on edge computing devices. The proposed model is improved on the basis of YOLOv4-tiny, which is suitable for edge computing devices, and the detection accuracy of the model is improved on the premise of maintaining a high detection speed. First, in the neck network, the inverted residual module is introduced to perform feature fusion to improve the positioning ability of the insulators. Then, a high-resolution detection output head is added to the original model to enhance its ability to detect defects. Finally, the prediction boxes are post-processed to incorporate split object boxes for large-scale insulators. In an experimental evaluation, the proposed model achieved an mAP of 96.22% with a detection speed of 10.398 frames per second (FPS) on an edge computing device, which basically meets the requirements of insulator and defect detection scenarios in edge computing devices.

1. Introduction

Insulators play a key role in the electrical insulation and mechanical fixation of overhead transmission lines. They can withstand high voltages for long periods and occasionally encounter natural disasters. Therefore, timely inspection and maintenance are required to ensure the normal operation of insulators [1]. Given that transmission lines are being laid more and more widely, the traditional manual approach to inspecting insulators requires considerable human resources, and the inspection efficiency is low. The use of new line inspection equipment, such as unmanned aerial vehicles (UAV) to collect insulator images, and computer vision algorithms to identify insulators and insulator defects has become a new mode of inspection [2,3].
Early computer vision algorithms were primarily based on using the geometric features of insulators represented in image pixel values to identify insulator defects. These kinds of algorithms firstly highlight the insulator information based on the image processing method and then input the processed image data into the neural network to discriminate the condition of the insulator. Wang et al. [4] extracted edge features based on a wavelet method, and the thickness of ice coating insulators was determined according to the number of pixels between ice edges. Yan et al. [5] detected the water bead edge of insulators based on the Canny operator, and the hydrophobicity of water on insulators was identified with a classification algorithm. Li et al. [6] studied insulator edge detection based on the Canny operator optimized using a two-dimensional maximum entropy threshold, which effectively extracted the edge information of insulator images and improved the accuracy of insulator crack detection. However, the insulator images used in these methods required that the insulator objects occupy a large proportion of images and are poorly applicable to UAV aerial images with a large number of objects and diverse scales; therefore, the application of the methods described above remains relatively limited in practice.
Deep learning object detection algorithms take the complete image as input, carry out image feature extraction and object prediction through a convolutional neural network (CNN) [7], and can output the position of insulators and defects in the image, which is very easy for transmission line operation and maintenance personnel to discriminate the condition of insulators. Deep learning object detection algorithms are more suitable for insulator and defect detection scenarios with many small-scale objects and complex backgrounds; therefore, research on using these methods has been widely conducted in recent years. Deep learning object detection algorithms can be largely divided into two categories. The first includes two-stage object detection algorithms represented by faster region convolutional neural network (Faster R-CNN) [8], which propose suggestion boxes through a region proposal network in the first stage and obtain the object detection results based on suggestion boxes in the second stage. The second includes single-stage object detection algorithms such as single-shot multibox detector (SSD) [9] and you only look once (YOLO) [10,11,12,13], which omit the step of proposing suggestion boxes and predict object box results based on anchors alone. The detection speed of single-stage object algorithms is generally higher than that of two-stage object algorithms. These algorithms [14,15,16] have been adopted to study the detection of insulators and defects, and satisfactory detection results were obtained through adaptive adjustment of the detection models.
Edge computing is a method of processing data near the source. It was first proposed by Akamai in 1998 to solve the problem of network congestion [17]. In 2016, Shi et al. [18] provided a widely recognized definition of edge computing as referring to the enabling technologies allowing computation to be performed at the edge of the network on downstream data on behalf of cloud services and upstream data on behalf of Internet of Things (IoT) services. Because edge computing has the advantages of avoiding large-scale data transmission and centralized processing, image data processing is gradually shifting from cloud servers to edge computing devices [17,19]. However, owing to the limited computing and storage resources of edge computing devices, they cannot implement detection models with large numbers of parameters and high computational complexity. Hence, higher requirements for lightweight operation have been proposed for detection models [20]. The detection accuracy of lightweight detection models generally decreases compared to the more computationally intensive methods. Thus, it is important to obtain a detection model with both accuracy and rapidity on edge computing devices.
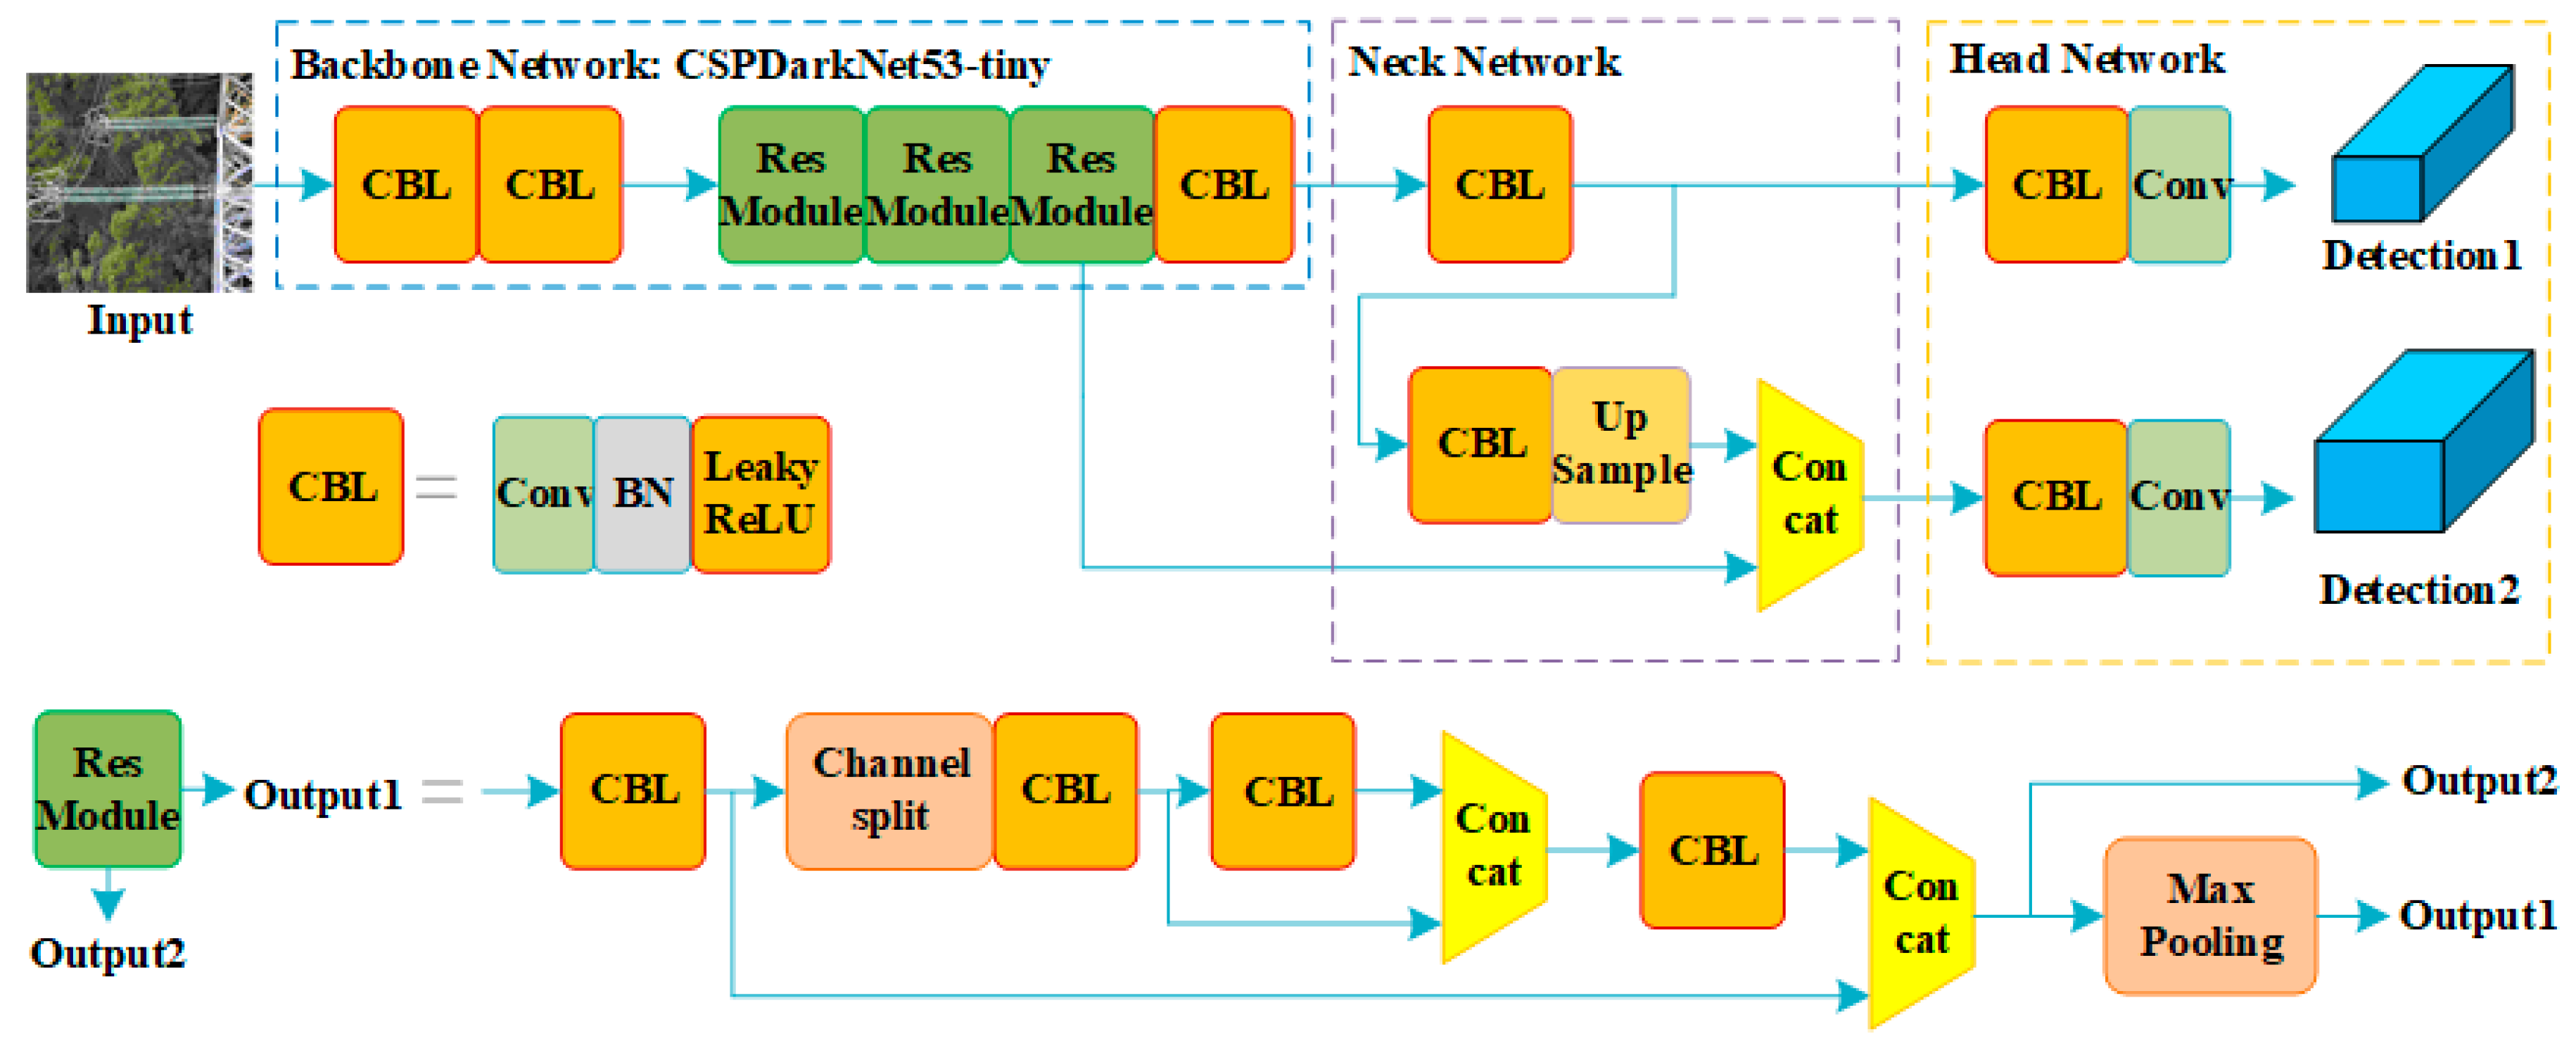
YOLOv4-tiny [21] is a representative lightweight object-detection model in the YOLO series. It performs detection relatively rapidly on edge computing devices, but its detection accuracy is generally lower than that of heavier object detection models. In this study, we propose an improved detection model based on YOLOv4-tiny designed to maintain high detection speed on edge computing devices to improve detection accuracy. In order to obtain the insulator and defect detection model with accuracy and rapidity on the edge computing device, we mainly improved YOLOv4-tiny in terms of the following three aspects:
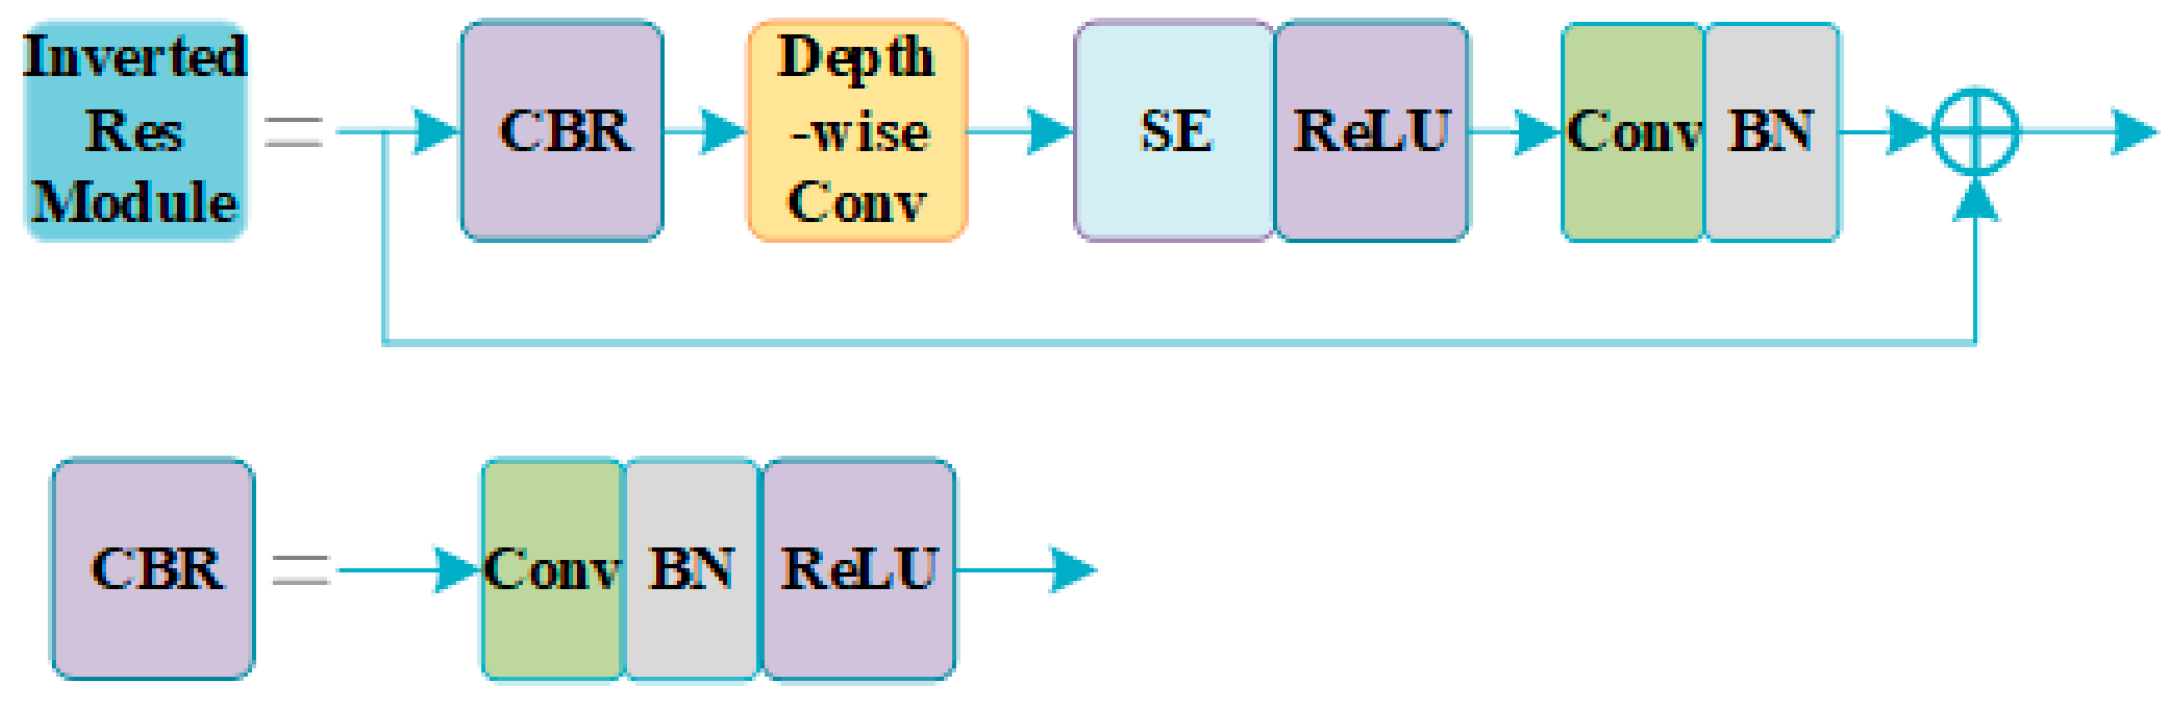
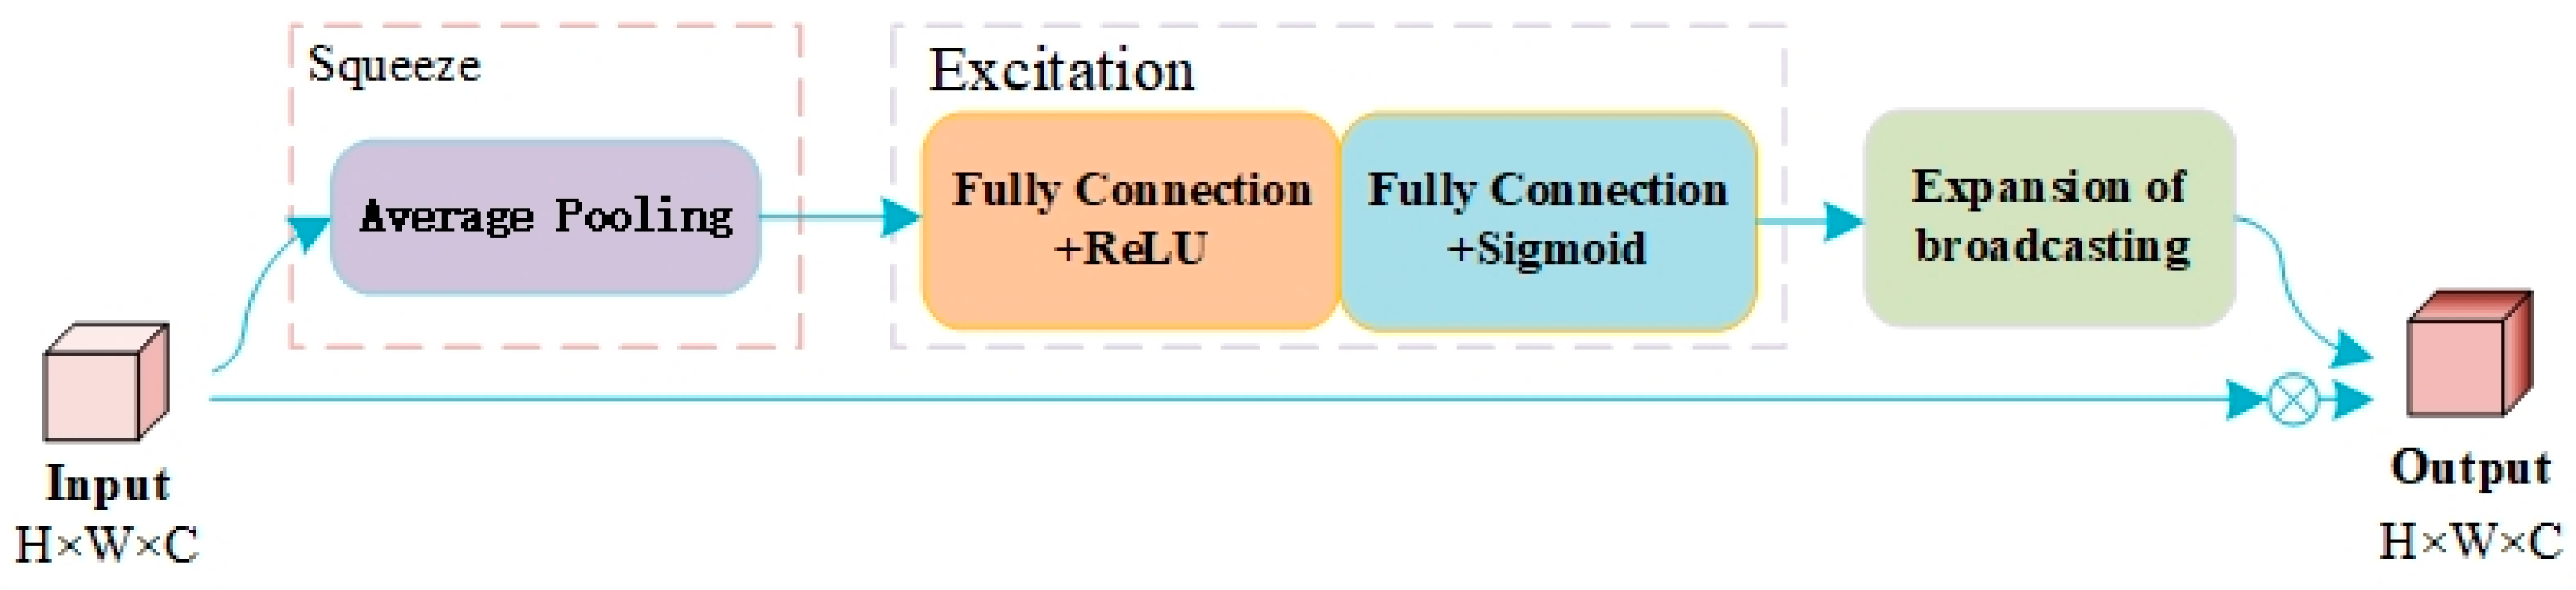
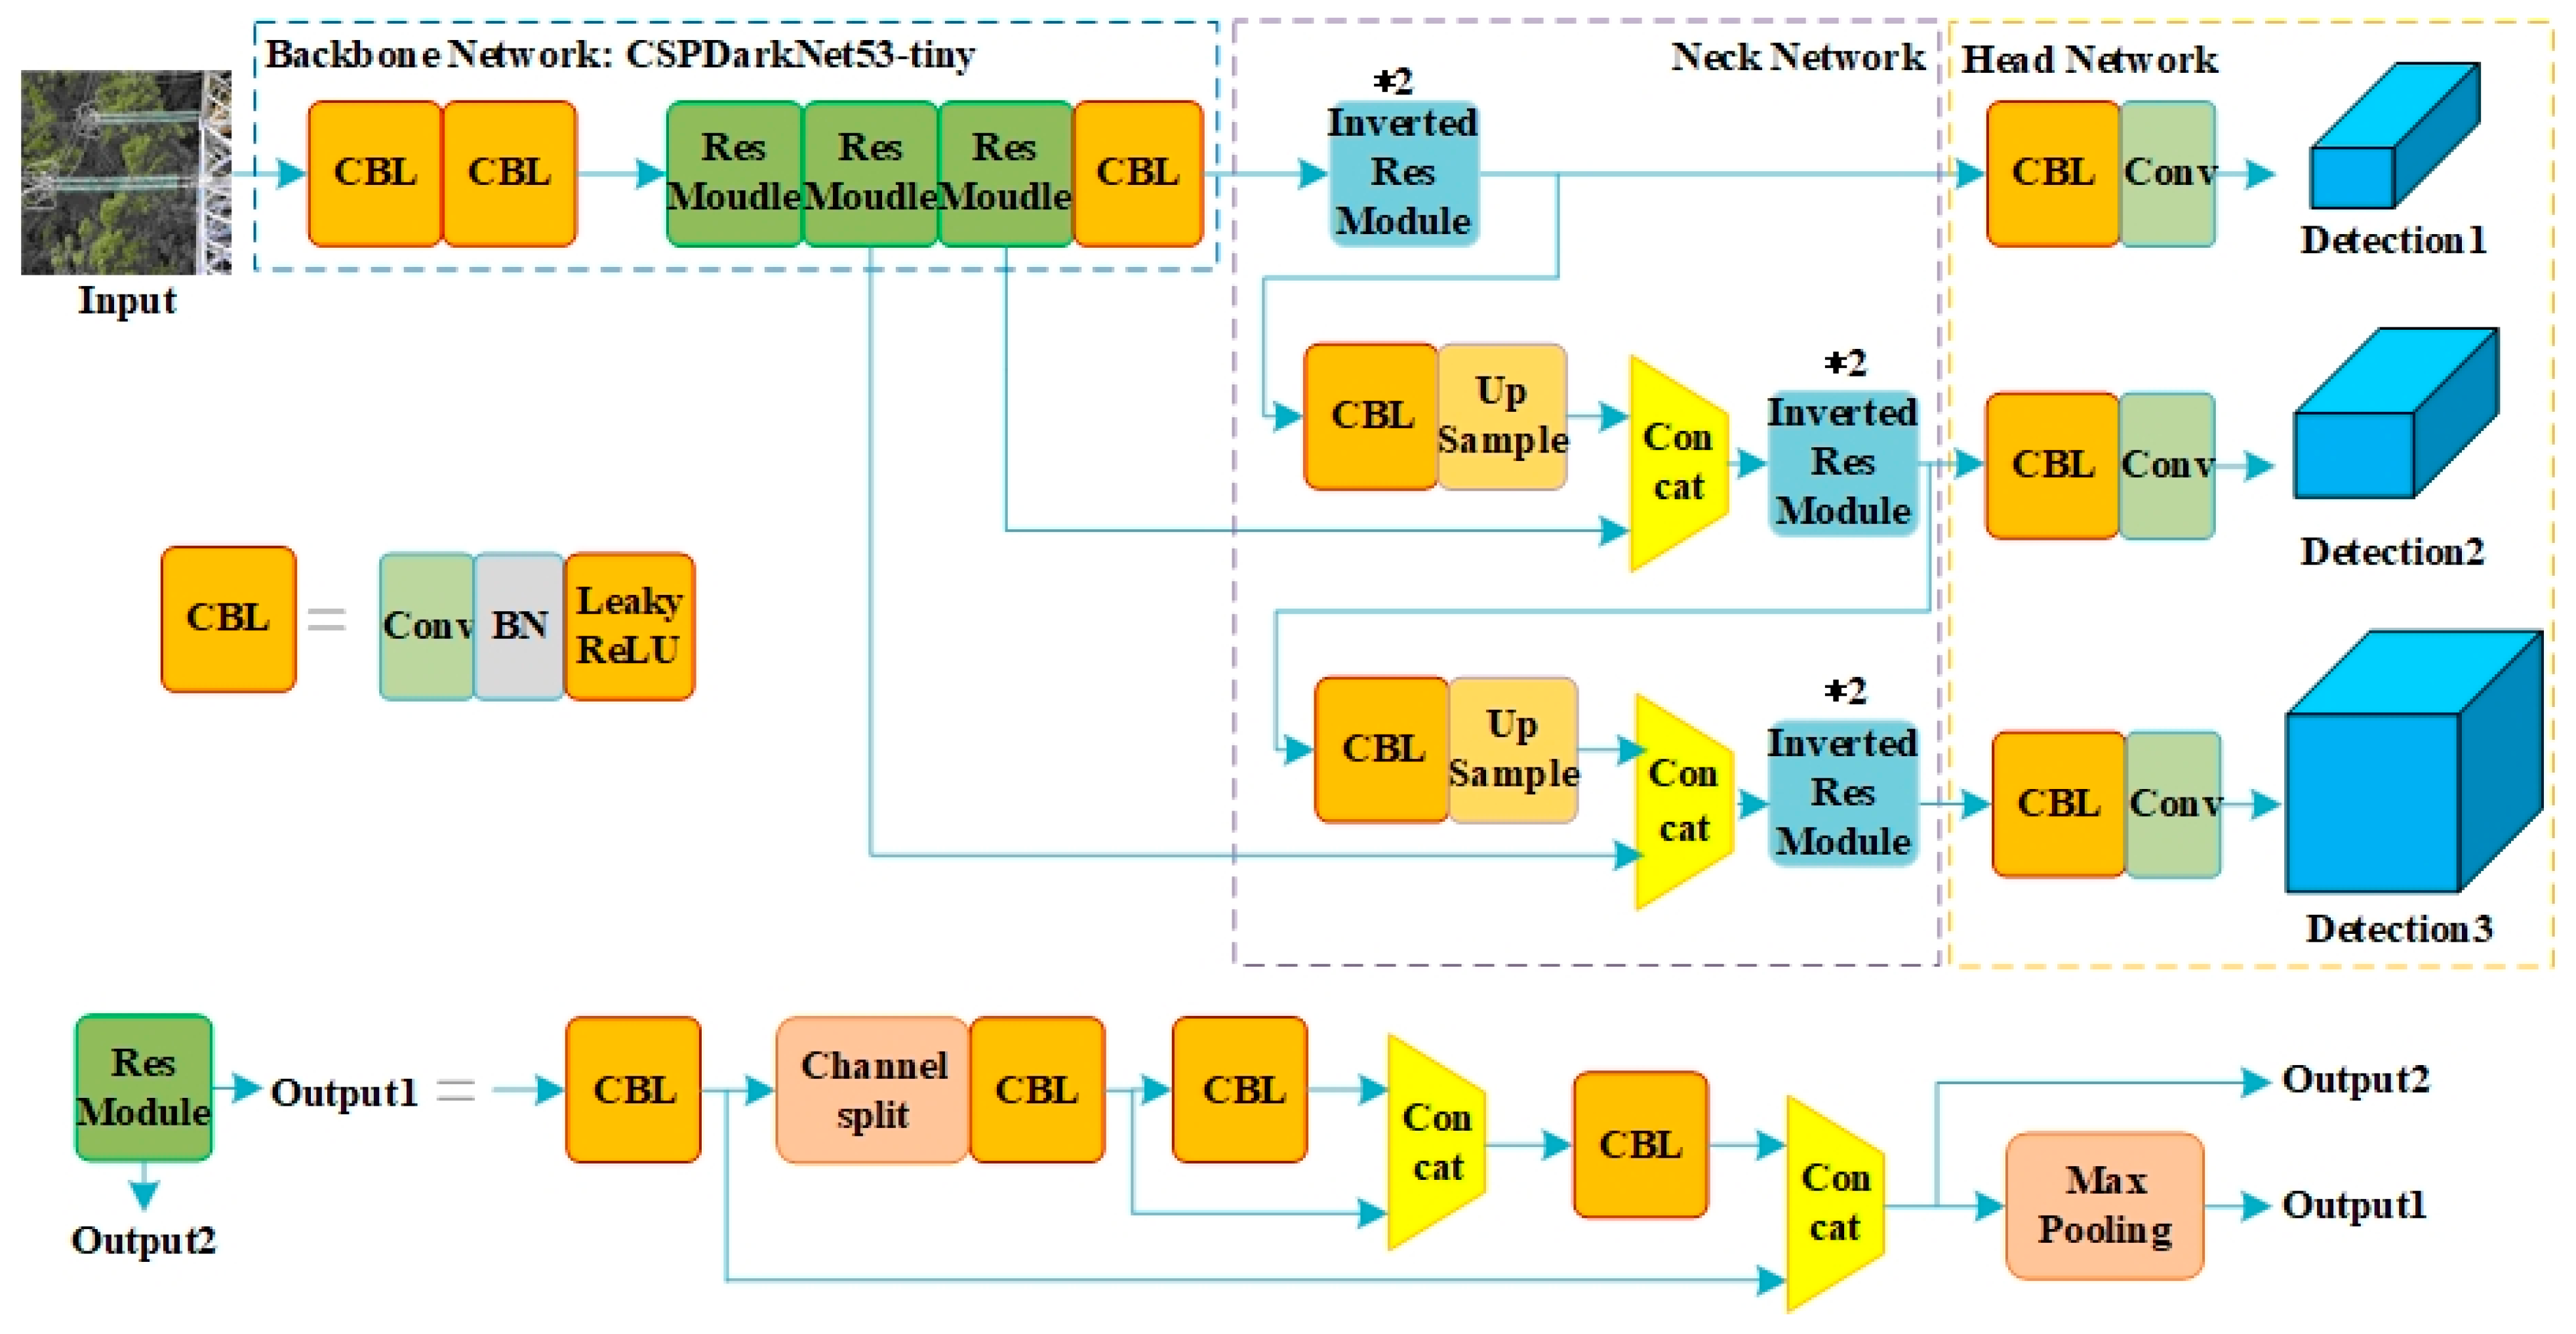
(1) Considering the problem of positioning deviation owing to the thin neck network structure, two serial inverted residual modules were used as the neck feature fusion modules of YOLOv4-tiny to enhance the feature fusion ability of the backbone network.
(2) Considering YOLOv4-tiny’s tendency to miss defect objects or detect them incorrectly, a detection output head suitable for small-scale objects was added to the original network structure, and the detection accuracy of small defects was improved without affecting detection accuracy for large insulators.
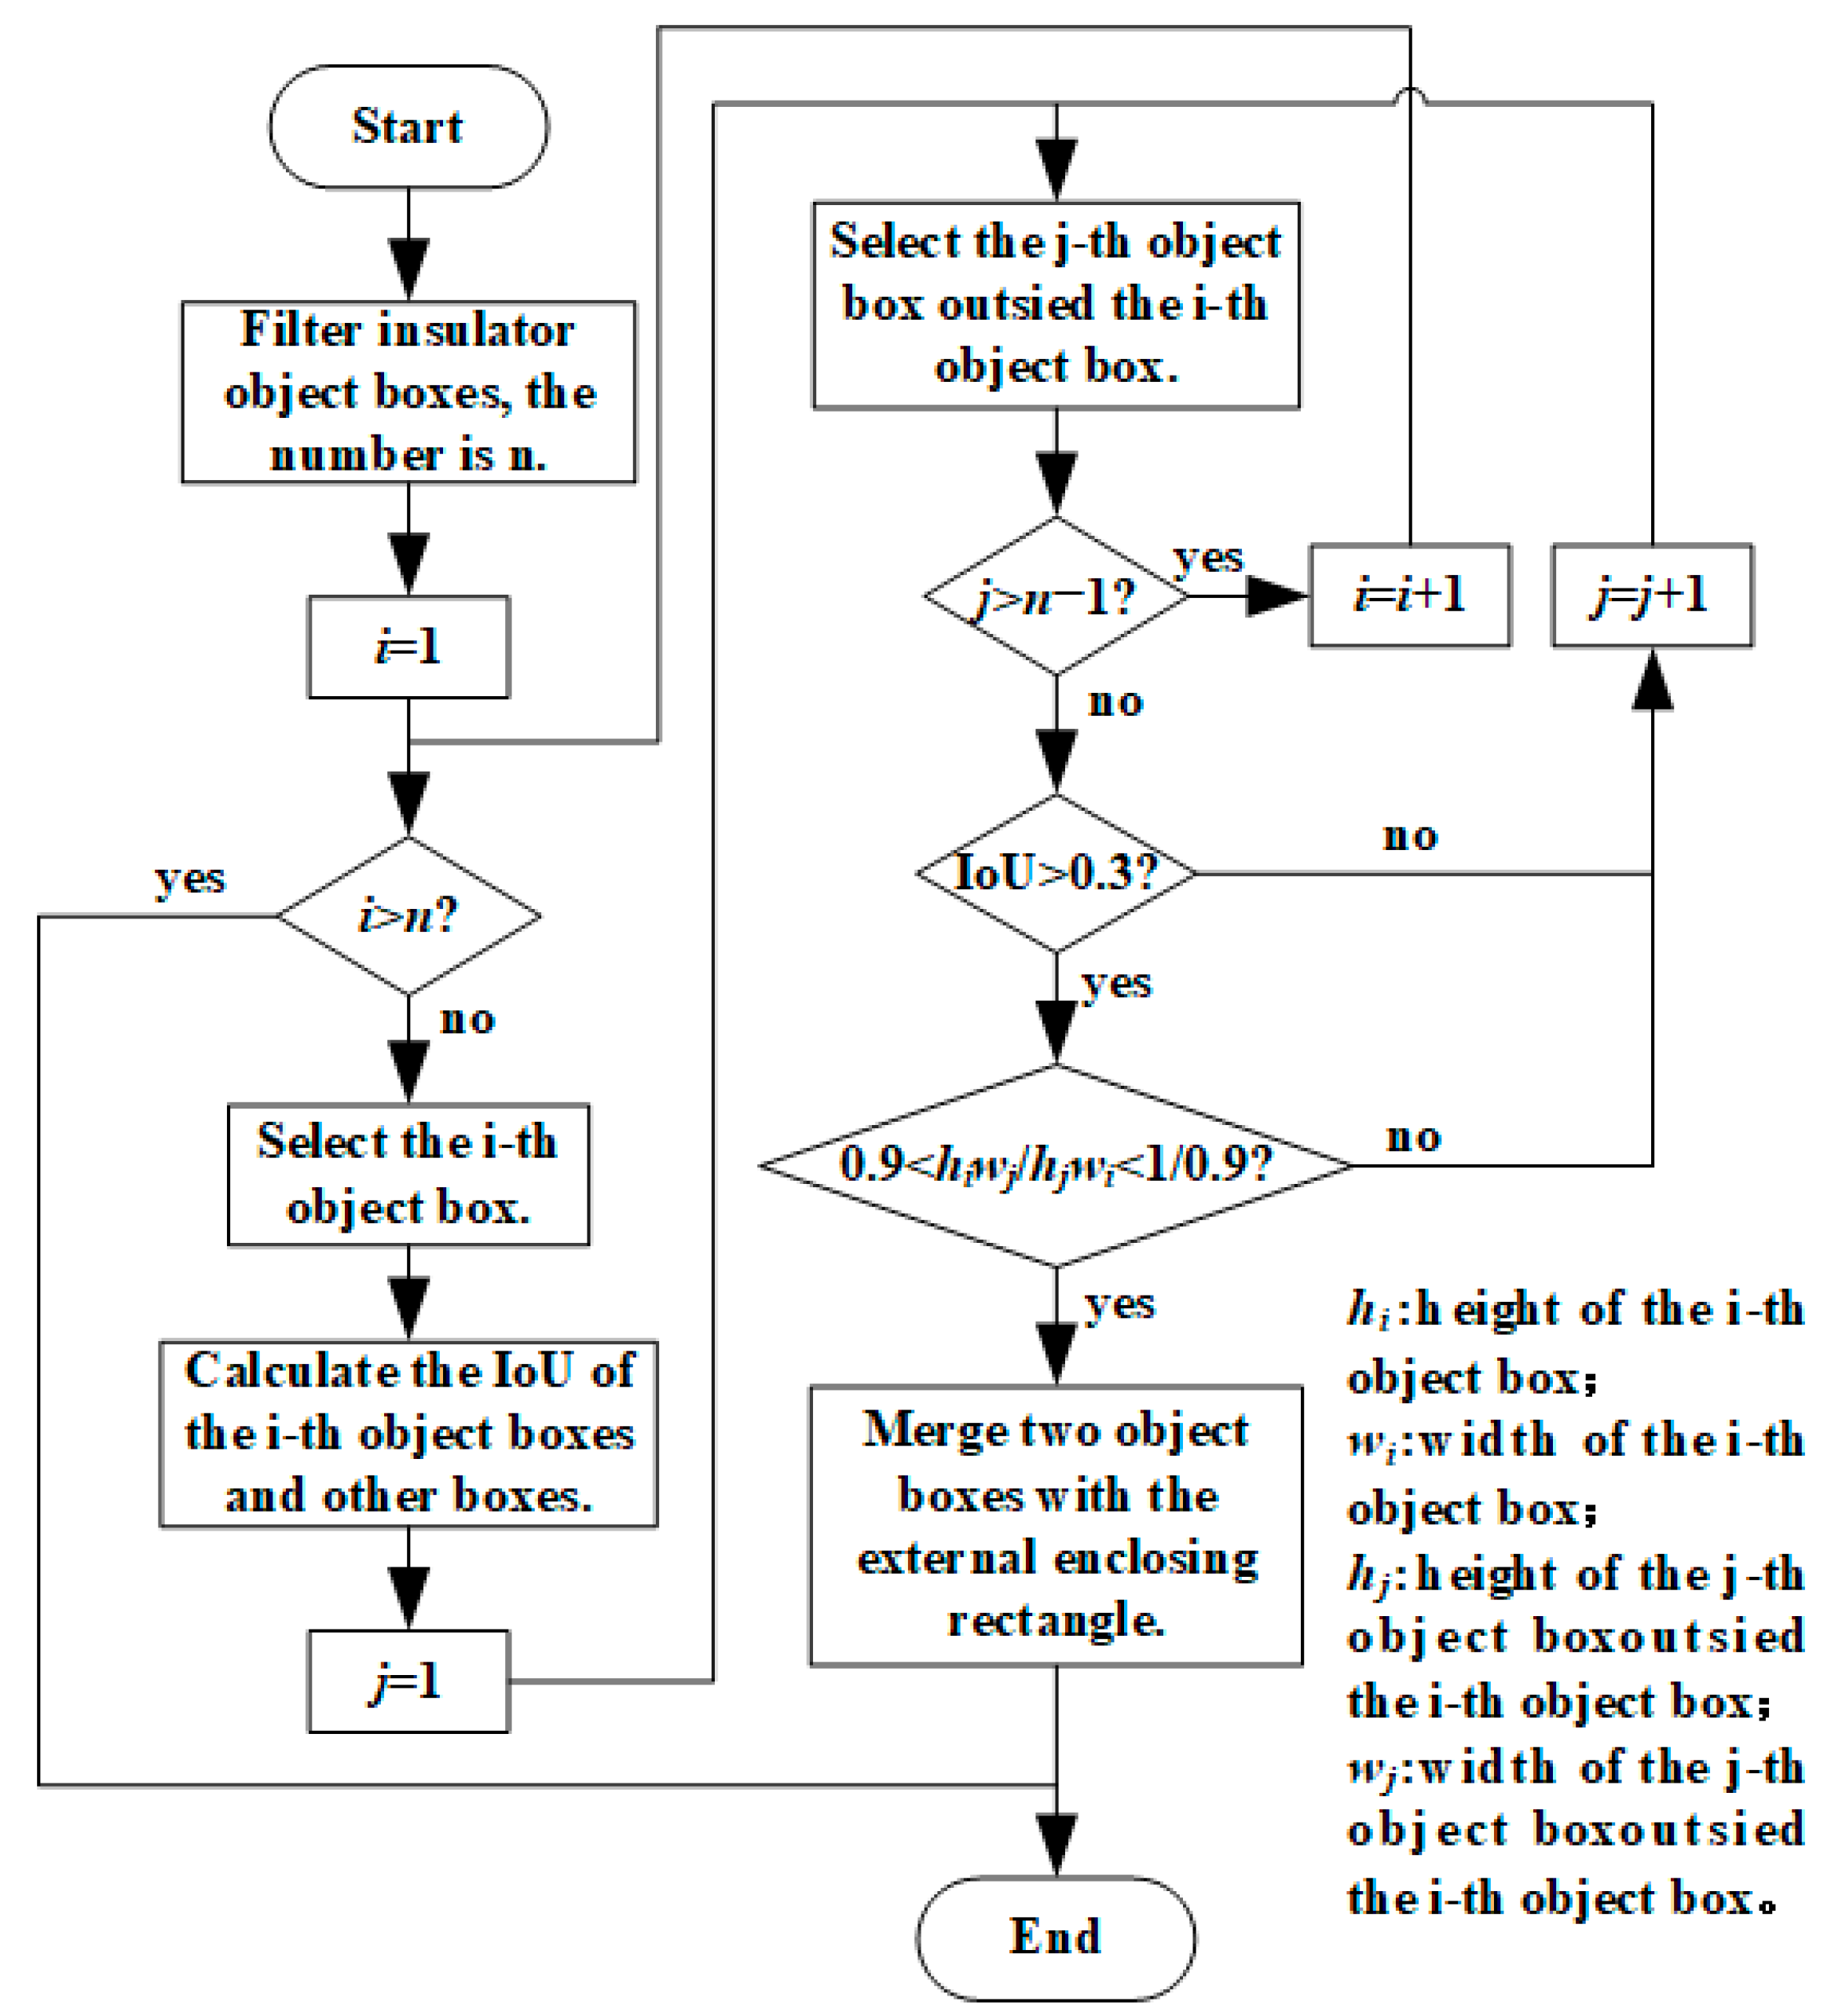
(3) Considering the problem of split detection boxes, split object boxes were determined after non-maximum suppression (NMS) through the intersection over union (IoU) and aspect ratio and then replaced by an external enclosing rectangular box to improve detection performance.

2. Improvements to YOLOv4-tiny

2.1. Network Sturcture of YOLOv4-tiny

YOLOv4-tiny is a simplified model proposed on the basis of YOLOv4. Its network structure uses CSPDarkNet53-tiny as the backbone network, performs feature fusion through CBL layers that combine convolution (Conv), batch normalization (BN), and a Leaky ReLU activation function, and finally performs object box prediction through two detection output heads. The network structure of YOLOv4-tiny is shown in Figure 1.
Compared with YOLOv4, YOLOv4-tiny has fewer parameters and floating point of operations (FLOPs) of convolution (Table 1).

2.1.1. Network Structure of CSPDarkNet53-tiny

YOLOv4-tiny uses a CSPDarkNet53-tiny backbone to extract image features. Based on the CBL, CSPDarkNet53-tiny includes a residual module (Res Module) through a cross-stage structure and channel split. The Res Module has two feature fusion operations, including external and internal fusion. The objects of external fusion are the results of the first and fourth CBL with a relatively large span. Corresponding to the external fusion, the internal fusion objects are the results of the second and third CBL with a small span. A channel split is applied to the first CBL; that is, a channel split is performed on the convolution result, and the convolution result with only half of the channels is reserved as the input for the subsequent convolution. Therefore, the number of channels of the internal fusion objects is only half that of external fusion objects.
CSPDarkNet-53-tiny adopts fewer stacking times of convolution blocks and reduces the number of input channels based on channel split, which helps reduce FLOPs and the number of parameters.

2.1.2. Simplified Feature Pyramid Network (FPN) Neck Network

YOLOv4-tiny’s neck network uses a minimalist FPN structure. The neck network of YOLOv4-tiny takes the feature results of CSPDarkNet53-tiny in two scales as inputs. The deep feature is upsampled and fused with the shallow feature. Although the neck network of YOLOv4-tiny realizes feature fusion using a simple convolution combination, this part of the model is so thin as to seriously degrade the detection accuracy of the model.

2.1.3. Design of the Detection Output Head

The head of YOLOv4-tiny is connected to the neck. The feature results of the two dimensions of the neck are taken as inputs, and the corresponding output results are obtained by combining the CBL and Conv layers. The number of channels of the YOLOv4-tiny detection output is expressed in Equation (1).
Co = (Nclasses + 5) × Nanchors,
where Co is the channel of the detection output, Nclasses is the number of prediction classes, and Nanchors is the number of anchors for one detection head.

2.2. Improved Methods for YOLOv4-tiny

2.2.1. Inverted Residual Module

The neck network of YOLOv4-tiny is extremely simple. Although it helps the model achieve a significant decrease in FLOPs and the number of parameters, the excessively thin structure significantly decreases detection accuracy, particularly in terms of the accuracy of insulator positioning.
To improve the insulator positioning accuracy of the YOLOv4-tiny model, we referred to the inverted residual module of MobileNetV2 [22]. In the neck network, two serial inverted residual modules are used to achieve feature fusion and improve the fusion effect between the semantic information of the deep feature map and the position information of the shallow feature map. The basic structure of the inverted residual module is shown in Figure 2.
The inverted residual module is based on depthwise separable convolution. The depthwise separable convolution comprises depthwise and pointwise convolutions. Here, the depthwise convolution converts a three-dimensional convolution into a two-dimensional convolution of each channel using the grouping convolution method. This step is used to achieve dimensional changes in the width and height of the feature map. Pointwise convolution is used to realize the expansion and contraction of the feature graph channels by a 1 × 1 convolution. This step is used to change the number of channels. Although depthwise separable convolution can realize the basic functions of conventional convolution, it uses fewer FLOPS and parameters. Under the action of depthwise separable convolution, the introduction of an inverted residual module in the neck network did not significantly reduce the detection speed.
The main feature of the inverted residual module is channel expansion. The method first expands the channel number of the feature graph by CBR, then changes the width and height of the feature graph by depthwise convolution, and finally shrinks the channel number by CBR. For the YOLOv4-tiny CSPDarkNet53-tiny backbone, because fewer channels are used, the inverted residual module can be adapted to extract more feature map information through pointwise convolution channel expansion to improve the feature fusion ability of the network.
In addition, the inverted residual module adopts a squeeze and excitation (SE) attention mechanism [23], the structure of which is shown in Figure 3.
As shown in Figure 3, the SE attention mechanism first flattens the feature graph with average pooling along the channel direction, then applies the two-layer perceptron to the flattening result, and finally multiplies the result of the perceptron action with the original feature graph element by element to obtain the feature graph of the attention action. The SE serves to distinguish the importance of feature graph channels, assign higher weights to important channels, and improve the model’s attention to important channels.

2.2.2. Design of Three Detection Output Heads

Owing to the pursuit of an extremely lightweight design, YOLOv4-tiny adopts double output heads for object detection; that is, only the feature fusion results of the fifth and fourth downsampling of the backbone model are used for object detection. Although this design may have relatively little influence on large objects, it cannot guarantee detection accuracy for small objects.
YOLO’s detection strategy is to set large anchors for deep feature maps with more downsampling times to examine large-scale objects and small anchors for shallow feature maps with fewer iterations of downsampling for small objects. This is because deep feature maps have a lower resolution and shallow feature maps have a higher resolution.
In the detection of insulators and defects, the size of insulators is generally large. Thus, the design of double output heads has relatively little influence on the detection accuracy of insulators. However, defects are generally relatively small. To avoid the negative impact of double output heads on the accuracy of defect detection, YOLOv4 was used as a benchmark to restore the design to three output heads. The structure of the YOLOv4-tiny model designed with the inverted residual module and three output heads is shown in Figure 4.

2.2.3. Supplementary Post-Processing with Prediction Boxes

Both Section 2.2.1 and Section 2.2.2 provide improvements from the perspective of the network structure of YOLOv4-tiny. In addition to the network structure, we also considered improving the post-processing part of the prediction boxes of YOLOv4-tiny to improve detection performance.
In this work, YOLOv4-tiny exhibited a phenomenon of split detection results. The split objects were generally large insulators. The concrete manifestation was that the detection results of the insulators were split into two object boxes with very similar shapes and certain overlapping areas. Although the model successfully detected the insulator, this effect is not helpful for power system operation and maintenance personnel.
To address this problem, we added a post-processing operation for prediction boxes after the NMS, which determined the coincidence size and similarity degree of prediction boxes based on their IoU and aspect ratio. If two prediction boxes met the characteristics of the split prediction boxes of the insulators, the external enclosing rectangular box of the two prediction boxes would be used to merge the split boxes. The basic process of this post-processing is shown in Figure 5.
In this study, an external enclosed rectangular box was used to replace the two split rectangular prediction boxes of an object through this post-processing operation. Although Improvement 3 had relatively little impact on the quantitative indicators of detection accuracy, it avoided the confusion of detection images caused by the split detection results.

3. Experiments and Analysis

In this study, we trained the object detection models on a server to obtain the weights. The detection speed of the models depended on the computing power of the hardware. As we mainly consider the detection speed at the edge, the detection speed of the model was tested on an edge computing device. The same weight file was used in the testing process so that the detection accuracy of the model on the edge computing device was consistent with that on the server. To demonstrate this, we randomly selected some image samples and found that the detection results of the two types of hardware were consistent. Considering that the detection speed of the model on the edge computing device was much lower than that of the server, the detection accuracy test was carried out on the server to save experimental time.

3.1. Experimental Setup

In this study, training and testing were performed on the server, and a speed test was performed on the edge computing device. The experimental environment of the server and the edge computing device included the Python 3.6 programming language and PyTorch1.7 deep learning framework, and both transmitted files over Wi-Fi. A comparison of the hardware used on the server and edge computing device is presented in Table 2.

3.2. Training

In this study, we adopted conventional settings for experimental training. The freezing training with no updating of the backbone weight was carried out first, and then the non-freezing training with the updating of the whole model weight was carried out. The specific training setting parameters are shown in Table 3.

3.3. Dataset Construction

In this work, we used a portion of the open-source Chinese power line insulator dataset (CPLID) [24] and added insulator and insulator defect image samples collected from across the Internet. The established dataset consisted of 1060 images. Among these, 641 images of normal insulators and 419 images of defective insulators were included. The dataset was divided into 760 training samples and 300 testing samples. Color gamut transformation was used to perform data augmentation on the training set in an offline data augmentation of 300 testing images. The specific method was to carry out two gamut conversion operations on each image and to expand the number of images in the test set to three times the original number. Because the training and test sets were separated before data expansion, there was no situation where the original image data are in the training set and the expanded image data were based on the original image in the test set. In this way, the information of the training set could be avoided from leaking to the test set, and the reliability of the testing results was guaranteed. Sample statistics were conducted on the training and test sets, and the statistical results are presented in Table 4.

3.4. Analysis of the Experimental Results

In this study, we compared the differences in speed between the improved YOLOv4-tiny and other object detection models in an edge computing device. Yolov4-tiny-1, yoloV4-tiny-1-2, and yoloV4-tiny-1-2-3 represent the YOLOv4-tiny with three improved methods added in turn.

3.4.1. Testing and Analysis of Detection Speed

First, the detection speed of the model was tested using an edge computing device. The quantitative indicator of detection speed is FPS, which refers to the number of images detected within a single second. In this study, the FPS of each model was tested three times on the edge computing device, and the average value was obtained (Table 5).
As can be observed from Table 5, the non-lightweight object detection models Faster R-CNN, SSD, and YOLOv4 exhibited extremely low detection speeds on edge computing devices, these methods involve some difficulty in meeting the speed requirements of insulator and defect detection. Although YOLOv4 with the application of a lightweight backbone network improved the detection speed to some extent, its detection speed on edge computing devices is still relatively slow. Yolov4-tiny exhibited a faster detection speed on edge computing devices, with an FPS exceeding 18. In this study, the network structure of YOLOv4-tiny was strengthened by Improvements 1 and 2. Under the action of these two improvements, the FPS dropped to 10.805, with a relatively obvious decrease. Improvement 3 did not change the network structure of the model, and the associated reduction in FPS is relatively small. Finally, the FPS of YOLOv4-tiny with three improved methods was 10.398. Although it is significantly lower than that of the original YOLOv4-tiny, its detection speed remains far higher than that of non-lightweight object detection models and was more in line with the speed requirements of the insulator and defect detection scenarios.

3.4.2. Testing and Analysis of Detection Accuracy

In this study, the recall, accuracy, and average precision (AP) of each object were used as quantitative indicators of the detection accuracy of the models. The calculation of the three indicators is expressed in Equations (2)–(4).
P = N T P N T P + N F P ,
where P is the detection accuracy, NTP is the number of correctly classified positive samples, and NFP is the number of incorrectly classified positive samples.
R = N T P N T P + N F N ,
where R is the detection recall and NFN is the number of incorrectly classified negative samples.
A P = P d R .
mAP is used to measure the detection accuracy of all object classes, and its calculation formula is expressed in Equation (5).
m A P = i = 1 N classes A P i N classes .
Here, I represents the insulator object and D represents the defect object. A comparison of the detection accuracy indicators of the different models is presented in Table 6. The IoU threshold of the AP indicator used in this study was 0.5.
Table 6 shows that in the non-lightweight object detection models, YOLOv4 showed relatively ideal detection accuracy for both types of objects, with insulator AP reaching 98.72% and defect AP reaching 95.95%. Compared with that of YOLOv4, the detection accuracy of YOLOV4-tiny decreased to a certain extent, mainly in terms of insulator accuracy, defect recall and defect accuracy.
In this study, Improvement 1 improved the neck feature fusion ability of YOLOv4-tiny by using the inverted residual module, which enhances the positioning accuracy and detection accuracy of insulators. The accuracy of insulator positioning can be shown by the visualization results of the models’ heat map and the actual detection diagrams, in which the red area of the heat map represents the area of concern for model detection. The improved insulator positioning pairs for YOLOv4-tiny and YOLOV4-tiny-1 are shown in Table 7.
As can be observed in Table 7, YOLOv4-tiny deviated from the center of the insulator in the focus area of some insulator objects. Although insulators were detected successfully, the locations of the detection boxes were inaccurate. The area of concern for YOLOv4-tiny-1 was closer to the center of the insulators, so not only could the insulators be detected successfully, but also the location of the detection boxes was more accurate, and the accuracy of insulator positioning was improved. Combined with Table 6, the accuracy of the insulator can be increased from 89.62% to 96.65% by Improvement 1.
For Improvement 2 of this study, the network structure of YOLOv4-tiny was restored to the three-output design of the conventional YOLO model, and the detection ability of the model for small-scale defective objects was improved by adding a high-resolution object detection layer. As can be observed from Table 6, under the effect of Improvement 2, the recall of defects increased from 91.59% to 92.56%, the accuracy of defects increased from 98.61% to 100.00%, and the cases of missed and incorrect detection of defects were both solved to a certain extent. The specific results are shown in Table 8.
As can be observed from Table 8, Improvement 2 can help YOLOv4-tiny detect defect objects that could not be detected previously and avoid defect misdetection.
In this study, Improvement 3 combines the split detection boxes of the same insulator with an external enclosing rectangular box. Although Table 6 shows that Improvement 3 had little influence on the quantitative indicators of detection accuracy, it actually improved the detection performance (Table 9).
As can be observed from Table 9, YOLOv4-tiny is prone to the problem of detection box splitting for large insulator objects, and the image detection results are relatively confused, which causes certain problems for transmission line operation and maintenance personnel. By Improvement 3, the split detection boxes can be merged, and the merged detection box can select the complete insulator object in a box. This avoids the problem of chaotic detection results and improves the detection performance of the model.

4. Conclusions

In this study, we developed a method to detect insulators and their defects with an improved YOLOv4-tiny model taking account of data processing shifted to an edge computing device. The accuracy and speed of the model were tested on the edge computing device. The specific conclusions of this work are listed as follows:
(1) YOLOv4-tiny is more applicable to edge computing devices owing to its faster detection speed and fewer parameters, but some room for improvement remains in terms of detection accuracy.
(2) By using the inverted residual module as the feature fusion module, the insulator positioning accuracy of the model was enhanced, and the insulator detection accuracy increased from 89.62% to 96.65%.
(3) By changing the network structure of YOLOv4-tiny to three output head designs, the detection ability of the model for small-scale defect objects was improved. The recall and accuracy of defects increased from 91.26% and 96.25%, respectively, with the original model to 92.56% and 100.00%.
(4) Post-processing of the prediction box was added to the YOLOv4-tiny model to combine the split prediction boxes of large-scale insulators in the form of an external enclosing rectangular box to improve the actual detection performance of the model.
(5) The insulator AP, defect AP, and mAP of the improved YOLOv4-tiny were 97.95%, 94.49%, and 96.22%, respectively, and the detection speed on the edge computing device reached 10.398 FPS, which basically meets the requirements of accuracy and speed in insulator and defect detection scenarios.

Author Contributions

Conceptualization, B.L.; methodology L.Q., F.Z., J.Y., K.L. and B.L.; software, H.L., M.H., J.W. and B.L.; writing-original draft preparation, B.L.; writing-review and editing, L.Q., K.L. and B.L. All authors have read and agreed to the published version of the manuscript.

Funding

This research was funded by the National Key Research and Development Program of China (2020YFB0905900).

Data Availability Statement

Not applicable.

Conflicts of Interest

The authors declare no conflict of interest.

References

  1. Yan, H.; Chen, J. Insulator string positioning and state recognition method based on improved YOLOv3 algorithm. High Volt. Eng. 2020, 46, 423–432. [Google Scholar]
  2. Liu, Z.; Miao, X.; Chen, J. Review of visible image intelligent processing for transmission line inspection. Power Syst. Technol. 2020, 44, 1057–1069. [Google Scholar]
  3. Xie, Q.; Zhang, X.; Wang, C. Application status and prospect of the new generation artificial intelligence technology in the state evaluation of transmission and transformation equipment. High Volt. App. 2022, 58, 1–16. [Google Scholar]
  4. Wang, X.; Hu, J.; Sun, C.; Du, L. On-line monitoring of icing-thickness on transmission line with image edge detection method. High Volt. App. 2009, 45, 69–73. [Google Scholar]
  5. Yan, K.; Wang, F.; Zhang, Z. Hydrophobic image edge detection for composite insulator based on Canny operator. J. Elec. Power Sci. Technol. 2013, 28, 45–56. [Google Scholar] [CrossRef]
  6. Li, H.; Li, Z.; Wu, T. Research on edge detection of insulator by Canny operator optimized by two-dimensional maximum entropy threshold. High Volt. App. 2022, 58, 205–211. [Google Scholar]
  7. Zhang, S.; Gong, Y.; Wang, J. The development of deep convolution neural network and its application on computer vision. Chin. J. Comput. 2019, 42, 453–482. [Google Scholar]
  8. Ren, S.; He, K.; Girshick, R.; Sun, J. Faster R-CNN: Towards real-time object detection with region proposal networks. IEEE Trans. Pattern Anal. Mach. Intell. 2017, 39, 1137–1149. [Google Scholar] [CrossRef] [PubMed] [Green Version]
  9. Liu, W.; Anguelov, D.; Erhan, D.; Szegedy, C.; Reed, S.; Fu, C.Y.; Berg, A.C. SSD: Single shot multibox detector. In Proceedings of the 2016 European Conference Computer Vision (ECCV), Amsterdam, The Netherlands, 11–14 October 2016; pp. 21–37. [Google Scholar]
  10. Redmon, J.; Divvala, S.; Girshick, R.; Farhadi, A. You only look once: Unified, real-time object detection. In Proceedings of the 2016 IEEE Conference on Computer Vision and Pattern Recognition (CVPR), Las Vegas, NV, USA, 27–30 June 2016; pp. 779–788. [Google Scholar]
  11. Redmon, J.; Farhadi, A. YOLO9000: Better, faster, stronger. In Proceedings of the 2017 IEEE Conference on Computer Vision and Pattern Recognition (CVPR), Honolulu, HI, USA, 21–26 July 2017; pp. 6517–6525. [Google Scholar]
  12. Hao, S.; Ma, R.; Zhao, X.; An, B.; Zhang, X.; Ma, X. Fault detection of YOLOv3 transmission line based on convolutional block attention model. Power Syst. Technol. 2021, 45, 2079–2987. [Google Scholar]
  13. Zheng, H.; Li, J.; Liu, Y.; Cui, Y.; Ping, Y. Infrared object detection model for power equipment based on improved YOLOv3. Trans. Chin. Elec. Soc. 2021, 36, 1389–1398. [Google Scholar]
  14. Ling, Z.; Zhang, D.; Qiu, R.C.; Jin, Z.; Zhang, Y.; He, X.; Liu, H. An accurate and real-time method of self-blast glass insulator location based on Faster R-CNN and U-Net with aerial images. CSEE J. Power Energy Syst. 2019, 5, 474–482. [Google Scholar]
  15. Luo, P.; Wang, B.; Ma, H. Defect recognition method with low false negative rate based on combined target detection framework. High Volt. Eng. 2021, 47, 454–464. [Google Scholar]
  16. Ma, F.; Wang, B.; Dong, X. Receptive field vision edge intelligent recognition for ice thickness identification of transmission line. Power Syst. Technol. 2021, 45, 2161–2169. [Google Scholar]
  17. Ma, F.; Wang, B.; Dong, X.; Wang, H.G.; Luo, P.; Zhou, Y.Y. Power vision edge intelligence: Power depth vision acceleration technology driven by edge computing. Power Syst. Technol. 2020, 44, 2020–2029. [Google Scholar]
  18. Shi, W.; Cao, J.; Zhang, Q.; Li, Y.; Xu, L. Edge computing: Vision and challenges. IEEE Internet Things J. 2016, 3, 637–646. [Google Scholar] [CrossRef]
  19. Bai, Y.; Huang, Y.; Chen, S.; Zhang, J.; Li, B.-Q.; Wang, F.-Y. Cloud-edge intelligence: Status quo and future prospective of edge computing approaches and applications in power system operation and control. Acta Autom. Sin. 2020, 46, 397–410. [Google Scholar]
  20. Cui, H.; Zhang, Y.; Zhang, X. Detection of power instruments equipment based on edge lightweight networks. Power Syst. Technol. 2022, 46, 1186–1193. [Google Scholar]
  21. Wang, C.; Bochkovskiy, A.; Liao, H. Scaled-YOLOv4: Scaling cross stage partial network. In Proceedings of the 2021 IEEE/CVF Conference on Computer Vision and Pattern Recognition (CVPR), Nashville, TN, USA, 19–25 June 2021; pp. 13024–13033. [Google Scholar]
  22. Sandler, M.; Howard, A.; Zhu, M. MobileNetV2: Inverted residuals and linear bottlenecks. In Proceedings of the 2018 IEEE/CVF Conference on Computer Vision and Pattern Recognition (CVPR), Salt Lack City, UT, USA, 18–23 June 2018; pp. 4510–4520. [Google Scholar]
  23. Hu, J.; Shen, L.; Albanie, S. Squeeze-and-excitation networks. IEEE Trans. Pattern Anal. Mach. Intell. 2020, 42, 2011–2023. [Google Scholar] [CrossRef] [PubMed] [Green Version]
  24. Tao, X.; Zhang, D.; Wang, Z.; Liu, X.; Zhang, H.; Xu, D. Detection of power line insulator defects using aerial images analyzed with convolutional neural networks. IEEE Trans. Syst. Man Cybern. Syst. 2020, 50, 1486–1498. [Google Scholar] [CrossRef]
Figure 1. YOLOv4-tiny network structure.
Machines 11 00122 g001
Figure 2. Structure of the inverted residual module.
Machines 11 00122 g002
Figure 3. Structure of SE.
Machines 11 00122 g003
Figure 4. Overall network structure of improved YOLOv4-tiny.
Machines 11 00122 g004
Figure 5. Flowchart of the post-processing of prediction boxes.
Machines 11 00122 g005
Table 1. Comparison of computational complexity and model size between YOLOv4 and YOLOv4-tiny.
ModelsFLOPs (G)Parameters (M)
YOLOv4141.45663.943
YOLOv4-tiny16.1495.876
Table 2. Hardware comparison between the server and the edge computing device.
HardwareServerEdge Computing Device
CPU2*Intel Xeon Platinum 8171M CPU6-core NVIDIA Carmel ARM®v8.2 64-bit
GPU2*Nvidia GeForce RTX 3090 GPU384-core NVIDIA VoltaTM GPU 48 Tensor Cores
Table 3. Training setting parameters of the models.
ParametersFreezing TrainingNon-Freezing Training
Epoch150350
Initial Learning Rate3 × 10−52.4 × 10⁻⁴
Change in Learning RateCosine AnnealingCosine Annealing
Batch Size52
OptimizerAdamAdam
Table 4. Dataset sample distribution.
DatasetInsulatorsDefectsImages
Training Set1372328760
Test Set1728309900
Table 5. Comparison of the model detection speed on the edge computing device.
ModelsFPS
Faster R-CNN1.099
SSD2.007
YOLOv42.089
MobileNetV2-YOLOv44.482
ShuffleNetV2-YOLOv45.116
GhostNet-YOLOv44.724
YOLOv4-tiny18.075
YOLOv4-tiny-114.054
YOLOv4-tiny-1-210.805
YOLOv4-tiny-1-2-310.398
Table 6. Comparison of the model detection accuracy.
ModelsI-AP (%)I-R (%)I-P (%)D-AP (%)D-R (%)D-P (%)mAP (%)
Faster R-CNN98.2597.9791.4176.7682.2077.4487.50
SSD96.4089.8794.8195.2979.61100.0095.84
YOLOv498.7297.2296.1695.9594.82100.0097.34
YOLOv4-tiny95.6793.9289.6293.7891.2696.2594.72
YOLOv4-tiny-197.9895.0296.6593.9391.5998.6195.96
YOLOv4-tiny-1-298.0395.4397.0694.4992.56100.0096.26
YOLOv4-tiny-1-2-397.9595.3797.2394.4992.56100.0096.22
Table 7. Improvement comparison of the insulator positioning.
YOLOv4-tinyYOLOv4-tiny-1
Heat MapDetection DiagramHeat MapDetection Diagram
Sample 1Machines 11 00122 i001Machines 11 00122 i002Machines 11 00122 i003Machines 11 00122 i004
Sample 2Machines 11 00122 i005Machines 11 00122 i006Machines 11 00122 i007Machines 11 00122 i008
Table 8. Improvement comparison of the defect detection.
YOLOv4-tinyYOLOv4-tiny-1YOLOv4-tiny-1-2
Defect OmissionMachines 11 00122 i009Machines 11 00122 i010Machines 11 00122 i011
Defect MisdetectionMachines 11 00122 i012Machines 11 00122 i013Machines 11 00122 i014
Table 9. Improvement comparison of the split detection boxes.
YOLOv4-tinyYOLOv4-tiny-1YOLOv4-tiny-1-2YOLOv4-tiny-1-2-3
Sample 1Machines 11 00122 i015Machines 11 00122 i016Machines 11 00122 i017Machines 11 00122 i018
Sample 2Machines 11 00122 i019Machines 11 00122 i020Machines 11 00122 i021Machines 11 00122 i022
Disclaimer/Publisher’s Note: The statements, opinions and data contained in all publications are solely those of the individual author(s) and contributor(s) and not of MDPI and/or the editor(s). MDPI and/or the editor(s) disclaim responsibility for any injury to people or property resulting from any ideas, methods, instructions or products referred to in the content.

