Article

Optimization of Centrifugal Pump Impeller for Pumping Viscous Fluids Using Direct Design Optimization Technique

1
Department of Robot and Smart System Engineering, Kyungpook National University, Daegu 41566, Korea
2
Intelligent Construction Automation Centre, Kyungpook National University, Daegu 41566, Korea
3
Wave Energy and Fluids Engineering Laboratory, Department of Ocean Engineering, Indian Institute of Technology Madras, Chennai 600036, India
4
School of Civil and Environmental Engineering, Harbin Institute of Technology, Shenzhen 518055, China
5
School of Architecture, Civil, Environmental and Energy Engineering, Kyungpook National University, Daegu 41566, Korea
*
Author to whom correspondence should be addressed.
Machines 2022, 10(9), 774; https://doi.org/10.3390/machines10090774
Submission received: 18 August 2022 / Revised: 31 August 2022 / Accepted: 31 August 2022 / Published: 6 September 2022
(This article belongs to the Section Turbomachinery)

Abstract

:
Pumping viscous fluids using centrifugal pumps in the subsea industry is very common. The pump performance degrades drastically when the viscosity of fluids increases, which ultimately gives rise to the installation and oil production cost. Their design optimization can lead to a significant improvement in their performance. Therefore, this study presented the effect of impeller geometry on pumping fluid viscosity through impeller design optimization. Here, pump operation is simulated numerically by solving the Reynolds-averaged Navier-Stokes (RANS) equations at different flowrates. Experimental testing is also performed using the same oils, for numerical validation. Artificial neural-network-assisted multiobjective optimization was performed with two independent design parameters; wrap angle and splitter blade length of impeller, with head and input power as objective functions. Wrap angle and splitter blade length, both significantly affect pump performance while pumping viscous oils; as the oil viscosity increases, increasing splitter length and decreasing wrap angle improve the head significantly.

1. Introduction

A centrifugal pump or an electric submersible pump is commonly used for pumping crude oil either upstream or downstream of subsea or offshore petroleum industries. As the viscosity of the crude oil increases in a matured oil field, pumping it with the same artificial lift technique consumes a huge amount of energy, which increases total oil production cost. The pump performance is greatly affected by viscosity of the pumping fluids. For several decades, researchers [1,2,3,4] have studied the influence of viscous oil on the performance of centrifugal pumps. The performance decrement of centrifugal pumps occurs in the form of head loss owing to recirculation of fluid at the inlet, disk friction, and skin friction losses. The skin friction and disk friction losses are among the major losses concerning pumping viscous fluids [5]. The pump performance for pumping oils of different viscosities can be analytically calculated using the correlation chart presented by the Hydraulic Institute [6] or through correlations developed in recent studies [7]. However, minimal attempts have been made to improve the pump performance, especially concerning the volute design or manipulation of the impeller.
Impeller design parameters, such as the wrap angle and angles of the inlet and outlet blades, affect the pump performance significantly; a large wrap angle increases the head and hydraulic efficiency of the pump, with a notable increment of input power [8]. The effects of variation in inlet profile and blade angle become significant and are generally observed as the inlet recirculation and cavitation performance changes [9]. The increase in outlet blade angle enhances hydraulic losses in the impeller and volute [10]. Ideally, an infinite number of blades can lower the slip factor greatly; however, it causes the flow pattern to distort [11]. An optimum number of blades are preferred when pumping a fluid for high head and low cavitation. Blade loading is an effective parameter that dictates the performance and maintenance frequency of a centrifugal pump [12]. The phenomenon of flow recirculation is greater when a limited number of impeller blades are used, which causes fluctuations. These fluctuations can be analyzed through flow patterns [13,14]. A decrement in impeller blade thickness increases the head; however, an optimum thickness is essential to bear the stress induced by blade loading and fluctuation during fluid flow.
Adding splitter blades to a compressor rotor is usually performed in order to reduce blade loading and improve rotor efficiency [15]. The splitter blades’ role in impeller design of a centrifugal pump has recently been discovered to significantly affect the pump’s performance. Splitter blades, along with six or more main blades, negatively affect the pump’s performance. On the other hand, five main blades have been found to be optimum for improving the hydraulic efficiency [16,17]. The performance of a pump can be improved by reduction in stall formation and pressure fluctuation between the blade passages. Adding splitter blades also unifies the fluid flow suppressing the backflow region at the impeller outlet [18]. Splitter blades can handle viscous fluids for wide operating ranges. It also reduces the shear loss due to increased total surface area of fluid–solid interaction [19]. Experimental technique design has been shown to improve head with negligible effect on pump efficiency [20]. A comparative literature review of centrifugal pump performance using splitter blades is presented in Table 1.
Optimization of turbomachine geometry is a complex and time-consuming task as there are several design parameters and constraints involved. The optimization process can have single or multiple objectives. A multiobjective optimization further increases complexity as there can be conflicting objectives [23,24,25,26,27,28]. Surrogate-based optimization is a direct design method, which is also computationally efficient for complex design models. Several surrogate models have recently been studied. The artificial neural network (ANN) model handles complex design problems better than other models, and also converges in fewer iterations [29,30,31]. Using a trained ANN model during optimization enables application of fast search algorithms efficiently [32].
Reports in the literature have provided sufficient information on the effects of viscosity and geometric design parameters, which can improve the performance of a centrifugal pump, but the combined effect of impeller geometry and pumping fluid viscosity has been rarely presented. Additionally, the effect of splitter and wrap angle of the impeller blades on the performance of pump has not been presented earlier; thus, in this study the combined effect of these design parameters on the performance of the pump while pumping viscous oil and its relationship is presented. Here, an ANN-based direct design optimization technique is adopted to optimize the performance of a centrifugal pump for pumping four different viscous fluids. The pump was optimized for each fluid property as a separate case, and then a combined relationship of blade geometry with the viscosity of fluid is presented in this work. An optimum impeller design for maximum head and minimum input power for each fluid is also provided.

2. Geometric Model and Numerical Simulations

2.1. Geometric Model

The geometry used in this study is of a centrifugal pump flow domain, which is created using CATIA V5 modeler and ANSYS BladeGen 16.1. The domain comprises an impeller, its volute (diffuser), clearance flow domain adjacent to the hub, and the impeller shroud (Figure 1). The extension flow domains at the inlet and outlet of the pump do not outturn significant change in the pump performance while doing steady flow simulation [8,17], thus, it is avoided to reduce computational time. The detailed dimensions of the pump geometry are presented in Table 2. The impeller has five backward blades with 10° and 40° inlet blade angles at the shroud and hub, respectively, and a 36° outlet blade angle, with a 170° wrap angle from the inlet to the impeller outlet.
The impeller flow domain with splitter blades is modeled using ANSYS BladeGen module 16.1. Here, the splitter blade profile follows the main blade profile (Figure 2). The trailing edge (TE) remains unchanged, whereas the leading edge (LE) position is changed in a ratio from 0.1 to 0.9 of the main blade arc length.

2.2. Grid Generation

The fluid domain is split into four components: impeller, volute casing, hub, and shroud clearance. The volute casing, hub, and shroud clearance are stationary components. The mesh for these components, therefore, contains unstructured tetrahedral and pyramid elements. For the impeller flow passage, on the other hand, the generated mesh comprises an unstructured tetrahedral and prism element layer near the blade surface (Figure 3). It is important to capture the near-wall boundary phenomenon, so the nondimensional distance (Y+) near the blade surface is maintained below 5, as recommended for the SST turbulence model [33]. The impeller blade passage consists of 20 prism layers with the first cell height at 0.02 mm from the blade surface. The growth rate of 1.2 can also be visualized (Figure 3) at the impeller blade leading edge (LE) and the trailing edge (TE). The grid independence tests are conducted to limit the maximum element size requirement. Figure 4 shows the mesh convergence plot of head (H) verses the number of elements. Here, the size of the flow domain body elements vary from 2.25 to 1 mm in five steps; the total mesh elements increase from 0.9 to 3.8 million, where the mesh domain with 3.1 million elements shows convergence of the mesh. The computer facility used for simulation has a six-core processor and 24 gigabyte RAM, which takes an average of 13 h to converge one simulation case of 3.1 million elements to a residual target of 10−5.

2.3. Numerical Formulation

Fluid flow is simulated by solving the three-dimensional (3D) Navier-Stokes equations using ANSYS CFX module version 16.1. The upwind scheme is adopted for discretization of the governing equations. The fluid can be assumed as incompressible, and its steady numerical calculation is carried out to obtain the performance of the pump. The inflow and outflow boundary conditions are set as total pressure and mass flowrate, respectively, with a convergence criterion of the residual target as 10−5. The Reynolds-averaged Navier-Stokes (RANS) equations in three dimensions are given as follows:
Continuity equation,
. v = 0
Momentum equation,
v . v = 2 ω × v + ω 2 · r 1 ρ · · τ
where v is the relative fluid velocity vector in 3D space and ω is the angular speed of impeller at a radial location r . The viscous stress ( τ ) is a tensor quantity and a combination of the viscous and turbulence viscosity terms, which can be represented as follows:
τ i j = 2 μ · s i j ρ · v i v j ¯
Here, μ and s i j represent the product of fluid viscosity and the mean strain tensor, respectively. The next term in Equation (3) represents the Reynolds stresses in 3D space.

3. Experimental Testing

3.1. Setup Design

The experimental flow loop setup is designed as per the ISO 5198-1987 standard with an appropriate piping system to study the centrifugal pump performance, while also pumping water or oil through it (Figure 5). The centrifugal pump used here is a low-specific speed pump with a design specification of 20 ft head and 220 L/min discharge at 1340 rpm. The inlet and outlet pressures are measured using mechanical pressure gauges, whereas the flowrate is measured using an ultrasonic mass flowmeter with uncertainties (Table 3). The input power is calculated using an energy meter with an efficiency of 0.85, including the motor loss. The hydraulic power of pump can be calculated using Equation (4), given as:
P o = ρ g H Q
where ρ is the density, g is the acceleration due to gravity, and H is the net head generated by the pump, which can be expressed as:
H = Δ P ρ g + V 2 2 V 1 2 2 g
where ΔP and V represent the differential pressure and average flow velocity at the two sections (inlet and outlet) of pump.

3.2. Rheological Properties of Fluids

The pump performance is analyzed using five different fluids: water and four blended oils (namely, C1, C2, C3, and C4). These oils were prepared by diluting the filtered SAE 10 W-40 lube oil of dynamic viscosity μ = 65 mPaS with diesel at normal temperature and pressure. The blended oil was prepared to vary the viscosity of the lube oil, with which the pump performance can be evaluated, and the head and input power then plotted against the flowrate characteristic curves [34]. The fluid properties at normal temperature and pressure are presented in Table 4. The dynamic viscosity of fluids needs to be measured to understand the fluid rheological properties of the fluid; thus, rheometer MCR301 was used, as shown in Figure 6, while the density was measured using a hydrometer. The effect of shear rate on the shear stress and viscosity obtained through the rheometer is shown in Figure 7.

4. Design Optimization

Design optimization of complex geometries, such as turbines, compressors, and centrifugal pumps, is time-consuming because numerical simulations for multiple design cases may take months to complete. Direct design optimization, a recently introduced technique, uses surrogate-model-assisted optimization. In this work, numerical simulations are conducted first for sample design points to generate a database for the input variable versus the objective response. Afterward, the database is used to train a surrogate model. The surrogate model mimics the response generated from high-fidelity models, and predicts their responses for the design space. Genetic algorithms coupled with surrogate models are used next to search for an optimum point within the design space. The optimization process is shown in Figure 8. The entire optimization process can be divided into two parts. The simulation process is first, where the geometry is simulated and validated with experimental results. The optimization process is second, which follows the design of experiment (DOE), numerical simulations at sample design points, surrogate training, and the search for optimum design. Here, the selection of the type of surrogate model is important, and can be decided based on its capability for handling complex geometries where it mimics the response of a few sample designs. For decades, ANN has been used effectively for the design optimization of turbomachine components [29,32].

4.1. Artificial Neural Network

The artificial neural network (ANN) is a mathematical metamodel that works similarly to the human nervous system. The data fed to it are initially used to train the model based on the assigned weights and biases. Then, when a new input datum is provided, the ANN compares it with the existing data and predicts its own output. In this way, it mimics the human function of predicting from prior knowledge and experience. Mathematically, a radial basis function is used as a hidden layer between the two layers of input and output (Figure 9) and can be expressed as,
g x = i = 1 n w i α i
where g(x) is the output function, α is the radial basis function, and n is the number of artificial neurons. A bias term should be added for giving weightage to the hidden layers. The radial basis function α can be expressed as:
α = e x c 2 r 2
where c represents the center at r distance of the artificial neuron parameters worked using a Gaussian function. The artificial neurons generate networks with a value predicted at each level of the network along with its weights, which help to train patterns. Further, artificial neuron network training is provided with new values and adjustments using cross-validation errors by changing parameters such as spread constant (sc) and error goal (EG).

4.2. Multiobjective Optimization

The problem here can be formulated as two variables (splitter blade length X1 and wrap angle X2) and two objectives, i.e., maximizing the head (H) and minimizing the input power (ψ). The design variable X1 varied from 0.1 to 0.9 of main blade length and the wrap angle varied from 90 to 180. The sample design was generated using the full factorial sampling technique with four levels; a total of 16 sample designs were generated for each optimization case. The multiobjective functions often conflict with each other because if one objective improves, the other degrades. This type of optimization problem has no single optimal solution. Thus, for such multiobjective optimization problems, a set of optimal designs solutions or a Pareto optimal front (POF) is generated.
The nondominated GA (NSGA-II) [35] replaced the sharing function approach of its previous version NSGA with a crowded comparison approach. In this work, NSGA-II is coupled with the surrogate model ANN to predict the optimal solution and generate POF using MATLAB codes. The POF, representing optimal solutions for the problem, needs to be again revalidated through CFD simulations to affirm its reliability.

5. Results and Discussion

The effect of impeller geometry, especially, and the splitter blade length and wrap angle on the viscosity of pumping fluid were studied. The pump was optimized for pumping fluids ranging from 1 to 65 mPaS to develop a relationship of splitter length and wrap angle with the viscosity. The first optimization case was conducted in our previous work [17] by simulating the flow domain called (Ref1) with water as fluid, following which the impeller design was optimized for maximum head and minimum input power. Similarly, in this work, Ref2, which is the optimized design of Ref1, is now simulated considering the other four oils: C1, C2, C3, and C4, having respective viscosities of 4.5, 14, 26, and 65 mPaS and optimized as a separate case. Later, for performance comparison two optimized impeller designs, one for maximum head and the other for minimum input power, were selected from each POF.

5.1. Validation

Experiments were conducted to find the performance of the centrifugal pump with Ref1 impeller design while pumping different viscosity fluids (water, C1, C2, and C3) only. Owing to the limitations of the experimental facility, performance testing with C4 oil was avoided. To plot the pump performance curve and pressure in the inlet and outlet of the pump, the input power to the motor was measured at different flowrates. The flowrate at which the pump gave the best performance was the design flowrate (Qd). whereas the other flowrates are referred to as off-design flowrates (Q). Qd decreases as the fluid viscosity increases; the performance curves are shown in Figure 10.
Later, the above experimental pump performance results were used for the validation of the numerically simulated pump performance. The initial numerical simulations were performed with the Ref1 impeller design, with different fluids. The performance curve obtained by numerical simulation using water as the fluid are said to be Ref1; similarly, for C1, C2, C3, and C4 fluids are referred to as Ref2, Ref3, Ref4, and Ref5, respectively. Afterward, the simulation results are validated by comparing them with experimental pump performance results, as shown in Figure 10. Figure 10a,b compare head rise (H) and input power (Ψ) with respect to Q/Qd for water, C1, C2, and C3 only. In both cases, the numerical results are in good agreement with the experimental outcomes with a deviation below 5% for both design and off-design conditions [36,37]. Since the numerical simulation results for other fluids converges with the experimental results, the simulation results for C4 fluid is also assumed to be reliable.

5.2. Optimizations

The design of a centrifugal pump impeller is a complex process where modifying one parameter affects the other parameters. Therefore, optimization for the centrifugal pump impeller is conducted by implementing splitter blades and varying wrap angles. The pump was optimized while pumping water, C1, C2, C3, and C4 oils as separate optimization cases. The optimized design for each is presented as a Pareto optimal front (POF), as shown in Figure 11, Figure 12, Figure 13 and Figure 14. These are the final predicted optimal solutions obtained using the NSGA-II search algorithm followed by several iterations, and simultaneous validations using numerical simulations. The POF represent the nondominated optimal point between two contradictory objective functions where improving one degrades the other. The final optimized design from POF can be selected by a pump manufacturer based on application. However, for comparing validation and performance between two extreme design points, such as “a” and “e” (Figure 11, Figure 12, Figure 13 and Figure 14), points are selected from each POF case and simulated using CFD to check its reliability, as shown in Table 5. The Opt1e design represents maximum head rise, whereas the Opt1a design represents minimum input power. When the root mean square deviation (RMSD) of each design cases converges with the numerically simulated results, then the reliability of the POF is present.
Here, ANN models were trained using sample design responses of high fidelity models and predict further designs in the entire design range. The ANN as a surrogate or low fidelity model performs better with small sample design points with great accuracy [31,38]. The values are predicted by a network training function, such as the radial basis function in ANN models and through training patterns, which are stored as error goals. The training can be controlled by adjusting error goals and spread constraints. This helps to predict accurate for verities of design problems for less computational time.

5.3. Performance Curves

The performance of a centrifugal pump for reference design and optimized design for each case is presented in Figure 15, Figure 16, Figure 17 and Figure 18. More significant head improvement was observed for pumping viscous fluids than while pumping water (Figure 15b and Figure 18b). It can also be observed that the pump performance of the optimized design improved at an off-design condition when compared to the reference design (Figure 17 and Figure 18). The improvement in head rise affects input power more significantly for water than for other viscous fluids (C1, C2, C3, and C4), which can be observed in Figure 15a and Figure 18a. The viscous fluid increases skin friction loss in the blade flow passage, causing a pressure drop and input power loss, whereas in less viscous fluid, recirculation causes flow blockage at off-design conditions. Modifying the wrap angle increases the blade flow passage area and pressure drops in viscous fluid, but also improves recirculation losses in less viscous fluids.
Adding splitter blades improves head, as reported by previous authors. The splitter blade reduces the recirculation losses in the blade flow passage, and with uniform blade loading, enhances pump. The head-rise improves, as is observed in the off-design flowrate as well (Figure 15b, Figure 16b, Figure 17b and Figure 18b). The reason for the improvement in pump performance for the optimized design is presented in the next section.

5.4. Flow Analysis

The optimized designs (Opt1a and Opt1e) for each case, i.e., water, C1, C2, C3, and C4, were compared with the reference designs (Refs). Streamlines, pressure contours, and vortex flow regions were generated to understand the fluid flow pattern in the blade passage and volute casing. Figure 19 shows streamlines at the midspan of the reference design and the optimal designs. The optimal designs, Opt1e, Opt2e, Opt3e, and Opt4e, which denote maximum head in each case, show reduced recirculation in blade passages when compared to the reference designs, Refs. 1, 2, 3, and 4, respectively. These trends indicate that reduction in recirculation reduces the hydraulic losses and improves the impeller outlet flow velocities. Additionally, it represents a uniform blade loading, which generates higher flow velocities, and ultimately enhances the pump head [21].
Figure 20 shows for each case the static pressure contour at the midspan. The pressure contour in a centrifugal pump can be divided into three zones: the inlet suction zone, blade passage zone, and the impeller outlet pressure zone, represented in Figure 20a. The impeller designs with splitter blades show a significant change in pressure patterns at the inlet suction and the blade passage zones, which indicate the improvement of the pump total head. The impeller design with a smaller wrap angle and splitter blade further improves the total head of the pump. Additionally, the length of the splitter blade plays an important role in further improving head the while pumping viscous fluids.
The pressure distribution characteristics at the impeller mid-plane were plotted, as shown in Figure 21. A comparison was made between the reference design Ref2 and the optimized design (Opt2a) for average pressure along the flow passage. The pressure distribution is not symmetric for all blade passages of the Ref2 impeller design. At the inlet of the blade leading edge (LE), a low pressure region is shown with lags in pressure value in case of Ref2, whereas a uniform pressure distribution from LE to the blade trailing edge (TE) can be observed in the optimized design impeller for example (Opt2a). A similar pattern was reported by previous authors for the investigation of a centrifugal pump flow passage [17].

5.5. Turbulent Characteristics

The effect of turbulent characteristics for improving pump performance, especially in the case of viscous liquids, can be understood by plotting velocity contours over the vortex core region and capturing turbulent kinetic energy (k) over the midspan (Figure 22 and Figure 23).
A vortex can be defined as the curl of velocity field in the fluid flow, i.e., × u where u is the velocity field vector in 3D space (x, y, and z). In a centrifugal pump, the speed of fluid particles is inversely proportional to the distance from the axis of rotation. Thus, an irrotational vortex is generated, which can be expressed as   × u = 0 , which only occurs under the influence of a body or pressure force. Here, the presence of viscous forces produces rotation under the action of shear stress, and thus, results in angular deformation. Figure 22 shows velocity contours at the vortex core region of the flow passage. Viscous forces are dominant in a highly viscous fluid, which creates a vortex in the flow passage, thereby, increasing the energy to transport fluid and improving the pump head. The increase in vortex core region and flow velocity at the impeller outlet can be easily visualized in the optimized designs, Opt2e and Opt5e of oil cases C1 and C4.
The turbulent kinetic energy k, the mean kinetic energy per unit mass that captures eddies in turbulent flow, can be written as:
k = 1 2 m u m u m ¯ = 1 2 u 1 u 1 ¯ + u 2 u 2 ¯ + u 3 u 3 ¯
Here, k contains the normal Reynolds stress tensor that helps in capturing strong rotating flow, which is very common in a centrifugal pump. The k value contours plotted for oil C1 and C4 cases and comparison between reference and optimized design are presented in Figure 23. It shows the combined influence of velocity and pressure distribution for the reference and the optimized impeller design for both cases on the midspan of the flow passage. The reference design of low viscous oil C1 shows high turbulence in the blade passage and the optimized design shows reduction in turbulence at the blade passage, thus causing improvement in flow velocity and improved pump performance. In case of high viscosity oil (C4), the phenomena is exactly opposite; the viscous forces decrease the flow velocity and reduce the pump performance, which can be understood through the turbulent kinetic energy in Ref5, contoured in Figure 23b. The reference case (Ref5) shows the least turbulent region in volute flow passage, whereas the optimized impeller design improves the k value in the volute flow passage as well. Here, the fluid flowing through the impeller with the optimized splitter blade design not only increases turbulent kinetic energy, but also enhances the geometric streamline structure, which completes the energy transmission and improves the head of the pump.

5.6. Effect of Viscosity on Pump Performance

The optimal designs for minimized input power (I/P) and maximized head are presented in Table 6, and the relationship between impeller geometry and viscosity are shown in Figure 24. Here, the relationship between wrap angle and splitter length with respect to viscosity for minimizing input power are presented in Figure 24a, which shows that increasing splitter length with slight decreases in wrap angle are preferred for pumping highly viscous oil compared to low viscous fluid. For targeting maximized head as well, a lower wrap angle is preferred for pumping viscous oil compared to less viscous oil (Figure 24b).
Figure 25, Figure 26 and Figure 27 show the effect of viscosity on the performance of the reference designs (Ref1–5) and the optimized design for maximizing head rise (Opt1e–5e) and minimizing input power (Opt1a–5a). There is a significant drop in pump head with the increase in viscosity: as the viscosity of the oil increases, the pump head decreases gradually at the design and off-design points (Figure 25b), and with an increase in input power at the off-design points of higher flowrates (Figure 25a). The pump performance drops owing to the increase in disk friction at the pump clearance and skin friction losses at the flow passages. Now, when the pump impeller is optimized by introducing splitter blades and manipulating wrap angle, the pump performance improves while pumping viscous oils. The pump was optimized for maximizing head and minimizing input power. The pump head improves for optimized impeller design (Opt1e–5e) with a small increase in input power at all design points as well. When compared to its reference design, the increment is due to uniform blade loading that is observed throughout the blade passage for the optimized impeller design (Figure 21).

6. Conclusions

This work focused on developing a relationship between centrifugal pump impeller geometry and viscosity of the pumping fluids to predict impeller design based on pumping viscous fluids. By introducing splitter blades and manipulating their wrap angles, centrifugal pump impeller geometry was optimized while pumping viscous oils of different viscosities. Multiobjective optimization aimed at maximizing the head and minimizing the input power was achieved in this work by using an artificial neural network and popular NSGA-II evolutionary algorithms. This approach efficiently searches for optimum design points in minimum iteration while handling two different contradictory objective functions.
Adding splitter blades prove to be beneficial for pumping light and medium viscous oils ranging from 0 to 80 mPaS. The performance of a centrifugal pump deteriorates while pumping viscous fluids with conventional impeller design, but the proposed optimized impeller design shows significant improvement in the pump performance. As the oil viscosity increases, impeller designs with large splitter length and small wrap angle significantly improve head. If also targeted to minimize the input power, large splitter length with a wrap angle from 150° to 160°, which shows less input power requirement, is recommended. The length of the splitter blade is found to be more sensitive toward input power, whereas the wrap angle is sensitive to head rise while pumping viscous oils.
This study will be useful in designing centrifugal pump impellers for pumping oils that target specific application in industry to improve pump performance. The cavitation phenomena and transient flow performance can be studied for centrifugal pumps with splitter blades.

Author Contributions

M.H.S., Conceptualization, methodology, validation and writing original draft; B.K., software, formal analysis, resources, project administration; A.S., Validation, review and editing; G.H., review and editing; D.-E.L., supervision. All authors have read and agreed to the published version of the manuscript.

Funding

This research was funded by the National Research Foundation of Korea (NRF) through grants funded by the Korea government (MSIT) (NRF-2018R1A5A1025137 and 2022R1C1C1005409).

Institutional Review Board Statement

Not applicable.

Informed Consent Statement

Not applicable.

Data Availability Statement

Data available on required to corresponding author.

Conflicts of Interest

The authors declare no conflict of interest.

References

  1. Bellary, S.A.I.; Samad, A. Pumping crude oil by centrifugal impeller having different blade angles and surface roughness. J. Pet. Explor. Prod. Technol. 2015, 6, 117–127. [Google Scholar] [CrossRef]
  2. Gülich, J. Pumping highly viscous fluids with centrifugal pumps—Part 2. World Pumps 1999, 1999, 39–42. [Google Scholar] [CrossRef]
  3. Li, W.-G. Effects of viscosity of fluids on centrifugal pump performance and flow pattern in the impeller. Int. J. Heat Fluid Flow 2000, 21, 207–212. [Google Scholar] [CrossRef]
  4. Varley, F.A. Effects of Impeller Design and Surface Roughness on the Performance of Centrifugal Pumps. Proc. Inst. Mech. Eng. 1961, 175, 955–989. [Google Scholar] [CrossRef]
  5. Shao, C.; Zhao, Y. Numerical study of the dimensionless characteristics and modeling experiment of a molten salt pump that transports viscous fluids. Int. J. Numer. Methods Heat Fluid Flow 2017, 27, 2131–2153. [Google Scholar] [CrossRef]
  6. ANSI/HI 1.3-2013; Rotodynamic Centrifugal Pumps for Design and Application (Manual). Hydraulic Institute: Parisippany, NJ, USA, 2005.
  7. Ofuchi, E.; Cubas, J.; Stel, H.; Dunaiski, R.; Vieira, T.; Morales, R. A new model to predict the head degradation of centrifugal pumps handling highly viscous flows. J. Pet. Sci. Eng. 2020, 187, 106737. [Google Scholar] [CrossRef]
  8. Tan, L.; Zhu, B.; Cao, S.; Bing, H.; Wang, Y. Influence of blade wrap angle on centrifugal pump performance by numerical and experimental study. Chin. J. Mech. Eng. 2014, 27, 171–177. [Google Scholar] [CrossRef]
  9. Westra, R.W.; Broersma, L.; Van Andel, K.; Kruyt, N.P. PIV Measurements and CFD Computations of Secondary Flow in a Centrifugal Pump Impeller. J. Fluids Eng. 2010, 132, 061104. [Google Scholar] [CrossRef]
  10. Liu, J.; Li, Z.; Wang, L.; Jiao, L. Numerical Simulation of the Transient Flow in a Radial Flow Pump during Stopping Period. J. Fluids Eng. 2011, 133, 111101. [Google Scholar] [CrossRef]
  11. Stepanoff, A.J. Centrifugal and Axial Flow Pumps: Theory, Design and Application, 2nd ed.; Chapman and Hall: London, UK, 1957; Available online: https://cir.nii.ac.jp/crid/1573387449864191104 (accessed on 17 August 2022).
  12. Li, X.; Gao, P.; Zhu, Z.; Li, Y. Effect of the blade loading distribution on hydrodynamic performance of a centrifugal pump with cylindrical blades. J. Mech. Sci. Technol. 2018, 32, 1161–1170. [Google Scholar] [CrossRef]
  13. Peck, J. Investigations Concerning Flow Conditions in a Centrifugal Pump, and the Effect of Blade Loading on Head Slip. Proc. Inst. Mech. Eng. 1951, 164, 1–30. [Google Scholar] [CrossRef]
  14. Abramian, M.; Howard, J.H.G. Experimental Investigation of the Steady and Unsteady Relative Flow in a Model Centrifugal Impeller Passage. J. Turbomach. 1994, 116, 269–279. [Google Scholar] [CrossRef]
  15. Miyamoto, H.; Nakashima, Y.; Ohba, H. Effects of Splitter Blades on the Flows and Characteristics in Centrifugal Impellers. JSME Int. J. 1992, 35, 238–246. [Google Scholar] [CrossRef]
  16. Siddique, M.H.; Samad, A.; Hossain, S. Centrifugal pump performance enhancement: Effect of splitter blade and optimization. Proc. Inst. Mech. Eng. Part A J. Power Energy 2021, 236, 391–402. [Google Scholar] [CrossRef]
  17. Gölcü, M.; Usta, N.; Pancar, Y. Effects of Splitter Blades on Deep Well Pump Performance. J. Energy Resour. Technol. 2007, 129, 169–176. [Google Scholar] [CrossRef]
  18. Kergourlay, G.; Younsi, M.; Bakir, F.; Rey, R. Influence of Splitter Blades on the Flow Field of a Centrifugal Pump: Test-Analysis Comparison. Int. J. Rotating Mach. 2007, 2007, 85024. [Google Scholar] [CrossRef]
  19. Shigemitsu, T.; Fukutomi, J.; Kaji, K.; Wada, T. Performance and Internal Flow Condition of Mini Centrifugal Pump with Splitter Blades. Int. J. Fluid Mach. Syst. 2013, 6, 11–17. [Google Scholar] [CrossRef]
  20. Namazizadeh, M.; Gevari, M.T.; Mojaddam, M.; Vajdi, M. Optimization of the Splitter Blade Configuration and Geometry of a Centrifugal Pump Impeller using Design of Experiment. J. Appl. Fluid Mech. 2020, 13, 89–101. [Google Scholar] [CrossRef]
  21. Korkmaz, E.; Gölcü, M.; Kurbanoğlu, C. Effects of Blade Discharge Angle, Blade Number and Splitter Blade Length on Deep Well Pump Performance. J. Appl. Fluid Mech. 2017, 10, 529–540. [Google Scholar] [CrossRef]
  22. Xie, X.; Li, Z.; Zhu, B.; Wang, H.; Zhang, W. Multi-objective optimization design of a centrifugal impeller by positioning splitters using GMDH, NSGA-III and entropy weight-TOPSIS. J. Mech. Sci. Technol. 2021, 35, 2021–2034. [Google Scholar] [CrossRef]
  23. Kim, B.; Tse, K.; Chen, Z.; Park, H.S. Multi-objective optimization of a structural link for a linked tall building system. J. Build. Eng. 2020, 31, 101382. [Google Scholar] [CrossRef]
  24. Ezhilsabareesh, K.; Rhee, S.H.; Samad, A. Shape optimization of a bidirectional impulse turbine via surrogate models. Eng. Appl. Comput. Fluid Mech. 2017, 12, 1–12. [Google Scholar] [CrossRef]
  25. Trejo, A.; Martín, M.J.; Gómez-Quintana, A.; Cava, R.; García-Parra, J.J.; Ramírez, M.R. Effect of slicing of top quality (Montanera) Iberian dry-cured chorizo on the stability to high pressure treatment and storage. J. Food Sci. 2021, 86, 1963–1978. [Google Scholar] [CrossRef] [PubMed]
  26. Jaiswal, A.K.; Siddique, H.; Paul, A.R.; Samad, A. Surrogate-based design optimization of a centrifugal pump impeller. Eng. Optim. 2021, 54, 1395–1412. [Google Scholar] [CrossRef]
  27. Kim, B.-R.; Choi, S.-W. Selection of the Number and Location of Monitoring Sensors using Artificial Neural Network based on Building Structure-System Identification. J. Comput. Struct. Eng. Inst. Korea 2020, 33, 303–310. [Google Scholar] [CrossRef]
  28. Derakhshan, S.; Bashiri, M. Investigation of an efficient shape optimization procedure for centrifugal pump impeller using eagle strategy algorithm and ANN (case study: Slurry flow). Struct. Multidiscip. Optim. 2018, 58, 459–473. [Google Scholar] [CrossRef]
  29. Gileva, L.V.; Aksenov, A.A.; Kozhukhov, Y.V.; Petrov, A.Y. The study of Y+ influence on the results of ANSYS CFX flow simulation in the centrifugal compressor radial inlet. AIP Conf. Proc. 2020, 2285, 030038. [Google Scholar] [CrossRef]
  30. Al-Besharah, J.M.; Salman, O.A.; Akashah, S.A. Viscosity of crude oil blends. Ind. Eng. Chem. Res. 1987, 26, 2445–2449. [Google Scholar] [CrossRef]
  31. Deb, K.; Pratap, A.; Agarwal, S.; Meyarivan, T. A fast and elitist multiobjective genetic algorithm: NSGA-II. IEEE Trans. Evol. Comput. 2002, 6, 182–197. [Google Scholar] [CrossRef]
  32. Gulich, J.F. Centrifugal Pumps, 2nd ed.; Springer Publications: Berlin, Germany, 2010. [Google Scholar]
  33. Safikhani, H.; Khalkhali, A.; Farajpoor, M. Pareto Based Multi-Objective Optimization of Centrifugal Pumps Using CFD, Neural Networks and Genetic Algorithms. Eng. Appl. Comput. Fluid Mech. 2011, 5, 37–48. [Google Scholar] [CrossRef] [Green Version]
  34. Pourrahmani, H.; Siavashi, M.; Moghimi, M. Design optimization and thermal management of the PEMFC using artificial neural networks. Energy 2019, 182, 443–459. [Google Scholar] [CrossRef]
  35. Gülich, J.F. Disk friction losses of closed turbomachine impellers. Forsch. Im Ing./Eng. Res. 2003, 68, 87–95. [Google Scholar] [CrossRef]
  36. Cavazzini, G.; Pavesi, G.; Santolin, A.; Ardizzon, G.; Lorenzi, R. Using splitter blades to improve suction performance of centrifugal impeller pumps. Proc. Inst. Mech. Eng. Part A J. Power Energy 2014, 229, 309–323. [Google Scholar] [CrossRef]
  37. Zhang, Z.; Chen, H.; Yin, J.; Ma, Z.; Gu, Q.; Lu, J.; Liu, H. Unsteady flow characteristics in centrifugal pump based on proper orthogonal decomposition method. Phys. Fluids 2021, 33, 075122. [Google Scholar] [CrossRef]
  38. Wang, Y.; Yang, H.; Chen, B.; Gao, P.; Chen, H.; Zhu, Z. Analysis of vortices formed in flow passage of a five-bladed centrifugal water pump by means of PIV method. AIP Adv. 2019, 9, 075011. [Google Scholar] [CrossRef] [Green Version]
Figure 1. Computational flow domain of centrifugal pump.
Machines 10 00774 g001
Figure 2. Impeller flow domain with splitter blades (Ref1).
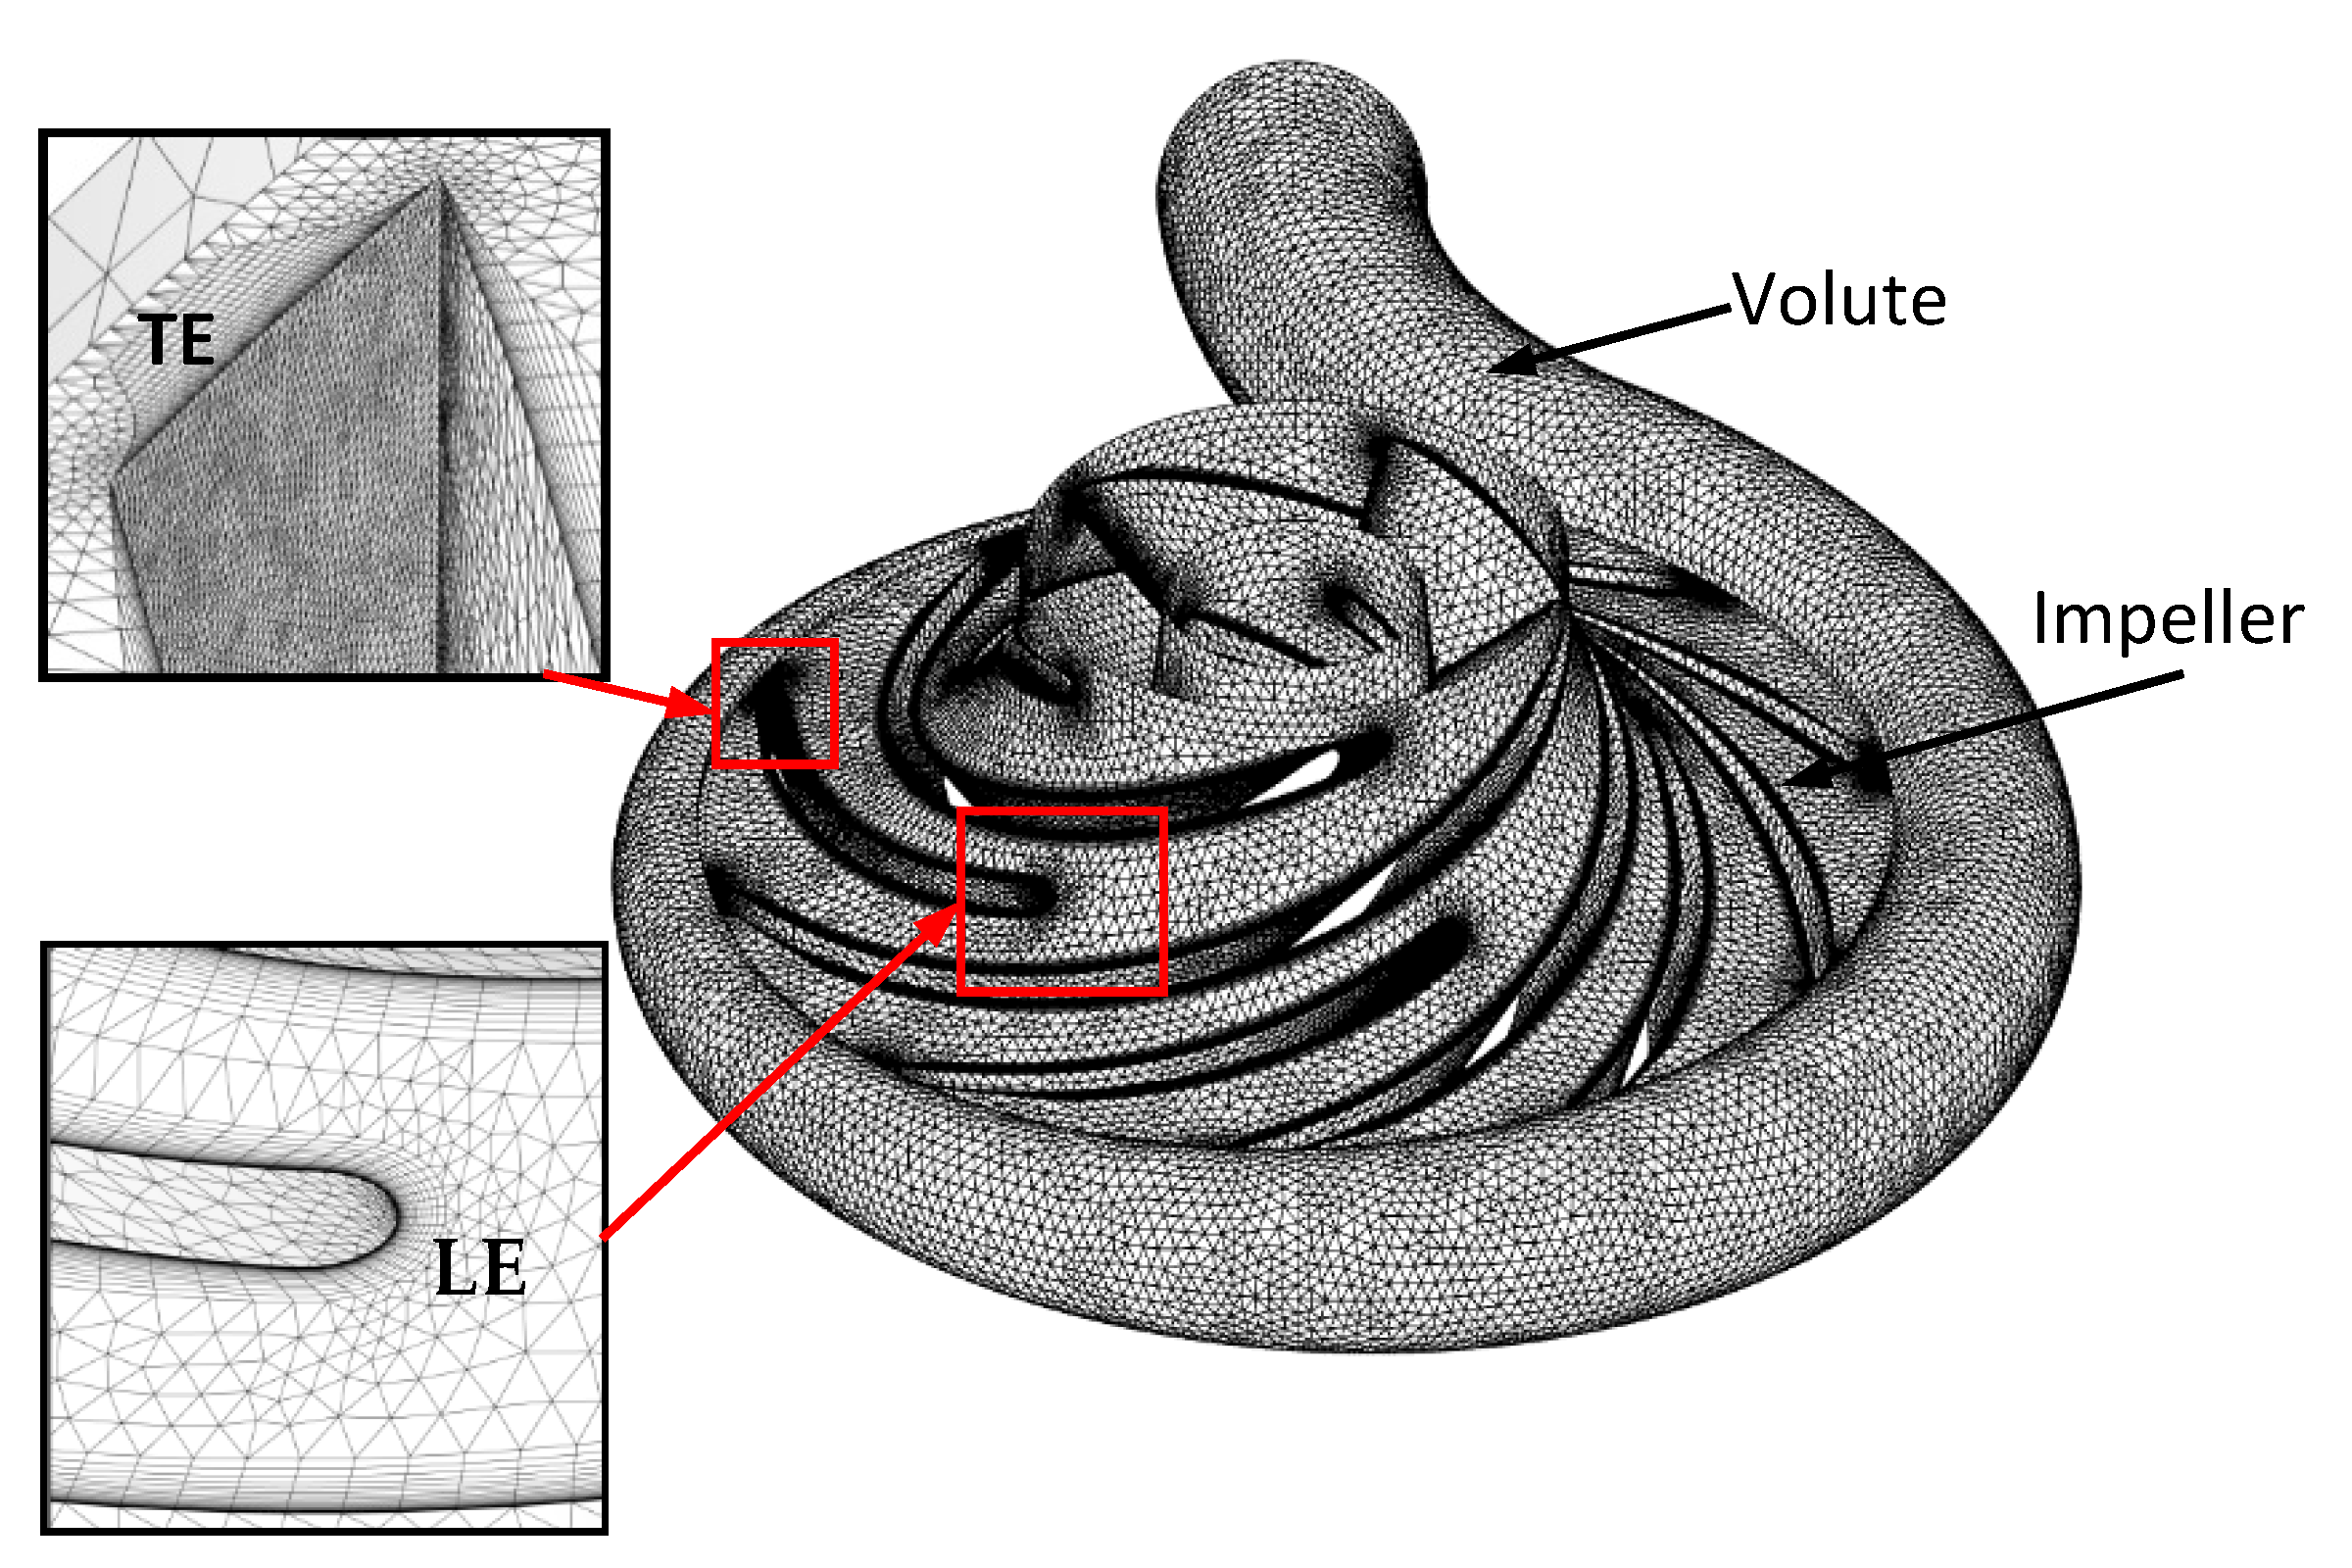
Machines 10 00774 g002
Figure 3. Flow domain mesh.
Machines 10 00774 g003
Figure 4. Grid independence test at the design flowrate.
Machines 10 00774 g004
Figure 5. Centrifugal pump test rig.
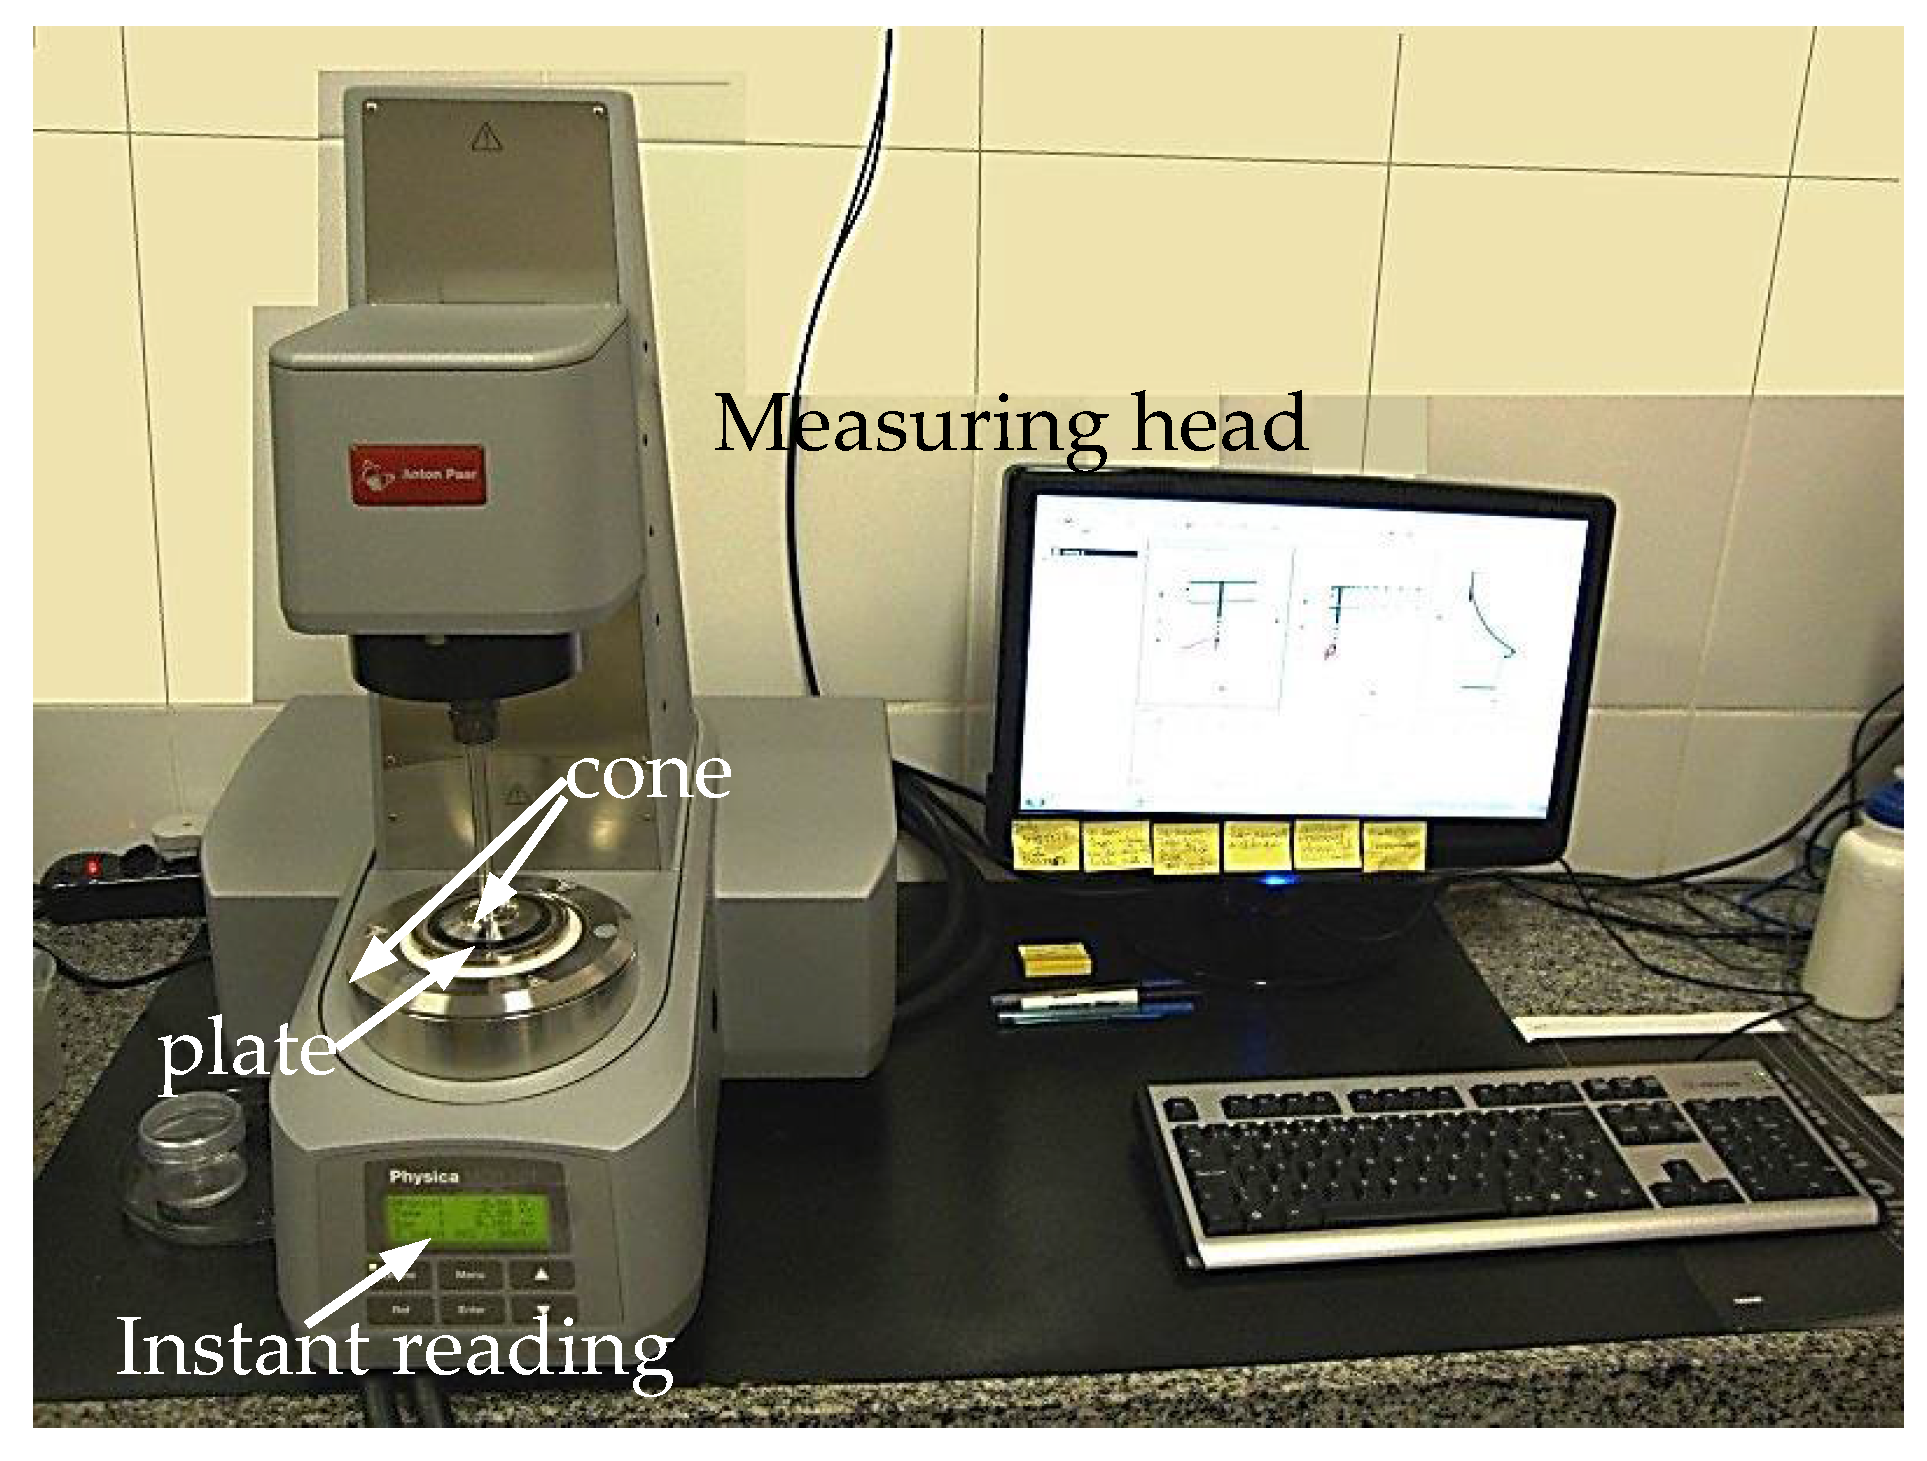
Machines 10 00774 g005
Figure 6. Rheometer MCR301.
Machines 10 00774 g006
Figure 7. Rheological fluid properties: (a) dynamic viscosity versus shear rate and (b) shear stress versus shear rate.
Machines 10 00774 g007
Figure 8. Flowcharts for simulation and optimization processes.
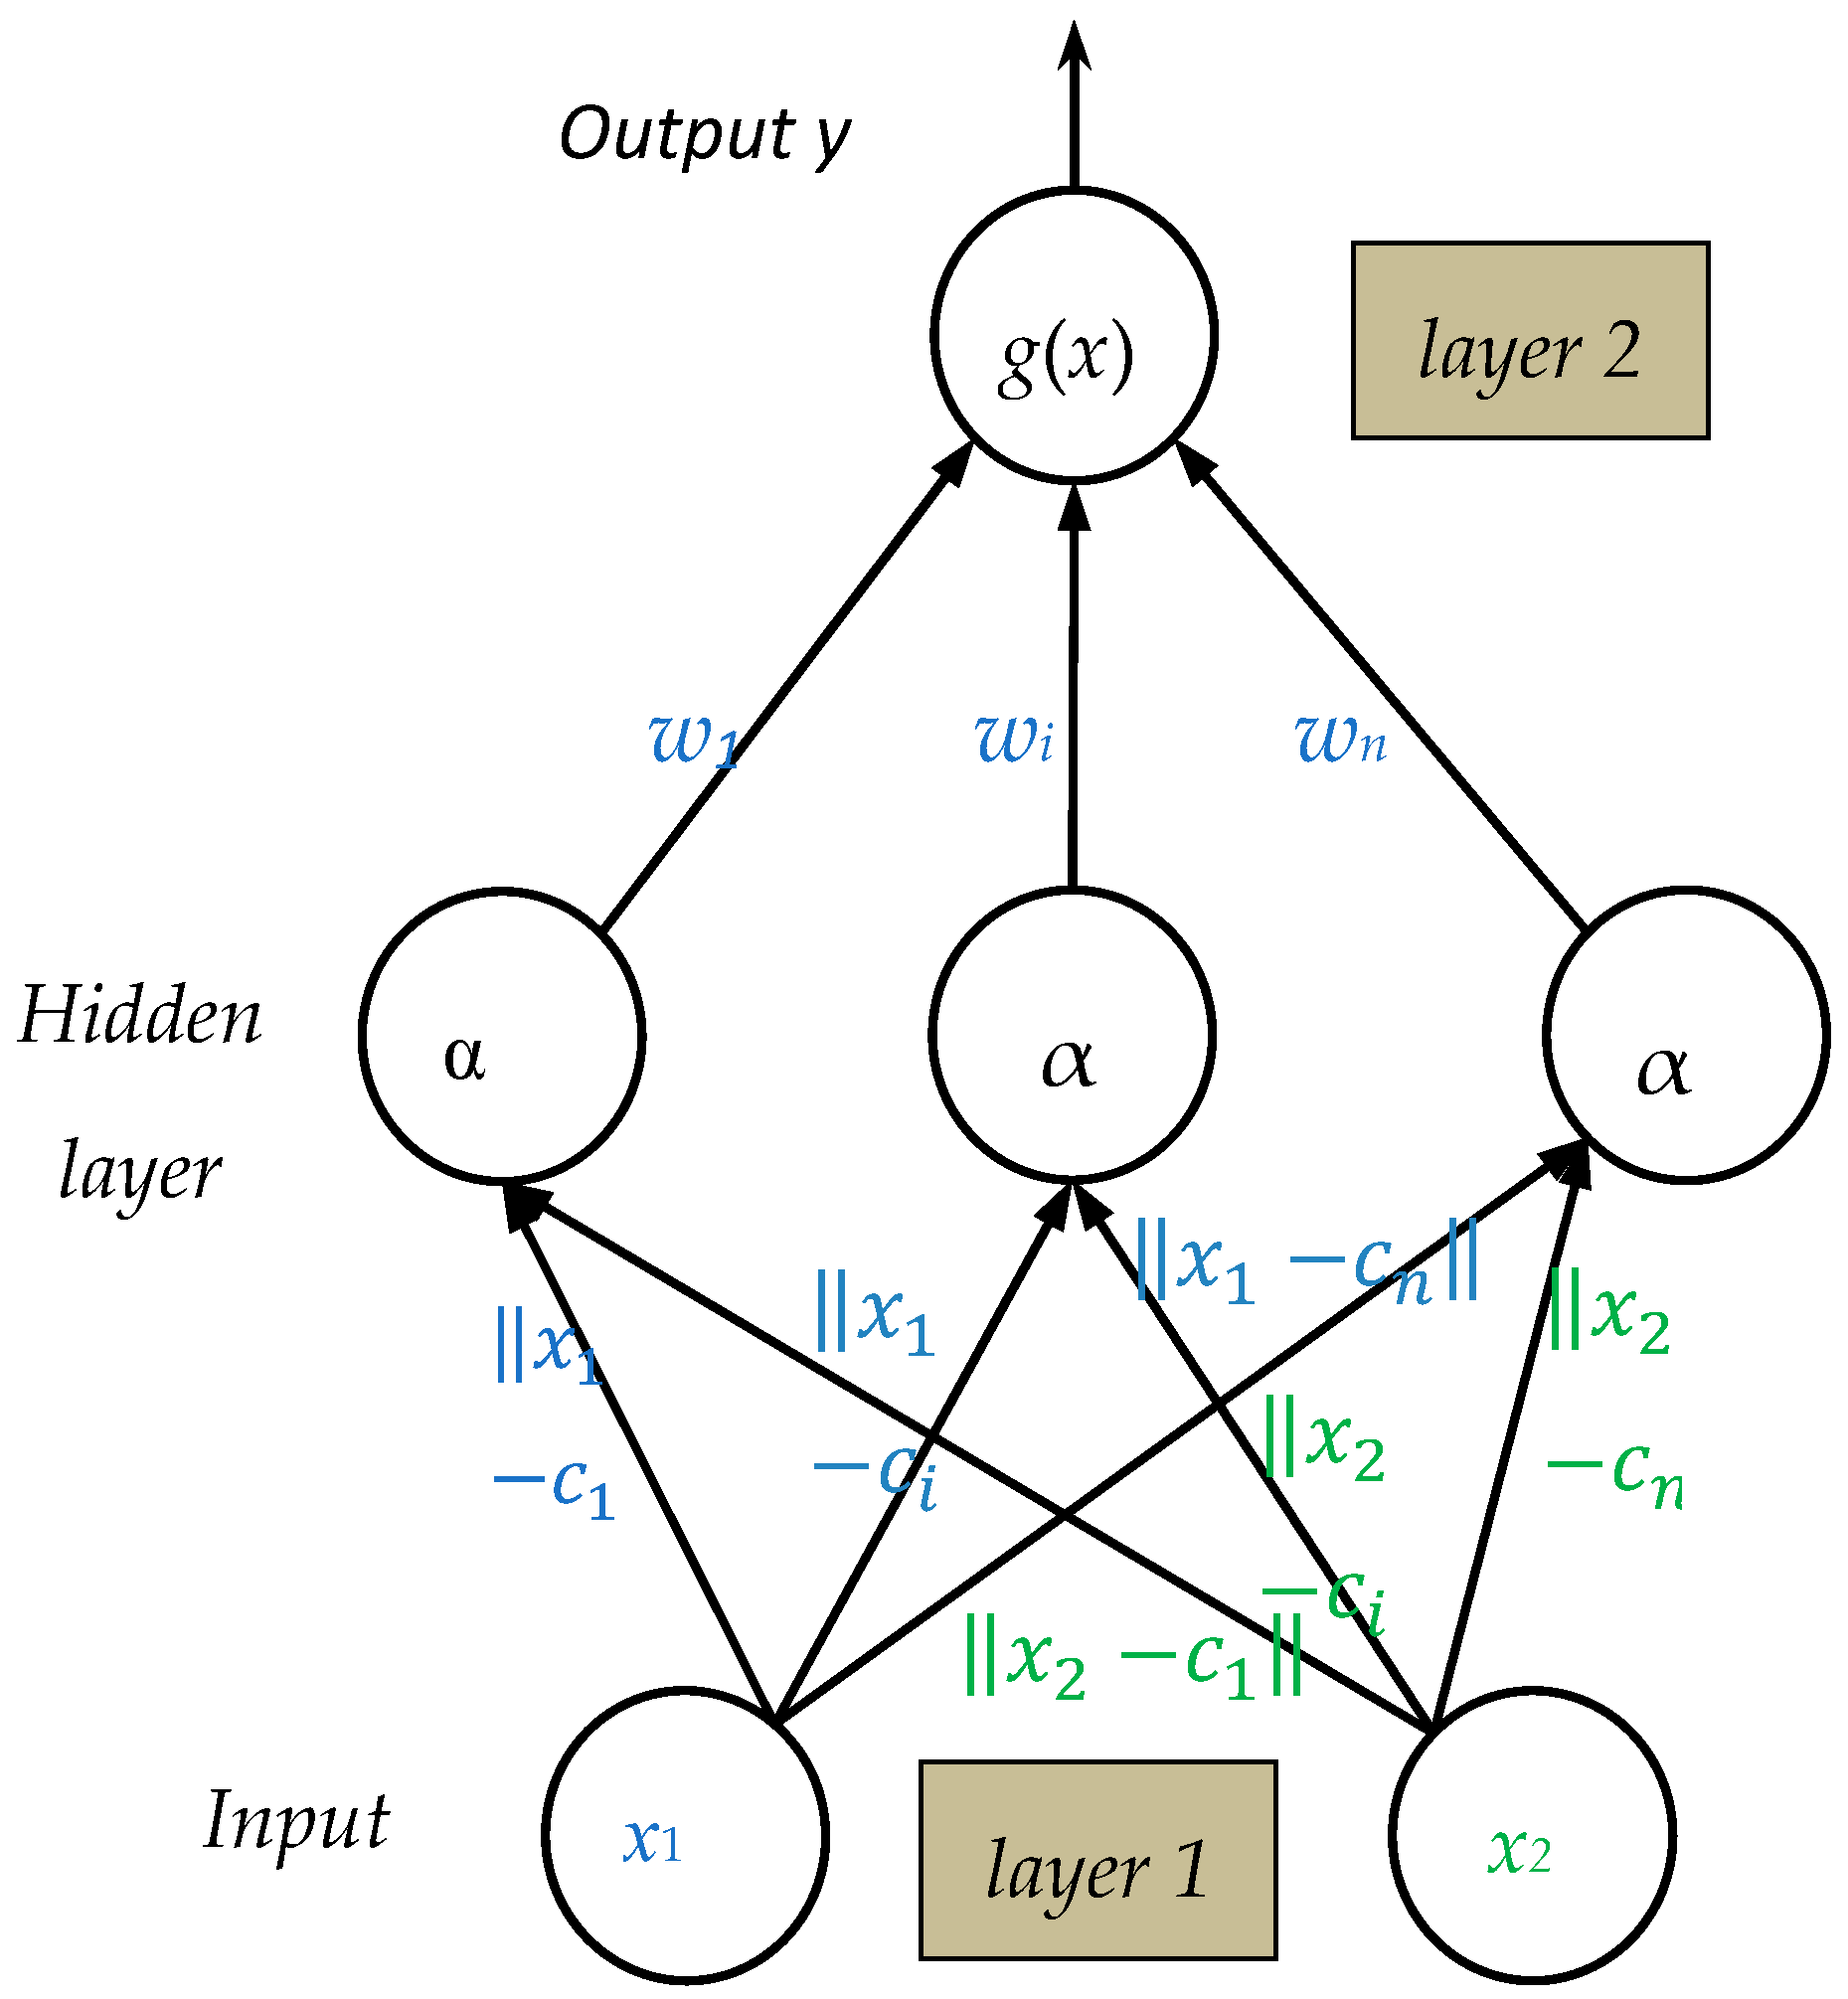
Machines 10 00774 g008
Figure 9. Architecture of ANN.
Machines 10 00774 g009
Figure 10. Validation of numerical results for all cases: (a) H versus Q/Qd and (b) Ψ versus Q/Qd.
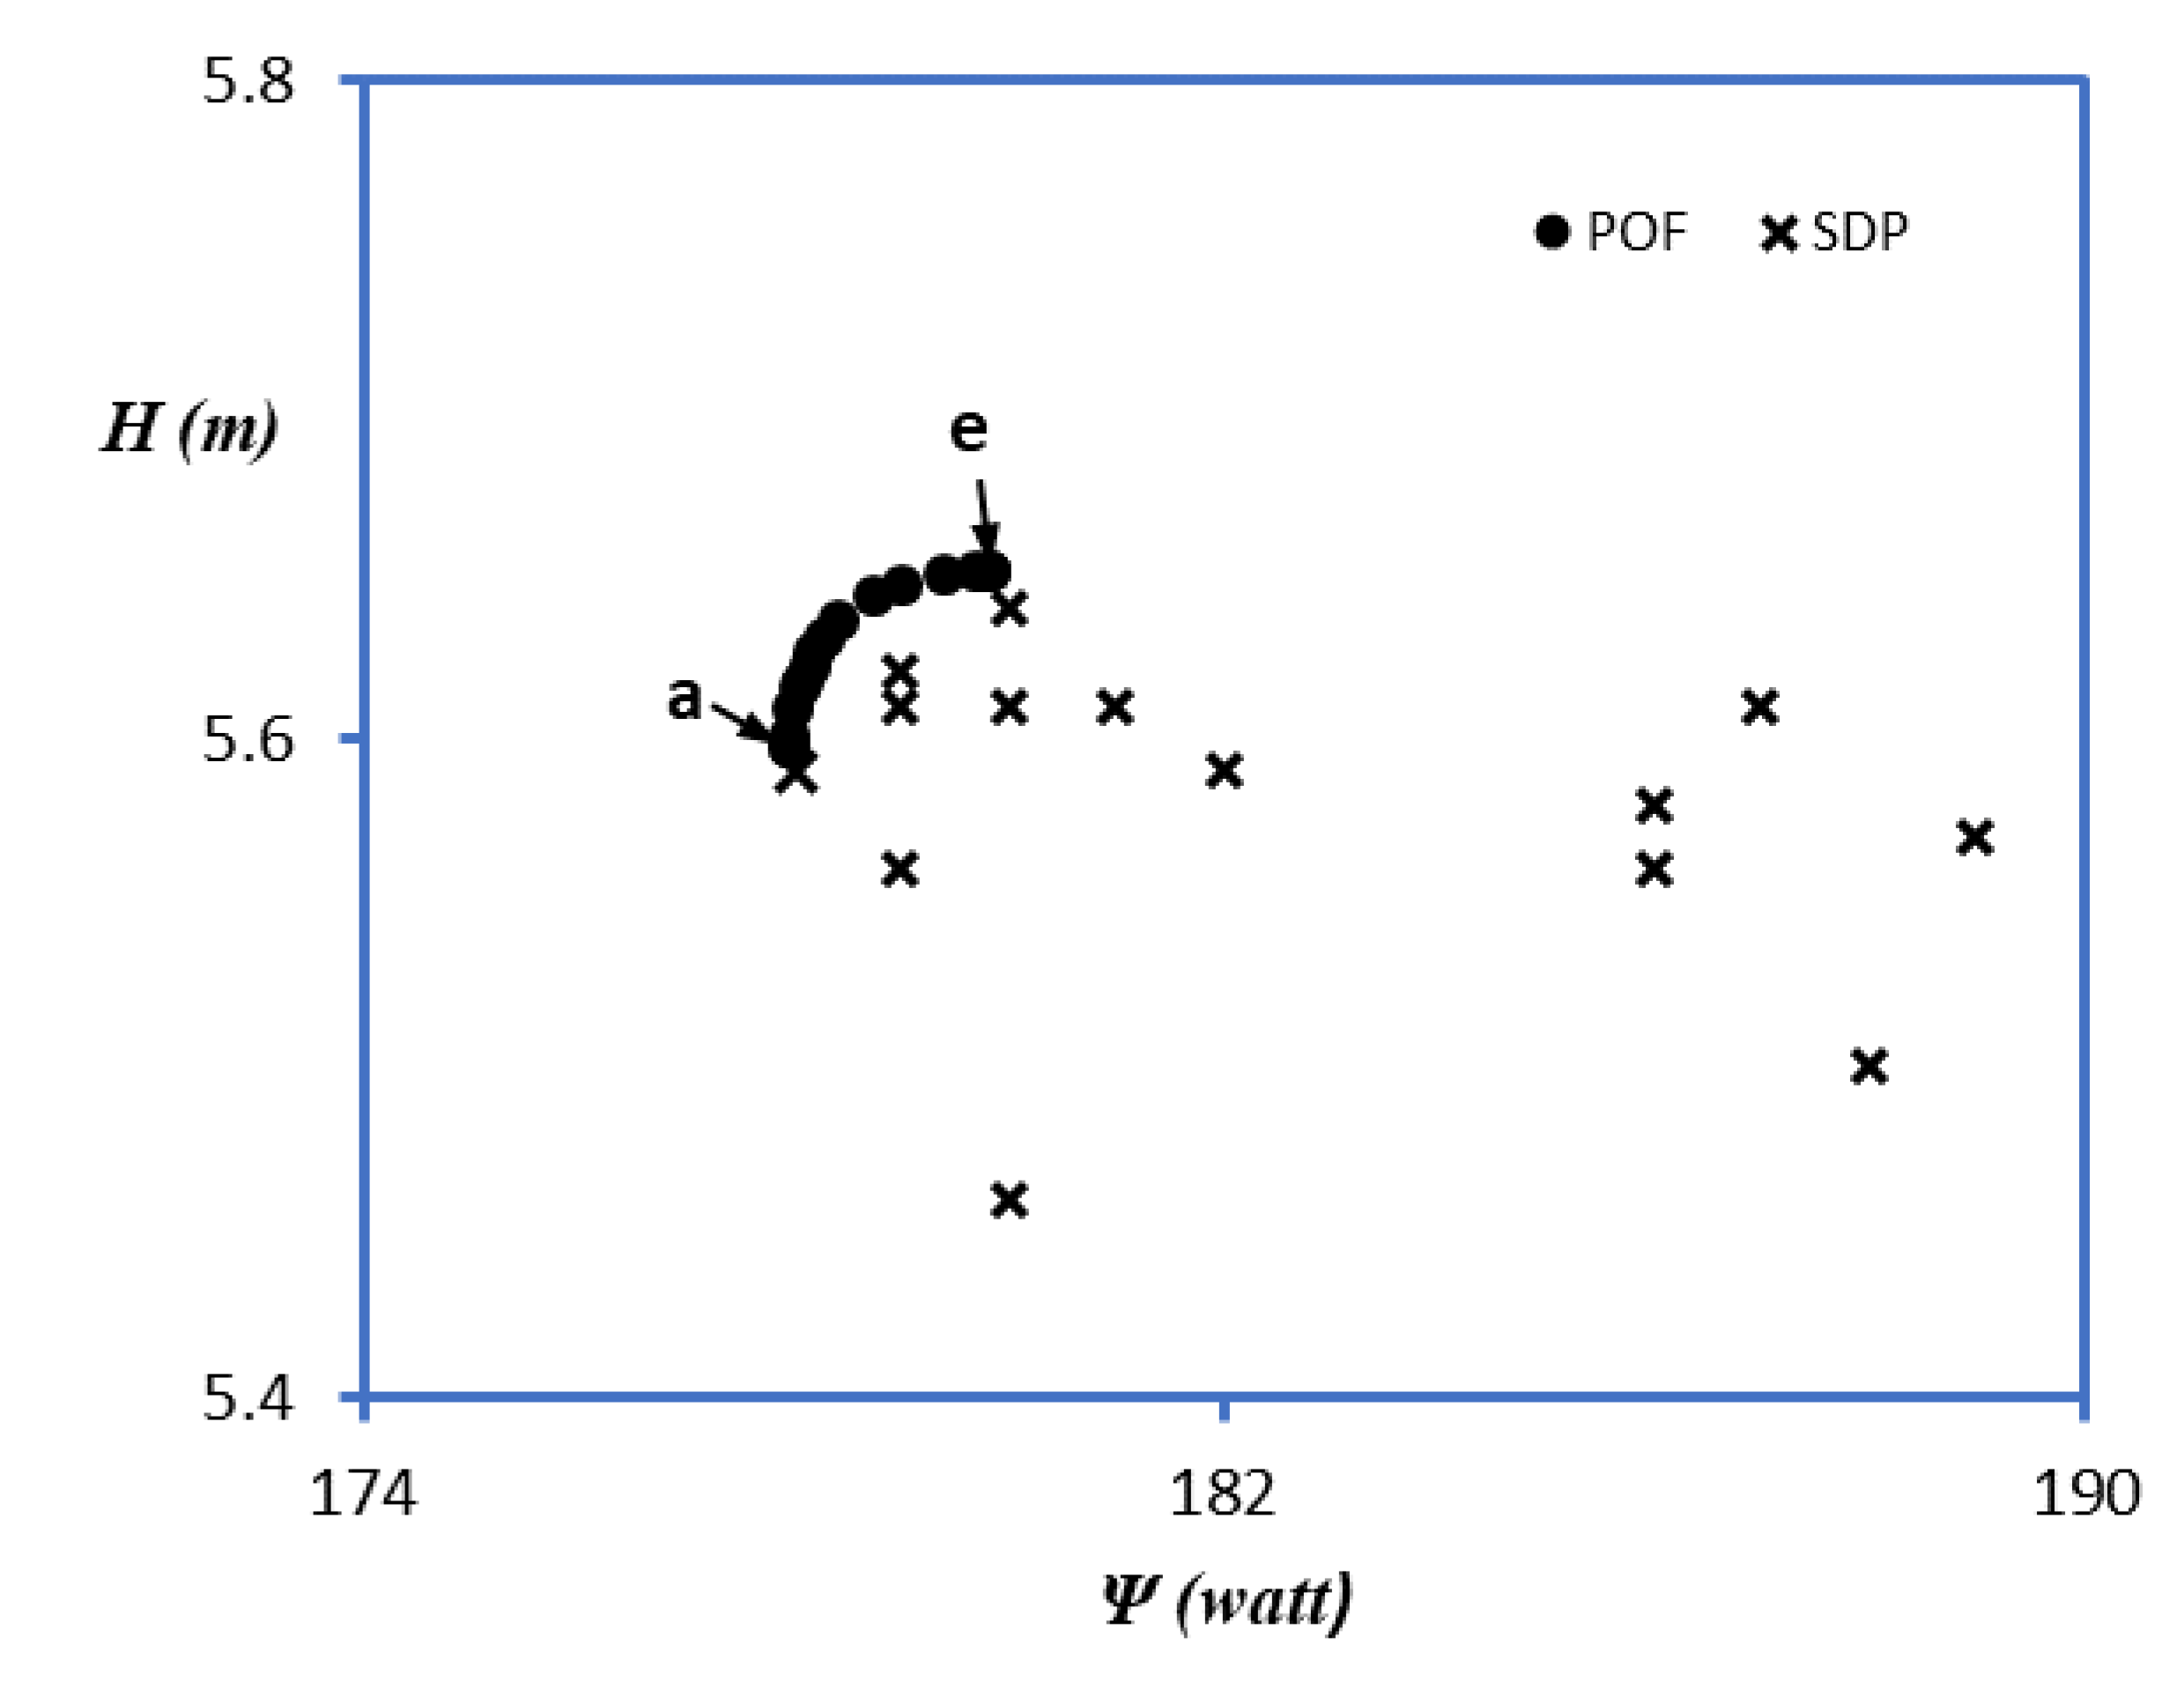
Machines 10 00774 g010aMachines 10 00774 g010b
Figure 11. Pareto optimal front for the case using water.
Machines 10 00774 g011
Figure 12. Pareto optimal front for case C1.
Machines 10 00774 g012
Figure 13. Pareto optimal front for case C2.
Machines 10 00774 g013
Figure 14. Pareto optimal front for case C3.
Machines 10 00774 g014
Figure 15. Pump performance comparison for water: (a) Ψ versus Q/Qd and (b) H versus Q/Qd.
Machines 10 00774 g015
Figure 16. Pump performance comparison for oil C1: (a) Ψ versus Q/Qd and (b) H versus Q/Qd.
Machines 10 00774 g016
Figure 17. Pump performance comparison for oil C2: (a) Ψ versus Q/Qd and (b) H versus Q/Qd.
Machines 10 00774 g017
Figure 18. Pump performance comparison for oil C3: (a) Ψ versus Q/Qd and (b) H versus Q/Qd.
Machines 10 00774 g018
Figure 19. Streamline at the midspan of reference and optimized impeller for all cases: (a) water, (b) C1, (c) C2, and (d) C3.
Machines 10 00774 g019
Figure 20. Static pressure contours at the midspan of the reference and optimized impeller for all cases: (a) water, (b) C1, (c) C2, and (d) C3.
Machines 10 00774 g020
Figure 21. Pressure distribution at the axial central plane: (a) Ref2 design and (b) Opt2a design.
Machines 10 00774 g021
Figure 22. Velocity at the vortex core region of the reference and optimized impeller: (a) C1 and (b) C4.
Machines 10 00774 g022aMachines 10 00774 g022b
Figure 23. Turbulent kinetic energy of the reference and optimized impeller: (a) C1 and (b) C3.
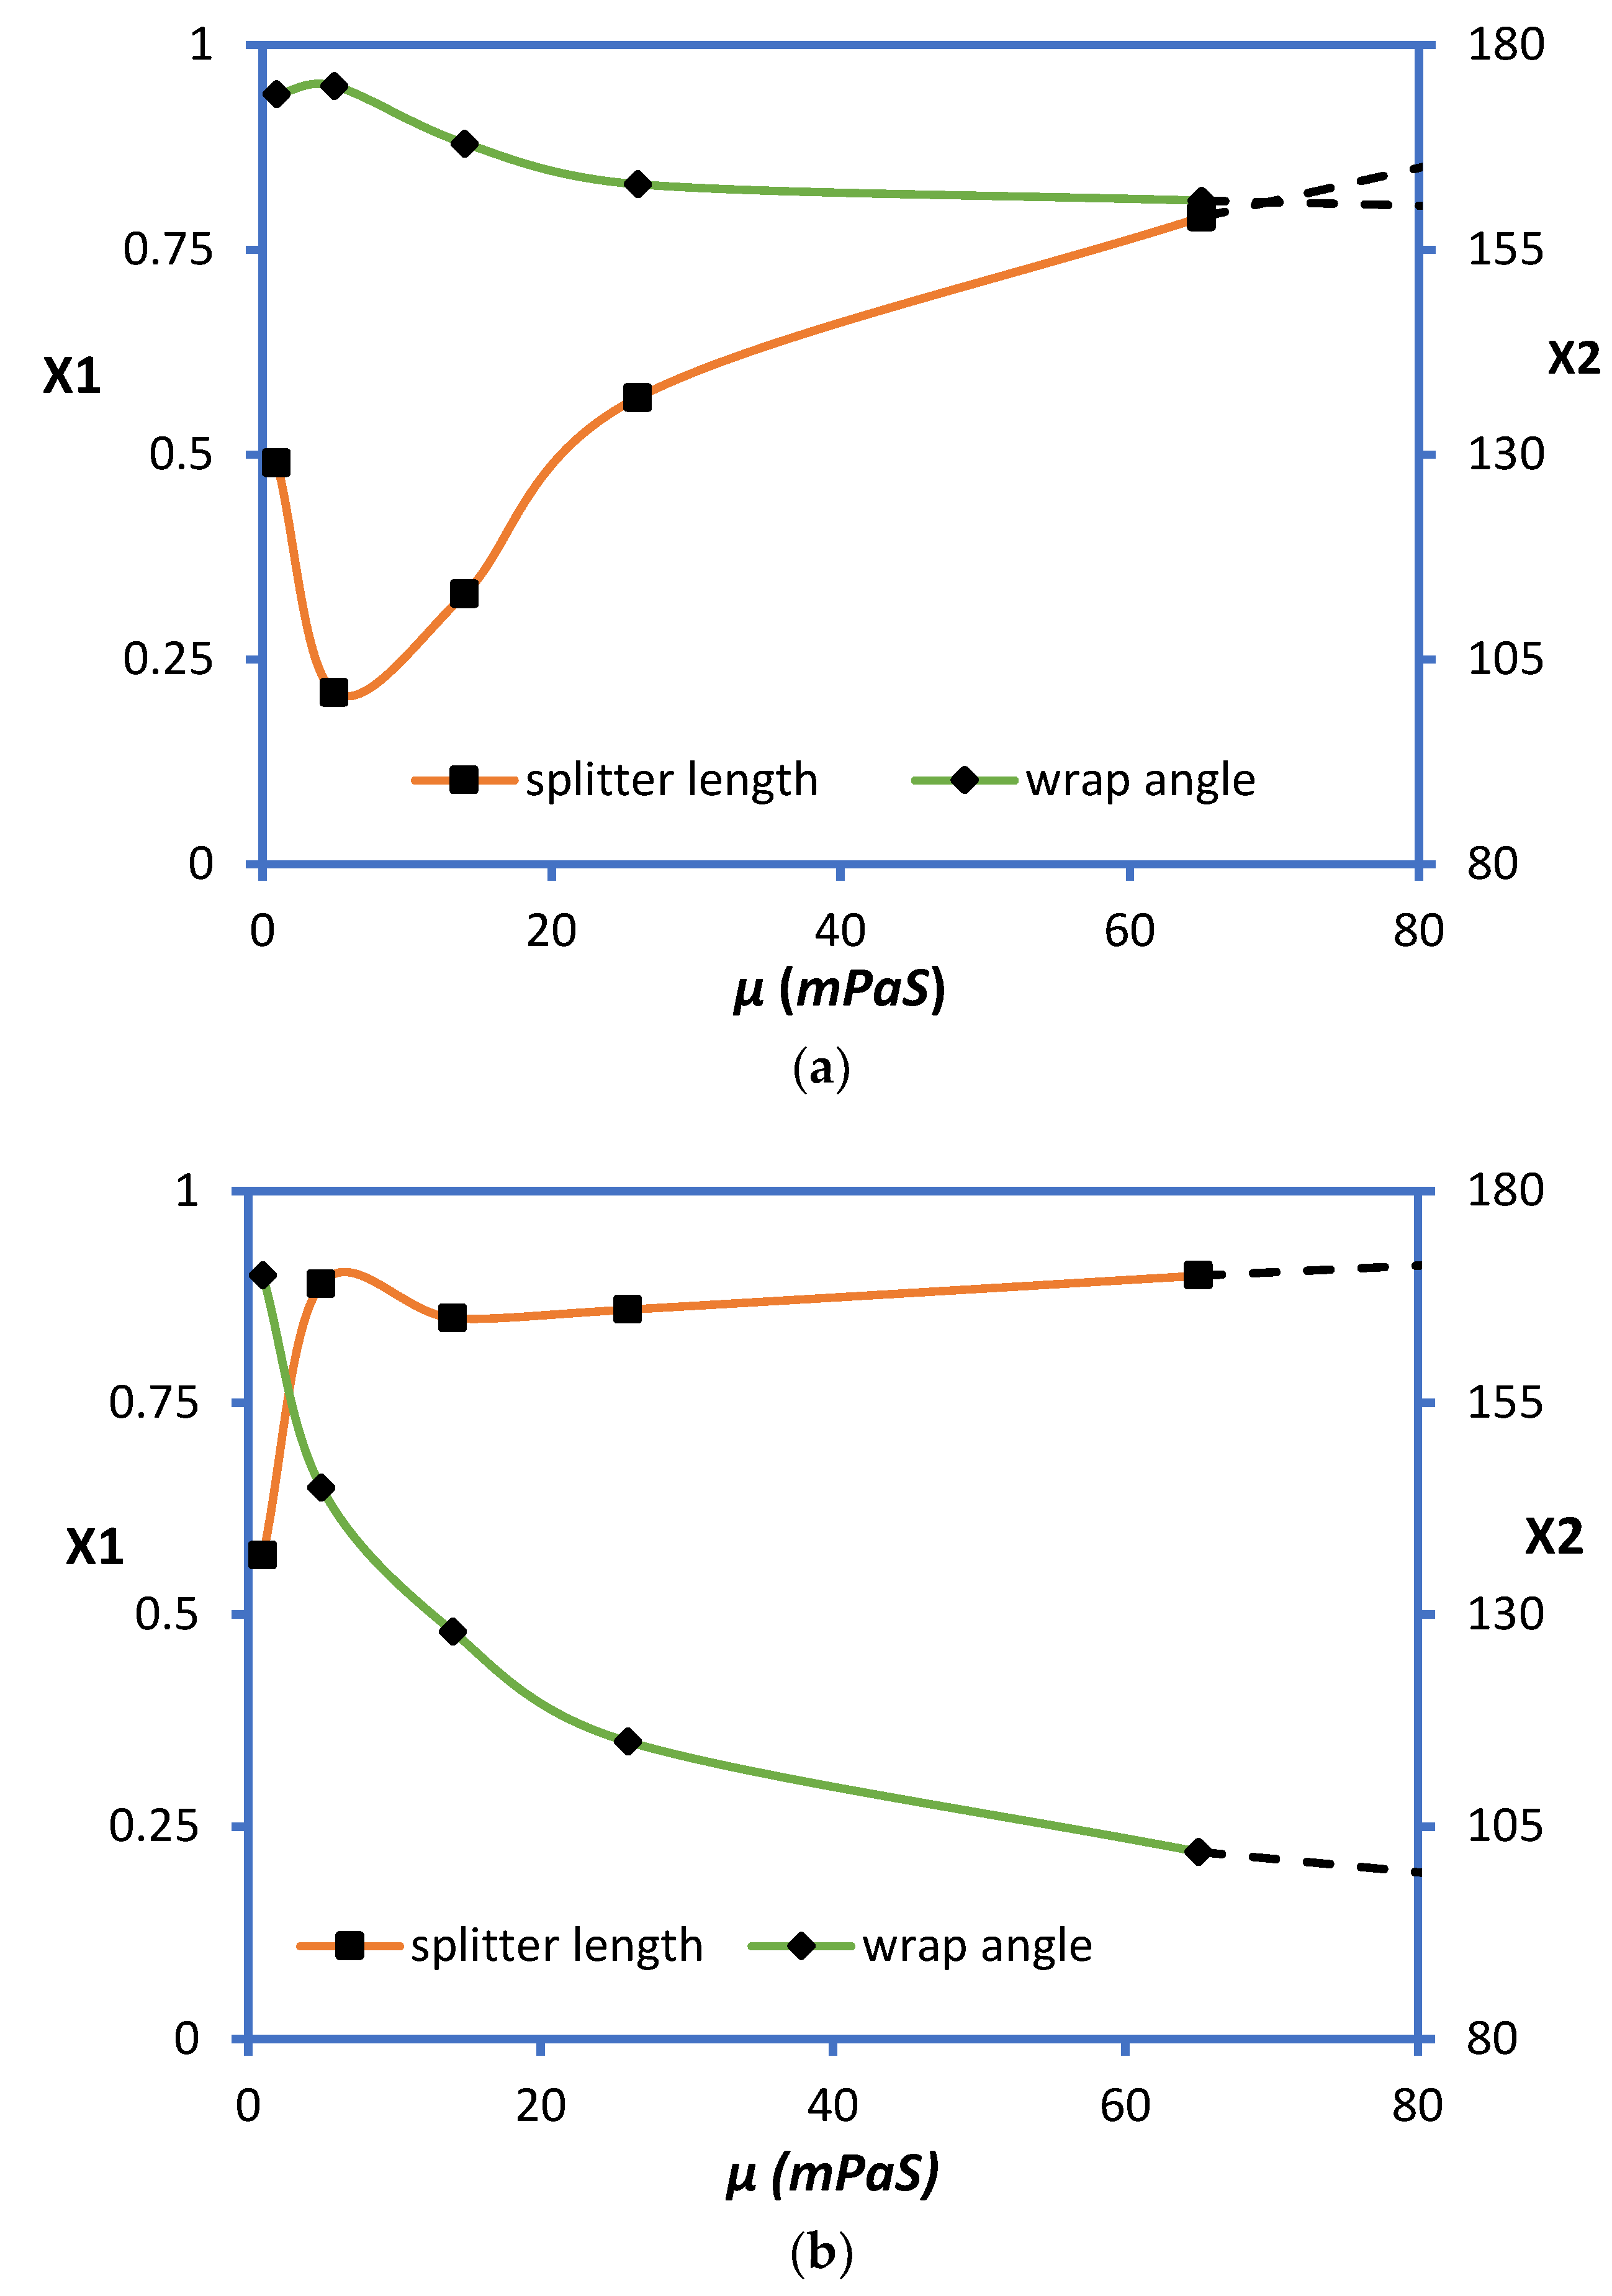
Machines 10 00774 g023
Figure 24. Relationship X1 and X2 with µ for (a) minimizing input power (Ψ), (b) maximizing head (H).
Machines 10 00774 g024
Figure 25. Effect of oil viscosity on pump performance for reference design: (a) head rise (H) vs. Q/Qd and (b) input power (Ψ).
Machines 10 00774 g025
Figure 26. Effect of oil viscosity on pump performance curves for optimized design of maximized head rise: (a) head rise (H) vs. Q/Qd and (b) input power (Ψ).
Machines 10 00774 g026
Figure 27. Effect of oil viscosity on the performance curves for optimized design of minimized input power: (a) head rise (H) vs. Q/Qd and (b) input power (Ψ).
Machines 10 00774 g027
Table 1. Study of splitter blades in a centrifugal pump.
AuthorsDescriptionOutcome
Golcu et al., 2007 [16]Experimental study for centrifugal pump for water application; modified number of blades and splitter lengthSplitter blade improves pump performance for a small number of blades
Shigemitsu et al., 2013 [19]Numerical and experimental investigation of mini semi-open impeller; addition of splitter blades at high outlet angle of impeller bladesBack-flow region suppressed, vortex loss at volute casing decreased
Cavazzini et al., 2015 [21]Numerical and experimental testing of centrifugal pump for water; addition of splitter bladesImproved cavitation performance at high flowrate
An et al., 2016 [22]Numerical simulation and optimization of centrifugal pump impeller; modified main blade and splitter profile using Bezier curvesPump performance improved by reducing secondary flow
Korkmaz, et al., 2017 [23]Experimental analysis of centrifugal pump impeller; modified of number of blades, outlet blade angle, and splitter lengthModifying outlet blade angle and at particular splitter length give high pump performance while pumping water
Namazizadeh et al., 2020 [20]Numerical simulation and experimental testing of centrifugal pump for water; modified splitter length and position from main blade variedAdding splitter blades improves pump head with negligible efficiency change
Xie et al., 2021 [24] experimental testing of centrifugal pump impeller; optimization of splitter blade lengthOptimized location of splitter blade, nonuniformity, maximum equivalent stress of the blade decreased
Siddique et al., 2021 [17]Numerical and experimental testing of centrifugal pump for water; number of blades, splitter length, wrap angle modifiedThrough optimization shape and length of splitter blade presented, which improved pump performance
Table 2. Reference pump dimensions.
ParametersDimensions
Suction pipe diameter, ds50 mm
Delivery pipe diameter, dd32 mm
Shaft diameter, ds24 mm
Impeller outlet diameter, Do142 mm
Number of blades, z5
Inlet blade angle at hub, β1sh40
Inlet blade angle at shroud, β1h10
Outlet blade angle, β236
Blade thickness, t3 mm
Base circle diameter of volute casing, Db147 mm
Table 3. Uncertainty analysis of instruments used in testing.
InstrumentsRange
Pressure gauge0.1–2.0 bar ± 0.5%
Flowmeter10–380 L/min ± 1%
Tachometer0–10,000 rpm ± 0.25%
Power meter0–1000 watt ± 0.25%
Table 4. Pumping fluid properties.
Pumping FluidsDensity (kg/m3)⁰APIDynamic Viscosity (mPaS)
Water1000101
C180544.34.5
C281442.314
C382739.626
C485533.865
Table 5. RMSD for the optimal design point in each case.
CasesH-PREDΨ-PREDH-CFDΨ-CFDRMSD
Opt1a5.603178.05.582178.10.07
Opt1e5.652179.75.643179.90.14
Opt2a5.351167.55.351168.20.49
Opt2e5.495169.55.453169.40.08
Opt3a5.356169.15.318168.70.28
Opt3e5.36169.35.354170.30.71
Opt4a4.896166.44.918166.30.07
Opt4e5.140170.45.128170.10.21
Table 6. Final optimal designs for maximum head and minimum input power.
Optimal DesignsX1X2HΨ
Ref1--5.22171.4
Opt1a0.571705.58178.1
Opt1e0.491745.64179.9
Ref20.571705.13150.2
Opt2a0.211755.35169.4
Opt2e0.891455.57176.4
Ref30.571704.86159.9
Opt3a0.331685.32168.7
Opt3e0.851285.35170.3
Ref40.571704.54161.1
Opt4a0.891614.90166.3
Opt4e0.901025.13170.1
Publisher’s Note: MDPI stays neutral with regard to jurisdictional claims in published maps and institutional affiliations.

