1. Introduction
Hypoid gears are associated with high sliding speeds during meshing due to their screwing relative motion. This brings about peculiar and, in general, more severe wear patterns than other gear types. Such wear can result in a contact pattern that is drastically different from the designed one. In fact, since an optimal contact pattern is the outcome of a
micro-geometry optimization process [
1,
2,
3], a variation of just a few tens of microns can significantly change the contact properties. Hence, wear must be cautiously considered for gears operating in long-life applications.
Park et al. [
4] introduced a wear model based on Archard’s law interfaced with a finite element (FEM)-based contact model. The very same
loaded tooth contact analysis (LTCA) tool,
Ansol Transmission3D [
5], is employed in this work. However, the software’s capabilities have been greatly improved over the last few years, thus allowing a more accurate prediction of the contact properties and, therefore, more accurate analyses of both lubrication and wear.
The study in [
6] proposed a wear model interfaced with a semi-analytical contact model developed by Kahraman and Kolivand [
7]. This tool greatly reduced the computation cost to perform the LTCA simulations while trading some accuracy for efficiency. Park [
8] developed a “patching” surface interpolation technique to predict wear, which allows the employment of fewer time-step discretizations of the meshing cycle. More recently, Ref. [
9] investigated wear in hypoid gears and its experimental correlation with the loaded transmission error.
In the first part of this paper, a semi-empirical formulation is introduced and employed to analyze lubrication and friction-induced efficiency losses during gear meshing. Despite the simplicity of the proposed model, the estimates it provides are effective and have been validated with experimental data in [
10].
Efficiency losses are an important aspect of geared transmissions. They can be classified into load-independent and load-dependent losses. The first category includes the so-called churning and windage losses (i.e., pumping of the lubricant between the mating members and splashing caused by inertial effects). The second category is related to rolling and sliding frictional losses. The rolling losses are usually negligible compared to the sliding ones, especially in hypoid gears. Our work proposes an estimation method for the friction coefficient under different lubrication regimes, which is the fundamental parameter required to accurately predict friction-induced efficiency losses.
Many friction prediction models for hypoid gears are available in the literature. Contribution [
11] evaluated the lubrication performance under different possible contact paths on bevel gears, [
12] carried out an elasto-hydrodynamic lubrication analysis on hypoid gears under relatively high loads, while [
13] analyzed the lubrication of hypoid gears taking into account the three-dimensional surface roughness. However, despite their accurate tribological analyses, many of the cited contributions fall short in providing reliable contact analysis results. In fact, an accurate LTCA tool has a paramount importance for the subsequent estimation of the friction coefficient.
In the second part of the paper, a wear investigation is performed. The main goal is to establish how often the worn tooth flank geometry should be updated (properly accounting for the removed material) to achieve a reliable and consistent prediction of the final wear and contact pattern. To this end, we computed wear predictions after 30 million meshing cycles (counted on the pinion) using different geometry update steps. This allowed the performance of a sensitivity analysis and provide quantitative indications on the minimum number of geometry updates required to provide a reliable prediction with limited computational burden.
2. Estimation of the Lubricated Friction Coefficient
There are several factors that influence friction, such as the lubrication regime (full film, mixed, boundary), the behavior of the lubricant with varying operating conditions (temperature, pressure, shear rate) and the surrounding environment (the boundary conditions of the lubricated contact).
The friction coefficient
f is evaluated from boundary to full-film lubrication conditions using a load sharing function
, related to the portion of load supported by the full film. According to [
14],
f can be calculated as:
where
and
are the friction coefficients related to the hydrodynamic (full fluid) and the boundary lubrication conditions, respectively.
is the ratio between the film thickness
h and the equivalent surface roughness of the contacting bodies:
Usually, the film thickness h is assumed to be the central film thickness , and and are the root mean square roughnesses of the two surfaces.
Several expressions can be found for
in the literature. The formulation in [
14] is employed in this work, which reads:
The coefficient of friction
is considered constant (with
being the typical value [
14]), while the mean value of
can be evaluated as the ratio between the shear stress
and the mean contact pressure
:
For elliptical nonconformal contacts, , where a and b are the axis semi-widths of the contact ellipse and F is the normal load.
The estimation of
is performed according to the Eyring constitutive model:
where
is the Eyring shear stress,
is the dynamic viscosity, and the shear strain rate is approximated as
, with
being the sliding velocity between the two mating teeth at the nominal contact point.
The dynamic viscosity variation with temperature
T and pressure
p is described by the empirical formulas introduced by Vogel and Gold [
15]:
where the viscosity-pressure coefficient is calculated as follows:
The remaining coefficients in Equations (
6) and (
7) need to be estimated empirically, based on the properties of the specific lubricant.
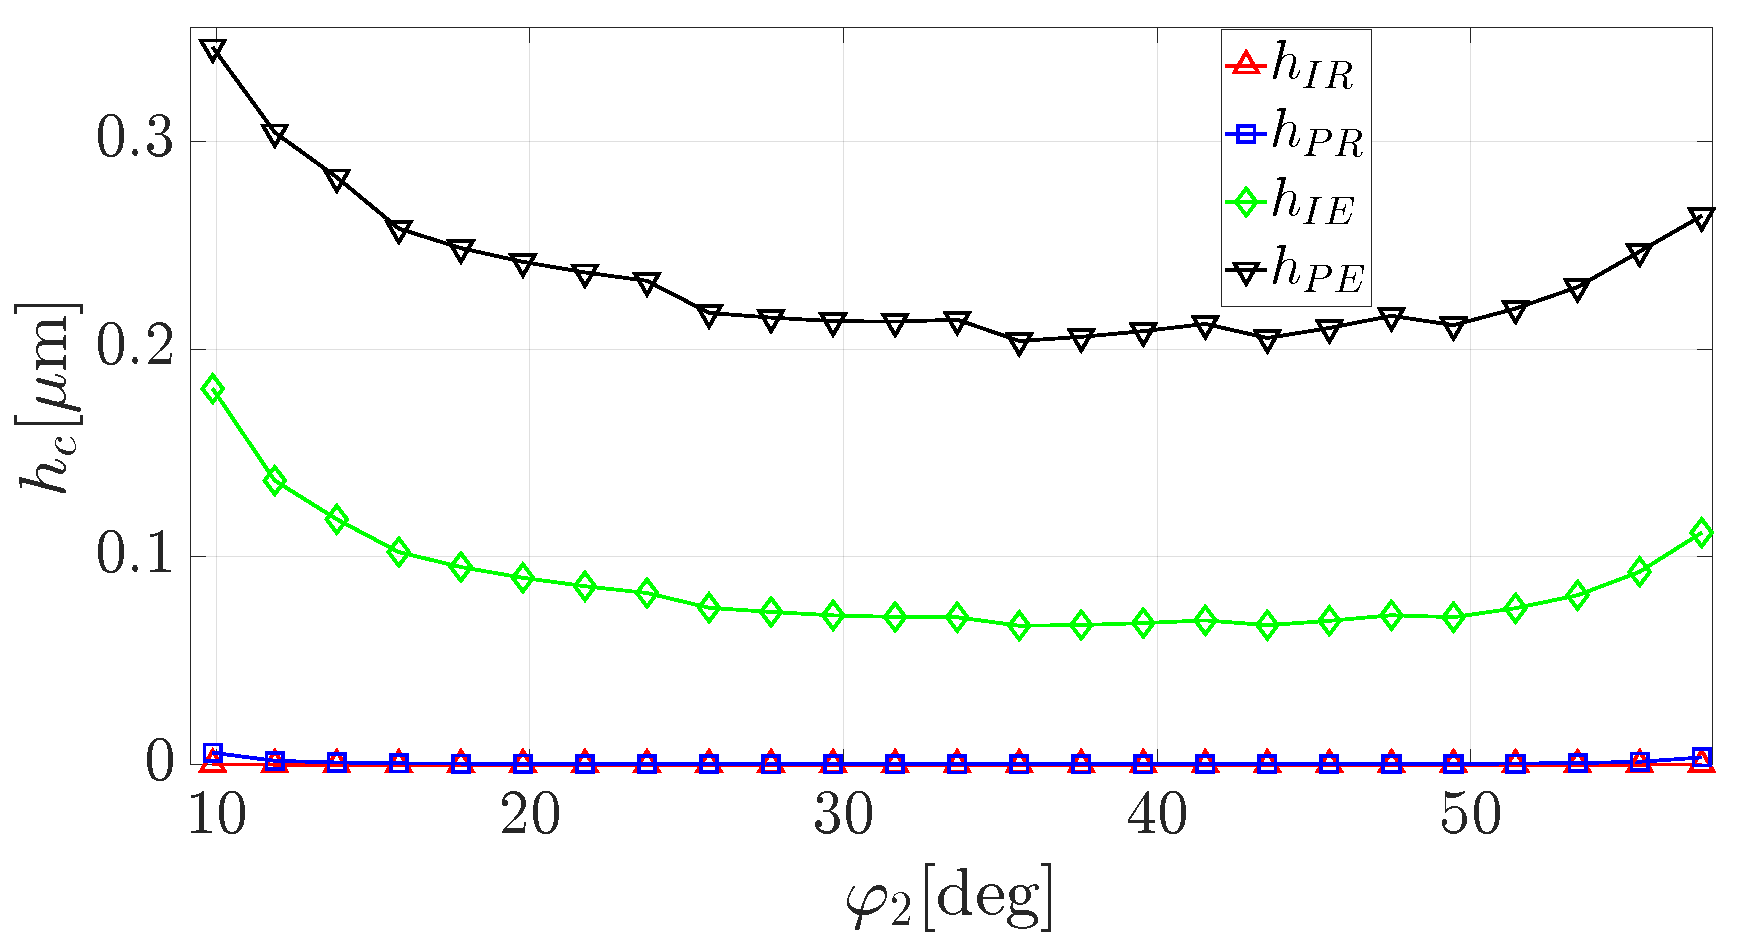
Different expressions for the evaluation of the central film thickness can be found in the literature. Four different lubrication regimes can be observed for nonconformal contacts, depending on the elastic deformation of the bodies and the variation of viscosity with pressure. The four regimes are usually indicated as isoviscous-rigid IR, piezoviscous-rigid PR, isoviscous-elastic IE and piezoviscous-elastic PE. The formulas reported in [
16] were elaborated in [
17] for the more general case in which the entraining velocity is not collinear with any principal direction. The final expressions employed in this work read as follows:
Here,
E is the equivalent elastic modulus,
u is the entraining velocity, and
and
are the equivalent radii of curvature parallel and perpendicular to
u, respectively. An accurate description of
u,
and
is provided in
Section 3. The proper lubrication regime is determined in a practical way by taking the highest of the values given by Equations (
8)–(
11).
Thermal effects are included using a reduced value for the central film thickness obtained by multiplying it by a dimensionless reduction factor
. Several models for
are available. The one described in [
18] is used here:
where
and
is the dimensionless thermal loading parameter.
The coefficients that characterize the 75W90 oil, which is the lubricant used in this study, are shown in
Table 1. Those experimental values have been obtained from [
19].
It is worth remarking that the formulas introduced in this section provide a first approximation of the lubricant film thickness and coefficient of friction. In particular, very high sliding speeds are associated with large increments of temperature that may cause a significant decrease in viscosity and hence in film thickness. The problem in its full generality would be also time-dependent, but some preliminary film thickness evaluation can be made considering a stationary situation with constant speed and geometry per contact configuration of the mating teeth. It may be worth noting in passing that the film thickness would also be influenced by the presence of spin, which is neglected here for simplicity.
3. Generation and Kinematic Analysis of Hypoid Gears
The face-milled tooth flank geometries are digitally synthesized through simulation of the generation process (by envelope) during finishing (grinding). The enveloping motions are defined by the kinematic parameters (
machine settings) of the 9-axis Gleason hypoid generator and the geometry of the grinding tool (
tool settings). A special program developed by the authors [
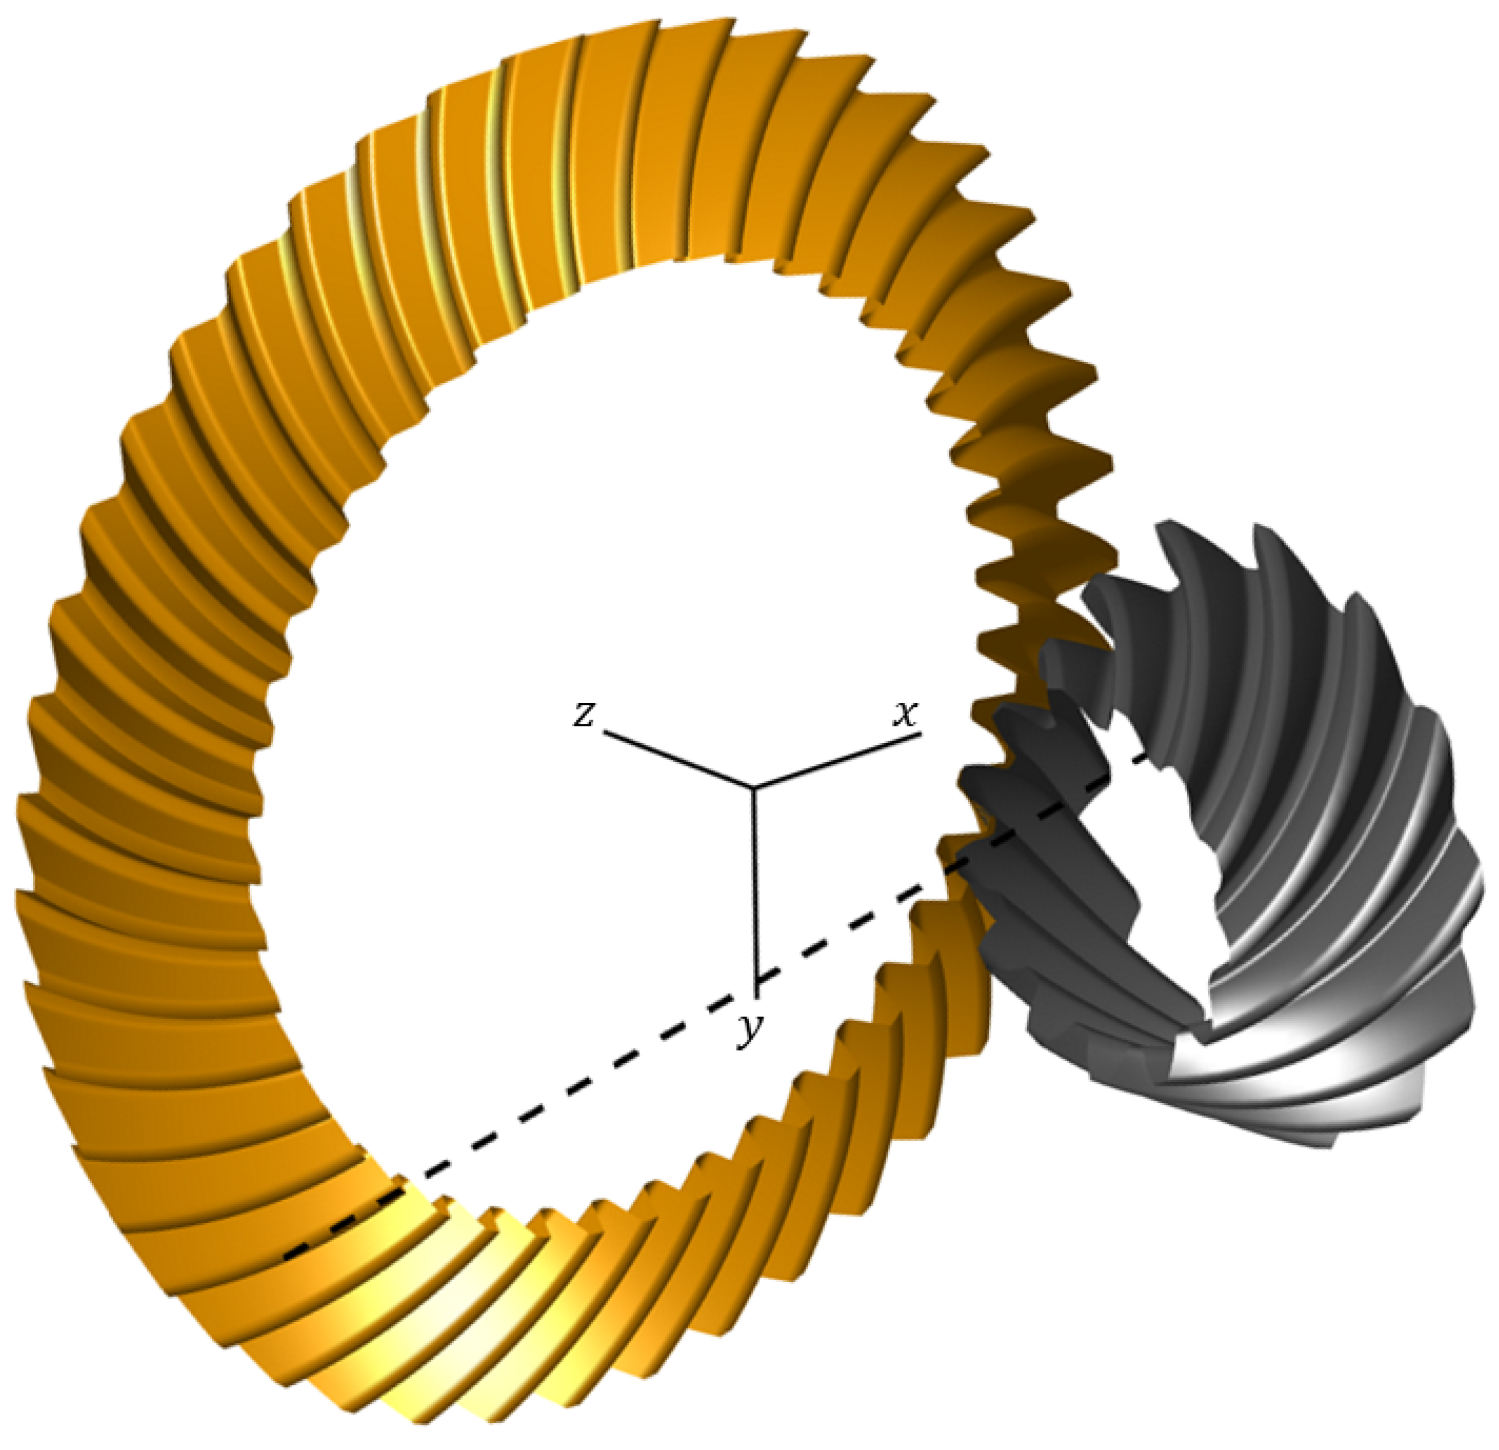
20] allows the obtaining of those settings from the basic macro-geometry data. A plot of the hypoid gearset under investigation is shown in
Figure 1.
Through geometric modelling and simulated loaded contact analysis (LTCA), it is also possible to compute fundamental kinematic and geometric information at each contact point, such as (subscript refers to the gear/pinion, respectively; superscript refers to the first/second direction on each surface):
velocities and of the two bodies (teeth) at the contact point;
angular velocities and of the bodies;
principal curvatures of the bodies , , and and their directions , , and .
principal relative curvatures and and their associated directions and . The direction along the largest semi-width of the contact ellipse is denoted as .
The principal normal curvature of body j along direction is considered positive/negative if the normal plane through cuts body j producing a section with a convex/concave boundary curve.
To employ the formulas described in
Section 2, the entraining velocity
of the lubricant needs to be computed. In addition, the direction of such velocity does not coincide with any of the principal directions at the contact point. However, given the angular velocities of the bodies, their linear velocities at the contact point and their curvatures
,
for the gear wheel and
,
for the pinion, respectively, along the principal relative directions
and
of the equivalent contact, the components of the entraining velocity vector can be obtained as [
17,
21]:
These are the components of the entraining velocity vector in the local frame with its axes aligned with the principal directions of the equivalent contact. The norm of the entraining velocity vector
is employed for the estimation of the friction coefficient formulas introduced in the previous section. It is important to remark that the validity of Equations (
13) and (
14) is subject to the following hypotheses:
- (1)
body 1 (tooth of the gear wheel) is always convex along both its principal directions (which is true under the so-called Drive operating conditions, i.e., the gear convex tooth sides make contact with the pinion concave tooth sides);
- (2)
the cross product yields a unit vector always pointing inside body 1.
As a final step, the radii of curvature along the entraining and the side-leakage directions (
and
) can be obtained by [
22]:
where
is the angle between the entraining velocity and
.
4. Numerical Application on a Hypoid Gearset
An application of the aforementioned friction coefficient model is presented in this section. The basic data of the hypoid gearset employed in our study are shown in
Table 2.
The machine-tool settings computed by a special program developed by the authors, and described in detail in [
20], are given as input to Transmission3D to perform an accurate LTCA analysis. More in detail, the contact simulation is performed by discretizing the overall meshing cycle into
contact configurations (time steps). The analysis results are then extracted and post-processed to carry out the calculations for the estimation of the friction coefficient. We assumed a pinion torque of 250 Nm and a pinion speed of 2000 rpm.
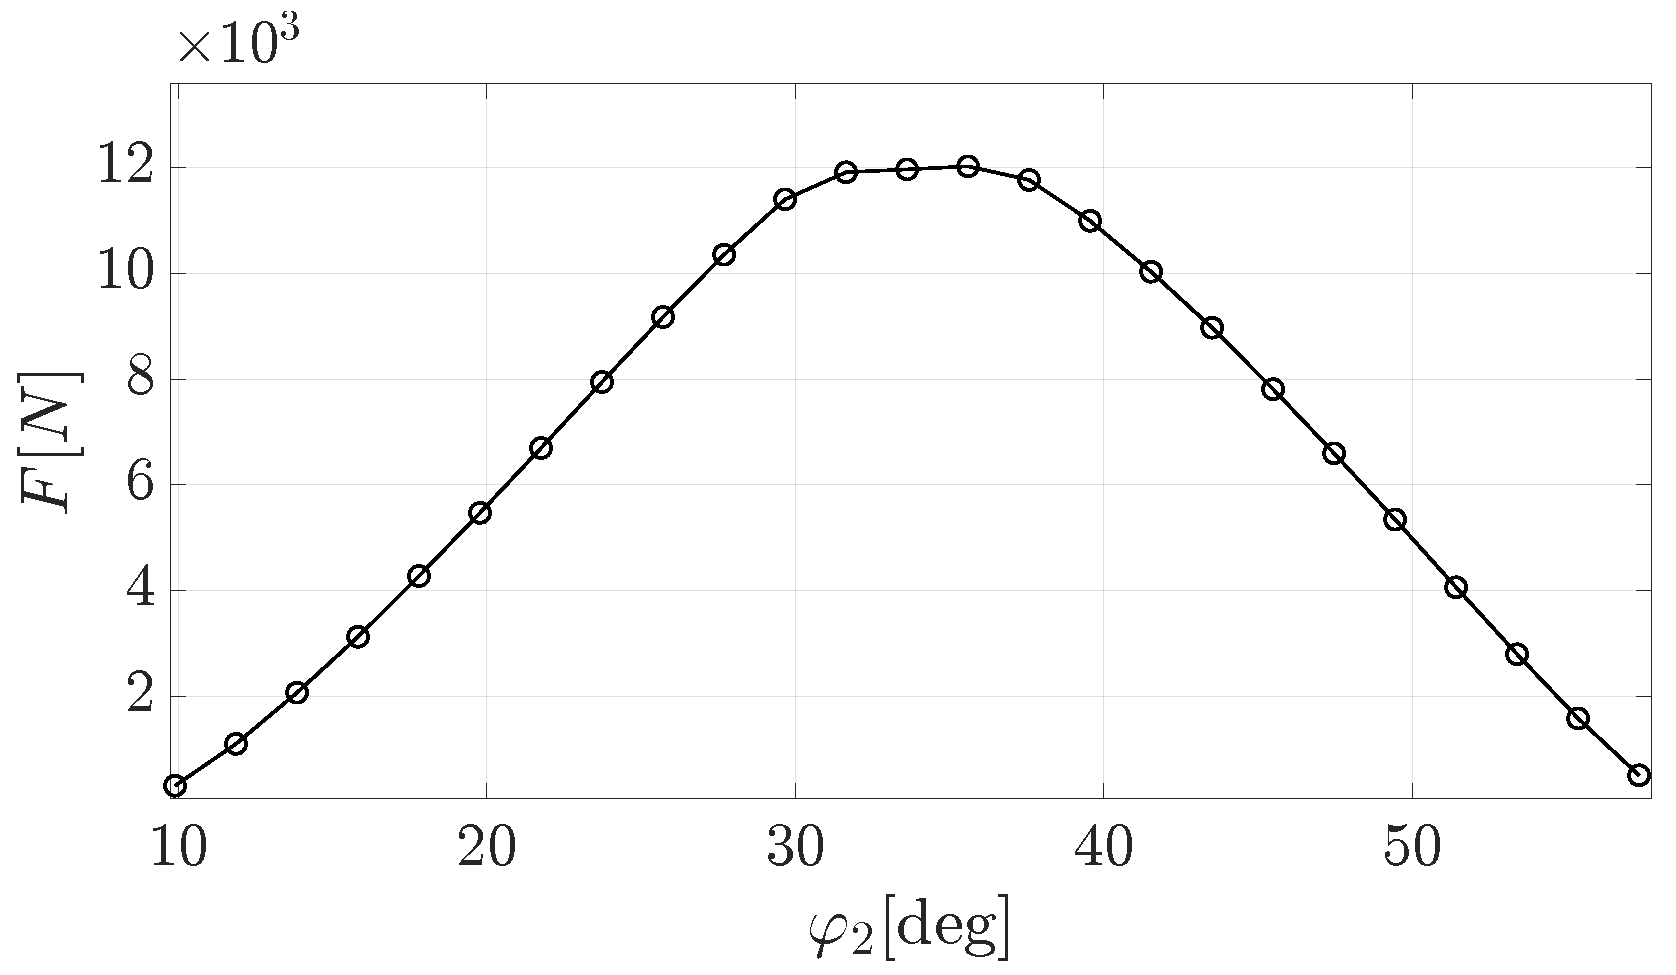
Figure 2 shows the load shared by a mating tooth pair over a mesh cycle (as a function of the pinion rotation angle
).
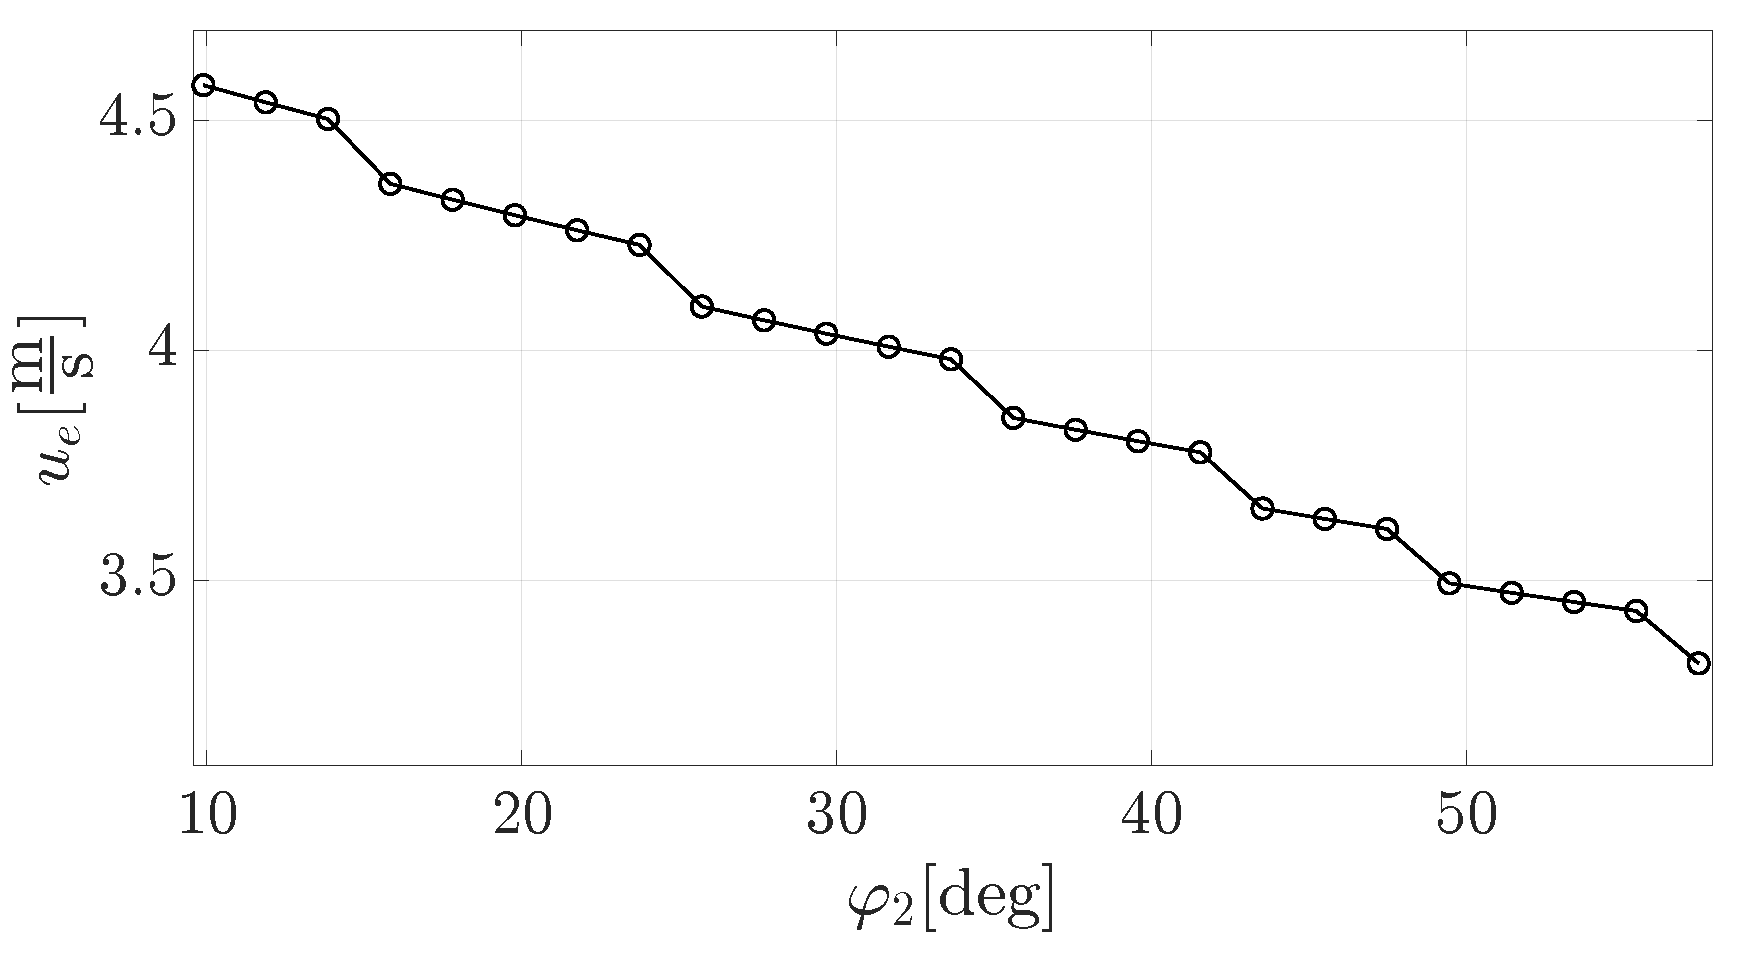
Figure 3 shows the entraining velocity of the lubricant.
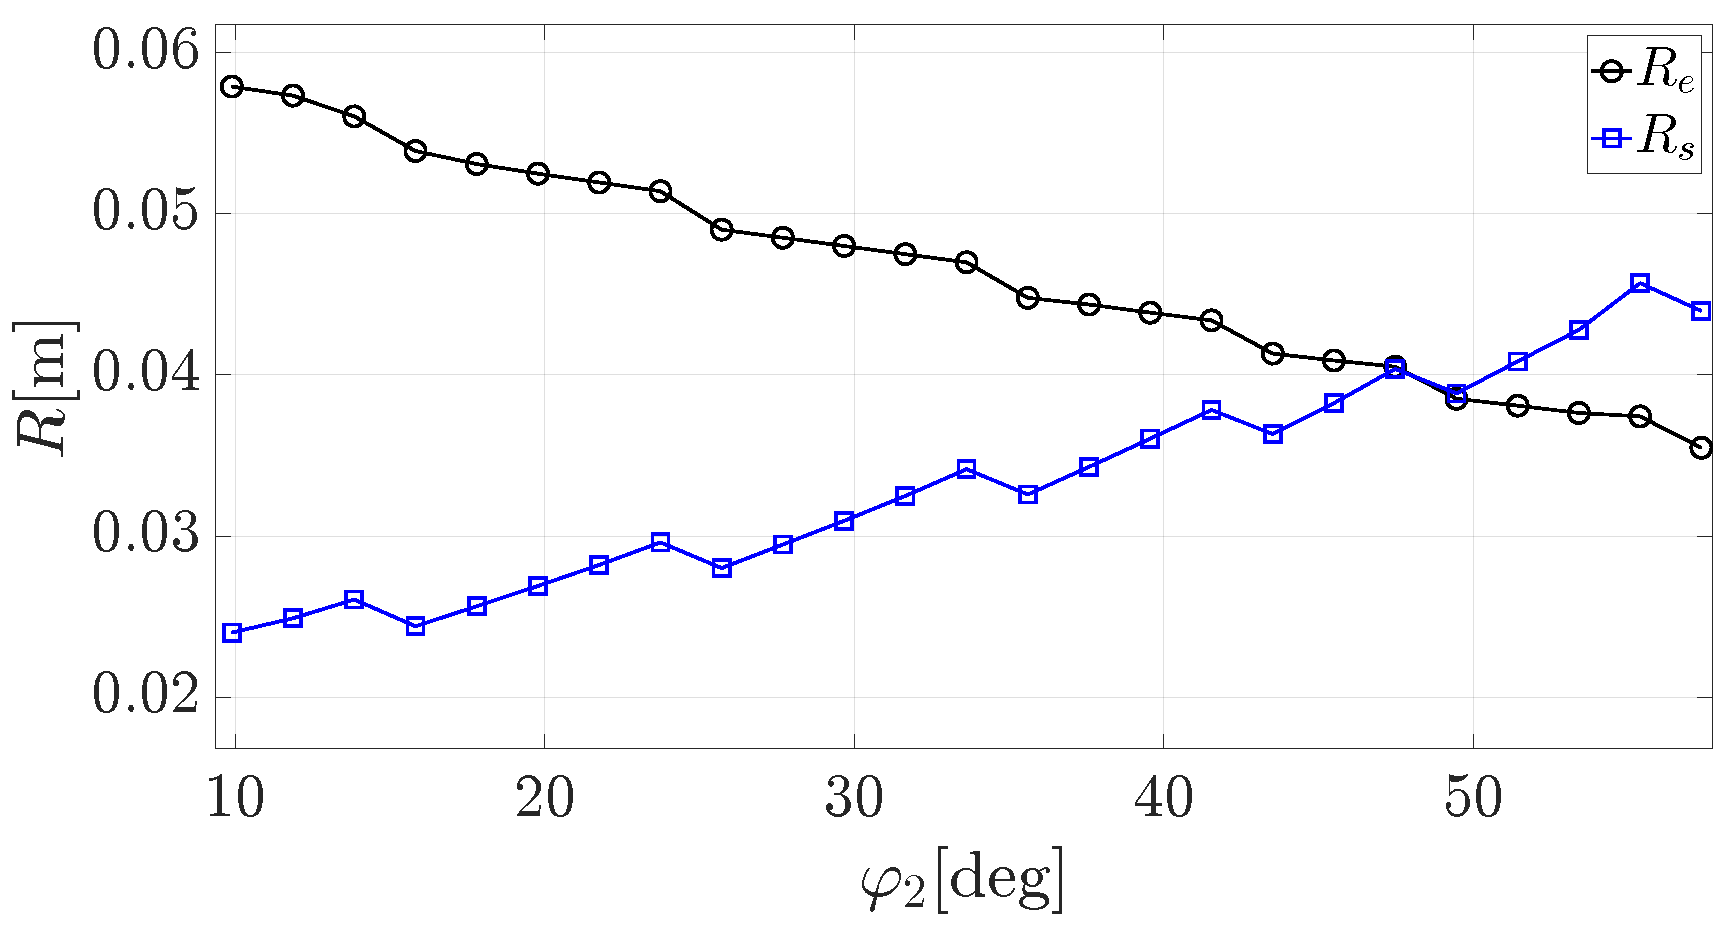
Figure 4 shows the evolution of the entraining and the side-leakage radii. Those values are strongly dependent on the micron-level flank deviations from the conjugate surfaces. As a matter of fact, micro-geometry can drastically change the evolution of the contact path, which may result in different contact zones and thus different local curvatures.
In
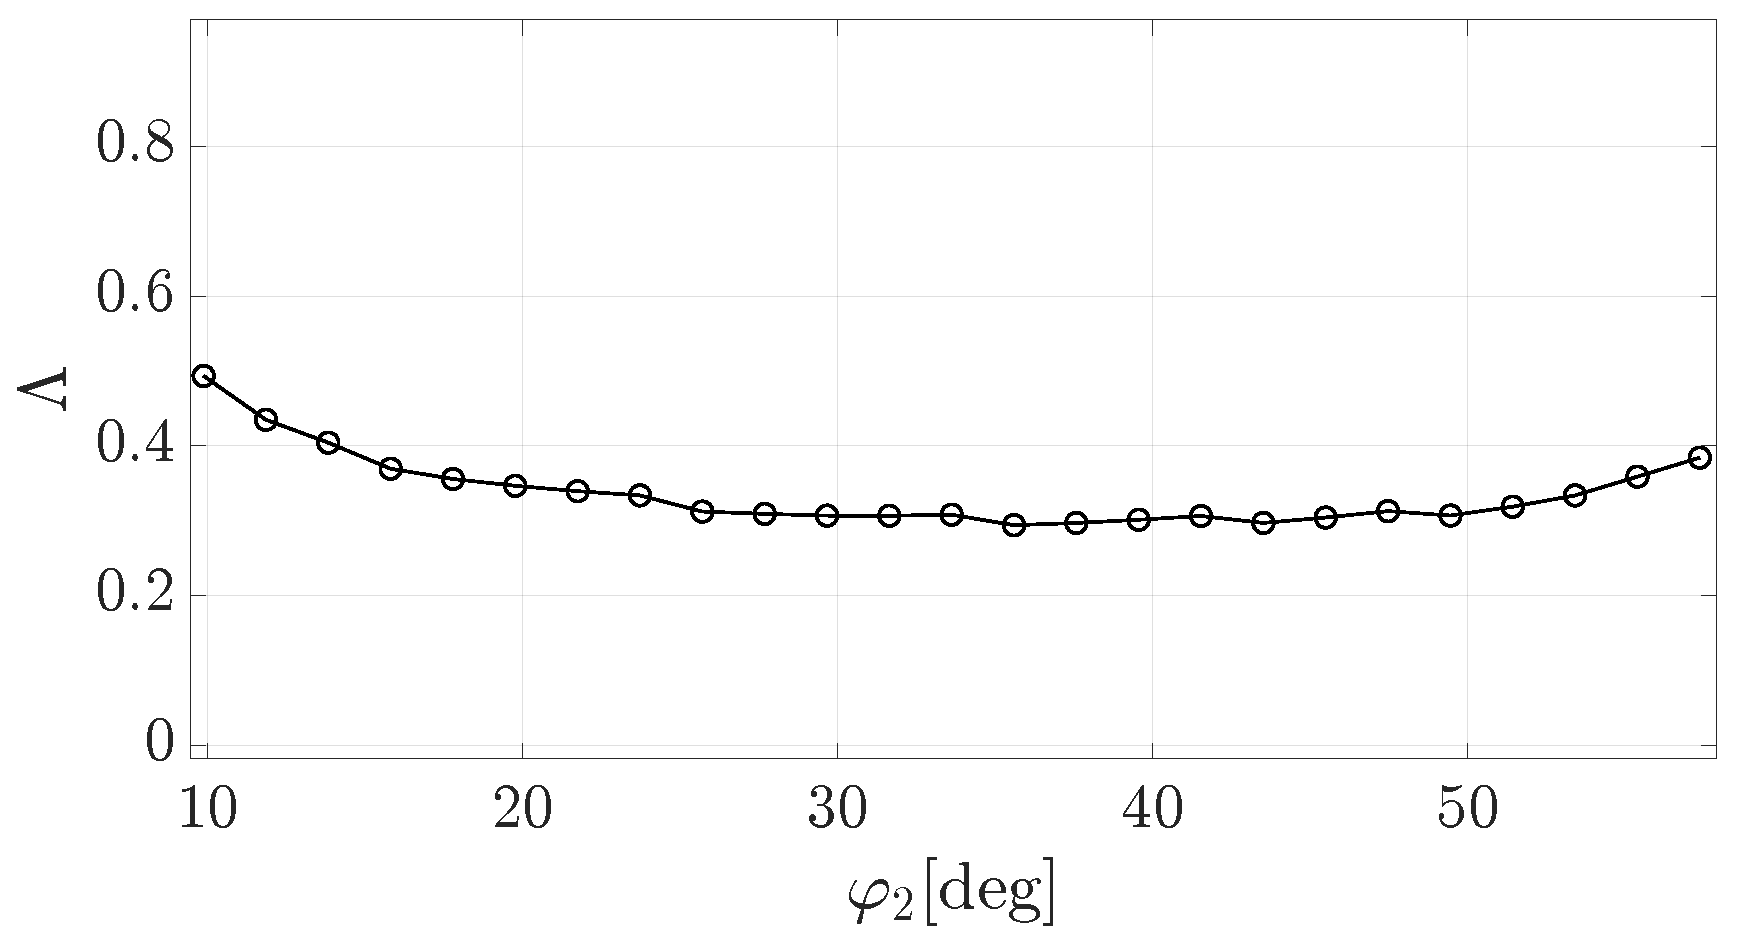
Figure 5 we can observe the different central film thicknesses calculated for the different lubrication regimes. At each contact configuration, the lubrication regime is the piezo-viscous-elastic one, probably due to the high loading of the gearset. This results in an analogous trend of the
factor, which can be observed in
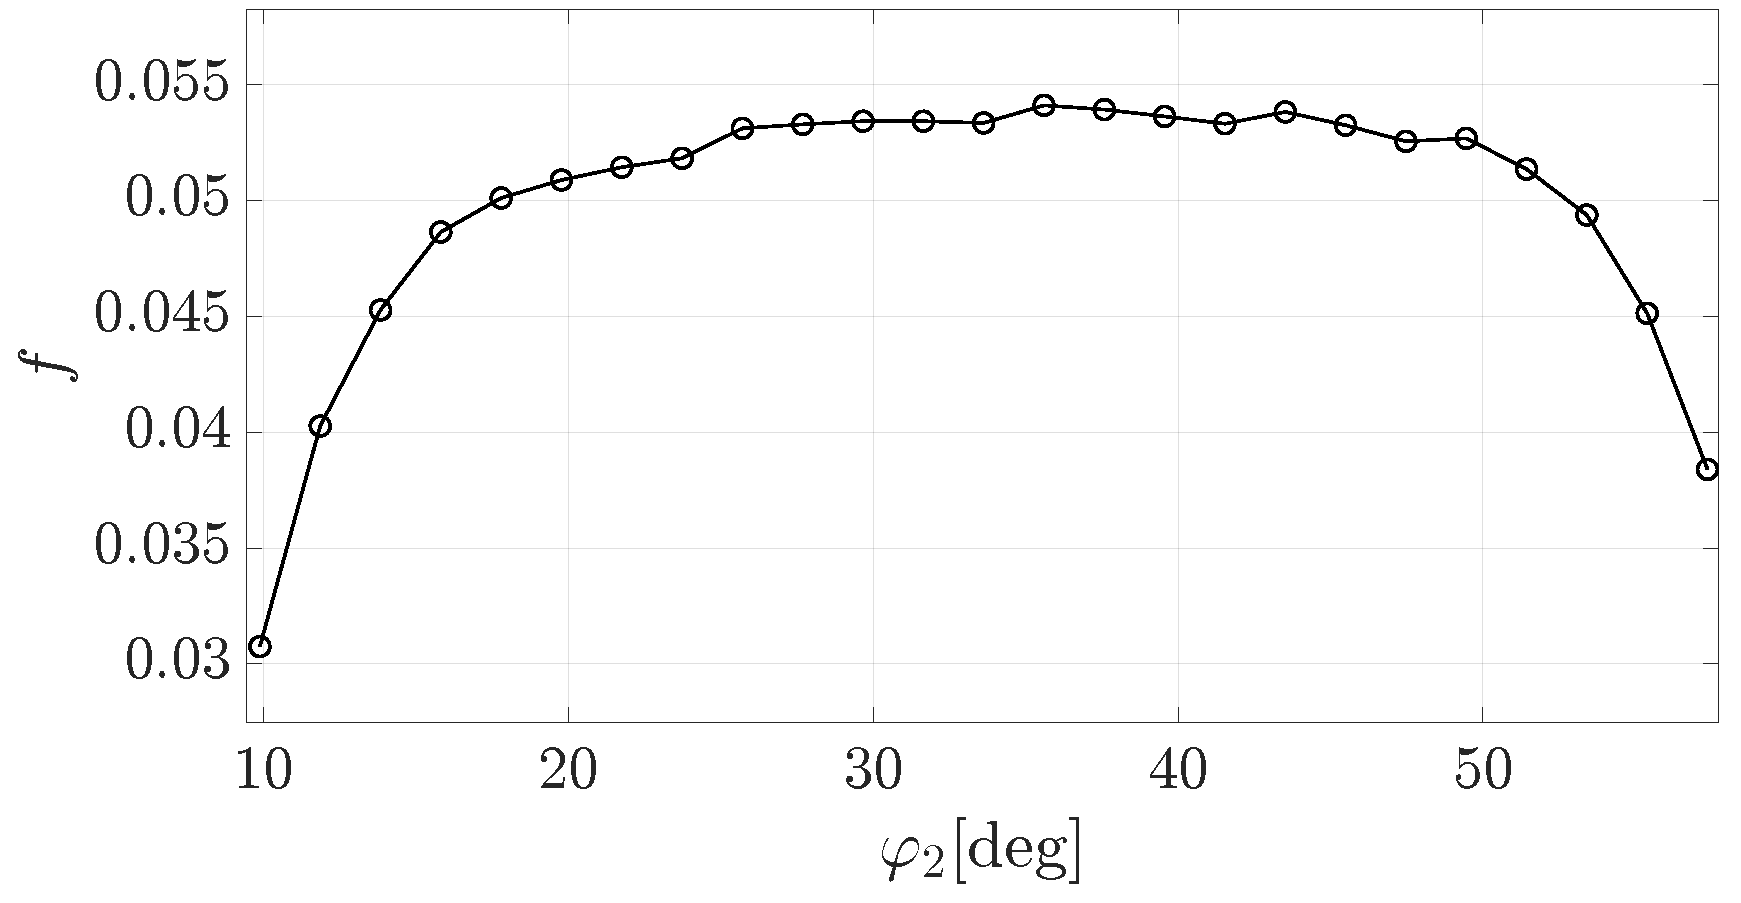
Figure 6. It is clear that the meshing tooth surfaces always operate under mixed lubrication conditions. To increase
, a lower surface roughness of the tooth flanks should be aimed for. Finally, the coefficient of friction is shown in
Figure 7.
The efficiency loss can be computed by numerical integration of the frictional power losses over the meshing cycle:
where
is the power loss at the
i-th time step and
,
,
are, respectively, the friction coefficient, normal contact force and sliding velocity of the
k-th tooth pair in engagement at the
i-th time step.
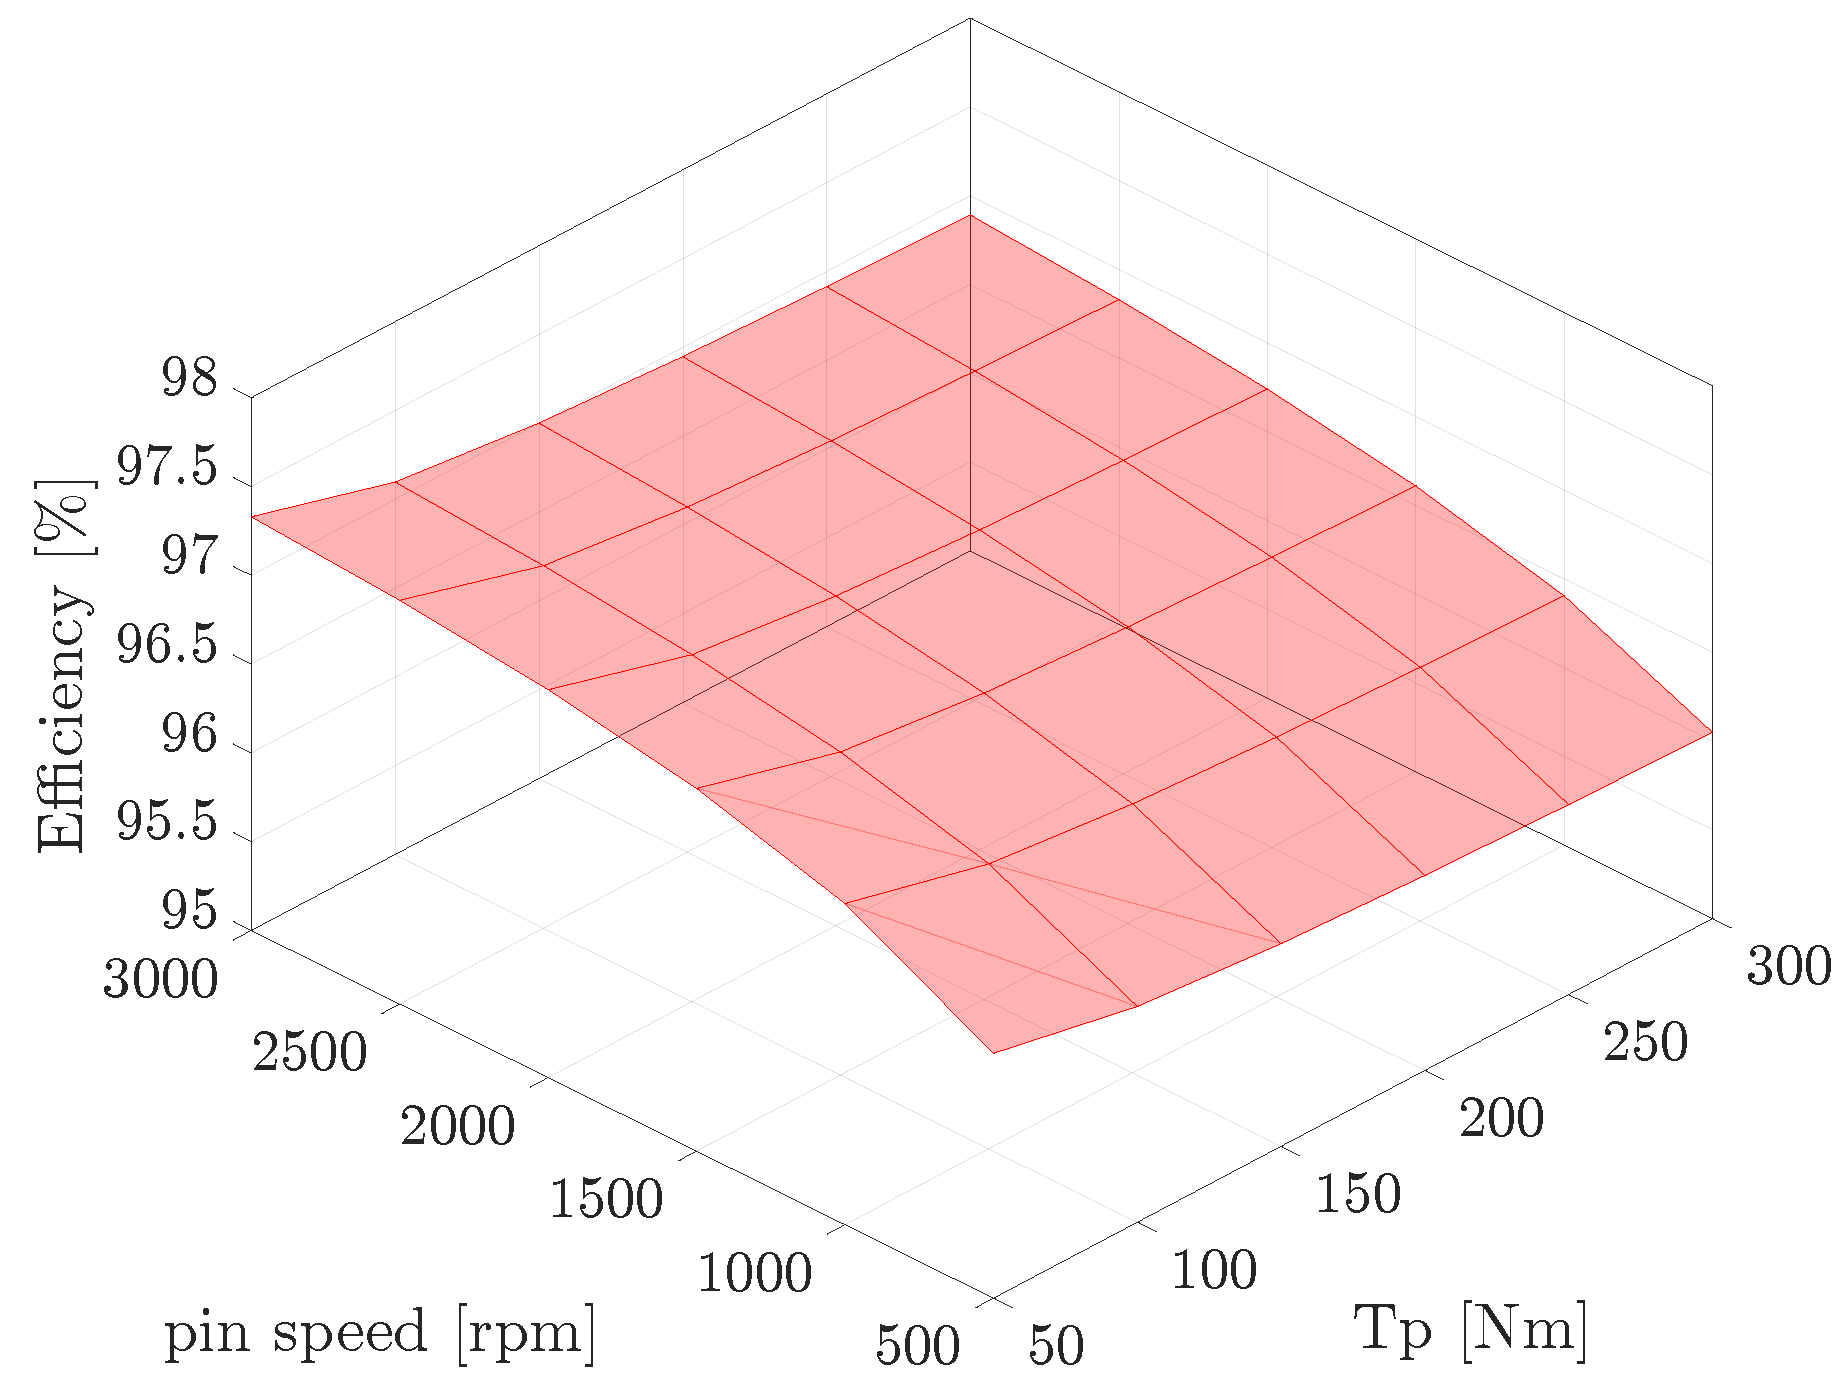
The efficiency estimation has been performed under different torques and speeds, namely in a torque range between 50 and 300 Nm and in a speed range between 500 and 3000 rpm. The results are shown in
Figure 8. According to our model, the efficiency decreases at large torque values and increases at higher speed. Those results are consistent with a mixed lubrication regime: a larger torque decreases the film thickness, resulting in a larger probability of asperity contacts. On the other hand, a higher speed increases the film thickness due to hydrodynamic effects, which mitigates the adverse effect of the boundary friction coefficient
(cfr. Equation (
1)).
5. Wear Model
The wear pattern is extracted directly by Transmission3D. Its wear implementation is based on the well-known Archard model:
where
w is the wear depth,
s is the sliding distance,
k is the
wear coefficient, and
P is the local pressure. The numerical value of the coefficient
k needs to be determined experimentally. Kahraman et al. [
23] suggested a value of
, which was experimentally derived for helical gears under mixed lubrication conditions. Due to the complexity and cost of an experimental test rig, this value has been used also for the hypoid gears investigated in this work. Under comparable operating conditions in terms of loading and peripheral speeds, hypoid gears generally have more sliding than helical gears, thus we can hypothesize that the value of
k is higher for the former. This might be caused by the fact that the larger sliding speeds entail an increased heating of the lubricant, which decreases the film thickness and thus induces more asperity contacts (more wear) under a mixed lubrication regime. However, obtaining an accurate
k value for hypoid gears is out of the scope of the present work.
After a certain number of meshing cycles, wear can noticeably modify the tooth flanks, thus the tooth geometry needs to be updated (before simulating further wear) to re-evaluate the contact pressure distribution, which is very sensitive to micro-geometry variations. The geometric update is performed by superimposing the post-processed wear pattern (evaluated at points arranged in a grid on the tooth flanks) onto the previous tooth surfaces. At the
j-th grid point:
where:
contains the coordinates of the grid point after the k-th geometry update;
and are the grid point coordinates and unit normal components after the -th (previous) geometry update;
is the k-th local wear depth.
The updated points
are then best-fit by a
NURBS surface [
24], which allows us to also compute the updated unit normals
. The updated points and normals are then fed back to a tooth mesher for Transmission3D, and the next wear simulation step is executed.
6. Wear Analysis Application
In this section, we present the results of an investigation aimed at assessing the impact of the frequency in updating the geometry of the worn tooth surfaces on the prediction of the final accumulated wear and contact patterns. The
contact pattern represents the envelope of all the instantaneous contact zones over the meshing cycle; the
wear pattern is the corresponding wear distribution on the tooth surface (after a certain number of wear cycles). Each geometry update necessarily calls for a new LTCA simulation, hence frequent updates can easily lead to a significant cost in terms of CPU time for a complete wear simulation. Our goal is to evaluate the best trade-off between the number of geometry updates and the computational burden. We assume here a service life of 30 Mc (where 1 Mc =
cycles), counted as revolutions of the hypoid pinion. The initial contact patterns of pinion and gear are shown in
Figure 9.
As a first step, serving as a baseline result, a very coarse analysis is carried out, where the predicted wear is evaluated assuming that the initial tooth geometry does not change during the whole service life. After calculating wear distribution, a geometry update is performed only once and the resulting contact pressures are computed. The corresponding wear and pressure patterns are shown in
Figure 10 for the pinion and in
Figure 11 for the gear. The contact patterns exhibit remarkable differences with respect to the ones in
Figure 9: a significant shift of the pressure peaks away from the tooth flank center is evident (
Figure 10a and
Figure 11a), and it is due to an unrealistic wear indentation effect.
In the subsequent analysis, a similar wear simulation is performed. This time, however, the tooth flank modifications due to the worn-out material, and the corresponding variation in contact pressures, are gradually updated according to a stepwise approach, where each step consists of 5 Mc. In other words, the tooth flank geometry is iteratively modified every 5 Mc as per Equation (
18). This update strategy, in practice, is equivalent to updating after a given wear volume, i.e., the wear volume at the first wear cycle, multiplied by the number of wear cycles [
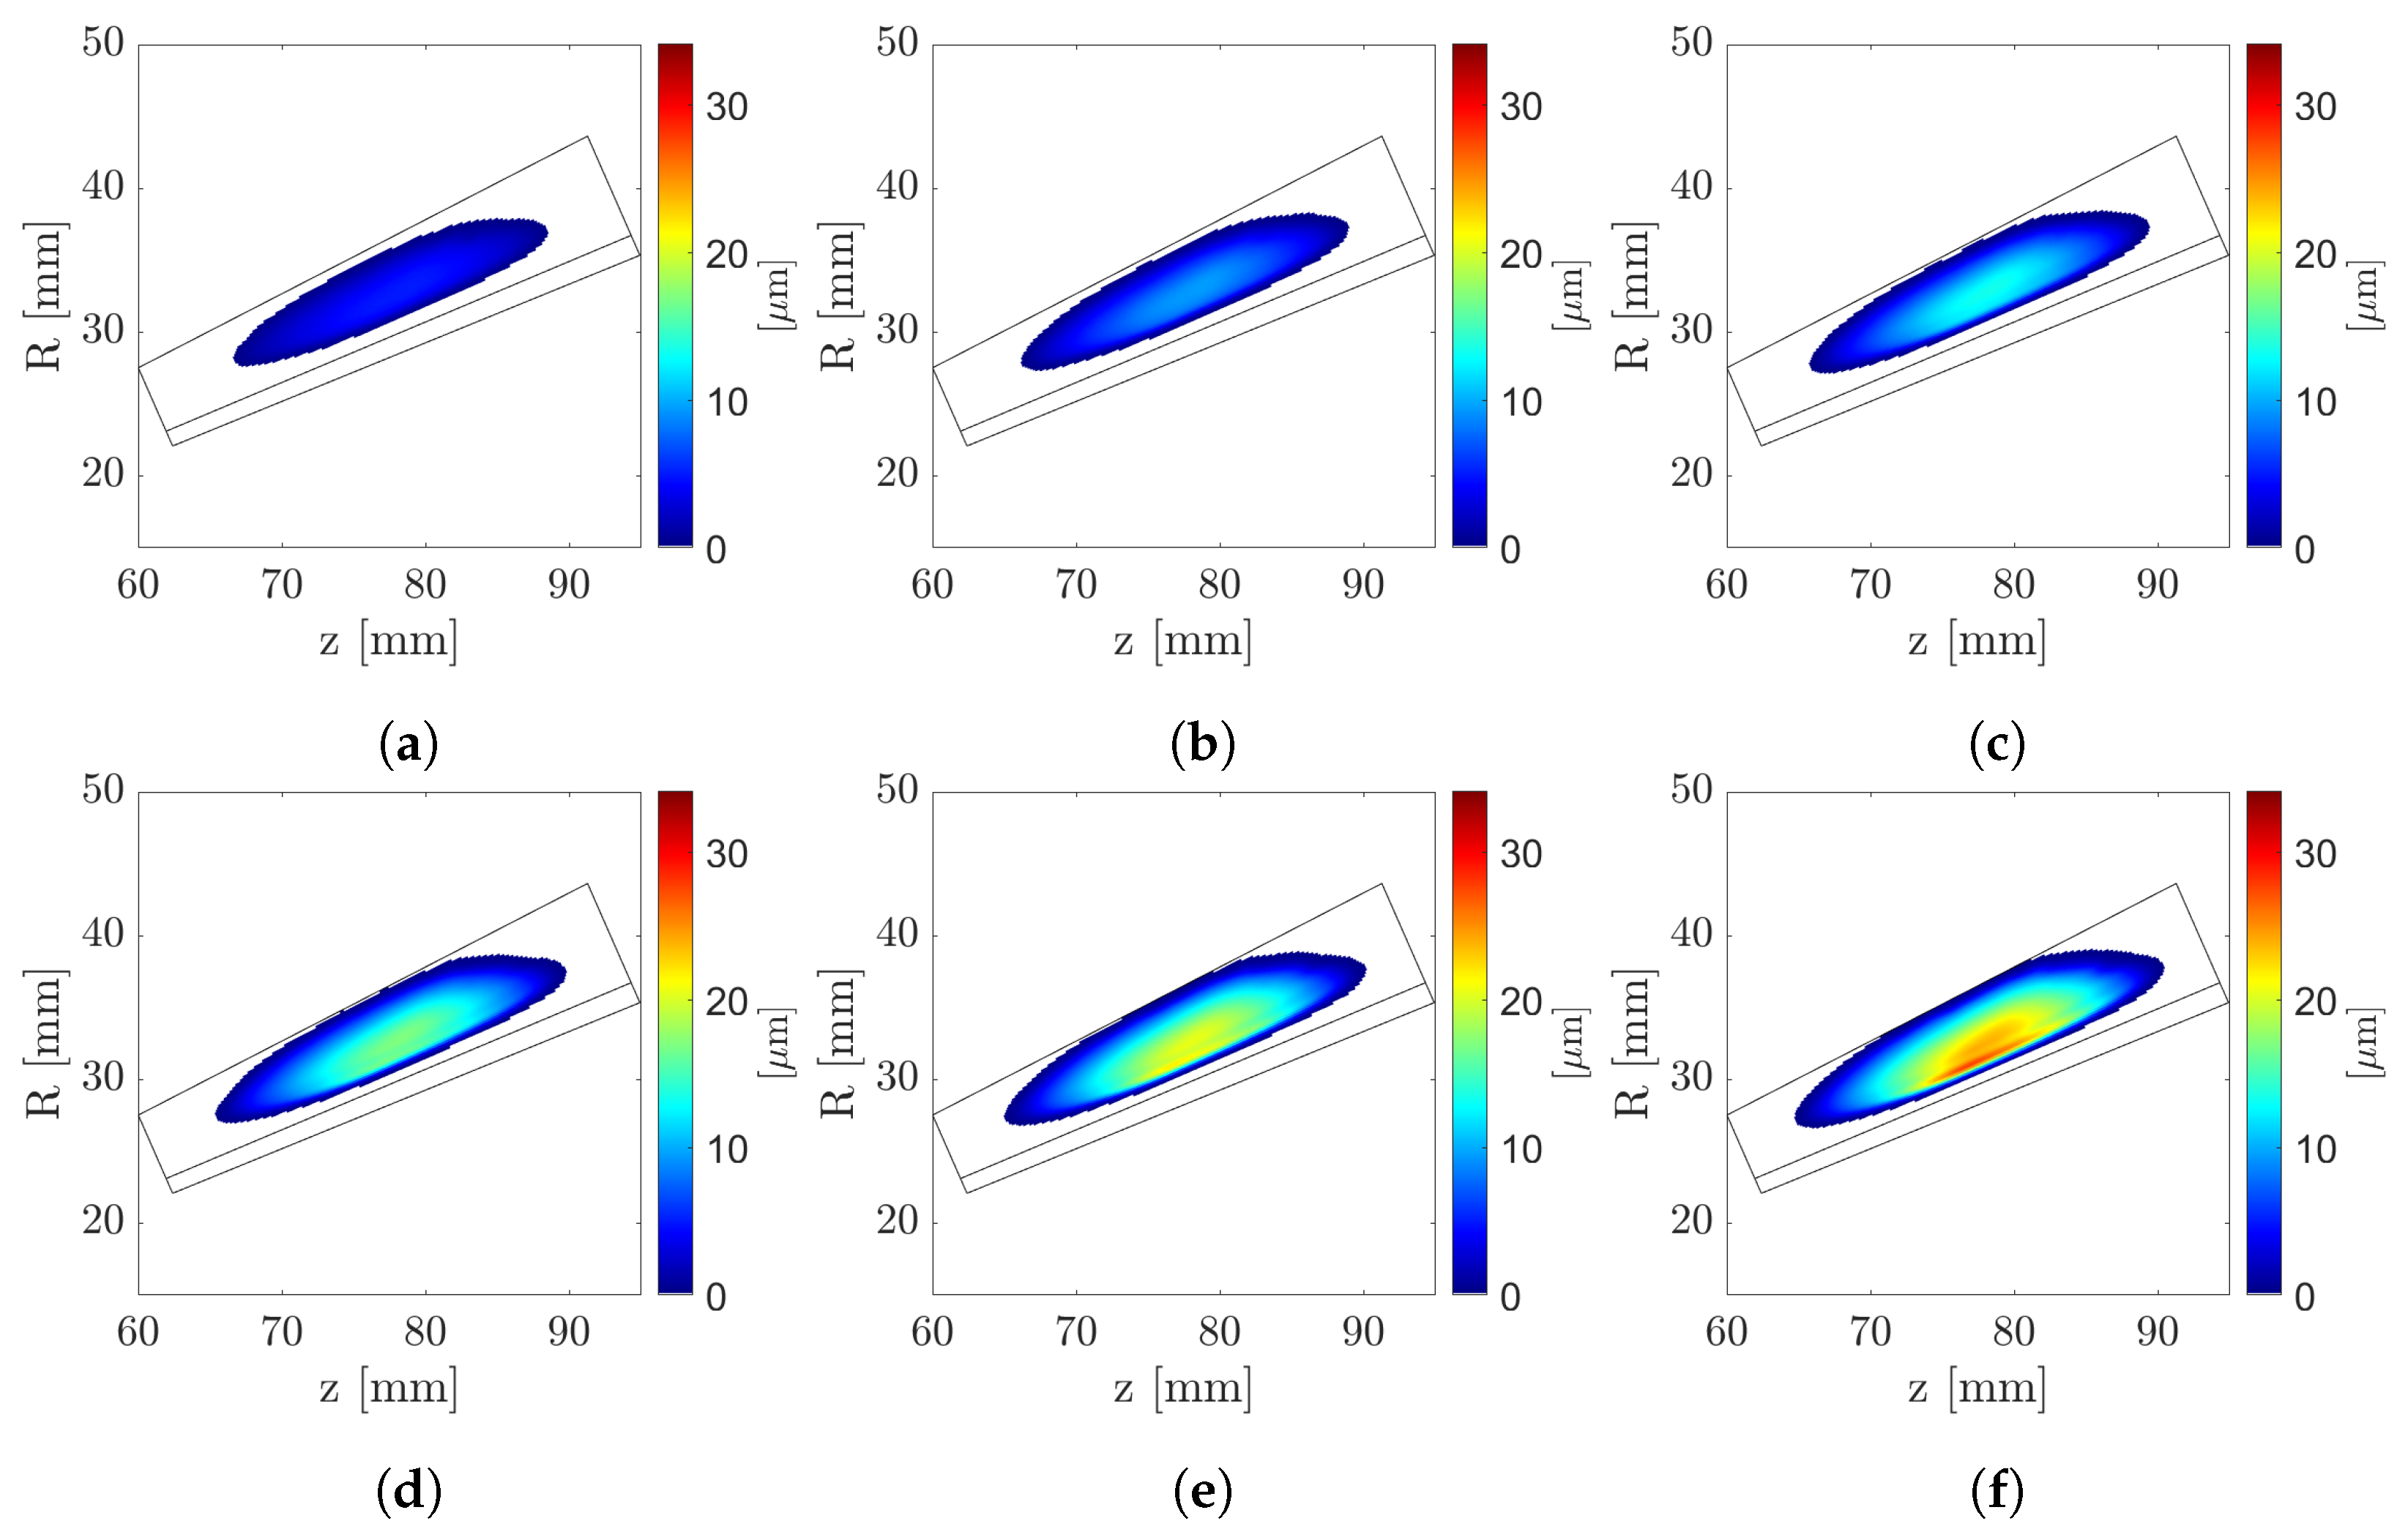
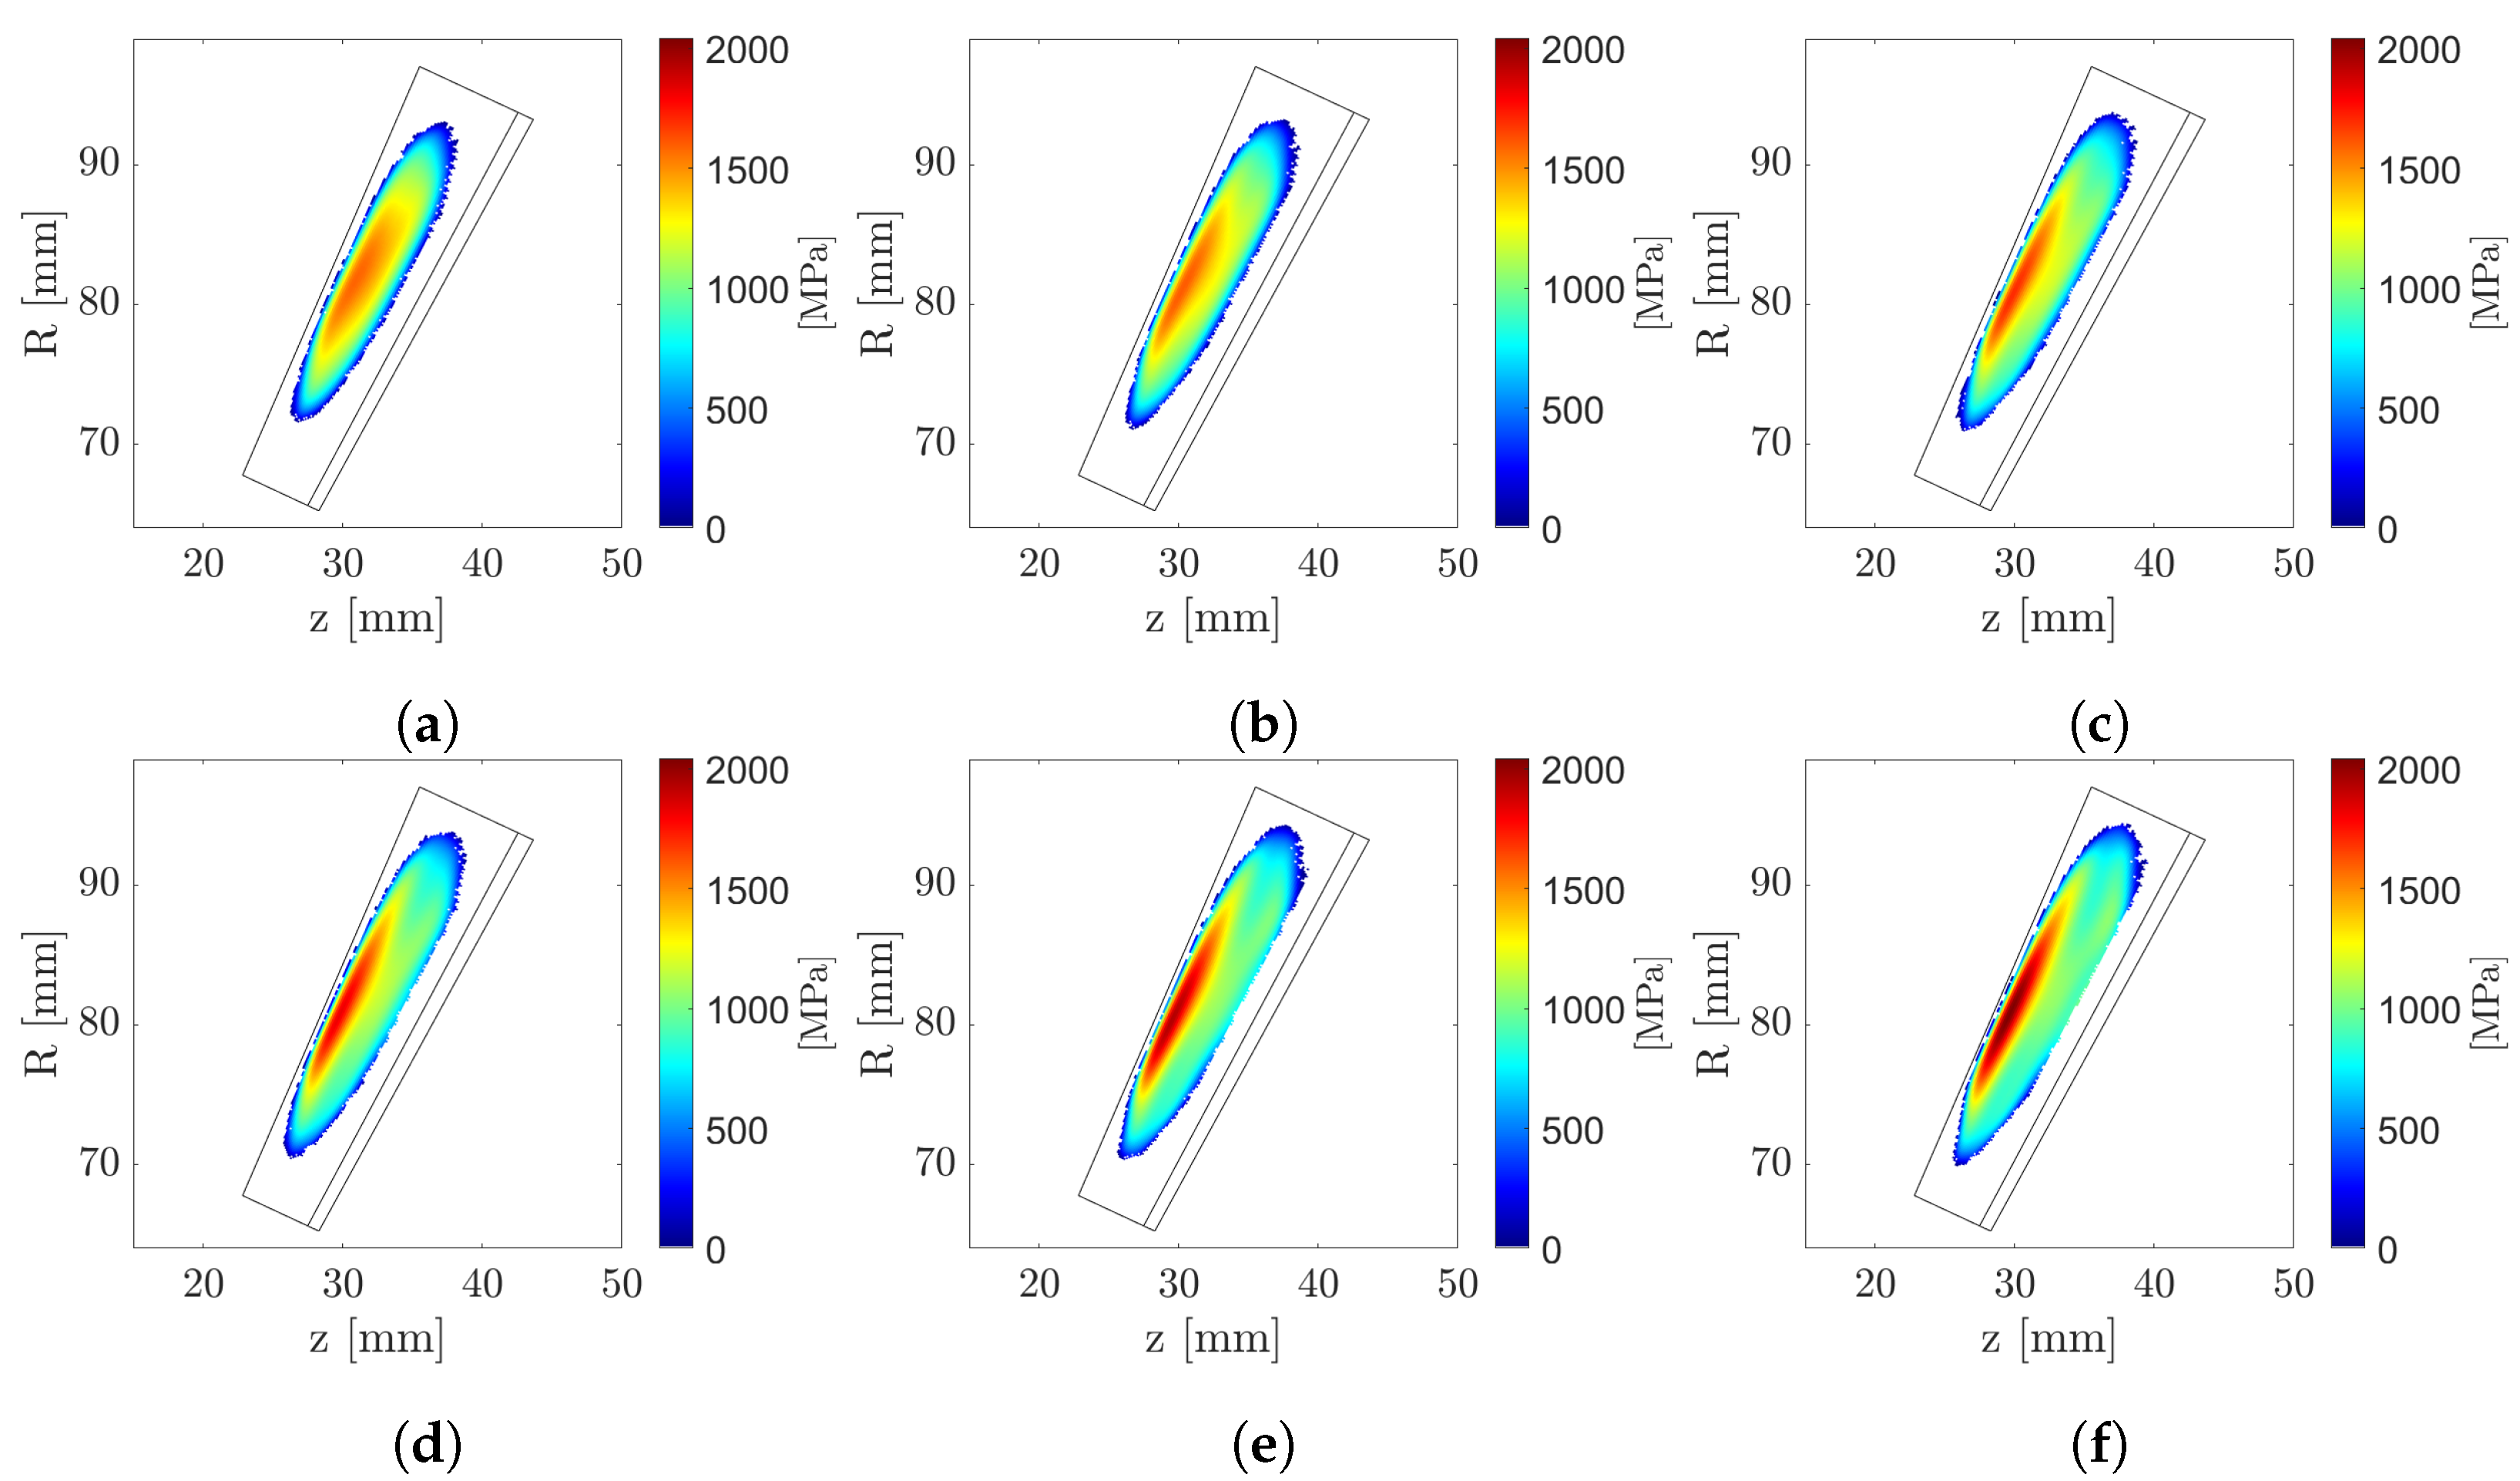
25]. The evolution of the pinion contact and wear patterns are shown, respectively, in
Figure 12 and
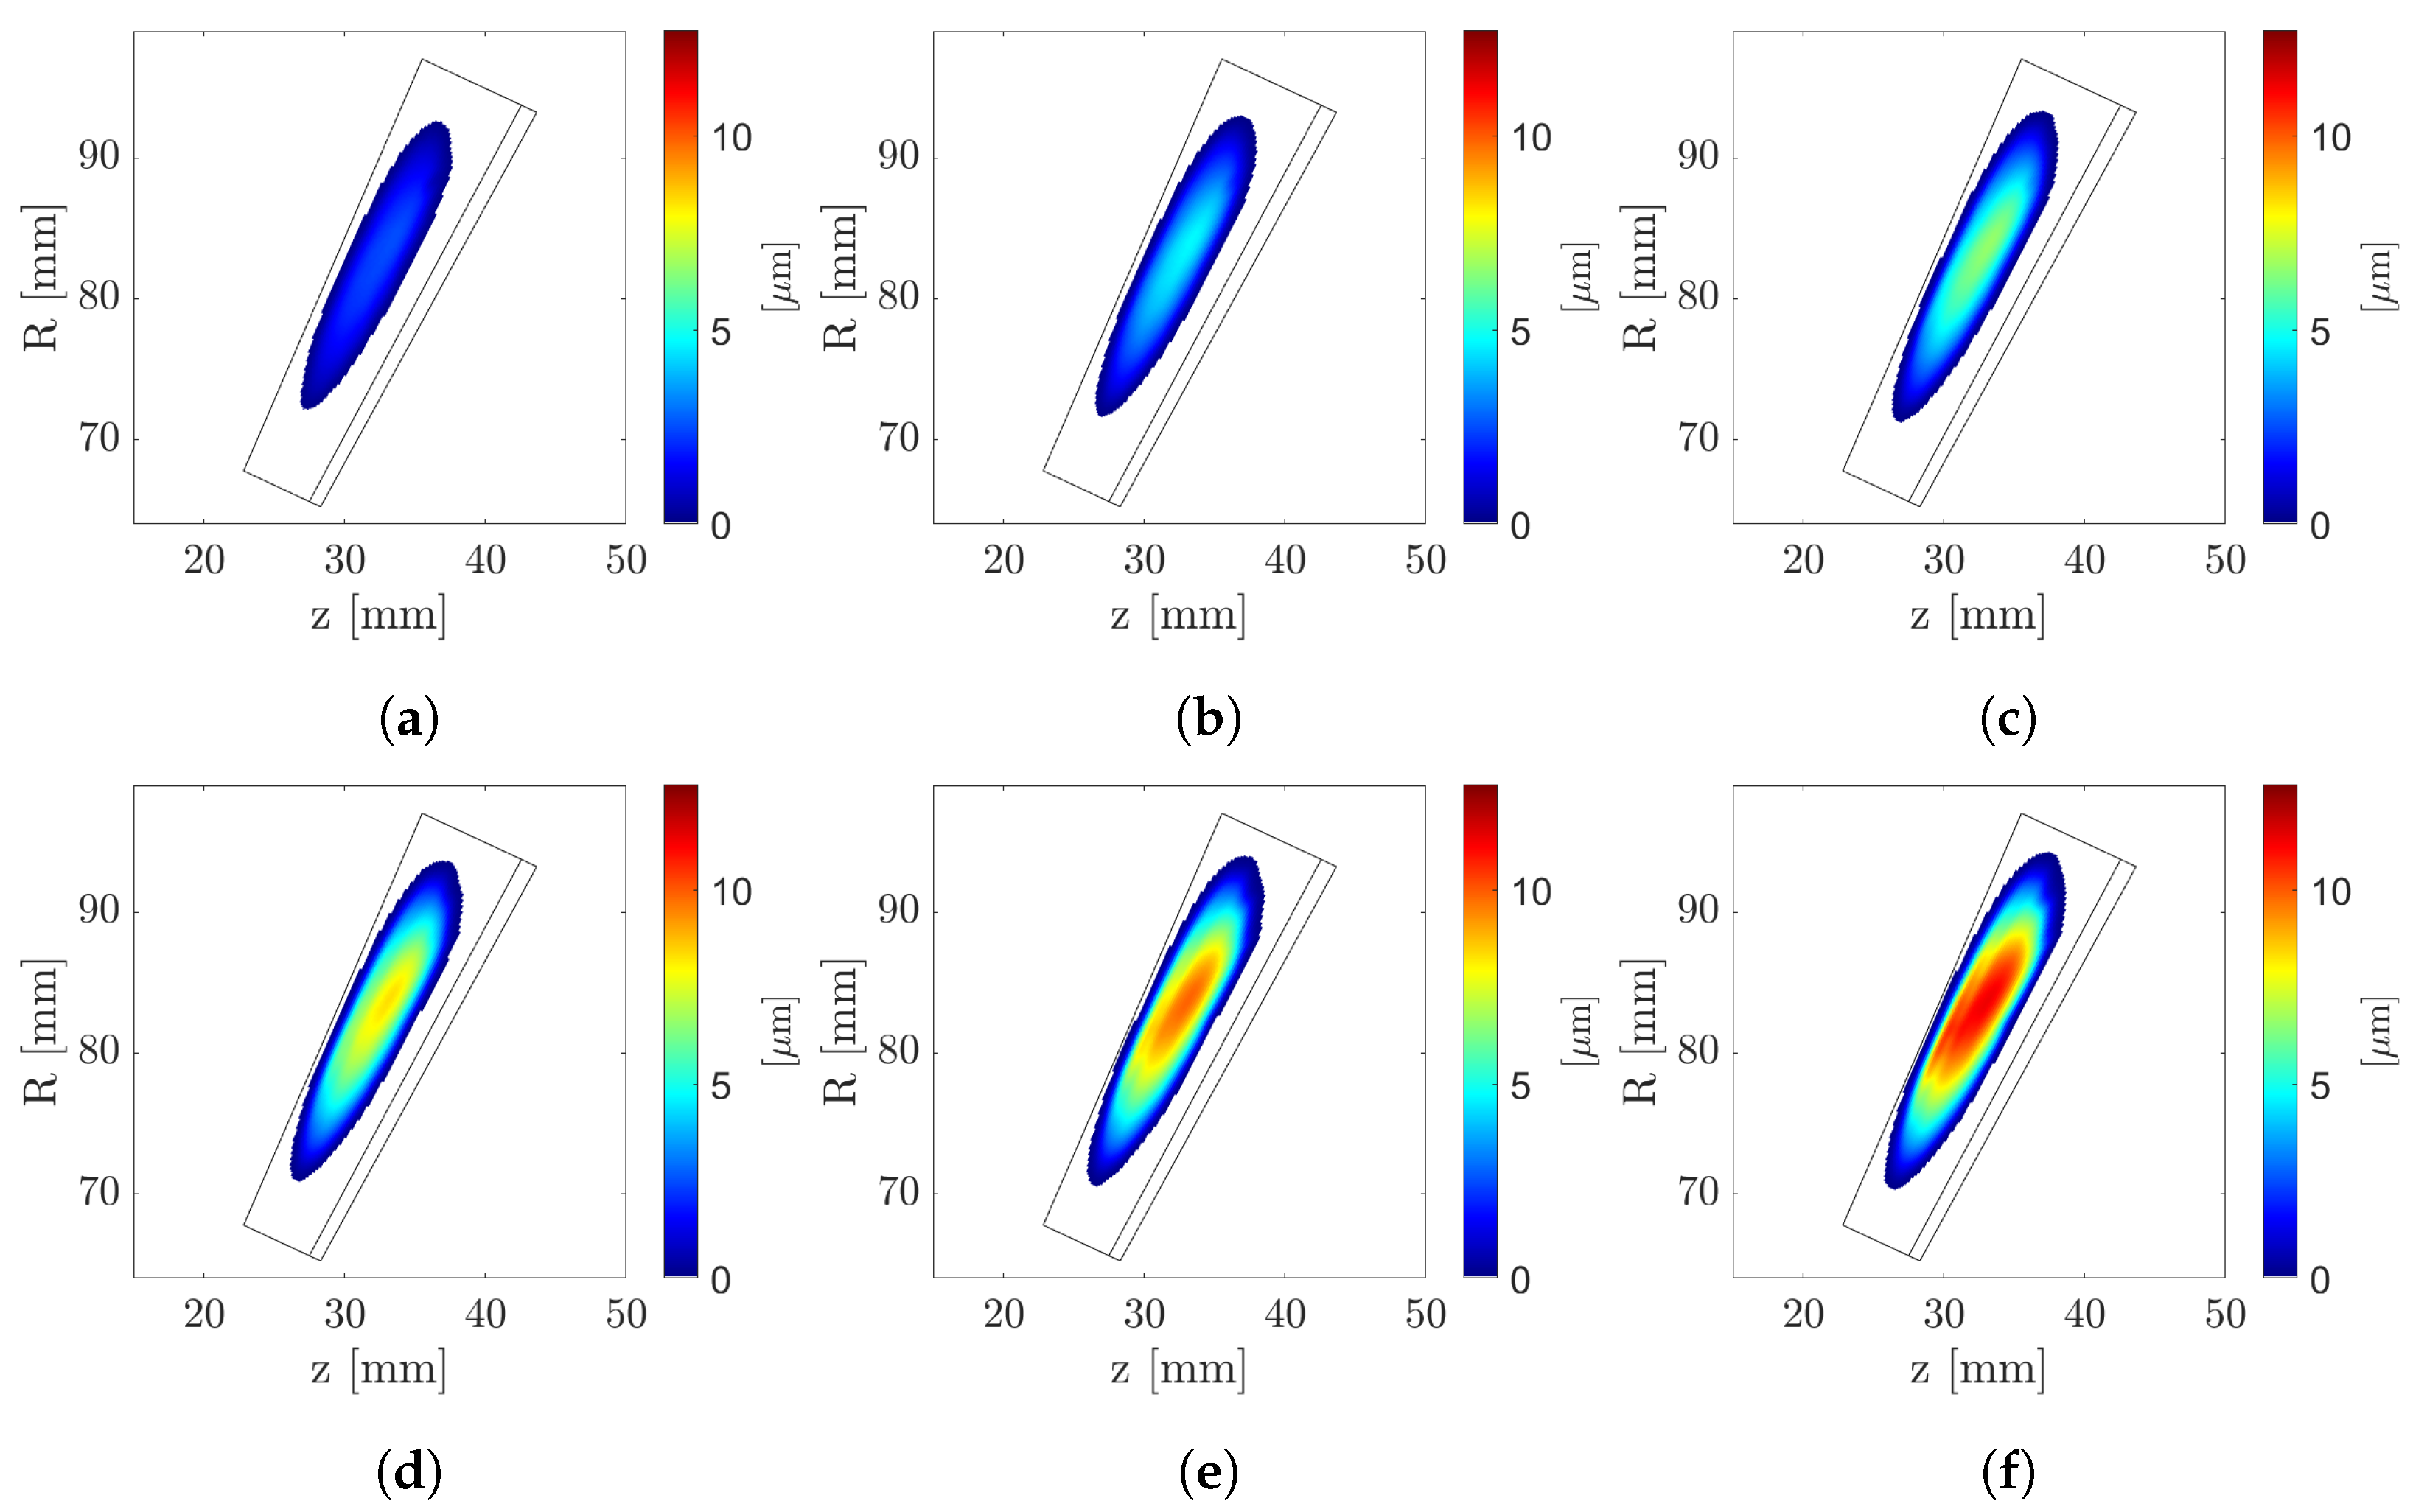
Figure 13. The associated gear patterns are shown in
Figure 14 and
Figure 15. As expected, the overall pattern grows larger along both the profile and face directions of the active flank. However, a localization of the contact pressures near the fillet portion of the pinion (close to, but away from, the gear tip) is evident. In the same area, also the wear pattern features a localization of its peaks.
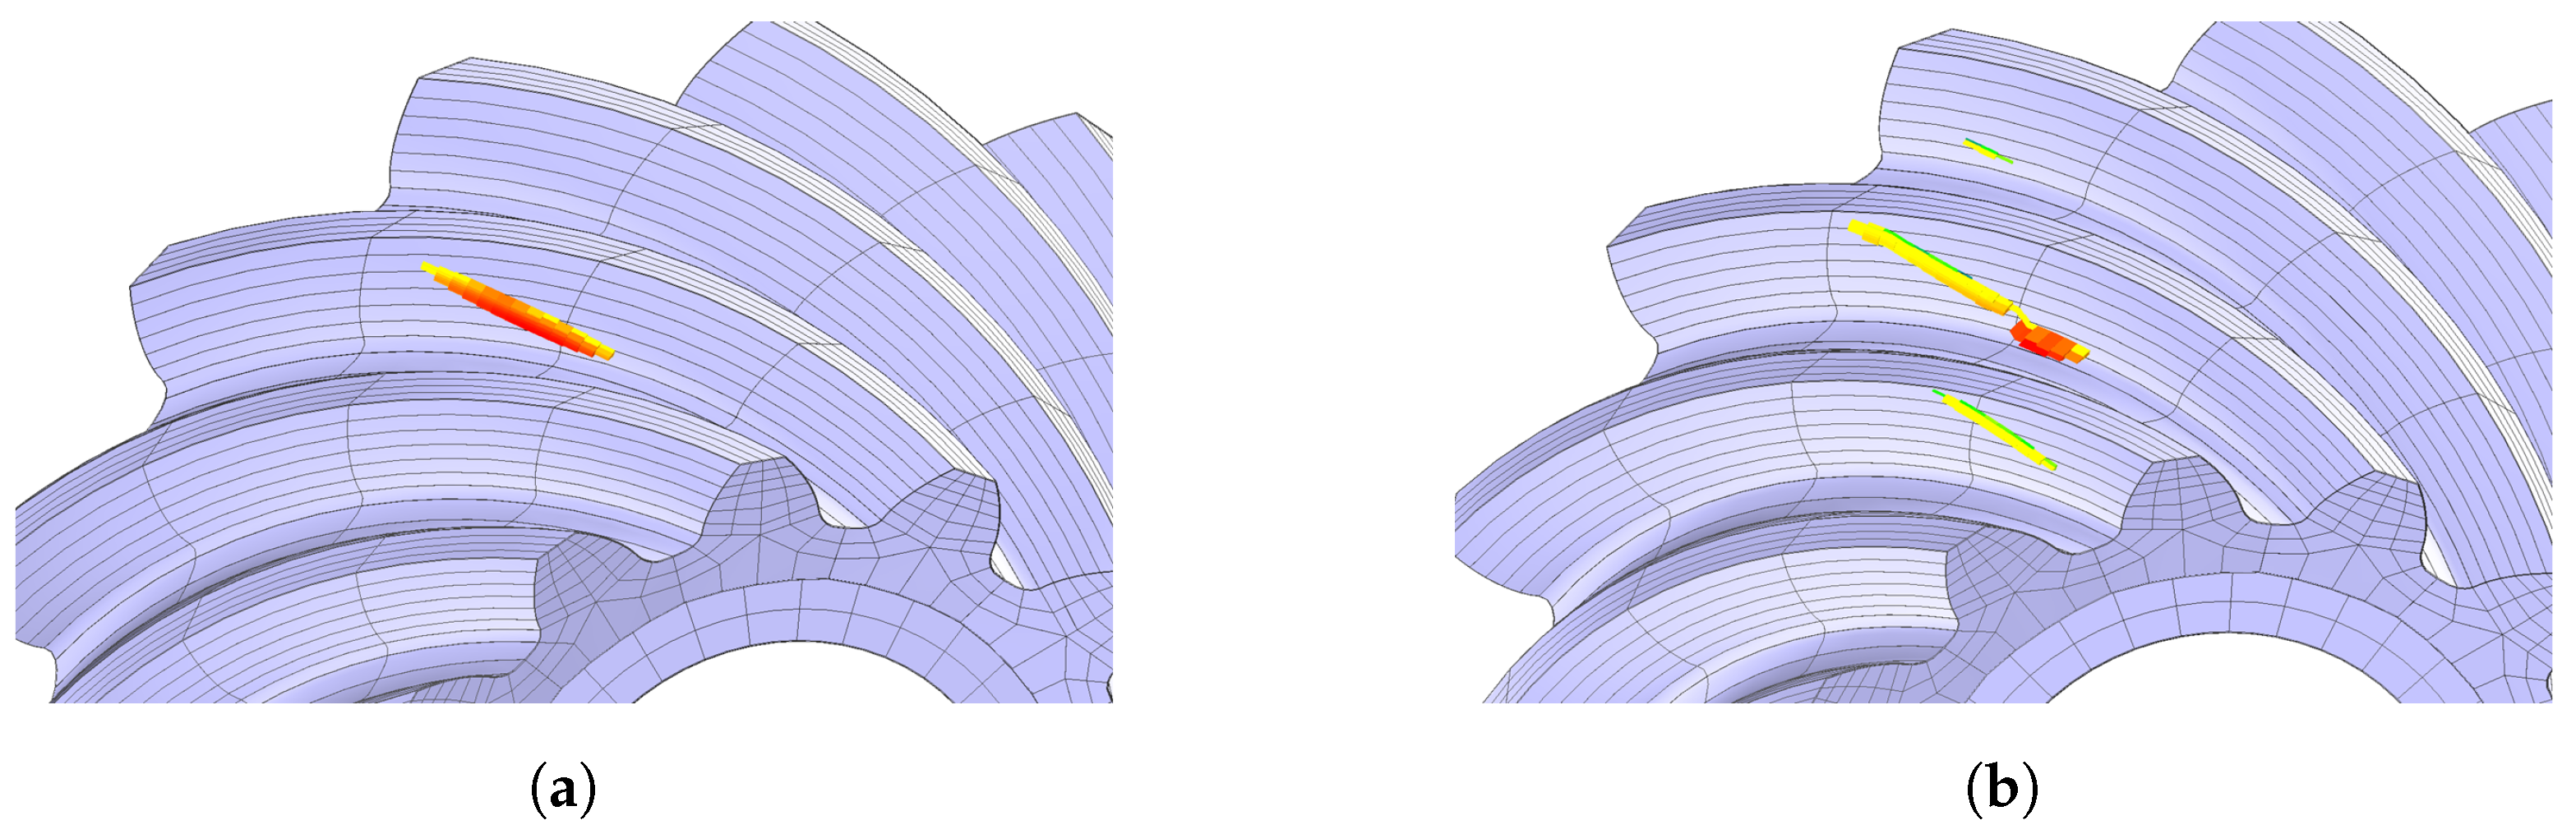
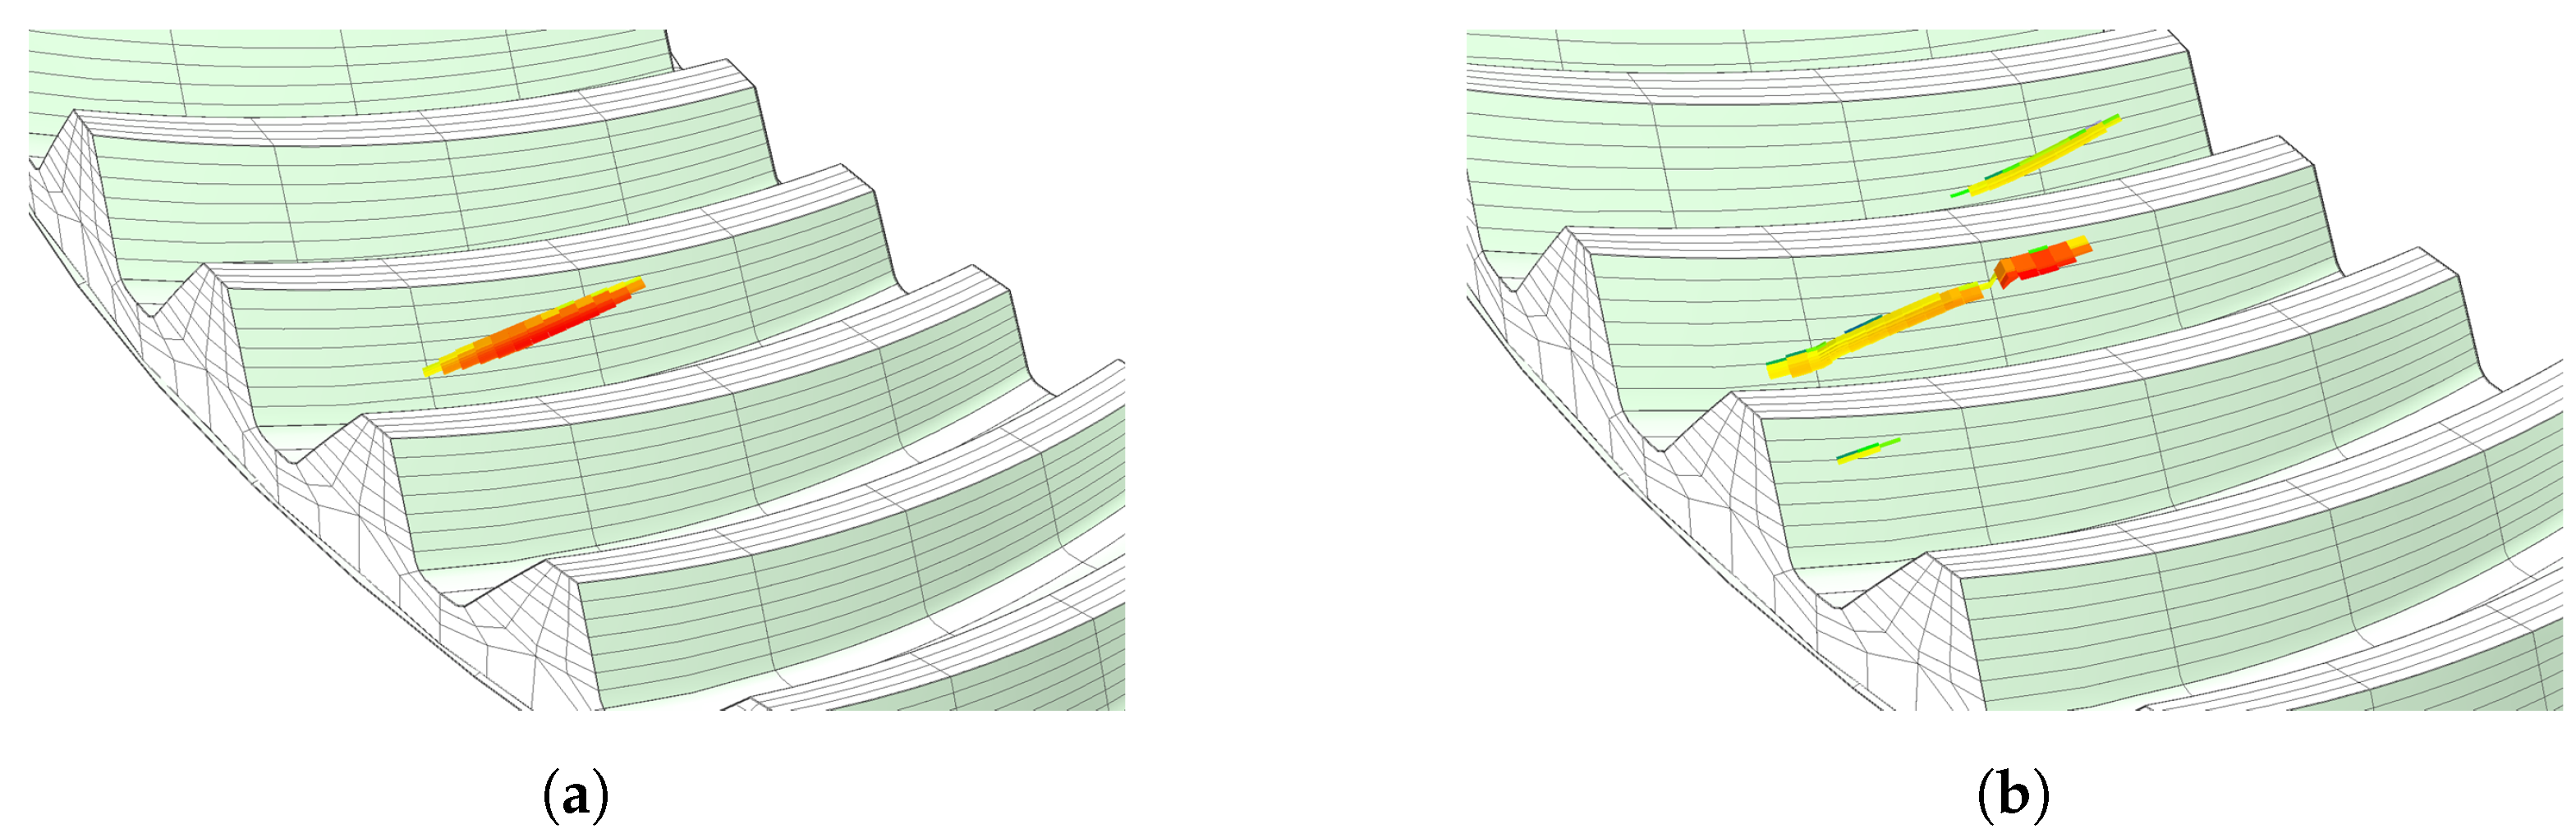
Figure 16 shows the pinion instantaneous contact zones at a specific meshing configuration before and after wear. The corresponding instantaneous contact zones for the gear are shown in
Figure 17. It can be noticed how wear induced a greater overlap ratio, increasing the number of mating tooth pairs (from one to three). Pressure localization is evident here as well, which appears to be caused by an abrupt change to the local curvature due to wear.
To gather more data for a sensitivity analysis, wear simulations have been performed also with geometry updates every 10 Mc, 1 Mc and 0.5 Mc. A side-by-side comparison of the final contact patterns is shown in
Figure 18. For brevity, only the pinion contact patterns are shown. It can be observed that the patterns obtained with 6, 30 and 60 update steps, i.e., every 5 Mc, 1 Mc, and 0.5 Mc, seem almost identical. Even with just three updates, i.e., every 10 Mc, the final pattern is already reasonably close to our most accurate analysis.
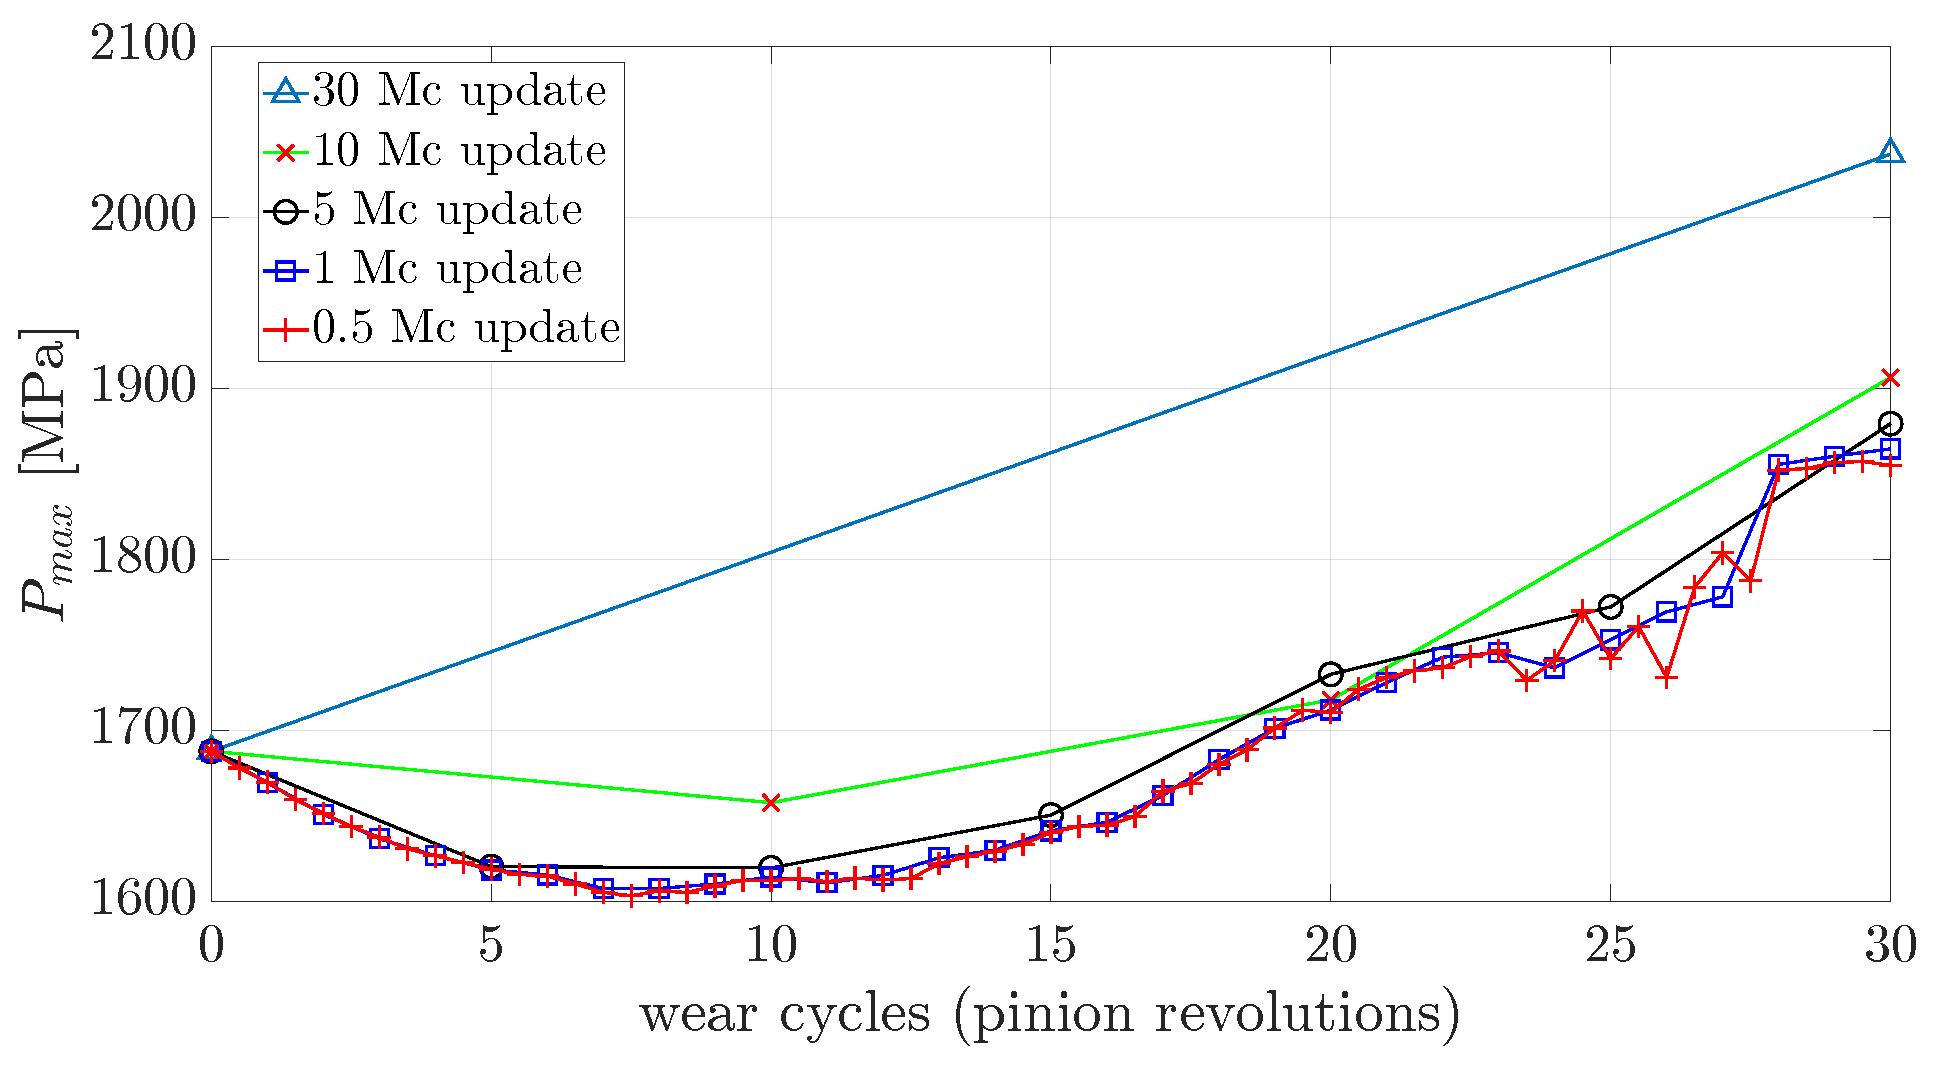
Figure 19 depicts a more quantitative result of this analysis by showing the maximum contact pressure (
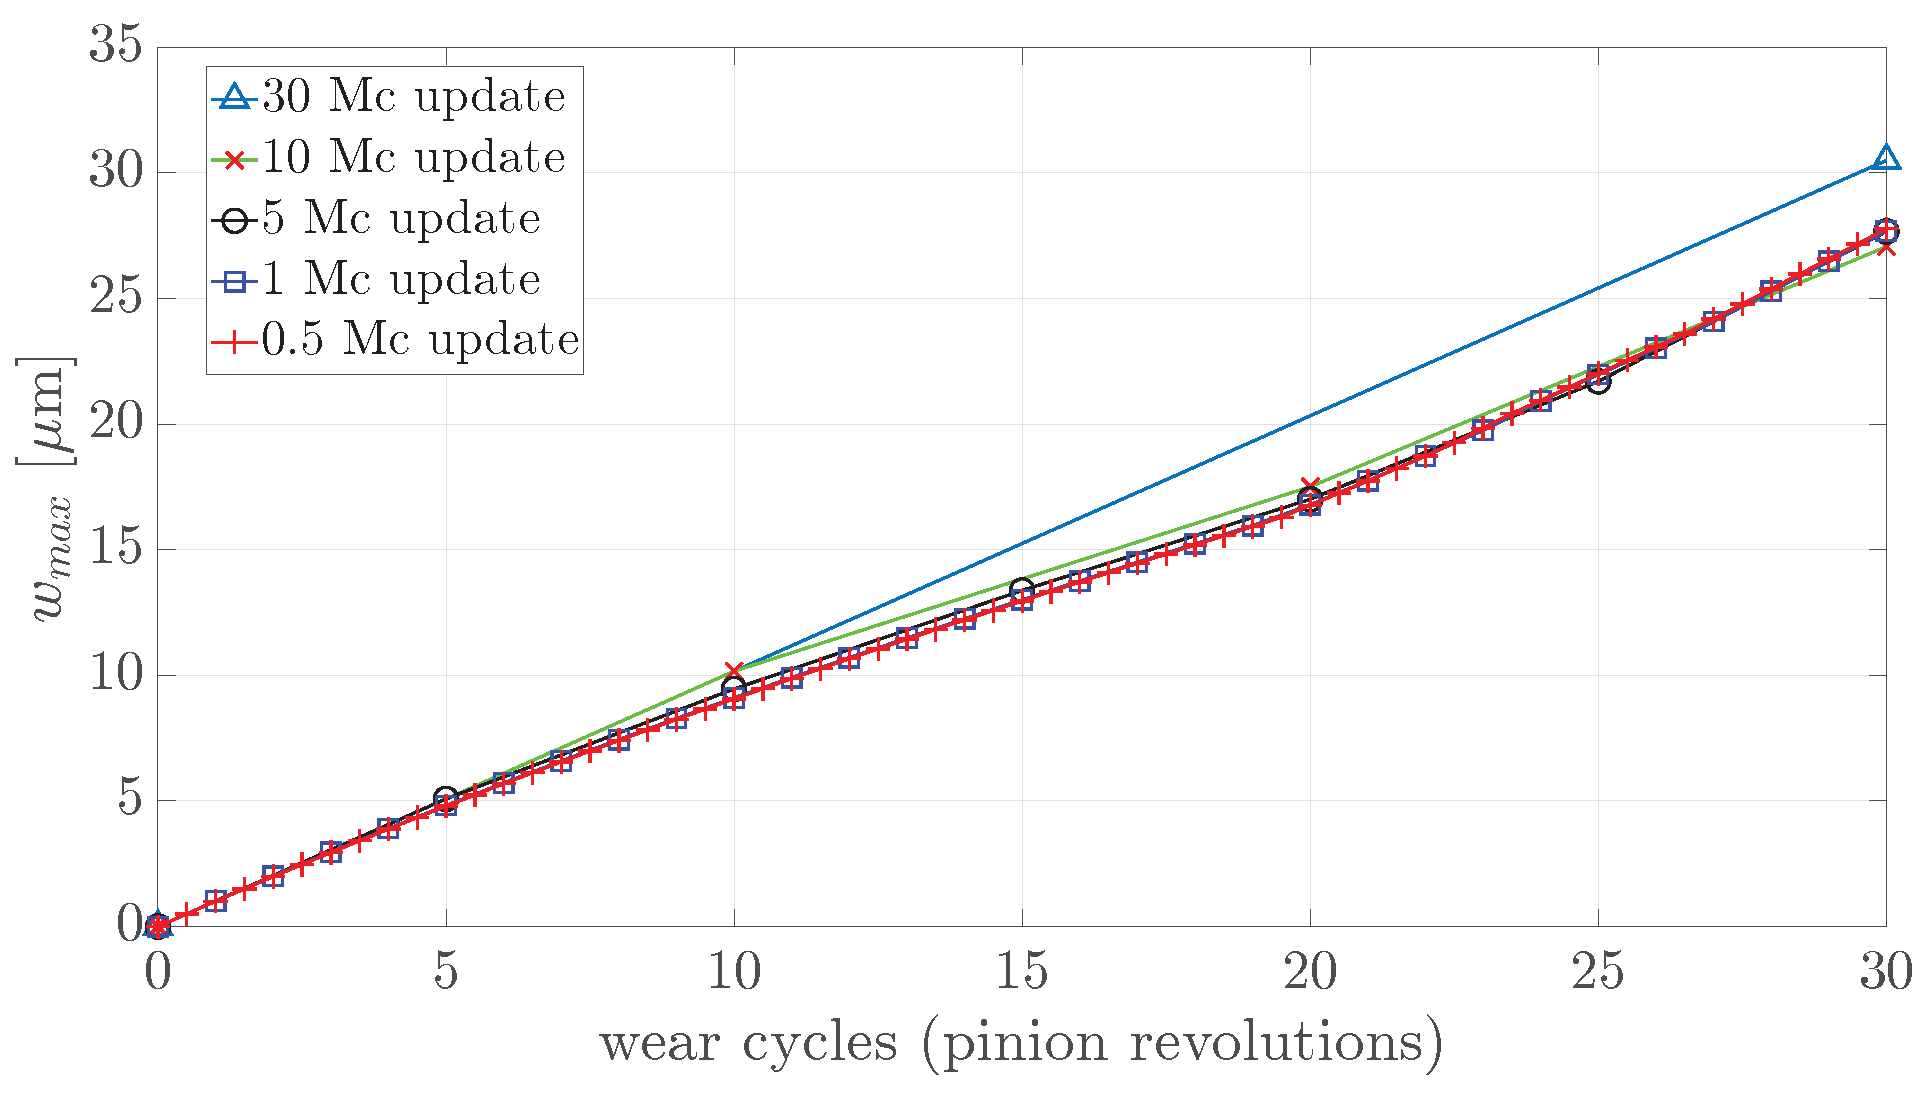
) registered during meshing as a function of the wear cycles. An analogous representation of the maximum wear depth
registered on the pinion is shown in
Figure 20. The graphs show that a geometry update performed every 5 Mc may be a good choice for balancing an accurate prediction, both in terms of contact pressure and wear depth, with affordable computations in terms of CPU time.


 ,
, 


