
EEG-Based Empathic Safe Cobot


Abstract
:1. Introduction
2. Materials and Methods
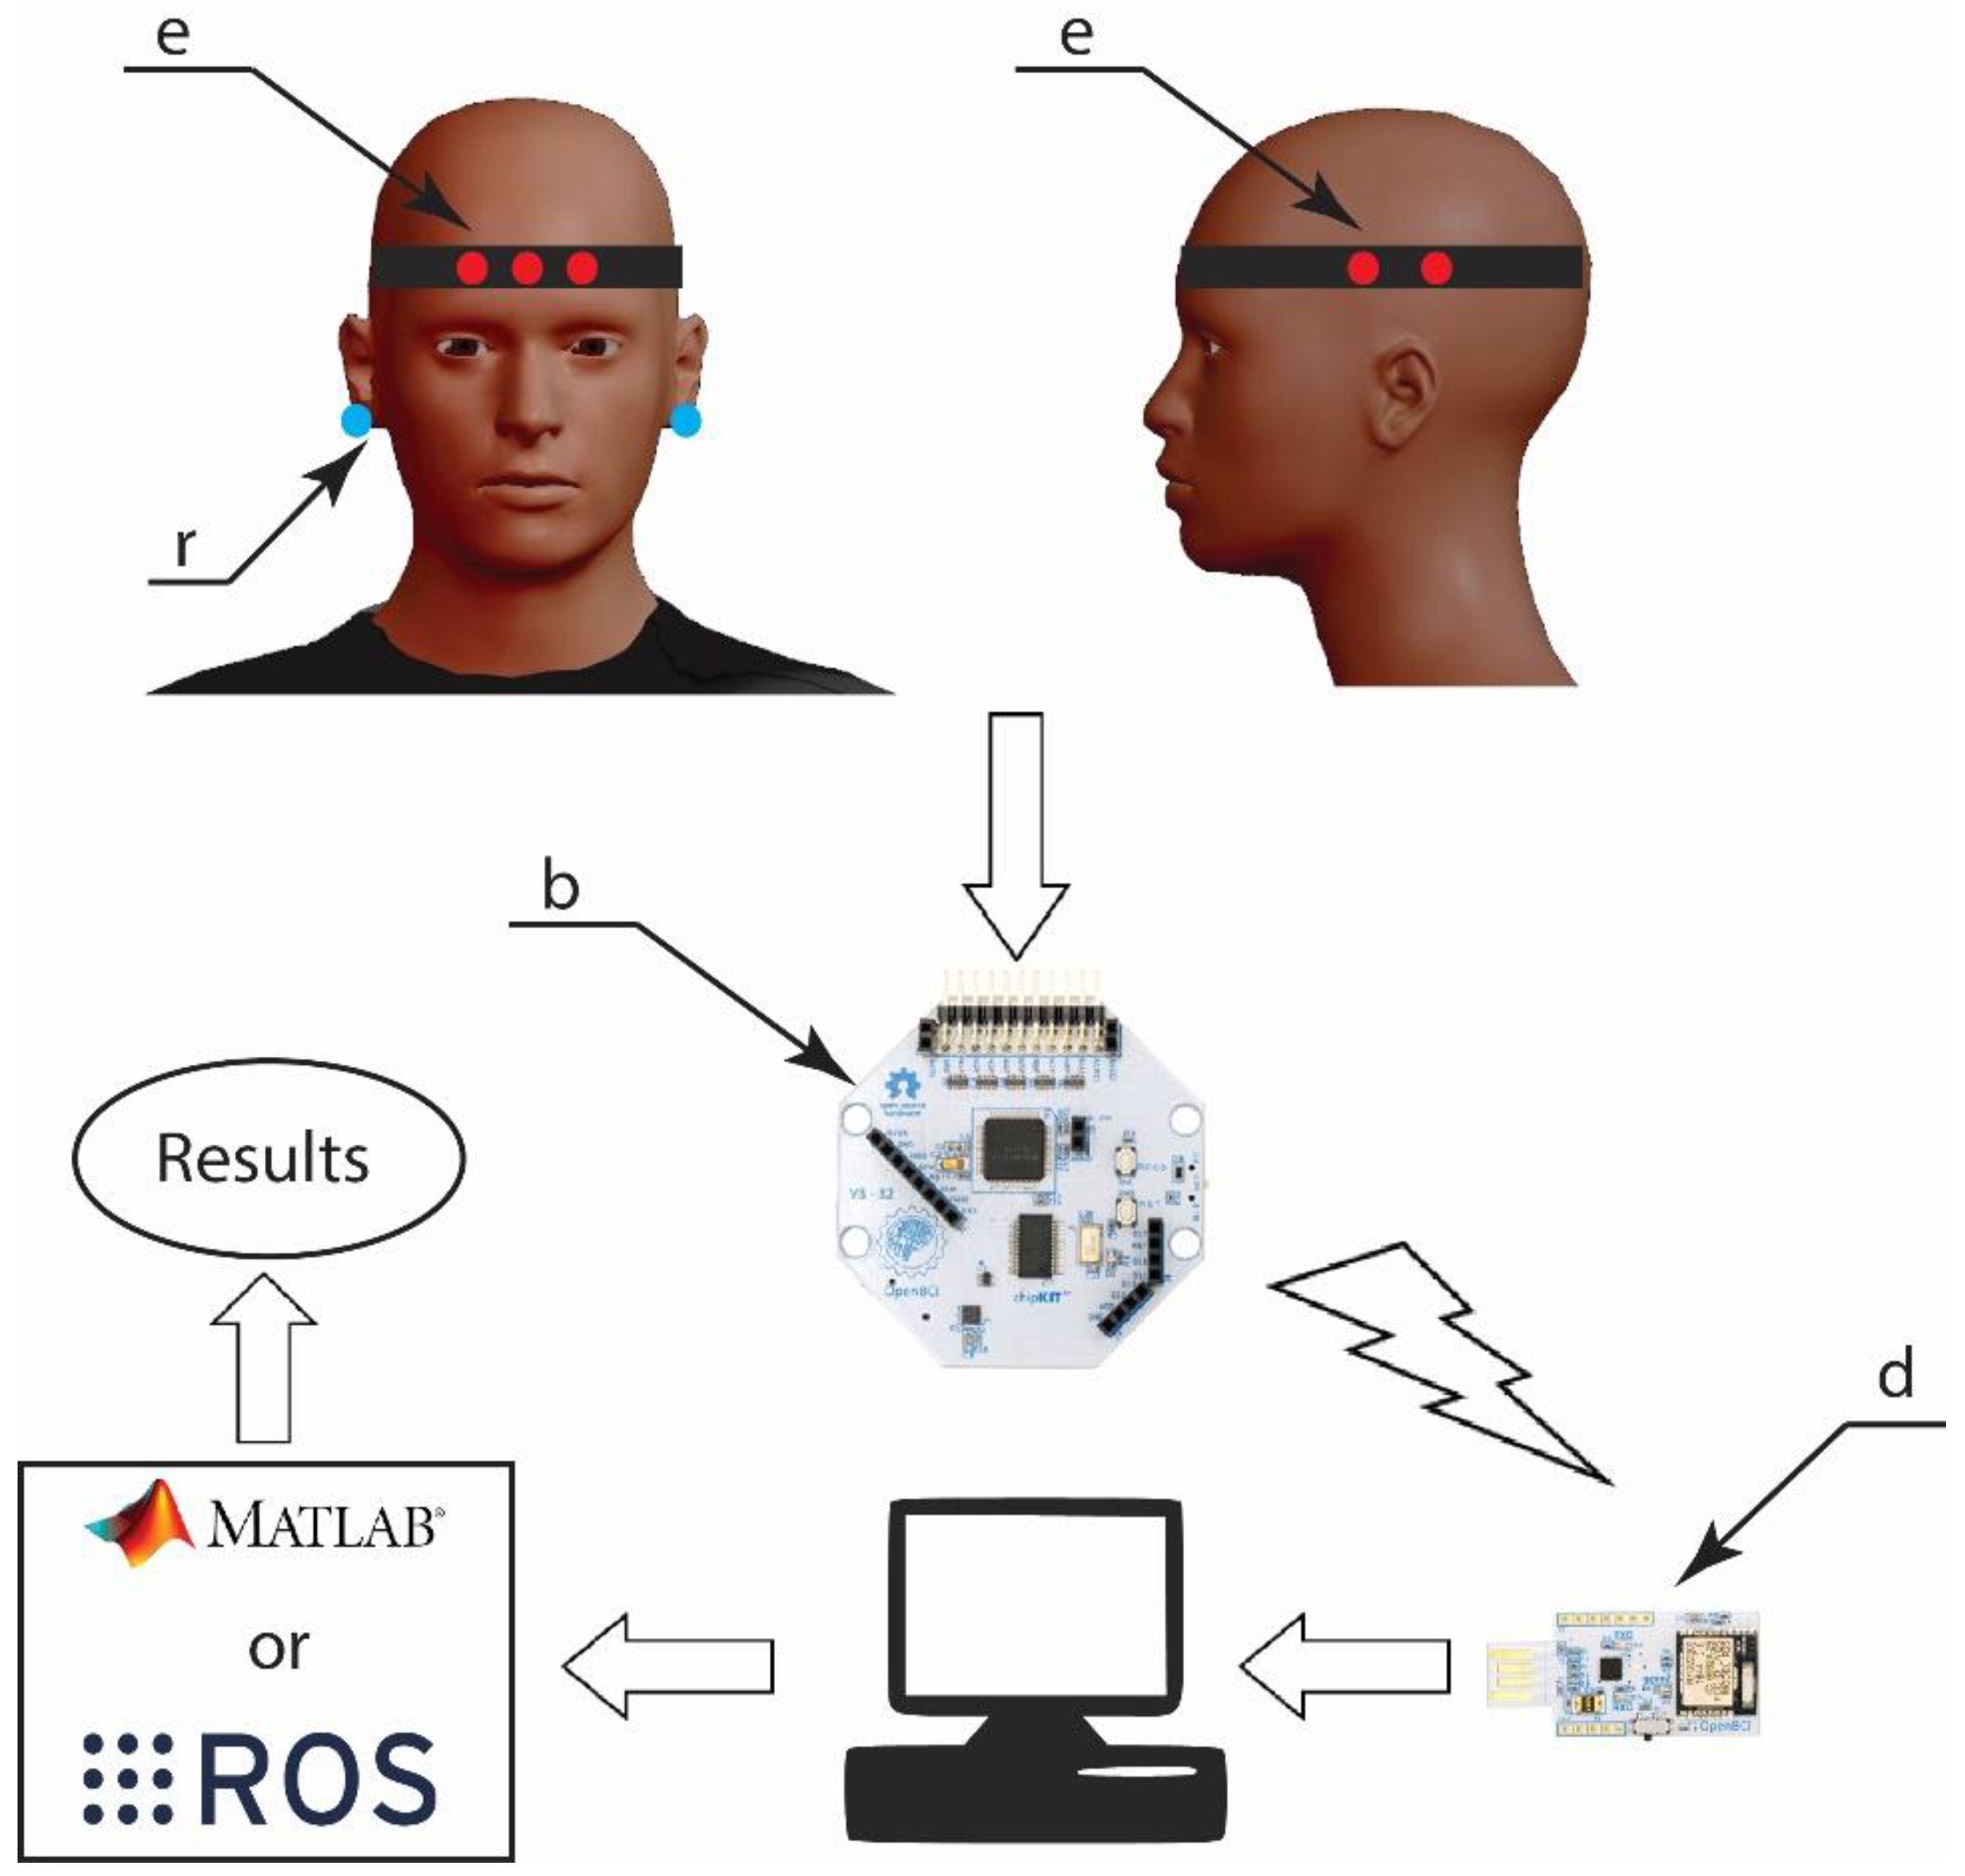
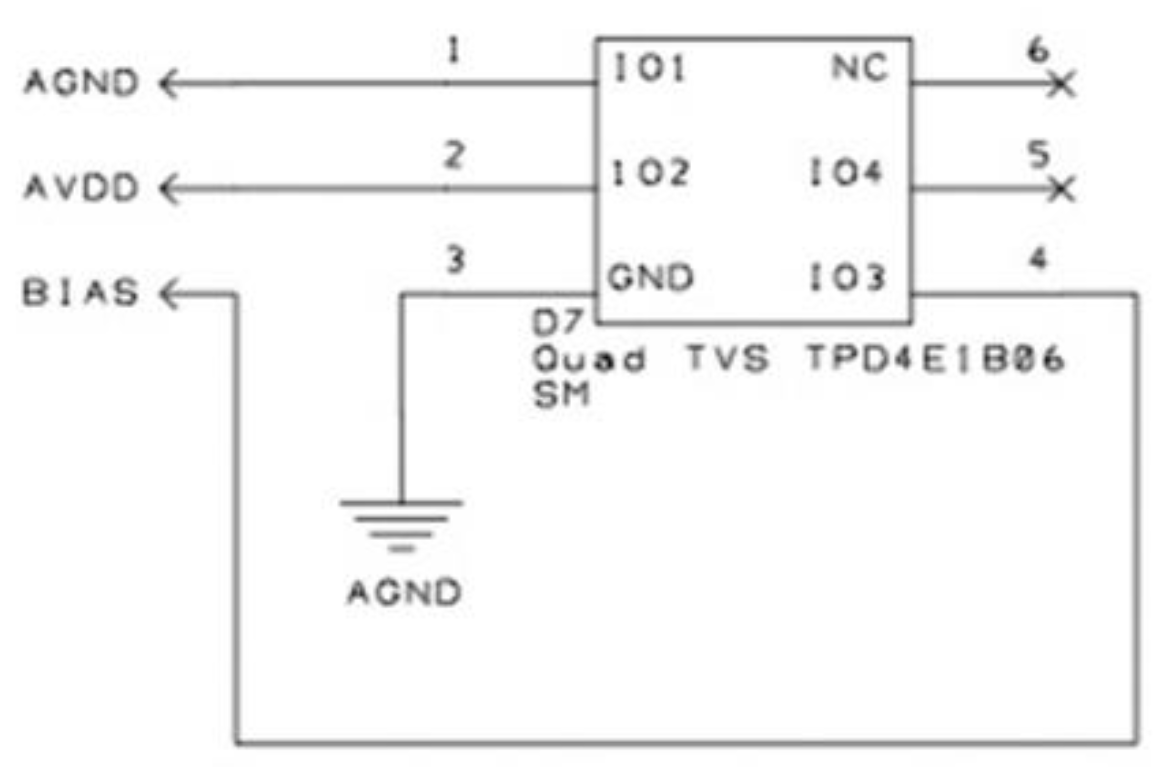
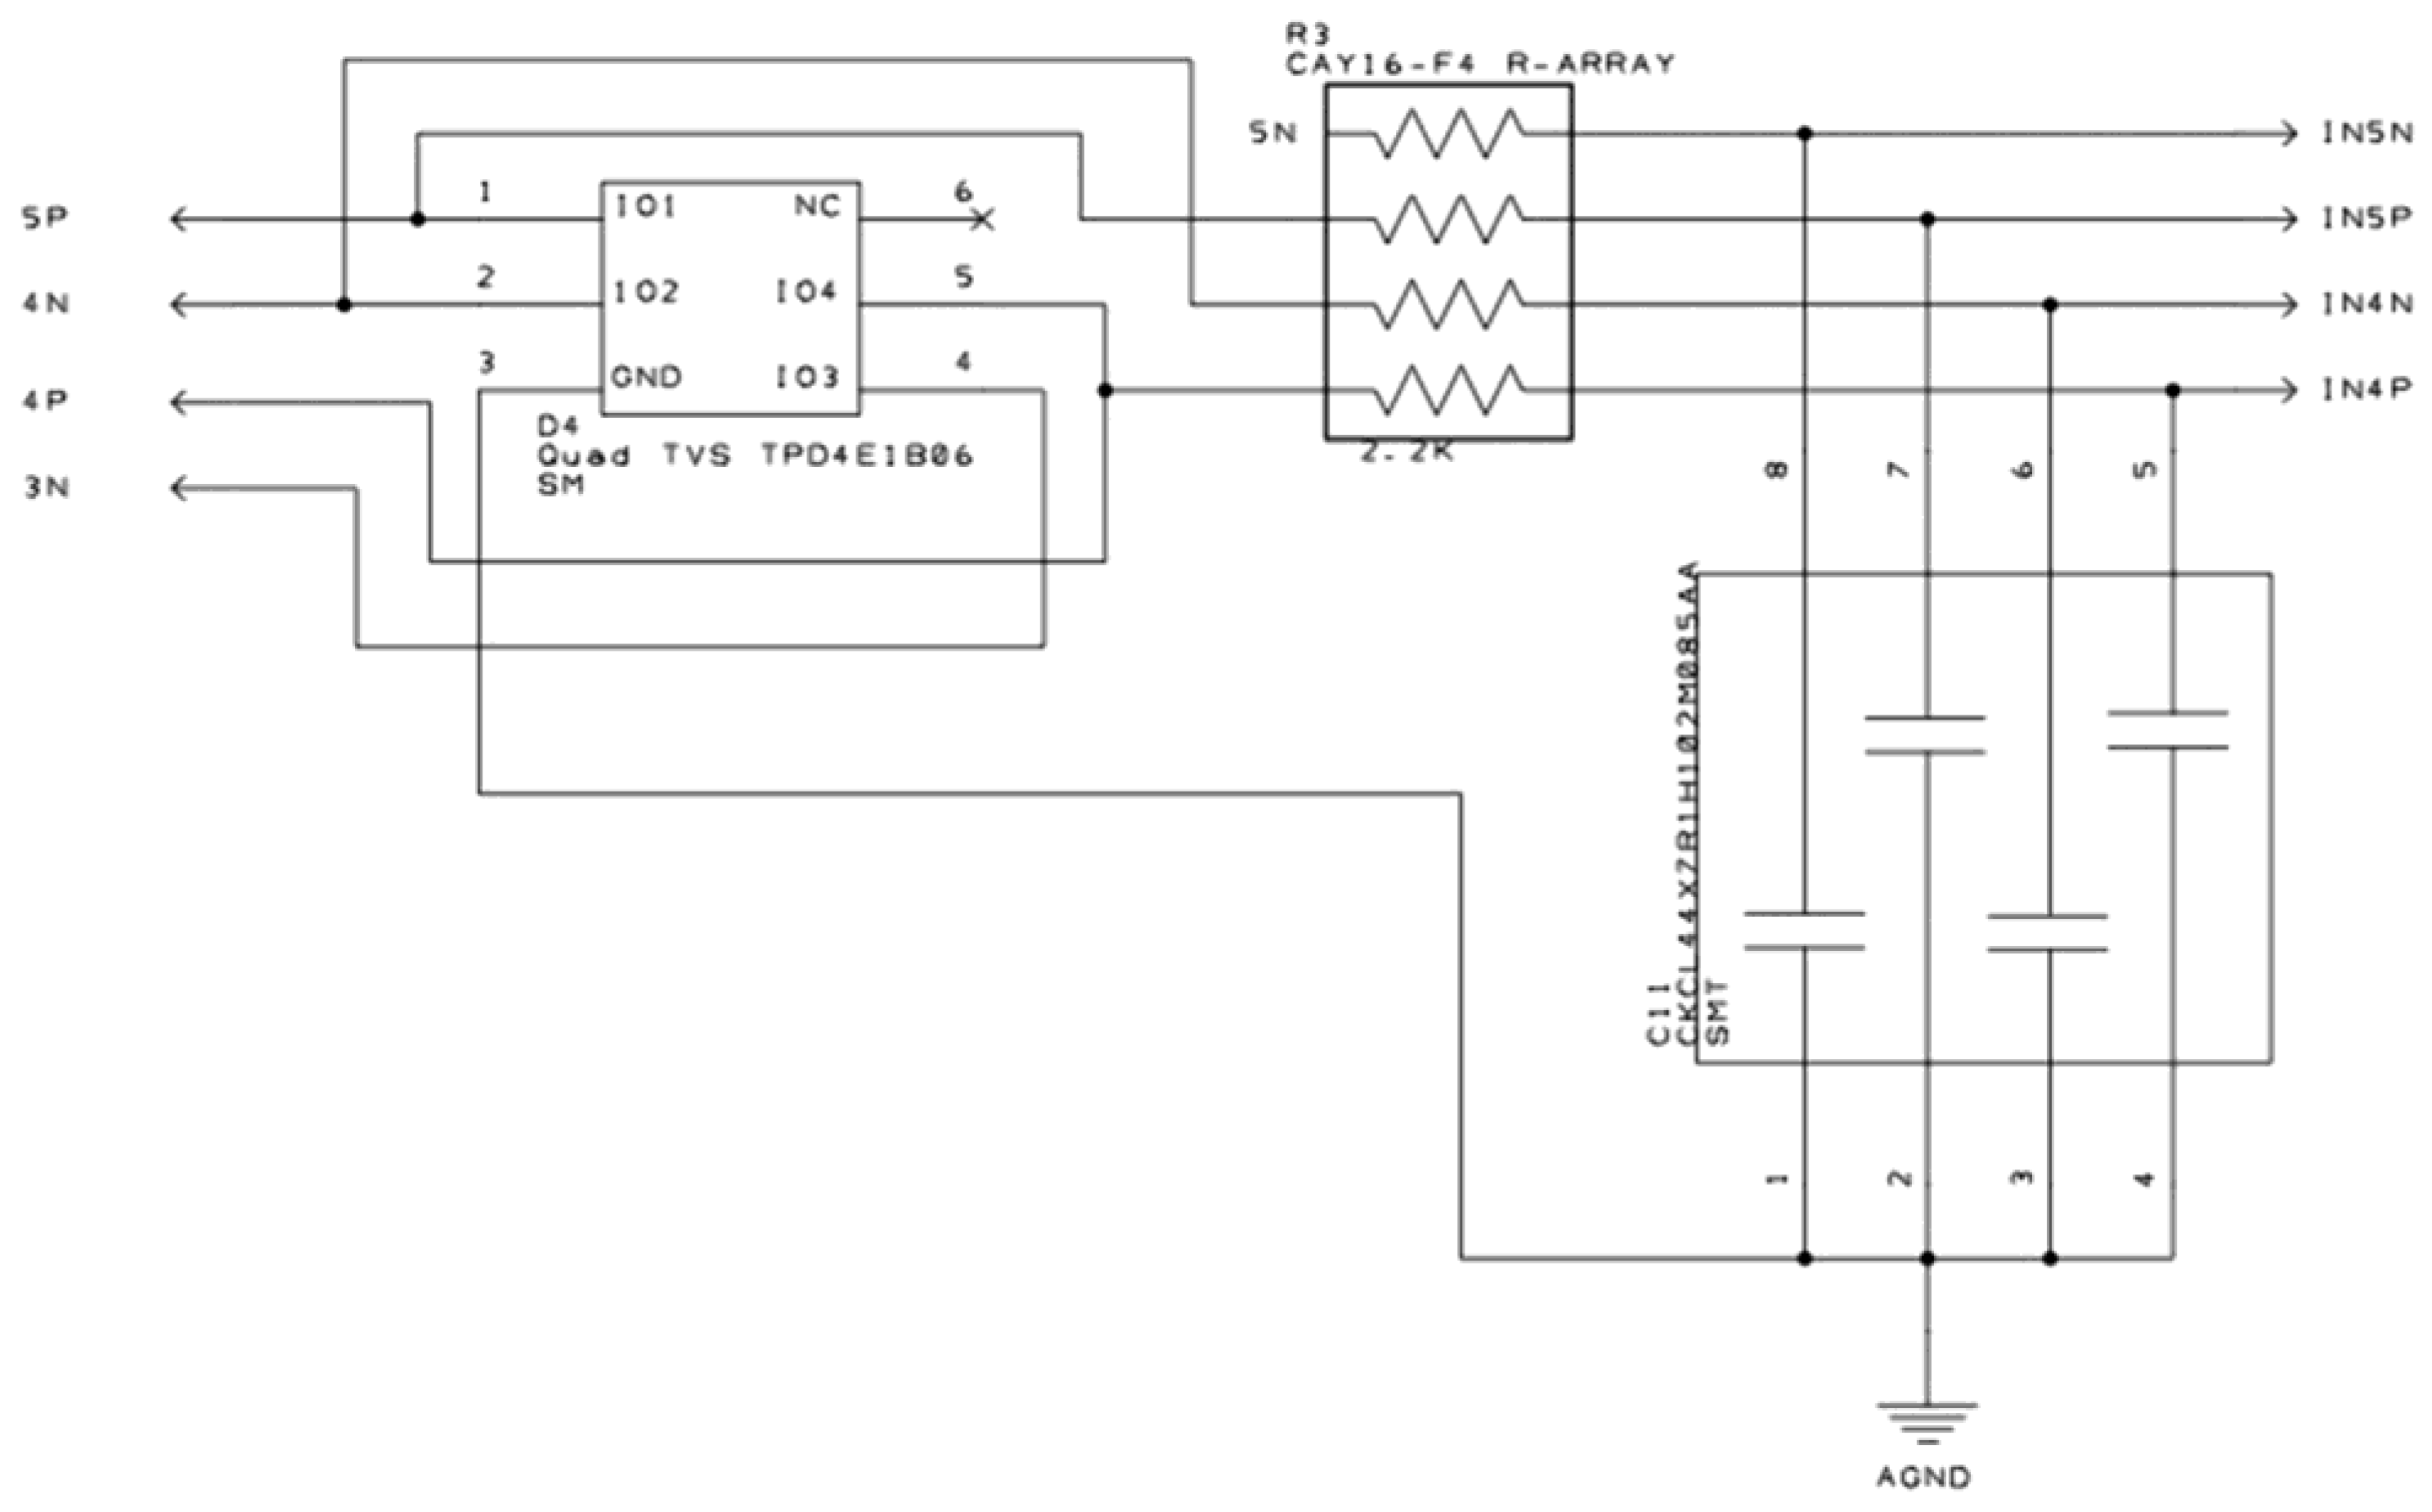
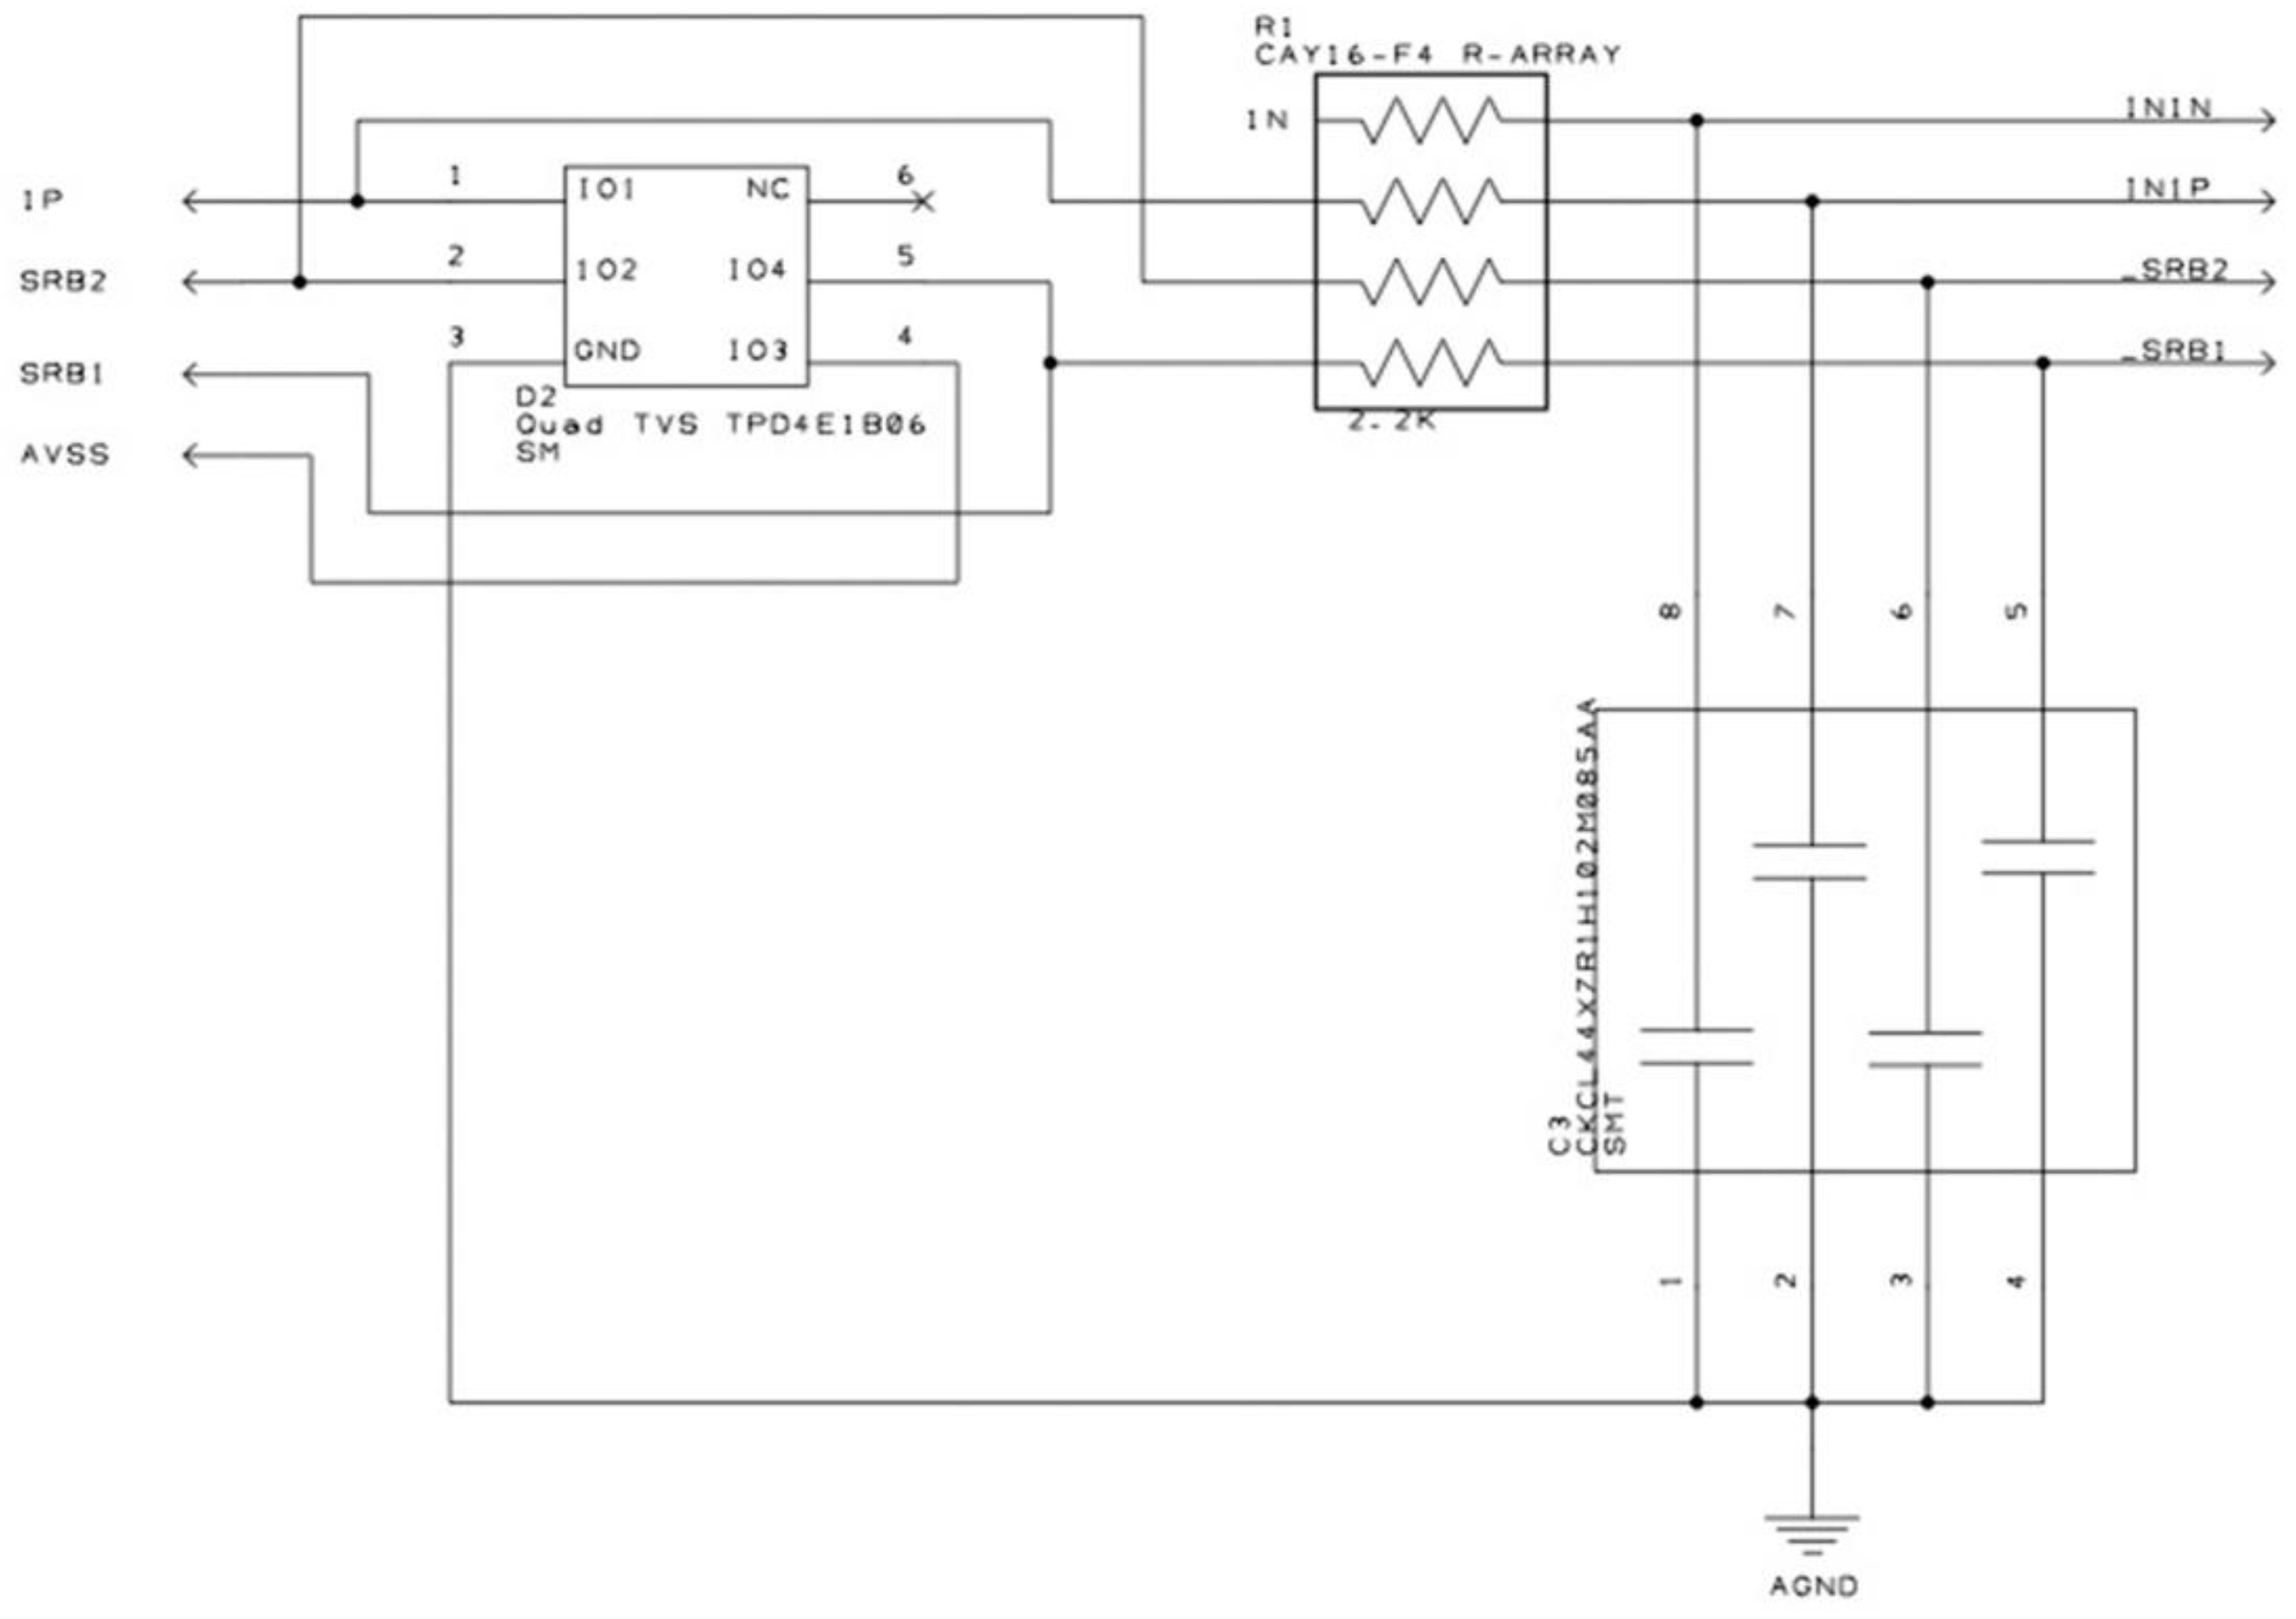
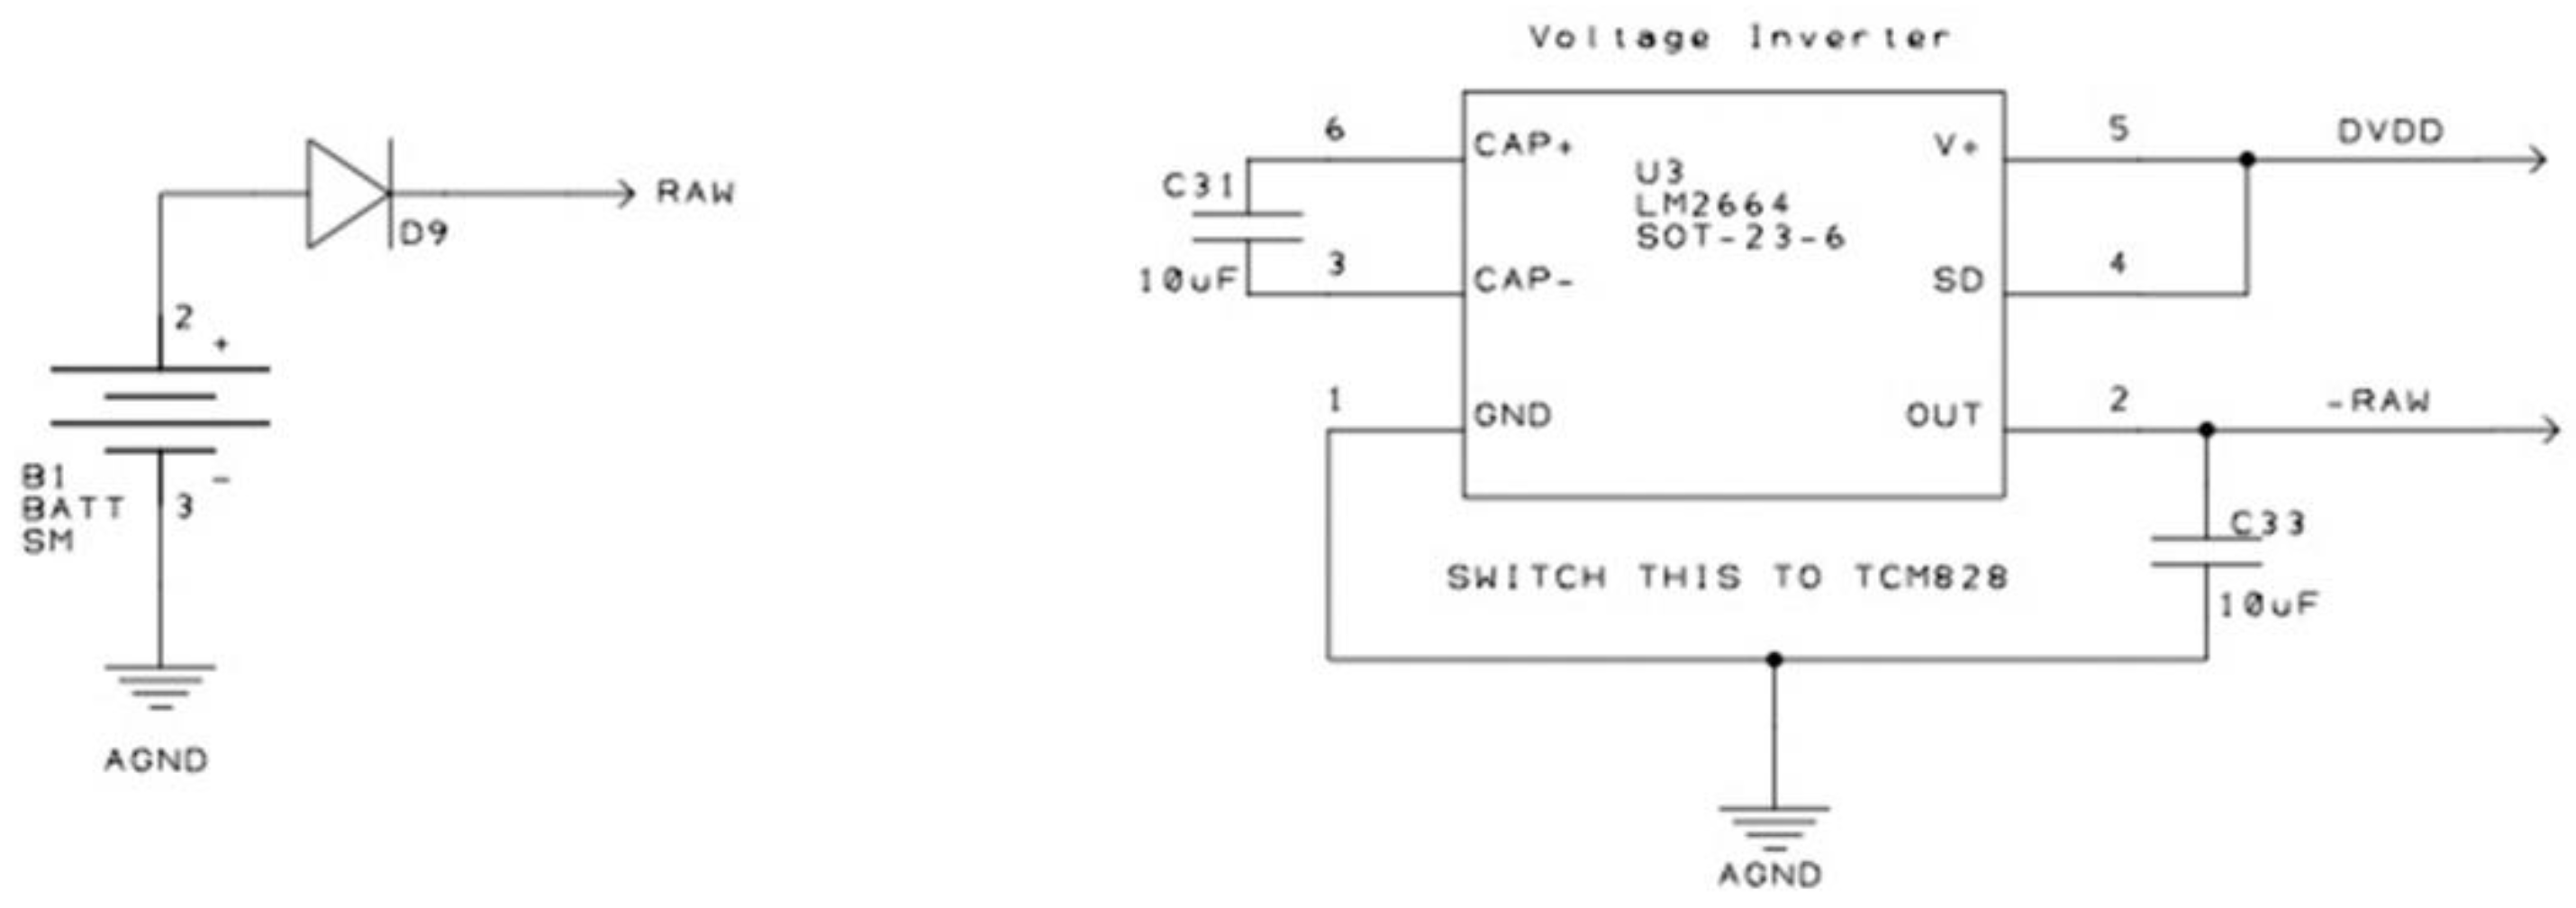
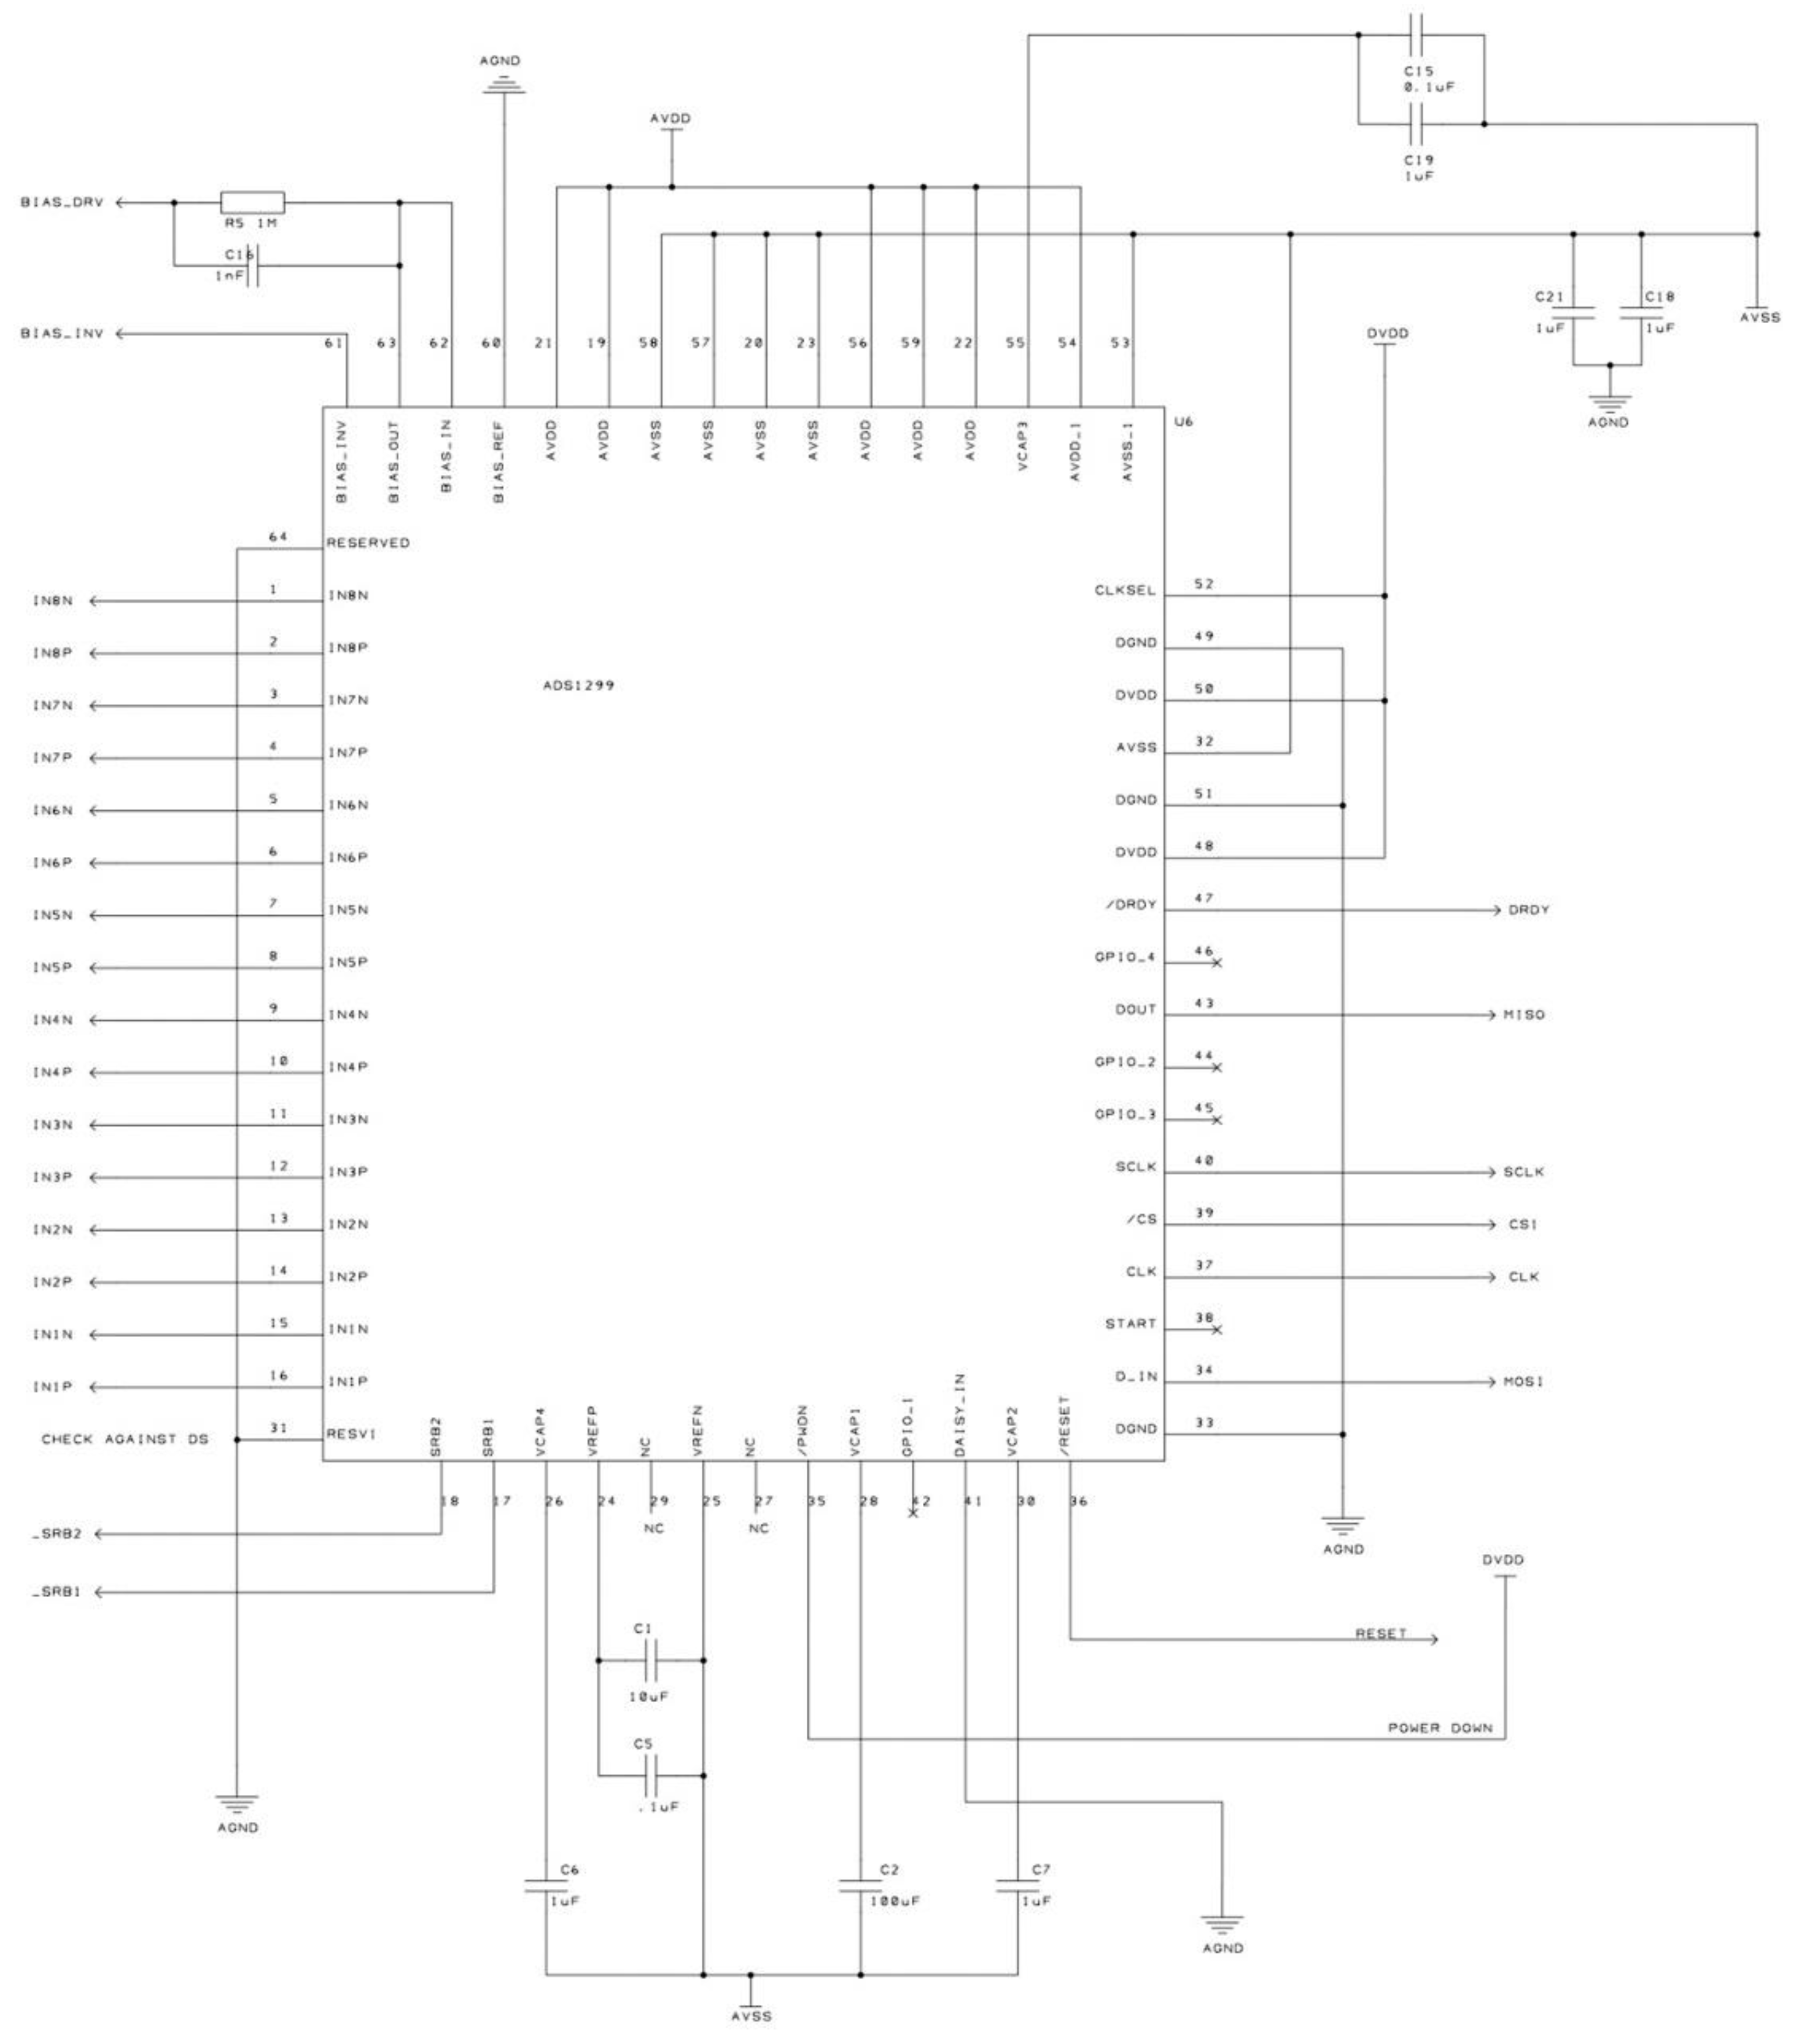
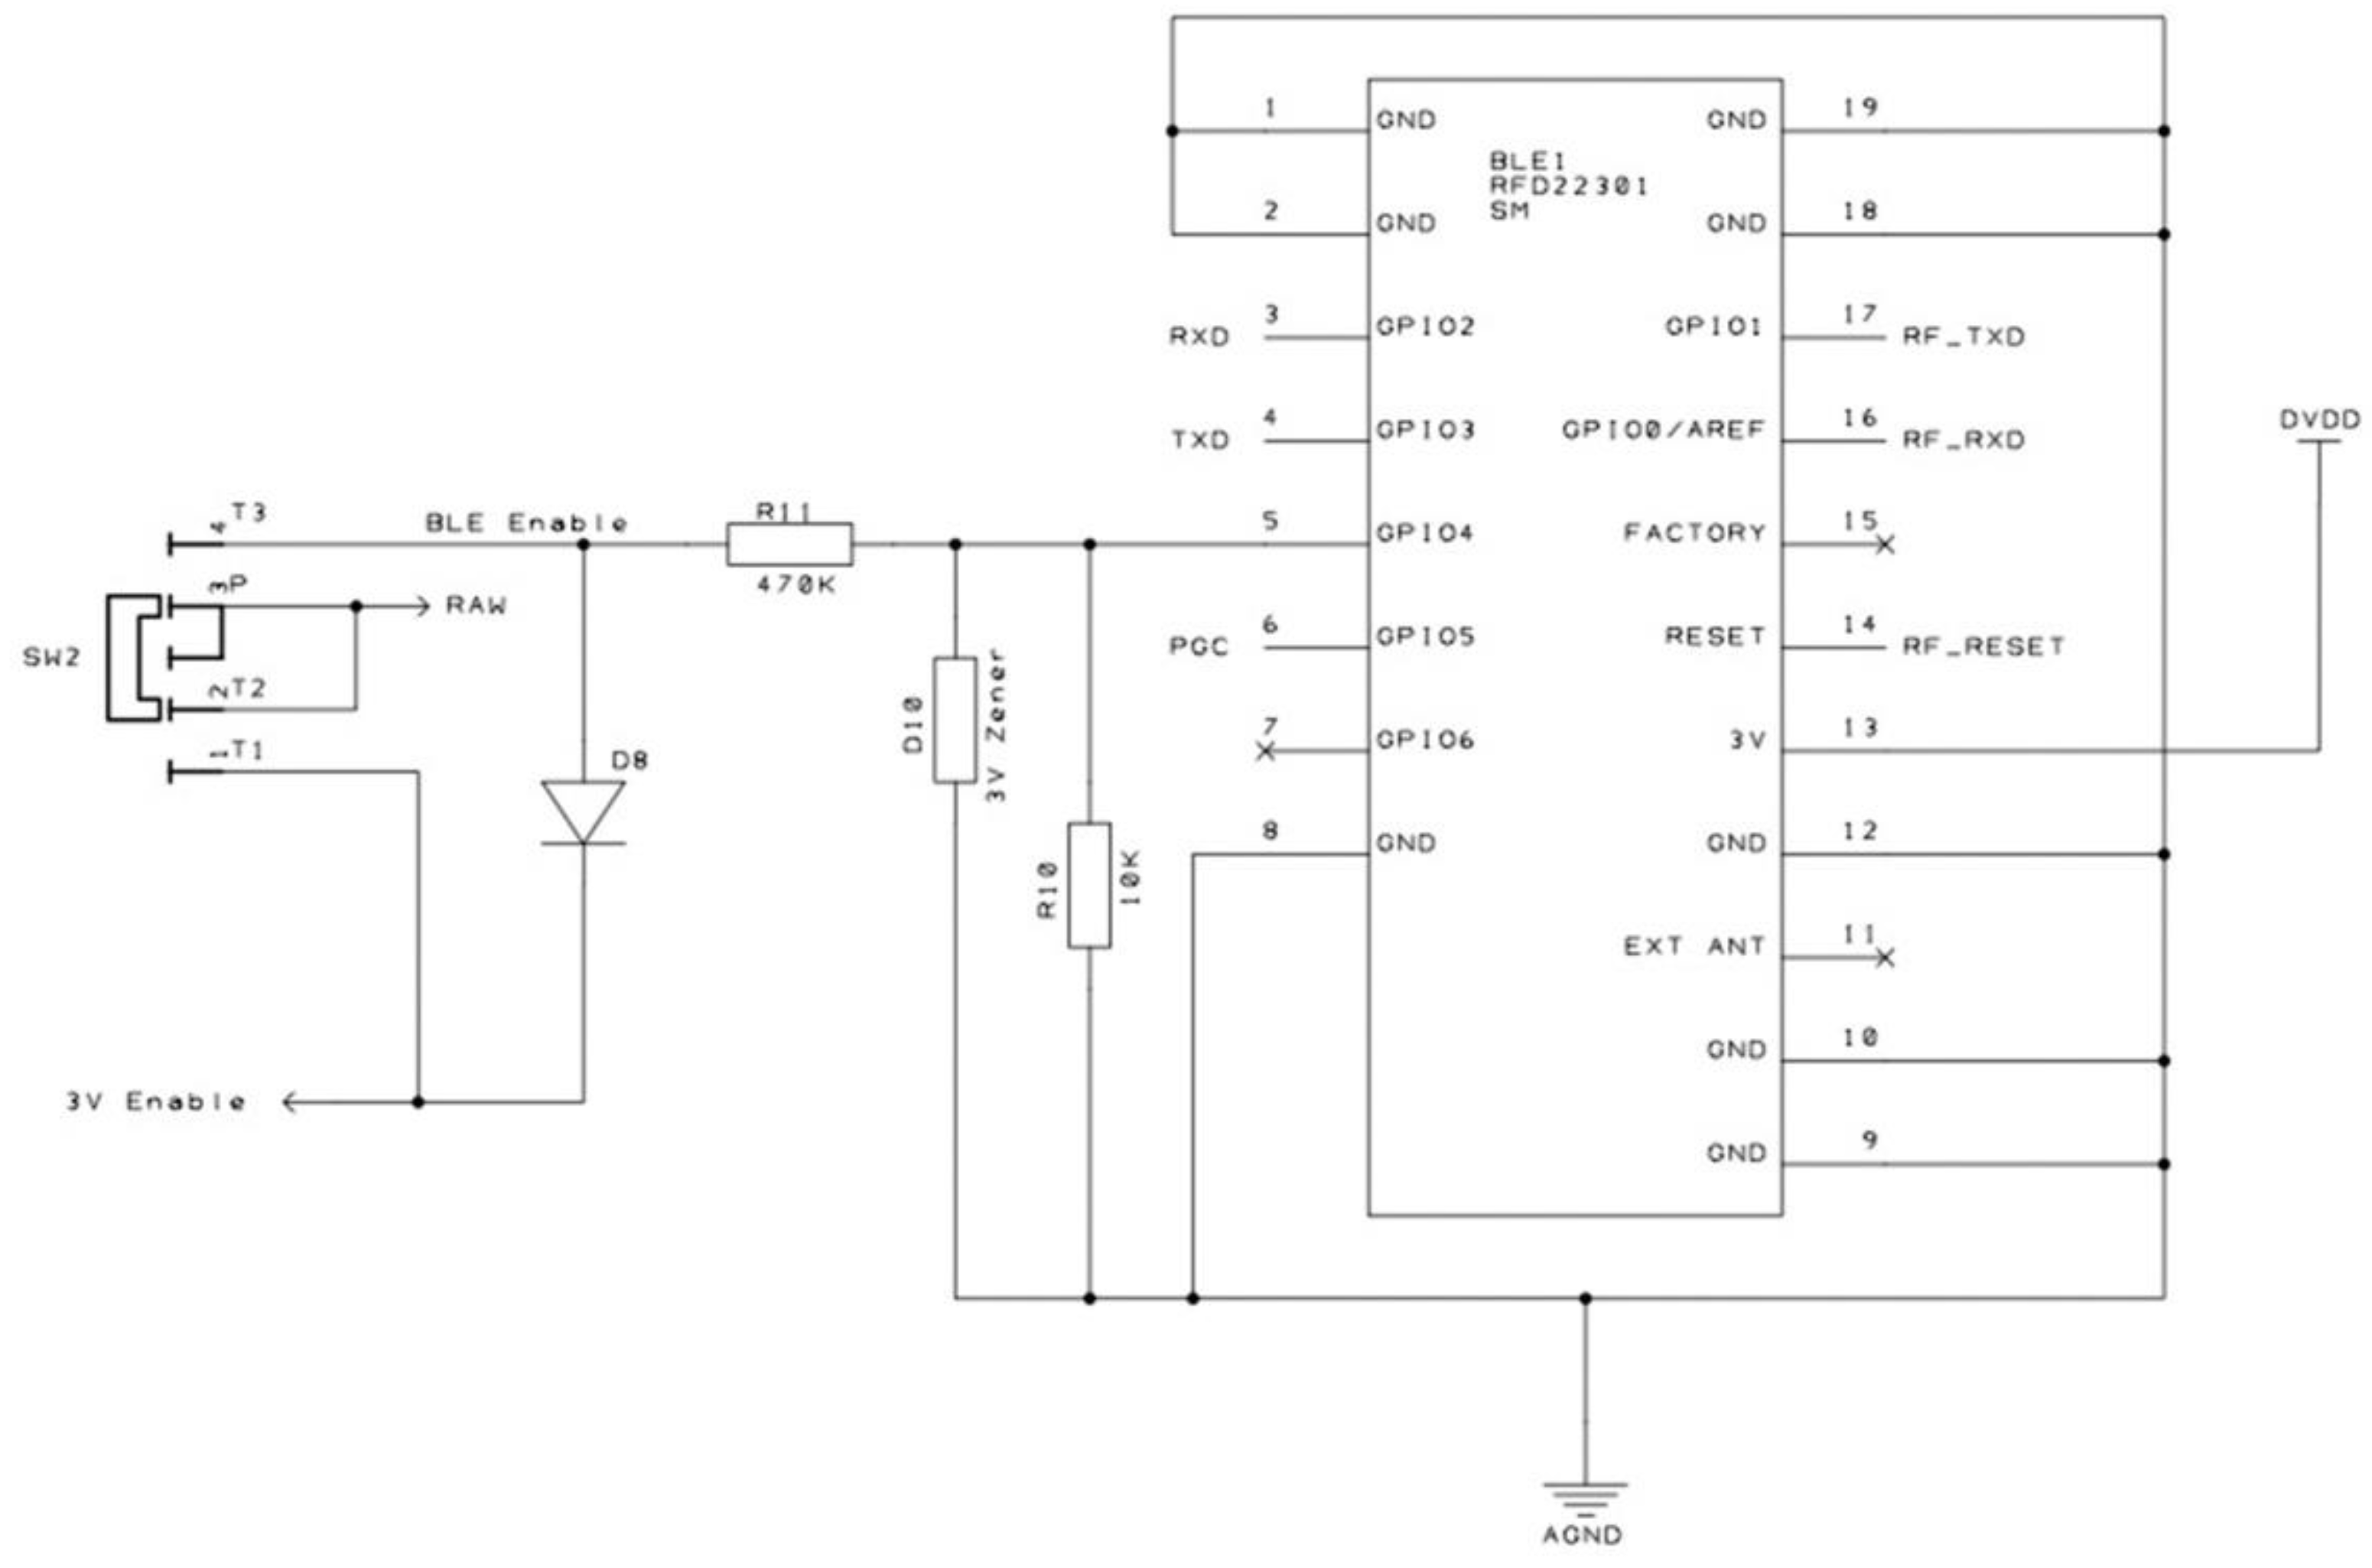
2.1. EEG Sensor System
|
... %data input filename = strcat(path, slash, file); fileID = fopen(filename); data=textscan(fileID,’%f%f%f%f%f%f%f%f%f%f%f%f%f% f%f%f%f%f%f%f%f%f%f%f%q’, ‘Delimiter’, ‘,’,’headerlines’, 5); fclose(fileID); sample_index = data{1}; k=1; for i = 2:9 eeg_data(:,k) = data{i}; %electrodes measures [microV] k = k+1; end reference = data{10}; %example parameters fs= 250; %[Hz] - sampling rate Channel = 8; %number of channels n = length(sample_index); time = data{25}; start_time = time(1); epoch_start = datetime(start_time); end_time = time(n); epoch_end = datetime(end_time); elapsed_time = epoch_end - epoch_start; elapsed_time = seconds(elapsed_time); %registration duration [s] t = linspace(0, elapsed_time, n); %bandpass filter Wp = [3 15]/(fs/2); %pass band Ws = [2 20]/(fs/2); %attenuation band Rp = 1; %[db] maximum bandwidth loss value Rs = 60; %[db] attenuation value [N, Wp] = ellipord(Wp,Ws,Rp,Rs); [B, A] = ellip(N,Rp,Rs,Wp); X = filtfilt(B,A,double(eeg_data)); %calculation of values at rest and during fright std_val = mean(m(fs*4:fs*10)); %resting average [V] between 4–10 s [fright_val, i]= max(m(fs*10:length(m))); %maximum after 10 s fright_time = i/fs + 10; threshold = 100; %fright threshold example if fright_val - std_val > threshold disp(‘frightened’) else disp(‘unfrightened’) end |
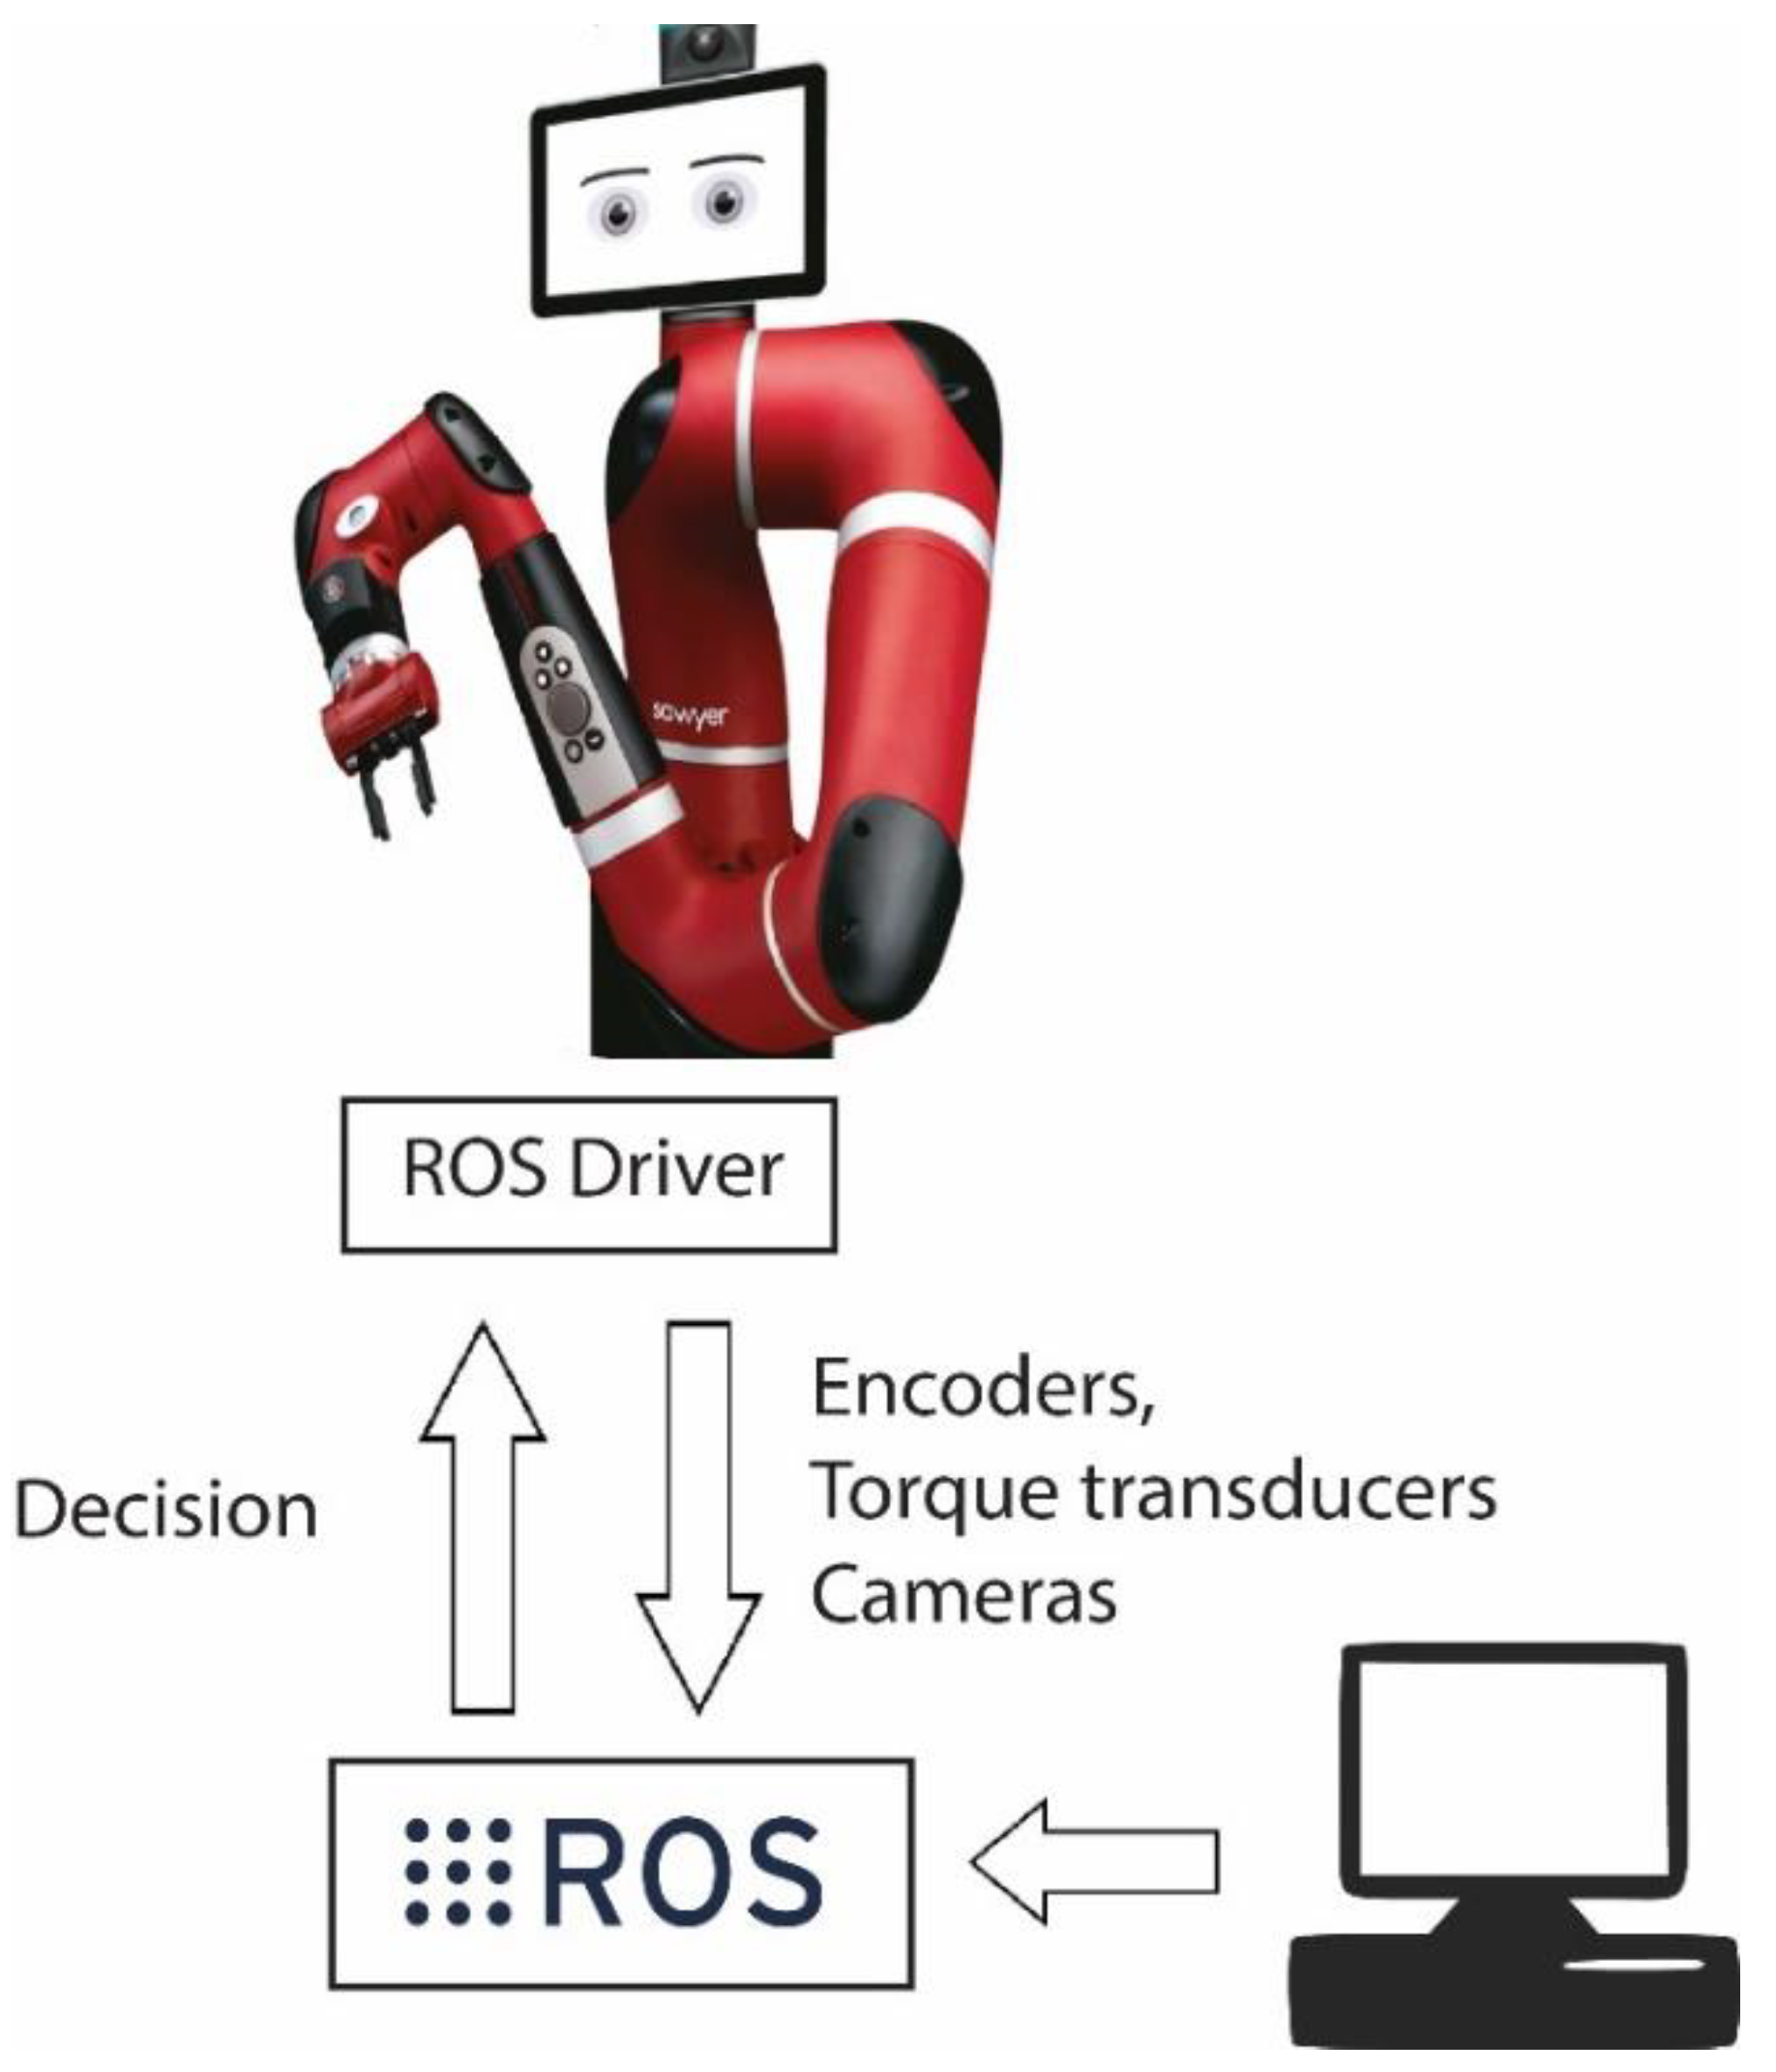
2.2. Cobot
2.3. Identification of the Decision Threshold
2.3.1. Participants
- -
- No cardiovascular disease, which could pose a risk factor during the experiment;
- -
- The absence of neurological disorders that could change the intensity, shape, and latency time of the response signal;
- -
- Absence of abnormal eating habits, excessive sports activity, not having over-hydrated or exercised shortly before the experiment; particularly to limit changes in skin hydration;
- -
- No creams or other cosmetic or medicinal products applied to the skin in the area where the electrodes will be applied, as well as no long hair, to limit changes in the contact impedance between the skin and the electrodes;
- -
- No substance abuse that alters the psychophysical state or general hydration level (alcohol, drugs, systemic medications).
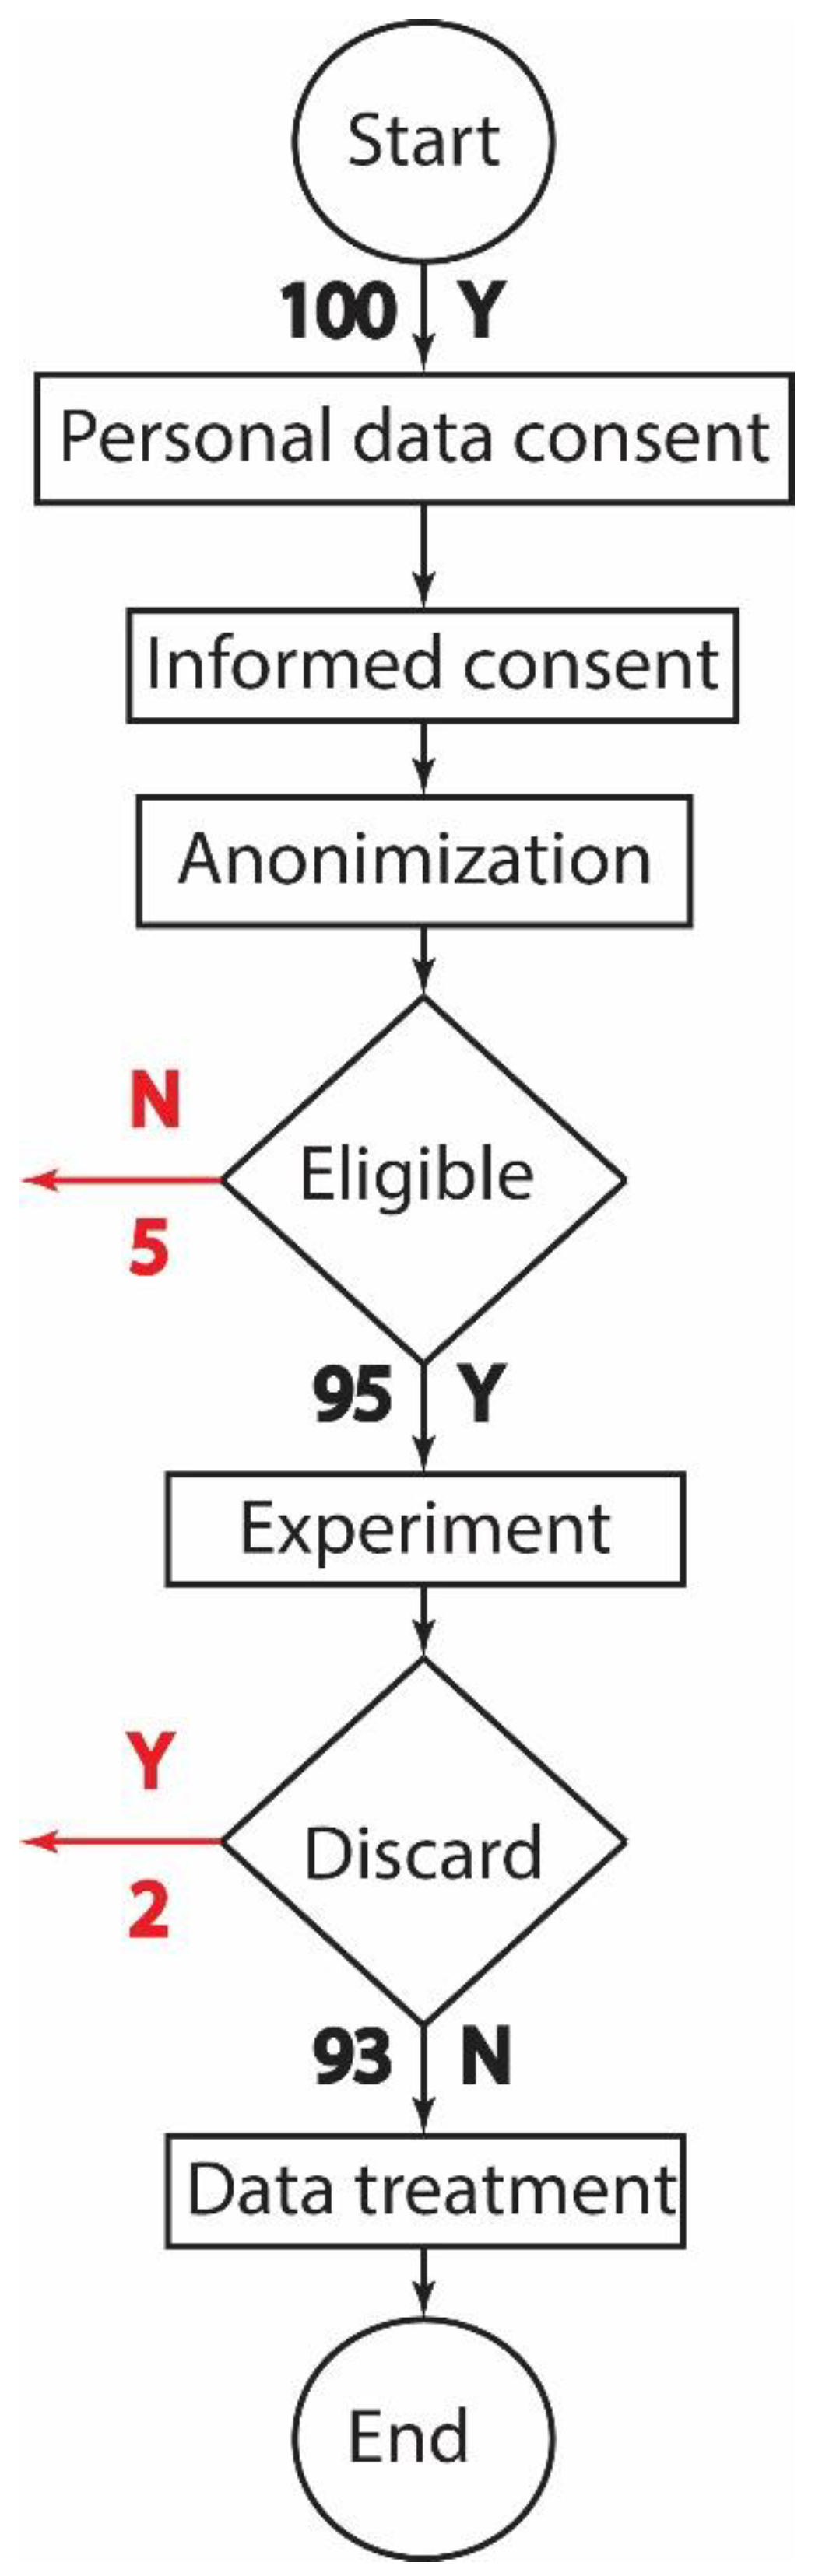
2.3.2. Experimental Protocol
- The Velcro strip was put on the person, and a mark was made on the Velcro strip to show the standard place to put the spikey electrodes;
- The band was removed from the subject, and then all the spikey electrodes were mounted in the correct position indicated in the previous step;
- The first lobe clip electrode was connected to the correct pin on the board (BIAS);
- The second lobe clip electrode was connected into the correct pin of the board (SRB);
- The three flat electrodes were connected to the three respective pins of the board (N1P, N2P, and N3P).
- The five spikey electrodes were connected into the five respective pins of the board (N4P, N5P, N6P, N7P and N8P);
- The Velcro band with the eight electrodes (three flat and five spikey) was placed on the subject;
- Finally, it was verified that the position of the electrodes was correct after the assembly had taken place.
2.4. Randomized-Controlled Trial (RCT) of Emphatic Collaboration
2.4.1. Participants
2.4.2. Experimental Protocol
3. Results
3.1. Results—Identification of the Decision Threshold
3.2. Results—Randomized-Controlled Trial (RCT) of Emphatic Collaboration
4. Discussion
5. Limitations and Future Developments
5.1. General Considerations
- Fear in humans is an emotion capable of more intensely activating brain activity. This ‘cerebral hyperactivity’ enables fear to be distinguished from other emotions;
- Precisely because it is recognizable-distinguishable, fear is precisely detectable by the EEG;
- If the human feels fear, then there is a real danger that requires the cobot to stop.
5.2. If the Human Feels Fear, It Is Because There Is Some Situation of Real Danger
5.3. How to Solve the Problems?
6. Conclusions
Author Contributions
Funding
Institutional Review Board Statement
Informed Consent Statement
Data Availability Statement
Acknowledgments
Conflicts of Interest
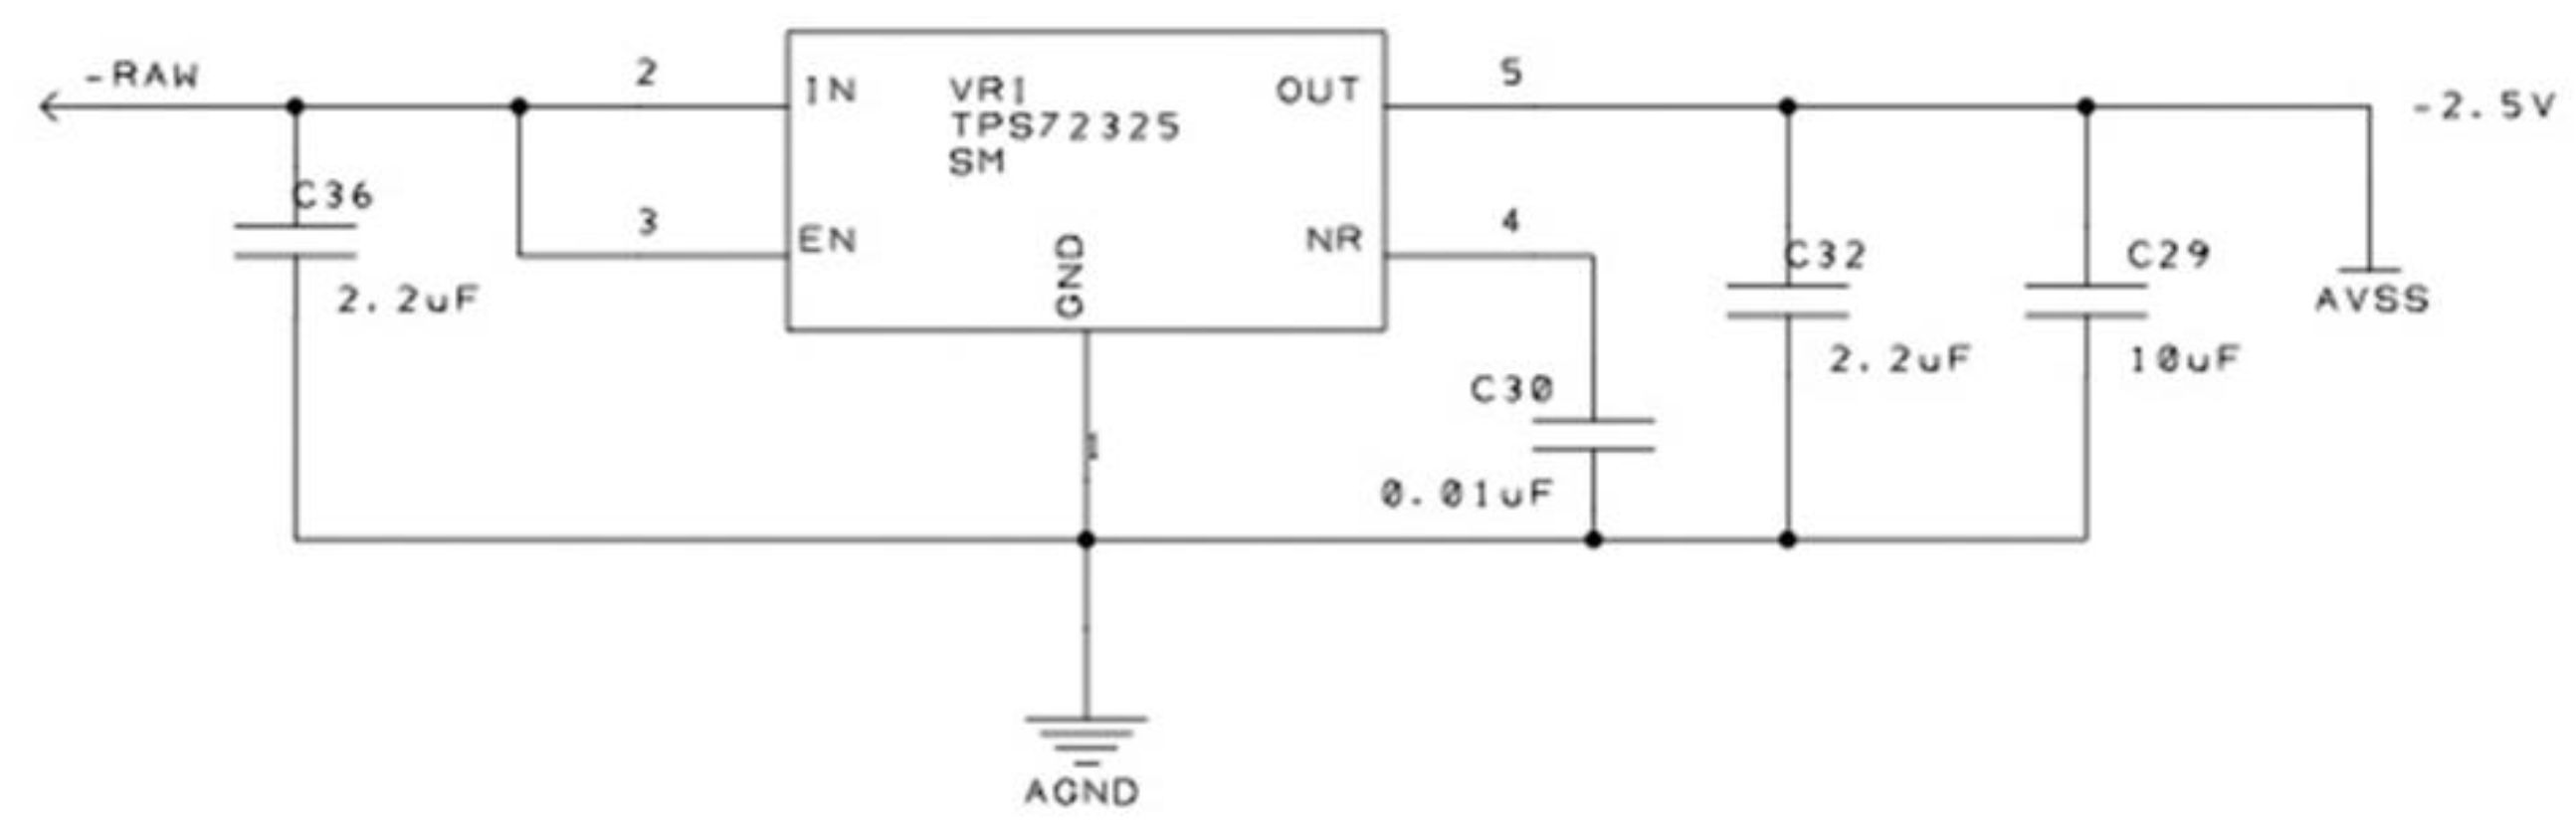
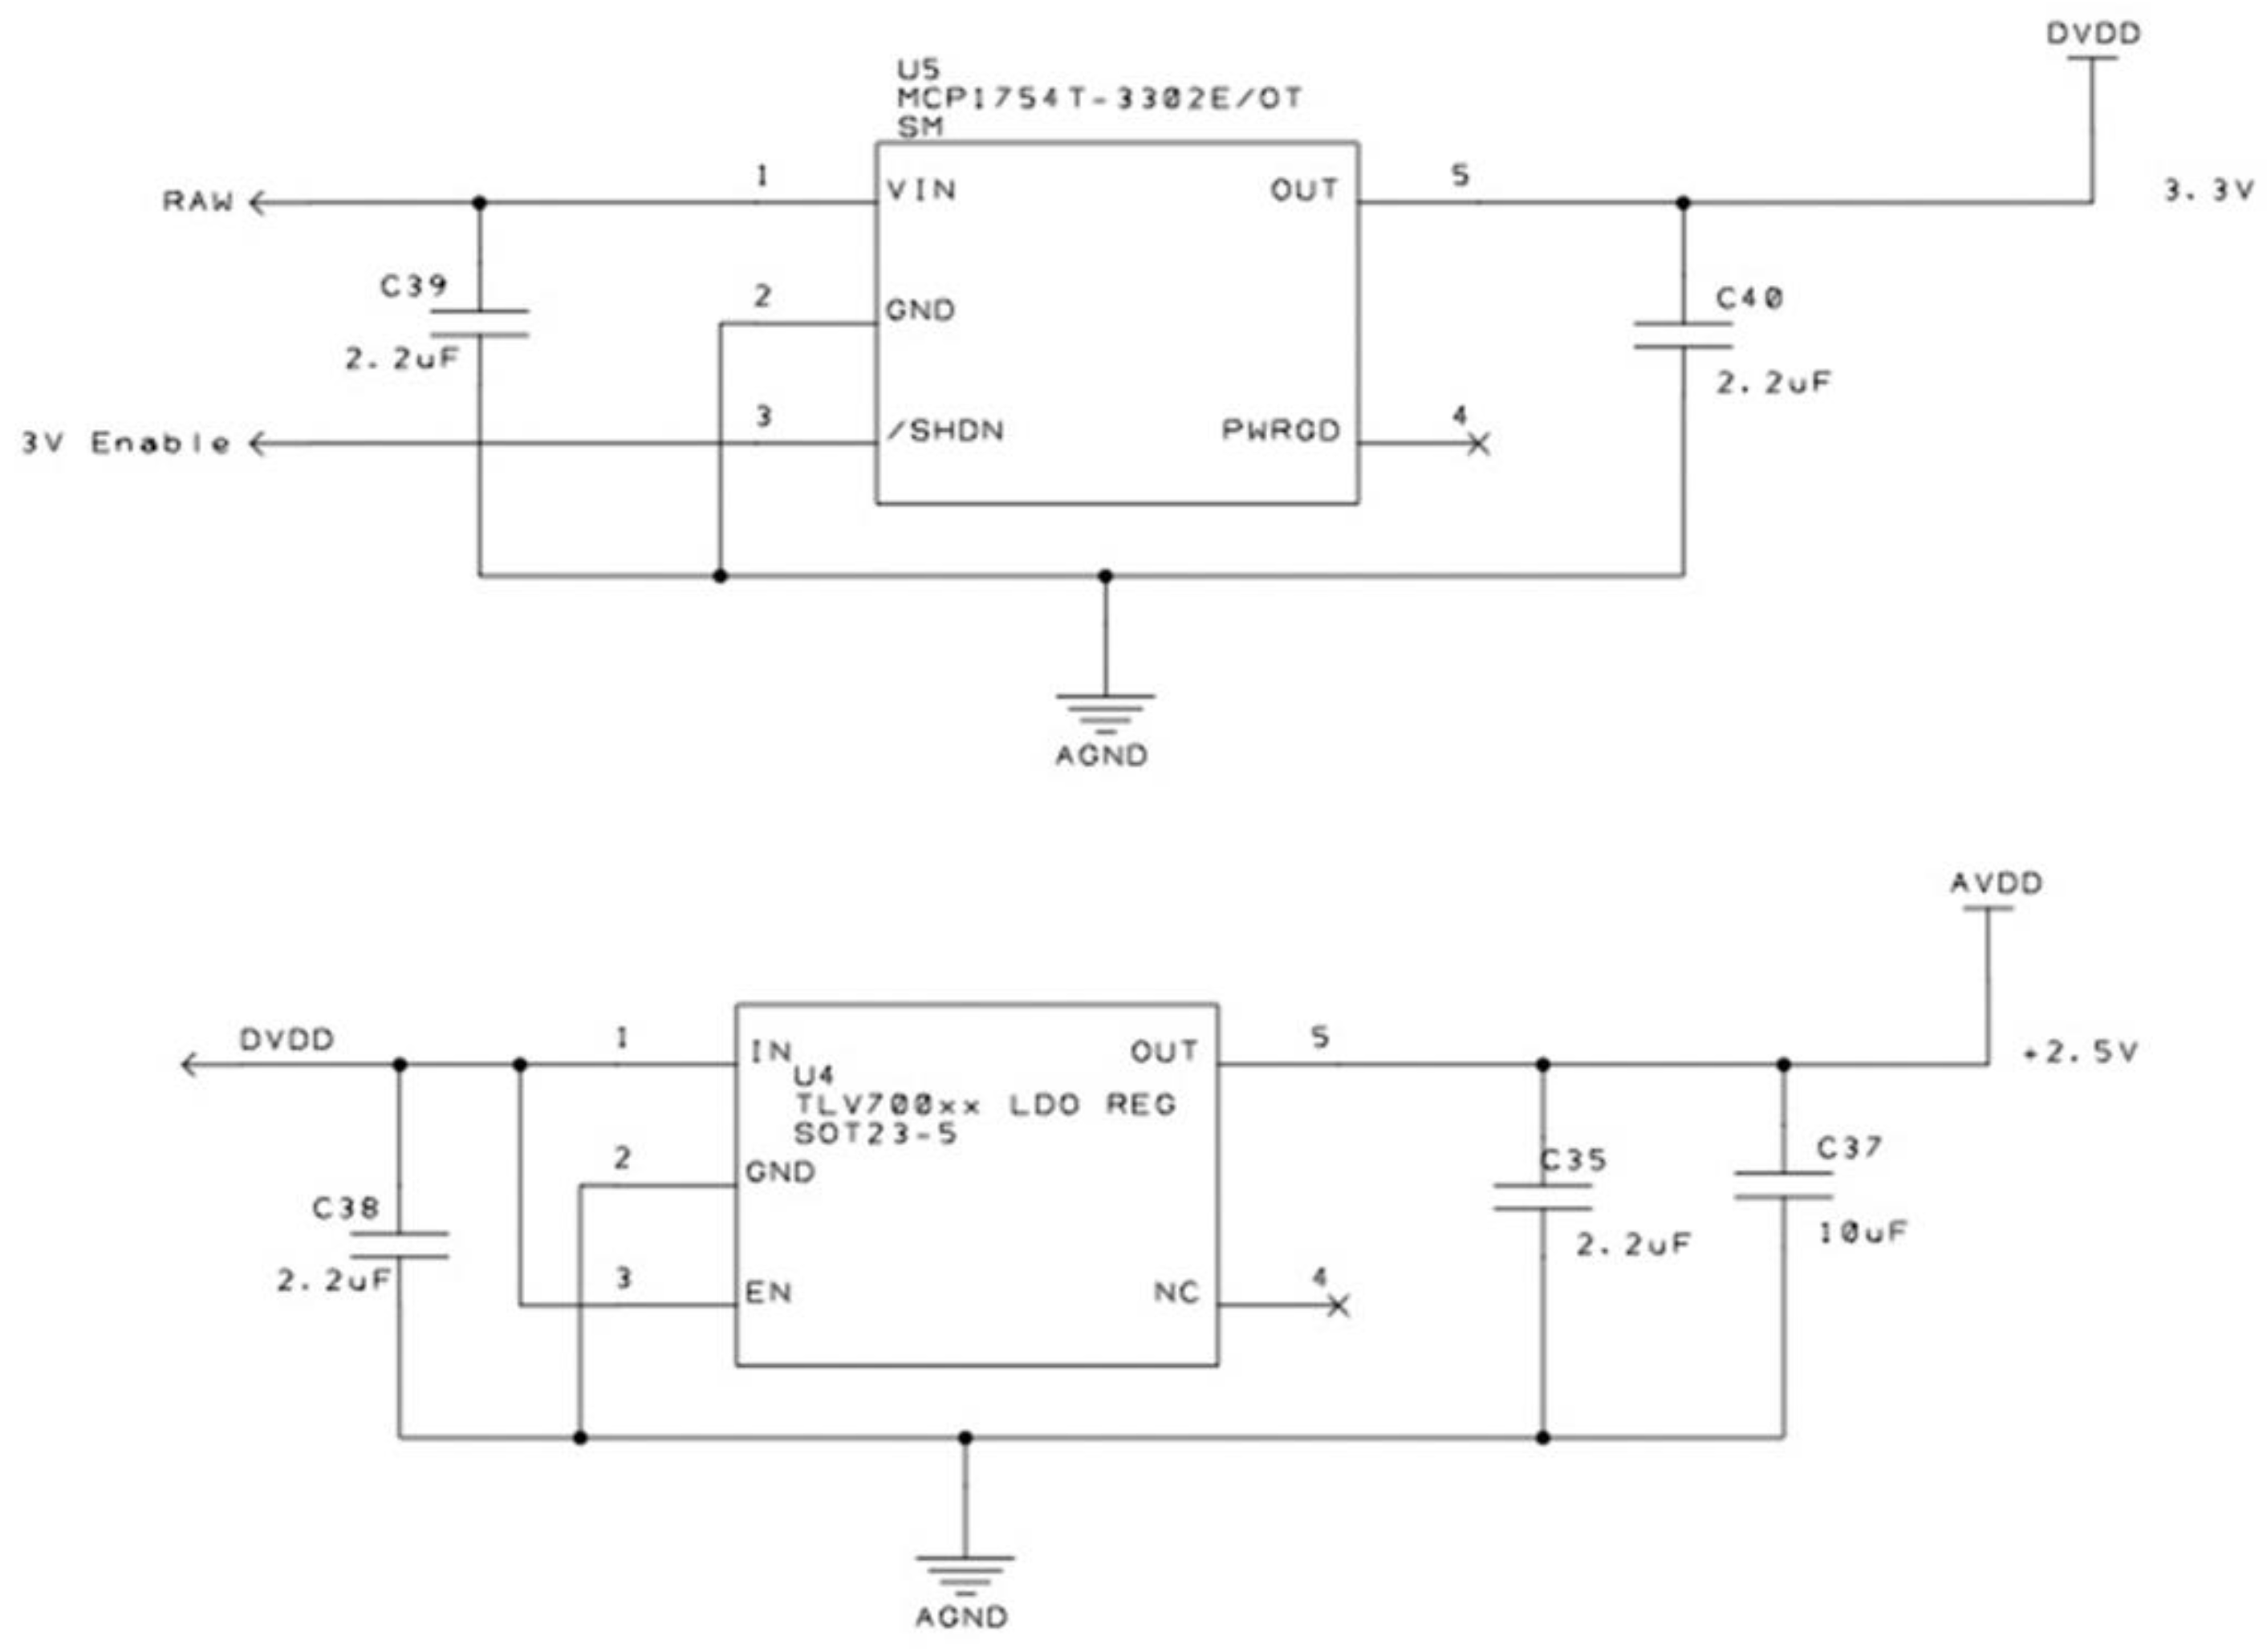
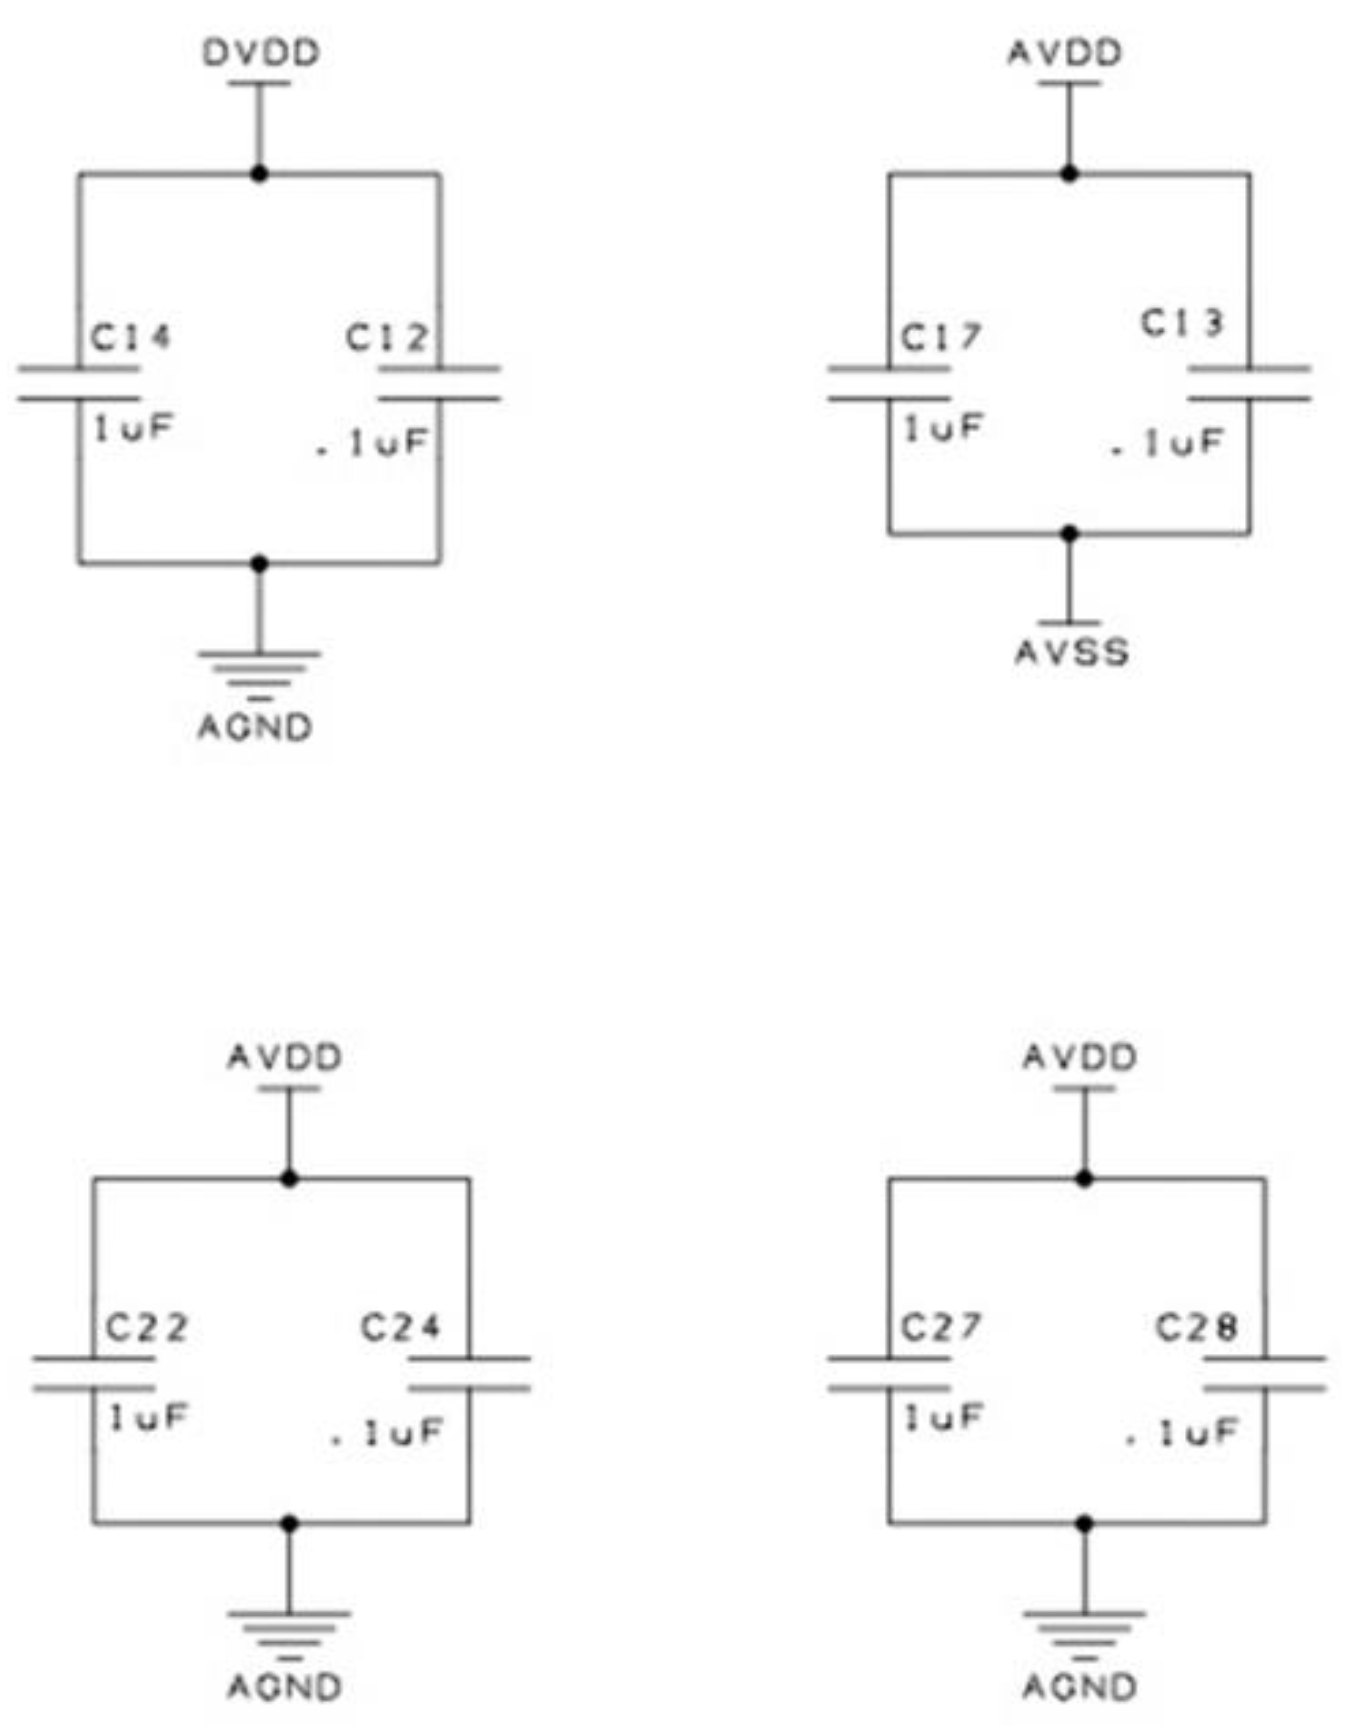
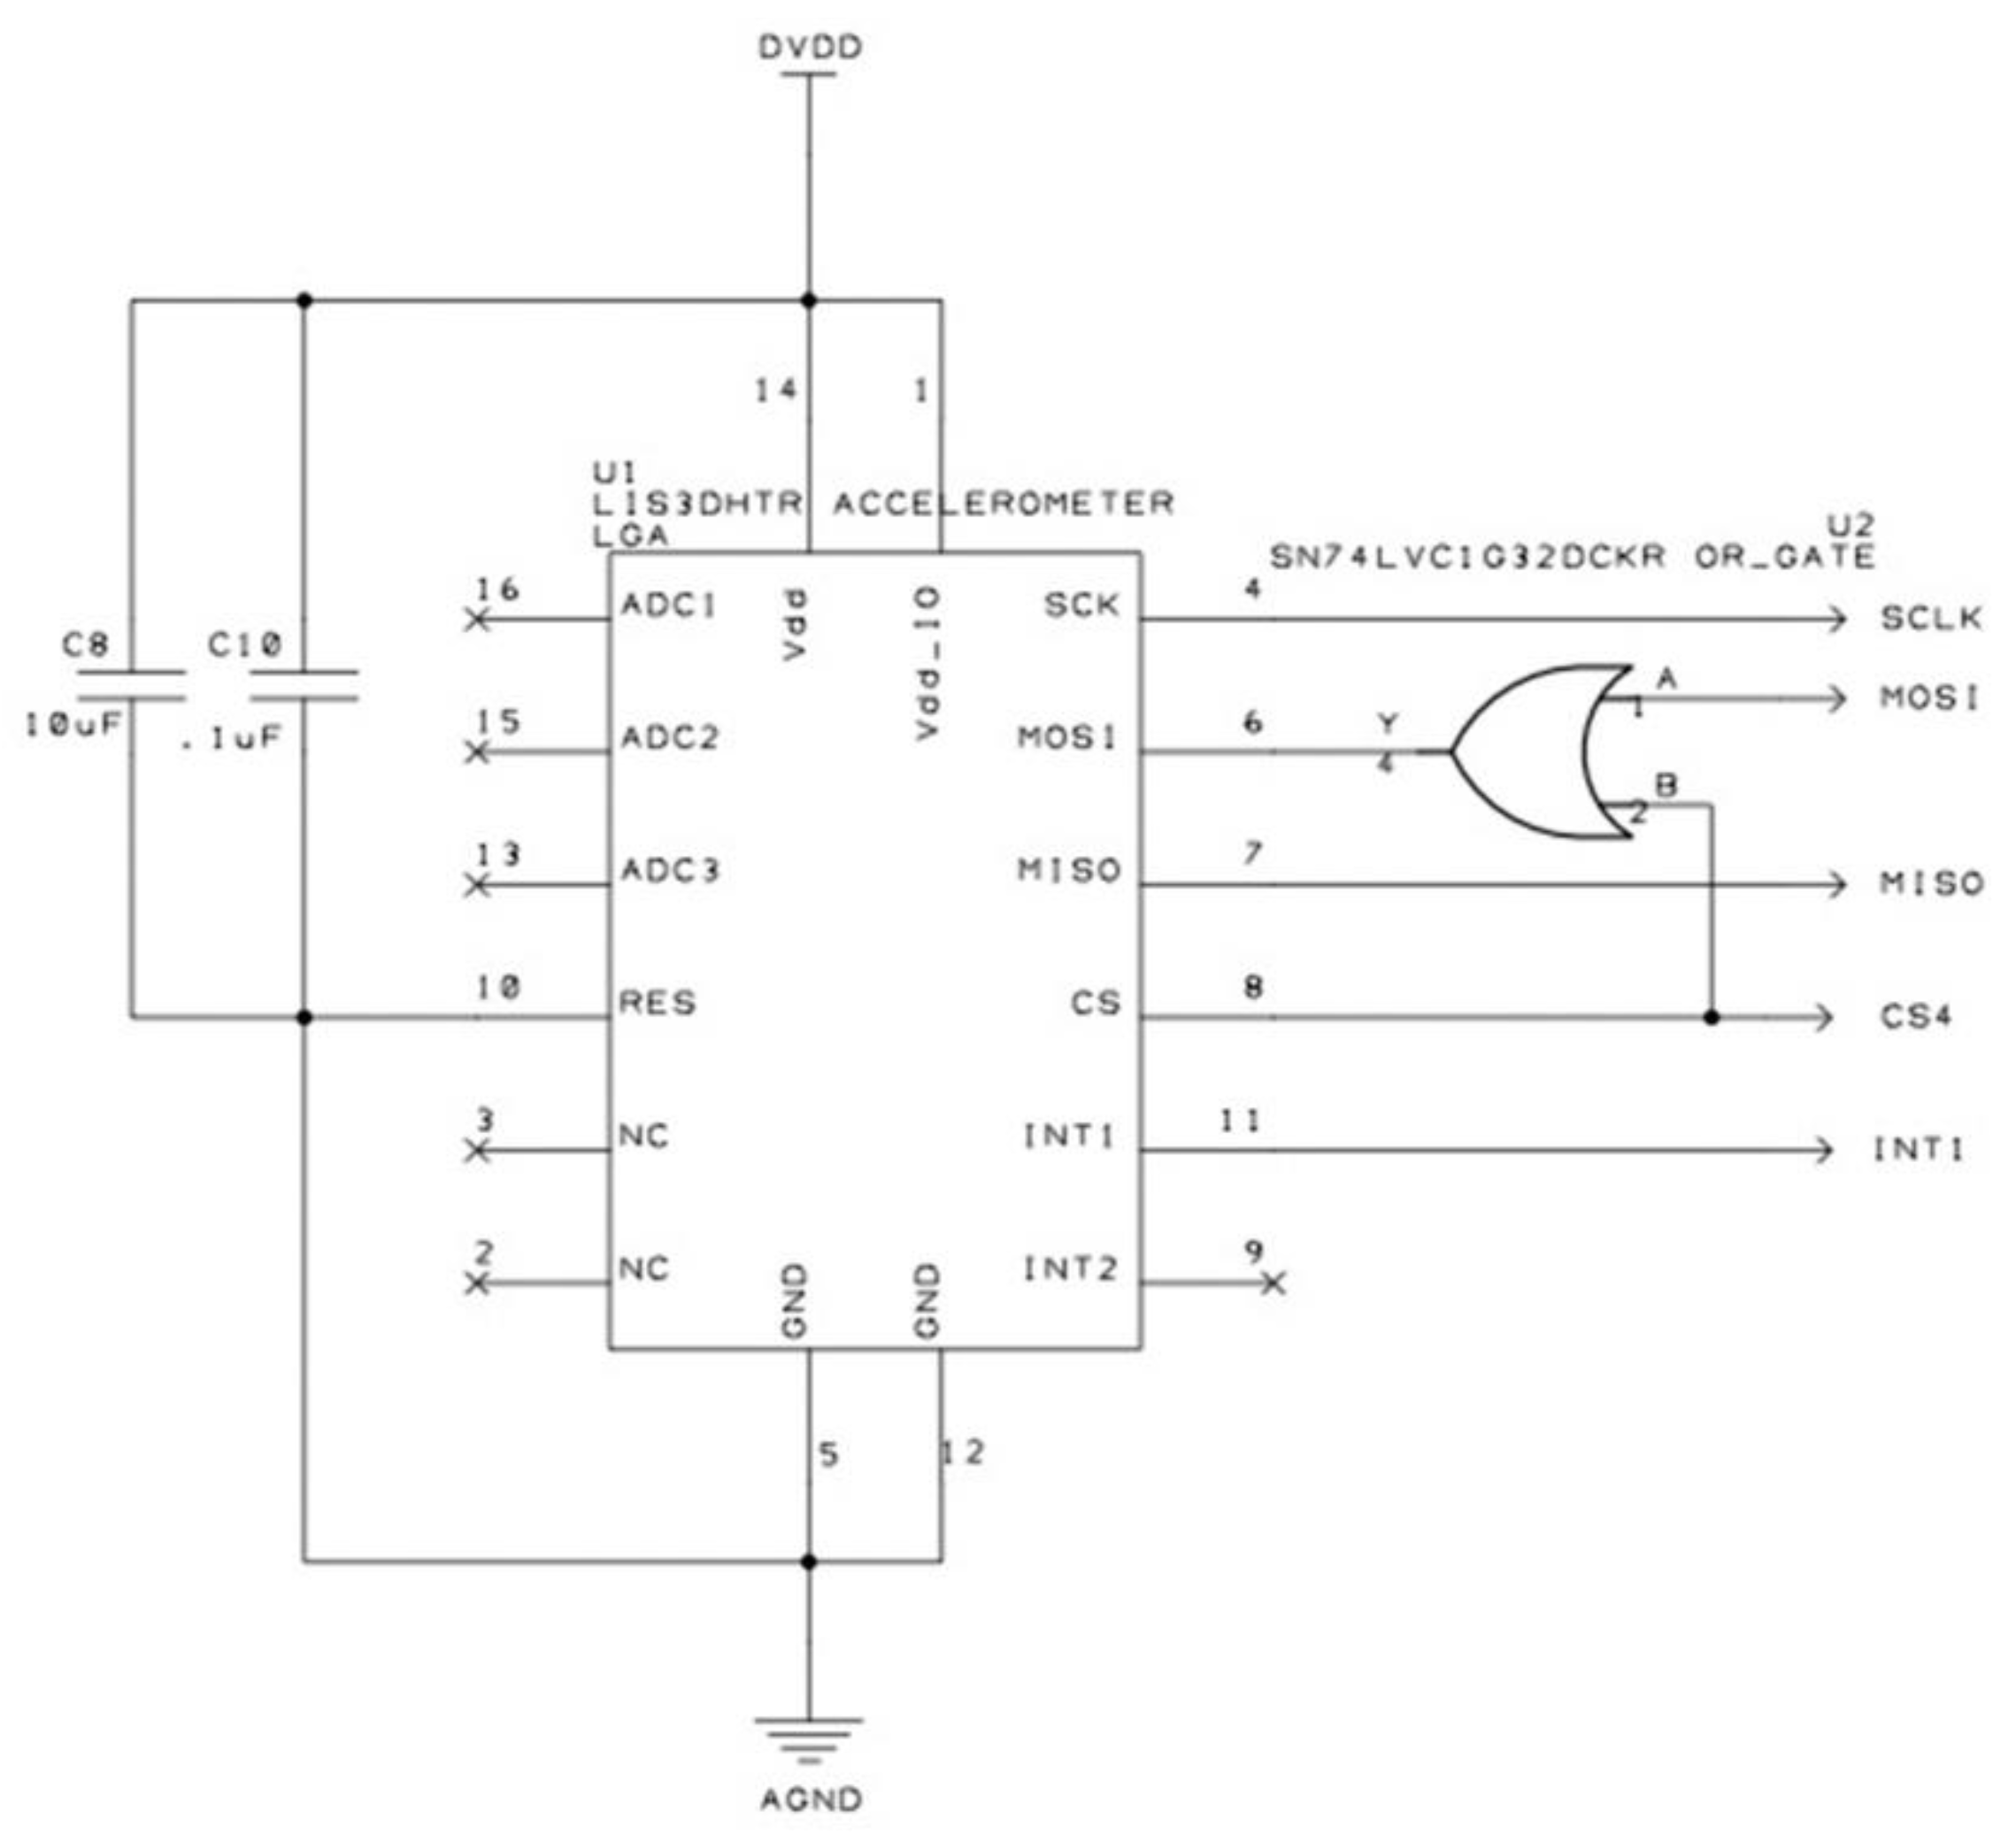
Appendix A. Description of The Acquisition Board


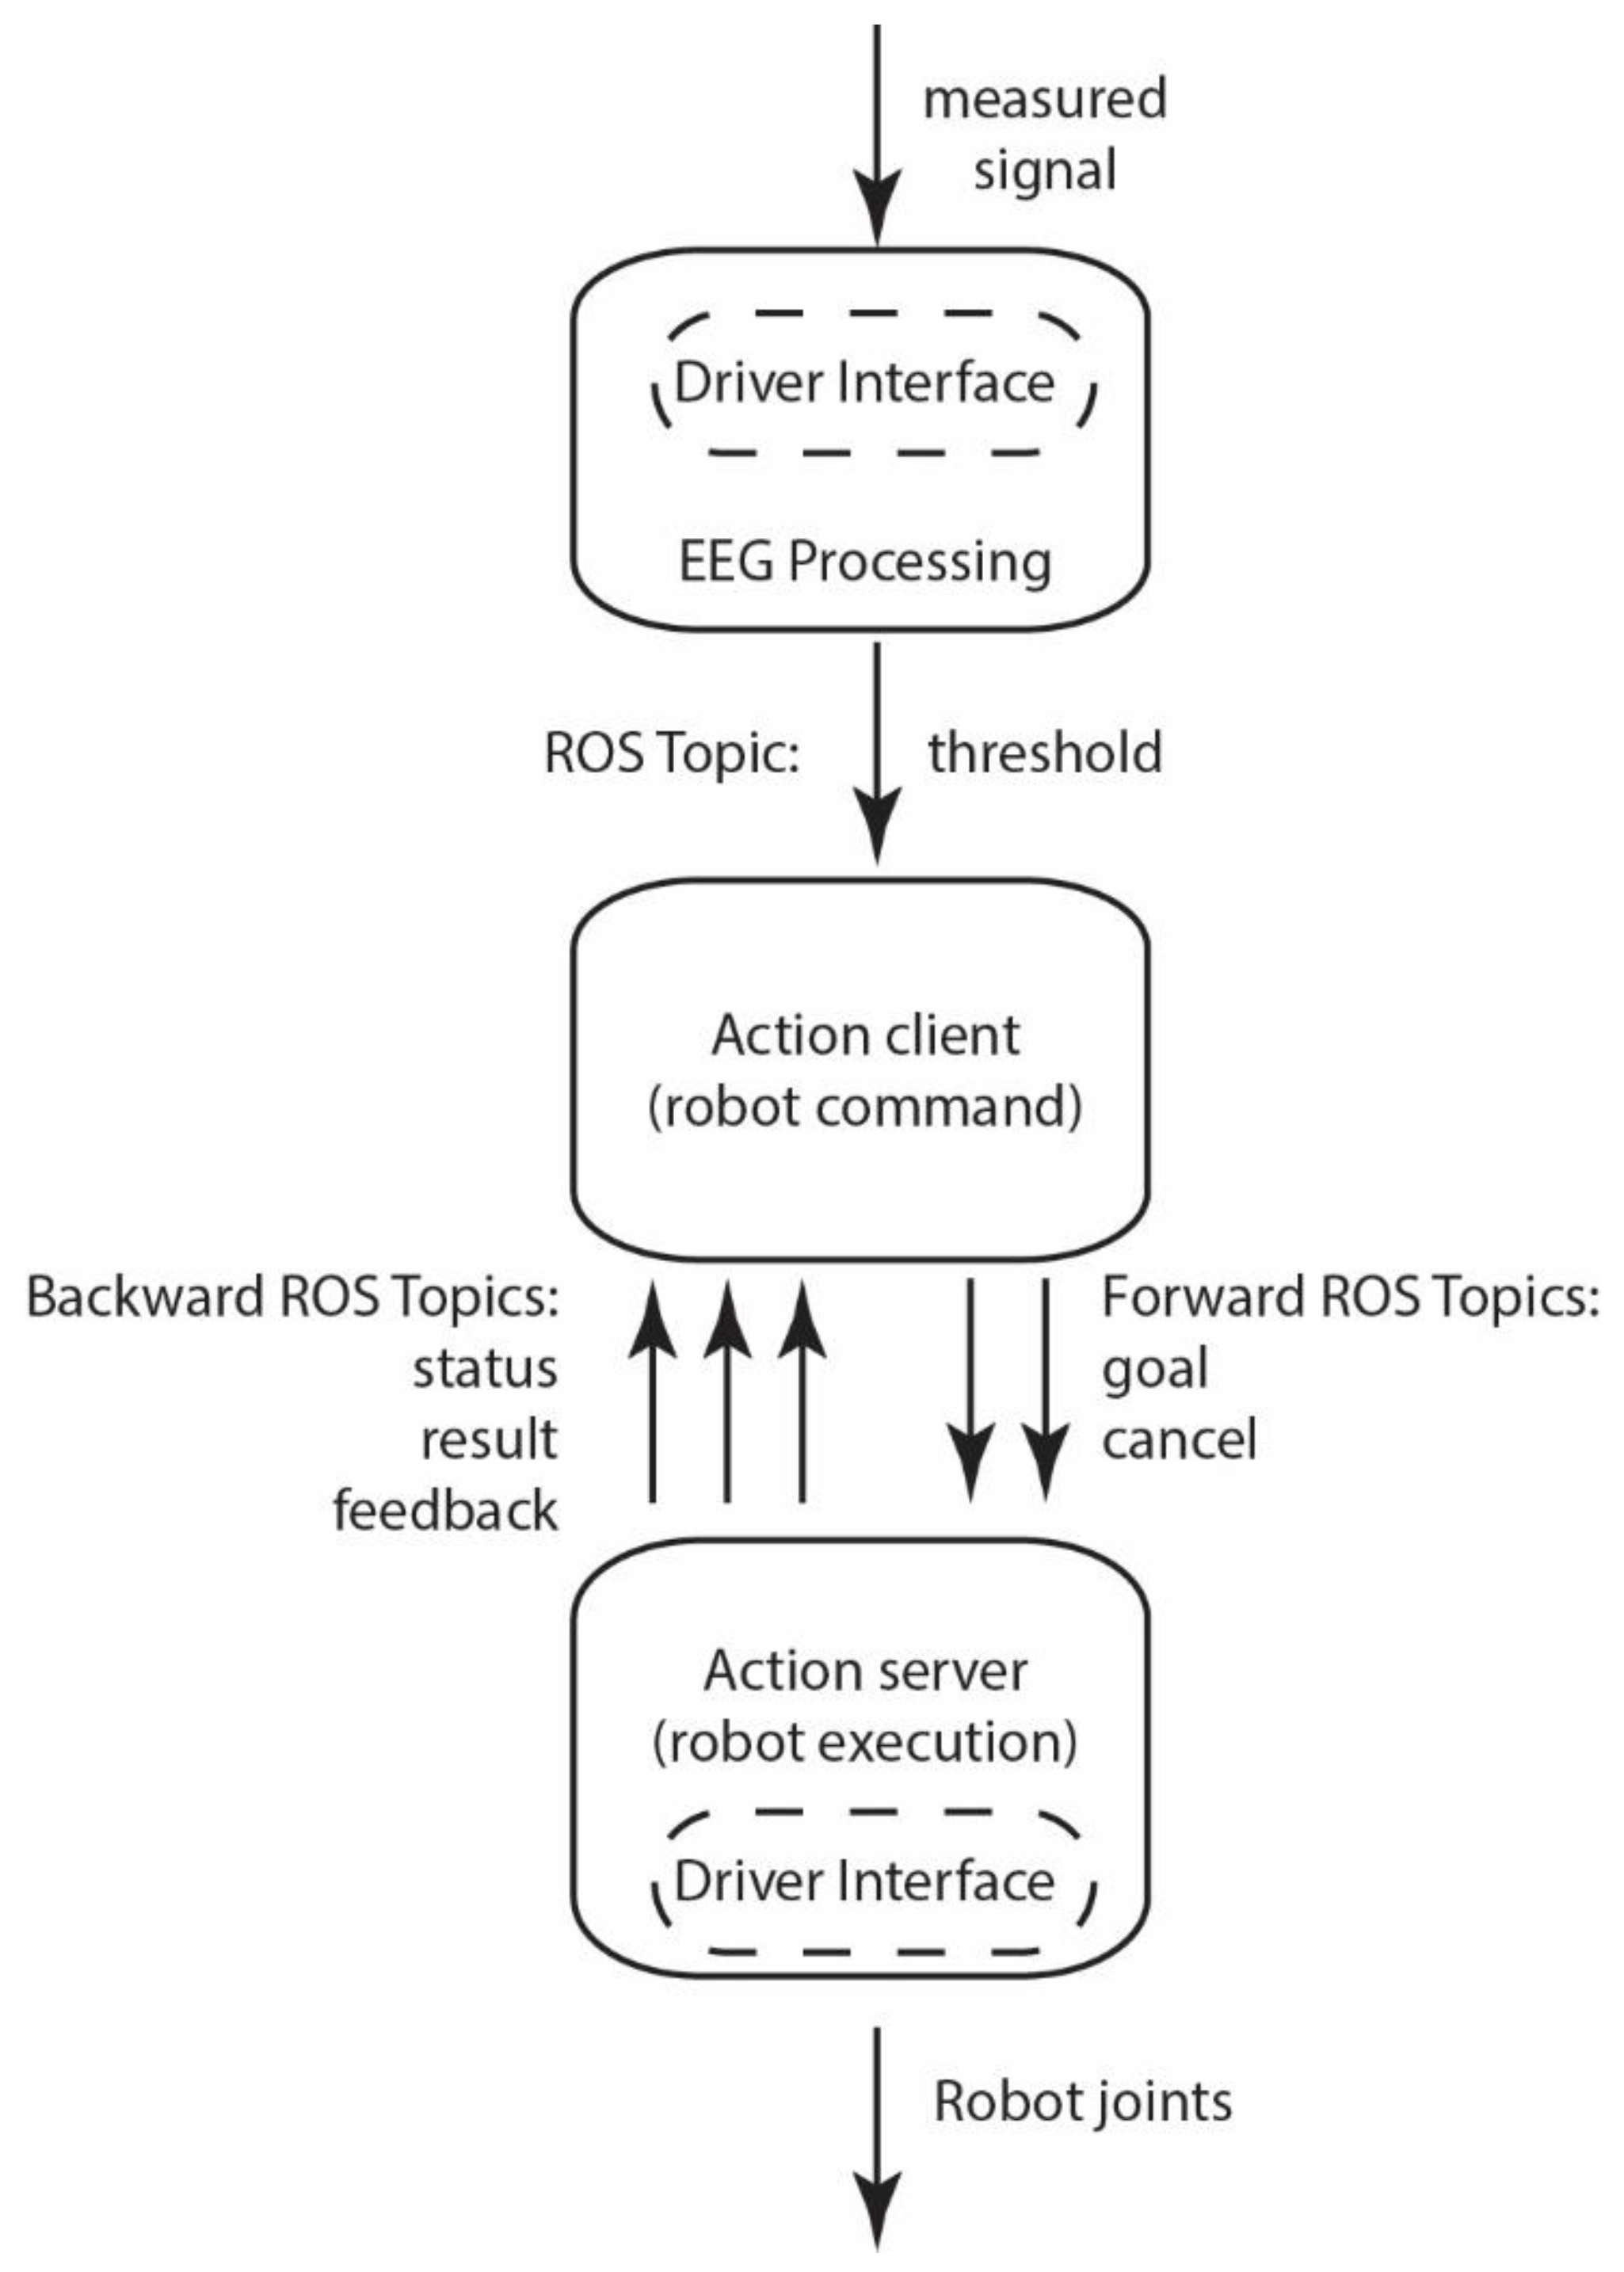
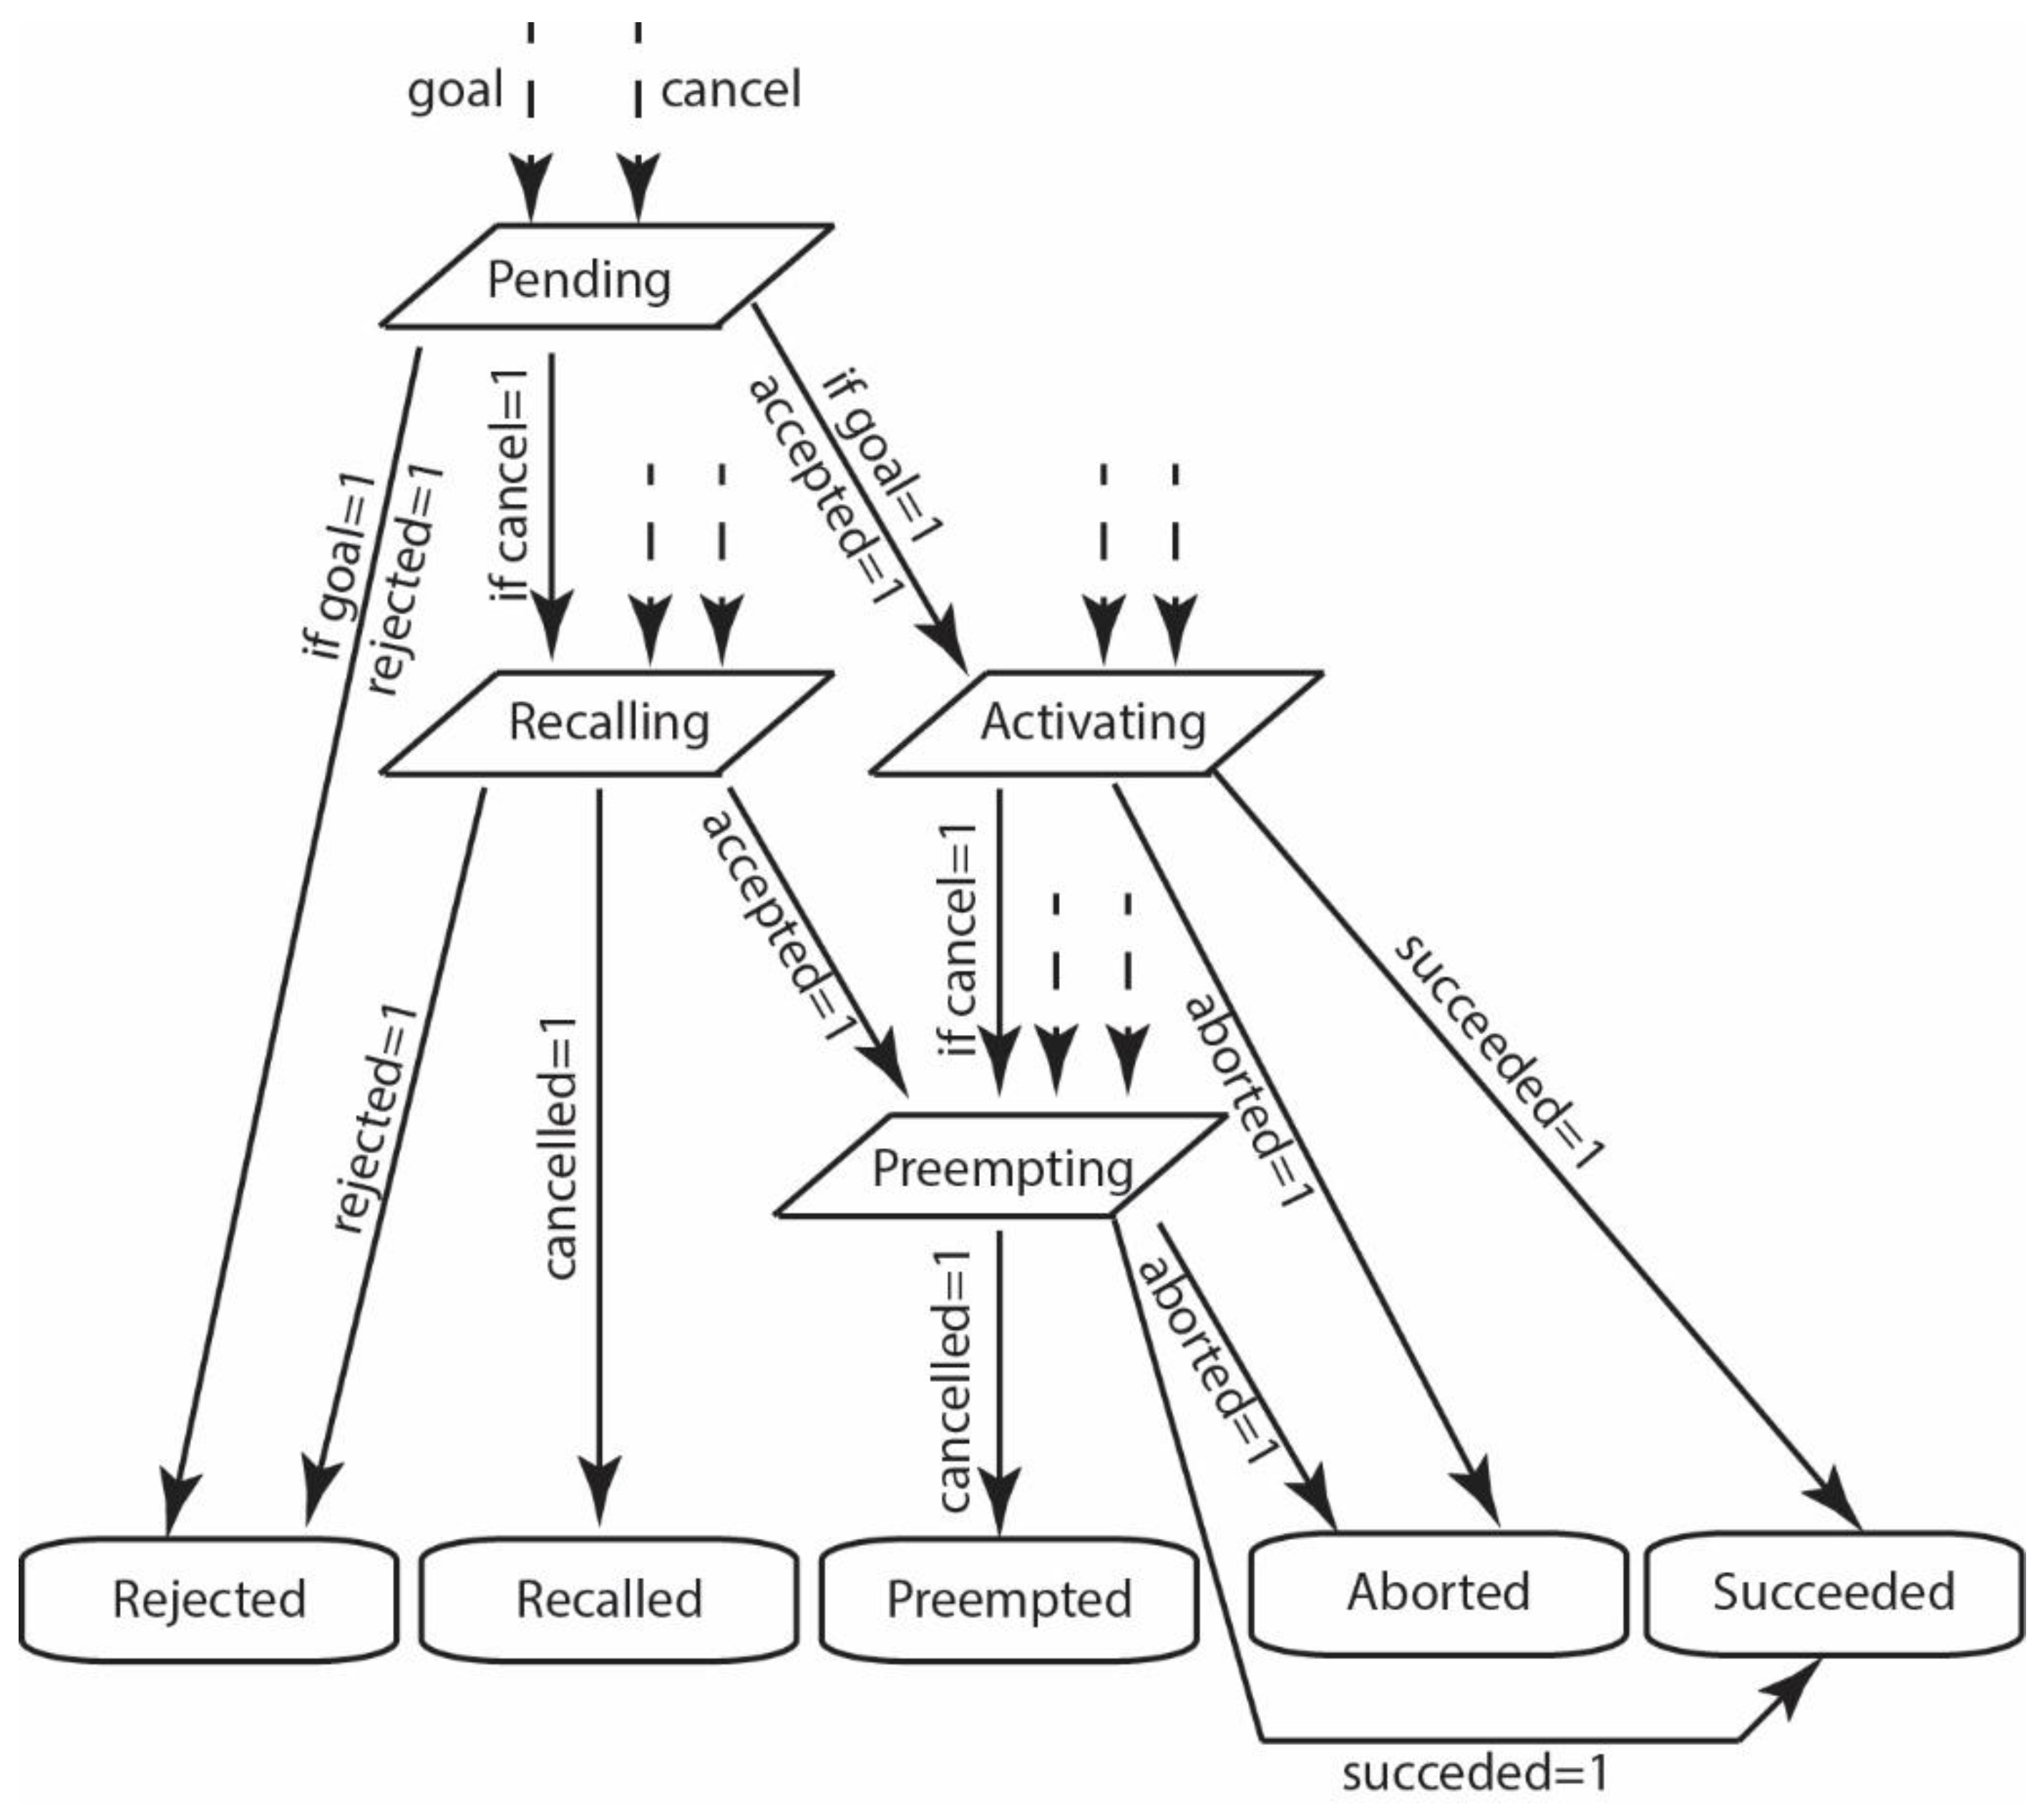
Appendix B. Description of the ROS Application


References
- Colgate, J.E.; Wannasuphoprasit, W.; Peshkin, M.A. Cobots: Robots for collaboration with human operators. In Proceedings of the American Society of Mechanical Engineers, Dynamic Systems and Control Division (Publication) DSC, Atlanta, GA, USA, 17–22 November 1996; pp. 433–439. [Google Scholar]
- Paula, G. Cobots for the assembly line. Mech. Eng. 1997, 119, 82–84. [Google Scholar]
- Wannasuphoprasit, W.; Akella, P.; Peshkin, M.; Colgate, J.E. Cobots: A novel material handling technology. In Proceedings of the American Society of Mechanical Engineers (Paper), Anaheim, CA, USA, 15–20 November 1998; pp. 1–7. [Google Scholar]
- Akella, P.; Peshkin, M.; Colgate, E.; Wannasuphoprasit, W.; Nagesh, N.; Wells, J.; Holland, S.; Pearson, T.; Peacock, B. Cobots for the automobile assembly line. Proc.-IEEE Int. Conf. Robot. Autom. 1999, 1, 728–733. [Google Scholar]
- Peshkin, M.; Colgate, J.E. Cobots. Ind. Robot 1999, 26, 335–341. [Google Scholar] [CrossRef]
- Peshkin, M.A.; Edward Colgate, J.; Wannasuphoprasit, W.; Moore, C.A.; Brent Gillespie, R.; Akella, P. Cobot architecture. IEEE Trans. Robot. Autom. 2001, 17, 377–390. [Google Scholar] [CrossRef] [Green Version]
- Šurdilović, D.; Bernhardt, R.; Zhang, L. New intelligent power-assist systems based on differential transmission. Robotica 2003, 21, 295–302. [Google Scholar] [CrossRef]
- Surdilovic, D.; Simon, H. Singularity avoidance and control of new cobotic systems with differential CVT. In Proceedings of the IEEE International Conference on Robotics and Automation, New Orleans, LA, USA, 26 April–01 May 2004; pp. 715–720. [Google Scholar]
- Bi, Z.M.; Lang, S.Y.T.; Wang, L. Improved control and simulation models of a tricycle collaborative robot. J. Intell. Manuf. 2008, 19, 715–722. [Google Scholar] [CrossRef]
- Rastegarpanah, A.; Saadat, M.; Borboni, A. Parallel Robot for Lower Limb Rehabilitation Exercises. Appl. Bionics Biomech. 2016, 2016, 8584735. [Google Scholar] [CrossRef] [Green Version]
- Mehrotra, Y.; Yadav, S. Coupled Bi-Orientation Octet Pattern for Medical Image Retrieval. In Proceedings of the 2020 IEEE 15th International Conference on Industrial and Information Systems, ICIIS 2020–Proceedings, Rupnagar, India, 26–28 November 2020; pp. 472–477. [Google Scholar]
- Aggogeri, F.; Borboni, A.; Pellegrini, N.; Adamini, R. Design and development of a mechanism for lower limb movement. Int. J. Mech. Eng. Robot. Res. 2019, 8, 911–920. [Google Scholar] [CrossRef]
- Riwan, A.; Giudicelli, B.; Taha, F.; Lazennec, J.Y.; Sabhani, A.; Kilian, P.; Jabbour, Z.; VanRhijn, J.; Louveau, F.; Morel, G.; et al. Surgicobot project: Robotic assistant for spine surgery. IRBM 2011, 32, 130–134. [Google Scholar] [CrossRef]
- Amici, C.; Borboni, A.; Faglia, R.; Fausti, D.; Magnani, P.L. A parallel compliant meso-manipulator for finger rehabilitation treatments: Kinematic and dynamic analysis. In Proceedings of the 2008 IEEE/RSJ International Conference on Intelligent Robots and Systems, IROS, Nice, France, 22–26 September 2008; pp. 735–740. [Google Scholar]
- Boy, E.S.; Burdet, E.; Teo, C.L.; Colgate, J.E. Motion guidance experiments with Scooter Cobot. In Proceedings of the 11th Symposium on Haptic Interfaces for Virtual Environment and Teleoperator Systems, HAPTICS 2003, Los Angeles, CA, USA, 22–23 March 2003; pp. 63–69. [Google Scholar]
- Trochimczuk, R.; Łukaszewicz, A.; Mikołajczyk, T.; Aggogeri, F.; Borboni, A. Finite element method stiffness analysis of a novel telemanipulator for minimally invasive surgery. Simulation 2019, 95, 1015–1025. [Google Scholar] [CrossRef] [Green Version]
- Rossi, F.; Pini, F.; Carlesimo, A.; Dalpadulo, E.; Blumetti, F.; Gherardini, F.; Leali, F. Effective integration of Cobots and additive manufacturing for reconfigurable assembly solutions of biomedical products. Int. J. Interact. Des. Manuf. 2020, 14, 1085–1089. [Google Scholar] [CrossRef]
- Villafañe, J.H.; Taveggia, G.; Galeri, S.; Bissolotti, L.; Mullè, C.; Imperio, G.; Valdes, K.; Borboni, A.; Negrini, S. Efficacy of Short-Term Robot-Assisted Rehabilitation in Patients With Hand Paralysis After Stroke: A Randomized Clinical Trial. Hand 2018, 13, 95–102. [Google Scholar] [CrossRef] [Green Version]
- Pascher, M.; Kronhardt, K.; Franzen, T.; Gruenefeld, U.; Schneegass, S.; Gerken, J. My Caregiver the Cobot: Comparing Visualization Techniques to Effectively Communicate Cobot Perception to People with Physical Impairments. Sensors 2022, 22, 755. [Google Scholar] [CrossRef]
- Rosenthal, S.; Biswas, J.; Veloso, M. An effective personal mobile robot agent through symbiotic human-robot interaction. In Proceedings of the International Joint Conference on Autonomous Agents and Multiagent Systems, AAMAS, Toronto, ON, Canada, 10–14 May 2010; pp. 915–922. [Google Scholar]
- Rosenthal, S.; Veloso, M. Mixed-initiative long-term interactions with an all-day-companion robot. In Proceedings of the AAAI Fall Symposium–Technical Report, Arlington, VA, USA, 11–13 November 2010; pp. 97–102. [Google Scholar]
- Vaz, M.; Ventura, R. Real-Time Ground-Plane Based Mobile Localization Using Depth Camera in Real Scenarios. J. Intell. Robot. Syst. Theory Appl. 2015, 80, 525–536. [Google Scholar] [CrossRef]
- Hamed, O.; Hamlich, M.; Ennaji, M. Hunting strategy for multi-robot based on wolf swarm algorithm and artificial potential field. Indones. J. Electr. Eng. Comput. Sci. 2022, 25, 159–171. [Google Scholar] [CrossRef]
- Krishna Kumar, K.; Karthikeyan, A.; Elango, M. Selection of a Best Humanoid Robot Using “TOPSIS” for Rescue Operation. Lect. Notes Mech. Eng. 2022, 943–953. [Google Scholar] [CrossRef]
- Nikitha, M.A.; Sai Swetha, B.S.; Mantripragada, K.H.; Jayapandian, N. The Future Warfare with Multidomain Applications of Artificial Intelligence: Research Perspective. Lect. Notes Netw. Syst. 2022, 351, 329–341. [Google Scholar] [CrossRef]
- Vardhini, P.A.H.; Babu, K.M.C. IoT based Autonomous Robot Design Implementation for Military Applications. In Proceedings of the 2022 IEEE Delhi Section Conference, DELCON, New Delhi, India, 11–13 February 2022. [Google Scholar]
- Bishop, R.H. The Mechatronics Handbook; CRC Press: Boca Raton, FL, UDA, 2002; pp. 1–1251. [Google Scholar]
- Aggogeri, F.; Borboni, A.; Merlo, A.; Pellegrini, N.; Ricatto, R. Real-time performance of mechatronic PZT module using active vibration feedback control. Sensors 2016, 16, 1577. [Google Scholar] [CrossRef] [Green Version]
- Tomizuka, M. Mechatronics: From the 20th to 21st century. Control Eng. Pract. 2002, 10, 877–886. [Google Scholar] [CrossRef]
- Borboni, A.; Carbone, G.; Pellegrini, N. Reference Frame Identification and Distributed Control Strategies in Human-Robot Collaboration. In Advances in Service and Industrial Robotics, Proceedings of the International Conference on Robotics in Alpe-Adria Danube Region, Kaiserslautern, Germany, 19 June 2020; Mechanisms and Machine Science; Springer: Cham, Switzerland, 2020; pp. 93–102. [Google Scholar]
- Rubagotti, M.; Tusseyeva, I.; Baltabayeva, S.; Summers, D.; Sandygulova, A. Perceived safety in physical human–robot interaction—A survey. Robot. Auton. Syst. 2022, 151, 104047. [Google Scholar] [CrossRef]
- Pagani, R.; Nuzzi, C.; Ghidelli, M.; Borboni, A.; Lancini, M.; Legnani, G. Cobot user frame calibration: Evaluation and comparison between positioning repeatability performances achieved by traditional and vision-based methods. Robotics 2021, 10, 45. [Google Scholar] [CrossRef]
- AlAttar, A.; Rouillard, L.; Kormushev, P. Autonomous air-hockey playing cobot using optimal control and vision-based bayesian tracking. In Towards Autonomous Robotic Systems, Proceedings of the Annual Conference Towards Autonomous Robotic Systems, London, UK, 3–5 July 2019; Lecture Notes in Computer Science; Springer: Cham, Switzerland, 2019; Volume 11650, pp. 358–369. [Google Scholar] [CrossRef] [Green Version]
- Borboni, A.; Marinoni, P.; Nuzzi, C.; Faglia, R.; Pagani, R.; Panada, S. Towards safe collaborative interaction empowered by face recognition. In Proceedings of the 2021 24th International Conference on Mechatronics Technology, ICMT 2021, Singapore, 18–22 December 2021. [Google Scholar]
- Boucher, J.D.; Pattacini, U.; Lelong, A.; Bailly, G.; Elisei, F.; Fagel, S.; Dominey, P.F.; Ventre-Dominey, J. I reach faster when i see you look: Gaze effects in human-human and human-robot face-to-face cooperation. Front. Neurorobotics 2012, 6, 3. [Google Scholar] [CrossRef] [PubMed] [Green Version]
- Brèthes, L.; Menezes, P.; Lerasle, F.; Hayet, J. Face tracking and hand gesture recognition for human-robot interaction. In Proceedings of the IEEE International Conference on Robotics and Automation, New Orleans, LA, USA, 26 April–01 May 2004; pp. 1901–1906. [Google Scholar]
- Wilhelm, T.; Böhme, H.J.; Gross, H.M. A multi-modal system for tracking and analyzing faces on a mobile robot. Robot. Auton. Syst. 2004, 48, 31–40. [Google Scholar] [CrossRef]
- Nuzzi, C.; Pasinetti, S.; Pagani, R.; Docchio, F.; Sansoni, G. Hand Gesture Recognition for Collaborative Workstations: A Smart Command System Prototype. In New Trends in Image Analysis and Processing–ICIAP 2019, Proceedings of the International Conference on Image Analysis and Processing, Trento, Italy, 9–13 September 2019; Lecture Notes in Computer Science; Springer: Cham, Switzerland, 2019; Volume 11808, pp. 332–342. [Google Scholar] [CrossRef]
- Calinon, S.; D’Halluin, F.; Sauser, E.L.; Caldwell, D.G.; Billard, A.G. Learning and reproduction of gestures by imitation. IEEE Robot. Autom. Mag. 2010, 17, 44–54. [Google Scholar] [CrossRef] [Green Version]
- Nagi, J.; Ducatelle, F.; Di Caro, G.A.; Cireşan, D.; Meier, U.; Giusti, A.; Nagi, F.; Schmidhuber, J.; Gambardella, L.M. Max-pooling convolutional neural networks for vision-based hand gesture recognition. In Proceedings of the 2011 IEEE International Conference on Signal and Image Processing Applications, ICSIPA 2011, Kuala Lumpur, Malaysia, 16–18 November 2011; pp. 342–347. [Google Scholar]
- Lauria, S.; Bugmann, G.; Kyriacou, T.; Bos, J.; Klein, E. Training personal robots using natural language instruction. IEEE Intell. Syst. Appl. 2001, 16, 38–45. [Google Scholar] [CrossRef]
- Adamini, R.; Antonini, N.; Borboni, A.; Medici, S.; Nuzzi, C.; Pagani, R.; Pezzaioli, A.; Tonola, C. User-friendly human-robot interaction based on voice commands and visual systems. In Proceedings of the 2021 24th International Conference on Mechatronics Technology, ICMT 2021, Singapore, 18–22 December 2021. [Google Scholar]
- Scheutz, M.; Schermerhorn, P.; Kramer, J.; Middendorff, C. The utility of affect expression in natural language interactions in joint human-robot tasks. In Proceedings of the HRI 2006: ACM Conference on Human-Robot Interaction, Salt Lake City, UT, USA, 2–3 May 2006; pp. 226–233. [Google Scholar]
- Thomason, J.; Zhang, S.; Mooney, R.; Stone, P. Learning to interpret natural language commands through human-robot dialog. In Proceedings of the IJCAI International Joint Conference on Artificial Intelligence, Buenos Aires, Argentina, 25–31 July 2015; pp. 1923–1929. [Google Scholar]
- Preston, S.D.; de Waal, F.B.M. Empathy: Its ultimate and proximate bases. Behav. Brain Sci. 2002, 25, 1–20. [Google Scholar] [CrossRef] [Green Version]
- Ekman, P. An Argument for Basic Emotions. Cogn. Emot. 1992, 6, 169–200. [Google Scholar] [CrossRef]
- Jain, N.; Kumar, S.; Kumar, A.; Shamsolmoali, P.; Zareapoor, M. Hybrid deep neural networks for face emotion recognition. Pattern Recognit. Lett. 2018, 115, 101–106. [Google Scholar] [CrossRef]
- Maglogiannis, I.; Vouyioukas, D.; Aggelopoulos, C. Face detection and recognition of natural human emotion using Markov random fields. Pers. Ubiquitous Comput. 2009, 13, 95–101. [Google Scholar] [CrossRef]
- Wegrzyn, M.; Vogt, M.; Kireclioglu, B.; Schneider, J.; Kissler, J. Mapping the emotional face. How individual face parts contribute to successful emotion recognition. PLoS ONE 2017, 12, e0177239. [Google Scholar] [CrossRef] [Green Version]
- Zhang, H.; Jolfaei, A.; Alazab, M. A Face Emotion Recognition Method Using Convolutional Neural Network and Image Edge Computing. IEEE Access 2019, 7, 159081–159089. [Google Scholar] [CrossRef]
- Gunes, H.; Piccardi, M. Fusing face and body gesture for machine recognition of emotions. In Proceedings of the IEEE International Workshop on Robot and Human Interactive Communication, Nashville, TN, USA, 13–15 August 2005; pp. 306–311. [Google Scholar]
- Gunes, H.; Piccardi, M. Bi-modal emotion recognition from expressive face and body gestures. J. Netw. Comput. Appl. 2007, 30, 1334–1345. [Google Scholar] [CrossRef] [Green Version]
- Wang, K.; Meng, D.; Zeng, X.; Zhang, K.; Qiao, Y.; Yang, J.; Peng, X. Cascade attention networks for group emotion recognition with face, body and image cues. In Proceedings of the ICMI 2018 International Conference on Multimodal Interaction, New York, NY, USA, 16–20 October 2018; pp. 640–645. [Google Scholar]
- Castellano, G.; Kessous, L.; Caridakis, G. Emotion recognition through multiple modalities: Face, body gesture, speech. In Affect and Emotion in Human-Computer Interaction; Lecture Notes in Computer Science; Springer: Berlin/Heidelberg, Germany, 2008; Volume 4868, pp. 92–103. [Google Scholar] [CrossRef]
- Cohn, J.F.; Katz, G.S. Bimodal expression of emotion by face and voice. In Proceedings of the Proceedings of the 6th ACM International Conference on Multimedia: Face/Gesture Recognition and their Applications, MULTIMEDIA 1998, Bristol, UK, 13–16 September 1998; pp. 41–44. [Google Scholar]
- Mansoorizadeh, M.; Charkari, N.M. Multimodal information fusion application to human emotion recognition from face and speech. Multimed. Tools Appl. 2010, 49, 277–297. [Google Scholar] [CrossRef]
- Metallinou, A.; Lee, S.; Narayanan, S. Audio-visual Emotion recognition using Gaussian Mixture Models for face and voice. In Proceedings of the 10th IEEE International Symposium on Multimedia, ISM 2008, Berkeley, CA, USA, 15–17 December 2008; pp. 250–257. [Google Scholar]
- Bechara, A.; Damasio, H.; Damasio, A.R. Role of the amygdala in decision-making. Ann. N. Y. Acad. Sci. 2003, 985, 356–369. [Google Scholar] [CrossRef]
- Shaver, P.; Schwartz, J.; Kirson, D.; O’Connor, C. Emotion Knowledge: Further Exploration of a Prototype Approach. J. Personal. Soc. Psychol. 1987, 52, 1061–1086. [Google Scholar] [CrossRef]
- Becker-Asano, C.; Wachsmuth, I. Affective computing with primary and secondary emotions in a virtual human. Auton. Agents Multi-Agent Syst. 2010, 20, 32–49. [Google Scholar] [CrossRef] [Green Version]
- Phan, K.L.; Wager, T.; Taylor, S.F.; Liberzon, I. Functional neuroanatomy of emotion: A meta-analysis of emotion activation studies in PET and fMRI. NeuroImage 2002, 16, 331–348. [Google Scholar] [CrossRef] [Green Version]
- Kang, S.J.; Kim, H.S.; Baek, K.H. Effects of Nature-Based Group Art Therapy Programs on Stress, Self-Esteem and Changes in Electroencephalogram (EEG) in Non-Disabled Siblings of Children with Disabilities. Int. J. Environ. Res. Public Health 2021, 18, 5912. [Google Scholar] [CrossRef]
- Balconi, M.; Fronda, G. The Use of Hyperscanning to Investigate the Role of Social, Affective, and Informative Gestures in Non-Verbal Communication. Electrophysiological (EEG) and Inter-Brain Connectivity Evidence. Brain Sci. 2020, 10, 29. [Google Scholar] [CrossRef] [Green Version]
- Sheikh, H.; McFarland, D.J.; Sarnacki, W.A.; Wolpaw, J.R. Electroencephalographic(EEG)-based communication: EEG control versus system performance in humans. Neurosci. Lett. 2003, 345, 89–92. [Google Scholar] [CrossRef]
- Krishna, G.; Tran, C.; Han, Y.; Carnahan, M.; Tewfik, A.H.; leee. Speech Synthesis Using EEG. In Proceedings of the 2020 IEEE International Conference on Acoustics, Speech, and Signal Processing, Barcelona, Spain, 4–8 May 2020; pp. 1235–1238. [Google Scholar]
- Formica, C.; De Salvo, S.; Micchia, K.; La Foresta, F.; Dattola, S.; Mammone, N.; Corallo, F.; Ciavola, A.; Arcadi, F.A.; Marino, S.; et al. Cortical Reorganization after Rehabilitation in a Patient with Conduction Aphasia Using High-Density EEG. Appl. Sci. 2020, 10, 5281. [Google Scholar] [CrossRef]
- Al-Hudhud, G.; Alqahtani, L.; Albaity, H.; Alsaeed, D.; Al-Turaiki, I. Analyzing Passive BCI Signals to Control Adaptive Automation Devices. Sensors 2019, 19, 3042. [Google Scholar] [CrossRef] [Green Version]
- Palumbo, A.; Gramigna, V.; Calabrese, B.; Ielpo, N. Motor-Imagery EEG-Based BCIs in Wheelchair Movement and Control: A Systematic Literature Review. Sensors 2021, 21, 6285. [Google Scholar] [CrossRef] [PubMed]
- Xu, B.G.; Li, W.L.; Liu, D.P.; Zhang, K.; Miao, M.M.; Xu, G.Z.; Song, A.G. Continuous Hybrid BCI Control for Robotic Arm Using Noninvasive Electroencephalogram, Computer Vision, and Eye Tracking. Mathematics 2022, 10, 618. [Google Scholar] [CrossRef]
- Barria, P.; Pino, A.; Tovar, N.; Gomez-Vargas, D.; Baleta, K.; Diaz, C.A.R.; Munera, M.; Cifuentes, C.A. BCI-Based Control for Ankle Exoskeleton T-FLEX: Comparison of Visual and Haptic Stimuli with Stroke Survivors. Sensors 2021, 21, 6431. [Google Scholar] [CrossRef]
- Amici, C.; Borboni, A.; Tuveggia, G.; Legnani, G. Bioelectric prostheses: Review of classifications and control strategies. G. Ital. Med. Del Lav. Ergon. 2015, 37, 39–44. [Google Scholar]
- Lee, J.; Mukae, N.; Arata, J.; Iihara, K.; Hashizume, M. Comparison of Feature Vector Compositions to Enhance the Performance of NIRS-BCI-Triggered Robotic Hand Orthosis for Post-Stroke Motor Recovery. Appl. Sci. 2019, 9, 3845. [Google Scholar] [CrossRef] [Green Version]
- Tran, Y.; Austin, P.; Lo, C.; Craig, A.; Middleton, J.W.; Wrigley, P.J.; Siddall, P. An Exploratory EEG Analysis on the Effects of Virtual Reality in People with Neuropathic Pain Following Spinal Cord Injury. Sensors 2022, 22, 2629. [Google Scholar] [CrossRef]
- Gannouni, S.; Belwafi, K.; Aboalsamh, H.; AlSamhan, Z.; Alebdi, B.; Almassad, Y.; Alobaedallah, H. EEG-Based BCI System to Detect Fingers Movements. Brain Sci. 2020, 10, 965. [Google Scholar] [CrossRef]
- Sanchez-Cuesta, F.J.; Arroyo-Ferrer, A.; Gonzalez-Zamorano, Y.; Vourvopoulos, A.; Badia, S.B.I.; Figuereido, P.; Serrano, J.I.; Romero, J.P. Clinical Effects of Immersive Multimodal BCI-VR Training after Bilateral Neuromodulation with rTMS on Upper Limb Motor Recovery after Stroke. A Study Protocol for a Randomized Controlled Trial. Medicina 2021, 57, 736. [Google Scholar] [CrossRef]
- Anwar, S.M.; Saeed, S.M.U.; Majid, M.; Usman, S.; Mehmood, C.A.; Liu, W. A Game Player Expertise Level Classification System Using Electroencephalography (EEG). Appl. Sci. 2017, 8, 18. [Google Scholar] [CrossRef] [Green Version]
- Al-Nafjan, A.; Aldayel, M. Predict Students’ Attention in Online Learning Using EEG Data. Sustainability 2022, 14, 6553. [Google Scholar] [CrossRef]
- Yang, Y.Z.; Du, Z.G.; Jiao, F.T.; Pan, F.Q. Analysis of EEG Characteristics of Drivers and Driving Safety in Undersea Tunnel. Int. J. Environ. Res. Public Health 2021, 18, 9810. [Google Scholar] [CrossRef] [PubMed]
- Zhang, Y.M.; Zhang, M.Y.; Fang, Q. Scoping Review of EEG Studies in Construction Safety. Int. J. Environ. Res. Public Health 2019, 16, 4146. [Google Scholar] [CrossRef] [PubMed] [Green Version]
- Zhang, Z.T.; Luo, D.Y.; Rasim, Y.; Li, Y.J.; Meng, G.J.; Xu, J.; Wang, C.B. A Vehicle Active Safety Model: Vehicle Speed Control Based on Driver Vigilance Detection Using Wearable EEG and Sparse Representation. Sensors 2016, 16, 242. [Google Scholar] [CrossRef] [PubMed]
- Kim, M.; Kim, M.K.; Hwang, M.; Kim, H.Y.; Cho, J.; Kim, S.P. Online Home Appliance Control Using EEG-Based Brain-Computer Interfaces. Electronics 2019, 8, 1101. [Google Scholar] [CrossRef] [Green Version]
- Hong, Y.G.; Kim, H.K.; Son, Y.D.; Kang, C.K. Identification of Breathing Patterns through EEG Signal Analysis Using Machine Learning. Brain Sci. 2021, 11, 293. [Google Scholar] [CrossRef]
- Chen, Y.J.; Chen, S.C.; Zaeni, I.A.E.; Wu, C.M. Fuzzy Tracking and Control Algorithm for an SSVEP-Based BCI System. Appl. Sci. 2016, 6, 270. [Google Scholar] [CrossRef] [Green Version]
- Korovesis, N.; Kandris, D.; Koulouras, G.; Alexandridis, A. Robot Motion Control via an EEG-Based Brain-Computer Interface by Using Neural Networks and Alpha Brainwaves. Electronics 2019, 8, 1387. [Google Scholar] [CrossRef] [Green Version]
- Martinez-Tejada, L.A.; Puertas-Gonzalez, A.; Yoshimura, N.; Koike, Y. Exploring EEG Characteristics to Identify Emotional Reactions under Videogame Scenarios. Brain Sci. 2021, 11, 378. [Google Scholar] [CrossRef]
- American Electroencephalographic Society Guidelines for Standard Electrode Position Nomenclature1. J. Clin. Neurophysiol. 1991, 8, 200–202. [CrossRef]
- Al-Quraishi, M.S.; Elamvazuthi, I.; Daud, S.A.; Parasuraman, S.; Borboni, A. Eeg-based control for upper and lower limb exoskeletons and prostheses: A systematic review. Sensors 2018, 18, 3342. [Google Scholar] [CrossRef] [PubMed] [Green Version]
- van Albada, S.J.; Robinson, P.A. Relationships between electroencephalographic spectral peaks across frequency bands. Front. Hum. Neurosci. 2013, 7, 56. [Google Scholar] [CrossRef] [PubMed] [Green Version]
- Coan, J.A.; Allen, J.J.B. Frontal EEG asymmetry as a moderator and mediator of emotion. Biol. Psychol. 2004, 67, 7–50. [Google Scholar] [CrossRef]
- Jenke, R.; Peer, A.; Buss, M. Feature extraction and selection for emotion recognition from EEG. IEEE Trans. Affect. Comput. 2014, 5, 327–339. [Google Scholar] [CrossRef]
- Lin, Y.P.; Wang, C.H.; Jung, T.P.; Wu, T.L.; Jeng, S.K.; Duann, J.R.; Chen, J.H. EEG-based emotion recognition in music listening. IEEE Trans. Biomed. Eng. 2010, 57, 1798–1806. [Google Scholar] [CrossRef]
- Petrantonakis, P.C.; Hadjileontiadis, L.J. Emotion recognition from EEG using higher order crossings. IEEE Trans. Inf. Technol. Biomed. 2010, 14, 186–197. [Google Scholar] [CrossRef]
- Zheng, W.L.; Lu, B.L. Investigating Critical Frequency Bands and Channels for EEG-Based Emotion Recognition with Deep Neural Networks. IEEE Trans. Auton. Ment. Dev. 2015, 7, 162–175. [Google Scholar] [CrossRef]
- Krishnan, N.M.; Mariappan, M.; Muthukaruppan, K.; Hijazi, M.H.A.; Kitt, W.W. Electroencephalography (EEG) based control in assistive mobile robots: A review. IOP Conf. Ser. Mater. Sci. Eng. 2016, 121, 012017. [Google Scholar] [CrossRef]
- Li, P.; Meziane, R.; Otis, M.J.D.; Ezzaidi, H.; Cardou, P. A smart safety helmet using IMU and EEG sensors for worker fatigue detection. In Proceedings of the ROSE 2014 IEEE International Symposium on RObotic and SEnsors Environments, Timisoara, Romania, 16–18 October 2014; pp. 55–60. [Google Scholar]
- Fu, Y.; Xiong, X.; Jiang, C.; Xu, B.; Li, Y.; Li, H. Imagined Hand Clenching Force and Speed Modulate Brain Activity and Are Classified by NIRS Combined with EEG. IEEE Trans. Neural Syst. Rehabil. Eng. 2017, 25, 1641–1652. [Google Scholar] [CrossRef]
- Eyam, A.T.; Mohammed, W.M.; Martinez Lastra, J.L. Emotion-driven analysis and control of human-robot interactions in collaborative applications. Sensors 2021, 21, 4626. [Google Scholar] [CrossRef] [PubMed]
- Arpaia, P.; Moccaldi, N.; Prevete, R.; Sannino, I.; Tedesco, A. A Wearable EEG Instrument for Real-Time Frontal Asymmetry Monitoring in Worker Stress Analysis. IEEE Trans. Instrum. Meas. 2020, 69, 8335–8343. [Google Scholar] [CrossRef]
- Martinez-Peon, D.; Parra-Vega, V.; Sanchez-Orta, A. EEG-motor sequencing signals for online command of dynamic robots. In Proceedings of the 3rd International Winter Conference on Brain-Computer Interface, BCI 2015, Gangwon, Korea, 12–14 January 2015. [Google Scholar]
- Alvarez, R.P.; Chen, G.; Bodurka, J.; Kaplan, R.; Grillon, C. Phasic and sustained fear in humans elicits distinct patterns of brain activity. NeuroImage 2011, 55, 389–400. [Google Scholar] [CrossRef] [PubMed] [Green Version]
- Isbell, L.A. Snakes as agents of evolutionary change in primate brains. J. Hum. Evol. 2006, 51, 1–35. [Google Scholar] [CrossRef] [PubMed]
- Olsson, A.; Nearing, K.I.; Phelps, E.A. Learning fears by observing others: The neural systems of social fear transmission. Soc. Cogn. Affect. Neurosci. 2007, 2, 3–11. [Google Scholar] [CrossRef] [Green Version]
- Cusano, N. Cobot and sobot: For a new ontology of collaborative and social robot. Found. Sci. 2022, 27, 1–20. [Google Scholar]
- Durka, P.J.; Kus, R.; Zygierewicz, J.; Michalska, M.; Milanowski, P.; Labecki, M.; Spustek, T.; Laszuk, D.; Duszyk, A.; Kruszynski, M. User-centered design of brain-computer interfaces: OpenBCI.pl and BCI Appliance. Bull. Pol. Acad. Sci. Tech. Sci. 2012, 60, 427–431. [Google Scholar] [CrossRef] [Green Version]
- Götz, T.; Janik, V.M. Repeated elicitation of the acoustic startle reflex leads to sensitisation in subsequent avoidance behaviour and induces fear conditioning. BMC Neurosci. 2011, 12, 30. [Google Scholar] [CrossRef] [Green Version]
- Al-Nafjan, A.; Hosny, M.; Al-Ohali, Y.; Al-Wabil, A. Review and classification of emotion recognition based on EEG brain-computer interface system research: A systematic review. Appl. Sci. 2017, 7, 1239. [Google Scholar] [CrossRef] [Green Version]
- Houssein, E.H.; Hammad, A.; Ali, A.A. Human emotion recognition from EEG-based brain–computer interface using machine learning: A comprehensive review. Neural Comput. Appl. 2022, 34, 12527–12557. [Google Scholar] [CrossRef]
- Pham, T.D.; Tran, D.; Ma, W.; Tran, N.T. Enhancing performance of EEG-based emotion recognition systems using feature smoothing. In Neural Information Processing, ICONIP 2015, Proceedings of the International Conference on Neural Information Processing, New Delhi, India, 22–26 November 2022; Lecture Notes in Computer Science; Springer: Cham, Switzerland, 2015; Volume 9492, pp. 95–102. [Google Scholar] [CrossRef]
- Alarcão, S.M.; Fonseca, M.J. Emotions recognition using EEG signals: A survey. IEEE Trans. Affect. Comput. 2019, 10, 374–393. [Google Scholar] [CrossRef]
- Bălan, O.; Moise, G.; Moldoveanu, A.; Leordeanu, M.; Moldoveanu, F. Fear level classification based on emotional dimensions and machine learning techniques. Sensors 2019, 19, 1738. [Google Scholar] [CrossRef] [PubMed] [Green Version]
- Kometer, H.; Luedtke, S.; Stanuch, K.; Walczuk, S.; Wettstein, J. The Effects Virtual Reality Has on Physiological Responses as Compared to Two-Dimensional Video; University of Wisconsin School of Medicine and Public Health: Madison, WI, USA, 2010. [Google Scholar]
- Wallstrom, G.L.; Kass, R.E.; Miller, A.; Cohn, J.F.; Fox, N.A. Automatic correction of ocular artifacts in the EEG: A comparison of regression-based and component-based methods. Int. J. Psychophysiol. 2004, 53, 105–119. [Google Scholar] [CrossRef] [PubMed]
- Østergaard, E.H.; Lund, H.H. Evolving control for modular robotic units. In Proceedings of the IEEE International Symposium on Computational Intelligence in Robotics and Automation, CIRA, Kobe, Japan, 16–20 July 2003; pp. 886–892. [Google Scholar]
- Shackman, A.J.; Fox, A.S. Contributions of the central extended amygdala to fear and anxiety. J. Neurosci. 2016, 36, 8050–8063. [Google Scholar] [CrossRef]
- Murphy, J. Hardware Design Files. 2022. Available online: https://github.com/OpenBCI (accessed on 27 June 2022).
- Instruments, T. ADS1299 Low-Noise, 8-Channel, 24-Bit Analog-to-Digital Converter for Biopotential Measurements. 2022. Available online: https://www.ti.com/product/ADS1299 (accessed on 28 June 2022).


| α | θ | a | d |
|---|---|---|---|
| −π/2 | θ1 | 8.1 × 10⁻² | 0 |
| π/2 | θ2 | 0 | 1.91 × 10⁻¹ |
| −π/2 | θ3 | 0 | 3.99 × 10⁻¹ |
| π/2 | θ4 | 0 | −1.683 × 10⁻¹ |
| −π/2 | θ5 | 0 | 3.965 × 10⁻¹ |
| π/2 | θ6 | 0 | 1.360 × 10⁻¹ |
| 0 | θ7 | 0 | 1.785 × 10⁻¹ |
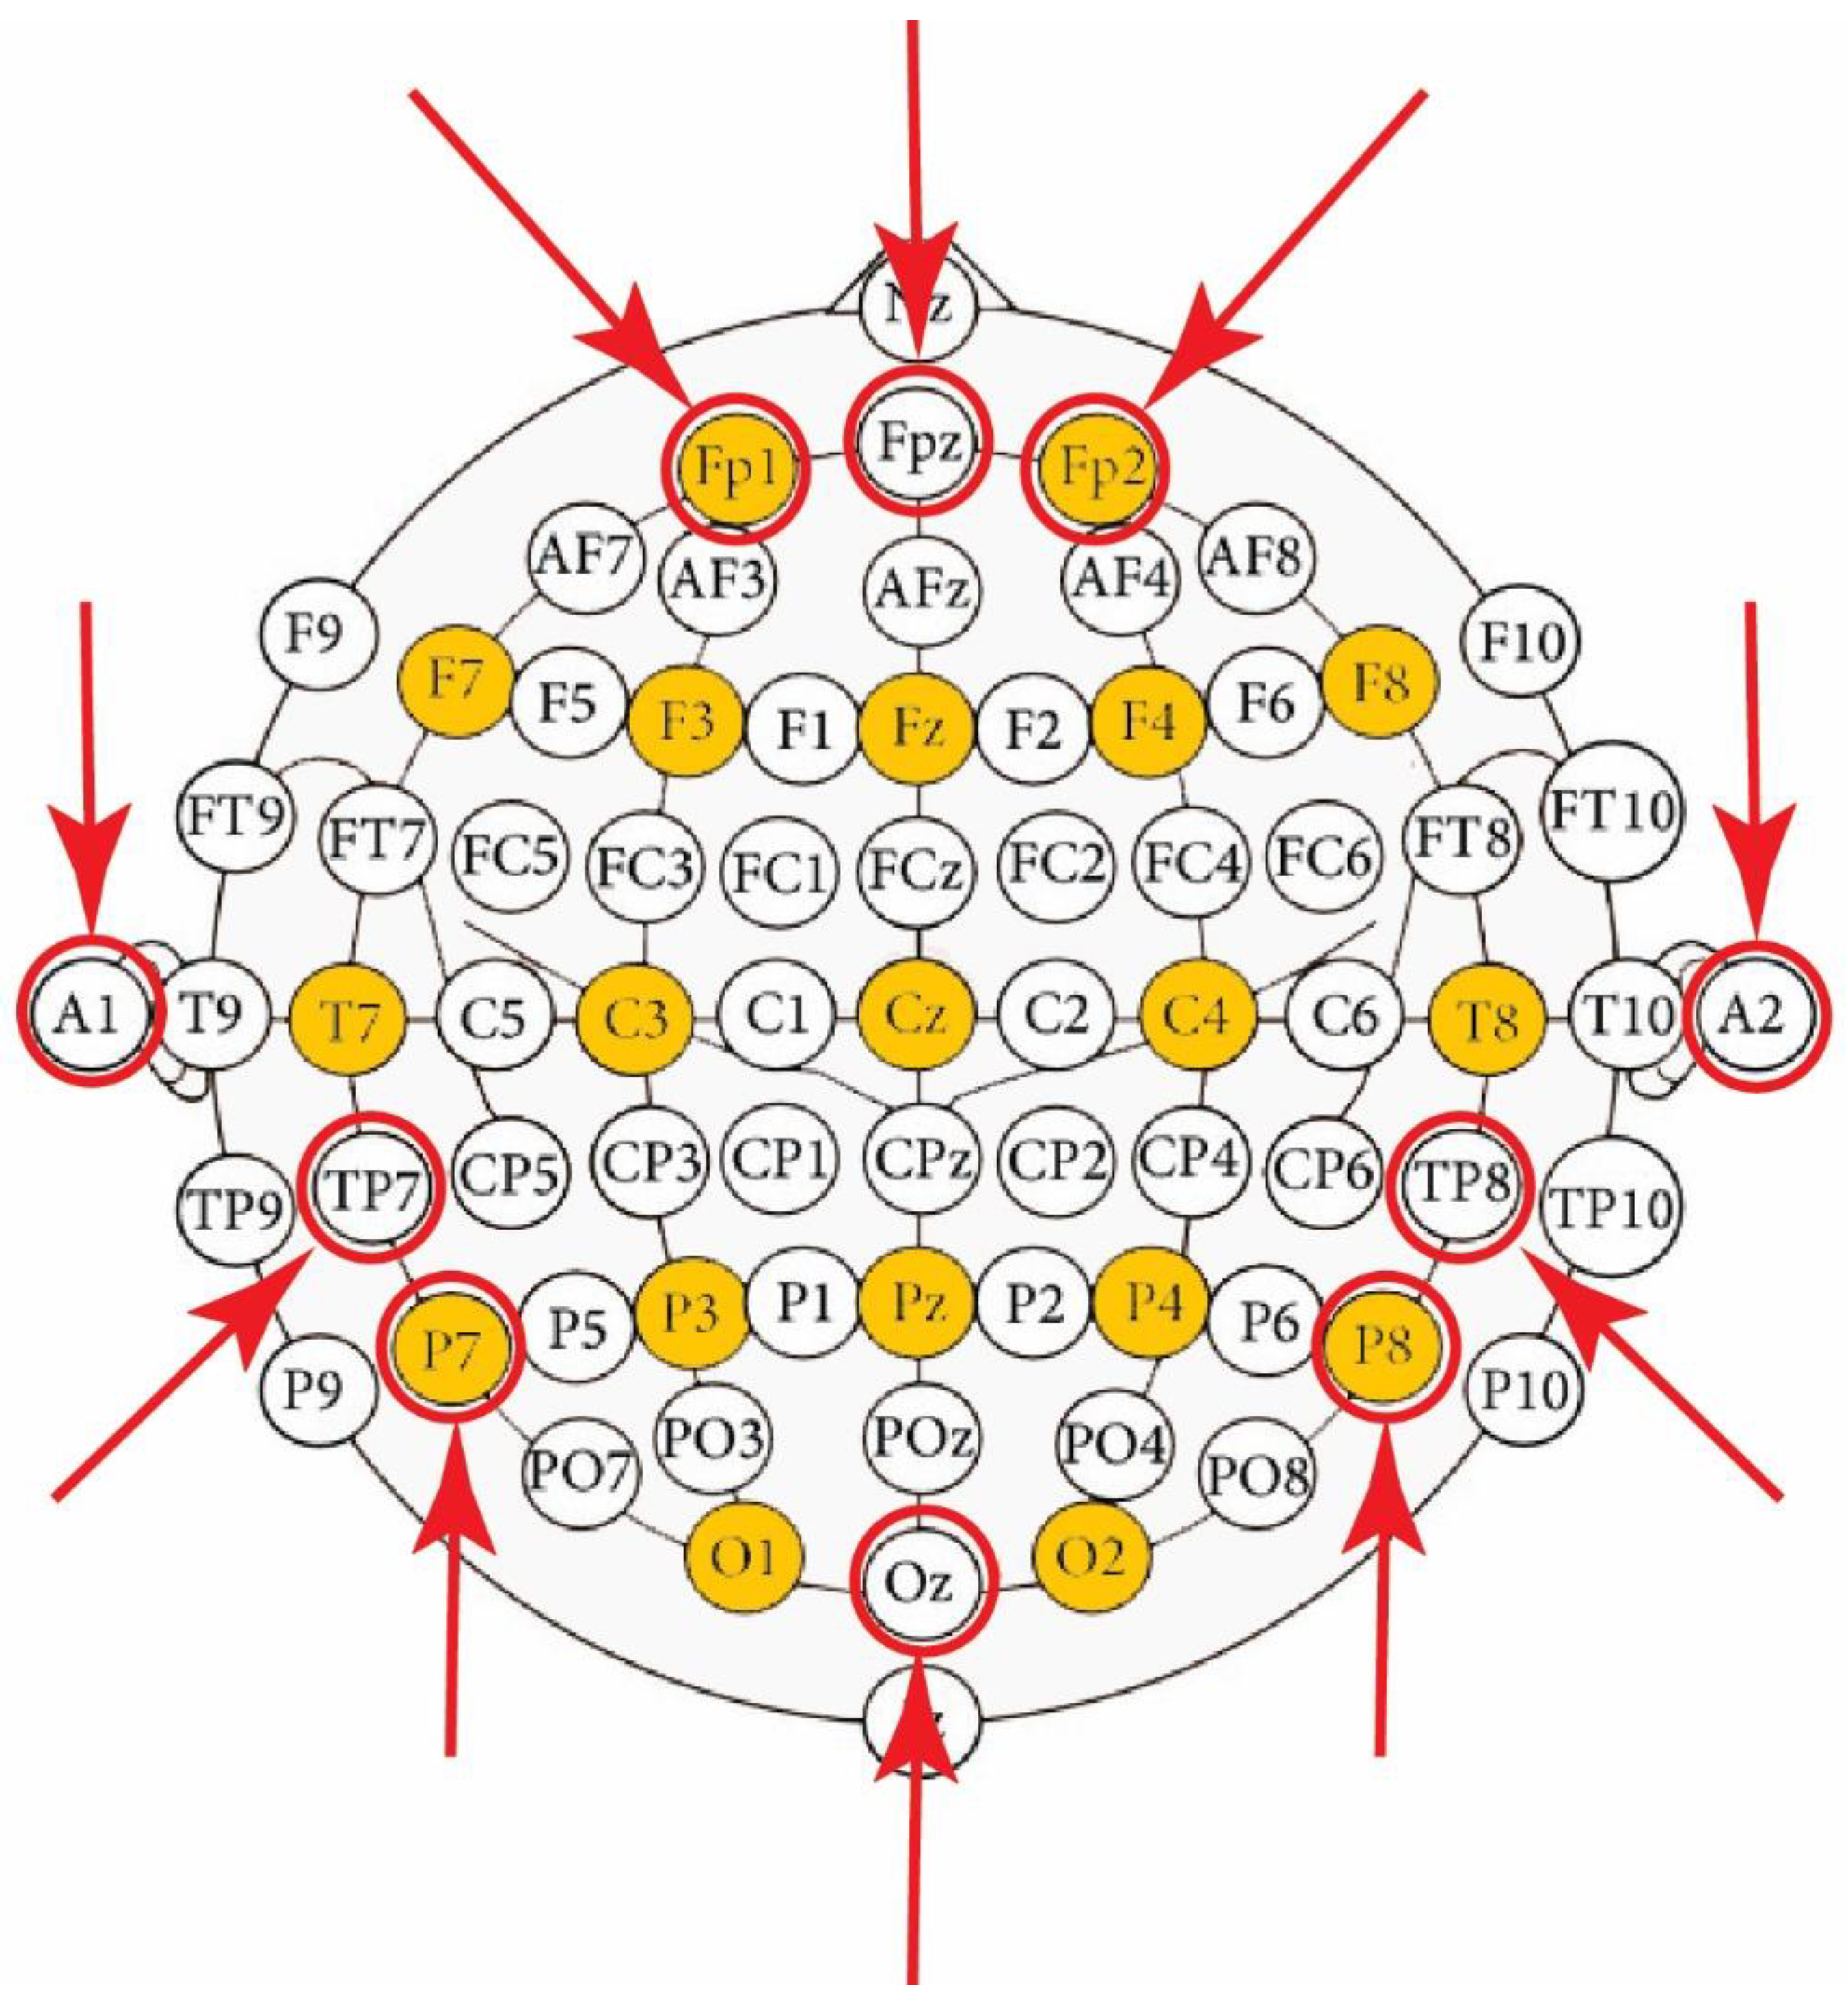
| Electrode Code | Electrode Type | Board Pin | GUI Channel |
|---|---|---|---|
| FP1 | Flat | N1P | 1 |
| FP2 | Flat | N2P | 2 |
| FPZ | Flat | N3P | 3 |
| TP7 | Spikey | N4P | 4 |
| TP8 | Spikey | N5P | 5 |
| P7 | Spikey | N6P | 6 |
| P8 | Spikey | N7P | 7 |
| OZ | Spikey | N8P | 8 |
| A1 | Ear clip | SRB | - |
| A2 | Ear clip | BIAS | - |
| Signal | m | M | µ | σ | p 1 |
|---|---|---|---|---|---|
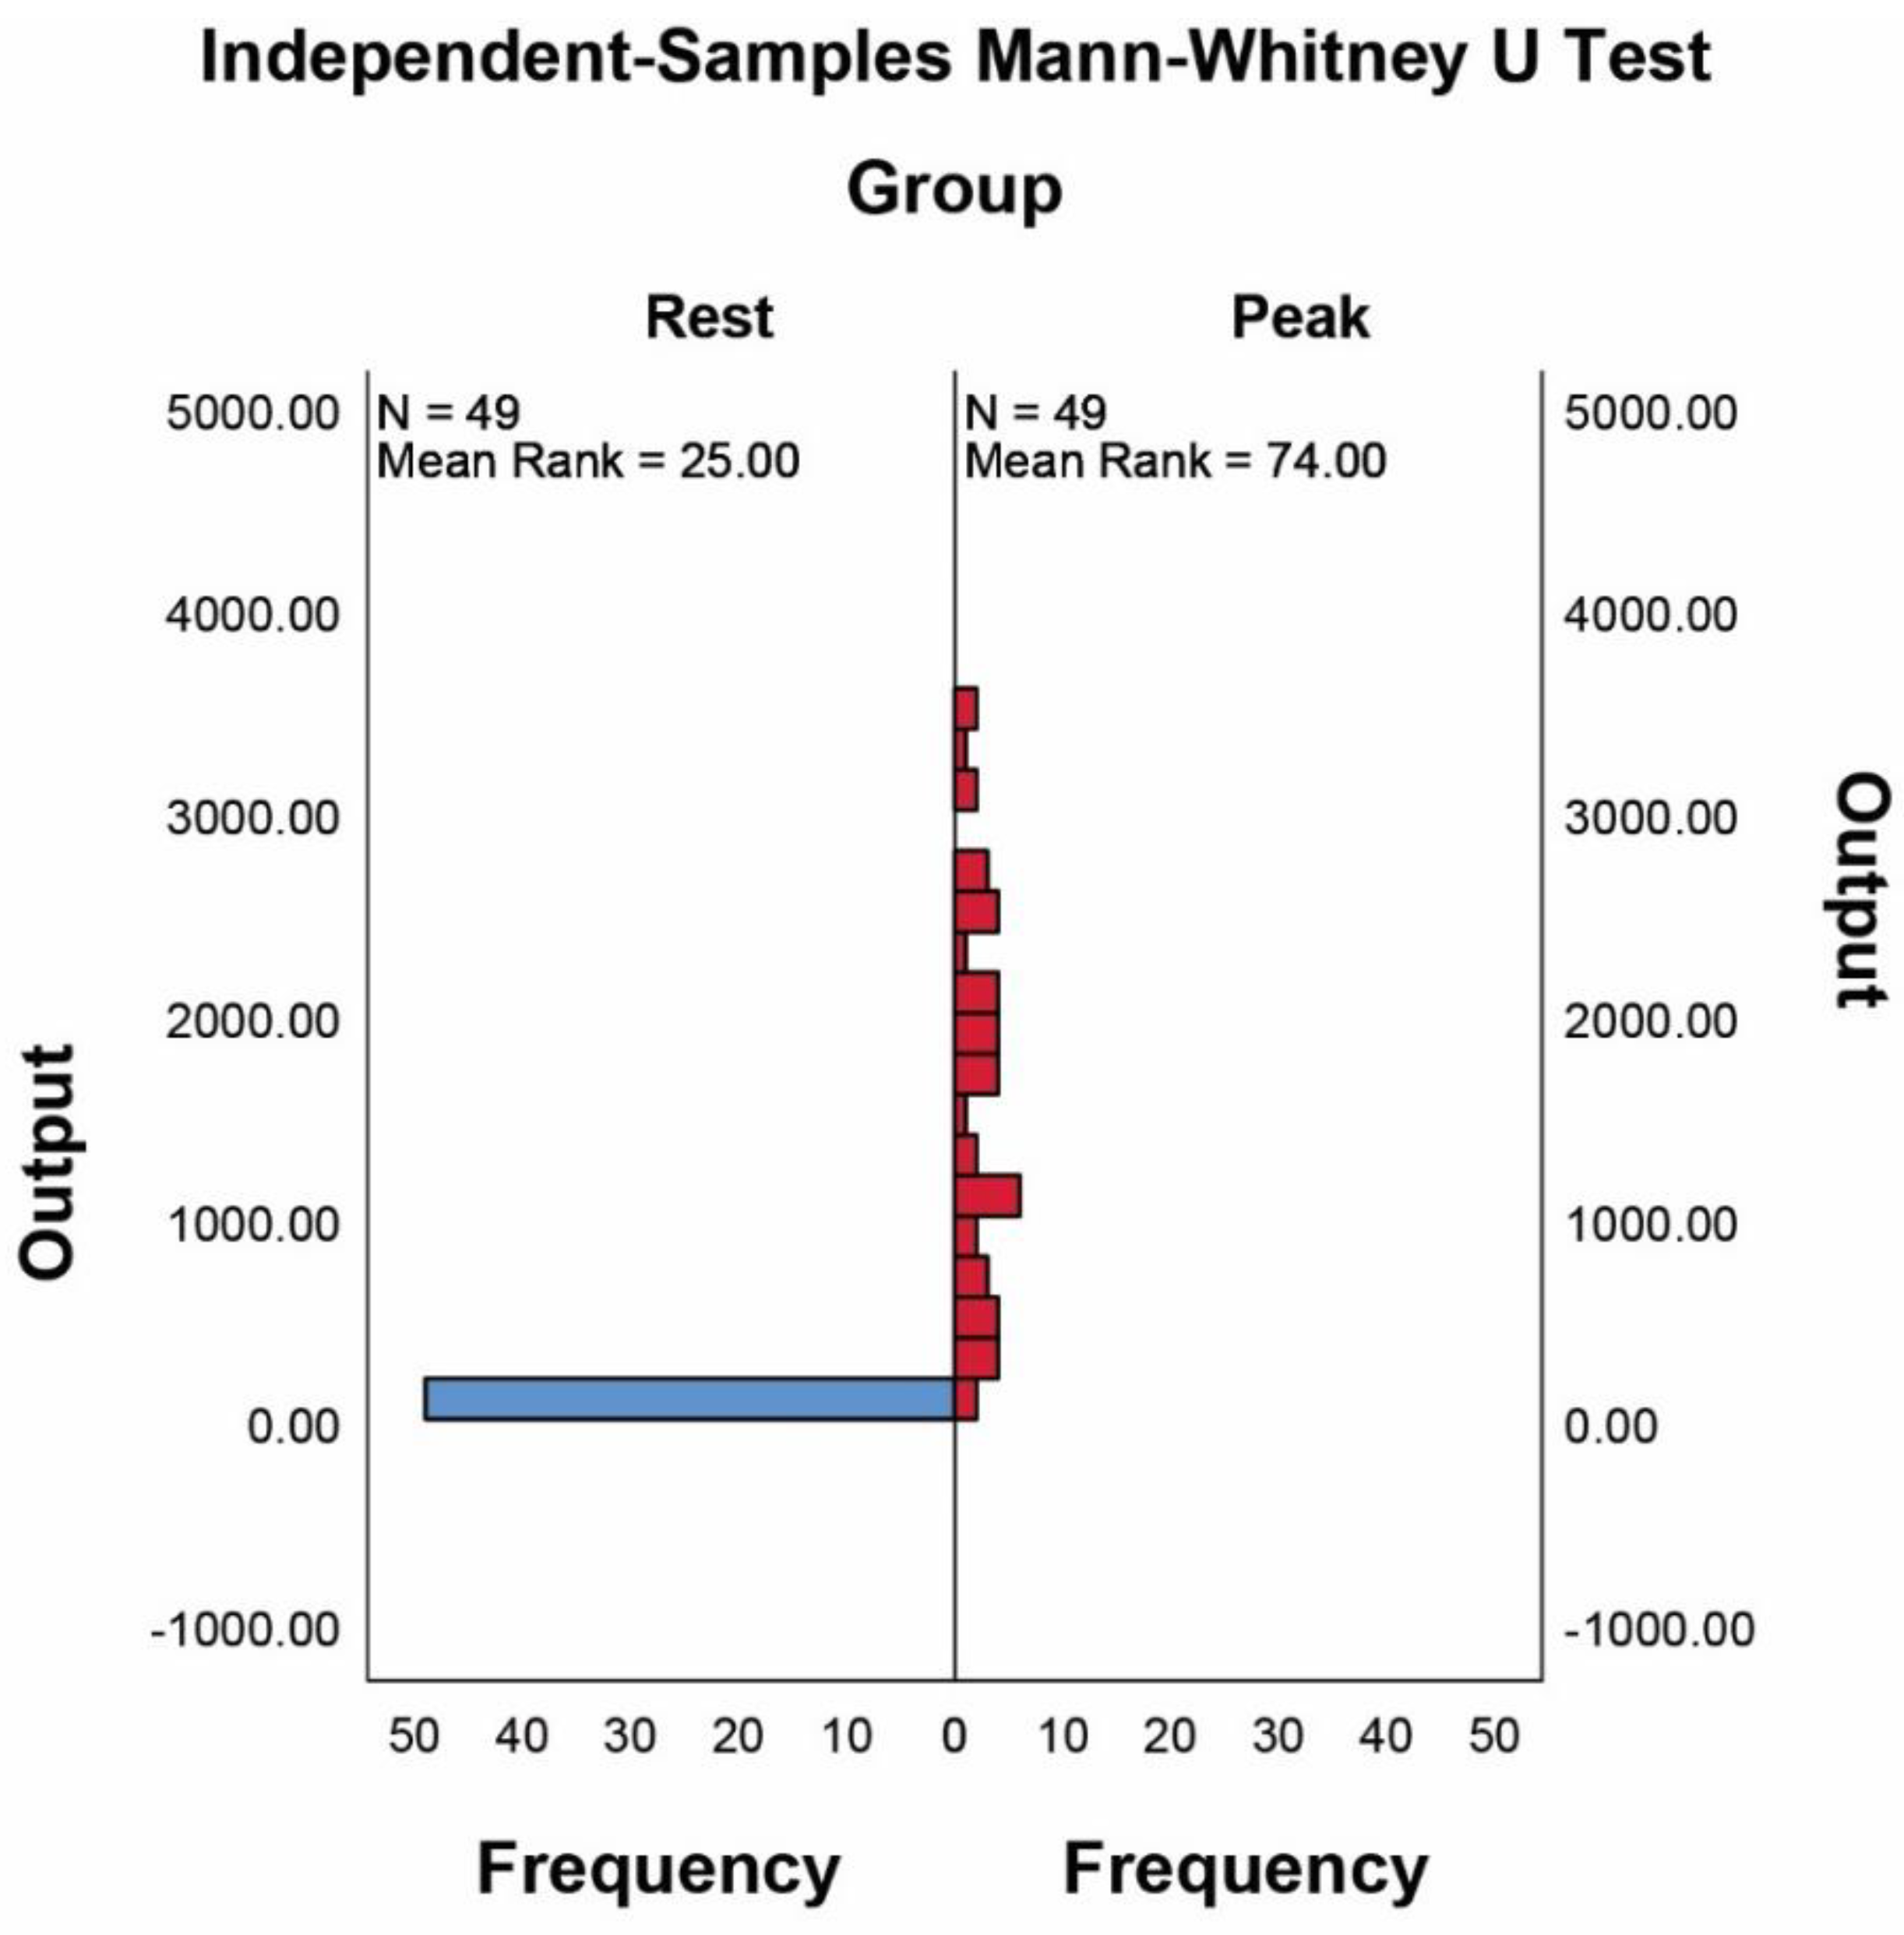
| rest | 0.0043 | 7.9100 | 1.1796 | 1.6861 | - |
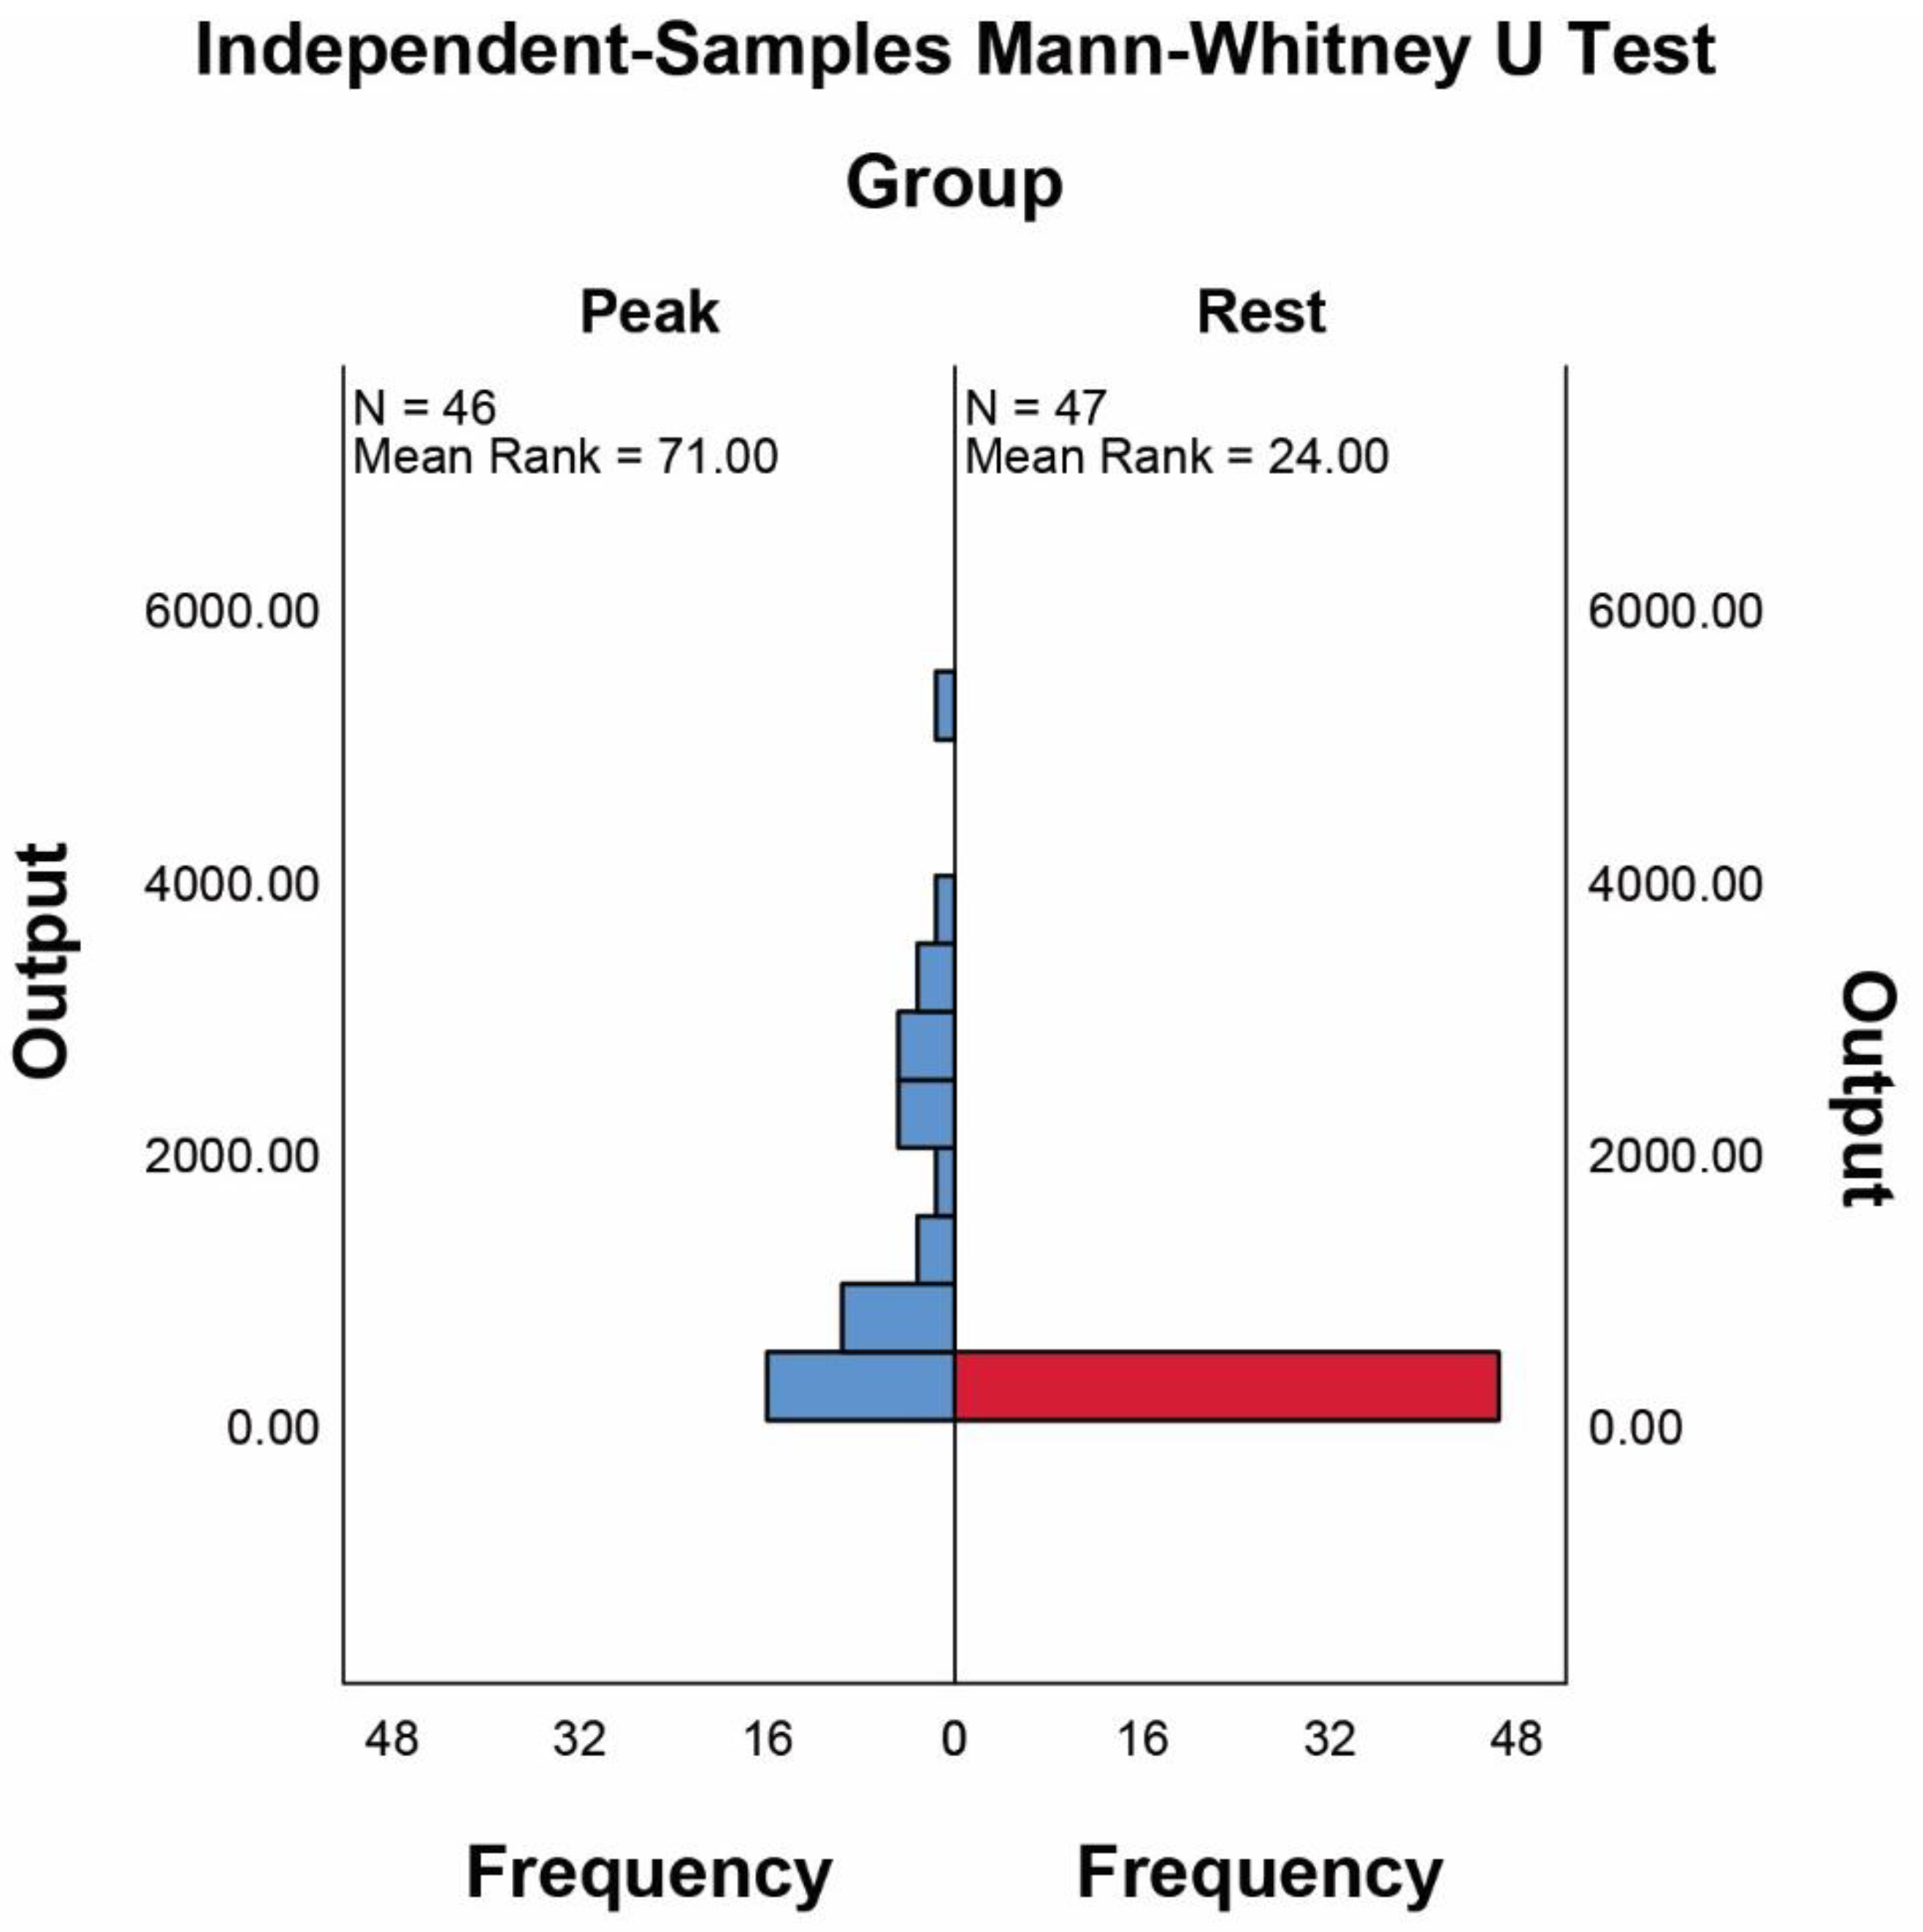
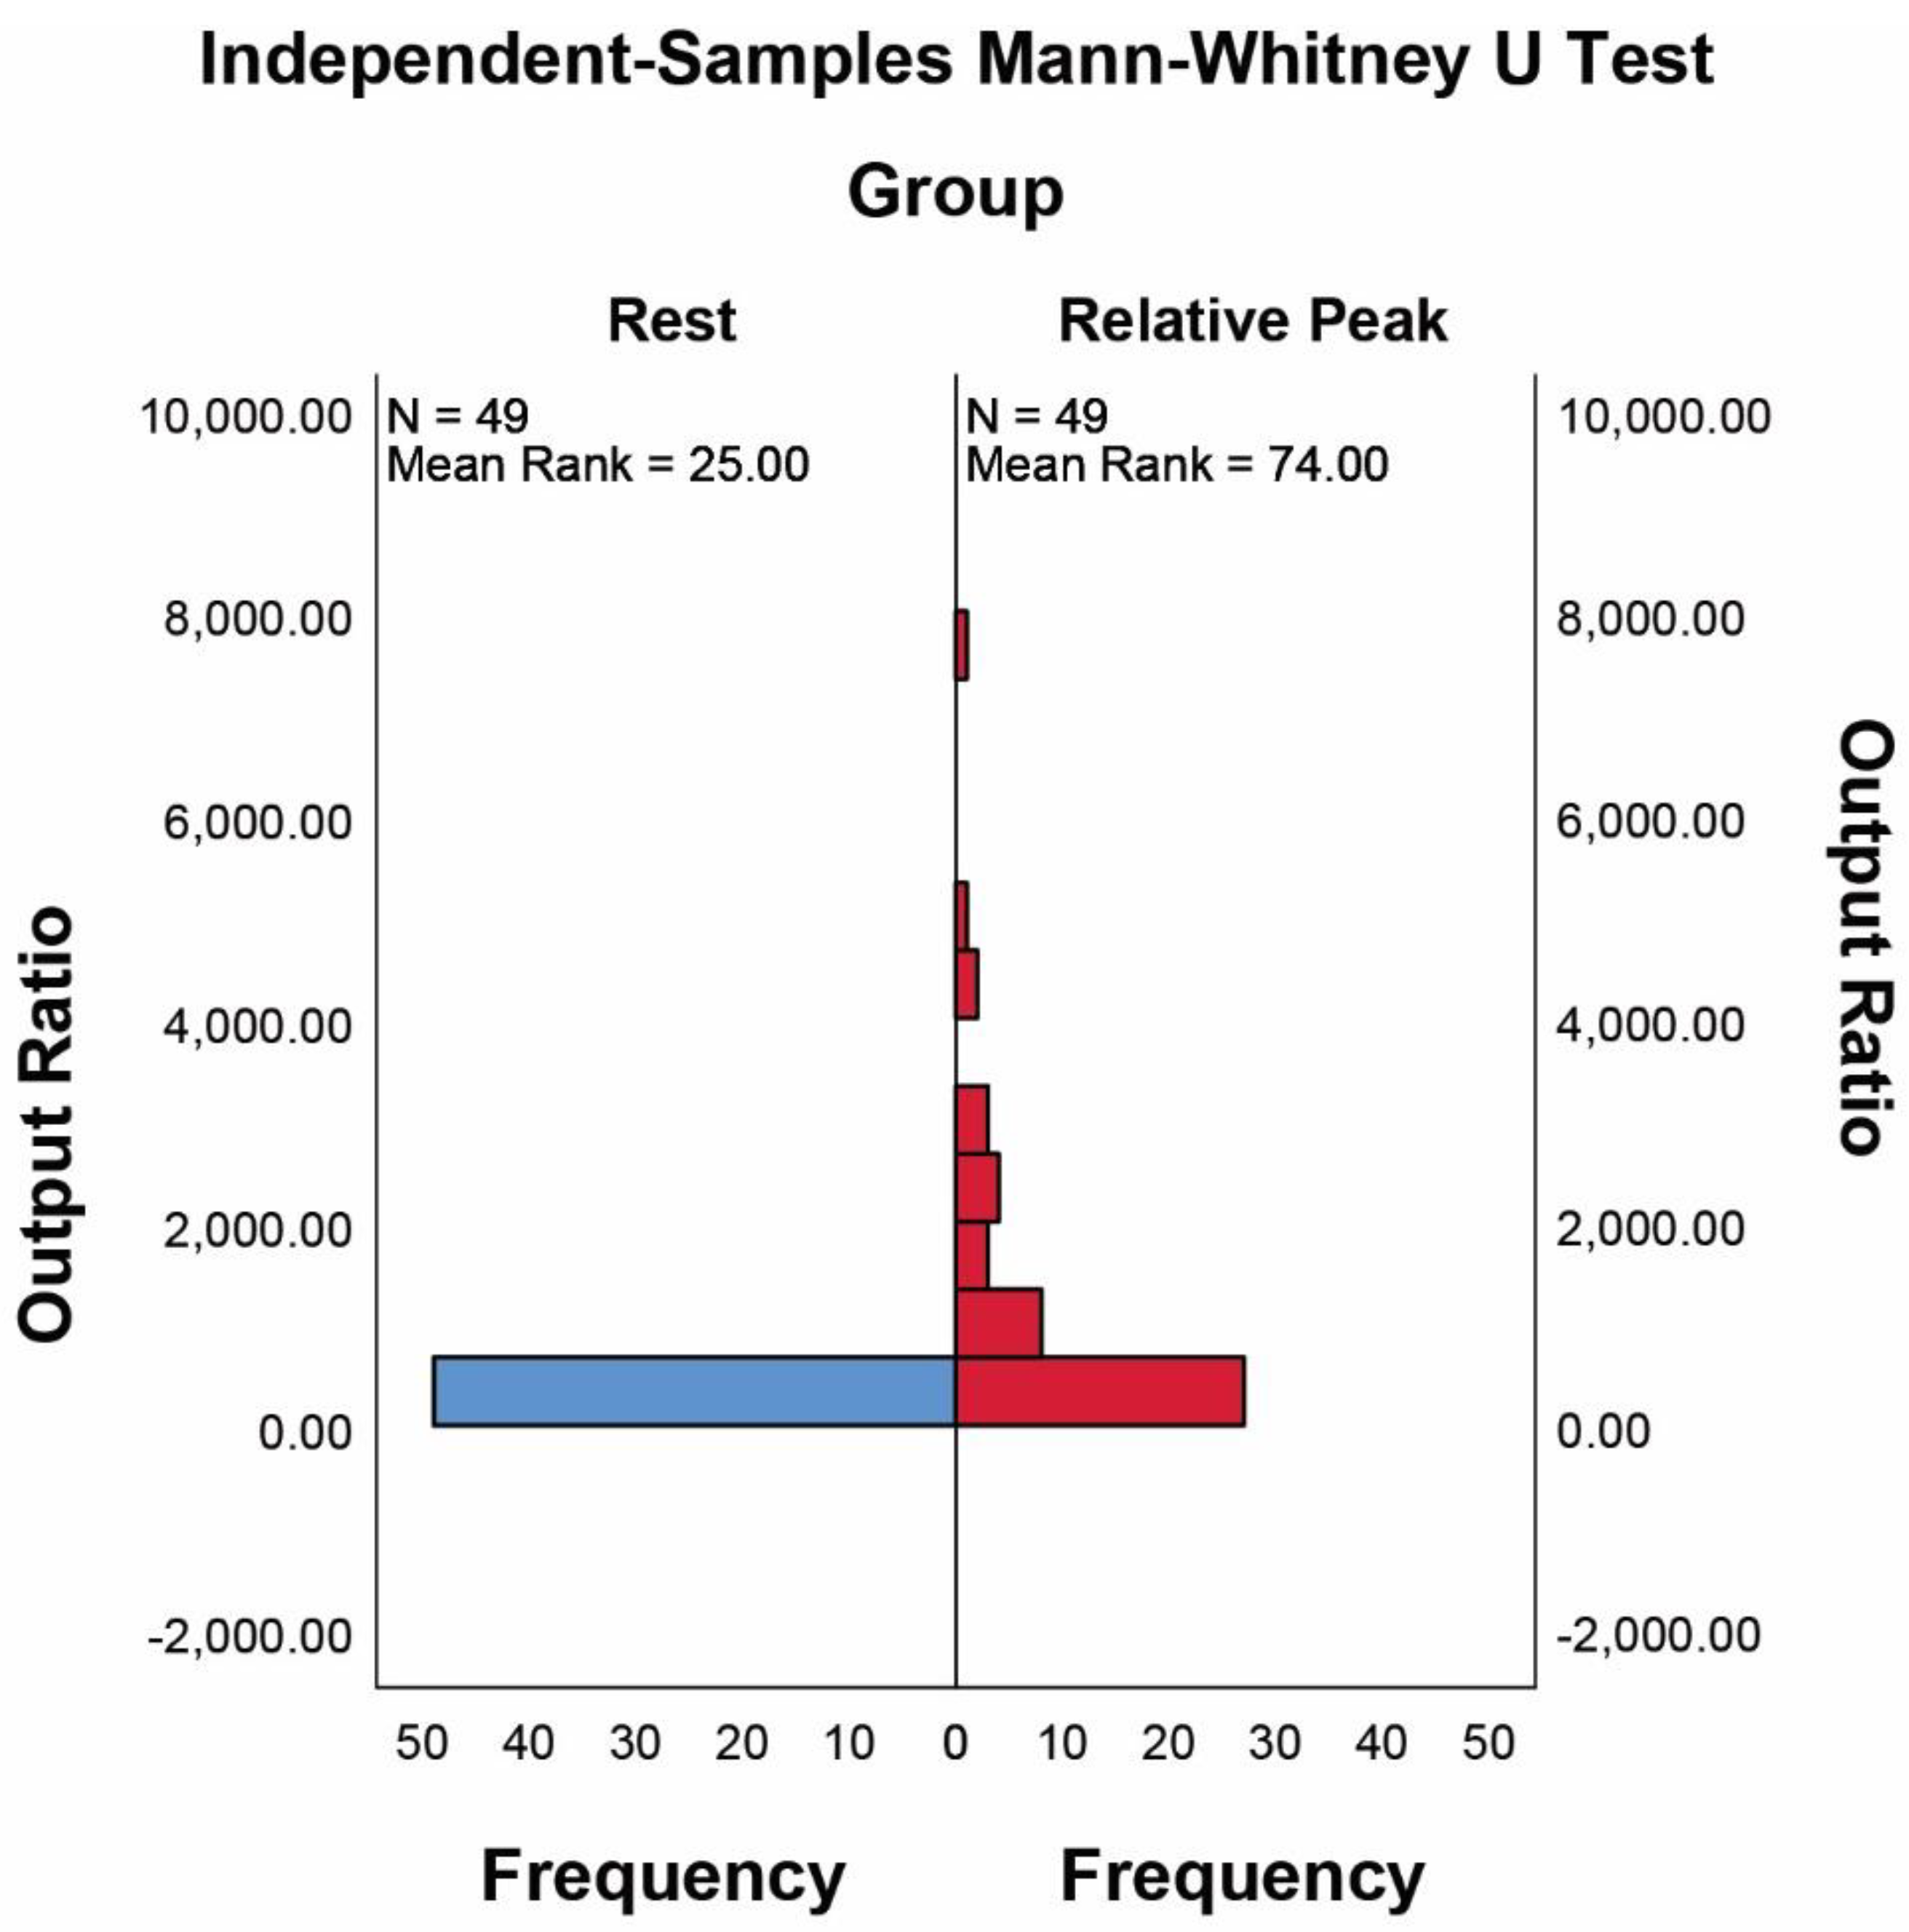
| peak | 53.58 | 5004.4 | 1386.95 | 1362.19 | <0.000 |
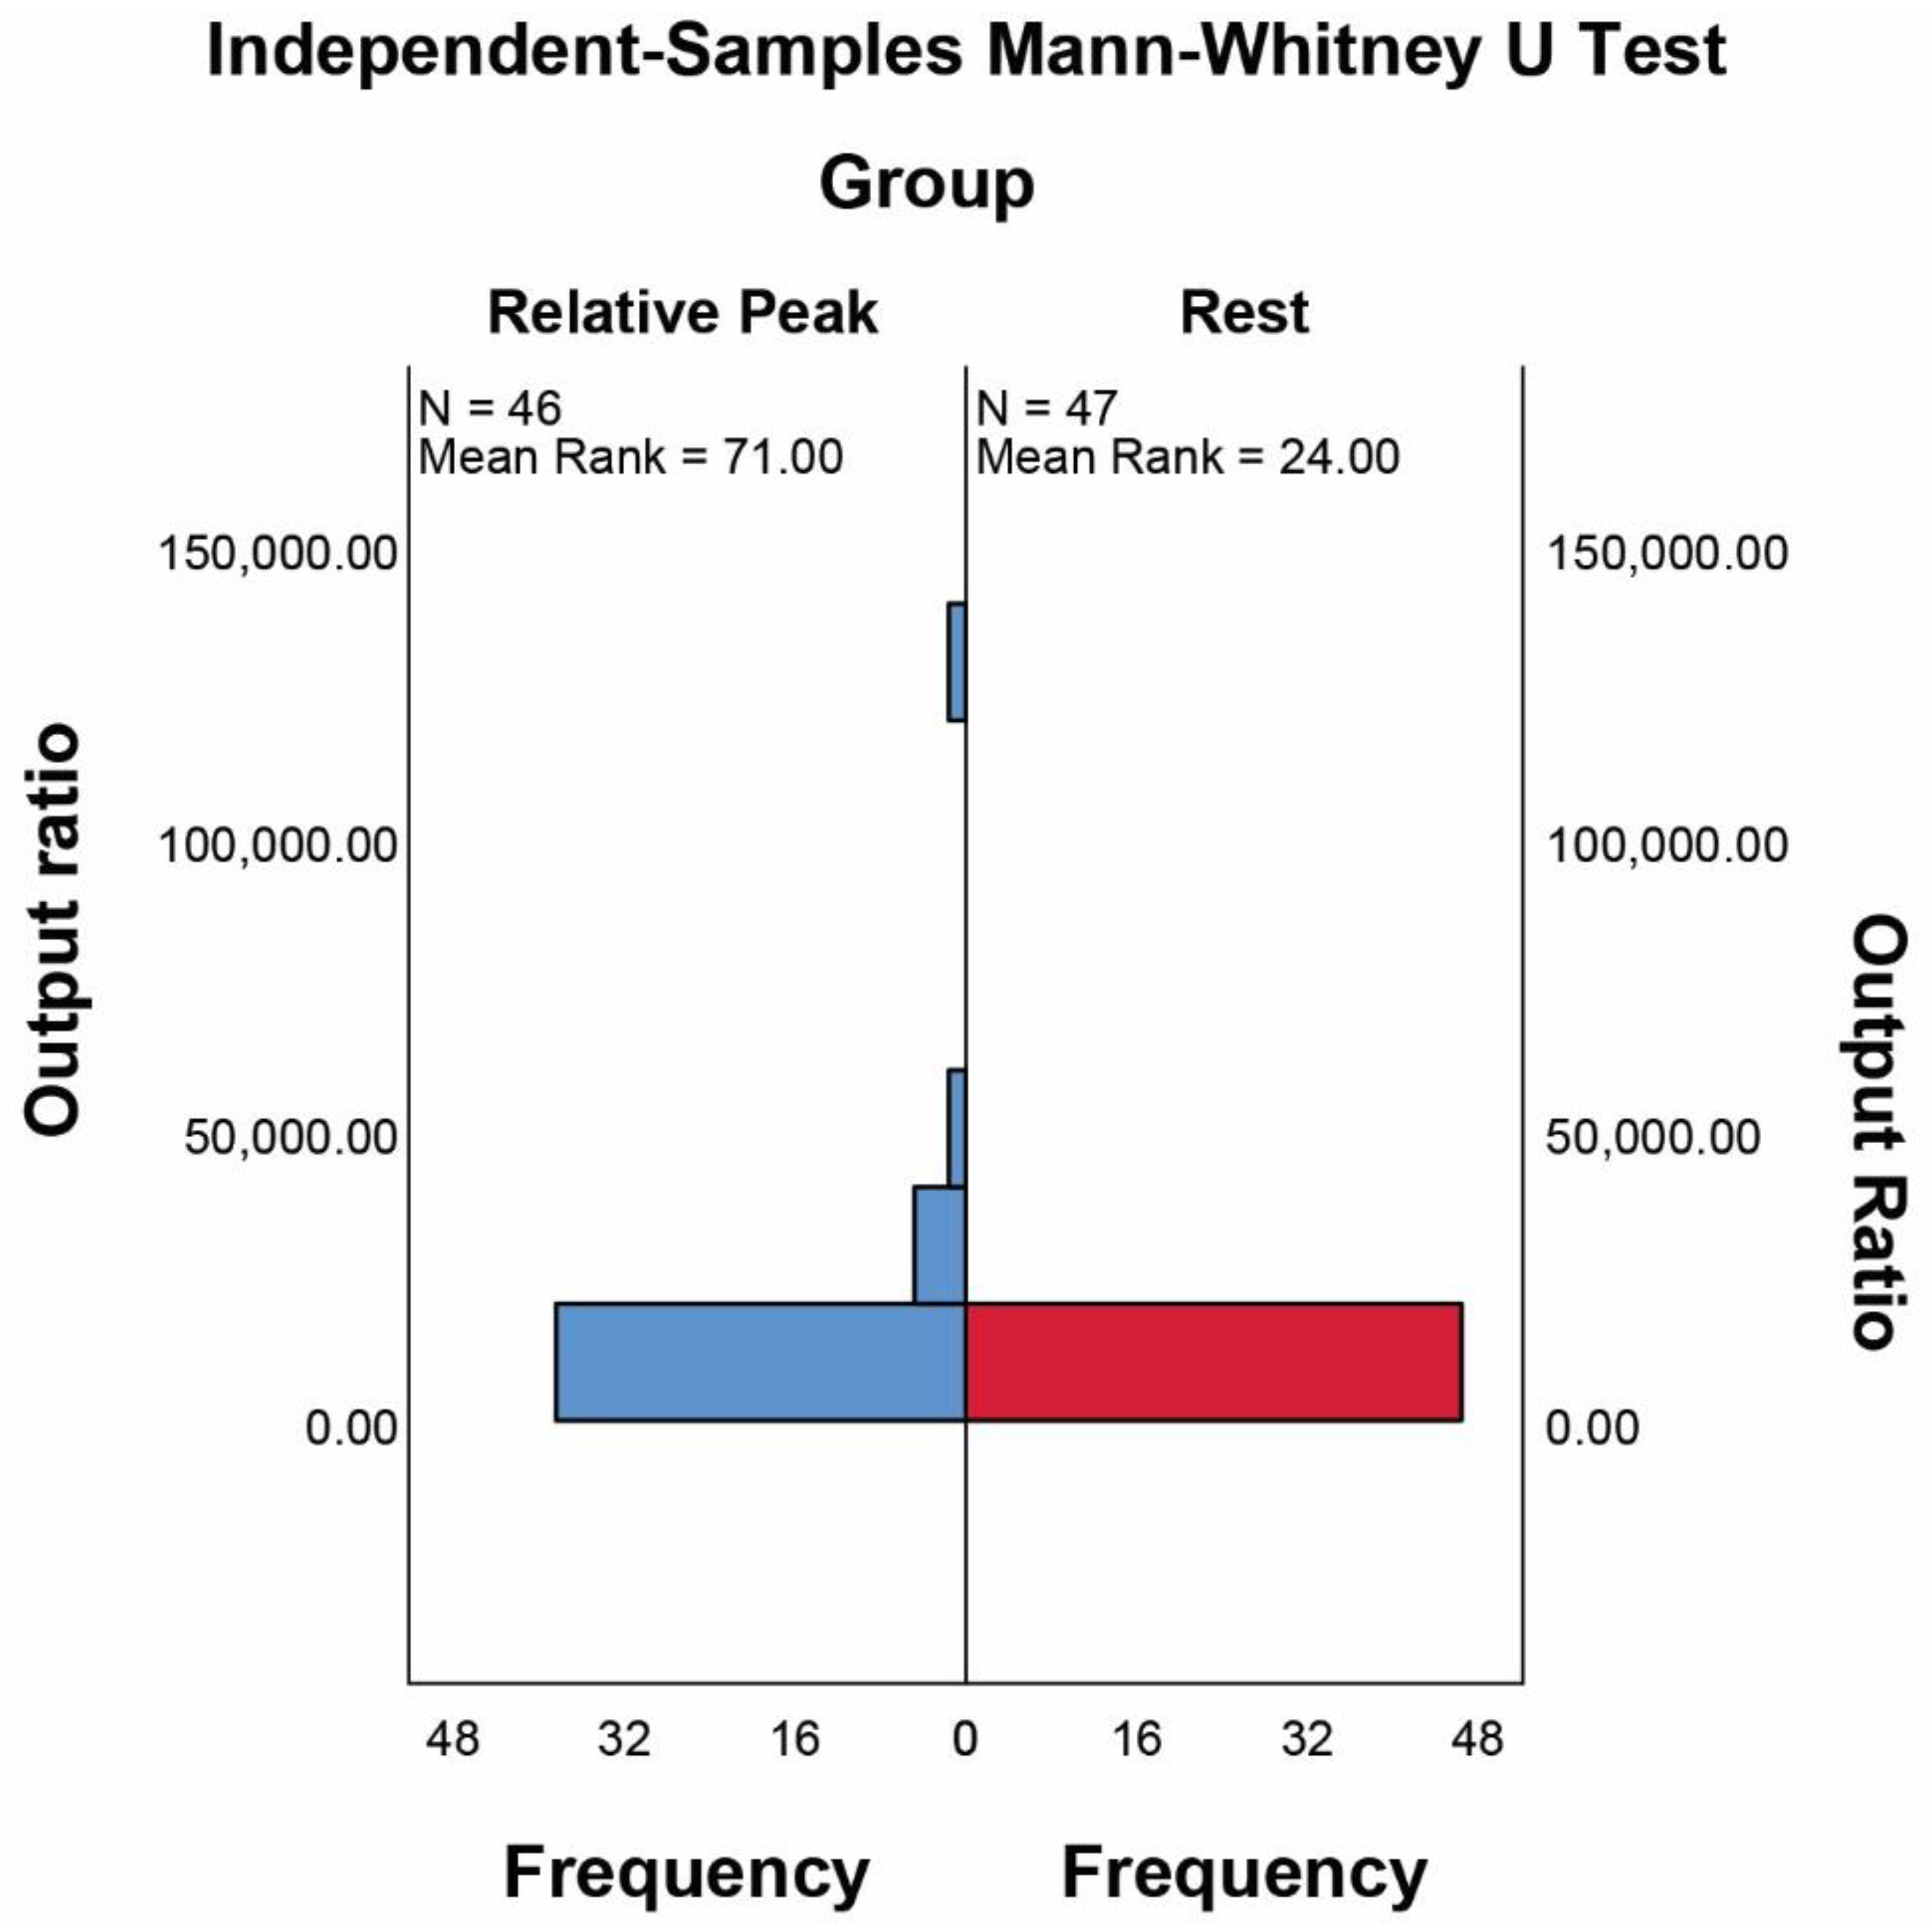
| peak/rest | 69.06 | 127,785.2 | 11,142.21 | 25,189.99 | <0.000 |
| Signal | m | M | µ | σ | p 1 |
|---|---|---|---|---|---|
| rest—group A | 0.1976 | 8.853 | 2.7174 | 2.3624 | - |
| peak group A | 49.03 | 3492.3 | 1578.7 | 961.44 | <10−3 |
| peak/rest A | 33.54 | 7641.8 | 1253.0 | 1526.7 | <10−3 |
| rest—group B | 0.5775 | 8.7525 | 4.732 | 2.459 | 0.287 |
| Signal | m | M | µ | σ | p 1 |
|---|---|---|---|---|---|
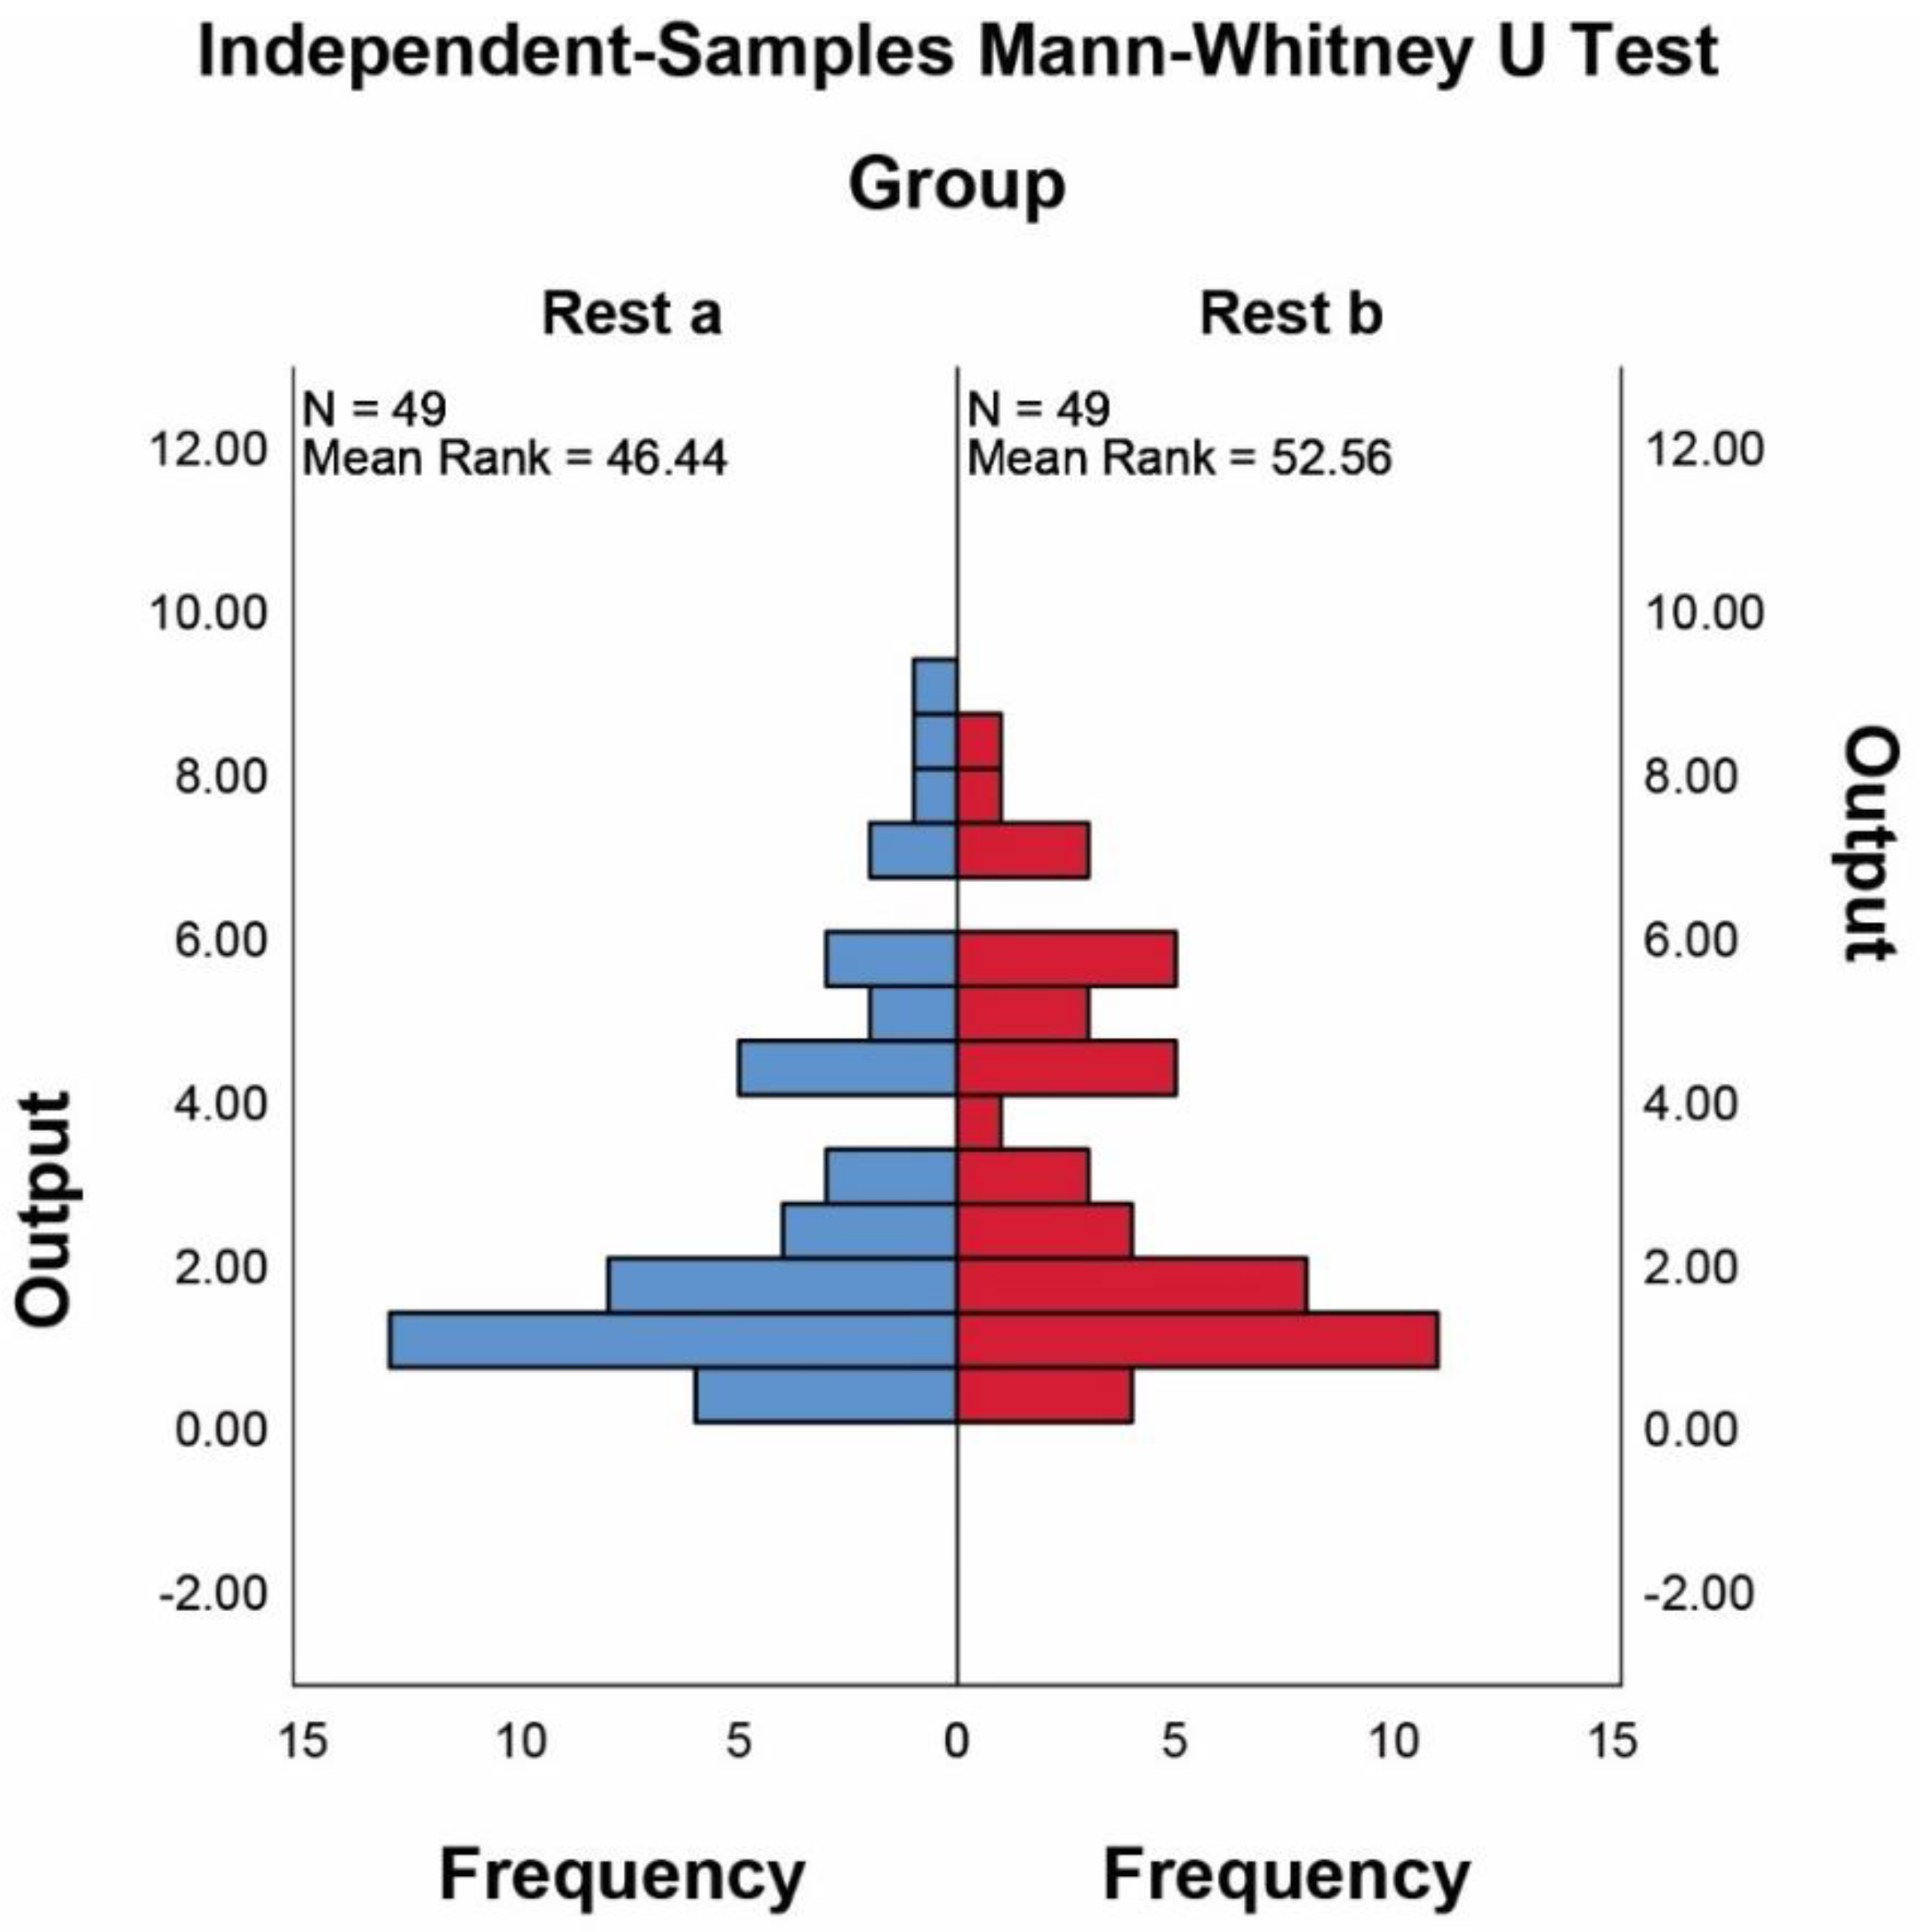
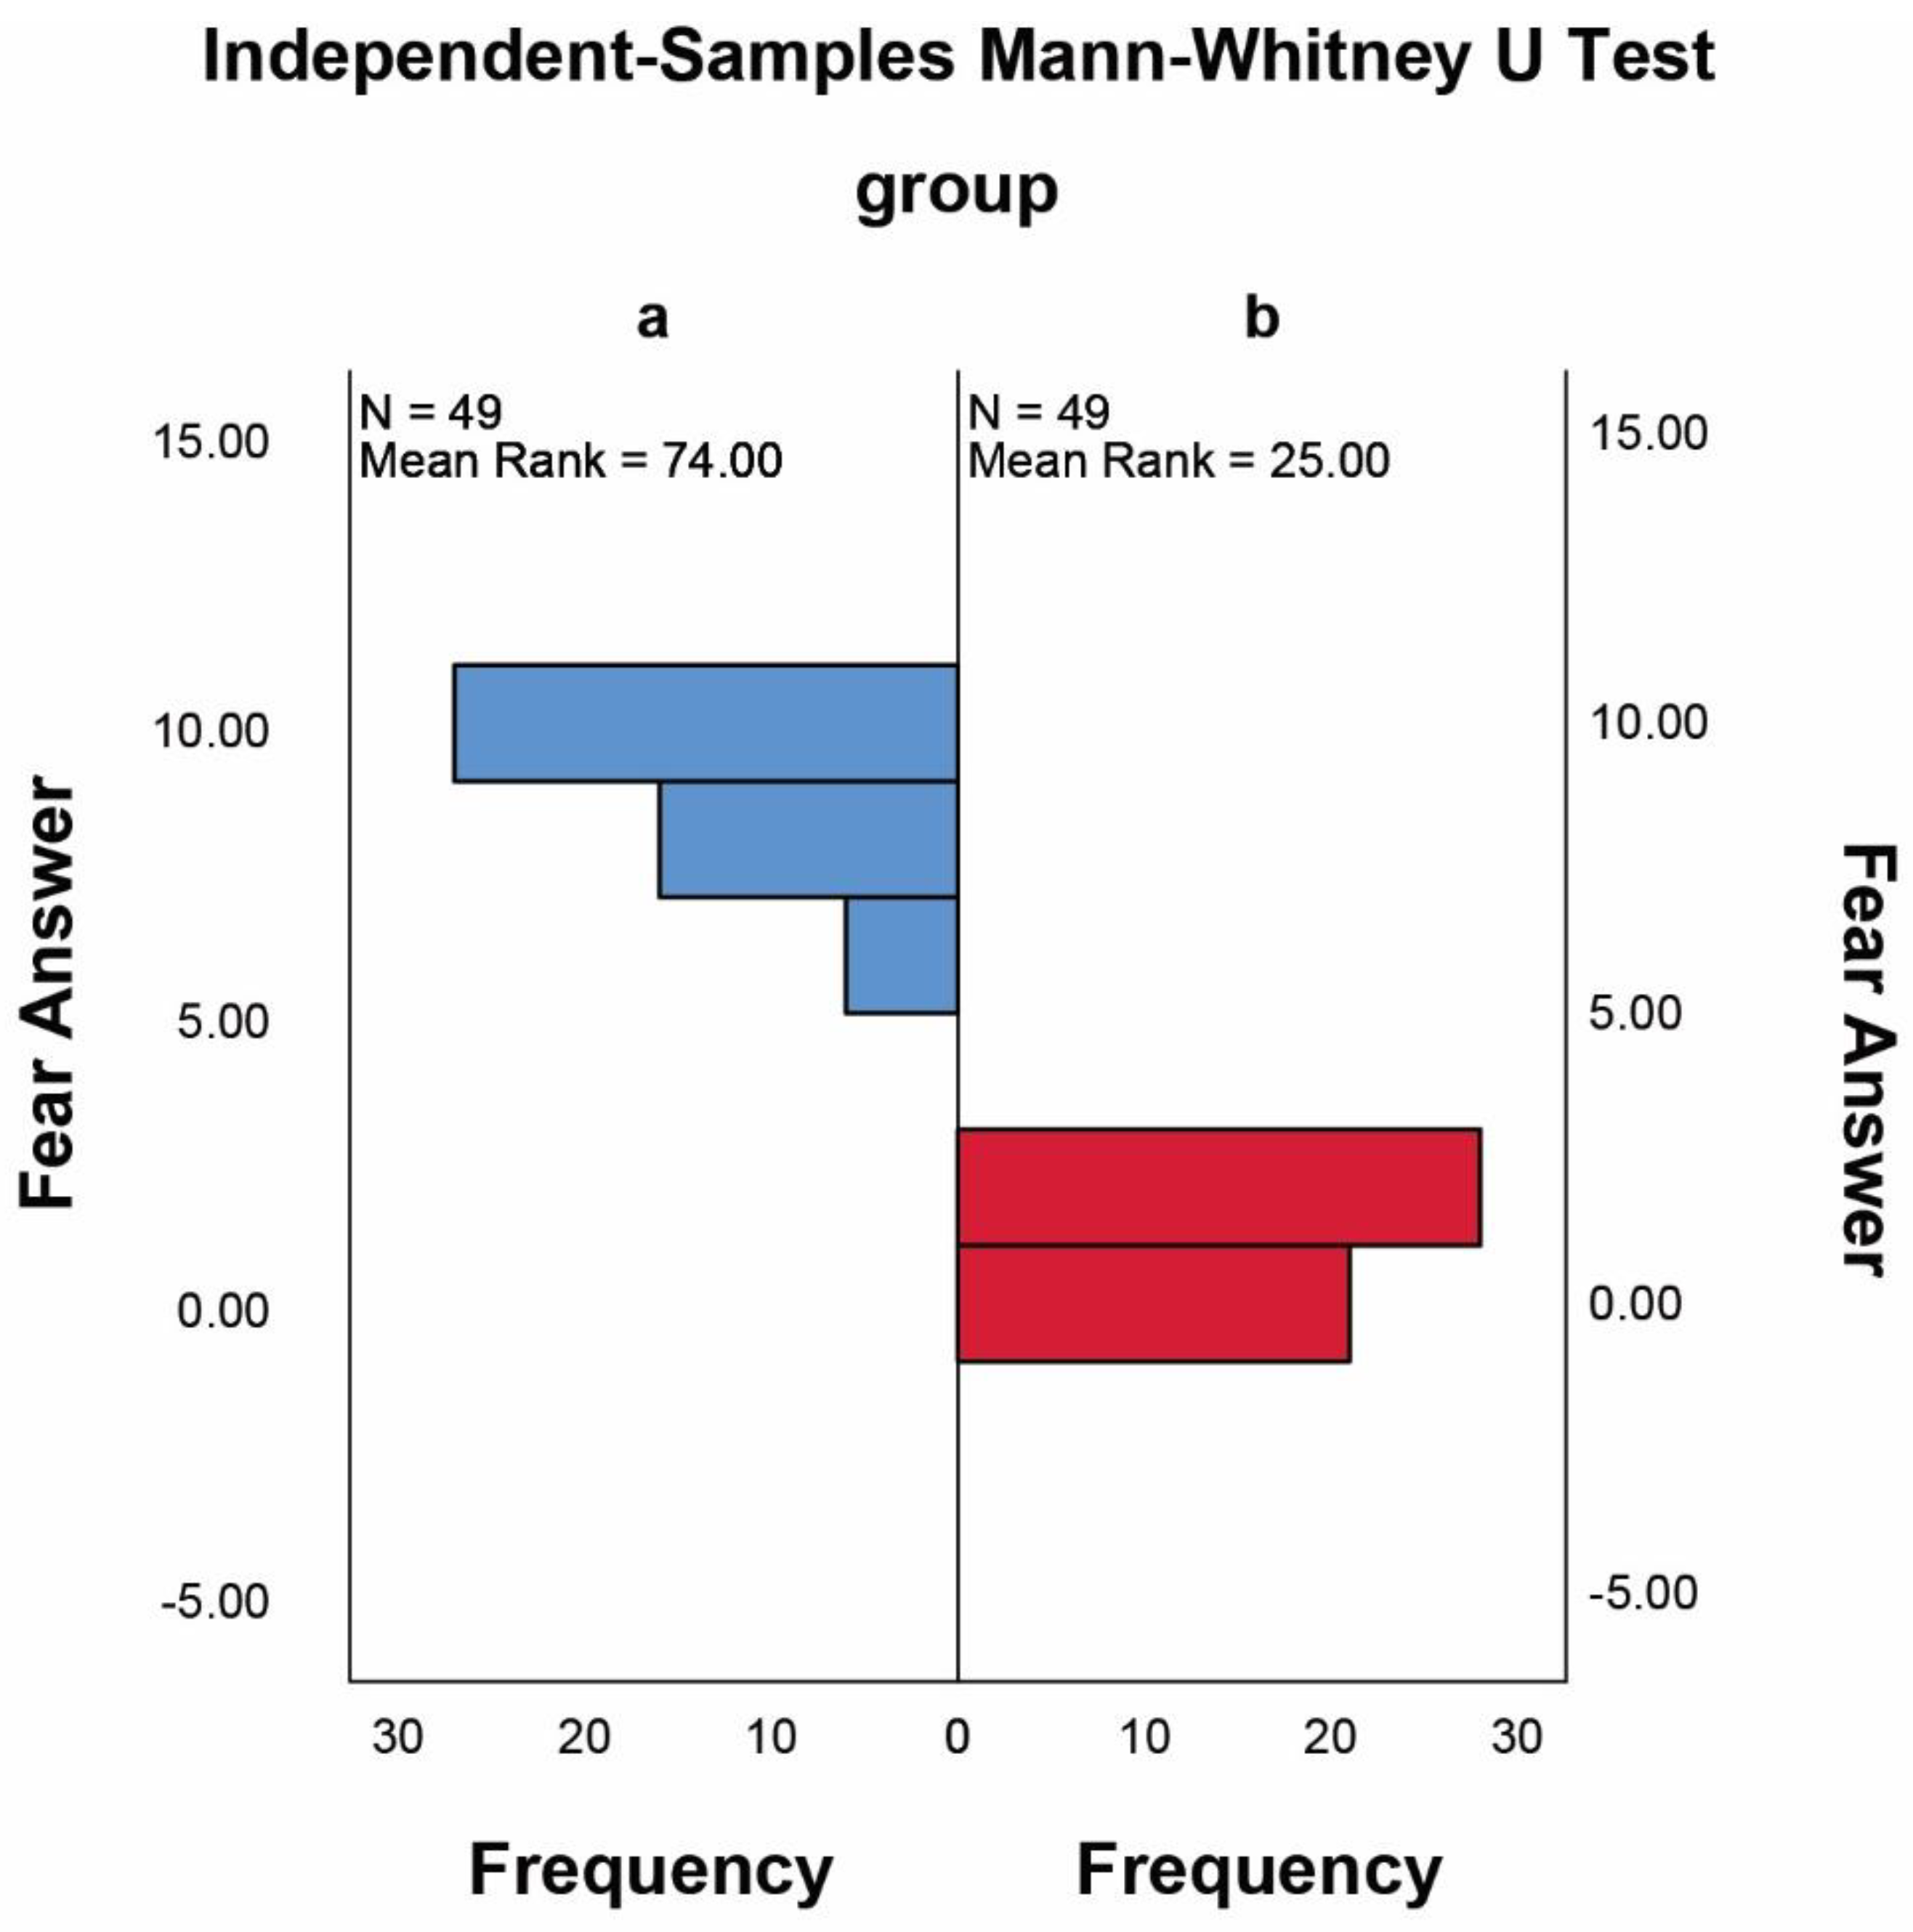
| group A | 6 | 10 | 8.5 | 1.4 | - |
| group B | 0 | 1 | 0.6 | 0.5 | <10−3 |
Publisher’s Note: MDPI stays neutral with regard to jurisdictional claims in published maps and institutional affiliations. |
© 2022 by the authors. Licensee MDPI, Basel, Switzerland. This article is an open access article distributed under the terms and conditions of the Creative Commons Attribution (CC BY) license (https://creativecommons.org/licenses/by/4.0/).
Share and Cite
Borboni, A.; Elamvazuthi, I.; Cusano, N. EEG-Based Empathic Safe Cobot. Machines 2022, 10, 603. https://doi.org/10.3390/machines10080603
Borboni A, Elamvazuthi I, Cusano N. EEG-Based Empathic Safe Cobot. Machines. 2022; 10(8):603. https://doi.org/10.3390/machines10080603
Chicago/Turabian StyleBorboni, Alberto, Irraivan Elamvazuthi, and Nicoletta Cusano. 2022. "EEG-Based Empathic Safe Cobot" Machines 10, no. 8: 603. https://doi.org/10.3390/machines10080603