Article

Text-MCL: Autonomous Mobile Robot Localization in Similar Environment Using Text-Level Semantic Information

1
School of Computer Science and Technology, Chongqing University of Posts and Telecommunications, Chongqing 400065, China
2
School of Information Engineering, Zunyi Normal University, Zunyi 563006, China
3
Advanced Manufacturing and Automatization Engineering Laboratory, Chongqing University of Posts and Telecommunications, Chongqing 400065, China
*
Author to whom correspondence should be addressed.
Machines 2022, 10(3), 169; https://doi.org/10.3390/machines10030169
Submission received: 17 January 2022 / Revised: 18 February 2022 / Accepted: 22 February 2022 / Published: 23 February 2022
(This article belongs to the Section Robotics, Mechatronics and Intelligent Machines)

Abstract

:
Localization is one of the most important issues in mobile robotics, especially when an autonomous mobile robot performs a navigation task. The current and popular occupancy grid map, based on 2D LiDar simultaneous localization and mapping (SLAM), is suitable and easy for path planning, and the adaptive Monte Carlo localization (AMCL) method can realize localization in most of the rooms in indoor environments. However, the conventional method fails to locate the robot when there are similar and repeated geometric structures, like long corridors. To solve this problem, we present Text-MCL, a new method for robot localization based on text information and laser scan data. A coarse-to-fine localization paradigm is used for localization: firstly, we find the coarse place for global localization by finding text-level semantic information, and then get the fine local localization using the Monte Carlo localization (MCL) method based on laser data. Extensive experiments demonstrate that our approach improves the global localization speed and success rate to 96.2% with few particles. In addition, the mobile robot using our proposed approach can recover from robot kidnapping after a short movement, while conventional MCL methods converge to the wrong position.

1. Introduction

As a fundamental capability of an autonomous mobile robot, localization can assist the robot in knowing where it is. In addition, it is prior knowledge for path planning when the mobile robot performs a navigation task [1]. In an indoor environment where a global positioning system (GPS) signal is denied, the active perception method usually builds a map by employing SLAM techniques in advance [2,3], then the mobile robot localizes itself according to the map. The commonly used solution is to use laser SLAM to build a 2D probability occupancy grid map [4]. A 2D laser LiDar, together with an encoder odometer mounted on the mobile robot, are used to construct the map. Then, the mobile robot can localize itself based on the current observations and previously built map. The most commonly used method is MCL, which is based on the particle filter algorithm [5], an implementation of the Bayes filter.
If the rooms or indoor environment have enough geometric features, the conventional MCL method can assist the mobile robot in achieving accurate localization. However, in the real-world environment, especially in structurally man-made high-rise buildings, the layout of the rooms is always along the corridor on every floor, such as office buildings, teaching buildings, the hospital inpatient department, hotels, dormitories, etc. In these similar or geometrically repeated environments [6,7], the mobile robot cannot get correct global localization without a prior known initial pose, and always fails to recover its pose from a robot kidnapping problem. The reason is that the particles may converge on an incorrect location which is similar to other locations. The number of particles is proportional to the scale of the environment. In order to increase the success rate of global localization or pose recovery, more particles are needed to generate as many pose hypotheses as possible. A large number of particles will consume computing power and memory. In addition, to search for a unique location of distance features, the mobile robot should move a long distance. The worst result is that the robot receives a wrong pose after moving from one side of a corridor to another side.
Fortunately, indoor corridors usually have many doors installed on the wall. Furthermore, there are room numbers or nameplates on the doors or near an elevator, as Figure 1 shows. Consequently, the geometric structures are similar or repeated, but the semantic level features are uniquely identifiable. In this paper, we solve the localization difficulties in similar environments by using a coarse-to-fine paradigm, which had been used in many other works [8,9]. We propose an approach that uses text-level semantic information to help mobile robots achieve coarse localization, then employ MCL and laser sensor data to realize fine localization.
The main contributions of this article are as follows:
(1)
We propose a coarse-to-fine localization paradigm for mobile robots in similar environments, especially in the long corridor of a high-rise building. Text-level semantic information is used to give coarse localization, and laser LiDar data together with the MCL method are used for fine localization;
(2)
The camera mounted on the mobile robot does not capture images in real-time nor process them continuously. It depends on the analysis result of the laser data. When the robot is near a door or elevator area, it adjusts the orientation of the camera to capture images with text content in the best perspective. Thus, the computing cost reduces and the detection and recognition accuracy improves;
(3)
A moving strategy is proposed to avoid random walking. This is beneficial to construct a high-quality map with text information. Furthermore, it can help the robot find the door or elevator area and get coarse localization as soon as possible;
(4)
Initialization of only 100 particles is needed to scatter in the doorway area where the nearest text is detected and recognized. Then, the weights of the particles are assigned according to their positions. The traditional MCL method is used in the subsequent moving process. If a new text is detected, the mobile repeats the previous two steps and can recover from robot kidnapping. Experimental results show that the Text-MCL approach can achieve a 96.2% successful localization rate and can relocate from robot kidnapping after a short movement, while the conventional method always fails.
The rest of the paper is organized as follows. Section 2 gives an overview of related work. Section 3 describes each step in the coarse-to-fine framework for robot localization. Section 4 presents the experimental results. Section 5 is the discussion and conclusions.

2. Related Work

2.1. Mapping and Localization

When a mobile robot moves into an unknown indoor environment, SLAM techniques can be used to build a map for localization. Currently, there are two mainstream methods of 2D laser LiDar SLAM, one is the filtering approach, the other is graph optimization [10]. The filter-based method is a two-step iterative procedure derived from the Bayesian filter [11]. EKF SLAM is one of the popular filter approaches, which was firstly used in sonar sensors using the Extended Kalman Filter and can also be extended to LiDar and camera sensors [12,13]. Other similar Kalman series are the unscented Kalman filter and adaptive Kalman filter method [14]. However, these methods need a Gaussian noise assumption and cannot deal with multi-modal distributions. Another branch of filter solutions is the particle filter which can solve any type of probability distribution, nonlinear and non-stationary problem [15]. A typical work of particle filter SLAM is Gmapping [16], which improved the proposal distribution and adaptive resampling of the Rao–Blackwellized particle filter [17]. The latter firstly estimates the trajectory of the mobile robot and then computes the map given that trajectory. The graph optimization SLAM solutions utilize a set of nodes to represent environmental landmarks and robot poses and use edges of a graph to represent those constraints of observations. Cartographer is a representative project of graph-based SLAM solutions [18] and is implemented by Google’s engineers. Additionally, both Gmapping and Cartographer are integrated into the Robot Operating System (ROS) as the third-party software packages.
Localization refers to a mobile robot achieving its position and orientation relative to the world coordinate system and usually has three modes that are global localization, local localization and robot kidnapping [19]. Global localization means the robot does not know its initial pose and should be solved by combining motion data and observation data. Local localization, also called pose tracking, requires a known initial pose, then the mobile robot tracks the pose according to the state information. Robot kidnapping means a moving robot is kidnapped to another place in a short time, or the mobile robot restarts in a new place away from the position previously stopped at. However, the mobile robot does not know this is happening and moves with a wrong pose estimation. To recover from this kidnapped robot problem, an upgraded version of global localization needs to be performed. Though the EKF-based methods can deal with part of the localization problem [20], especially pose tracking issues, they cannot solve all localization problems. In contrast, the Monte Carlo approach using the particle filter to realize the non-parametric implementation of the recursive Bayes filter is suitable to deal with the three localization modes. Thrun et al. used the MCL method to realize mobile robot localization, though the sensor data are noisy [21]. The MCL series methods can realize multi-modal beliefs and have many advantages but still fail when they encounter similar environments or repeated geometric structures. Therefore, it is necessary to introduce other sensor data or features to assist mobile robot localization, such as visual features [22] or text information.

2.2. Text Extraction and Application in Mobile Robotics

Scene text extraction is one of the most popular research topics in the computer vision field and usually consists of two parts, text detection and text recognition. Both of the two procedures can be solved using traditional algorithms or deep learning methods. Text detection is to distinguish text regions from the background of an image, while text recognition means a classification of each character region. For those simple text scenarios with only Arabic numerals or letters, and limited computing capacity, traditional manually designed methods are suitable for use. Most of the traditional text detection methods use connected components analysis or sliding window-based classification [23]. Neumann et al. [24] assumed chromatic consistency within each character and proposed the maximally stable extremal (MSER) region approach to detect the text regions. Epshtein et al. [25] assumed consistent stroke width with each character and presented the stroke width transform (SWT) method, which had a good performance. The sliding window classification methods utilized differently sized widows to slide over the input image and decide if each window was a text segment or not [26]. After the text regions had been detected, traditional text recognition mainly used the hand-crafted features method to recognize character content, such as the support vector machine (SVM) and similar machine learning algorithms or decomposed the procedure into several sub-problems [23,27]. Several open-sourced optical character recognition (OCR) engines can be used to recognize text content in simple scenes, such as Tesseract [28], Google Docs OCR [29], etc.
If the scene texts have various fonts, multi-oriented directions, curved directions, uneven illumination, or multilingual or perspective transformation, then deep learning-based approaches are proposed to tackle these problems with the development of large computing devices, e.g., GPU. In the text detection phase, many excellent works are inspired by the object detection idea of the computer vision research field, such as TextBoxes [30,31], the connectionist Text Proposal Network (CTPN) [32] and EAST [33]. In the recognition phase, the main approaches consist of CNN and RNN frameworks, such as CNN, Seq2Seq attention model [34] and CRNN [35]. Currently, there are also research works focused on a one-stage end-to-end system that can handle text detection and recognition in a single pipeline [36].
There are several works focused on text information for localization problems. Tomono et al. [37] used object and character recognition to achieve mobile robot navigation in indoor environments, especially a corridor scene. They built models of doors and text plates by using line features extracted from images in advance, and then searched a door followed by the text extraction step in the localization phase. However, the successful localization rate was not very high, and the use of ultrasonic sensors was not suitable for constructing the geometric grid map which makes path planning simple and is easy to extend to an inside-room scene. Radwan et al. [38] firstly utilized geo-referenced texts for global localization in public maps. They employed text information of the shop and street names to achieve accurate positioning in urban environments. A compass and RGB camera were used to get direction indications and image landmarks. However, the position errors were too large, reaching from 10–20 m when compared with GPS results. Besides, at least two landmarks with text regions were needed to solve the discrete locations for localization, which are not applicable for continuous positioning. Inspired by these works, our approach consists of MCL and text-level semantic information to realize robust and accurate localization tasks.

3. Methods

The room layout varies in different buildings; along the corridor, there are single-row rooms on one side or double-row rooms on both sides. In addition, there are many categories of corridors, for instance, straight line-shaped corridors, L-shaped corridors and loop-shaped ones. Though the corridors and room layouts are complex, we can consider them as a simple combination of multiple linear corridors and single-row room layouts. One more phenomenon is that different floors in a high-rise building usually have the same room layout and corridor type. We simplified the problem to a single straight corridor with single-row rooms on one side of the corridor, which is commonly seen in many buildings.

3.1. Strategy of the Robot Movement

In order to avoid random movement in the environment, the mobile robot needs to move according to a strategy, especially for an autonomous robot. In this article, the data from a 2D laser range finder is used for basic decision-making in indoor scenes. Before making a moving strategy, we should make some definitions and explanations. Figure 2 shows a basic situation where the robot moves on one of the floors in a building. Figure 2a shows that the mobile robot gets the same laser scans data in two different locations, A and B. If the mobile robot has no more sensors to extract other information around the locations, it cannot localize itself because of the similar laser sensor data. Most of the 2D laser range finders can measure distances between the center of the sensor and the obstacles around. In addition, the measurement angle range is usually 360 degrees. We define the maximum measuring distance as D max , the minimum measuring distance as D min and the angular resolution as φ min . The raw data is shown on the top of Figure 2b and can be described by the following formula:
R = { ( r i , φ i ) i = 1 ,   2 ,   ,   N }
where N equals the value 360 / φ min and represents the total number of scanning points P = { p 1 ,   p 2 ,   ,   p N } . r i is the return distance of the i-th laser beam and φ i is the angular of rotation relative to the initial direction. The coordinate value of p i relative to the center of the laser sensor can be calculated by the following equation:
x i = r i cos φ i y i = r i sin φ i
We define the following variables which are shown in Figure 2c. The width of the corridor is usually a constant value and defined as w c o r r i d o r . The depth of the door frame, which is recessed in the wall, is defined as d d o o r , the width of the door is w d o o r , the height of the door is h d o o r and the height from the floor to the center of the doorplate is h d p l a t e . The shortest distance or vertical distance between the left wall and the center of the laser sensor is defined as d L l a s e r , while the other side is d R l a s e r . It is apparent that the width of the corridor is the sum of these two distances.
We assume the doors are closed and the mobile robot is located in a long corridor. If the robot is in a local area without doors, then the following equation holds:
d L l a s e r + d R l a s e r w c o r r i d o r ε
where ε is a threshold which is smaller than the depth of the door frame. We can set the threshold to 1 4 d d o o r . When the mobile robot is passing through the door area and elevator entrance area, Equations (4) and (5) can represent these two cases, respectively.
d L l a s e r + d R l a s e r w c o r r i d o r d d o o r ε
d L l a s e r + d R l a s e r w c o r r i d o r d d o o r 2 ε
when the mobile robot moves in a long corridor, an invalid scan area θ n u l l means the laser sensor gets no return distance data. In other words, the distance between the laser sensor and the obstacle exceeds the maximum scanning radius, especially in the area parallel to the corridor. The invalid scan area is shown at the bottom of Figure 2b, where θ n u l l [ θ min ,   θ max ] . The minimum value of θ n u l l is determined by Equation (6) when the laser sensor is located on the middle line parallel to the corridor. Similarly, Formula (7), with a maximum value, means that the laser sensor is close to the wall.
θ min = arcsin w c o r r i d o r 2 D max
θ max = arcsin w c o r r i d o r D max
Given the information above, the mobile robot can move autonomously in both the mapping and localization stages. The details are shown in Algorithm 1. When a mobile robot does move along a long corridor, the detected distance data on both sides of the robot is valid because of the limited width of the corridor. Consequently, if two invalid areas are detected and θ min θ n u l l i θ max i = 1 , 2 , they must be two opposite areas along the corridor. We can also calculate the angle of the effective region between two adjacent invalid areas to further verify this conclusion.
Algorithm 1. Autonomous Moving Strategy.
Input: Raw data from laser scans R = { ( r i , φ i ) i = 1 ,   2 ,   ,   N }
Output: Moving decisions
1:  Initialization and extract the invalid scan areas θ n u l l i i = 1 ,   2 ,   ,   n
2:  if Mode is Mapping then
3:   Go to mapping stage
4:  else if Mode is Localization then
5:   Go to Navigation stage
6:   Execute Localization procedure
7:  end if
8:  Mapping stage
9:  if only one invalid scan area and  θ min θ n u l l 1 θ max  then
10:   Move toward the invalid scan area and constructs map
11:   else if two invalid scan areas and  θ min θ n u l l i θ max i = 1 ,   2  then
12:   Move toward one side randomly
13:   Keep moving until only one invalid area left
14:   Go to step 9
15:   end if
16:   Navigation stage
17:   if only one invalid scan area and  θ min θ n u l l 1 θ max  then
18:   Use AMCL method to localize
19:   else if two invalid scan areas and  θ min θ n u l l i θ max i = 1 ,   2  then
20:   Move toward one side randomly
21:   Detect and recognize text information
22:   Go to step 18
23:   end if
24:   return

3.2. Text Detection and Recognition

An interesting phenomenon is that the doorplates or similar text regions are usually horizontal and have a uniform height and position relative to the doors and elevators. Therefore, the mobile robot can detect and recognize the text information when it moves to those local areas. Given that the mobile robot moves along the corridor using the strategy of Algorithm 1, we can confirm that the robot passes through the door area from Equation (4) and the elevator area from Equation (5). The place where detecting and recognizing the text information from is shown in Figure 3, where the mobile robot turns toward the door to capture images in an optimal position and orientation. If the mobile robot passes through these areas without steering, the text content in the image will be skewed and distorted. As a result, this will lead to wrong text detection and recognition. Therefore, it is useful and necessary to adjust the robot’s orientation or rotate the camera. Considering the problem of camera and robot calibration, we choose the former scheme.
To improve the efficiency of text detection and recognition for mobile robots, we still need to make the following definitions and assumptions. The number of all text regions N a l l in a building is the sum of the number of doors and elevators on all floors. If every floor has the same number of rooms and layout, then the total number of text regions can be represented as Formula (8), where n f l o o r s is the number of floors and n t e x t s is the number of text regions on each floor. The result will be expressed by Formula (9) if every floor has different rooms and layout. Formula (8) can express most of the real environment:
N a l l = n f l o o r s × n t e x t s
N a l l = i n f l o o r s n i
A new image is defined as I . The detected result usually has several text rectangular boxes because there does not exist an algorithm that can detect the correctly expected text box with absolute accuracy. B o x k means the k -th rectangular text box detected from the image, which is captured from the door area, where k = { 1 ,   2 ,   ,   m } . For every rectangular text box, the center point coordinate of the rectangle is defined as ( x k ,   y k ) . w k and h k represent the width and the height of the rectangle box, respectively. The representation is defined as follows:
B o x k = { ( x k , y k ) , w k , h k }
However, it is obvious that only one true and expected rectangular box exists in the image captured near the door area or elevator area. Others are falsely detected or irrelevant to the positioning purpose because the semantic text contents are not unique or useful for robot localization. To filter out the extra text regions, we added some restrictions. If the camera mounted on the mobile robot faces the doors at a fixed distance and the same relative position, as the left part of Figure 3 shows, then the boxes in different images must have the same parameters. In other words, the text regions will appear in the same location in the images. Assume that the mobile robot moves along the corridor keeping a distance d c o n s from the wall without doors, the text detection program only needs to detect the upper fixed height region of the image, as shown in the right part of Figure 3. This not only reduces the computational consumption of image processing but also increases the accuracy of text detection.
Considering the limited computing capacity of the robot and the low complexity of Arabic numerals or English character recognition, we do not need to use GPU and the deep learning-based OCR model. In contrast, we utilize the traditional text detection and recognition approach. Firstly, we use the MSER method to detect the expected text region when the robot encounters the doorway area. Secondly, an OCR engine is used to recognize the text content. Lastly, to minimize or avoid the result of false recognition, three detected and recognized results are counted from different positions. These positions are close, varying with only a small range of movement. We selected at least two identical results of the three as the final reference value. Figure 4 shows the text detection and recognition results.

3.3. Map-Building Using Text-Level Information

In the mapping stage, a single text-level feature map is not suitable for path planning and navigation. In addition, the text information of the doorplate is in a three-dimensional space, and 3D expression is not very important for robot localization. Consequently, we then transform the 3D spatial information coordinates of text into a two-dimensional space. The doorplate, which is posted on the door, is usually perpendicular to the ground. Therefore, we only need to project the center position of the doorplate onto the 2D grid map, then the text information can be thought of as a geo-tagged index to the relative 2D coordinates in the occupancy grid map.
An occupancy grid map is a combination of many grid cells which is the discretization of an indoor plane. If a mobile robot constructs a map in an environment with known poses, the mathematical equation is described as follows:
p ( m z 1 : t , x 1 : t ) = i p ( m i x 1 : t , z 1 : t )
where m = { m i } is the whole map and m i is the i-th grid cell. x 1 : t = x 1 ,   x 2 ,   ,   x t means the continuous trajectory from time 1 to time t, while z 1 : t = z 1 ,   z 2 ,   ,   z t is the observations and is gained from the external laser sensor which is mounted on the mobile robot. Then, it is easy to solve by utilizing the binary Bayes filter method and the logarithmic occupancy probability expression. The posterior probability equation after transformation is shown in (12):
p ( m i z 1 : t , x 1 : t ) = 1 1 1 + exp { l t , i }
where the detailed expression of l t , i is shown in Equation (13) and the purpose of logarithmic probability expression is to avoid the numerical instability near 0 and 1.
l t , i = log p ( m i z 1 : t , x 1 : t ) 1 p ( m i z 1 : t , x 1 : t )
However, before building a map, an environment that is very familiar to humans is usually unfamiliar to a robot. In a relatively strange environment, mobile robots do not know their position and orientation. To solve the problem, a laser-based SLAM method is used to jointly estimate the posterior p ( x 1 : t ,   m z 1 : t ,   u 1 : t 1 ) about the probability grid map m and the robot pose trajectory x 1 : t = x 1 ,   x 2 ,   ,   x t . The known input data are the odometry measurements u 1 : t = u 1 ,   u 2 ,   ,   u 1 : t and the laser sensor observations z 1 : t = z 1 ,   z 2 ,   ,   z t . A classical SLAM model of the joint estimation is equivalent to the following factorization, as in Equation (14):
p ( x 1 : t , m z 1 : t , u 1 : t ) = p ( x 1 : t z 1 : t , u 1 : t ) p ( m x 1 : t , z 1 : t , u 1 : t )   = p ( m x 1 : t , z 1 : t ) p ( x 1 : t z 1 : t , u 1 : t )
where the pose trajectory is firstly estimated by using odometry data and laser data. Given the estimated pose of the mobile robot, the SLAM task turns into a map construction with a known pose, which can be solved by using Equations (11)–(13).
The following work is to extract text information from door or elevator areas using the approach described in the previous section. The framework and basic procedure are depicted in Figure 5.
When the mobile robot moves in the mapping phase, laser data is not only used for laser SLAM but also for feature extraction and regional judgment. If the judgment result shows that the robot passes through the door or elevator areas, the 2D occupancy grid map will be constructed along with doorplate detection and recognition. Then, the central position of the text region will be projected onto the ground, represented by the grid cell m t e x t i . The coordinates are shown in Equation (15) and Figure 6:
m t e x t i = ( x t e x t i , y t e x t i ) = ( x d o o r i , y d o o r i )
where ( x d o o r i ,   y d o o r i ) means the intersection of the laser scanning horizontal plane and the vertical line which passes through the center point of the exterior surface of the i-th door. The global coordinates in the occupancy grid map are constructed by the laser SLAM. Then the i-th text information extracted from the i-th doorplate is thought of as a geo-tagged index of this global position m t e x t i .

3.4. Localization Stage

The traditional Monte Carlo localization approach can solve both global and local localization problems when given a known environment map and observations at every moment t . The robot pose x t = ( x   y   θ ) T can be computed by recursively estimating the posterior probability p ( x t m , z 1 : t , u 1 : t ) using the motion model and the observation model. The pose of an online fashion is estimated as follows:
p ( x t m , z 1 : t , u 1 : t ) p ( z t m , x t ) p ( x t x t 1 , u t ) p ( x t 1 m , z , u 1 : t 1 ) d x t 1
where m is the occupancy grid map of one floor inside a building and u 1 : t is the sequence of odometry data, which is also thought of as the motion command. The laser sensor readings are represented by z 1 : t , as the observations. MCL realizes non-parametric implementations of the recursive Bayes filter to model the belief by using a set of particles.
However, in the initial step of most particle filter localization algorithms, the traditional and widely-used method is to randomly generate particles uniformly throughout the whole map. Obviously, if the map is too large, it will be difficult work that consumes a lot of computing power and memory space. Besides, in a high-rise building with multiple floors and rooms, particles often converge to the wrong position in similar areas.
To solve the above problems, we use the coarse-to-fine paradigm to perform global and local localization, which utilizes the Monte Carlo localization approach together with a text-based initialization strategy. The whole localization procedure and flow chart are shown in Figure 6. If the robot does not know its initial pose in a map, the coarse localization method is used to find an approximate location. Subsequently, a fine localization mode is used to track the mobile robot pose. Firstly, the mobile robot analyzes the laser sensor data after it is powered on and the start-up system is completed. Then, the robot moves forward according to the strategy described in Algorithm 1, until it reaches a door area or an elevator area. Thirdly, detecting and recognizing text information is performed to decide which local area the robot is located. At last, the mobile robot initializes the position and weight of the particles, then tracks the local pose.
In this paper, if the number of floors is less than ten, then the room number is a string of three Arabic numbers, and each of them is a character from zero to nine. The first number usually represents the floor number, while the latter two indicate a specific room number on that floor. If a building has more than ten floors, then the room number will be a string of four Arabic numbers on the upper floors. When the floor number is more than ten, then the first two Arabic numerals represent the floor number. The text content which represents the floor number is a large font Arabic number followed by a fixed capital F. Consequently, when a mobile robot detects a doorplate and recognizes the room number, it is easy to judge the robot’s location on a specific floor and near a particular doorway. Furthermore, the mobile robot pose can be narrowed to a certain small area as per the following description.
Assuming a mobile robot moves in the corridor and passes by a door area, the coordinates in the map coordinate system is ( x o i ,   y o i ) , which is the position for the mobile robot observing the doorplate. The coordinates are calculated based on the LiDar measured distance from the wall and the camera’s relative orientation to the house number plate. Obviously, it is not an accurate pose. Assuming it is in an elliptical area, we take it as the center of an ellipse with the long axis as d l o n g and the short axis as d s h o r t .
d l o n g w d o o r d s h o r t 1 4 w c o r r i d o r x x o i d s h o r t 2 + y y o i d l o n g 2 = 1 4
Then the particles are generated uniformly inside this elliptical region as Figure 7 shows.
The initial weights of all particles are set based on the Gaussian density function, as Equations (18) and (19) show:
w i n i t i a l = P ( x 0 ; u , )
P ( x 0 ; u , ) = 1 2 π 1 2 exp 1 2 ( x 0 u ) T 1 ( x 0 u ) = 1 2 π σ x σ y exp ( ( ( x x o i ) 2 2 σ x 2 + ( y y o i ) 2 2 σ y 2 ) )
where x 0 is the initial pose of the robot, and μ means the expected coordinates that the mobile robot locates according to the laser data and moving strategy. The ideal position is the intersection of the corridor’s central line and the vertical line of the i-th door, and the camera orientated to the doorplate. The coordinates μ are represented as Equation (20) shows:
u = ( x o i , y o i )
is the covariance matrix. σ x y equals to zero because of the independence of abscissa and ordinate variables. In addition, σ y is larger than σ x because the longitudinal error is larger. The closer a particle’s position to the coordinates μ , the greater the value of P ( x , y ) . The orientation angle of each particle is not considered and can be thought of as facing the side of the door uniformly.
After the initialization step with text information, the mobile robot moves forward using only odometry and laser sensor data and switches to traditional AMCL localization mode. The basic MCL method that uses the particle filter is divided into three steps: sampling, importance weighting and resampling. The former two steps correspond to the prediction and updating phase of the Bayes filter. The motion model p ( x t x t 1 , u t ) can be chosen as the proposal distribution which is used to draw samples and corresponds to the prediction step of the Bayes filter. A new pose state estimation x ^ is drawn as follows:
x ^   ~   π ( x t x t 1 [ i ] , z t , u t )
For each i-th sampled particle, the importance weight, which corresponds to the correction step of the Bayes filter, is computed according to Equation (22):
w t [ i ] = η p ( z t x t [ i ] , m ) p ( x t x t 1 [ i ] , u t ) π ( x t x t 1 [ i ] , z t , u t ) w t 1 [ i ] = η p ( z t x t [ i ] , m ) p ( x t x t 1 [ i ] , u t ) p ( x t x t 1 [ i ] , u t ) w t 1 [ i ] = η p ( z t x t [ i ] , m ) w t 1 [ i ] p ( z t x t [ i ] , m ) w t 1 [ i ] p ( z t x t [ i ] , m )
From the above derivation, we can find that the weight at time t is related to the previous moment of time t – 1. The result is the weight at t – 1 multiplied by a ratio which is gained from the importance sampling step at time t. In the resampling phase, the probability of drawing a sample is proportional to its weight. The newly sampled particles are usually set to the same weight, such as 1 N .
When the mobile robot continues to move forward, detects and recognizes another room number as the text landmark, the importance weights w will be updated according to Figure 7 and Equations (18)–(20). In other words, when the robot encounters the text information, it scatters particles and updates the weight using our proposed approach. The reason for this is to prevent excessive cumulative errors and the problem of robot kidnapping. In other areas, the robot uses the traditional method to update the weights of the particles. The detailed improved AMCL approach is shown in Algorithm 2.
Algorithm 2. Improved AMCL Algorithm with Text Information.
Input: sample set χ ¯ t 1 , control u t , observation z t (raw laser data, image with text), map m .
Output: particle set with optimal estimated pose χ t
1: Initialization, χ ¯ t = χ t =
2: uniformly sample poses in a elliptical area near the door or elevator
3:  w ^ i n i t i a l = P ( x , y ) = 1 2 π σ x σ y exp ( ( ( x x o i ) 2 2 σ x 2 + ( y y o i ) 2 2 σ y 2 ) )
4: robot moves forward
5: if no text detected then
6:  for  j = 1 to N do
7:    x ^ t [ j ] = sample_motion_model ( u t , x t 1 [ j ] )
8:    w ^ t [ j ] = measurement_model ( z t , x ^ t [ j ] , m )
9:    χ ¯ t = χ ¯ t < x ^ t , w ^ t >
10:   end for
11:   for  k = 1 to N do
12:   Draw sample x ^ t [ k ] from χ ¯ t with probability w ^ t [ k ]
13:   Add x ^ t [ k ] to χ t
14:   end for
15:  else
16:   go to step 2, x t replaces x 0
17:  end if
18:  return  χ t
In Algorithm 2, the N particles χ t = { x t [ 1 ] ,   x t [ 2 ] ,   ,   x t [ N ] } are the final belief confidence at the current time t , which is equivalent to b e l ( x t ) in the Bayes filter. u t means the command which changes the state from t – 1 to t and is, generally, the odometry data. m is the previously built map with a hierarchical architecture, including a text information submap and an occupancy grid one. Except for similar and symmetric environments, most localization problems can be solved by using MCL series solutions including Augmented MCL and KLD sampling MCL. These combinations are called AMCL and integrated into ROS software packages which have been used in most commercial service robot systems.

4. Experiments and Results

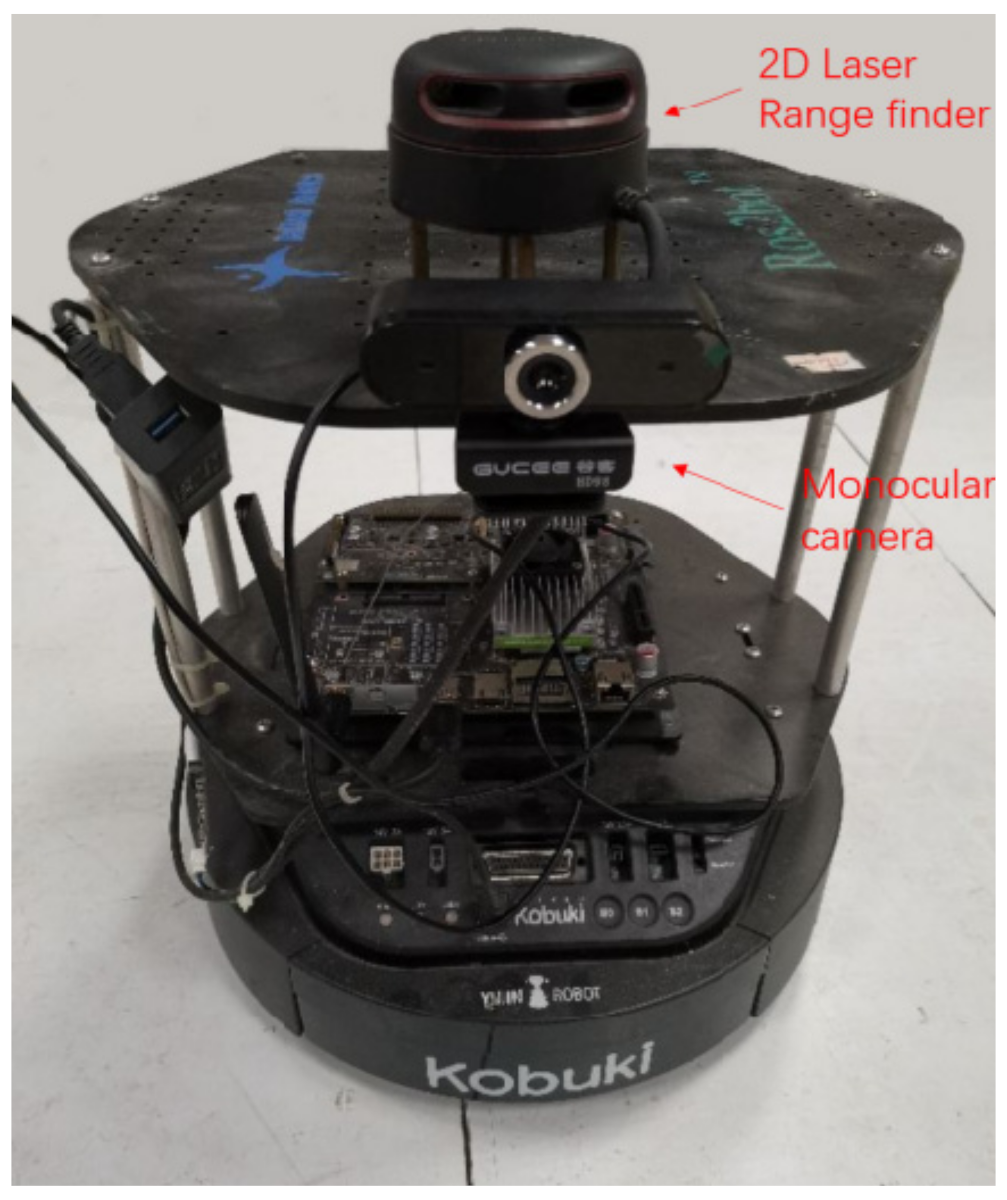
4.1. Experimental Setup and Environment

We built a robot for our experiment based on a Kobuki robot chassis (Yujin Robot Company, Seoul, Korea), and its driving mode satisfied the differential driving model, shown in Figure 8. Then, we added a 2D laser rangefinder sensor and a monocular camera on the top part of the robot. The LiDar was an RPLIDAR A2 (SLAMTEC, Shanghai, China), which had an 8 m measuring radius in the actual test, 360-degree scanning angle range, and was connected with the mainboard using a USB port. The camera with 1280 × 960 resolution and 30 frames per second was fixed on the position lower than the LiDar sensor to avoid blocking the scanning of it. The embedded development board was a Raspberry Pi 4B which was configured with ARM Cortex-A72 CPU at 1.5 GHz, 8 GB RAM memory and 32 GB TF storage card. ROS Kinetic Kame was installed based on Ubuntu 16.04, which is a Linux OS distribution, and the application software was programmed using C++ and Python. In the mapping stage, we remotely controlled the mobile robot from one end of the corridor to the other end. In the localization stage, the mobile robot worked autonomously to get a correct pose.
As the existing public datasets are not suitable for testing, we tested our approach and mobile robot system on the fifth floor in a teaching building of the Chongqing University of Posts and Telecommunications, China. We added a baffle at the intersection of the corridor to make it look like a straight corridor. The distance between the two adjacent doors was equal. A constructed occupancy grid map was built using Gmapping, and the result is shown in Figure 9. Due to the odometer error, the corridor looked a little curved, not a straight line. We chose twelve locations on the map to test the global localization and kidnapped robot problems. In addition, the room numbers were marked on the relative positions.
The length of the corridor was 53.20 m, the width was 1.85 m, the depth of the door frame was 0.15 m and the distance between two adjacent doors was 5.15 m. According to Equations (3)–(5), the mobile robot could determine which area it located. The parameter ε was set as 0.05 m. The ground-truth of the signed locations and the distances in the real-world environment were measured manually using a tape ruler.

4.2. Text Detection and Recognition Performance

To evaluate the performance and improvement compared with the conventional image processing method, we conducted the text detection and recognition experiments separately and repeated each experiment many times. In the text detection phase, we implemented two moving strategies, respectively. One of them was that the mobile robot moved from one end of the corridor to the other end, continuously capturing images from the wall with doors and detecting text regions from all areas of the wall. The other strategy was that the mobile robot moved to a doorway or elevator area, adjusted the pose of the robot platform and camera to capture an image from the best perspective, and then detected the text regions. If the mobile robot continuously processed images when it moved from one end of the corridor to the other end, it needed to process at least 1700 images at a rate of 30 frames per second. In contrast, using our method and strategy, the number of images that needed to be processed was reduced by several orders of magnitude. As Figure 3 shows, according to the strategy of detection from the best position and perspective, only one image was reserved from each doorway or elevator area. A total of eleven discrete images captured from the doorway or elevator areas were needed to detect the text regions, while images from other areas could be neglected.
After the text detection procedure, we employed the Tesseract OCR engine to recognize the text content which was semantic level information for robot localization. The text recognition accuracy was high enough for our localization purpose. However, we found that the wrong recognition cases were mainly caused by the similarity of the numeral. In order to further improve the accuracy of text recognition, we slightly adjusted the pose of the mobile robot and captured images from three different perspectives. Then, we implemented the recognition program and selected the final result according to a rule of two wins in three games. If the final recognition had at least two equal results, then it was the result we wanted. Fortunately, the minor improvement was indeed effective. The recognition accuracy is shown in Table 1.

4.3. Global Localization Tests

In this part of the experiment, we tested the traditional MCL localization method and our proposed method at the twelve test locations, respectively. The mobile robot could not locate itself without being given the initial pose manually, except for the adjacent areas of positions #1 and #12, which had unique geometry features. However, even these two areas were not 100% successful. In order to explain these phenomena in detail, we present two results, respectively.
Firstly, we chose a representative location, #7, which is similar to all other doorway areas, and used the traditional AMCL method to test the result. Figure 10 shows the results at the different process stages. The particle distribution for a mobile robot in an environment given an initial pose and a pre-built map is shown in Figure 10b, where most of the particles are concentrated around the pose. After that, once the motion of the mobile robot is updated, the particles will quickly converge to a small cluster. The redundant particles will be removed, and the total number of particles will be reduced to an appropriate number. When the mobile robot is placed in the corridor without a known initial pose, then a global localization task with uniform particle distribution will be executed. Thousands of particles are evenly distributed on the whole map, as shown in Figure 10c. At this point, the robot does not know where it is, and it needs to move to update the motion data and observation data. We manually controlled the robot to move towards the elevator entrance, that is, position #12. After moving a short distance, the particles converged into multiple clusters, as Figure 10d shows. Due to the high similarity of the corridor environment, the particles could converge to a correct pose and reduce to one particle cluster. As shown in Figure 10e, there are still four particle clusters even though the mobile robot moved to the end of the corridor near position #12 in the real-world environment, where the blue points are the scanning points of the laser rangefinder. Unfortunately, the localization result on the map is wrong, and the robot found it hard to re-localize to the right pose. These tests show that it is difficult to achieve correct global localization without giving the initial pose using the traditional AMCL method.
Secondly, we chose a representative location, #6, and used our proposed method to get global localization. Figure 11 demonstrates the basic process. When a mobile robot was placed on location #6 without a known initial pose, the laser scan data achieved by the LiDar sensor was analyzed first. As shown in Figure 11a, the mobile robot drew its own conclusion that it was most likely in the middle area of the corridor, even if it could not obtain an accurate pose. Then, according to our proposed approach and moving strategy, the robot randomly selected a corridor direction to move until it reached the doorway area or the end of the corridor. As shown in Figure 11b, when the mobile robot reached a doorway area, it steered to face the door and extracted the room number information. After the text detection and recognition steps, the mobile robot sprinkled particles in the identified doorway area, as Figure 11c shows. Later, after a short moving distance and several iterations, the mobile achieved global localization.
In order to test the convergence speed and successful localization rate of our proposed approach, we conducted ten groups of pure rotation and pure translation experiments at the above twelve positions, respectively. We counted the number of iterations from the initial start-up with thousands of particles to the one-cluster with few effective particles and the successful localization times when the particles converged to one cluster. If the poses of the mobile robot on the map and that of the real-world environment were within a small range (like 0.05 m of distance, 0.5 degree of angle), we judged the result as successful localization, otherwise, a failure.
Table 2 shows the results of successful localization times and the number of iterations when particles converged to one cluster. What needs to be explained is that the particles converging to one cluster does not mean global localization has been successful. The method of AMCL usually makes the particles converge into a wrong pose. In addition, the decimals of the average number of iterations are rounded up and rounded down numbers. We found that the mobile robot could hardly achieve successful localization if only rotation motion was performed. Position #1 and #12 are different from the other ten positions because the laser scanning data of these two positions had unique characteristics and could be distinguished from other places. Our proposed Text-MCL approach needed to move a short distance to a find room number, so the rotation motion of our method had no different result from the AMCL. Consequently, we did not give the tests, and the results are represented by dashes.
When the mobile robot performed translation motion, the conventional AMCL required slightly fewer iterations than that of rotation motion. However, the successful localization times did not increase too much. In contrast, our proposed method sprinkled particles only after the robot moved to the doorway or elevator area and recognized the unique text information. Consequently, the number of iterations was much less than that of the conventional method, but the successful localization times increased significantly, as shown in the right part of Table 2. The mobile robot in locations #6, #9 and #10 could not achieve 100% successful localization because of the wrong recognition of text contents.
We chose another 20 different locations to test our proposed approach and compared these with the conventional AMCL method. A different number of initial particles of the AMCL method was considered. Every method was tested 10 times at each location, the results are shown in Table 3. We recorded the minimum, maximum and average number iterations when the particles converged to a single cluster. When the particles converged, we recorded the moving distance and the result of the localization. The results show that the conventional method had a low successful localization rate, even though the particles increased. In contrast, our proposed approach achieved a 96.2% successful localization rate. In addition, the average moving distance was only 2.72 m, which is acceptable in practical applications.
An extended data presentation of the relationship between the successful localization rate and moving distance is shown in Figure 12. We found that the mobile robot achieved a high localization success rate when using our approach.

4.4. Re-Localization from Kidnapping

For the fairness of the experiment, we gave the initial pose manually for the mobile robot when testing the effectiveness of the two approaches. As Figure 13 shows, when a mobile robot with a known initial pose moved to position A, we kidnapped it to position B. Actually, the mobile robot did not know what happened because the laser scanning data from position B was not different from A. The red dashed line represents the moving route that the mobile robot would go. When the mobile robot moved to position D, the conventional AMCL method could not find the kidnapped robot problem and misidentified position D as position C. The problem continued until the robot reached the area near position E. If the robot was kidnapped to other floors which had similar environments with the fifth floor, the traditional method completely lost the ability of correct positioning.
In contrast, our proposed approach can solve the kidnapped robot problem easily, even though it is kidnapped to another floor with a similar environment. As described in Algorithms 1 and 2, when a mobile robot using the Text-MCL method moved to position D, it could detect that the position belongs to a doorway area. Then, the robot would detect and recognize the doorplate to extract the text content 508. Subsequently, a resample of particles would be performed, and most of the particles could converge to the new correct pose.
A detailed result of the localization error after robot kidnapping is shown in Figure 14. The localization error before robot kidnapping was approximately 0.02 m and suddenly increased to 15.45 m after the robot kidnapping. Figure 14a is the result of our proposed method, which shows that the mobile robot moved forward with a large error until it reached a doorway area (room 508). After a moving distance of 2.50 m, the robot detected and recognized the room number, updated the particles and weights, and then tended to the correct pose. Figure 14b is the result of the conventional method, which had a large error and continued a long distance. Unfortunately, the robot could hardly achieve a correct pose at a later time.
The result depicts that our proposed approach can realize relocation after several moving distances, while it is too difficult to recover from wrong poses using the conventional method.

5. Discussion and Conclusions

A puzzling problem is that the mobile robot using conventional AMCL methods should be able to localize itself when it moves to either end of a corridor in theory because laser data from those areas have unique features different from other areas. The reason is that the conventional AMCL method considers both laser scans, odometer data, and transformation of the coordinate system. Before the mobile robot reaches one end of the corridor, the particles have converged to a single cluster, even if the pose is wrong. In addition, if the similarity of multiple floors is considered, using the traditional method makes it more difficult to achieve successful localization.
In this work, the main contribution is the development of an integrated approach that combines text-level semantic information with a particle filter for both the global localization and robot kidnapping problem. The text-level semantic information can benefit mobile robot localization, while the laser data can assist in improving the detection and recognition of the text information. We can think of them as mutually beneficial. In addition, when a mobile robot needs to perform a task like delivering objects to room 503, text information can provide semantic information while the traditional occupancy grid map requires the manual marking of coordinate points. The experimental results indicate that our proposed approach can realize a high successful localization rate with few particles while the conventional AMCL method has a low success rate.
As future work, our proposed Text-MCL method can be used in many other indoor large spaces, such as shopping malls, the waiting hall of railway stations and airports, even in a train where there are many similar geometric structures. However, the texts of these scenes have multiple fonts and inconsistent sizes, which need to be considered and solved using deep learning methods. In addition, visual features can also be used to assist the text information for more efficient global localization if there are few text features in the environment.

Author Contributions

Conceptualization, G.G. and Y.Z.; methodology, G.G.; software, W.W. and Q.J.; validation, L.H., Y.W. and Y.Z.; formal analysis, Q.J.; investigation, Y.W.; resources, G.G.; data curation, W.W.; writing—original draft preparation, G.G.; writing—review and editing, W.W.; visualization, Y.W.; supervision, Y.Z.; project administration, Y.Z.; funding acquisition, Y.Z. All authors have read and agreed to the published version of the manuscript.

Funding

This research was funded by the National Natural Science Foundation of China (NSFC, grant number 61703067, 61803058, 51604056, 51775076), Science and Technology Research Project of Chongqing Education Commission (grant number KJ1704072), and Doctoral Talent Train Project of Chongqing University of Posts and Telecommunications (grant number BYJS202006). The authors would like to thank the referees for their constructive comments.

Data Availability Statement

Not applicable.

Acknowledgments

The authors would like to acknowledge all developers and maintainers of the ROS open source software community for their convenient software package.

Conflicts of Interest

The authors declare no conflict of interest.

References

  1. Meng, J.; Wang, S.; Xie, Y.; Jiang, L.; Li, G.; Liu, C. Efficient re-localization of mobile robot using strategy of finding a missing person. Measurement 2021, 176, 109212. [Google Scholar] [CrossRef]
  2. Taheri, H.; Xia, Z.C. SLAM; definition and evolution. Eng. Appl. Artif. Intell. 2021, 97, 104032. [Google Scholar] [CrossRef]
  3. Campos, C.; Elvira, R.; Rodriguez, J.J.G.; Montiel, J.M.M.; Tardos, J.D. ORB-SLAM3: An Accurate Open-Source Library for Visual, Visual–Inertial, and Multimap SLAM. IEEE Trans. Robot. 2021, 37, 1874–1890. [Google Scholar] [CrossRef]
  4. Xu, L.; Feng, C.; Kamat, V.R.; Menassa, C.C. An occupancy grid mapping enhanced visual SLAM for real-time locating applications in indoor GPS-denied environments. Autom. Constr. 2019, 104, 230–245. [Google Scholar] [CrossRef]
  5. Fox, D.; Burgard, W.; Dellaert, F.; Thrun, S. Monte carlo localization: Efficient position estimation for mobile robots. AAAI/IAAI 1999, 1999, 2. [Google Scholar]
  6. Wu, Z.; Yue, Y.; Wen, M.; Zhang, J.; Peng, G.; Wang, D. MSTSL: Multi-sensor based two-step localization in geometrically symmetric environments. In Proceedings of the 2021 IEEE International Conference on Robotics and Automation (ICRA), Xi’an, China, 30 May–5 June 2021. [Google Scholar]
  7. Ge, G.; Zhang, Y.; Jiang, Q.; Wang, W. Visual features assisted robot localization in symmetrical environment using laser SLAM. Sensors 2021, 21, 1772. [Google Scholar] [CrossRef] [PubMed]
  8. Sarlin, P.-E.; Cadena, C.; Siegwart, R.; Dymczyk, M. From coarse to fine: Robust hierarchical localization at large scale. In Proceedings of the IEEE/CVF Conference on Computer Vision and Pattern Recognition (CVPR), Long Beach, CA, USA, 15–20 June 2019; pp. 12708–12717. [Google Scholar]
  9. Qian, R.; Hu, D.; Dinkel, H.; Wu, M.; Xu, N.; Lin, W. Multiple sound sources localization from coarse to fine. In Proceedings of the Computer Vision–ECCV 2020: 16th European Conference, Glasgow, UK, 23–28 August 2020; Springer International Publishing: Cham, Switzerland, 2020; pp. 292–308. [Google Scholar]
  10. Debeunne, C.; Vivet, D. A review of visual-LiDAR fusion based simultaneous localization and mapping. Sensors 2020, 20, 2068. [Google Scholar] [CrossRef] [PubMed] [Green Version]
  11. Mullane, J.; Vo, B.-N.; Adams, M.D. A Random-finite-set approach to bayesian SLAM. IEEE Trans. Robot. 2011, 27, 268–282. [Google Scholar] [CrossRef]
  12. Bailey, T.; Nieto, J.; Guivant, J.; Stevens, M.; Nebot, E. Consistency of the EKF-SLAM algorithm. In Proceedings of the 2006 IEEE/RSJ International Conference on Intelligent Robots and Systems, Beijing, China, 9–15 October 2006; pp. 3562–3568. [Google Scholar]
  13. Kokovkina, V.A.; Antipov, V.A.; Kirnos, V.; Priorov, A.L. The algorithm of EKF-SLAM using laser scanning system and fisheye camera. In Proceedings of the 2019 Systems of Signal Synchronization, Generating and Processing in Telecommunications (SYNCHROINFO), Yaroslavl, Russia, 1–3 July 2019; pp. 1–6. [Google Scholar]
  14. Bahraini, M.S. On the efficiency of SLAM using adaptive unscented kalman filter. Iran. J. Sci. Technol. Trans. Mech. Eng. 2020, 44, 727–735. [Google Scholar] [CrossRef]
  15. Murphy, K.; Russell, S. Rao-Blackwellised particle filtering for dynamic Bayesian networks. In Sequential Monte Carlo Methods in Practice; Springer: New York, NY, USA, 2001; pp. 499–515. [Google Scholar]
  16. Grisetti, G.; Stachniss, C.; Burgard, W. Improved techniques for grid mapping with rao-blackwellized particle filters. IEEE Trans. Robot. 2007, 23, 34–46. [Google Scholar] [CrossRef] [Green Version]
  17. Doucet, A.; de Freitas, J.F.G.; Murphy, K.; Russel, S. Rao-blackwellized partcile filtering for dynamic bayesian networks. In Proceedings of the Conference on Uncertainty in Artifificial Intelligence (UAI), Stanford, CA, USA, 30 June–3 July 2000; pp. 176–183. [Google Scholar]
  18. Hess, W.; Kohler, D.; Rapp, H.; Andor, D. Real-time loop closure in 2D rangefinder SLAM. In Proceedings of the IEEE International Conference on Robotics and Automation, Stockholm, Sweden, 16–21 May 2016; pp. 1271–1278. [Google Scholar]
  19. Thrun, S. Probabilistic robotics. Commun. ACM 2002, 45, 52–57. [Google Scholar] [CrossRef]
  20. Alatise, M.B.; Hancke, G.P. Pose Estimation of a mobile robot based on fusion of IMU data and vision data using an extended kalman filter. Sensors 2017, 17, 2164. [Google Scholar] [CrossRef] [PubMed] [Green Version]
  21. Thrun, S.; Fox, D.; Burgard, W.; Dellaert, F. Robust Monte Carlo localization for mobile robots. Artif. Intell. 2001, 128, 99–141. [Google Scholar] [CrossRef] [Green Version]
  22. Xu, S.; Chou, W.; Dong, H. A Robust indoor localization system integrating visual localization aided by CNN-based image retrieval with Monte Carlo localization. Sensors 2019, 19, 249. [Google Scholar] [CrossRef] [PubMed] [Green Version]
  23. Long, S.; He, X.; Yao, C. Scene text detection and recognition: The deep learning era. Int. J. Comput. Vis. 2021, 129, 161–184. [Google Scholar] [CrossRef]
  24. Neumann, L.; Matas, J. Real-time scene text localization and recognition. In Proceedings of the 2012 IEEE Conference on Computer Vision and Pattern Recognition, Providence, RI, USA, 16–21 June 2012; pp. 3538–3545. [Google Scholar]
  25. Epshtein, B.; Ofek, E.; Wexler, Y. Detecting text in natural scenes with stroke width transform. In Proceedings of the 2010 IEEE Computer Society Conference on Computer Vision and Pattern Recognition, San Francisco, CA, USA, 13–18 June 2010; pp. 2963–2970. [Google Scholar]
  26. Lee, J.-J.; Lee, P.-H.; Lee, S.-W.; Yuille, A.; Koch, C. AdaBoost for text detection in natural scene. In Proceedings of the 2011 International Conference on Document Analysis and Recognition(ICDAR), Beijing, China, 18–21 September 2011; pp. 429–434. [Google Scholar]
  27. Yao, C.; Bai, X.; Shi, B.; Liu, W. Strokelets: A learned multi-scale representation for scene text recognition. In Proceedings of the 2014 IEEE Conference on Computer Vision and Pattern Recognition, Columbus, OH, USA, 23–28 June 2014; pp. 4042–4049. [Google Scholar]
  28. Agbemenu, A.S.; Yankey, J.; Addo, E.O. An automatic number plate recognition system using opencv and tesseract ocr engine. Int. J. Comput. Appl. 2018, 180, 1–5. [Google Scholar]
  29. Tafti, A.P.; Baghaie, A.; Assefi, M.; Arabnia, H.R.; Yu, Z.; Peissig, P. OCR as a service: An experimental evaluation of Google Docs OCR, Tesseract, ABBYY FineReader, and Transym. In Proceedings of the Springer International Symposium on Visual Computing, Las Vegas, NV, USA, 12–14 December 2016. [Google Scholar]
  30. Liao, M.; Shi, B.; Bai, X.; Wang, X.; Liu, W. Textboxes: A fast text detector with a single deep neural network. In Proceedings of the Thirty-First AAAI Conference on Artificial Intelligence, San Francisco, CA, USA, 4–9 February 2017; pp. 4161–4167. [Google Scholar]
  31. Liu, W.; Anguelov, D.; Erhan, D.; Szegedy, C.; Reed, S.; Fu, C.Y.; Berg, A.C. Ssd: Single shot multibox detector. In Proceedings of the European Conference on Computer Vision; Springer: Cham, Switzerland, 2016; pp. 21–37. [Google Scholar]
  32. Tian, Z.; Huang, W.; He, T.; He, P.; Qiao, Y. Detecting text in natural image with connectionist text proposal network. In Proceedings of the European Conference on Computer Vision, Amsterdam, The Netherlands, 11–14 October 2016; pp. 56–72. [Google Scholar] [CrossRef] [Green Version]
  33. Zhou, X.; Yao, C.; Wen, H.; Wang, Y.; Zhou, S.; He, W.; Liang, J. EAST: An efficient and accurate scene text detector. In Proceedings of the 2017 IEEE Conference on Computer Vision and Pattern Recognition (CVPR), Honolulu, HI, USA, 21–26 July 2017. [Google Scholar]
  34. Ly, N.T.; Nguyen, C.T.; Nakagawa, M. An attention-based row-column encoder-decoder model for text recognition in Japanese historical documents. Pattern Recognit. Lett. 2020, 136, 134–141. [Google Scholar] [CrossRef]
  35. Shi, B.; Bai, X.; Yao, C. An end-to-end trainable neural network for image-based sequence recognition and its application to scene text recognition. IEEE Trans. Pattern Anal. Mach. Intell. 2016, 39, 2298–2304. [Google Scholar] [CrossRef] [PubMed] [Green Version]
  36. Liu, X.; Liang, D.; Yan, S.; Chen, D.; Qiao, Y.; Yan, J. FOTS: Fast oriented text spotting with a unified network. In Proceedings of the 2018 IEEE/CVF Conference on Computer Vision and Pattern Recognition, Salt Lake City, UT, USA, 18–23 June 2018; pp. 5676–5685. [Google Scholar]
  37. Tomono, M.; Yuta, S. Mobile robot navigation in indoor environments using object and character recognition. In Proceedings of the Proceedings 2000 ICRA. Millennium Conference. IEEE International Conference on Robotics and Automation. Symposia Proceedings (Cat. No.00CH37065), San Francisco, CA, USA, 24–28 April 2000; pp. 313–320. [Google Scholar]
  38. Radwan, N.; Tipaldi, G.D.; Spinello, L.; Burgard, W. Do you see the bakery? Leveraging geo-referenced texts for global localization in public maps. In Proceedings of the 2016 IEEE International Conference on Robotics and Automation (ICRA), Stockholm, Sweden, 16–21 May 2016; pp. 4837–4842. [Google Scholar]
Figure 1. Text-level semantic information in similar environments.
Machines 10 00169 g001
Figure 2. Laser scans in long corridor environment. (a) Laser scans in two similar locations; (b) Laser data coordinates and scanning result; (c) Dimensions of the corridor.
Machines 10 00169 g002
Figure 3. Text detection from the best position and perspective.
Machines 10 00169 g003
Figure 4. Illustration of text extraction. (a) Original image; (b) MSER; (c) MSER+NMS; (d) Recognition from Fixed area.
Machines 10 00169 g004
Figure 5. Map-building procedure.
Machines 10 00169 g005
Figure 6. Localization procedure.
Machines 10 00169 g006
Figure 7. Initial potential area of the particles.
Machines 10 00169 g007
Figure 8. The mobile robot platform.
Machines 10 00169 g008
Figure 9. Occupancy grid map of the experimental environment.
Machines 10 00169 g009
Figure 10. Global localization results using AMCL method. (a) Real pose in the map. (b) Initial particle distribution with a pose given manually. (c) Initial particle distribution without a known pose. (d) Particle distribution after moving a short distance. (e) Particle distribution when the robot reached position #12.
Machines 10 00169 g010
Figure 11. Global localization using our proposed Text-MCL method. (a) Initial state of the robot; (b) Moving to a doorway area; (c) Initialize the particles after text recognition.
Machines 10 00169 g011
Figure 12. Relationship between successful localization rate and moving distance.
Machines 10 00169 g012
Figure 13. Schematic diagram of the robot kidnapping problem.
Machines 10 00169 g013
Figure 14. The result of the kidnapped robot problem. (a) the result of proposed method; (b) the result of the conventional method.
Machines 10 00169 g014
Table 1. Average recognition accuracy (%) in different places.
Text CategoryRoom NumberFloor Number
One time result95.398.6
Two of three times result98.4100
Table 2. Successful localization times and iterations when particles converged.
Placed LocationRotation MotionTranslation Motion
Average Number of IterationsSuccessful Localization TimesAverage Number of IterationsSuccessful Localization Times
AMCLText-MCLAMCLText-MCLAMCLText-MCLAMCLText-MCL
# 175-3-7726610
# 2123-0-9519210
# 3129-1-11716010
# 4137-0-12618210
# 5132-0-13519010
# 6153-0-1312519
# 7146-0-13419110
# 8137-0-13727010
# 9131-0-1292018
# 10129-0-1051809
# 11118-0-7919310
# 1274-8-5320710
Table 3. Statistical data of three methods.
MethodSampling ParticlesIterations (Minimum)Iterations (Maximum)Iterations (Average)Moving Distance (Average)/mSuccess Rate
AMCL500421287412.5319.6%
AMCL5000471939317.4622.9%
Text-MCL1001647312.7296.2%
Publisher’s Note: MDPI stays neutral with regard to jurisdictional claims in published maps and institutional affiliations.

