Article

Effect of Coolant Temperature on the Thermal Compensation of a Machine Tool

1
Graduate Institute of Precision Manufacturing, National Chin-Yi University of Technology, No. 57, Sec. 2, Zhongshan Rd., Taiping Dist., Taichung 41170, Taiwan
2
Department of Intelligent Automation Engineering, National Chin-Yi University of Technology, No. 57, Sec. 2, Zhongshan Rd., Taiping Dist., Taichung 41170, Taiwan
3
Department of Refrigeration, Air Conditioning and Energy Engineering, National Chin-Yi University of Technology, No. 57, Sec. 2, Zhongshan Rd., Taiping Dist., Taichung 41170, Taiwan
*
Author to whom correspondence should be addressed.
Machines 2022, 10(12), 1201; https://doi.org/10.3390/machines10121201
Submission received: 12 October 2022 / Revised: 28 November 2022 / Accepted: 7 December 2022 / Published: 12 December 2022

Abstract

:
Machine tool (MT) accuracy is an important factor in the industry and is affected by heat generation through internal and external moving parts; the electrical components used; and variable environmental temperatures. Thermal errors lead to 40–60% of all MT errors. To improve MT accuracy, efficient techniques to minimize thermal errors must be identified. This study investigated the coolant temperature effects under different rotating speeds of a standalone built-in spindle system and computer numerical control (CNC) machine with a direct-drive spindle on the accuracy of thermal deformation prediction. The z-axis thermal deformation of the standalone built-in spindle system and CNC machine with a direct-drive spindle was conducted at different spindle rotating speeds and coolant temperatures at a constant coolant flow rate of 5 LPM. All experiments were conducted in a steady and dynamic operation according to ISO 230-3. For the standalone built-in spindle system, in comparison to the Mares model, the developed new model based on the coolant temperature effect on the Mares model (Mares CT model) can improve the thermal deformation prediction accuracy by 18.17% to 39.50% at different coolant temperatures of 12 C to 26 C and the accuracy can be controlled within the range of 0.03 μ m to 5.24 μ m, while the supply coolant temperature is above 16 C. However, the thermal compensation analysis of the Mares CT model for a CNC machine with a direct-drive spindle shows a thermal deformation prediction accuracy improvement of 58.30% to 66.35% at different coolant temperatures of 22 C to 28 C and the accuracy can be controlled within the range of 0.14 μ m to 4.05 μ m. To validate the feasibility of the compensation model in real machining processes, dynamic operational analysis was performed for a standalone built-in spindle system and a CNC machine with a direct-drive spindle, and the thermal deformation prediction accuracy improved by 12.19% to 35.53% with the standalone built-in spindle system and 40.25% to 60.33% with the CNC machine with a direct-drive spindle. The compensation model analysis shows that the coolant temperature has a high impact on thermal deformation prediction and markedly affects system accuracy within certain limits.

1. Introduction

With the advancement of engineering and technology, machining is becoming quicker, more accurate, and more automatic. Machining precision has become an important equipment manufacturing industrial progress indicator [1]. Machining accuracy directly impacts product life and performance in the military, medical, electronics, automotive, and other sectors. Thermal phenomena in MTs are the major causes of machining defects, which strongly affect the efficiency of machining operations. The importance of reducing thermal errors increases as the necessary machining precision increases. Thermal errors are primarily caused by internal and external heat sources, and are affected by the latter’s intensity: heat transfer inside the MT, the environment, and variables related to the MT design and the machining operations performed. The external heat sources can be controlled by controlling the MT’s environmental temperature, which is important for external heat sources [2,3]. Thermal errors vary with the behavior of the MT in operation and are affected by the intensity of heat sources. In the CNC machine, thermal errors are caused by moving parts, such as a spindle and motor, and by non-moving parts, such as a hydraulic unit [4]. Generally, the generating heat inside the MT is removed by using the cooling system in the MT [5,6]. For the cooling system, compared to the conventional constant coolant volume (COV) method, the varied coolant volume (VOV) control method allows adjustment of the coolant circulating flow rate in terms of machining load and spindle rotating speeds to remove the heat generated by the MTs [7,8]. Internal heat generated by the spindle and the thermal deformations in the y- and z-axes can be reduced by 70.1% and 73.5%, respectively, using the VOV method [9]. Hot-gas bypass temperature control methods were developed for the MT cooler by combining the PID controller with the smith prediction method to control the time-varying problems with time delay properties. The coolant outlet temperature can be controlled at 0.1 C and that can also improve the performance of traditional PID controllers by using the hot-gas bypass valve [10].
The heat produced during machining leads to a nonuniform temperature distribution in an MT. As a result of the temperature distributions, the MT structure is thermally deformed. The complex heat sources result in a nonuniform temperature distribution throughout the MT frame. The generated heat is distributed throughout the spindle, increasing the temperature and causing thermal expansion in each component. Different degrees of deformation, such as stretching, bending, and twisting, occur due to variations in material, structure, shape, and thermal inertia among distinct spindle components, culminating in the spindle’s thermal deformation. Thermal deformations are generally characterized by a nonlinear phenomenon, making it difficult to correct thermal faults using a simple control system due to the complexity of heat transfer. To identify the major temperature field across the machine, researchers developed a compensation method to reduce the displacement variations concerning the temperature distribution of the MTs and improve the accuracy of the MTs [11,12,13,14].
The thermal error control method is economical and effectively reduces thermal effects [15]. The thermal error compensation method uses the thermal deformation model to predict and compensate for the thermal errors of MTs with robust and economic characteristics. Researchers have proposed linear regression [16,17,18,19,20], time series [21], the decomposition method [22], the beetle antennae search (BAS) algorithm [23], the particle swarm optimization backpropagation neural network (PSO-BPNN) [24], the improved binary grasshopper optimization algorithm (IBGOA) [25], and the transfer function method [26,27,28,29,30] to establish empirical thermal error models with critical temperature inputs. However, the robustness and prediction performances are insufficient to achieve a high-precision MT model. Hsieh et al. [31] proposed the adaptive neuro-fuzzy inference system (ANFIS) cooling control method for the coolant volume prediction of MTs. The suitable coolant pump driving frequencies under different rotating speeds of the spindle can be predicted by the ANFIS method, and 60%∼90% of the generating heat of the spindle can be removed by this method. In the machining process, a smaller-the-better (STB) and a larger-the-better (LTB) quality characteristics can be adopted to improve the possibility of the greatest resulting from the sampling errors and also integrate the previous experience to improve the accuracy and precision assessment [32,33]. Fang et al. [34] proposed the finite element analysis (FET) model based on thermal contact resistance (TCR) to analyze the temperature distribution of the spindle system. Experimental results show that the relative error of the proposed model is less than 5% for the spindle stopping temperature. Xiang et al. [35] applied the new data-driven prediction (DDP) approach to the dynamic linearization modeling of spindle thermal errors and found that the DDP model is better than the general model-based method, and the accuracy improvement is approximately 40%. Liu et al. [36] developed analytical modeling methods to analyze the spindle thermal error and found that the 20 C coolant temperature can cause lower linear thermal errors of −18.9 μ m and 58.2 μ m in the x- and y-axes, respectively. Liu et al. [37] proposed the axial growth model for the spindle based on temperature variations and investigated the environmental temperature variation error (ETVE) and error induced by spindle rotation (EIBSR). A 16.1% reduction in thermal error was found. Reddy et al. [38] developed a real-time compensation model based on the feed-forward backpropagation neural network and regression analysis method, and found that the neural network and regression methods are suitable for compensation modeling with less than 1 μ m accuracy. Ma et al. [39] proposed the closed-loop iterative thermal behavior modeling method to determine the accurate temperature of the ball screw shaft by updating the heat generation. Thermal errors can be predicted and compensated under different working conditions to verify the developed method. They found that the positioning error is reduced by 45% compared to that without compensation and by 36% and 19% compared to pitch compensation and multiple linear regression analysis (MLRA), respectively.
D-xing et al. [40] investigated the coolant passage that affects the heat dissipation of the front and rear halves of spindles by considering the scaling factor and accordingly created thermal modeling of the spindle. Results showed that the coolant operating at 2 C lower than room temperature was the most effective for the accuracy of the spindles. Kaulagi et al. [41] investigated the influences of external heat sources, primarily ambient temperature variations. Their model was inherently based on the thermal network using a lumped system approach for the temperature estimation of the MT components, and they found that the machining precision improvement was approximately 70%. Liu et al. [42] determined the optimum number of key temperature points using the elbow method and proposed the spindle thermal error prediction based on long short-term memory (LSTM) for a CNC MT. The thermal error can be predicted under different spindle speeds to verify the developed LSTM model; they found that the thermal deformation was within 0.62 μ m of the LSTM model.
Developing ultrahigh accuracy requires sophisticated technology and the greatest skill level. Advancements go beyond well-known ideas to intelligent systems that combine various tasks into a single unit. Moreover, reconfigurability is a novel idea for future machines to accomplish multi-machining operations. However, zero faults for complex components with greater performances have become new challenges for the next generation of MTs.
MT thermal deformation cannot be effectively removed via MT structural design, temperature control, and direct compensation without additional costs. Due to its cost and convenience, indirect compensation of the MT’s thermal deformation is one of the most often used methods to reduce MT thermal errors. Many researchers have concentrated on an estimate of only one active heat source in the entire MT thermal error, although various heat sources are continually mixed under real machining conditions, leading to the complex thermal error of the MT. The thermal compensation models used in previous studies still need improvements to reduce numerous thermal errors for MT accuracy. The compensation model developed by Mares et al. [27] is based on the linearization of MT thermal problems with the help of an equation model with nonlinear parts. The flowing coolant is also one of the important parameters of the MT, which was not considered in their study. Therefore, in this study, we modify the thermal compensation model developed by Mares et al. [27] by considering the coolant temperature effects on the MT, and we use the developed new model based on the coolant temperature effect on Mares model (Mares CT model) in the two machines: one is in a standalone built-in spindle system, and the other is in a CNC machine with a direct-drive spindle. A greater accuracy improvement was found by using the coolant temperature effect in the compensation modeling based on the Mares model.

2. Materials and Methods

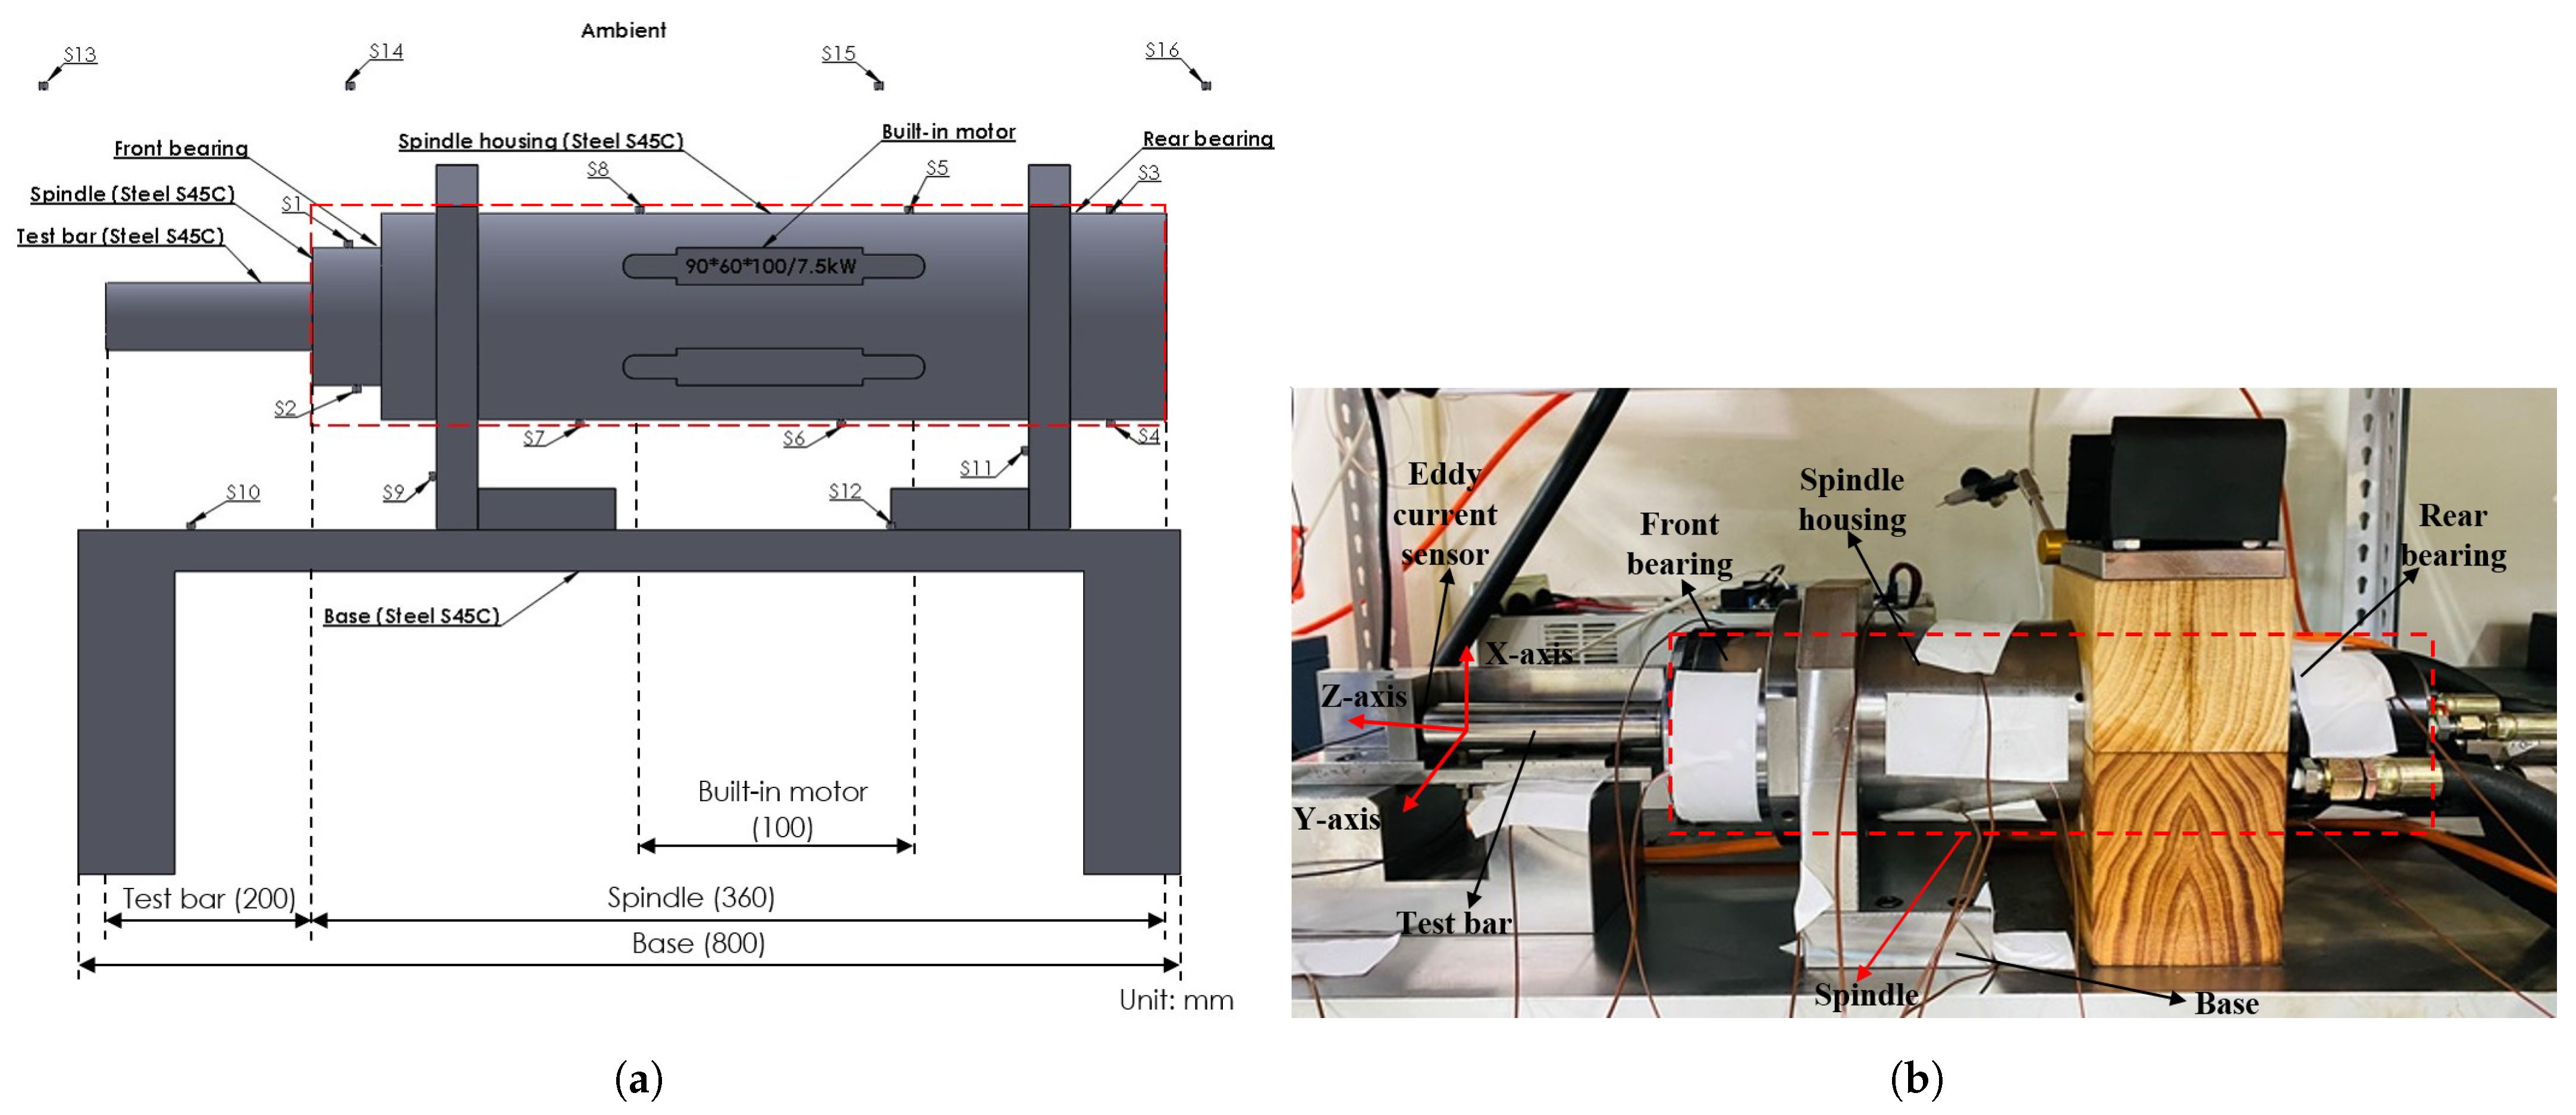
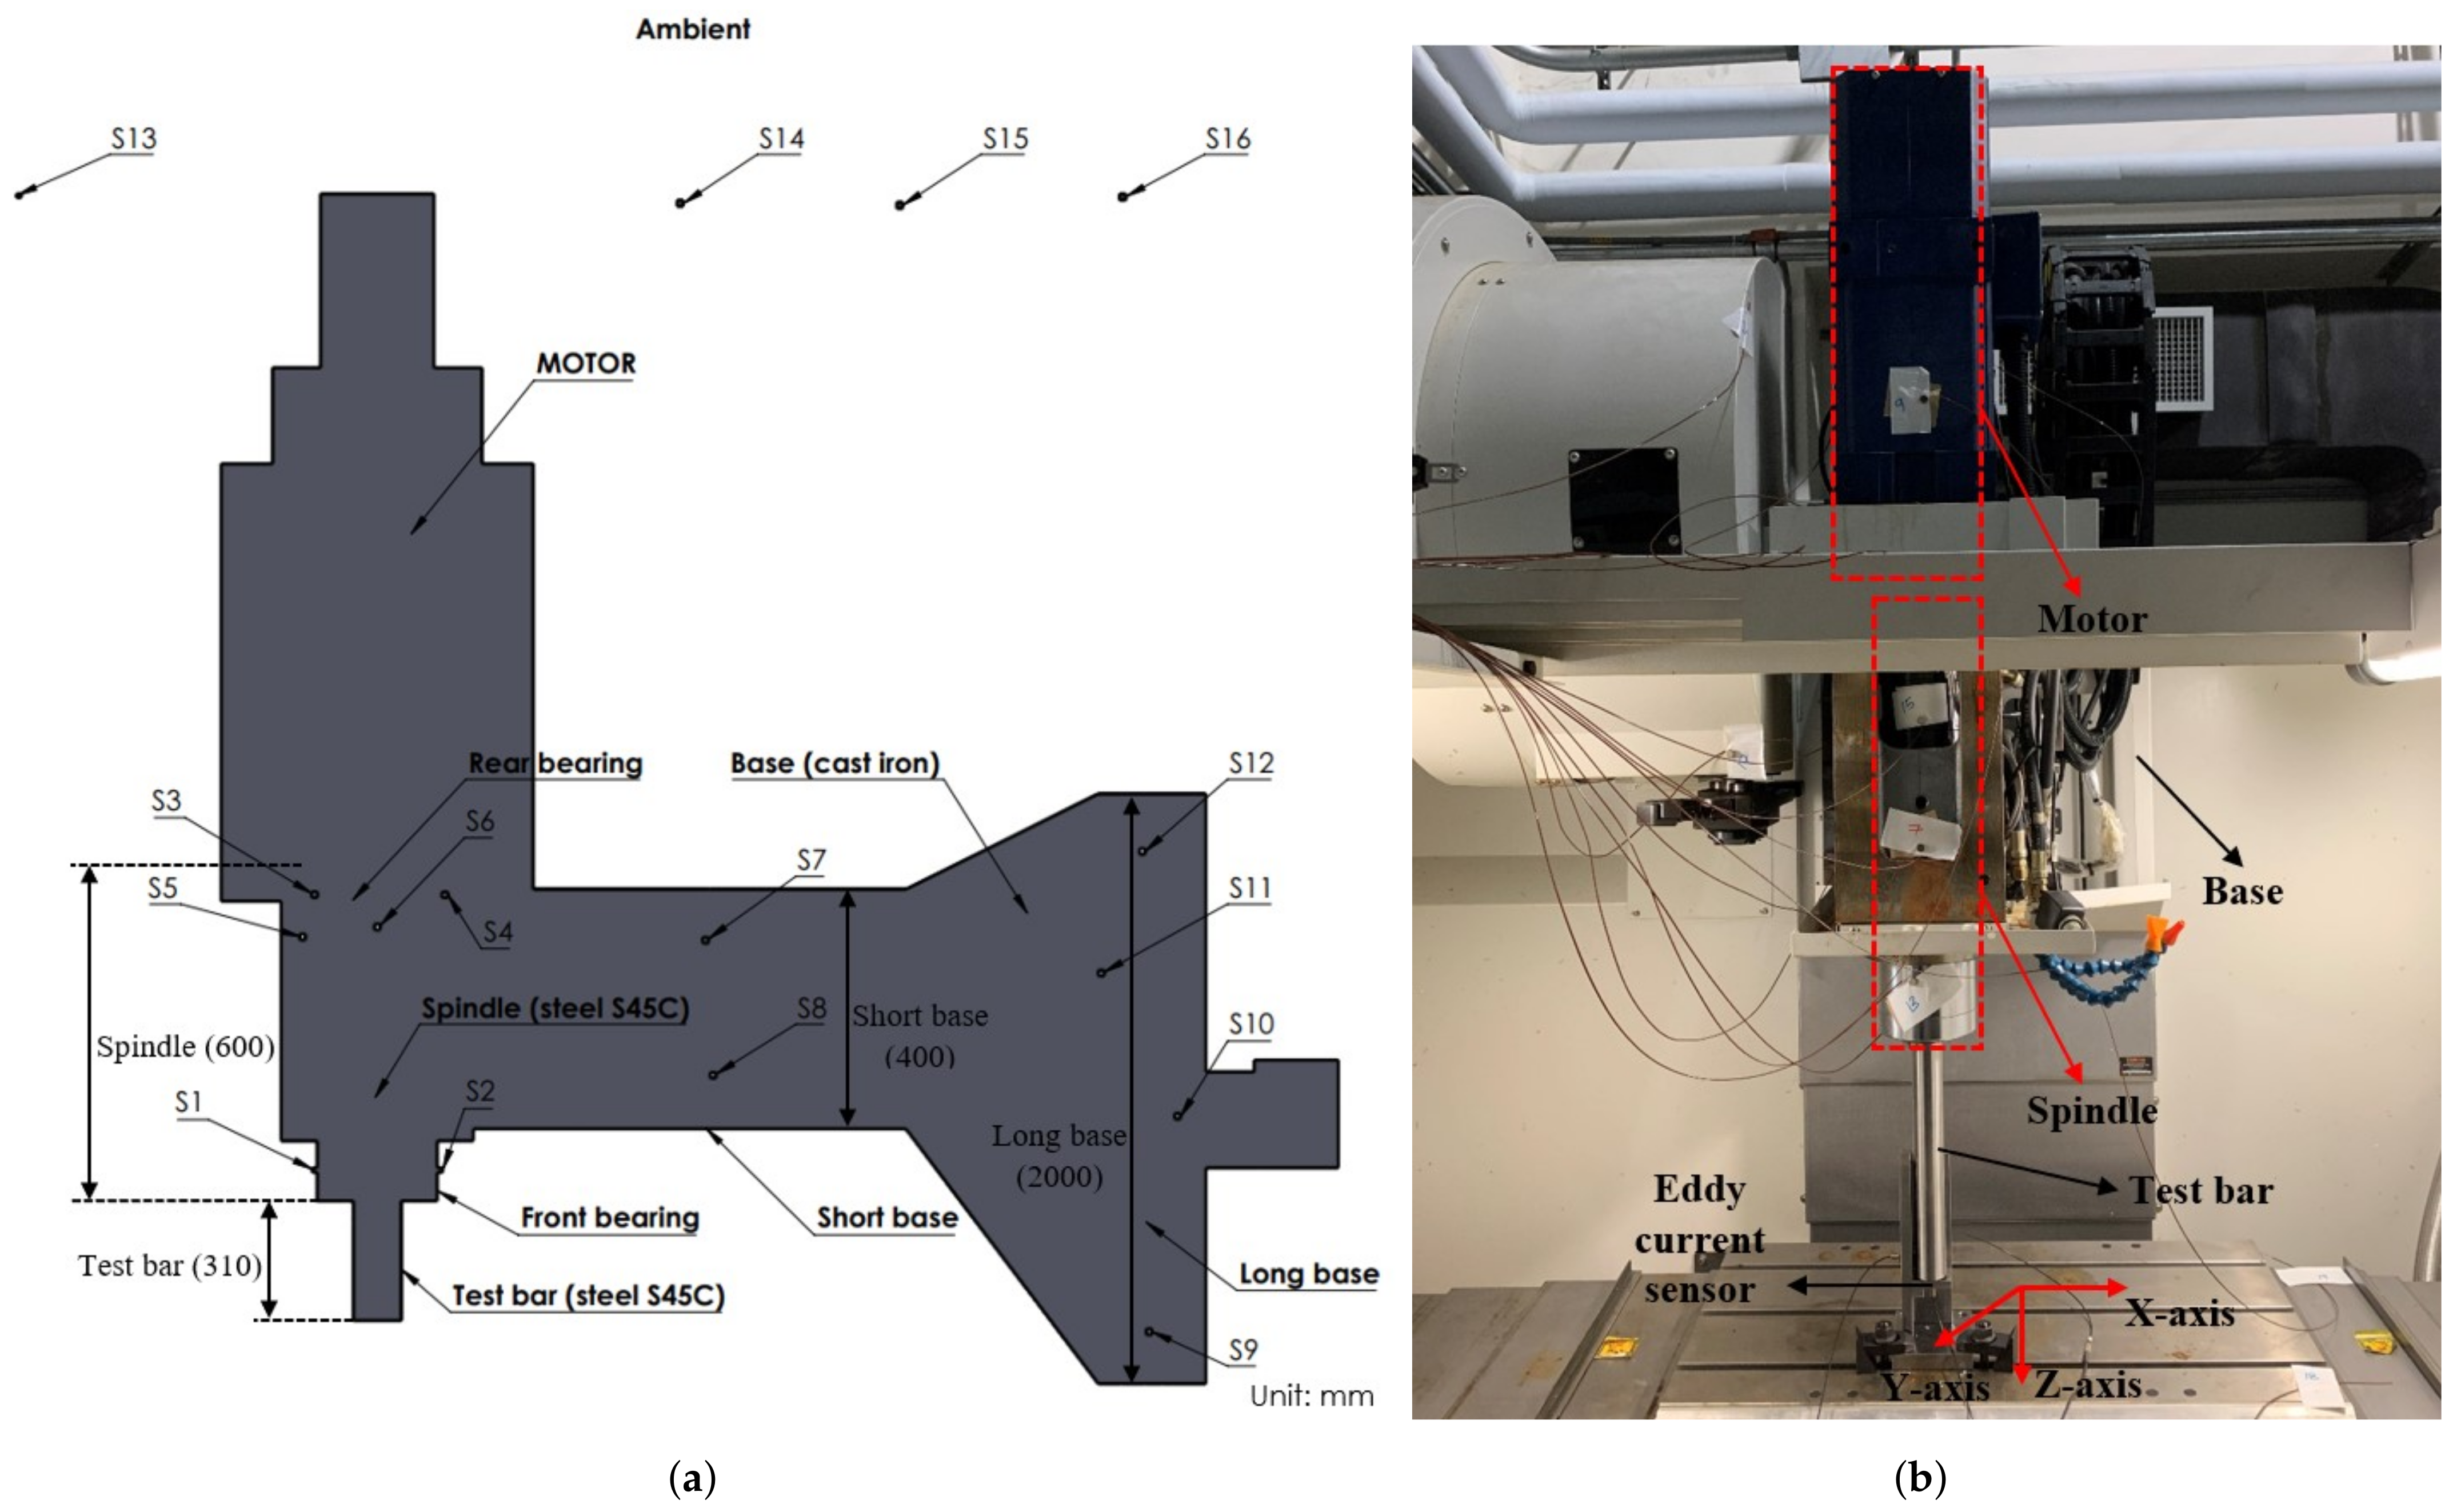
2.1. Experimental Setup

In this study, the thermal deformation of systems was investigated: one is a standalone built-in spindle system, and the other is a CNC machine with a direct-drive spindle. The standalone built-in spindle system consists of a built-in spindle (213A370, Setco) with a maximum rotating speed of 24,000 rpm and a 7.5 kW built-in motor. Figure 1a shows the standalone built-in spindle system, T-type temperature sensor positions, and the outer dimensions of the experimental setup.
The outer dimensions of the standalone built-in spindle setup consist of a built-in spindle with a length (L) of 360 mm, a test bar with a length (L) of 200 mm clamped with the spindle, an in-built motor with a length (L) of 100 mm, a base length (L) of 800 mm, and one eddy current displacement sensor (AEC S-06) for the deformation measurement. Figure 1b shows the experimental setup of the standalone built-in spindle system.
The CNC machine with a direct-drive spindle (YTM-764) made by Yang Iron Precision Corp., Taiwan, was used, which consists of an ISO-40 (BT-40) spindle with a maximum rotating speed of 12,000 rpm and a 7.5 kW motor. Figure 2a shows the CNC machine with a direct-drive spindle, T-type temperature sensor positions, and the outer dimension of the experimental setup. The outer dimension of the CNC machine with a direct-drive spindle consists of a direct-drive spindle with a length (L) of 600 mm, a test bar with a length (L) of 310 mm clamped with the spindle, a short base length (L) of 400 mm, a long base length (L) of 2000 mm and one eddy current displacement sensor (AEC S-06) for the deformation measurement. Figure 2b shows the experimental setup of a CNC machine with a direct-drive spindle. All experiments in both systems were conducted according to the ISO 230-3 specification.
In both studies, a total of 16 T-type temperature sensors were used to measure the corresponding component temperature variations of the spindle systems in order to predict the thermal behavior of the spindle and the MTs. The installation locations of the temperature sensors are shown in Figure 1 and Figure 2 and the position details of the temperature sensors are shown in Table 1. Finally, the average temperature differences of the spindle bearings, motor, base, and the ambient environment of the respective four sensors in the case of the standalone built-in spindle system; as well as the average temperature differences of the spindle bearings, motor, short base, and the ambient environment of the respective four sensors in the case of the CNC machine with a direct-drive spindle were considered for analysis.
Some amounts of uncertainty are always presented in all instruments and may be caused by instrumental, physical, or human imperfections [43]. In this study, the experimental influencing factors and corresponding uncertainties include the following: (1) an ambient temperature variation of ±1 C; (2) a temperature sensor (Trump NCP20 thermistor) with an accuracy of ±0.01 C; (3) a coolant flow meter (New Flow, DPG 3000) with an accuracy of ±0.05 LPM; (4) an eddy current displacement sensor (AEC-S06) with an accuracy of ±0.01%; (5) a T-type temperature sensor with an accuracy of ±1 C; (6) a signal measuring instrument (GL840 M) with an accuracy of ±0.002%; and (7) a signal measuring instrument (PR20) with an accuracy of ±0.002%. The total uncertainty of this analysis is 4.31%. The overall uncertainties can be calculated as the root of the sum of the square of each uncertainty using:
Δ y = [ ( Δ x 1 2 ) + ( Δ x 2 2 ) + ( Δ x 3 2 ) + + ( Δ x n 2 ) ] ,
where Δ x 1 , Δ x 2 ,…, Δ x n are the uncertainties of the individual variables.

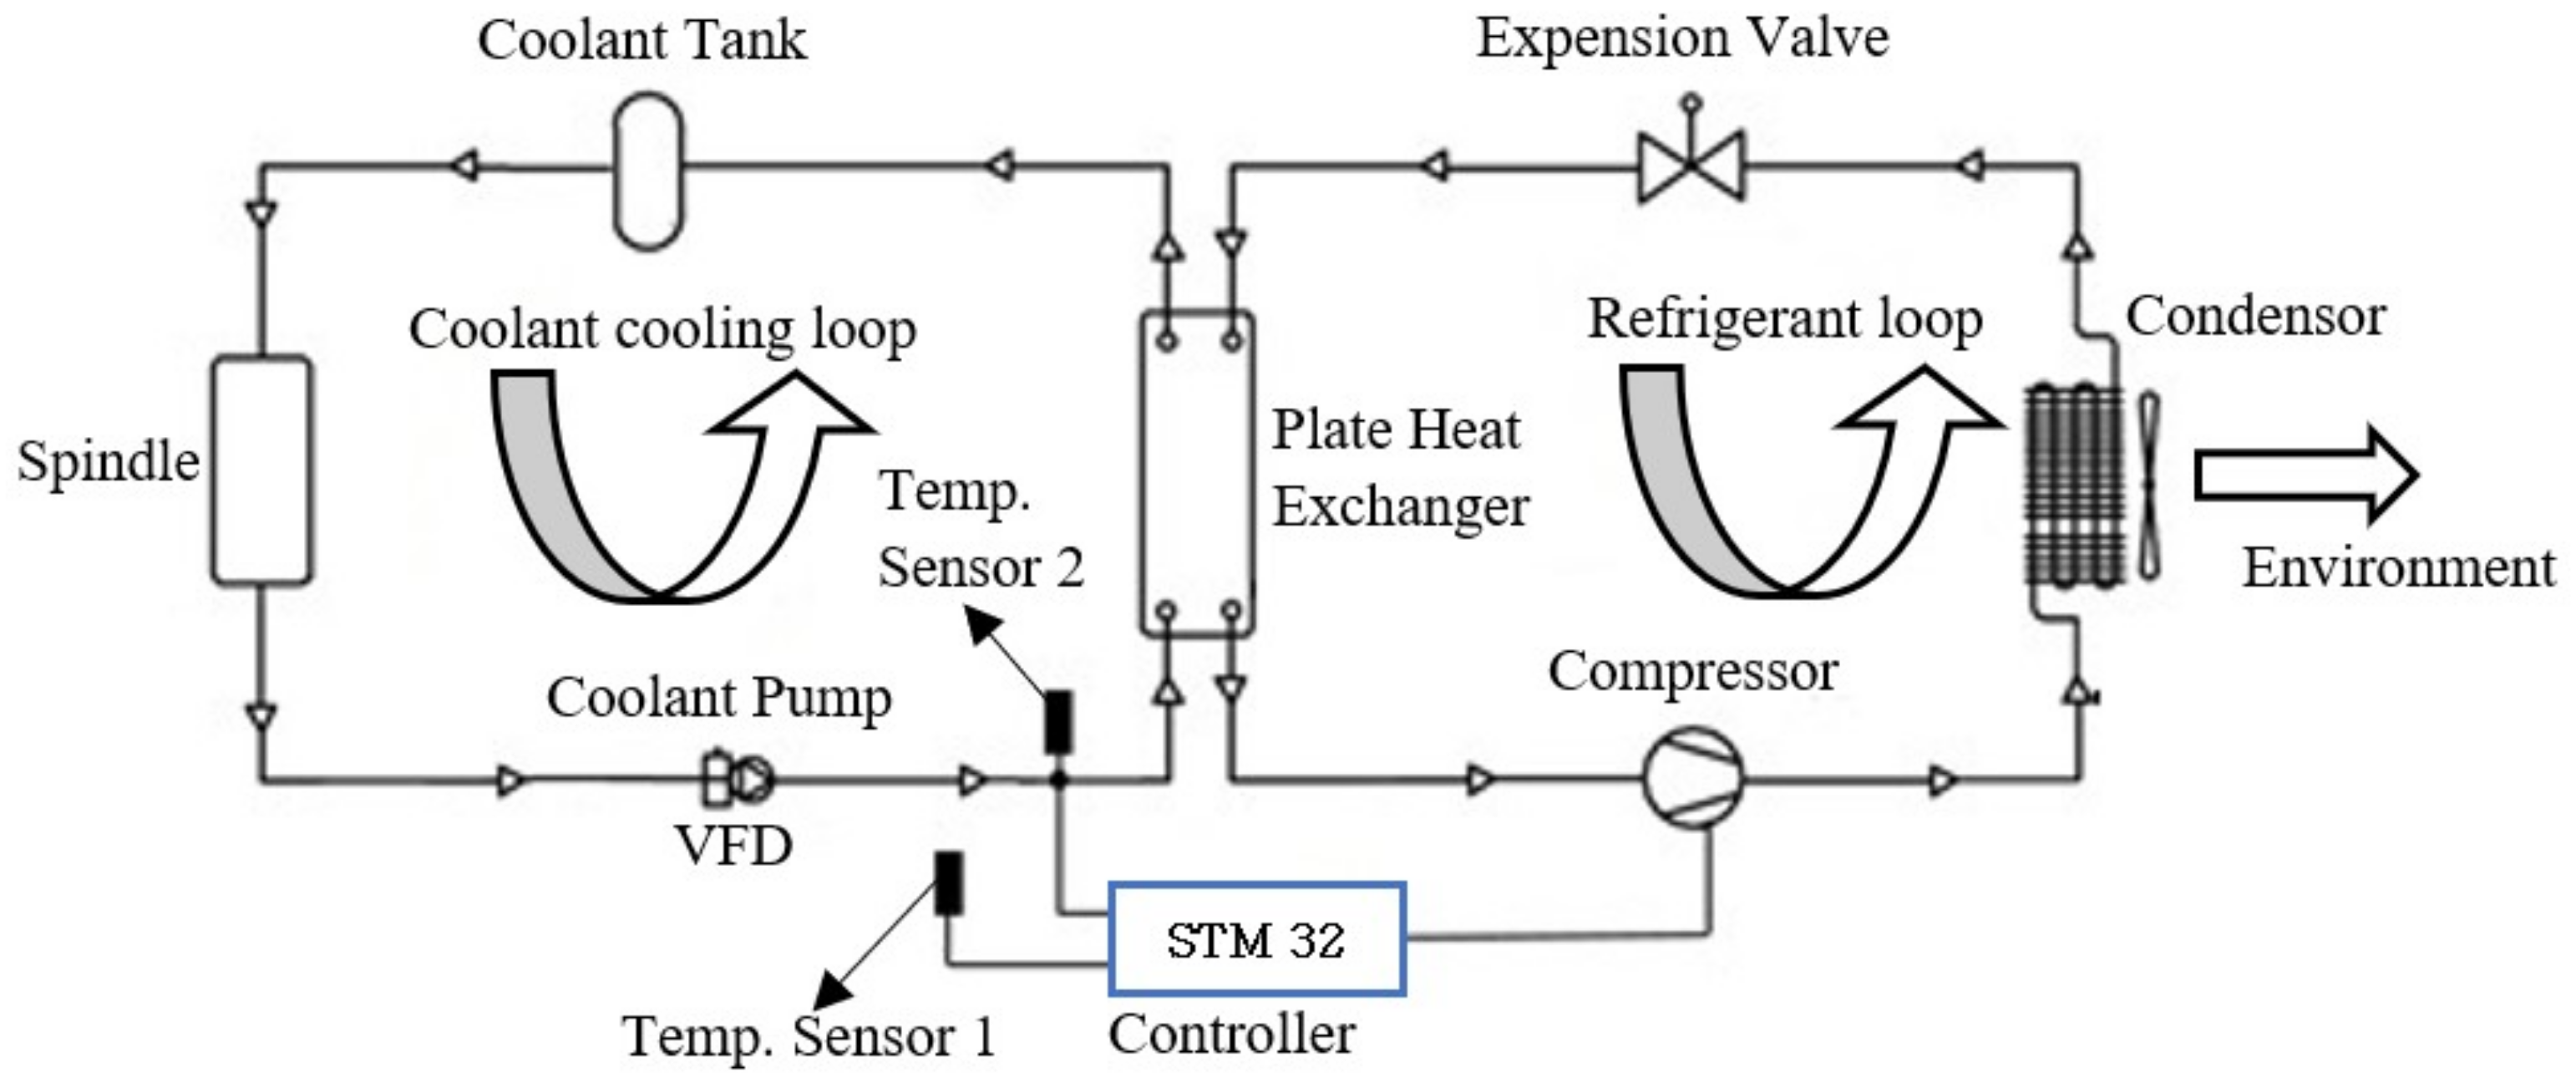
2.2. Refrigeration Cooling System

A cooling system with a coolant pump is developed to supply the coolant to the spindle for heat exchange. The system consists of two circulation loops (coolant cooling and refrigerant loops), as shown in Figure 3. The left loop is a coolant cooling loop consisting of a spindle, coolant storage tank, and coolant pump. Conversely, the right loop is a refrigerant circulation loop containing a compressor, condenser, expansion valve, and plate heat exchanger. The liquid refrigerant supplied by the compressor absorbs heat from the circulating coolant in the plate heat exchanger, evaporates into a gas, and then returns to the compressor in the refrigeration cycle. The gas refrigerant is compressed to high pressure before condensing into a liquid and then ejecting the condensation heat into the ambient environment from the condenser. After passing through an expansion valve, the pressure of the condensing liquid refrigerant decreases, and the refrigerant returns to the plate heat exchanger to complete the cycle. In the plate heat exchanger, the temperature of the circulating coolant decreases due to the heat released for refrigerant evaporation in the plate heat exchanger, and the low-temperature coolant is pumped to the rotating spindle to remove the heat generated during the working process. The ambient temperature detected by the temperature sensor (temp. sensor 1) is used to detect the ambient temperature variation and as a reference temperature for the supply coolant temperature setting. The coolant temperature sensor (temp. sensor 2) at the inlet of the plate heat exchanger is used to detect the coolant temperature and further adjust the driving frequency of the compressor by the STM32 PID controller to modify the refrigerant flow rate in the refrigeration cycle according to the cooling load variations of the spindle in order to maintain a stable and constant supply coolant temperature to the spindle. Figure 3 shows the operation of the cooling control system used in the standalone built-in spindle system and the CNC machine with a direct-drive spindle in this study.
For the standalone built-in spindle system and CNC machine with a direct-drive spindle in this study, the cooling system with an R410a refrigerant made by Habor Precision, Inc., Taiwan, and the J-H K 2 coolant were used. The cooling capacity of the cooling system is 3 kW for the standalone built-in spindle system and 1.7 kW for the CNC machine with a direct-drive spindle. The supply coolant temperature can be controlled in the range from 10 C to 40 C with an accuracy of ±0.5 C.

2.3. Thermal Deformation Analysis

2.3.1. Compensation Model

The following equation is used to estimate the thermal deformation in the z-direction ( δ z ) via the superposition principle:
δ z = Σ j = 1 l δ i , j ,
where i is the axis direction; j is an identifier of a specific heat source (e.g., spindle, motor, base or coolant); and l is the total number of deformational elements by the compensation model.
The deformational elements δ i , j in the overall thermal error δ z in the z-axis can be expressed as follows:
δ z , j = Δ T j · ε z , j ,
δ z in Equation (2) is the desired approximation of the MT thermal error in the z-direction. However, Δ T j in Equation (3) is the relevant temperature difference from an initial state to a steady state measured near a heat source, and ε z , j is the strain in the z-direction due to the change in the temperature from an initial state to a steady state of the described heat sources. The strain presents the relation between the relevant input Δ T j and output (deformational element δ z , j ) of the thermomechanical system.
Based on Equations (2) and (3), we consider the prediction for the z-direction thermal deformation for the systems in this study; thus, the full mathematical-specific model can be expressed as:
δ z = Δ T b a s e · ε z , b a s e + ( Δ T s p Δ T b a s e ) · ε z , s p + ( Δ T x Δ T b a s e ) · ε z , x + ( Δ T y Δ T b a s e ) · ε z , y + ( Δ T z Δ T b a s e ) · ε z , z + ( Δ T r Δ T b a s e ) · ε z , r ,
Equation (4) is the Mares model from Mares et al. [27], in which the authors considered temperature and strain changes of different parts of a 5-axis MT, where Δ T b a s e , Δ T s p , Δ T x , Δ T y , Δ T z , Δ T r , Δ T m , and Δ T c are the temperature change of the base, spindle, x-axis, y-axis, z-axis, rotational table, motor, and coolant temperature change from an initial state to a steady state, respectively, at constant ambient temperature (25 C ± 1 C); and ε z , b a s e , ε z , s p , ε z , x , ε z , y , ε z , z , ε z , r , ε z , m , and ε z , m , s p are the strains in the z-direction due to the temperature change of the base, spindle, x-axis, y-axis, z-axis, rotational table, motor, and built-in spindle motor from an initial state to a steady state, respectively.
The modified Mares model considering the coolant temperature is presented in Equation (5) in which the effects of coolant temperatures on strain changes of different components of the standalone built-in spindle system and the CNC machine are considered:
δ z = Δ T b a s e · ε z , b a s e + ( Δ T s p Δ T b a s e ) · ε z , s p + ( Δ T m Δ T b a s e ) · ε z , m + ( Δ T c Δ T b a s e ) · ε z , m , s p ,
ε = α · L ,
The strain ( ε ) calculation of the different components of the systems is the thermal expansion coefficient ( α ) multiplied by the corresponding length (L) of the different components of the spindle system. The corresponding lengths for Equation (6) are shown in Figure 1a and Figure 2a.
Due to a lack of the coolant effect on the motor in the CNC machine with a direct-drive spindle, the temperature variation effect on the motor is ignored, and only a short base is considered due to a few temperature variations at the long base. Therefore, in this study, for the CNC machine with a direct-drive spindle, the considered temperature-sensitive points are the spindle front and rear bearings, and short base and ambient environmental temperatures.
The spindle, motor, and base materials in the standalone built-in spindle system are steel S45C; however, the base material of the CNC machine with a direct-drive spindle is cast iron. The thermal expansion coefficient ( α ) of steel S45C and cast iron is 11 × 10 6 /m C.

2.3.2. Multiple Linear Regression (MLR) Model

A multiple linear regression model [16,17,18,19,20] was established to determine the relationship between the dependent and independent variables. In this study, the dependent variable is the thermal error, and the independent variable is the temperature variations of the temperature-sensitive points.
Based on the analytical analysis, regression modeling was conducted, and the deformation in the z-direction and regression coefficients can be calculated as follows:
δ Z = C 0 + Σ j = 1 m C j · ( Δ T ) j ,
C i ( T ) = a 0 + Σ k = 1 j a k · ( T ) k ; k = 1 t o j ,
where k is the number of regression coefficients and varies from 0 to j; T is the coolant temperature in C; Δ T is the temperature change from an initial state to a steady state in C; and j is the number of described heat sources. In this study, the numbers of dominant heat sources are 8, and other heat sources can be ignored. For the standalone built-in spindle system MLR analysis, 8 sets of experimental data were selected at different coolant temperatures (12–26 C) and a spindle speed of 12,000 rpm. However, for the CNC machine with a direct-drive spindle, 4 sets of experimental data were selected at different coolant temperatures (22–28 C) at a spindle rotating speed of 6000 rpm.
The functions of the multiple MLR model for the thermal deformations in the z-direction at different spindle speeds are shown in Equation (9):
δ z = C 0 + C 1 · Δ T 1 + C 2 · Δ T 2 + C 3 · Δ T 3 + + C 8 · Δ T 8 ,
The accuracy improvement (AI) of the system between the Mares model ( δ M ) and the Mares CT model ( δ M C T ) can be calculated using Equation (10):
AI = | δ M | | δ M C T | | δ M | × 100 % ,
The root mean square error (RMSE) of the spindle system between the Mares model ( δ M ) and the Mares CT model ( δ M C T ) can be calculated using Equation (11):
RMSE = 1 n j = 1 n ( δ M C T j δ M j ) 2 ,
where j is observations in the data set and n is the number of rotating speeds at the same temperature.
The average accuracy improvement ( A I ¯ ) of the spindle system between the Mares model ( δ M ) and the Mares CT model ( δ M C T ) can be calculated using Equation (12):
AI ¯ = 1 n j = 1 n AI ,
where j is the observation in the data set and n is the number of rotating speeds at the same temperature.
The Nash–Sutcliffe model efficiency (NSE) [44] presented in Equation (13) can be considered to evaluate the model efficiency of the Mares CT model ( δ M C T ) in the dynamic operation of spindle system:
NSE = 1 j = 1 n ( δ E x p e r i m e n t a l j δ M C T j ) 2 j = 1 n ( δ E x p e r i m e n t a l j δ E x p e r i m e n t a l ¯ ) 2 ,
where j is the observation in the data set, n is the number of rotating speeds at the same coolant temperature, δ E x p e r i m e n t a l is the experimental thermal deformation, and δ E x p e r i m e n t a l ¯ is the average experimental thermal deformation at the same coolant temperature.

3. Results and Discussion

Experiments were conducted in steady-state and dynamic operations based on the standard of ISO 230-3. To analyze the effects of coolant temperature on the thermal deformation of the MT during the steady-state operation, the spindle running and restoration times were a 60-min warming phase (running time) and a 60-min cooling phase (restoration time) with different spindle rotating speeds. For dynamic operations, 5, 15, and 30 min time intervals were used without resting the MT at different spindle speeds. The thermal deformation was calculated using Equation (5) (i.e., a Mares CT model for a standalone built-in spindle system and CNC machine with a direct-drive spindle system) and Equation (9) (i.e., multiple linear regression), and comparative analyses were performed with the measured deformations by the eddy current displacement sensor and the Mares model. In this study, accuracy improvement was calculated using Equation (10), root mean square error (RMSE) values were calculated using Equation (11), and the model’s efficiency during the dynamic operation was calculated using Equation (13) for the standalone built-in spindle system and CNC machine with a direct-drive spindle.
The initial temperature of the coolant flowing into the system is the most influential input parameter in the cooling system. This temperature is, thus, a critical variable for the overall MT performance because decreasing the initial temperature below a certain value causes rapid bearing failure due to condensation inside the bearings. To avoid such problems, we must consider this parameter carefully.

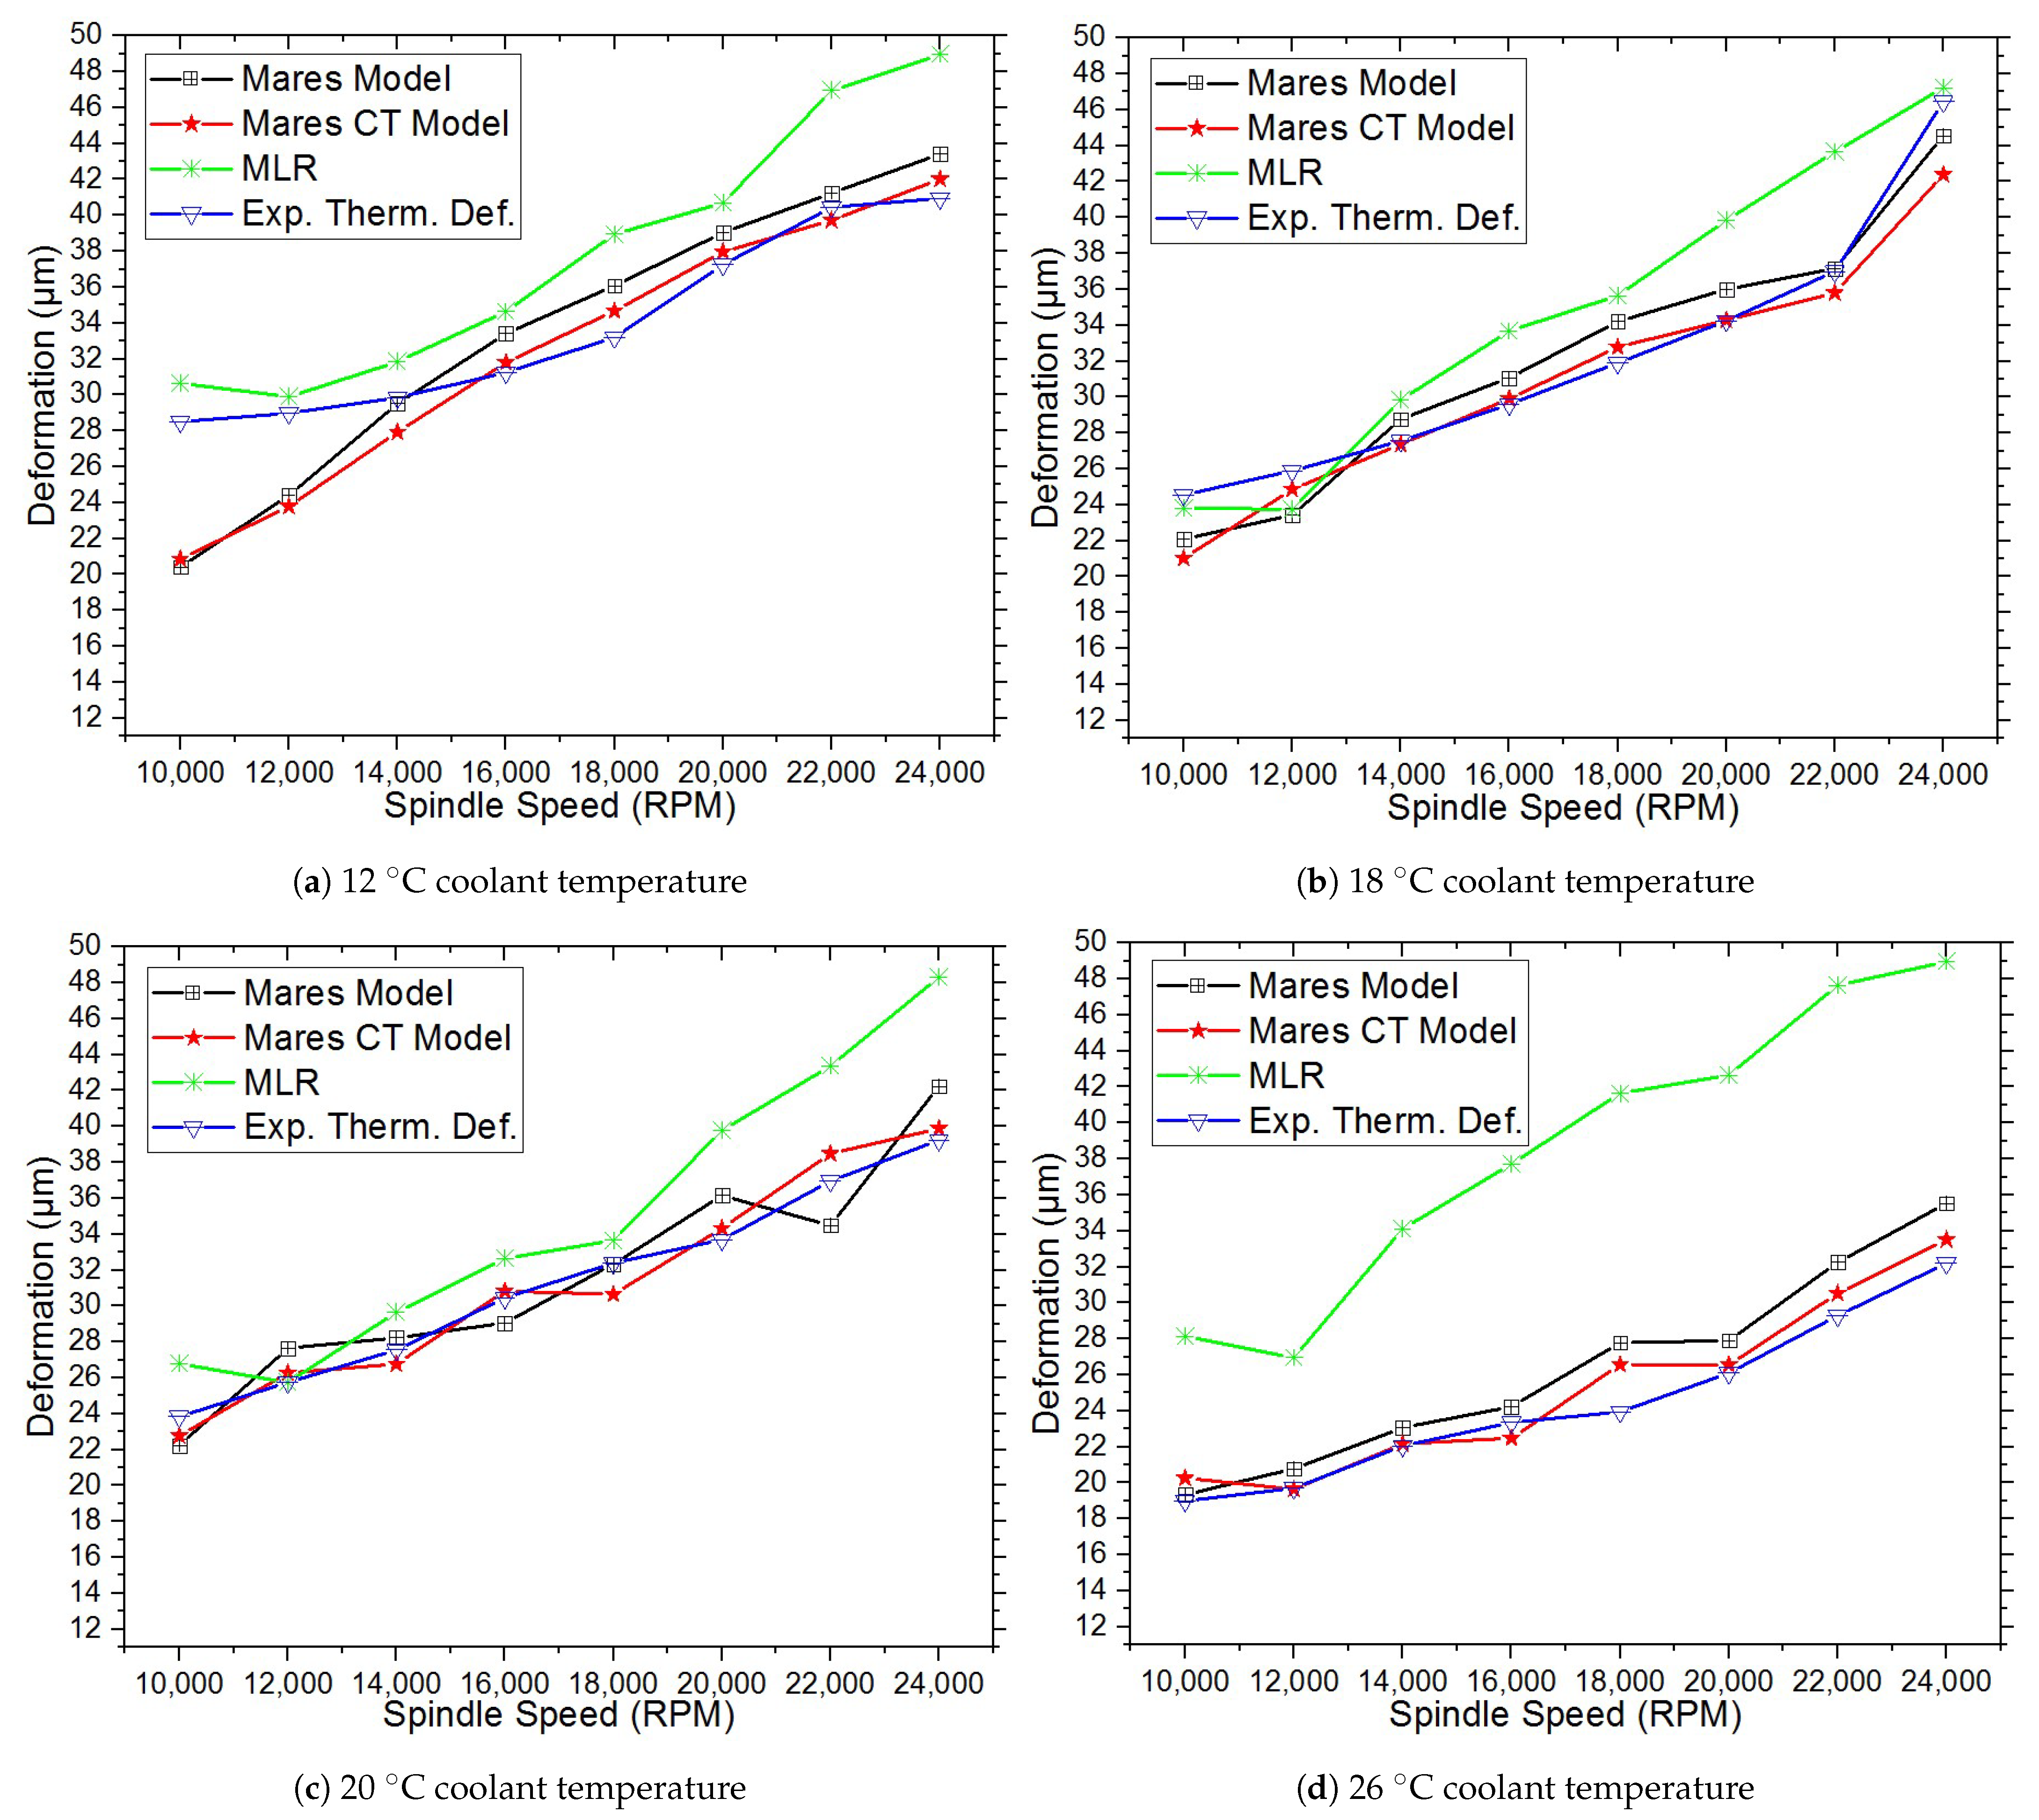
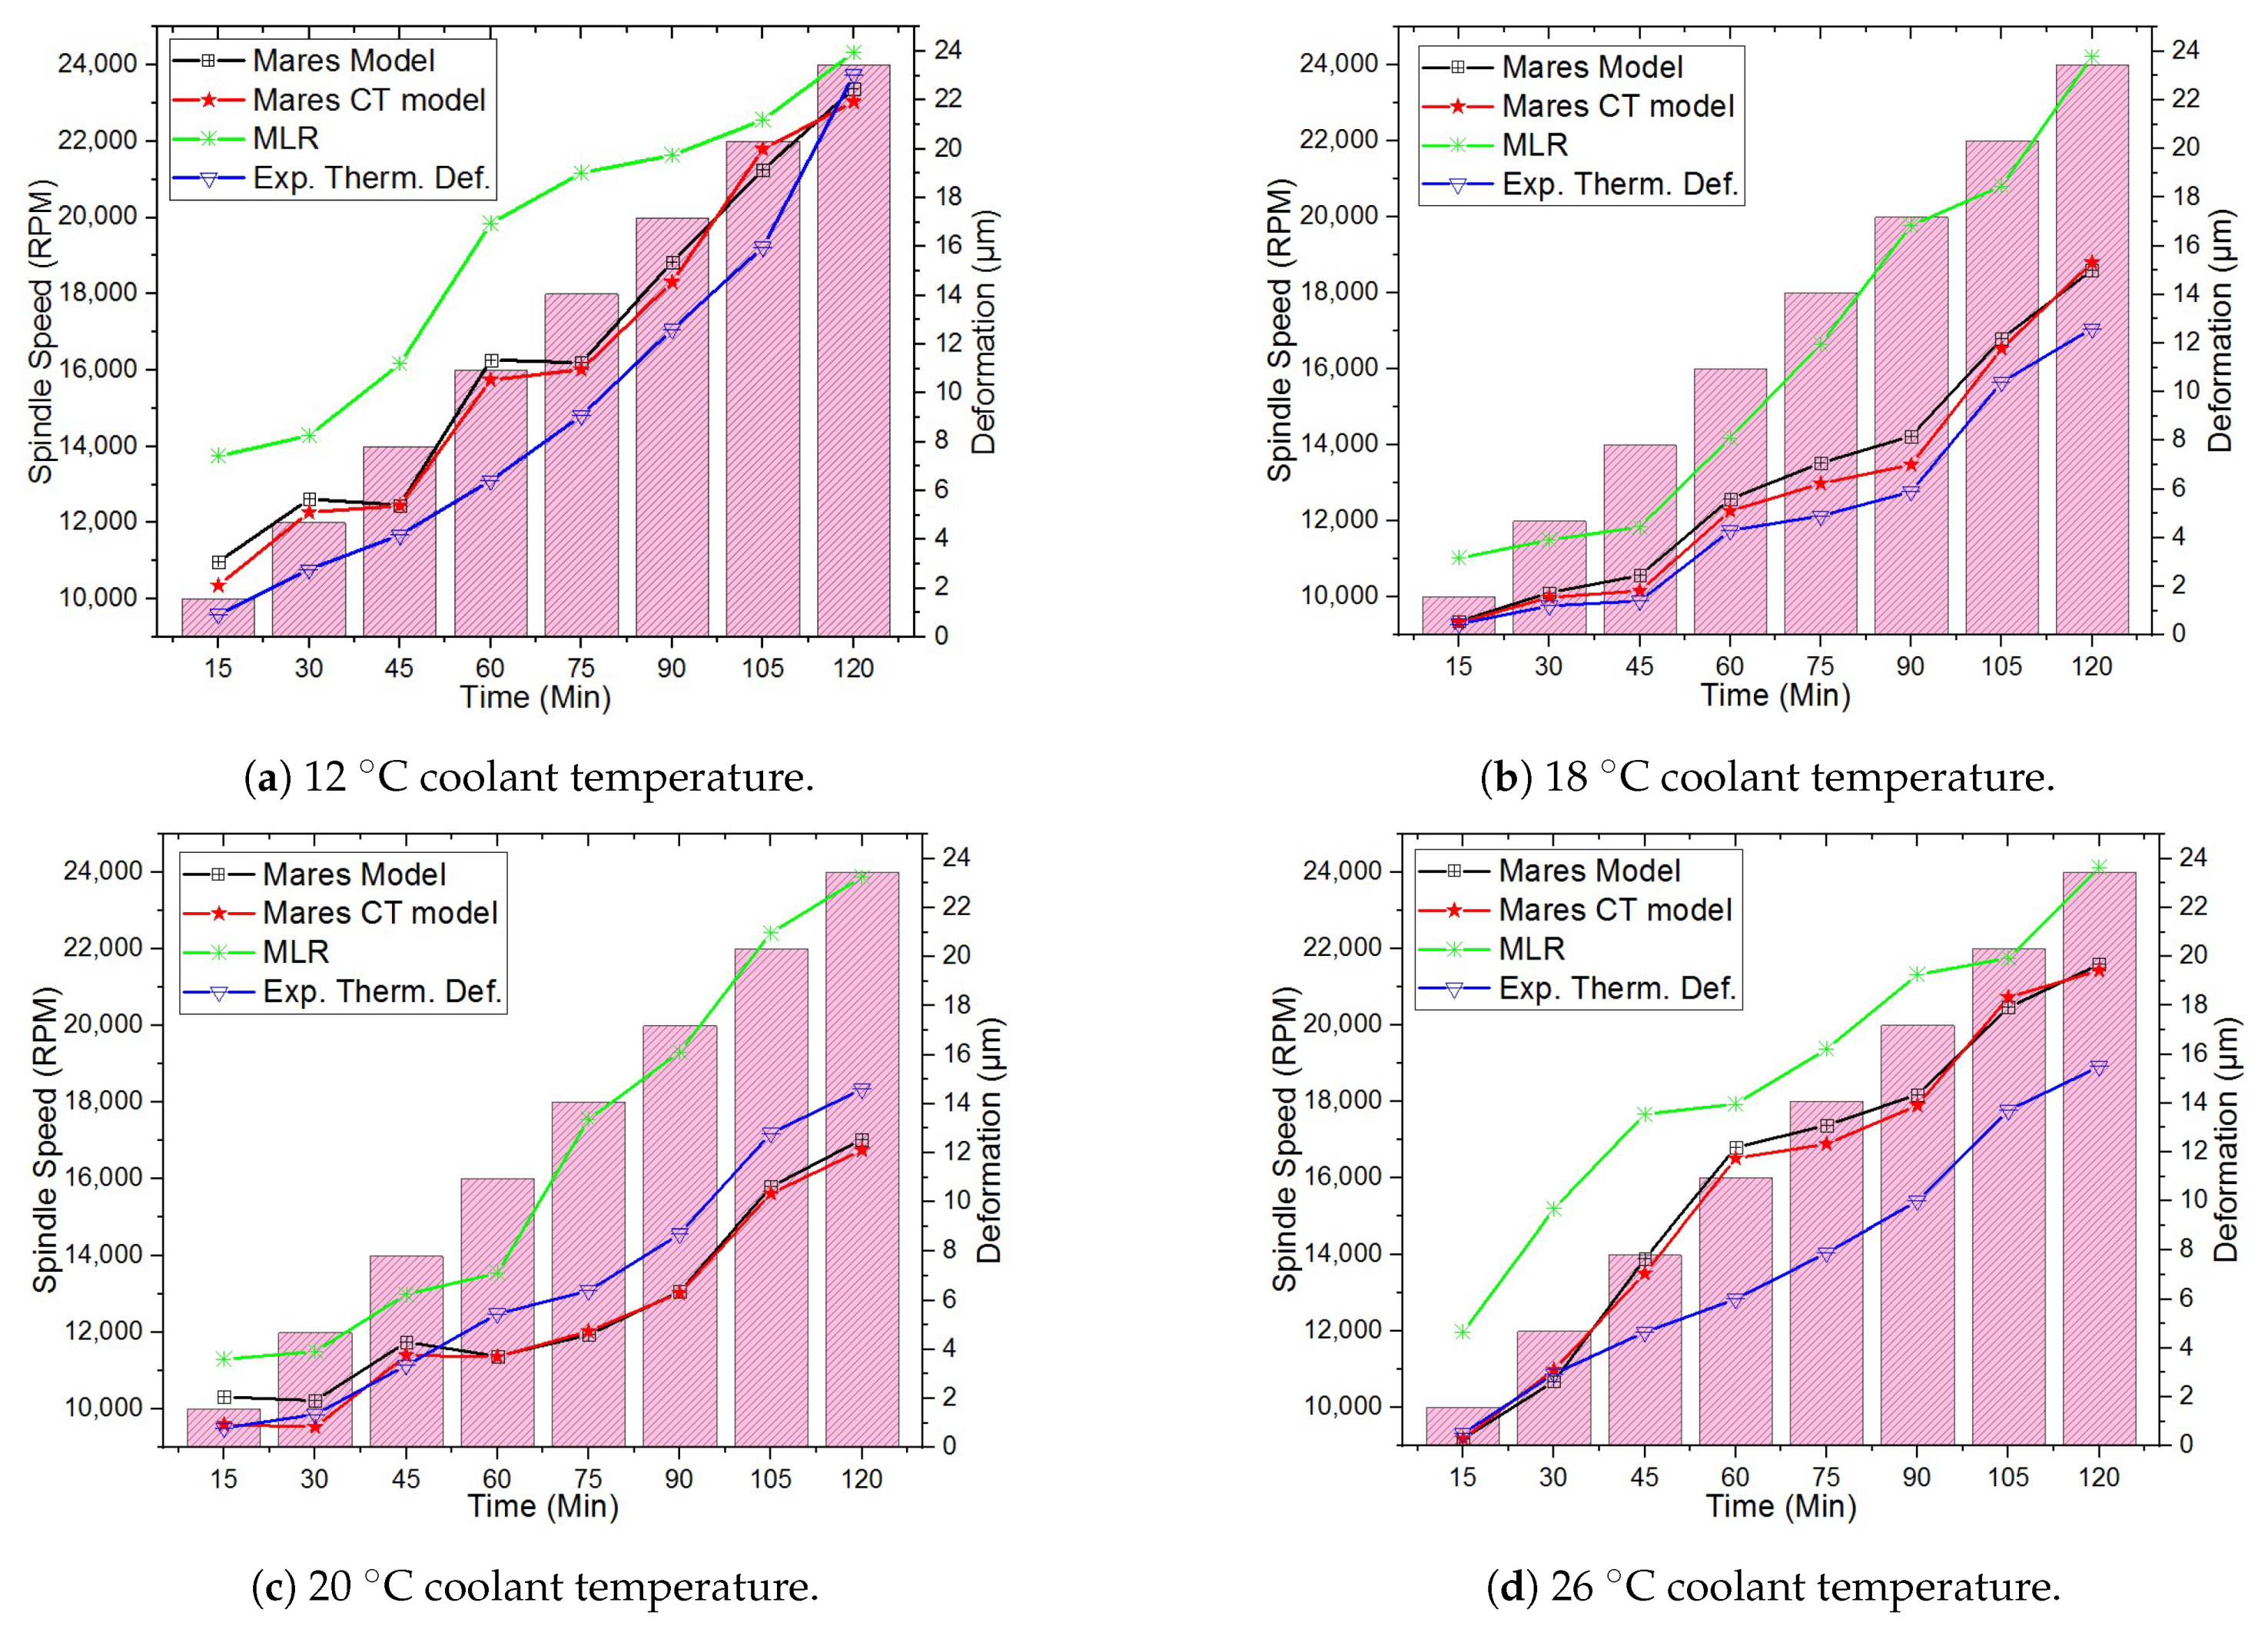
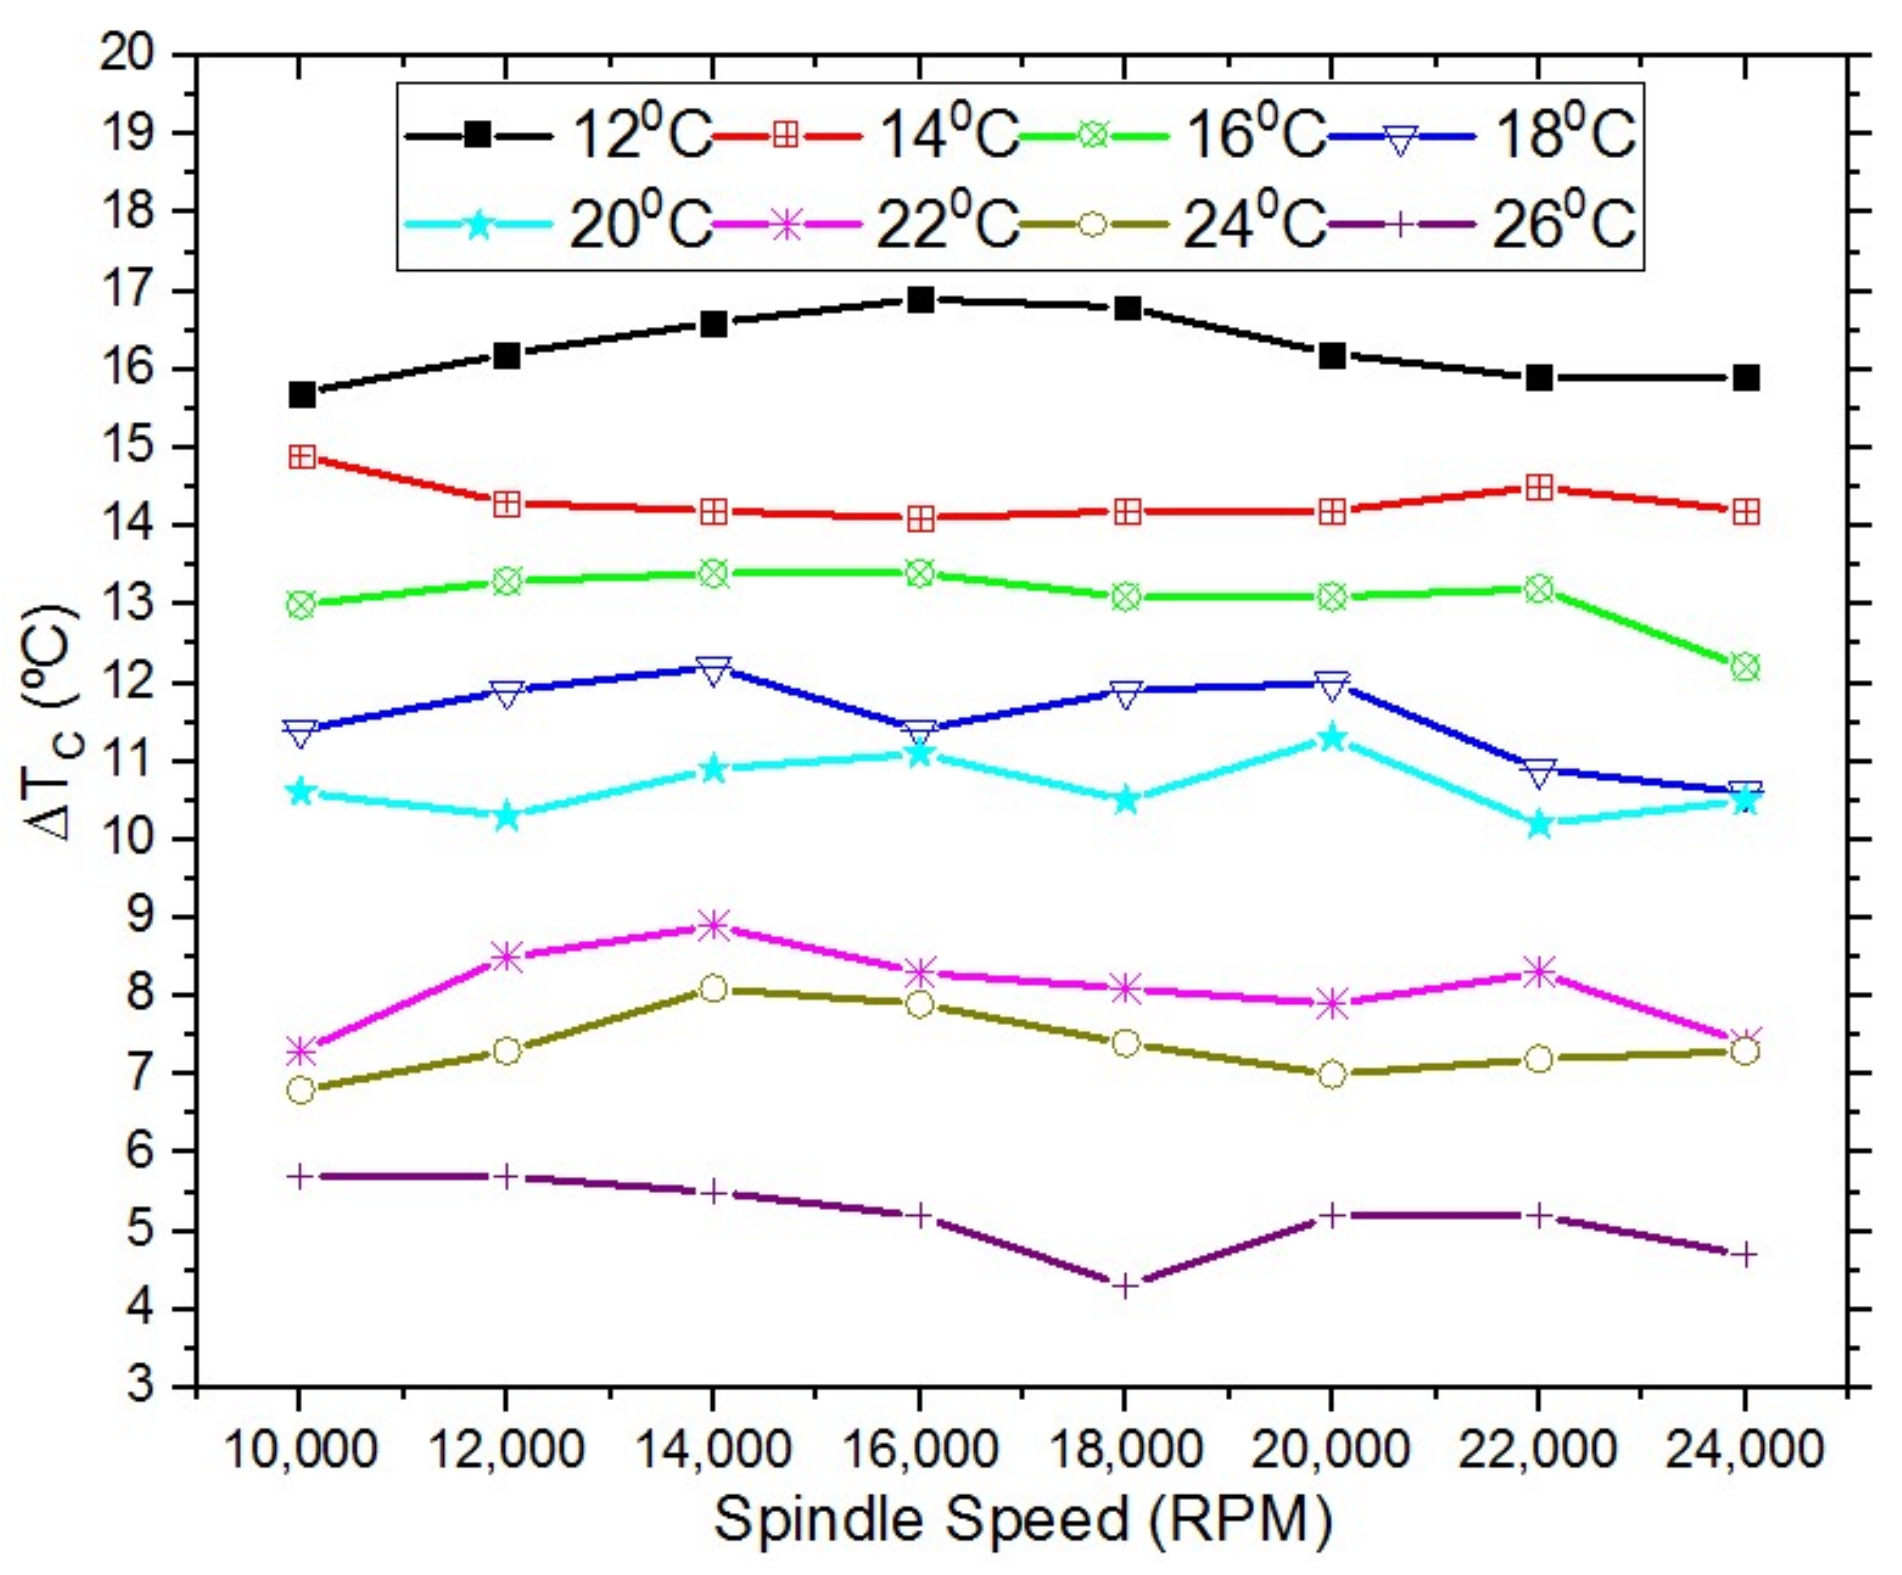
3.1. Effect of the Coolant Temperature on the Standalone Built-In Spindle System

Table 2 and Figure 4 show the residual thermal errors of the standalone built-in spindle system in the steady-state operation of the z-axis under different coolant temperatures and spindle rotating speeds with a constant coolant flow rate of 5 LPM and ambient temperature of 26 C. Table 2 shows the thermal deformations at different coolant temperatures and a constant flow rate of 5 LPM with different spindle rotating speeds. At different coolant temperatures of 12 C to 26 C, experimental thermal deformations at different spindle rotating speeds of 10,000 to 24,000 rpm with 2000 rpm intervals, increase with increasing spindle rotating speeds because the spindle bearing’s heat generation increases with increasing spindle rotating speeds. The experimental thermal deformation decreases and the accuracy improvement of the Mares CT model increases as the coolant temperature approaches an ambient temperature. The residual thermal errors between the Mares model and the Mares CT model over the experimental thermal deformation show that the Mares CT model has better prediction accuracy than the Mares model at different coolant temperatures and spindle rotating speeds. In the Mares model, coolant temperature impacts are not considered; however, in the Mares CT model, the effects of the coolant temperature are considered, leading to an increase in the MT accuracy. The average prediction accuracy improvements of the Mares CT model are 18.17%, 22.78%, 24.37%, 25.51%, 30.84%, 35.76%, 36.55%, and 39.50% at coolant temperatures of 12 C, 14 C, 16 C, 18 C, 20 C, 22 C, 24 C, and 26 C, respectively.
Figure 4 shows that MLR model prediction accuracy worsens with increasing spindle speeds at different coolant temperatures. Thus, the MLR model is suitable for lower spindle speeds due to experimental data considered for the MLR analysis are at 12,000 rpm spindle rotating speed at different coolant temperatures; however, residuals between the MLR model, Mares model, and Mares CT model are large. The Mares CT model achieves better accuracy at different spindle speeds and coolant temperatures compared to the Mares and MLR models due to its consideration of the coolant temperature impact on the MT.
In a real machining process, the rotating speed of the spindle is not constant and varies with the machining product, machining mode, and cutting conditions. To validate the feasibility of the Mares, Mares CT, and MLR models in real machining processes, 15-min time intervals were used in the dynamic operation. Table 3 shows the dynamic operation at different coolant temperatures of 12 C, 18 C, 20 C, and 26 C. The experimental thermal deformations at different spindle rotating speeds of 10,000 to 24,000 rpm with 2,000 rpm intervals, increases with the increase in spindle rotating speed due to the spindle bearing heat generation increase with the increasing spindle rotating speed. However, the residual in the experimental thermal deformation between the Mares and Mares CT models shows that the Mares CT model achieves better prediction accuracy than the Mares model at different coolant temperatures and spindle speeds. The average prediction accuracy improvements are 16.59%, 35.35%, 15.59%, and 12.19% at coolant temperatures of 12 C, 18 C, 20 C, and 26 C, respectively. The Mares CT model ( δ M C T ) efficiency in the dynamic operations are 0.97, 0.99, 0.89, and 0.92 at different coolant temperatures of 12 C, 18 C, 20 C, and 26 C, respectively.
Figure 5 also shows that the MLR model prediction accuracy worsens with increasing spindle rotating speeds at medium coolant temperatures of 18 C and 20 C. With the lower (12 C) and higher (26 C) coolant temperatures of the MLR model, the prediction accuracy is good at the selected spindle rotating speeds; however, the residuals between the MLR model, Mares model, and Mares CT model are large. The Mares CT model achieves greater accuracy improvements at different spindle rotating speeds and coolant temperatures than the Mares and MLR models due to its consideration of the effect of coolant temperature on the MT.
From the overall analysis of the standalone built-in spindle system, the coolant temperature is shown to have a stronger impact on the accuracy of the MT, and accuracy can, thus, be improved by considering the coolant temperature effect on the MT.
Figure 6 shows the differences in the inlet and outlet coolant temperatures at steady-state operation with different coolant temperatures and spindle rotating speeds. At the different coolant temperatures, from 12 C to 26 C at a constant flow rate of 5 LPM and a 26 C ambient temperature, coolant temperature differences are in the range of 16.9 C to 4.3 C and decrease as the coolant temperature approaches an ambient temperature.

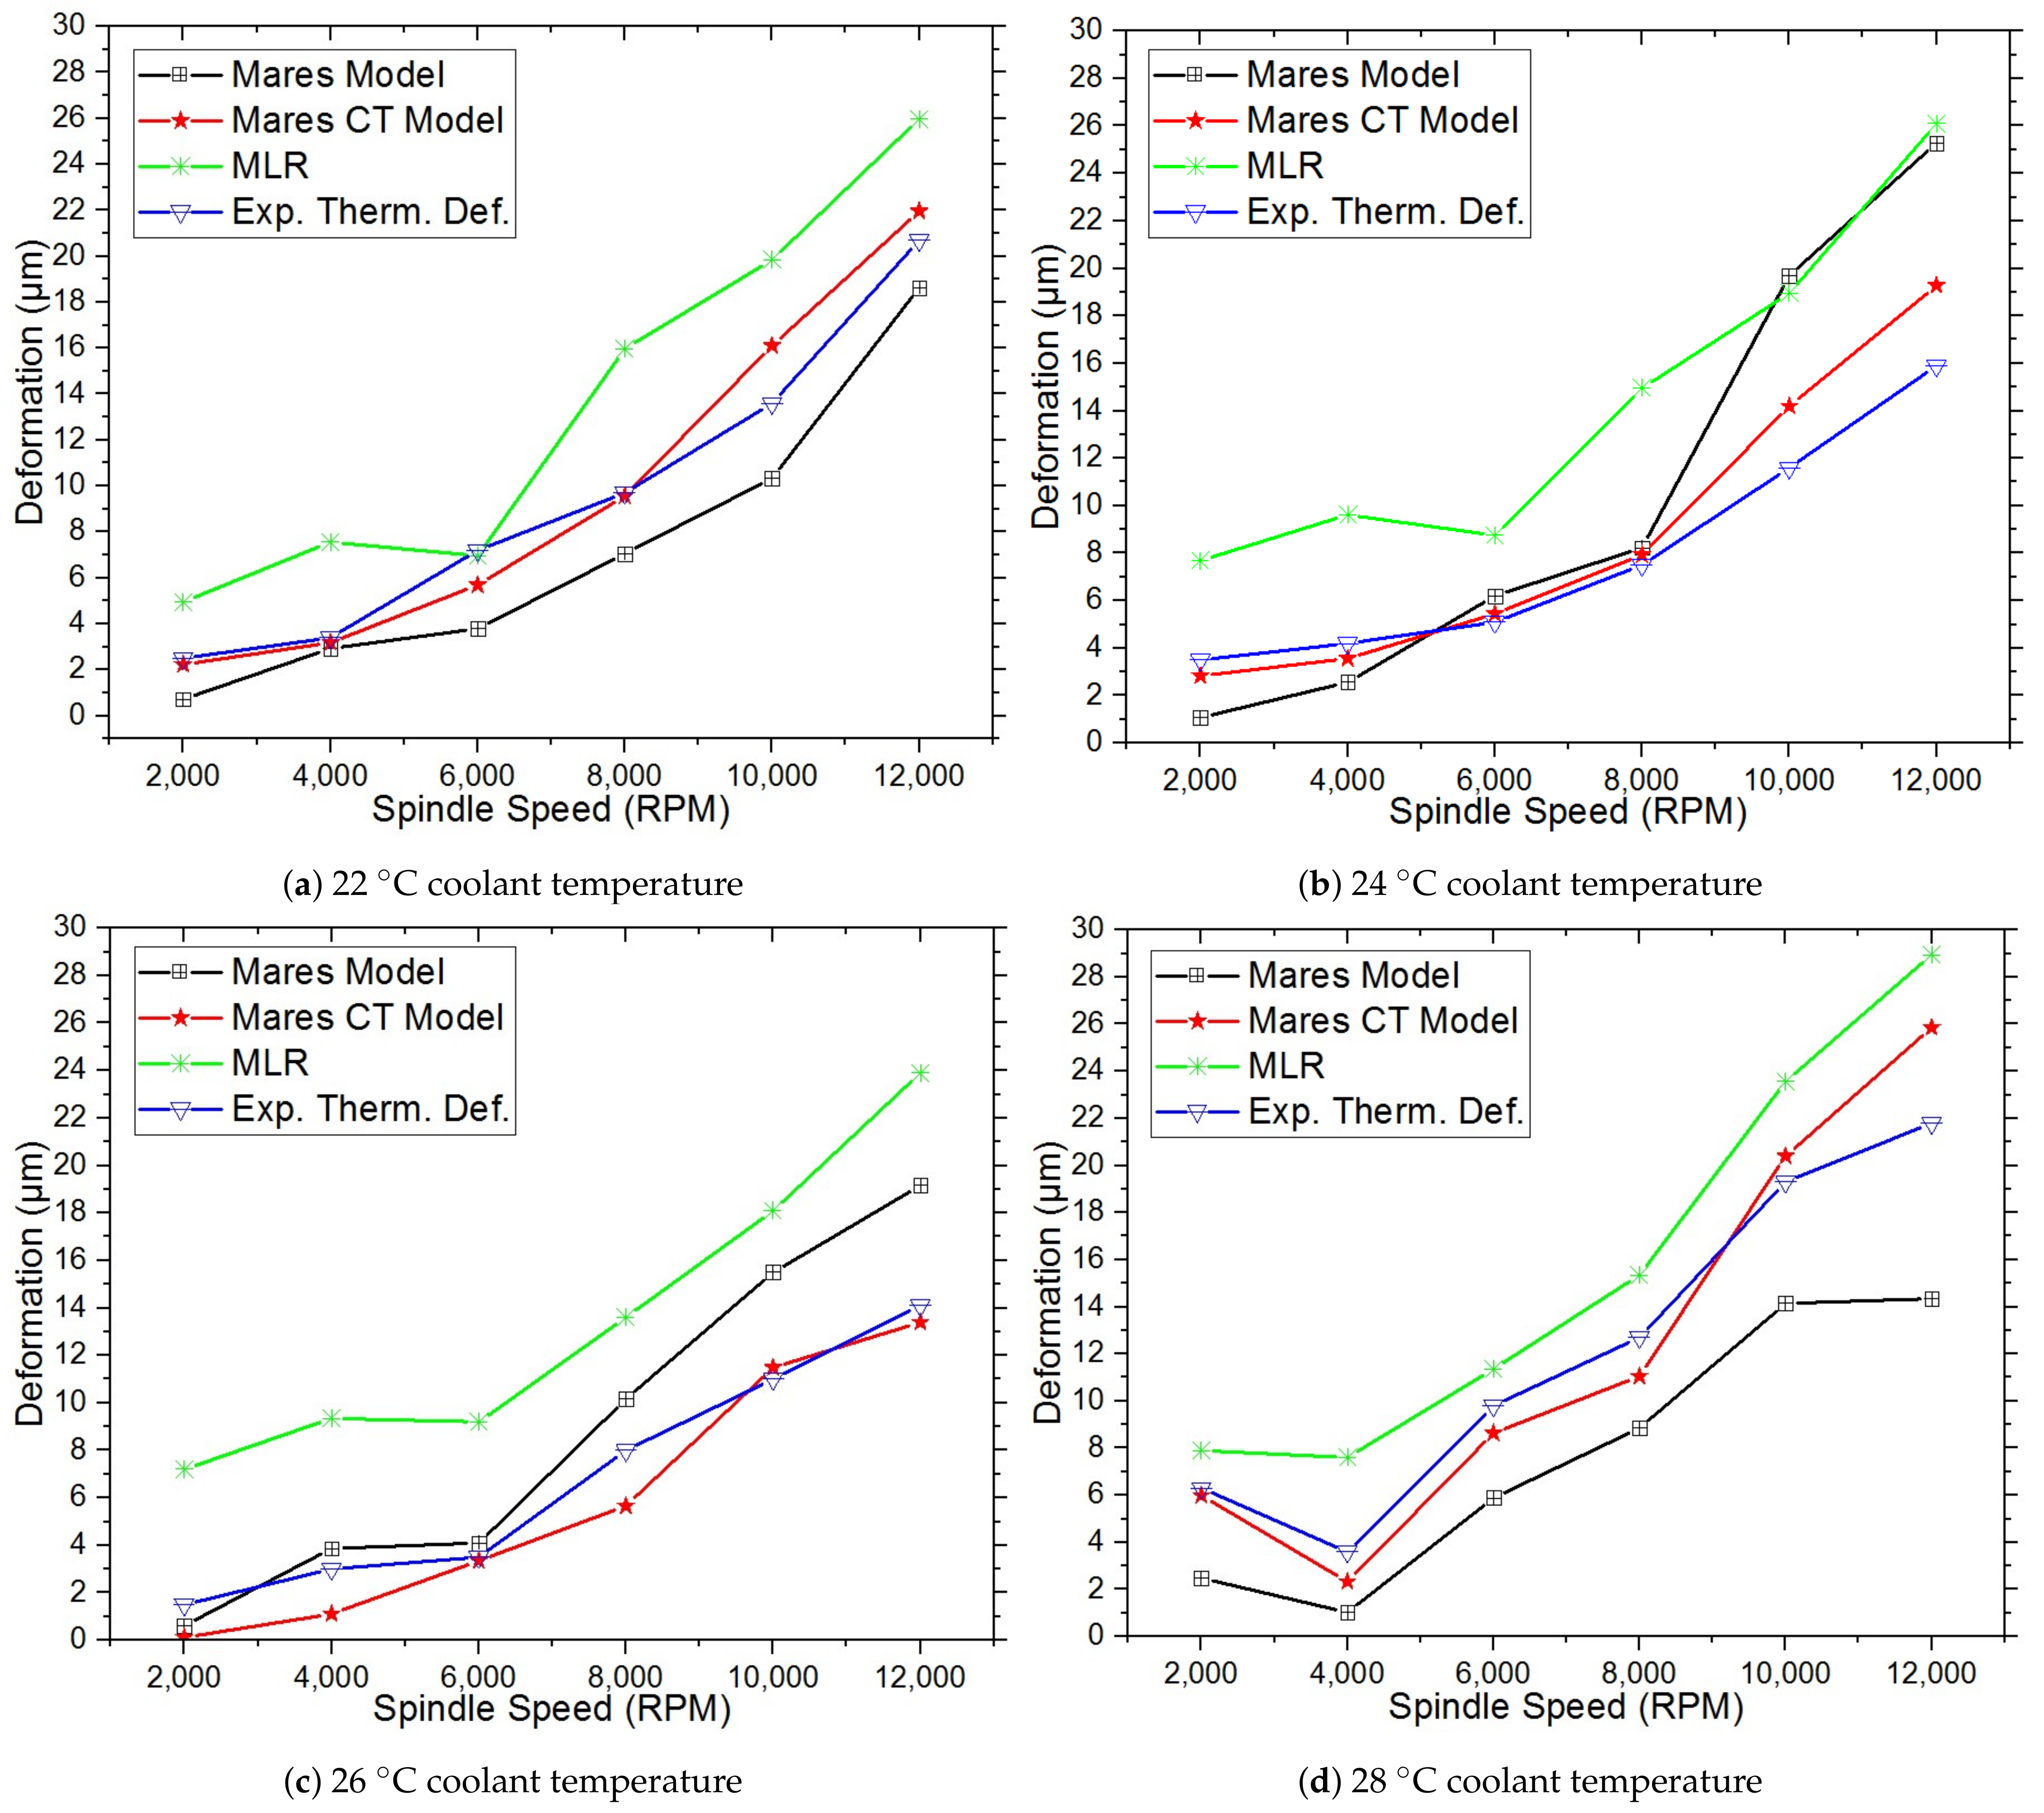
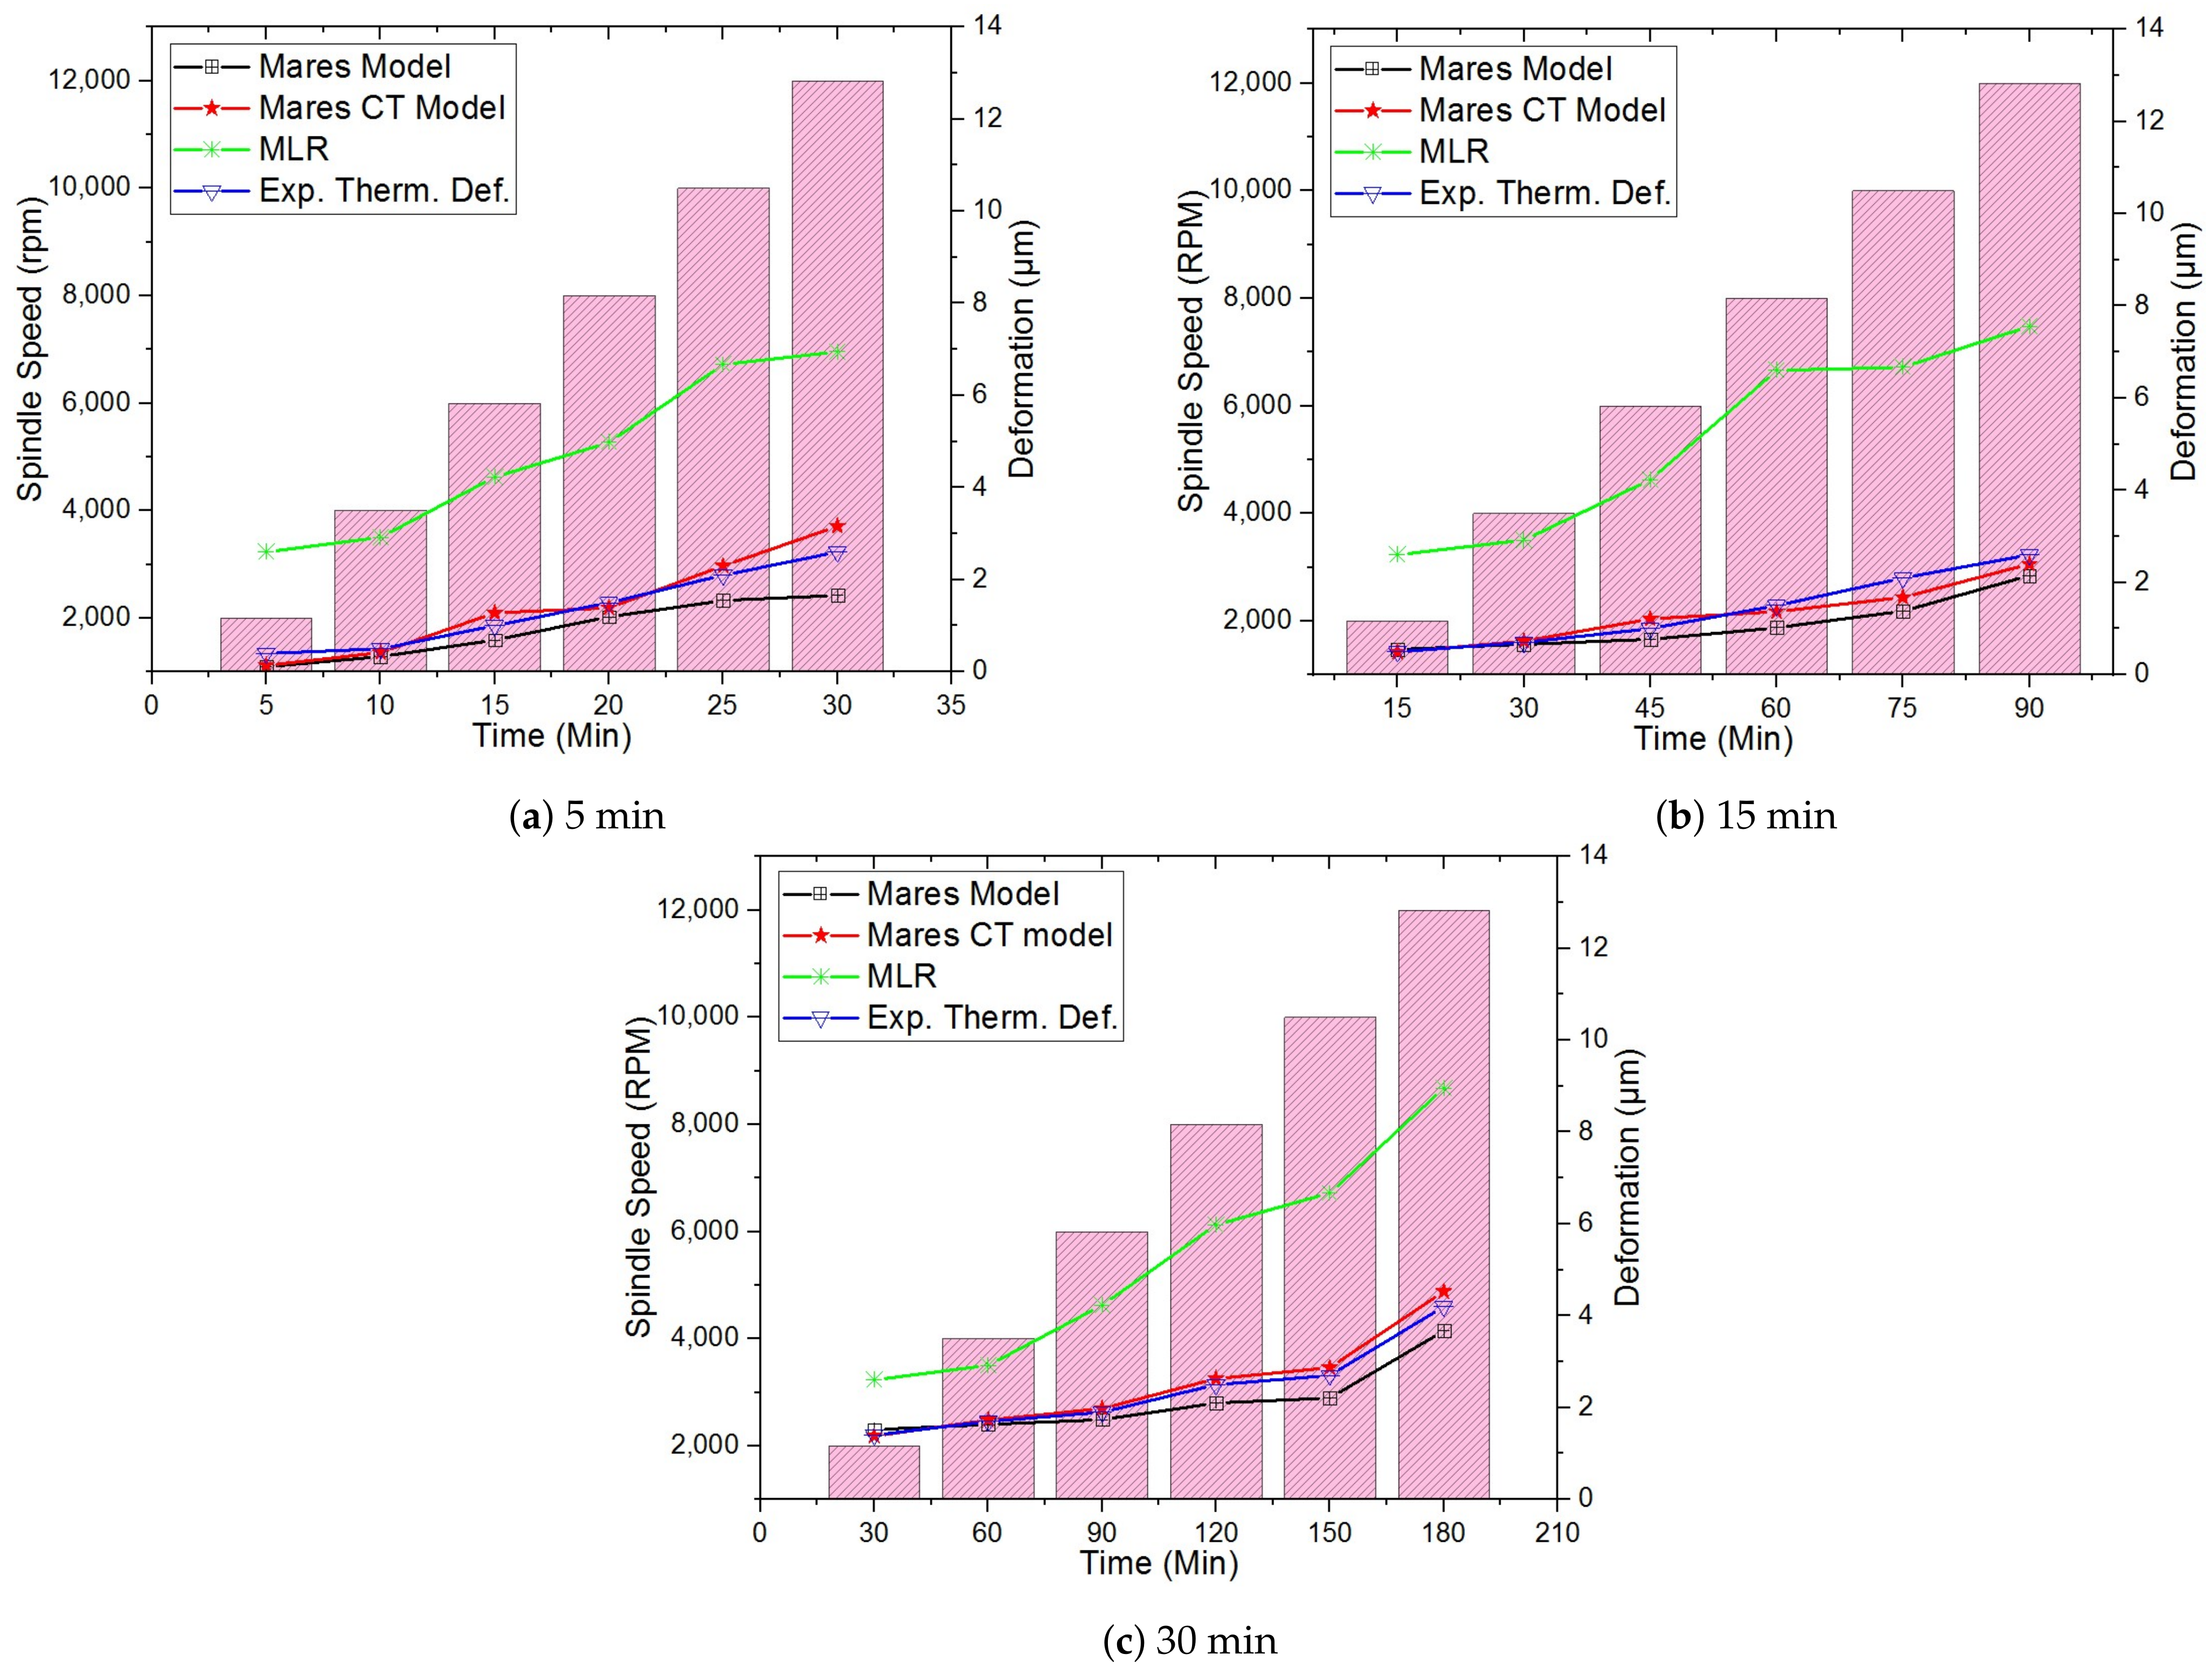
3.2. Effect of Coolant Temperature on CNC Machine with a Direct-Drive Spindle

Table 4 and Figure 7 show that the residual thermal errors of the CNC machine with a direct-drive spindle in the steady-state operation of the z-axis are different under the different coolant temperatures and spindle speeds with a constant coolant flow rate of 5 LPM and a 26 C ambient temperature. Table 4 shows the thermal deformations at different coolant temperatures and a constant flow rate of 5 LPM with different spindle rotating speeds. At different coolant temperatures of 22 C to 28 C, experimental thermal deformations at different spindle rotating speeds of 2,000 rpm to 12,000 rpm with 2000 rpm intervals, increase with the increasing spindle rotating speed because the spindle bearing’s heat generation increases with increasing spindle speeds. The experimental thermal deformation decreases and the average accuracy improvement of the Mares CT model increases as the coolant temperature approaches the ambient temperature. However, when the coolant temperature exceeds the ambient temperature, the overall accuracy improvement begins to worsen with the increasing coolant temperature. The residual between the Mares model and the Mares CT model over the experimental thermal deformation shows that the Mares CT model achieves better prediction accuracies than the Mares model at different coolant temperatures and spindle rotating speeds. The average prediction accuracy improvements are 58.30%, 62.42%, 66.35%, and 65.70% at 22 C, and 24 C, 26 C, and 28 C coolant temperatures, respectively.
Figure 7 also shows that the MLR model prediction accuracy trends with spindle rotating speeds at different coolant temperatures and can also be used for thermal deformation prediction; however, the residuals between the MLR, Mares, and Mares CT models are large. The Mares CT model achieves greater accuracy improvements at different spindle speeds and coolant temperatures than the Mares and MLR models due to its consideration of the effects of coolant temperature on the MT.
In a real machining process, the rotational speed of the spindle is not constant and varies with the machining product, machining mode, and cutting conditions. To validate the feasibility of the Mares, Mares CT, and MLR models in real machining processes, three periods in which the spindle rotating speed increased to 5, 15, and 30 min were used in the dynamic operations. Table 5 shows the residual between the Mares and Mares CT models over the experimental thermal deformation and the accuracy improvement in the dynamic operation at the constant coolant temperatures of 26 C, a flow rate of 5 LPM, and a 26 C ambient temperature with different spindle rotating speeds of 2000 to 12,000 rpm with 2000 rpm intervals of a CNC machine with a direct-drive spindle. At different time intervals of 5, 15, and 30 min, the experimental thermal deformations at different spindle rotating speeds of 2000 to 12,000 rpm with 2000 rpm intervals, increase with increases the spindle rotating speeds due to the spindle bearing’s heat generation increases with increasing spindle rotating speeds. The average accuracy improvement increases with longer time intervals because the heat diffusion from the inner parts to the outer parts of the machine requires some time. However, the residual between the Mares and Mares CT models with regard to the experimental thermal deformation shows that the Mares CT model achieves better prediction accuracies than the Mares model at different time intervals and spindle rotating speeds. The average prediction accuracy improvements are 40.25%, 60.33%, and 60.16% at 5 min, 15 min, and 30 min time intervals, respectively. The Mares CT model ( δ M C T ) efficiency in the dynamic operations are 0.97, 0.95, and 0.98 at a 26 C coolant temperature and at different time periods of 5, 15, and 30 min, respectively.
Figure 8 also shows that MLR model prediction accuracy worsens with increasing spindle rotating speeds at different time intervals of 5, 15, and 30 min; thus, the MLR model is suitable for lower spindle speeds because the experimental data used in the MLR analysis were measured at a spindle rotating speed of 6000 rpm. However, the residuals between the MLR, Mares, and Mares CT models are large. The Mares CT model achieves greater accuracy improvements at different spindle speeds and coolant temperatures than the Mares and MLR models due to the coolant temperature effect.
From the overall analysis of a CNC machine with a direct-drive spindle, the coolant temperature is shown to have a stronger impact on the MT accuracy, and accuracy can be improved by considering the coolant temperature effect on the MT.

4. Conclusions

This study analyzed a mathematical thermal error compensation model for the z-axis thermal deformation of a standalone built-in spindle system and a CNC machine with a direct-drive spindle at different coolant temperatures with varying spindle rotating speeds. Experimental results show that the thermal deformation of the spindle is directly related to the coolant temperature and strongly affects system accuracy within certain limits.
At different coolant temperatures of a standalone built-in spindle system, accuracy improvements of the Mares CT model over the Mares model are 18.17% to 39.50% at the different coolant temperatures of 12 C to 26 C and the accuracy can be controlled within the range of 0.03 μ m to 5.24 μ m, while the coolant temperature is above 16 C. However, at the different coolant temperatures of the CNC machine with a direct-drive spindle, accuracy improvements of the Mares CT model over the Mares model are 58.30% to 66.35% at different coolant temperatures of 22 C to 28 C and the accuracy can be controlled within the range of 0.14 μ m to 4.05 μ m. This analysis shows that the experimental thermal deformation decreases and the accuracy improvement of the Mares CT model increases as the coolant temperature approaches an ambient temperature and above ambient temperature; the experimental thermal deformation increases and the accuracy improvement of the Mares CT model worsens with the increase in coolant temperatures.
The dynamic analysis also validates the feasibility of the Mares CT model; the accuracy improvements of the Mares CT model over the Mares model are 12.19% to 35.53% with the standalone built-in spindle system at 12 C to 26 C coolant temperatures at a time interval of 15 min. In the CNC machine with a direct-drive spindle, the accuracy improvements of the Mares CT model over the Mares model are 40.25% to 60.33% with 5, 15, and 30 min time intervals at a 26 C constant coolant temperature. This analysis shows that the thermal deformation worsens with increasing spindle speeds because the spindle bearing’s heat generation increases with increasing spindle rotating speeds. Moreover, the improvement in average accuracy markedly increases with a longer time interval.
This study shows that the developed new model based on the coolant temperature effect on the Mares model (Mares CT model) markedly improves the MT accuracy at different coolant temperatures and spindle speeds compared to the Mares model.

Author Contributions

W.-J.L., S.N.M., K.-Y.L.: conceptualization and methodology; W.-J.L., S.N.M. and S.-Y.K.: performed the experiments; W.-J.L., S.N.M. and S.-Y.K.: data analysis and investigation; W.-J.L. and S.N.M.: wrote the paper. All authors have read and agreed to the published version of the manuscript.

Funding

This research was funded by the Ministry of Science and Technology, Taiwan, under grant number MOST 109-2622-E167-015.

Data Availability Statement

Not applicable.

Conflicts of Interest

The authors declare no conflict of interest.

References

  1. Li, K.Y.; Luo, W.J.; Huang, J.Z.; Chan, Y.C.; Faridah, D. Operational temperature effect on positioning accuracy of a single-axial moving carrier. Appl. Sci. 2017, 7, 420. [Google Scholar] [CrossRef] [Green Version]
  2. Zhang, C.; Gao, F.; Yan, L. Thermal error characteristic analysis and modeling for machine tools due to time-varying environmental temperature. Precis. Eng. 2017, 47, 231–238. [Google Scholar] [CrossRef]
  3. Groos, L.; Held, C.; Keller, F.; Wendt, K.; Franke, M.; Gerwien, N. Mapping and compensation of geometric errors of a machine tool at different constant ambient temperatures. Precis. Eng. 2020, 63, 10–17. [Google Scholar] [CrossRef]
  4. Tachiya, H.; Hirata, H.; Ueno, T.; Kaneko, Y.; Nakagaki, K.; Ishino, Y. Evaluation of and Compensation for Thermal Deformation in a Compact CNC lathe. Int. J. Autom. Technol. 2012, 6, 137–146. [Google Scholar] [CrossRef]
  5. Grama, S.N.; Mathur, A.; Badhe, A.N. A model-based cooling strategy for motorized spindle to reduce thermal errors. Int. J. Mach. Tools Manuf. 2018, 132, 3–16. [Google Scholar] [CrossRef]
  6. Denkena, B.; Bergmann, B.; Klemme, H. Cooling of motor spindles—A review. Int. J. Adv. Manuf. Technol. 2020, 110, 3273–3294. [Google Scholar] [CrossRef]
  7. Li, K.Y.; Luo, W.J.; Yang, M.H.; Hong, X.H.; Luo, S.J.; Chen, C.N. Effect of supply cooling oil temperature in structural cooling channels on the positioning accuracy of machine tools. J. Mech. 2019, 35, 887–900. [Google Scholar] [CrossRef]
  8. Li, K.Y.; Luo, W.J.; Zeng, Y.R.; Huang, I.H. Increase in Accuracy of a Built-in Spindle by Adaptive Cooling Control with Varied Coolant Volume and Temperature. Sens. Mater. 2020, 32, 3689–3706. [Google Scholar] [CrossRef]
  9. Li, K.Y.; Luo, W.J.; Hong, X.H.; Wei, S.J.; Tsai, P.H. Enhancement of machining accuracy utilizing varied cooling oil volume for machine tool spindle. IEEE Access 2020, 8, 28988–29003. [Google Scholar] [CrossRef]
  10. Chiang, W.M.; Luo, W.J.; Wang, F.J. Temperature control scheme using hot-gas bypass for a machine tool oil cooler. J. Mech. Sci. Technol. 2018, 32, 1391. [Google Scholar] [CrossRef]
  11. Chen, T.C.; Chang, C.J.; Hung, J.P.; Lee, R.M.; Wang, C.C. Real-time compensation for thermal errors of the milling machine. Appl. Sci. 2016, 6, 101. [Google Scholar] [CrossRef] [Green Version]
  12. Reddy, T.N.; Shanmugaraj, V.; Prakash, V.; Krishna, S.G.; Narendranath, S.; Kumar, P.S. Real-time thermal error compensation module for intelligent Ultra Precision Turning Machine (iUPTM). Procedia Mater. Sci. 2014, 6, 1981–1988. [Google Scholar] [CrossRef] [Green Version]
  13. Zhou, H.C.; Hu, P.C.; Tan, H.L.; Cheng, J.H.; Liu, G.A. Modelling and compensation of thermal deformation for MT based on the real-time data of the CNC system. Procedia Manuf. 2018, 26, 1137–1146. [Google Scholar]
  14. Li, K.Y.; Liao, M.C.; Maurya, S.N. Linear Axial Error Signal Measurement and Processing Method of a Machine Tool for Accuracy Compensation Improvement. Sens. Mater. 2022, 34, 4137. [Google Scholar]
  15. Liu, K.; Sun, M.; Zhu, T.; Wu, Y.; Liu, Y. Modeling and compensation for spindle’s radial thermal drift error on a vertical machining center. Int. J. Mach. Tools Manuf. 2016, 105, 58–67. [Google Scholar] [CrossRef]
  16. Fu, Y.Q.; Gao, W.G.; Yang, J.Y.; Zhang, Q.; Zhang, D.W. Thermal error measurement, modeling and compensation for motorized spindle and the research on compensation effect validation. In Advanced Materials Research; Trans Tech Publications Ltd.: Baech, Switzerland, 2014; Volume 889, pp. 1003–1008. [Google Scholar]
  17. Li, Y.; Zhao, W.; Wu, W.; Lu, B.; Chen, Y. Thermal error modeling of the spindle based on multiple variables for the precision machine tool. Int. J. Adv. Manuf. Technol. 2014, 72, 1415–1427. [Google Scholar] [CrossRef]
  18. Yang, H.; Ni, J. Dynamic Modeling for MT Thermal Error Compensation. J. Manuf. Sci. Eng. 2003, 125, 245–254. [Google Scholar] [CrossRef]
  19. Lin, C.J.; Su, X.Y.; Hu, C.H.; Jian, B.L.; Wu, L.W.; Yau, H.T. A linear regression thermal displacement lathe spindle model. Energies 2020, 13, 949. [Google Scholar] [CrossRef] [Green Version]
  20. Chen, C.C.; Hung, W.C. Thermal Error Modeling of CNC Machine Tool Spindle Based on Multiple Regression and Features Selection. In Proceedings of the 2021 IEEE 3rd Eurasia Conference on IOT, Communication and Engineering (ECICE), Yunlin, Taiwan, 29–31 October 2021; pp. 583–587. [Google Scholar]
  21. Yang, J.; Zhang, D.; Feng, B.; Mei, X.; Hu, Z. Thermal-induced errors prediction and compensation for a coordinate boring machine based on time series analysis. Math. Probl. Eng. 2014, 2014, 784218–784231. [Google Scholar] [CrossRef] [Green Version]
  22. Vyroubal, J. Compensation of machine tool thermal deformation in spindle axis direction based on decomposition method. Precis. Eng. 2012, 36, 121–127. [Google Scholar] [CrossRef]
  23. Li, Z.; Zhu, B.; Dai, Y.; Zhu, W.; Wang, Q.; Wang, B. Research on Thermal Error Modeling of Motorized Spindle Based on BP Neural Network Optimized by Beetle Antennae Search Algorithm. Machines 2021, 9, 286. [Google Scholar] [CrossRef]
  24. Wang, J.; Jiang, T.; Shen, J.; Dai, J.; Pan, Z.; Deng, X. Thermal Error Compensation of Spindle System of Computer Numerically Controlled Machine Tools Through Experiments and Modeling. Instrum. Mes. Métrologies 2020, 19, 301–309. [Google Scholar] [CrossRef]
  25. Li, G.; Tang, X.; Li, Z.; Xu, K.; Li, C. The temperature-sensitive point screening for spindle thermal error modeling based on IBGOA-feature selection. Precis. Eng. 2022, 73, 140–152. [Google Scholar] [CrossRef]
  26. Horejs, O.; Mares, M.; Hornych, J. Real-Time Compensation of Machine Tool Thermal Error Including Cutting Process. J. Mach. Eng. 2015, 15, 5–18. [Google Scholar]
  27. Mareš, M.; Horejš, O.; Havlík, L. Thermal error compensation of a 5-axis machine tool using indigenous temperature sensors and CNC integrated Python code validated with a machined test piece. Precis. Eng. 2020, 66, 21–30. [Google Scholar] [CrossRef]
  28. Mareš, M.; Horejš, O. Modelling of cutting process impact on machine tool thermal behaviour based on experimental data. Procedia Cirp 2017, 58, 152–157. [Google Scholar] [CrossRef]
  29. Mareš, M.; Horejš, O.; Fiala, Š.; Lee, C.; Jeong, S.; Kim, K. Strategy of Milling Center Thermal Error Compensation Using a Transfer Function model and its Validation Outside of Calibration Range. MM Sci. J. 2019, HSM2019, 3156–3163. [Google Scholar] [CrossRef]
  30. Horejš, O.; Mareš, M.; Mlčoch, A. Smart Sensor for Enhancement of a Multi-Spindle Automatic Lathe Thermal Error Compensation Model. MM Sci. J. 2021, ICTIMT2021, 4706–4712. [Google Scholar] [CrossRef]
  31. Hsieh, M.C.; Maurya, S.N.; Luo, W.J.; Li, K.Y.; Hao, L.; Bhuyar, P. Coolant Volume Prediction for Spindle Cooler with Adaptive Neuro-fuzzy Inference System Control Method. Sens. Mater. 2022, 34, 2447–2466. [Google Scholar] [CrossRef]
  32. Luo, W.J.; Chen, K.S.; Yu, C.M.; Hsu, T.H. The fuzzy process quality evaluation model for the stb quality characteristic of machining. Appl. Sci. 2020, 10, 8272. [Google Scholar] [CrossRef]
  33. Yu, C. M; Luo, W.J; Hsu, T.H; Lai, K.K. Two-tailed fuzzy hypothesis testing for unilateral specification process quality index. Mathematics 2020, 8, 2129. [Google Scholar] [CrossRef]
  34. Fang, B.; Cheng, M.; Gu, T.; Ye, D. An improved thermal performance modeling for high-speed spindle of machine tool based on thermal contact resistance analysis. Int. J. Adv. Manuf. Technol. 2022, 120, 5259–5268. [Google Scholar] [CrossRef]
  35. Xiang, S.; Yao, X.; Du, Z.; Yang, J. Dynamic linearization modeling approach for spindle thermal errors of machine tools. Mechatronics 2018, 53, 215–228. [Google Scholar] [CrossRef]
  36. Liu, T.; Gao, W.; Zhang, D.; Zhang, Y.; Chang, W.; Liang, C.; Tian, Y. Analytical modeling for thermal errors of motorized spindle unit. Int. J. Mach. Tools Manuf. 2017, 112, 53–70. [Google Scholar] [CrossRef] [Green Version]
  37. Liu, K.; Liu, Y.; Sun, M.; Li, X.; Wu, Y. Spindle axial thermal growth modeling and compensation on CNC turning machines. Int. J. Adv. Manuf. Technol. 2016, 87, 2285–2292. [Google Scholar] [CrossRef]
  38. Reddy, T.N.; Shanmugaraj, V.; Vinod, P.; Krishna, S.G. Real-time thermal error compensation strategy for precision machine tools. Mater. Today Proc. 2020, 22, 2386–2396. [Google Scholar] [CrossRef]
  39. Ma, C.; Liu, J.; Wang, S. Thermal error compensation of linear axis with fixed-fixed installation. Int. J. Mech. Sci. 2020, 175, 105531. [Google Scholar] [CrossRef]
  40. De-xing, Z.; Weifang, C. Effect of a cooling unit on high-speed motorized spindle temperature with a scaling factor. Int. J. Adv. Manuf. Technol. 2022, 120, 2559–2572. [Google Scholar] [CrossRef]
  41. Kaulagi, M.N.; Sonawane, H.A. Thermal network-based compensation model for a vertical machining center subjected to ambient temperature fluctuations. Int. J. Adv. Manuf. Technol. 2022, 1–22. [Google Scholar] [CrossRef]
  42. Liu, Y.C.; Li, K.Y.; Tsai, Y.C. Spindle thermal error prediction based on LSTM deep learning for a CNC machine tool. Appl. Sci. 2021, 11, 5444. [Google Scholar] [CrossRef]
  43. Kine, S.; McClintock, F. Describing uncertainties in single-sample experiments. Mech. Eng. 1953, 75, 3–8. [Google Scholar]
  44. Zeybek, M. Nash-sutcliffe efficiency approach for quality improvement. J. Appl. Math. Comput. 2018, 2, 496–503. [Google Scholar] [CrossRef]
Figure 1. Standalone built-in spindle system: (a) T-type temperature sensor position and the outer dimensions; (b) experimental setup.
Machines 10 01201 g001
Figure 2. CNC machine with a direct-drive spindle: (a) T-type temperature sensor position and the outer dimensions; (b) experimental setup.
Machines 10 01201 g002
Figure 3. Working of the cooling control system.
Machines 10 01201 g003
Figure 4. Thermal deformations of the standalone built-in spindle system in the steady-state operation at the different coolant temperatures and the spindle rotating speeds with a constant coolant flow rate of 5 LPM: (a) 12 C coolant temperature; (b) 18 C coolant temperature; (c) 20 C coolant temperature; (d) 26 C coolant temperature.
Machines 10 01201 g004
Figure 5. Thermal deformations of the standalone built-in spindle system in the 15 min dynamic operation at the different coolant temperatures and spindle rotating speeds with a constant coolant flow rate of 5 LPM: (a) 12 C coolant temperature; (b) 18 C coolant temperature; (c) 20 C coolant temperature; (d) 26 C coolant temperature.
Machines 10 01201 g005
Figure 6. Inlet–outlet coolant temperature difference at a constant flow rate of 5 LPM.
Machines 10 01201 g006
Figure 7. Thermal deformations of the CNC machine with a direct-drive spindle in steady-state operations at different coolant temperatures and spindle rotating speeds with a constant coolant flow rate (5 LPM) and 26 C ambient temperature; (a) 22 C coolant temperature; (b) 24 C coolant temperature; (c) 26 C coolant temperature; and (d) 28 C coolant temperature.
Machines 10 01201 g007
Figure 8. Thermal deformations of the CNC machine with a direct-drive spindle in the dynamic operation at the constant coolant temperature of 26 C and flow rate of 5 LPM with different spindle rotating speeds: (a) 5 min; (b) 15 min; (c) 30 min.
Machines 10 01201 g008
Table 1. Locations of the temperature sensors in the standalone built-in spindle system and CNC machine with a direct-drive spindle.
Temp. SensorPositions in Standalone Built-In Spindle SystemPositions in CNC Machine with a Direct-Drive Spindle
S1, S2Front bearing of spindleFront bearing of spindle
S3, S4Rear bearing of spindleRear bearing of spindle
S5, S6, S7, S8Different locations of the motorDifferent locations of the short base
S9, S10, S11, S12Different locations of the baseDifferent locations of the long base
S13, S14, S15, S16Different locations in the workshopDifferent locations in the workshop
Table 2. Residual thermal errors, AI, RMSE, and AI ¯ between the Mares and Mares CT models over the experimental thermal deformation (exp. therm. def.) at different coolant temperatures and spindle rotating speeds at a constant flow rate of 5 LPM and a 26 C ambient temperature with a standalone built-in spindle system.
Speed (rpm)Coolant Temperature ( C)
1214161820222426
10,000 Exp. therm. def. ( μ m)28.529.425.0524.5523.8523.4521.121
Residual ( μ m)Mares model−8.08−6.18−2.76−2.45−1.56−4.28−0.58−0.73
Mares CT model−7.67−7.50−2.10−3.44−1.07−5.24−0.28−1.59
AI (%)5.10−17.5823.83−28.7231.53−18.3550.91−53.59
RMSE ( μ m)0.411.320.660.990.490.960.300.86
12,000 Exp. therm. def. ( μ m)28.1526.3529.5525.925.7522.5522.219.7
Residual ( μ m)Mares model−3.373.39−3.83−2.361.90−2.56−1.311.07
Mares CT model−4.310.09−3.61−1.040.63−3−0.590.03
AI (%)−21.7397.075.7455.9366.43−14.6554.5396.84
RMSE ( μ m)0.943.30.221.321.270.440.721.04
14,000 Exp. therm. def. ( μ m)29.8530.1530.5527.5527.5519.8524.922.05
Residual ( μ m)Mares model−0.34−2.80−1.861.210.684.54−0.481.01
Mares CT model−1.80−4.12−2.38−0.07−0.663.14−0.270.19
AI (%)−80.72−32.0025.6493.622.2730.8743.2581.12
RMSE ( μ m)1.461.320.521.140.021.40.210.82
16,000 Exp. therm. def. ( μ m)31.2533.427.329.630.4523.9525.523.35
Residual ( μ m)Mares model2.15−0.033.791.46−1.264.404.730.88
Mares CT model0.67−1.193.080.390.383.164.07−0.73
AI (%)68.84−96.8918.8372.9869.7728.1013.93−17.38
RMSE ( μ m)1.481.160.711.070.881.240.660.15
18,000 Exp. therm. def. ( μ m)33.233.3531.131.932.427.3525.0523.2
Residual ( μ m)Mares model2.882.351.312.30−0.051.83.264.59
Mares CT model1.580.700.150.98−1.620.501.893.46
AI (%)44.8770.0388.0657.27−96.6371.8042.0524.55
RMSE ( μ m)1.301.651.161.321.571.31.371.13
20,000 Exp. therm. def. ( μ m)37.2535.0534.834.2533.73027.526.1
Residual ( μ m)Mares model1.782.04−0.801.752.451.203.101.81
Mares CT model0.790.340.290.150.77−0.081.890.46
AI (%)55.5083.2763.2690.9868.4292.9138.9374.34
RMSE ( μ m)0.991.70.511.61.681.121.211.35
22,000 Exp. therm. def. ( μ m)40.4540.336.53736.9530.0528.929.3
Residual ( μ m)Mares model0.782.282.690.14−2.262.854.732.95
Mares CT model−0.610.491.51−1.09−1.531.092.811.35
AI (%)20.9978.3643.91−86.5132.3061.6140.6254.03
RMSE ( μ m)0.171.791.180.950.731.761.921.6
24,000 Exp. therm. def. ( μ m)40.9542.8542.5546.4539.2531.635.6532.2
Residual ( μ m)Mares model2.460.91−0.54−1.892.994.39−1.133.33
Mares CT model1.16−0.73−2.14−3.900.812.900.951.46
AI (%)52.5019.37−74.48−51.4472.6533.818.1956.15
RMSE ( μ m)1.30.181.602.012.181.490.181.87
AI ¯ (%)18.1722.7824.3725.5130.8435.7636.5539.50
Table 3. Residual thermal errors, AI, RMSE, and AI ¯ between the Mares and Mares CT models over the experimental thermal deformation (exp. therm. def.) and NSE of the Mares CT model over the experimental thermal deformation (exp. therm. def.) in the dynamic operation at different coolant temperatures and spindle rotating speeds at a constant flow rate of 5 LPM and 26 C ambient temperature with a standalone built-in spindle system.
Speed (rpm)Coolant Temperature ( C)
12182026
10,000 Exp. therm. def. ( μ m)0.850.450.800.50
Residual ( μ m)Mares model−2.23−0.11−1.260.20
Mares CT model−1.26−0.06−0.130.20
AI (%)/RMSE ( μ m)43.16/0.9747.21/0.0589.30/1.130.00/0.00
12,000 Exp. therm. def. ( μ m)2.551.201.352.95
Residual ( μ m)Mares model−3.10−0.53−0.550.31
Mares CT model−2.55−0.340.51−0.15
AI (%)/RMS ( μ m)17.68/0.5535.78/0.197.16/0.0449.19/0.16
14,000 Exp. therm. def. ( μ m)3.851.403.354.65
Residual ( μ m)Mares model−1.56−1.05−0.95−3.00
Mares CT model−1.53−0.42−0.40−2.40
AI (%)/RMSE ( μ m)1.76/0.0360.06/0.6357.83/0.5520.12/060
16,000 Exp. therm. def. ( μ m)5.904.305.456.00
Residual ( μ m)Mares model−5.46−1.291.72−6.18
Mares CT model−4.63−0.791.74−5.74
AI (%)/RMSE ( μ m)15.10/0.8338.26/0.50−1.59/0.027.11/0.44
18,000 Exp. therm. def. ( μ m)8.354.906.407.90
Residual ( μ m)Mares model−2.89−2.171.80−5.20
Mares CT model−2.61−1.321.66−4.43
AI (%)/RMSE ( μ m)9.50/0.2839.13/0.857.63/0.1414.80/0.77
20,000 Exp. therm. def. ( μ m)11.605.908.7010.00
Residual ( μ m)Mares model−3.76−2.272.33−4.34
Mares CT model−2.94−1.092.39−3.90
AI (%)/RMSE ( μ m)21.90/0.8251.89/1.18−2.35/0.0610.12/0.44
22,000 Exp. therm. def. ( μ m)14.7010.4012.8013.70
Residual ( μ m)Mares model−4.44−1.782.19−4.21
Mares CT model−5.29−1.372.46−4.63
AI (%)/RMSE ( μ m)−19.20/0.8523.07/0.41−12.55/027−9.77/0.42
24,000 Exp. therm. def. ( μ m)21.212.6014.615.50
Residual ( μ m)Mares model−1.28−2.402.04−4.17
Mares CT model−0.73−2.712.48−3.92
AI (%)/RMSE ( μ m)42.83/0.55−12.55/0.31−21.47/0.445.93/0.25
AI ¯ (%)16.5935.3515.5912.19
NSE Mares CT model 0.970.990.890.92
Table 4. Residual thermal errors, AI, RMSE, and AI ¯ between the Mares and Mares CT models with regard to experimental thermal deformation (exp. therm. def.) at different coolant temperatures and spindle rotating speeds at a constant flow rate of 5 LPM and a 26 C ambient temperature with a CNC machine with a direct-drive spindle.
Speed (rpm)Coolant Temperature ( C)
22242628
2000 Exp. therm. def. ( μ m)2.503.501.506.30
Residual ( μ m)Mares model1.782.420.88−0.81
Mares CT model0.270.670.52−1.31
AI (%)/RMSE ( μ m)84.83/1.5172.31/1.7540.91/0.3691.86/0.50
4000 Exp. therm. def. ( μ m)3.404.203.003.6
Residual ( μ m)Mares model0.471.64−0.87−2.57
Mares CT model0.220.640.27−1.27
AI (%)/RMSE ( μ m)53.19/0.2560.98/1.0068.97/0.6050.58/1.3
6000 Exp. therm. def. ( μ m)7.205.103.509.80
Residual ( μ m)Mares model3.41−1.10−0.60−3.91
Mares CT model1.51−0.350.15−1.16
AI (%)/RMSE ( μ m)55.72/1.968.18/0.7575.00/0.4570.33/2.75
8000 Exp. therm. def. ( μ m)9.707.508.0012.7
Residual ( μ m)Mares model2.64−0.73−2.16−3.85
Mares CT model0.14−0.431.34−2.65
AI (%)/RMSE ( μ m)94.70/2.541.10/0.337.96/0.8231.16/1.20
10,000 Exp. therm. def. ( μ m)13.6011.6011.0019.3
Residual ( μ m)Mares model3.26−8.09−4.50−5.16
Mares CT model−2.50−2.59−0.491.10
AI (%)/RMSE ( μ m)23.31/0.7667.99/5.5089.17/4.0178.68/4.06
12,000 Exp. therm. def. ( μ m)20.6915.9014.1021.8
Residual ( μ m)Mares model2.05−9.38−5.06−7.45
Mares CT model−1.27−3.380.704.05
AI (%)/RMSE ( μ m)38.05/0.7863.97/6.0086.17/4.3645.63/3.40
AI ¯ (%)58.3062.4266.3565.70
Table 5. Residual thermal errors, AI, RMSE, and AI ¯ between the Mares and Mares CT models with regard to the experimental thermal deformation (exp. therm. def.) and the NSE of the Mares CT model over the experimental thermal deformation (exp. therm. def.) in the dynamic operation at a constant coolant temperature of 26 C, a flow rate of 5 LPM, and ambient temperature of 26 C with different spindle rotating speeds of a CNC machine with a direct-drive spindle.
Speed (rpm)Time (Min)
51015
2000 Exp. therm. def. ( μ m)0.400.501.40
Residual ( μ m)Mares model−0.290.050.12
Mares CT model−0.26−0.01−0.02
AI (%)/RMSE ( μ m)10.34/0.0380.00/0.0483.33/0.10
4000 Exp. therm. def. ( μ m)0.500.701.70
Residual ( μ m)Mares model−0.17−0.04−0.07
Mares CT model−0.080.030.03
AI (%)/RMSE ( μ m)52.94/0.0925.00/0.0157.14/0.04
6000 Exp. therm. def. ( μ m)1.001.001.90
Residual ( μ m)Mares model−0.31−0.23−0.16
Mares CT model0.280.210.08
AI (%)/RMSE ( μ m)9.67/0.0386.90/0.0250.00/0.08
8000 Exp. therm. def. ( μ m)1.501.502.50
Residual ( μ m)Mares model−0.31−0.48−0.40
Mares CT model−0.11−0.130.13
AI (%)/RMSE ( μ m)64.51/0.2072.91/0.3567.500/0.27
10,000 Exp. therm. def. ( μ m)2.102.102.70
Residual ( μ m)Mares model−0.55−0.72−0.49
Mares CT model0.20−0.420.17
AI (%)/RMSE ( μ m)63.63/0.3541.66/0.3065.30/0.32
12,000 Exp. therm. def. ( μ m)2.602.604.20
Residual ( μ m)Mares model−0.94−0.45−0.53
Mares CT model0.56−0.200.33
AI (%)/RMSE ( μ m)40.42/0.0855.55/0.2537.73/0.20
AI ¯ (%)40.2560.3360.16
NSE Mares CT model 0.970.950.98
Publisher’s Note: MDPI stays neutral with regard to jurisdictional claims in published maps and institutional affiliations.

