Article

Effect of Process Parameters on Stress Field of Laser Additive Manufacturing

School of Mechanical Engineering and Automation, Northeastern University, Shenyang 110819, China
*
Author to whom correspondence should be addressed.
Machines 2022, 10(12), 1197; https://doi.org/10.3390/machines10121197
Submission received: 10 November 2022 / Revised: 5 December 2022 / Accepted: 8 December 2022 / Published: 11 December 2022
(This article belongs to the Topic Advanced Manufacturing and Surface Technology)

Abstract

:
In order to optimize the additive manufacturing process and find the process parameters affecting the mechanical properties of the parts, an additive manufacturing simulation model of Ti-6Al-4V titanium alloy was established, and the effects of ambient temperature, substrate thickness and wire temperature on the stress field and residual stress field were analyzed. The results show that the ambient temperature is inversely proportional to the residual stress of the cladding layer, while the substrate thickness and wire temperature are positively correlated to the residual stress of the cladding layer. When the ambient temperature increases from 0 °C to 600 °C, the maximum residual stress decreases by 36.0%, the maximum residual stress increases by 10.0% when the substrate thickness increases from 25 mm to 55 mm and the maximum residual stress increases by 7.48% when the temperature increases from 0 °C to 600 °C. The influence of the three parameters on the maximum residual stress is as follows: ambient temperature > substrate thickness > wire temperature. The research results can provide reference for stress control during actual manufacturing.

1. Introduction

Additive manufacturing (AM) technology is mainly the process of melting materials and stacking them layer by layer to form required parts by making use of various energies, also known as “the third industrial revolution” [1,2,3]. At present, there are dozens of kinds of AM technologies, involving many fields such as industry, education, medicine, etc. Meanwhile, the materials used in AM are various as well, such as steel, titanium alloy, aluminum alloy in industrial fields, various kinds of cells in the medical industry, etc. [4]. Compared with traditional manufacturing methods, AM has advantages of saving molds and additive materials, low cost, short cycle, wide range of applicable materials and applicability for steel materials that are hard to process by traditional methods. In addition, the parts used have the advantages of fine grain, dense structure, excellent performance in mechanical properties and uniform composition [5,6].
The AM parts made by AM also have many shortcomings, such as large residual stress, high surface roughness and cracks [7,8]. Therefore, it is very necessary to carry out relevant research on optimizing AM technologies. Sun et al. [9] studied the impacts of different scanning routines on sheet deformation during arc AM, and created the S-value discriminant method for sheet deformation degree, which was applied to the AM process of solid parts. By taking 5356 aluminum alloy as the welded object of AC argon tungsten arc welding, Shen et al. [10] studied the impact of different intervals on the cladding layer and microstructure. The results show that various intervals can produce better parts. Through numerical simulation and experiments, Ogino et al. [11] studied the impact of cooling and welding direction in arc welding, and the results show that under appropriate cooling conditions, the shape of the deposited layer becomes larger and thinner, and for the linear and cylindrical deposition, the welding direction has an obvious impact on forming quality. Through the mutual verification between experiments and simulation, Daniel et al. [12] analyzed the life, width and depth of a molten pool under different electron beam powers, scanning speeds and energies, and stimulated the temperature distribution during the selective melting process of the electron beam by using the finite element simulation tool which was developed by them independently. The results show that the life of the molten pool increases linearly along with linear energy, while the size of the molten pool is nonlinear, related to linear energy. Zinoviev et al. [13] established the evolutionary mathematical model of grain structure in each component used for prediction of the laser melting process, and simulated the selective laser melting process. In the simulation, the growth and structure formation of grains during laser additive manufacturing (LAM) were fully described. Chu [14] established the simulation model of laser cladding Al2O3 aluminum alloy, and carried out research on the roles of preheating and slow cooling on the laser cladding and the influence law of different process parameters on the temperature gradient. Loh et al. [15] created a selective laser melting simulation model taking the transformation from powder to solid into account, and carried out research on the relationship between laser power, scanning speed and melt size, melting and evaporation of powder and temperature change rate. By comprehensively taking free surface, temperature, component concentration and molten pool flow velocity into consideration, Dubrov et al. [16] established the dynamic equation for the laser melting process of metal powder, and provided its numerical implementation algorithm, and tested calculation results of the temperature field, flow structure of the molten pool, solute distribution and geometric characteristics of the object to be formed. Zhao et al. [17] analyzed the influence law of thermal cycle and cladding direction on AM part quality during AM of sheet parts. Miranda et al. [18] conducted research on the impact of the relative position of wire feeder and substrate and ratio of laser radius to wire radius on the forming quality. The results show that the former has impacts on the transfer mode of molten metal and the pressure of the wire tip on the molten pool, while the latter has an influence on procedure efficiency. The two parameters control the surface finish of the parts. Zhan et al. [19] discussed the effect of process parameters on residual stress. The results show that the residual stress is positively correlated with the laser power, and it is negatively correlated with the scanning speed and powder feeding. Fan et al. [20] analyzed the residual stress field of TC4/TC11 FGM fabricated via LAM using the finite element method. Samodurova et al. [21] developed a methodology for manufacturing titanium alloy products and studied the microstructure of the obtained details and measured the microhardness of the samples. Products made according to the developed technique do not have visible defects and pores.
There are many elements causing residual stress of AM parts. Three parameters were selected, which are studied rarely at present but very important in real processing. The research results can provide a significant theoretical basis for residual stress control in LAM. Due to advantages such as relatively better high-temperature resistance, oxidation resistance and corrosion resistance, at present, Ti-6Al-4V titanium alloy is mainly used in the aerospace and maritime fields [6]. Based on the simulation of the AM process, this research describes the change in internal properties of the cladding layer, manufactured by laser adding material with titanium alloy wire.
AM is a process of “rapid heating and rapid cooling”, and the formed cladding layer is heated unevenly and the temperature changes dramatically, so the cladding layer will produce thermal stress due to expansion with heat and contraction with cold. When this thermal stress exceeds the yield and tensile strength of Ti-6Al-4V titanium alloy, it is easy to deform the cladding layer and substrate. Therefore, the mechanism and action law of thermal stress in AM are a difficult problem.

2. Modeling of LAM

2.1. Finite Element Model

In this paper, the simulation model of laser wire additive manufacturing is established by ABAQUS, and the function of MODEL CHANGE in ABAQUS is used to simulate the addition of Ti-6Al-4V titanium alloy material. In order to make the numerical simulation results more accurate, this paper determines the simulation process parameters according to the actual experimental data [22]. The parameters are as follows. Laser scanning speed is 6 mm/s. Laser power is 180 W. Laser diameter is 0.8 mm. Simplified finite element model of the substrate is set to 60 mm × 14 mm × 5 mm. In addition, the length, width and thickness of the cladding layer are 50 mm, 0.85 mm and 0.54 mm. The four corners of the substrate are completely fixed.
As displayed in Figure 1, the substrate is meshed, and the area near the cladding layer is densely meshed, with 40,680 nodes and 34,582 elements.
In the finite element model of the cladding layer and the substrate, the surface heat transfer coefficient and thermal radiation coefficient are set according to Equations (1)–(3) to simulate the actual heat dissipation process. The initial temperature of the cladding layer and the substrate is set at 20 °C and the ambient temperature is set at 20 °C. In addition, a birth–death element strategy is used to simulate the material addition process.
The heat production equation is
( ρ c P T ) t + ( ρ c P v T ) ( K T ) = Q
in which Q is heat generation of laser heat source; K is thermal conductivity of titanium alloy; cp is specific heat capacity; 𝜌 is density of titanium alloy; t is laser heat source action time; v is laser scanning speed.
The initial condition of the heat conduction equation of the laser heat source is
K ( T n ) | Ω = { α I ( x , y , z , t ) h ( T - T 0 ) ε t σ ( T 4 - T 0 4 ) if Ω Γ h c ( T - T 0 ) ε t σ ( T 4 - T 0 4 ) if Ω Γ
in which n is the normal vector of the cladding layer and substrate surface; I (x, y, z, t) is the energy distribution of the cladding layer and substrate surface; α is laser absorption coefficients of Ti-6Al-4V titanium alloys; hc is convection coefficient of the cladding layer and substrate; εt is radiance of the cladding layer and substrate; σ is Stefan–Boltzmann constant; Ω is cladding layer and substrate surface; Γ is laser heating surface; T0 is ambient temperature.
The boundary condition is
{ T ( x , y , z , 0 ) = T 0 T ( x , y , z , ) = T 0

2.2. Basic Assumption

In this paper, the following assumptions are made for the simulation process of LAM.
  • The interaction between laser heat source and material follows the traditional heat transfer theory [23].
  • The materials in this paper are considered as isotropic and the effect of temperature on density is not considered.
  • The influence of molten pool flow and vaporization on temperature is neglected.
  • Since the deformation of the material has little effect on the temperature, the effect of material deformation on temperature is neglected.
  • The effect of substrate deformation on the relaxation of the residual stresses is neglected.

2.3. Heat Source Model

In the actual laser AM process, the energy of the heat source acting on the cladding layer gradually decreases from center to periphery. At the same time, due to the continuous movement of the laser heat source, the energy distribution is different before and after. Therefore, the double ellipsoid heat source is selected to simulate the loading process of the laser heat source, and the coordinate directions of the finite element model are defined by the coordinate directions of the heat source. The double ellipsoid heat source is shown in Figure 2 [24].
The expression of the double ellipsoid heat source model is
{ Q 1 = 6 3 p ω π 3 2 a 1 b c exp { - 3 [ ( x - x 0 a 1 ) 2 + ( y - y 0 b ) 2 + ( z - z 0 c ) 2 ] } Q 2 = 6 3 p ω π 3 2 a 2 b c exp { - 3 [ ( x - x 0 a 2 ) 2 + ( y - y 0 b ) 2 + ( z - z 0 c ) 2 ] }
in which Q1 and Q2 are the quantity of heat generated by the laser heat source; p is laser power; ω is the energy absorption efficiency of Ti-6Al-4V titanium alloy; a1, a2, b and c are shape parameters of the double ellipsoid heat source; x0, y0 and z0 are position coordinates of the starting point of the cladding layer.

2.4. Material Model

The physical parameters of titanium alloy change with the change in temperature, so the setting of thermal physical parameters of titanium alloy is a major factor affecting the accuracy of the results. The line chart of thermophysical performance parameters of titanium alloy is shown in Figure 3.
In the finite element simulation experiment, the materials of the substrate and wire are Ti-6Al-4V titanium alloy, and their chemical compositions are listed in Table 1.

3. Analysis of Thermal Stress Field of LAM

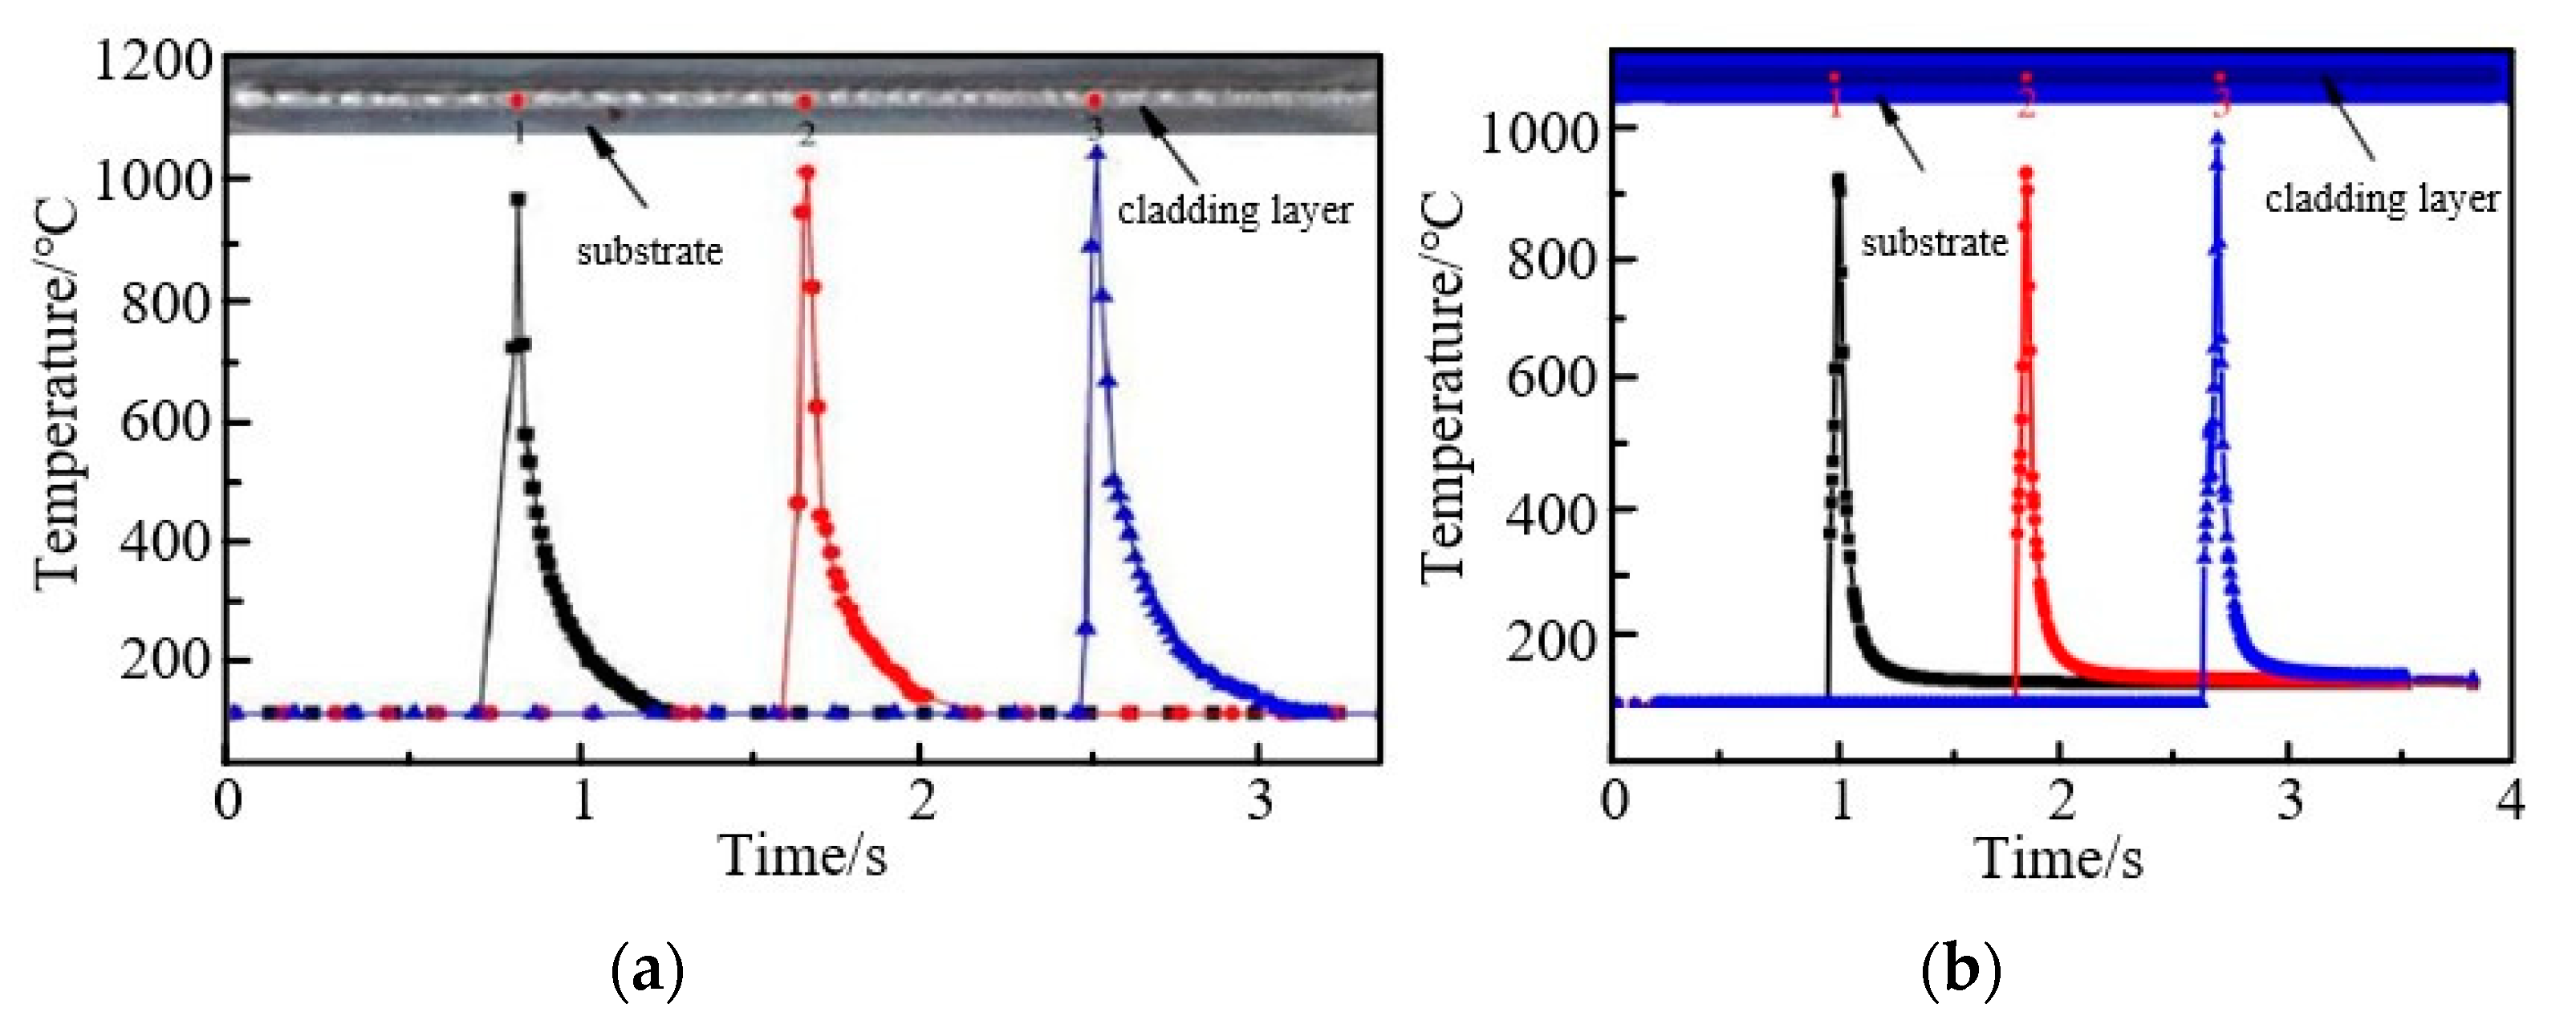
3.1. Model Validation

In order to verify the authenticity of the established model, the material is set as the material used in the experiment of reference [22] for AM simulation without changing other parameters. The temperature curves at different points are obtained through selecting three points at equal intervals between cladding layers, which are compared with experimental results and shown as Figure 4. From the simulation results in Figure 4b, it can be seen that all temperatures at each point of the cladding layers have two processes of increasing and decreasing. When the laser heat source arrives, the temperature of the cladding layer increases rapidly, and when heat source leaves this point, the temperature of the cladding layer decreases rapidly and the cooling speed is slower than the speed of temperature increase. In addition, along with the consistent processing of the laser cladding, the heat dissipation capacity of the substrate and cladding layers gradually decreases, meaning the temperature peak values at all points are continuously increased. The above conclusions are consistent with the temperature data shown in Figure 4a. Among them, the error of maximum temperature at 1–3 points of the cladding layer is less than 10%, which proves the accuracy of the simulation model.

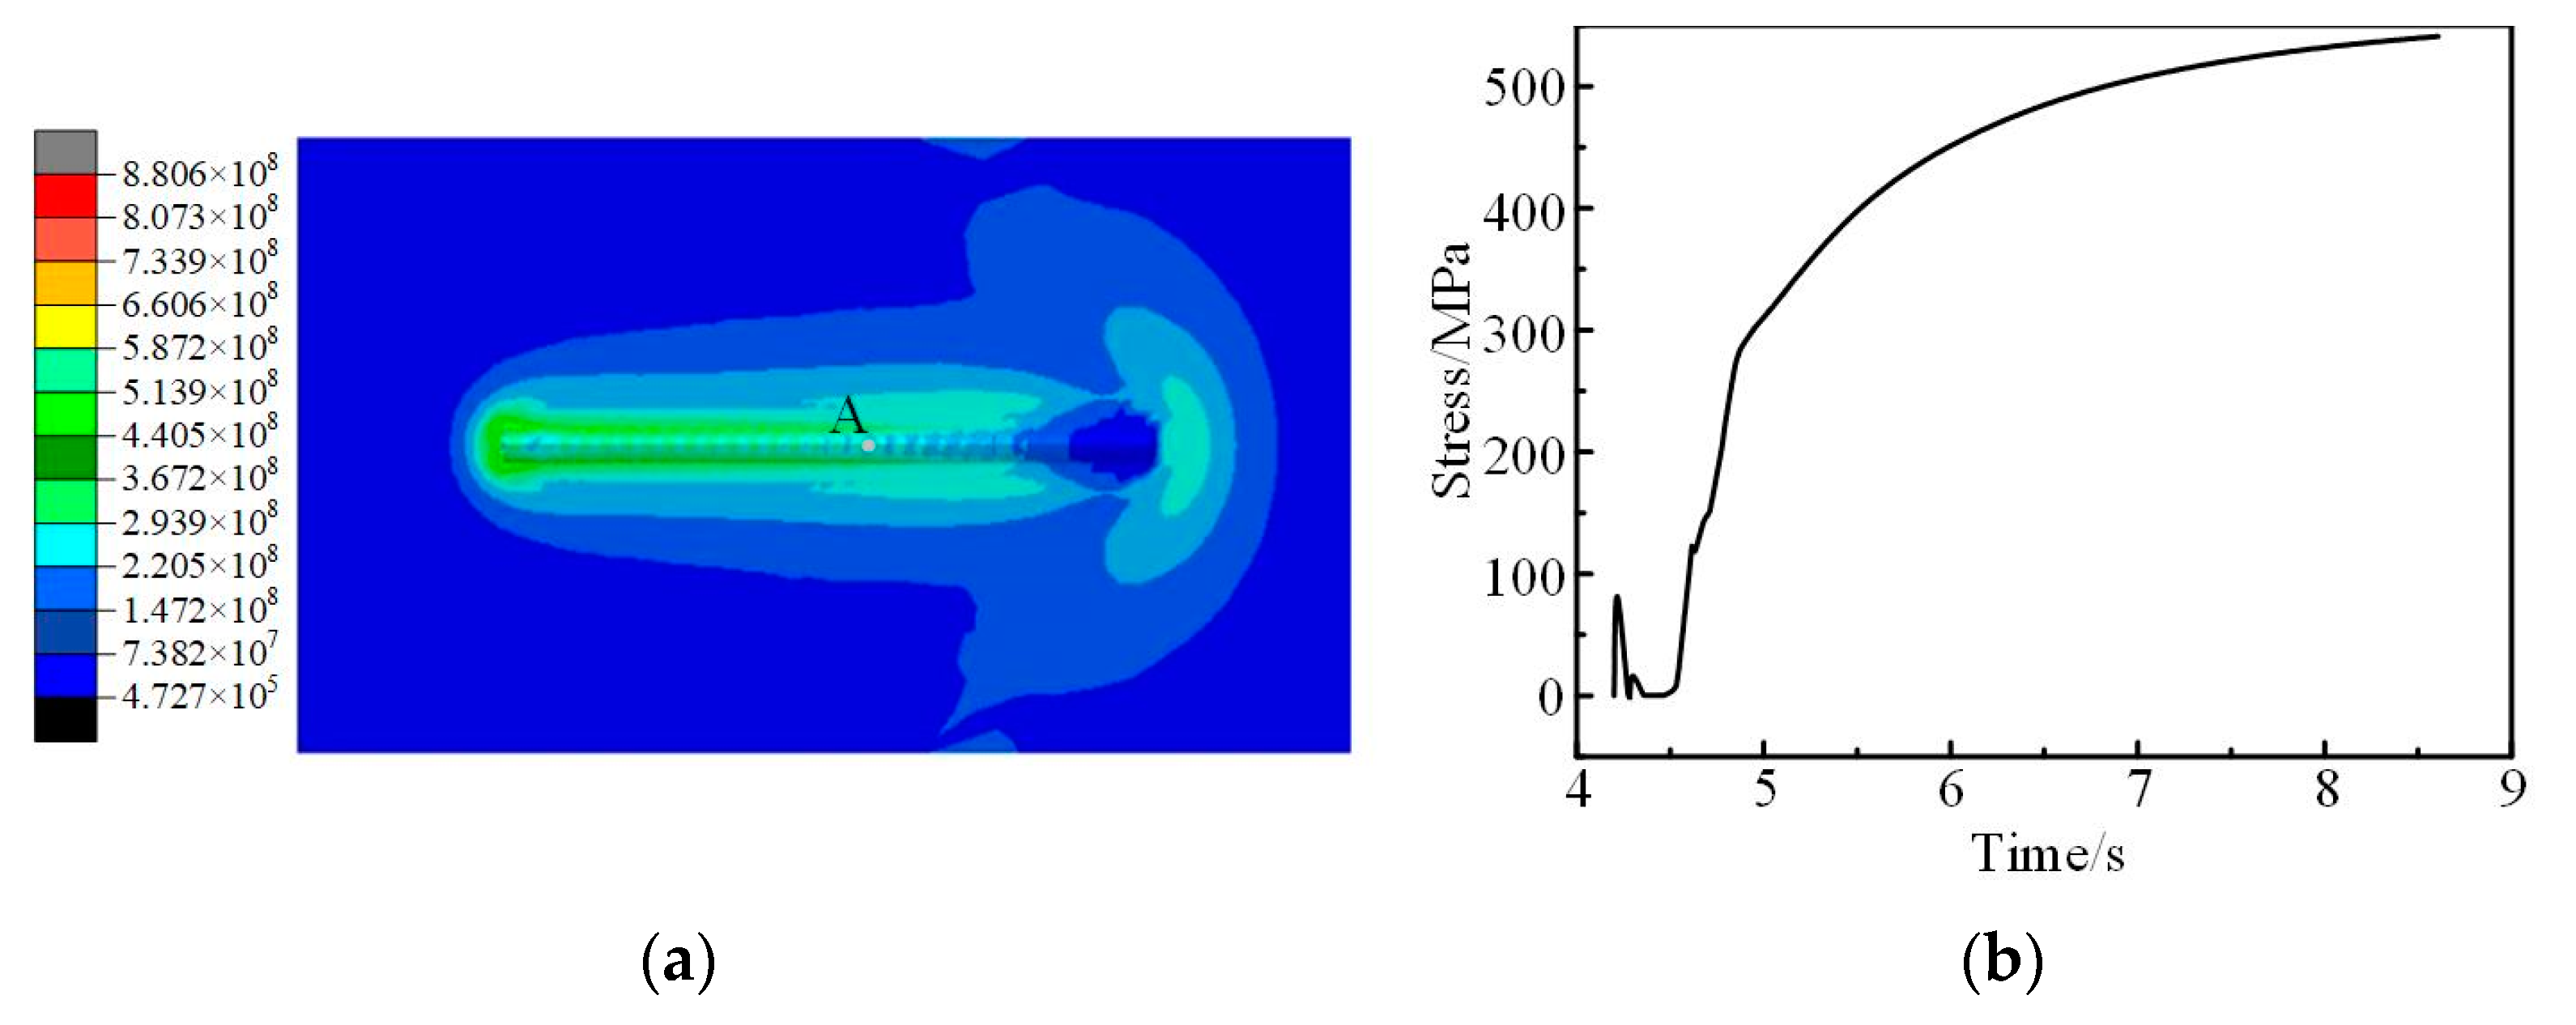
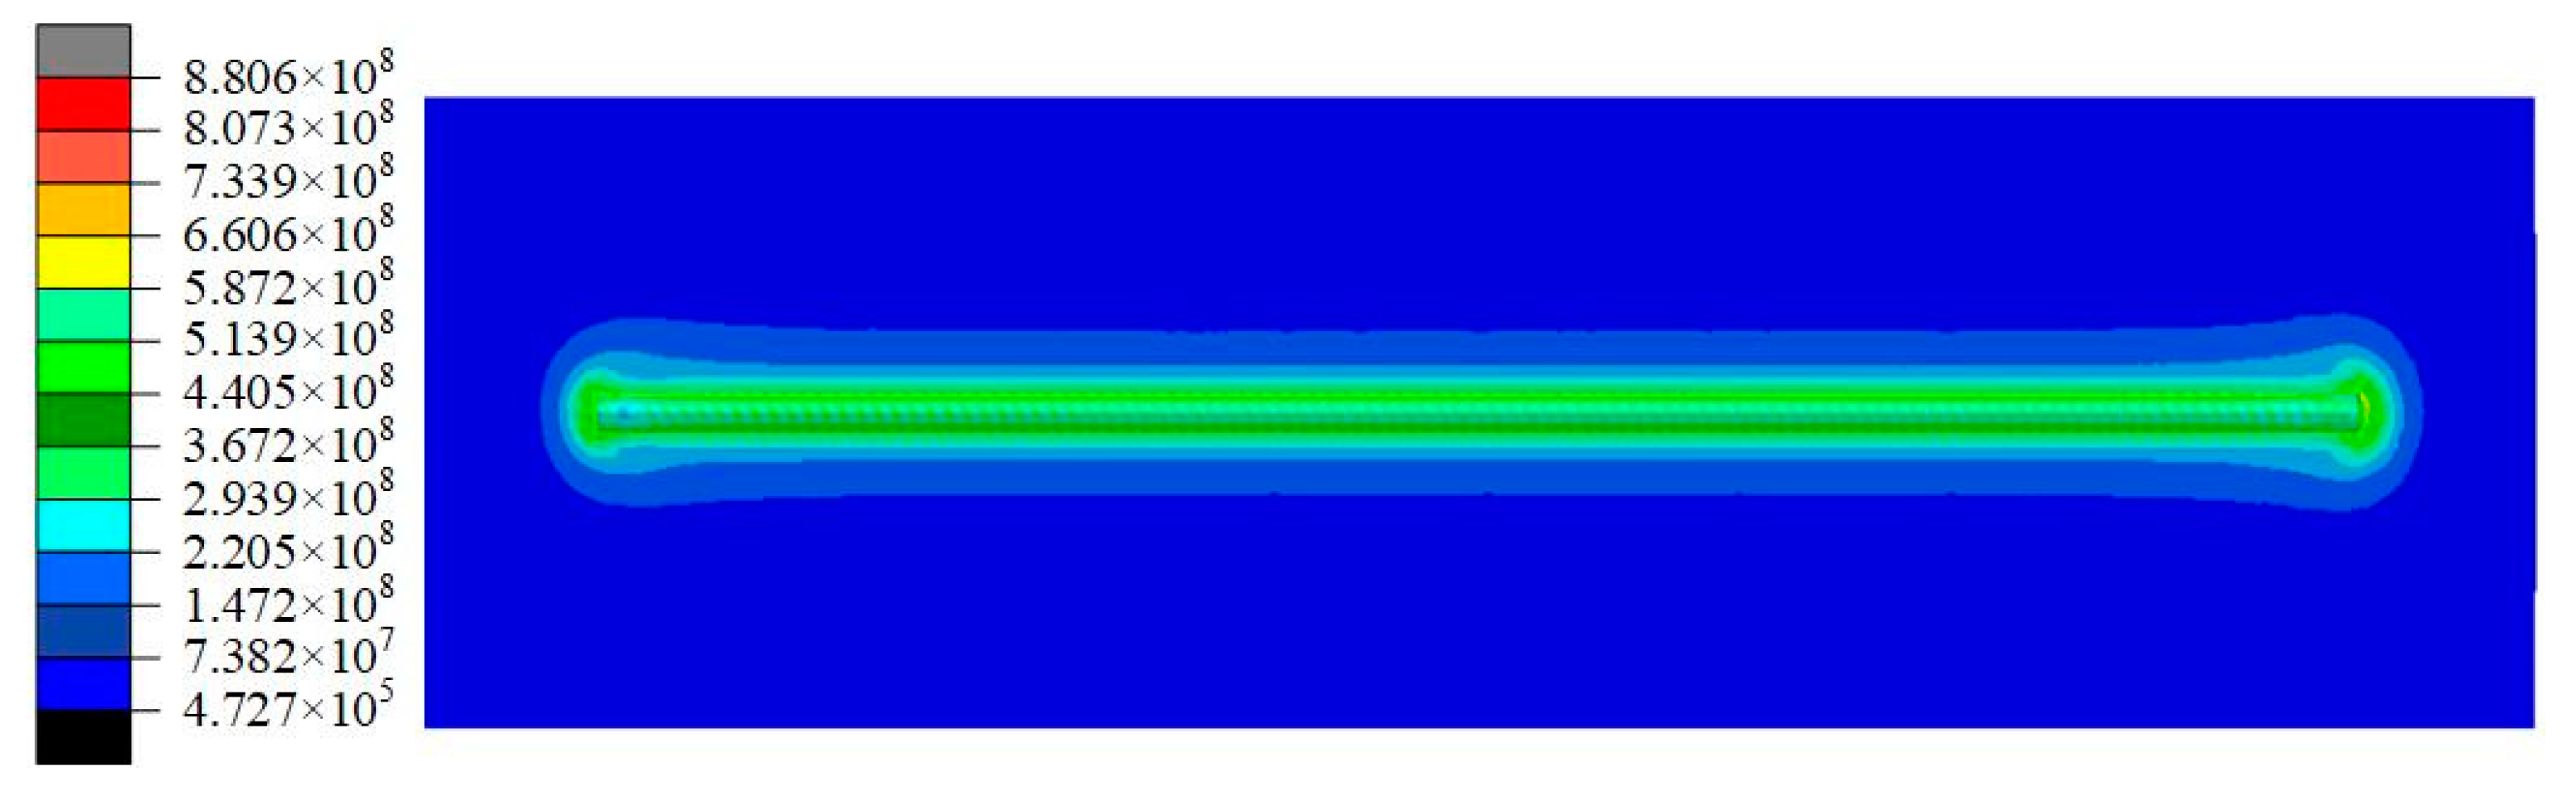
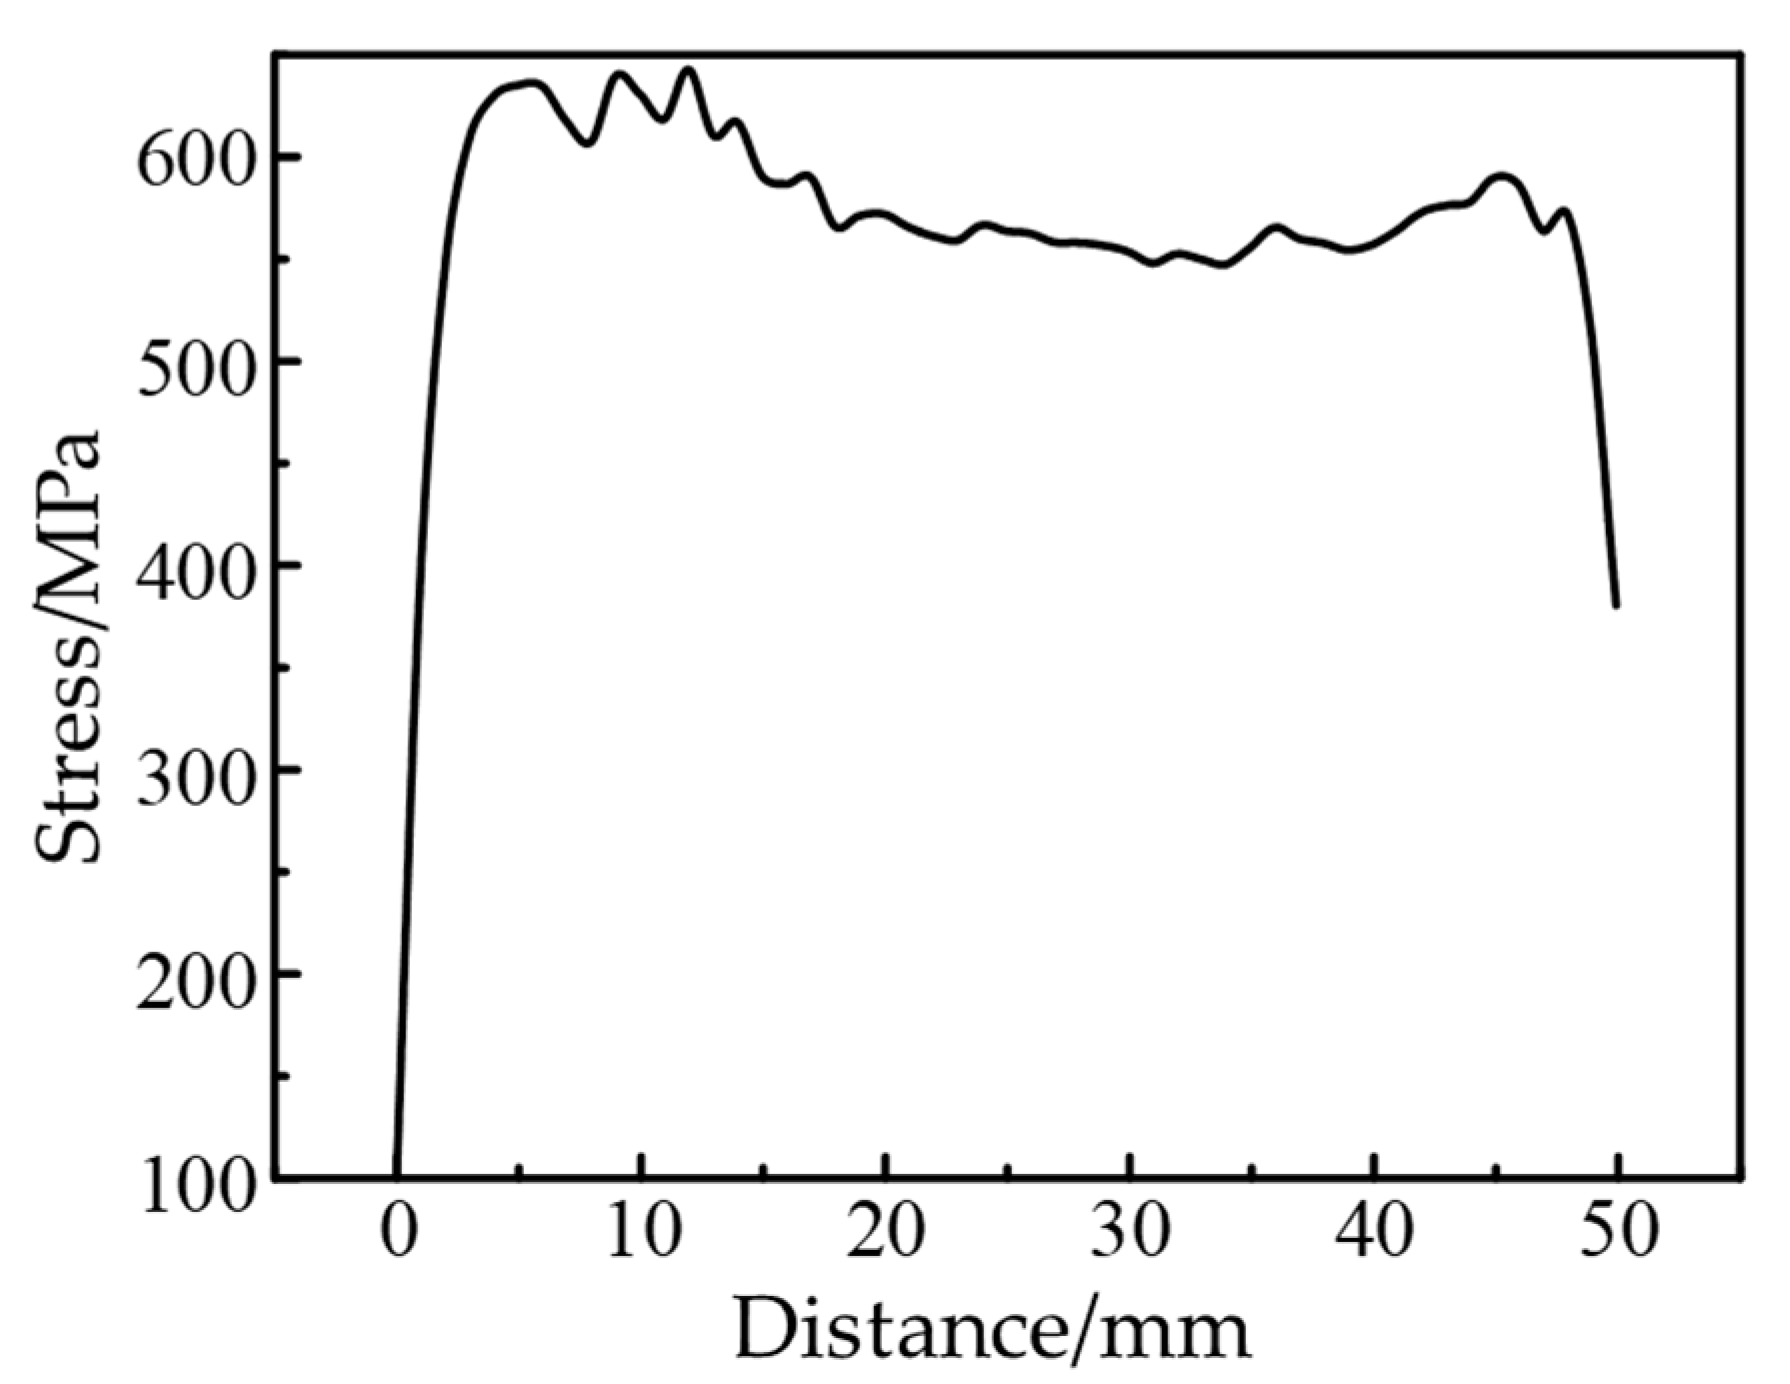
3.2. Results of Stress Field

The middle point of the cladding layer is selected for analysis and defined as point A. Figure 5 shows the stress cloud diagram and stress curve diagram of point A when the laser heat source moves to point A. It can be seen from Figure 5a that when the laser heat source passes through the substrate, the titanium alloy wire and the substrate melt to form a liquid molten pool, so the internal equivalent stress is the minimum, which is in the zero-stress state. At the front of the molten pool, due to the action of the laser heat source, the substrate and the wire are heated and expanded to produce a large area of thermal stress. Additionally, at the back end of the heat source, due to the heat dissipation and distance away from the heat source, the heat-affected area of the cladding layer gradually decreases. Therefore, the stress is concentrated near the cladding layer. It can be seen from Figure 5b that when the heat source gradually approaches point A, the stress increases, and when the molten pool is formed the stress decreases to zero. After the heat source passes through the substrate, the molten pool changes from liquid to solid, and then a large stress is formed.
The residual stress distribution has a significant effect on the quality of the laser cladding layer and life of the workpiece. Figure 6 shows the residual stress distribution after the cladding layer is cooled for 900 s. It can be seen from Figure 6 that during the laser forming process, not only is residual stress generated in the cladding area, but also in the surrounding area without melting. However, the stress near the cladding layer is greater than that at other positions.
Figure 7 shows the residual stress curve along the path of AM after the cladding layer is cooled for 900 s. It can be seen from Figure 7 that the residual stress in the middle of the cladding layer is much greater than that in the beginning and end positions. The main reason is that there is no constraint at the beginning and end positions, and the residual stress can be released well. However, in the middle of the cladding layer, due to the constraints of the substrate and the cladding layers, a large residual stress is generated, which increases the risk of cracks and other defects.
As shown in Figure 8, we firstly let X, Y and Z be the stress direction produced by LAM for the following discussion with ease.

4. Influence of Different Parameters on Stress Field of Formed Parts

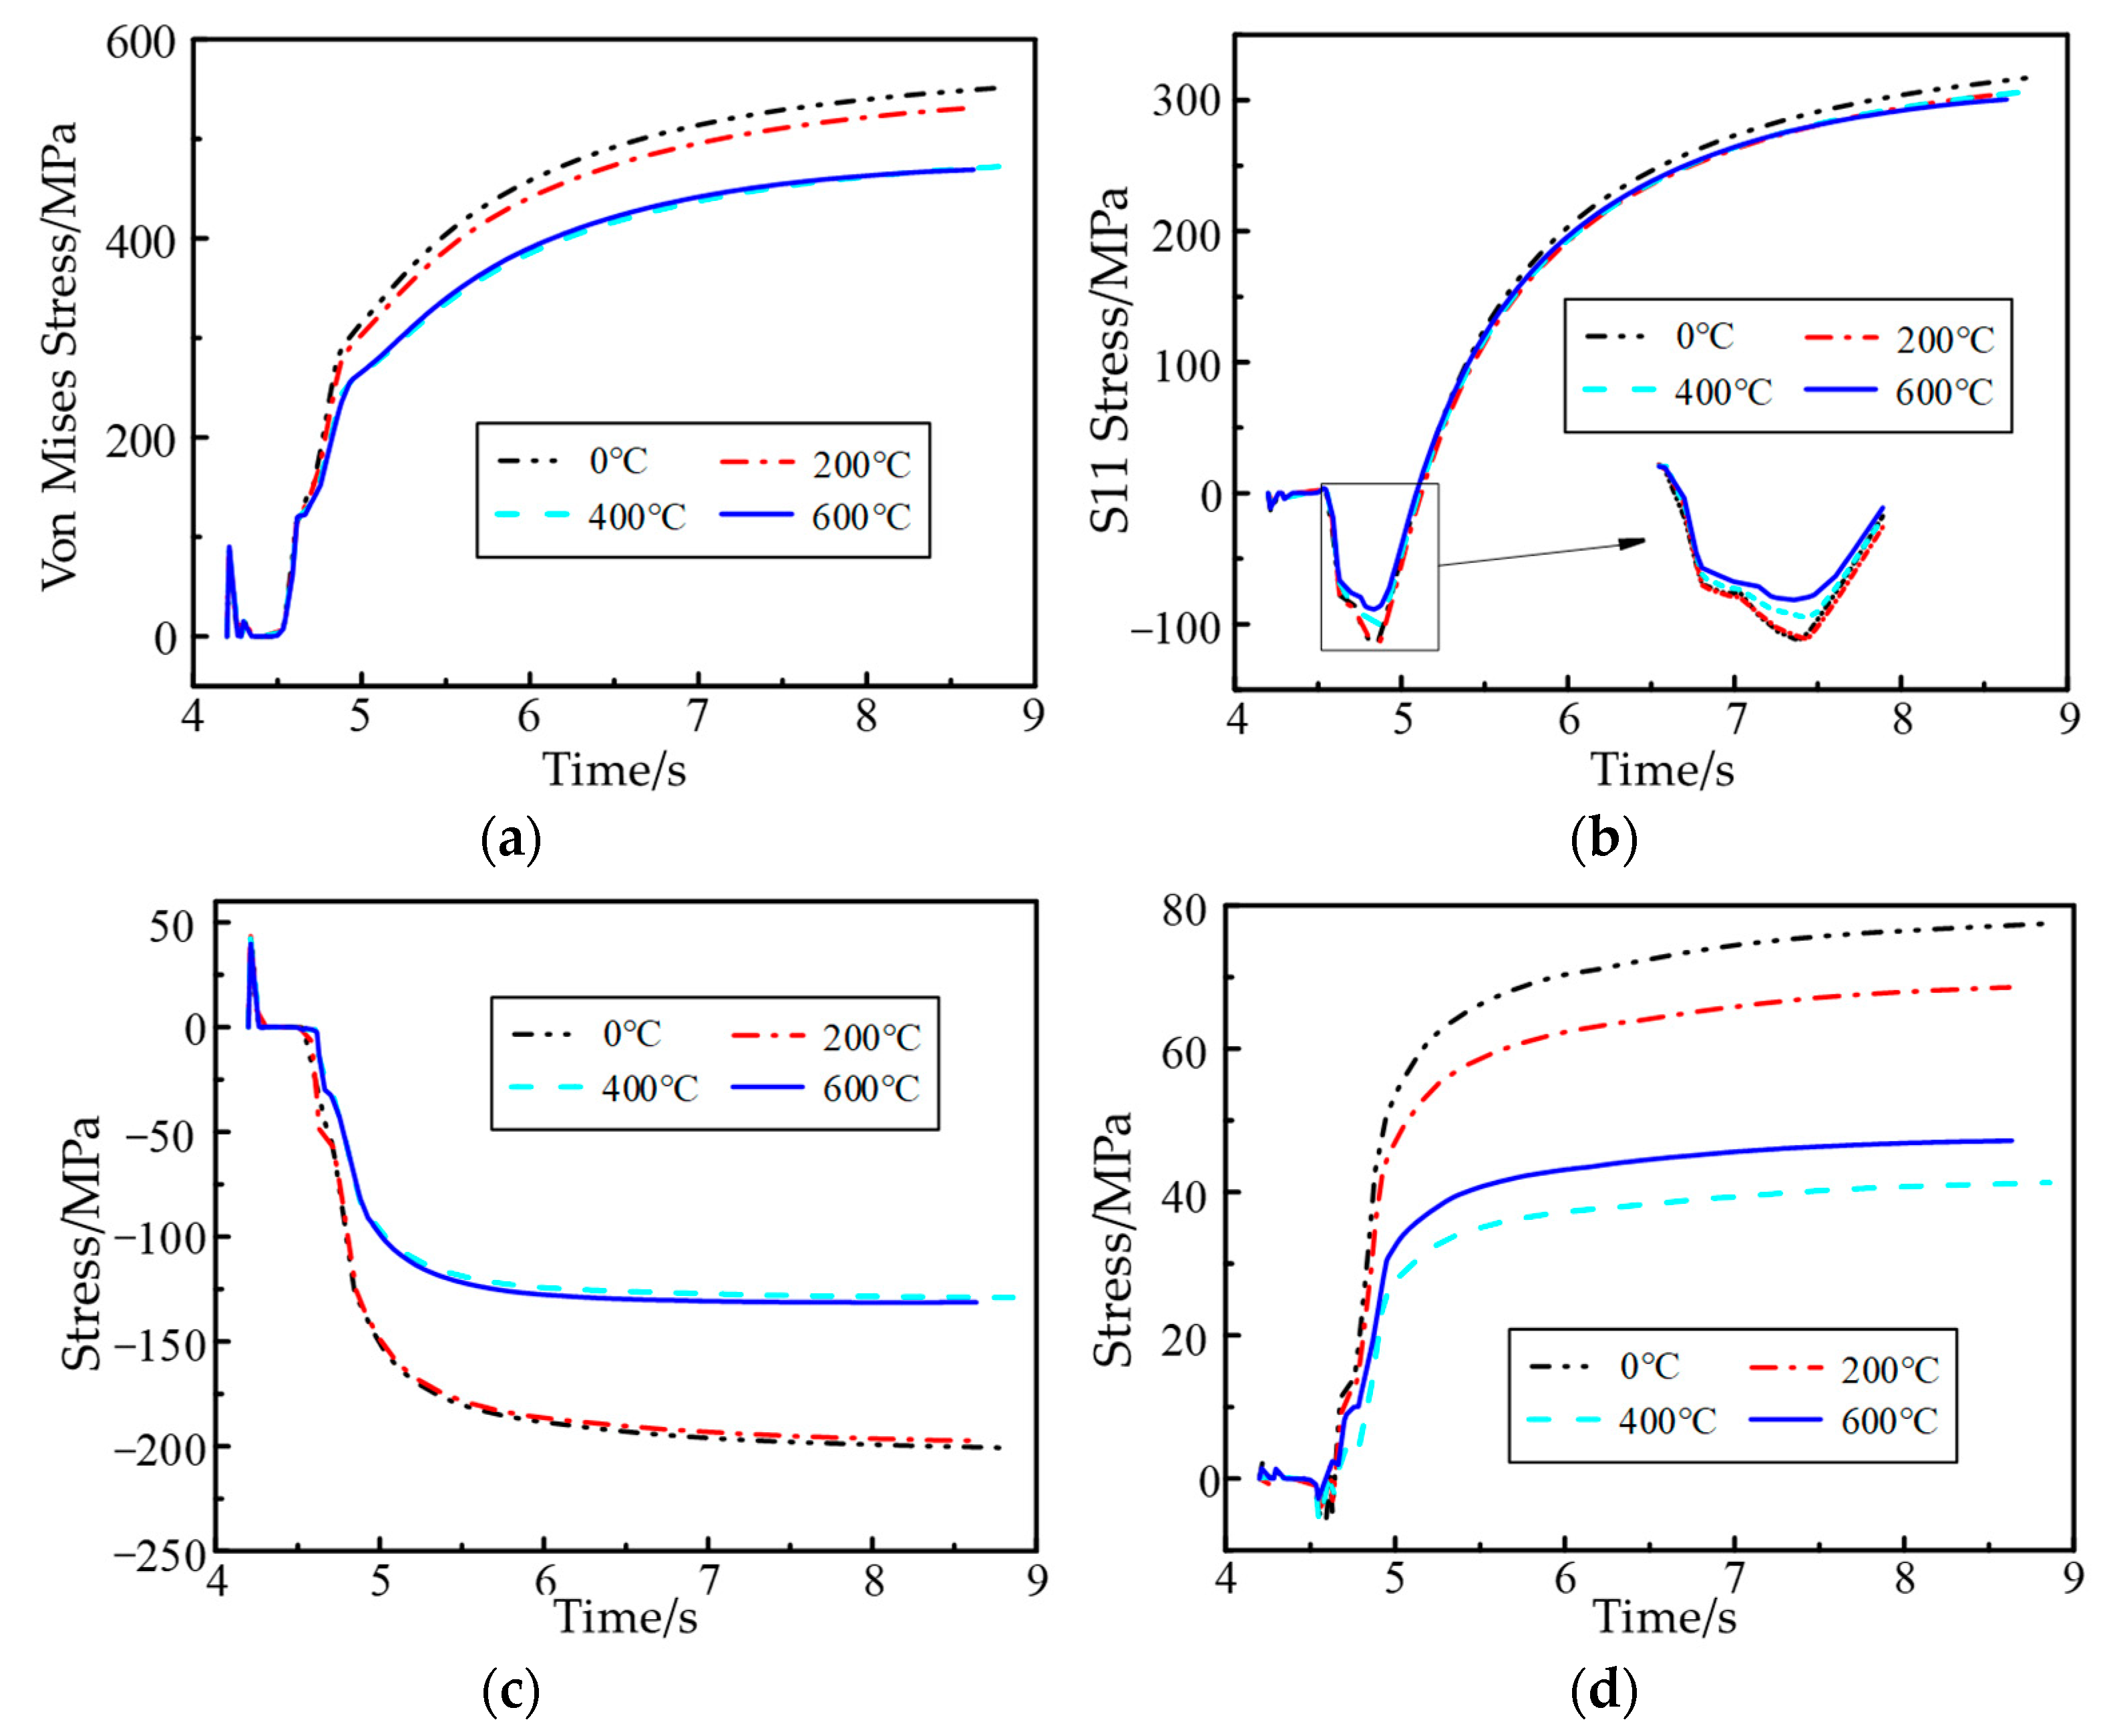
4.1. Ambient Temperature

During the research on the influence of ambient temperature on the stress field of formed parts, the ambient temperatures of 0 °C, 200 °C, 400 °C and 600 °C are selected. Taking point A as the research object, the stress and stress component curve are obtained at different ambient temperatures, which is shown as Figure 9. From Figure 9a, it can be found that the variation trends of von Mises stress of point A at each ambient temperature are almost the same. However, along with the increment in ambient temperature, the peak value of stress is gradually decreased. It is decreased by 80 MPa and about 14.5% from 552 MPa at 0 °C to 472 MPa at 600 °C. From the stress curve of Figure 9b,d, it can be seen that the stress in the x direction and z direction is basically over time. The relationship between stress and ambient temperature is a negative correlation. From the curve of Figure 9c, the stress of the y direction basically has a downward trend, and lower temperature the higher formed pressure is. Therefore, since the stress in the x direction is the largest among all directions, cracks are more likely to occur in the vertical direction of this direction.
Figure 10a shows the curve of residual stress of the cladding layer at different ambient temperatures. Comparing the residual stress curves at 0 °C, 200 °C, 400 °C and 600 °C, it can be seen that the residual stress of the cladding layer decreases as the ambient temperature increases. Figure 10b shows the line chart of maximum residual stress of the cladding layer at different ambient temperatures. With the increase in ambient temperature, the maximum residual stress is decreased linearly. It is decreased by 254 MPa and about 36.0% from 706 MPa to 452 MPa. Therefore, ambient temperature has a great influence on the residual stress of the formed parts.

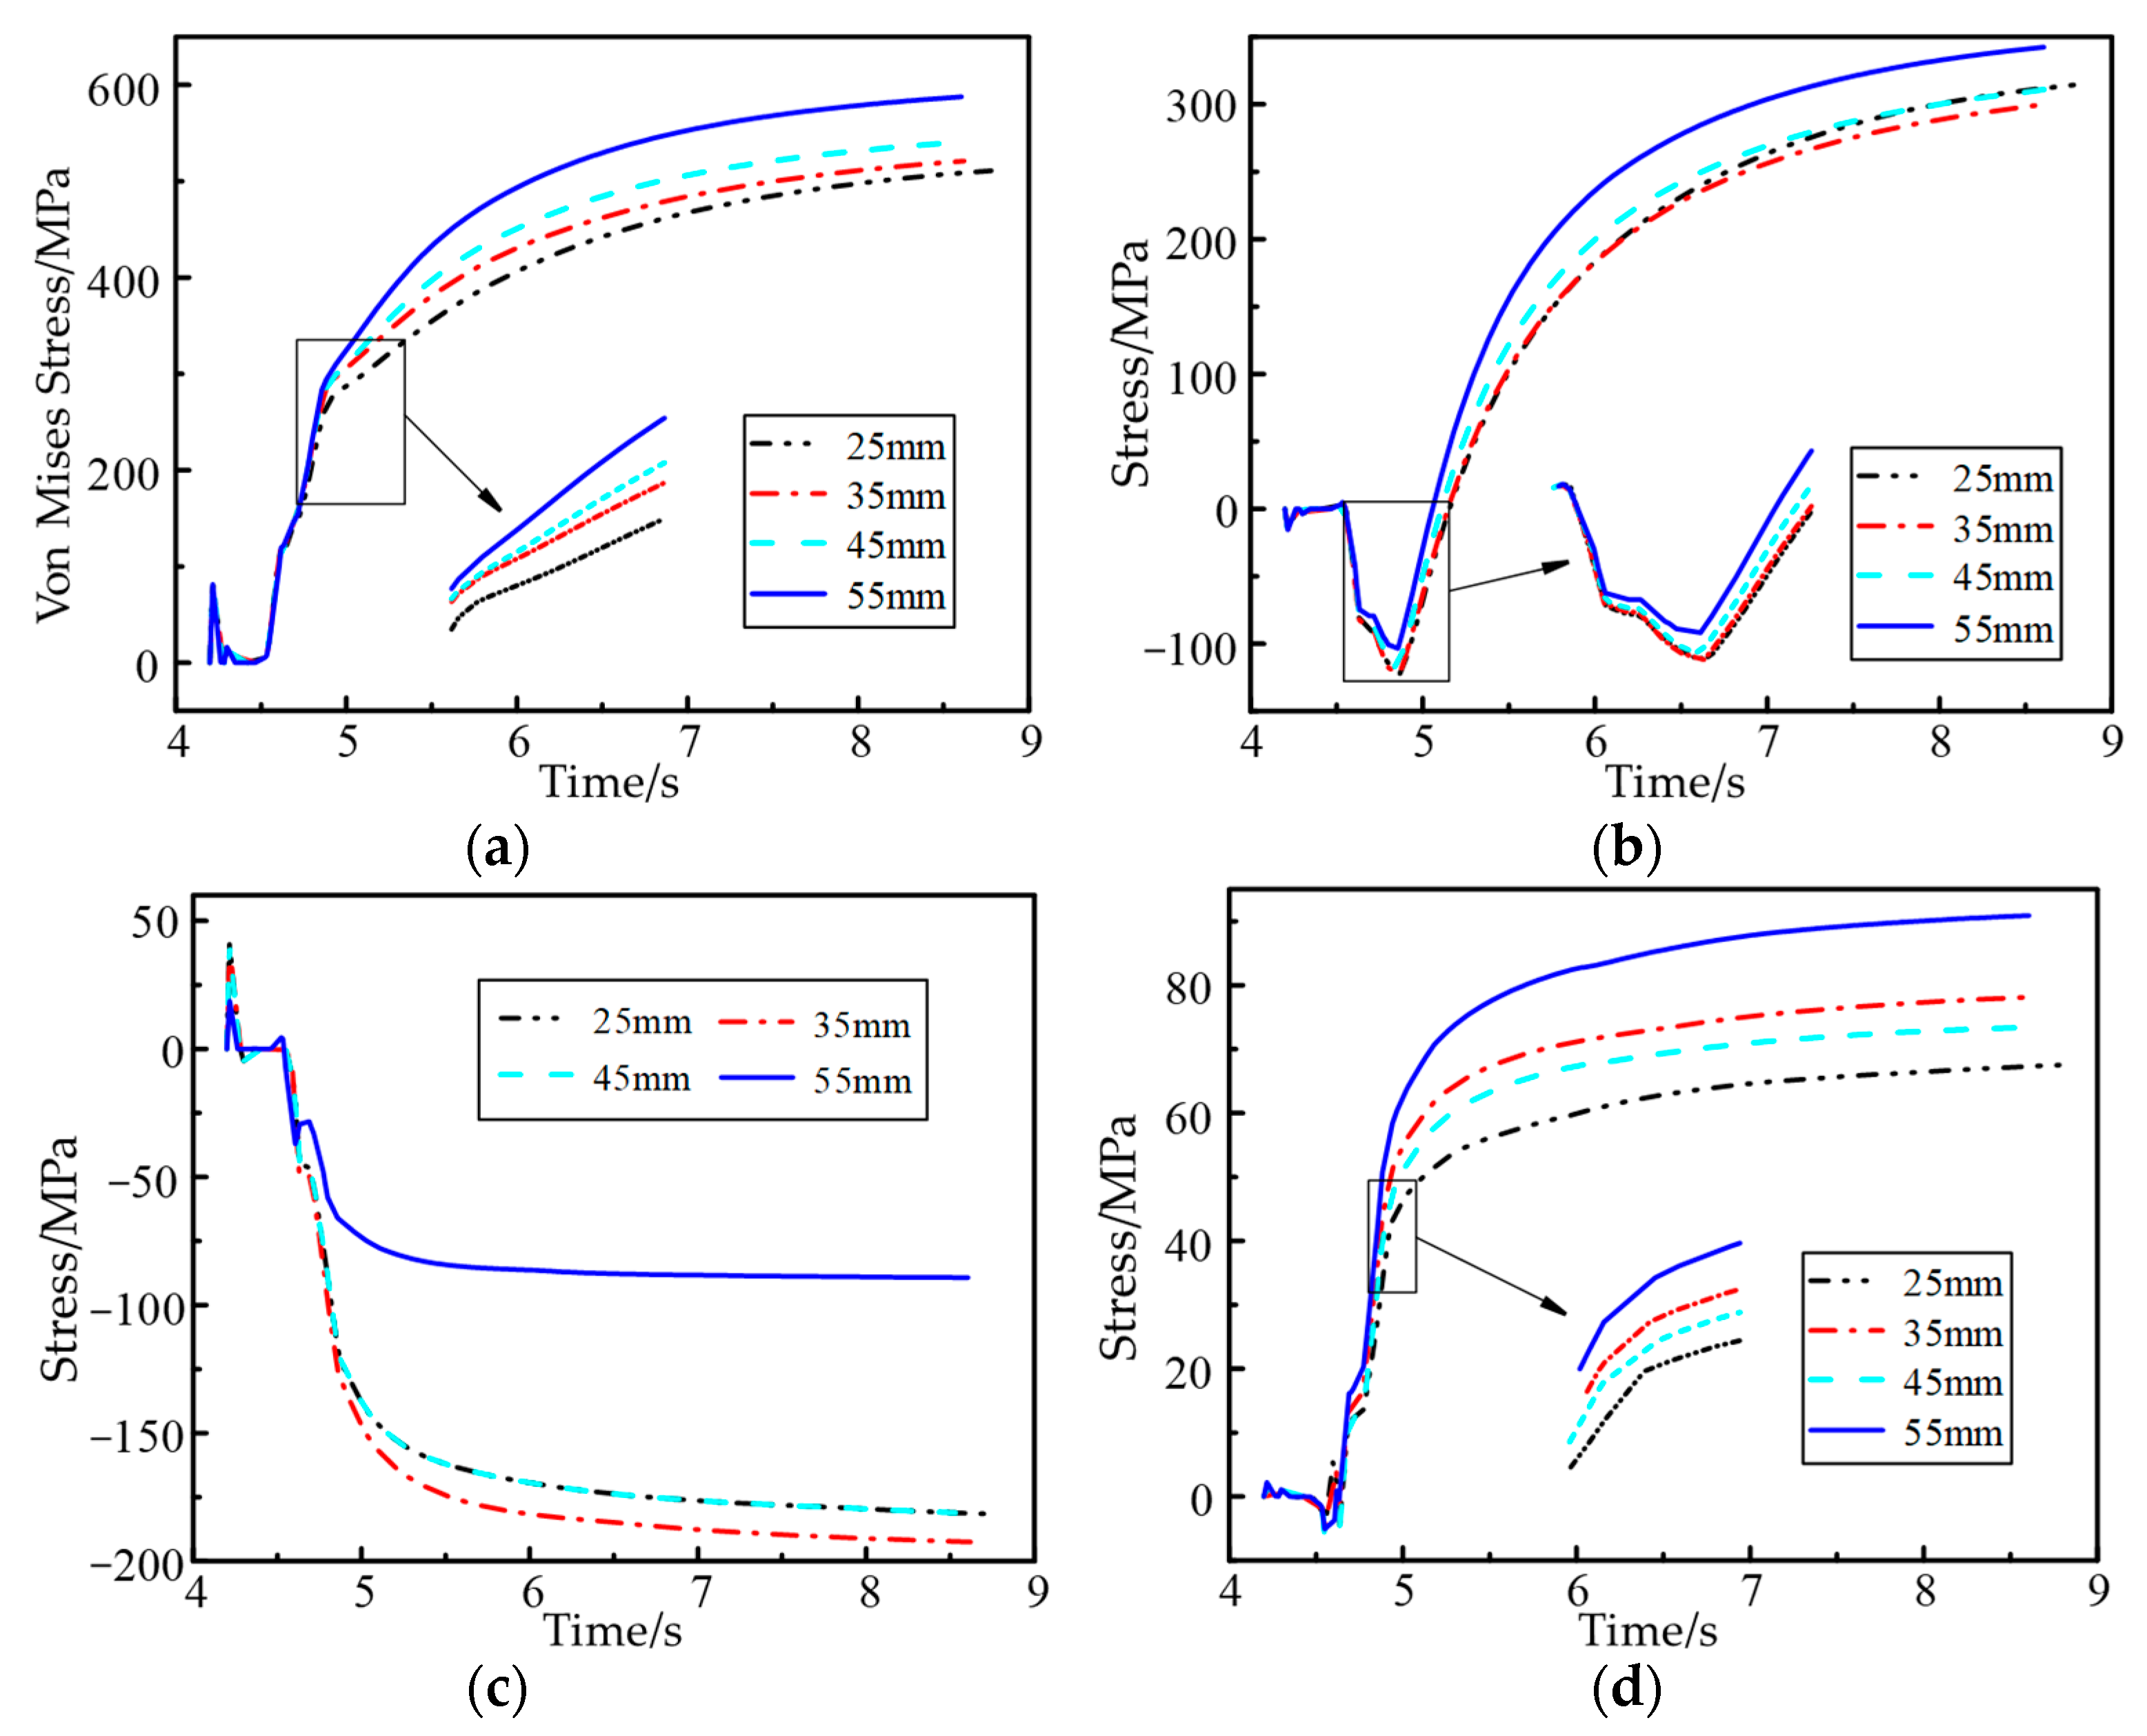
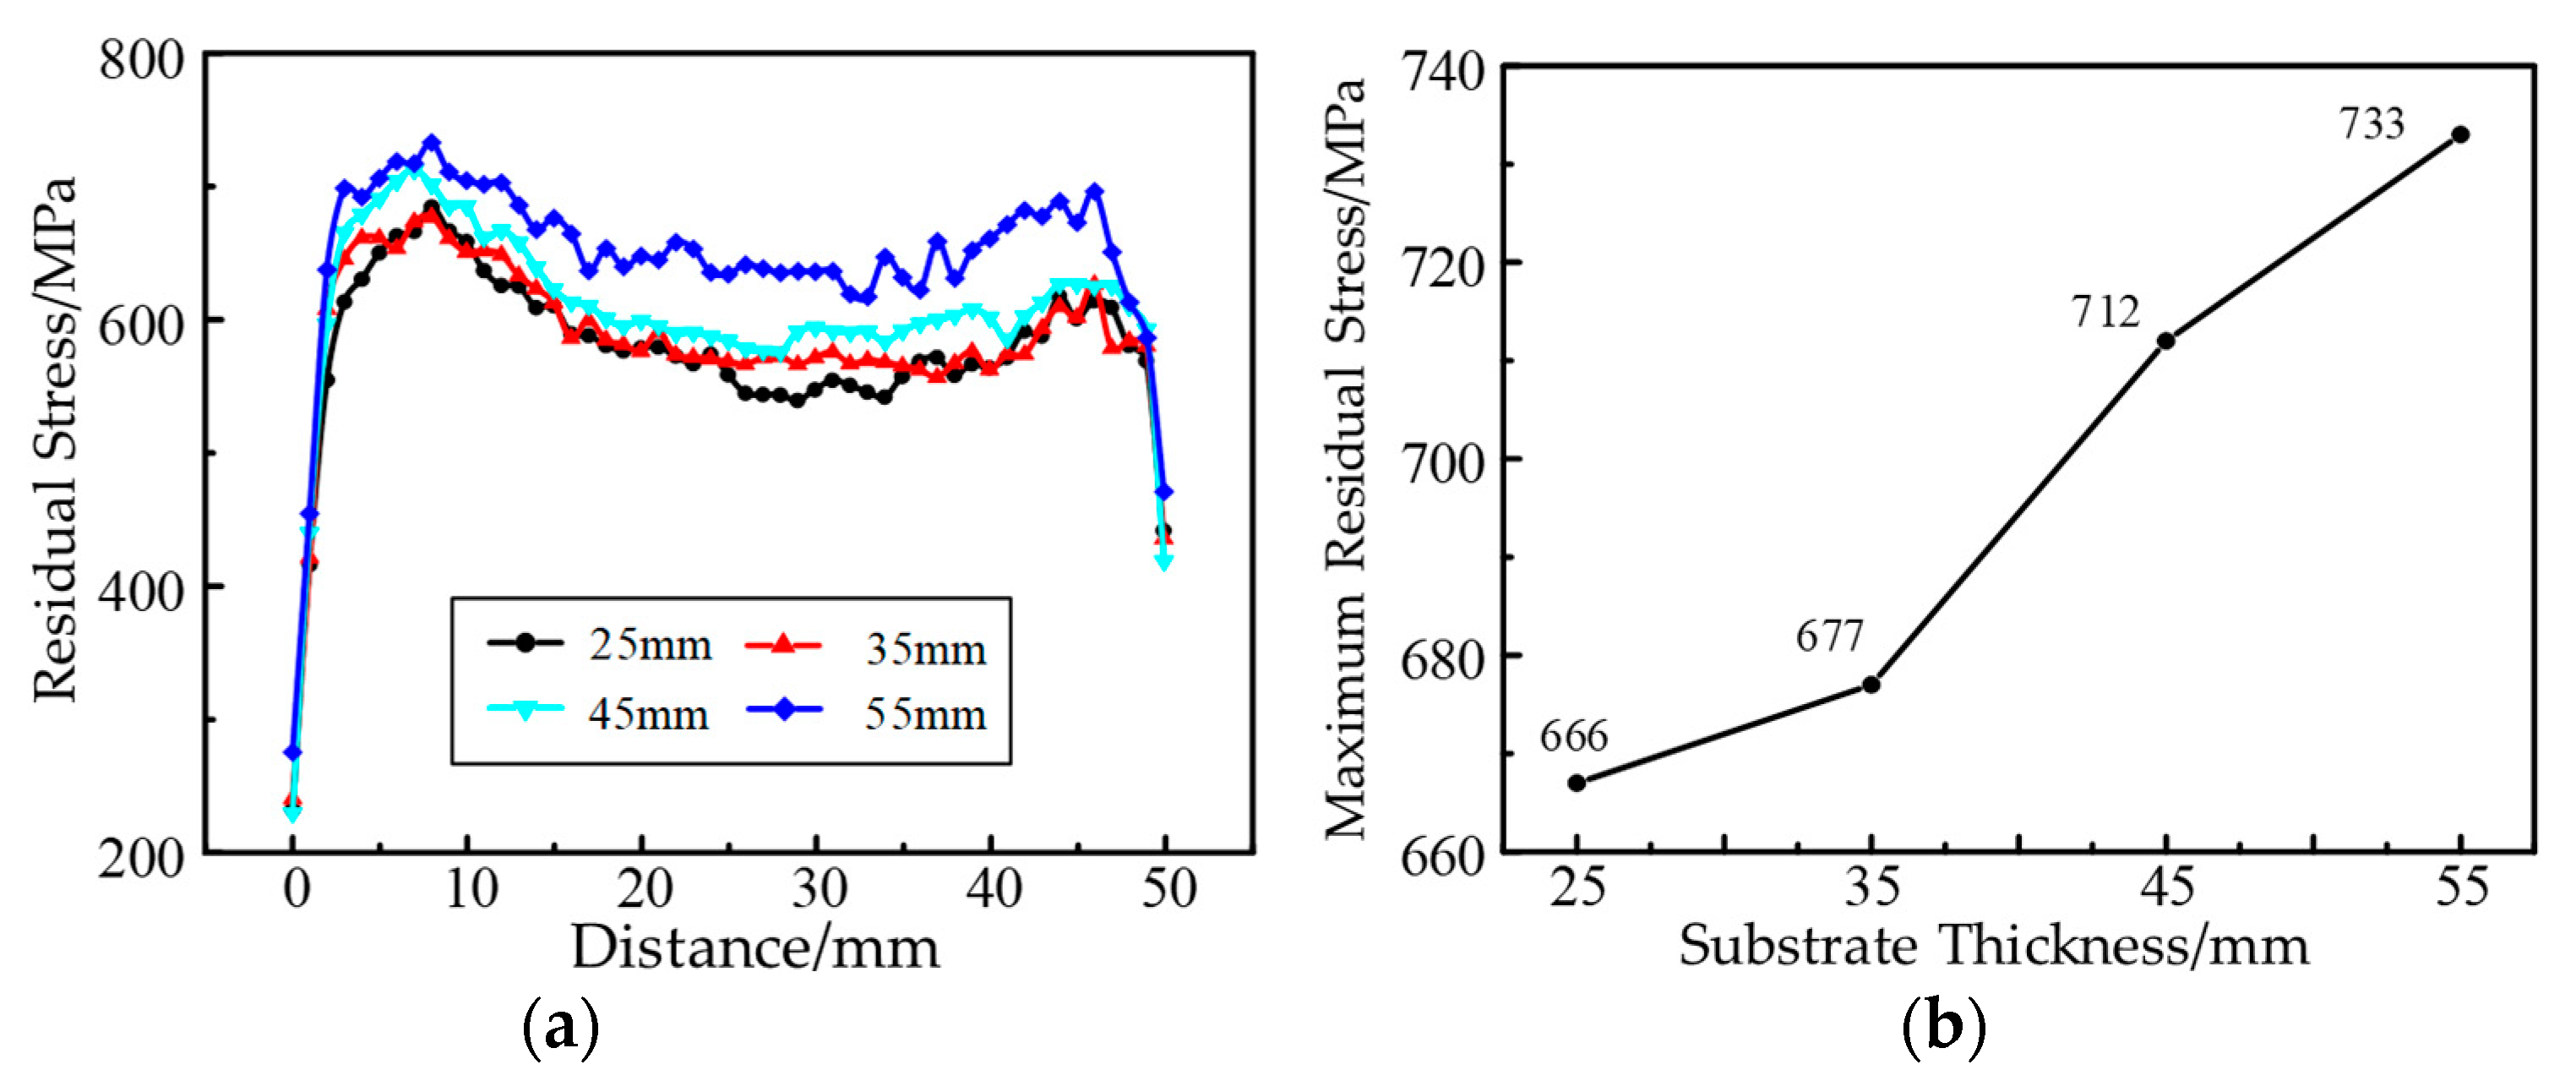
4.2. Substrate Thickness

During the research on the influence of substrate thickness on stress field, four variables of substrate thickness of 25 mm, 35 mm, 45 mm and 55 mm are selected. Figure 11 is the equivalent stress and stress component curve of point A. From Figure 11a, it can be seen that along with the increment in substrate thickness, the von Mises stress increases gradually, which is increased about 15.9% from 511 MPa at substrate thickness of 25 mm to 592 MPa at substrate thickness of 55 mm. However, in the actual process, a relatively obvious deformation would happen when substrate thickness is decreased to a certain thickness [25]. Figure 11b,d show that the stress in the x direction and z direction increases with the increase in substrate thickness. From the curve of Figure 11c, the pressure of the y direction is basically increased over time.
Figure 12a shows the curve of residual stress of the cladding layer under different substrate thicknesses. Comparing the residual stress curves at 25 mm, 35 mm, 45 mm and 55 mm, it can be seen that the residual stress of the cladding layer increases as the substrate thickness increases. Figure 12b shows the line chart of maximum residual stress of the cladding layer under different substrate thicknesses. With the increment in substrate thickness, the maximum residual stress is gradually increased. It is increased by 67 MPa and about 10.0% from 733 MPa to 666 MPa. Therefore, substrate thickness has a certain influence on the residual stress of the formed parts.

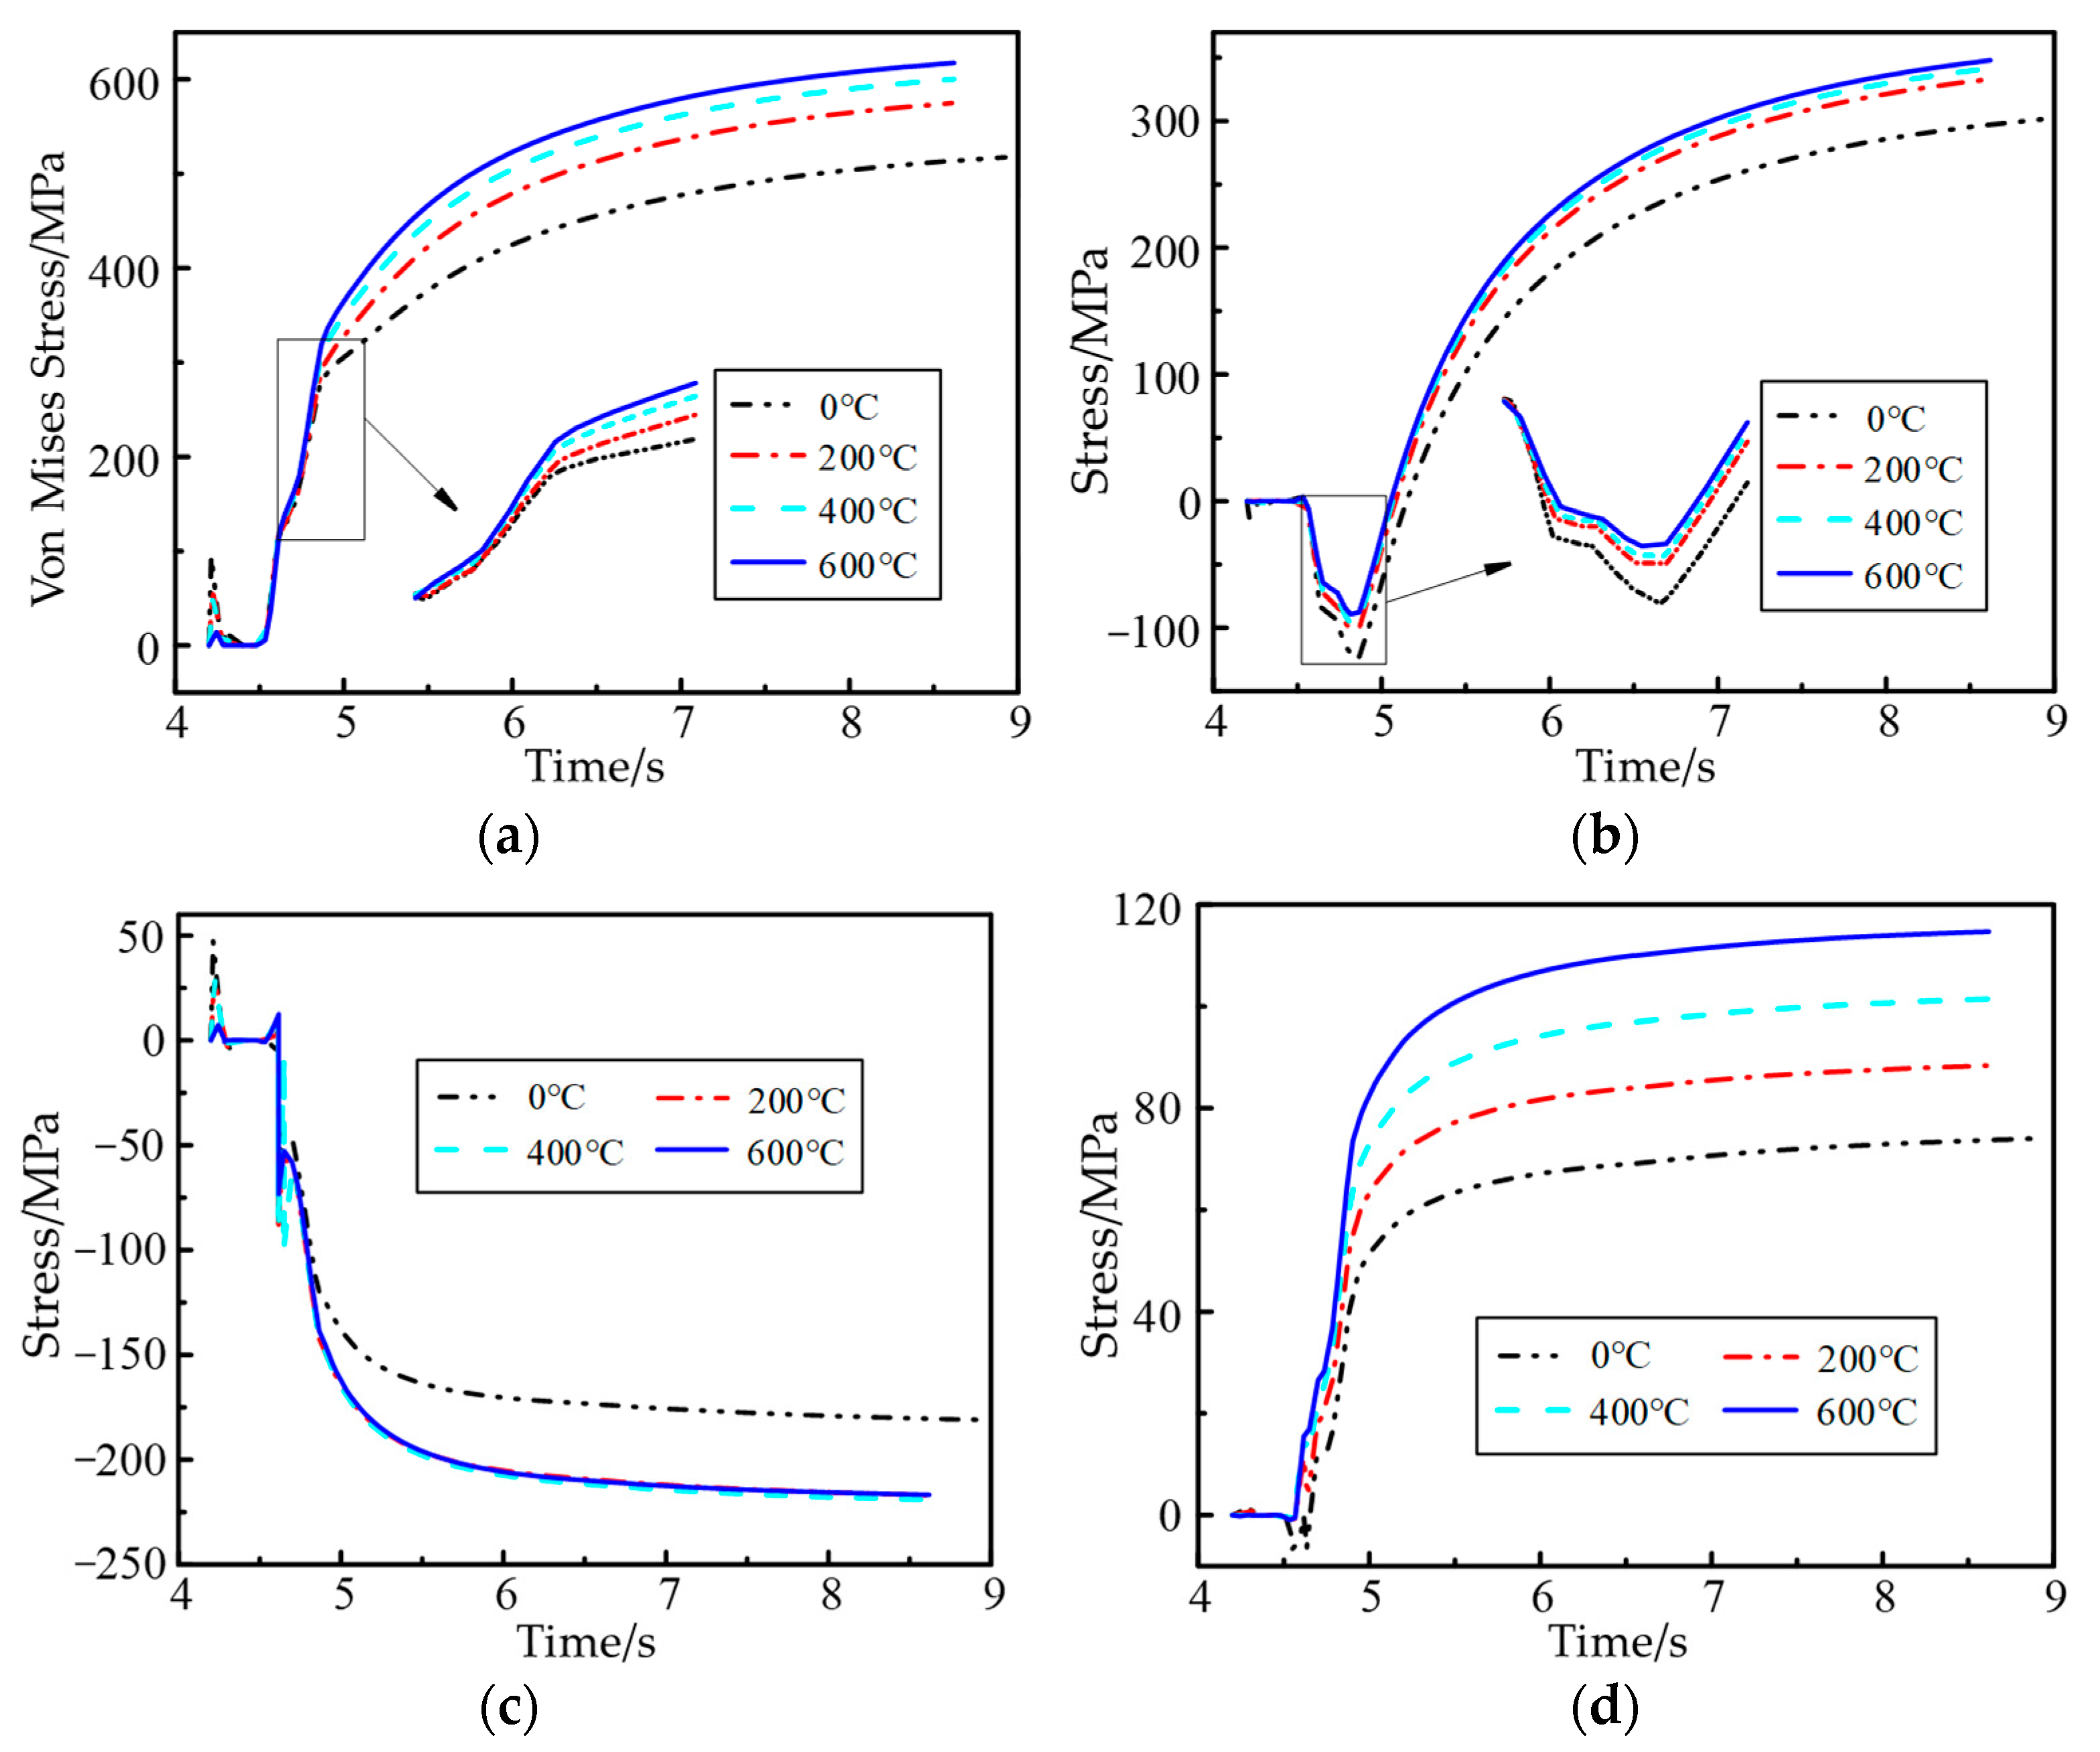
4.3. Wire Temperature

In the research of wire temperature, the wire temperatures of 0 °C, 200 °C, 400 °C and 600 °C are selected. Figure 13 is the equivalent stress and stress component curve of point A. From Figure 13a, it can be seen that along with the increment in wire temperature, the von Mises stress increases gradually, which is increased by 106 MPa and about 20.5% from 518 MPa at 0 °C to 624 MPa at 600 °C. Figure 13b,d show that the stress in the x direction and z direction increases with the increase in wire temperature. Figure 13c shows that the pressure of the y direction is basically increased over time.
Figure 14a shows the curve of residual stress of the cladding layer under different wire temperatures. Comparing the residual stress curves at 0 °C, 200 °C, 400 °C and 600 °C, it can be seen that the residual stress of the cladding layer increases as the wire temperature increases. Figure 14b shows the line chart of maximum residual stress of the cladding layer under different wire temperatures. With the increase in wire temperature, the maximum residual stress is gradually increased. It is increased by 50 MPa and about 7.48% from 718 MPa to 668 MPa. Therefore, wire temperature has little effect on the residual stress of the formed parts.
By comprehensively comparing the effects of ambient temperature, substrate thickness and wire temperature on the stress field, it can be found that ambient temperature has the greatest effect on the residual stress of formed parts, and wire temperature has the least effect on the residual stress.

5. Conclusions

  • In the AM process, in a certain range of clamping conditions, temperature and substrate thickness, the residual stress basically increases first, then decreases and finally gradually increases and tends to be stable. The residual stress of the forming direction has the most influence on von Mises stress.
  • When the temperature increases from 0 °C to 600 °C, the maximum residual stress of the cladding layer basically decreases linearly. The maximum residual stress is decreased about 36.0% from 706 MPa to 452 MPa. When the substrate thickness is increased from 25 mm to 55 mm, the maximum residual stress of cladding layers is gradually increased by 10.0%. When the wire temperature increases from 0 °C to 600 °C, the maximum residual stress of the cladding layer is increased by 7.48%.
  • Through the comprehensive comparisons of residual stress of final formed parts affected by ambient temperature, substrate thickness and wire temperature, it can be found that the ambient temperature has the most influence, then the substrate thickness, and the wire temperature has the least influence.

Author Contributions

Y.L.: Writing—original draft. Q.L.: Investigation. Z.J.: Software. Z.R.: Writing—review & editing. H.L.: Methodology. X.Z.: Data curation, Investigation. All authors have read and agreed to the published version of the manuscript.

Funding

This research received no external funding.

Data Availability Statement

Not applicable.

Conflicts of Interest

The authors declare no conflict of interest.

References

  1. Vrancken, B.; Thijs, L.; Kruth, J.P.; Van Humbeeck, J. Microstructure and Mechanical Properties of a Novel β Titanium Metallic Composite by Selective Laser Melting. Acta Mater. 2014, 68, 150–158. [Google Scholar] [CrossRef] [Green Version]
  2. Huang, W.; Kovacevic, R. A Laser-Based Vision System for Weld Quality Inspection. Sensors 2011, 11, 506–521. [Google Scholar] [CrossRef] [PubMed]
  3. Zhou, C.Y.; Luo, L.; Liu, Y.; Wu, J. Research Status of Additive Manufacturing Technology for Metal. Hot Work. Technol. 2018, 47, 9–14. [Google Scholar]
  4. Song, B.; Dong, S.J.; Liao, H.L.; Coddet, C. Process Parameter Selection for Selective Laser Melting of Ti6Al4V Based on Temperature Distribution Simulation and Experimental Sintering. Int. J. Adv. Manuf. Technol. 2012, 61, 967–974. [Google Scholar] [CrossRef]
  5. Baufeld, B.; Brandl, E.; Biest, O.V.D. Wire Based Additive Layer Manufacturing: Comparison of Microstructure and Mechanical Properties of Ti-6Al-4V Components Fabricated by Laser-Beam Deposition and Shaped Metal Deposition. J. Mater. Process. Technol. 2011, 211, 1146–1158. [Google Scholar] [CrossRef]
  6. Mok, S.H.; Bi, G.; Folkes, J.; Pashby, L. Deposition of Ti-6Al-4V Using a High Power Diode Laser and Wire, Part I: Investigation on the Process Characteristics. Surf. Coat. Technol. 2008, 202, 3933–3939. [Google Scholar] [CrossRef]
  7. Peng, Q.; Dong, S.Y.; Yan, S.X.; Men, P.; Wang, B. An Overview of Defects in Laser Melting Deposition Forming Products and the Corresponding Controlling Methods. Mater. Rep. 2018, 32, 2666–2671+2682. [Google Scholar]
  8. Victor, C.; Philippe, Q.; Wilson, M.; Eric, C. Comparative Study of Fatigue Properties of Ti-6Al-4V Specimens Built by Electron Beam Melting (EBM) and Selective Laser Melting (SLM). Mater. Charact. 2018, 143, 76–81. [Google Scholar]
  9. Sun, Q.J.; Sang, H.B.; Liu, Y.B.; Feng, J.C. Section Scanning Trajectory Planning Based on Arc Additive Manufacturing. Trans. China Weld. Inst. 2017, 38, 21–24+65. [Google Scholar]
  10. Shen, J.Q.; Hu, S.S.; Liu, W.L.; Han, J.H. Effects of Time Interval in Rapid Prototyping of Al-alloy Based on Welding. Trans. China Weld. Inst. 2008, 29, 112–115+121. [Google Scholar]
  11. Ogino, Y.; Asai, S.; Hirata, Y. Numerical Simulation of WAAM Process by a GMAW Weld Pool Model. Weld. World 2018, 62, 393–401. [Google Scholar] [CrossRef]
  12. Daniel, R.; Thorsten, S.; Robert, F.S.; Paul, S.; Carolin, K.; Julia, M. Macroscopic Simulation and Experimental Measurement of Melt Pool Characteristics in Selective Electron Beam Melting of Ti-6Al-4V. Int. J. Adv. Manuf. Technol. 2017, 88, 1309–1317. [Google Scholar]
  13. Zinoviev, A.; Zinovieva, O.; Ploshikhin, V.; Romanova, V.; Balokhonov, R. Evolution of Grain Structure During Laser Additive Manufacturing. Simulation by a Cellular Automata Method. Mater. Des. 2016, 106, 321–329. [Google Scholar] [CrossRef]
  14. Chu, Y. Temperature Field Simulation of Dual-Beam Cladding Al2O3 and Design of Optical System. Master’s Thesis, Dalian University of Technology, Dalian, China, 2014. [Google Scholar]
  15. Loh, L.E.; Chua, C.K.; Yeong, W.Y.; Song, J.; Mapar, M.; Sing, S.L.; Liu, Z.H.; Zhang, D.Q. Numerical Investigation and an Effective Modelling on the Selective Laser Melting (SLM) Process with Aluminium Alloy 6061. Int. J. Heat Mass Transf. 2015, 80, 288–300. [Google Scholar] [CrossRef]
  16. Dubrov, A.V.; Mirzade, F.K.; Dubrov, V.D. Mathematical Modeling of Thermal Behavior for Additive Manufacturing with Metal Powder Injection. Procedia Eng. 2017, 201, 478–488. [Google Scholar] [CrossRef]
  17. Zhao, H.H.; Zhang, G.J.; Yin, Z.Q.; Liu, W. A 3D Dynamic Analysis of Thermal Behavior During Single-pass Multi-layer Weld-based Rapid Prototyping. J. Mater. Process. Technol. 2011, 211, 488–495. [Google Scholar] [CrossRef]
  18. Miranda, R.M.; Lopes, G.; Quintino, L.; Rodrigues, J.P.; Williams, S. Rapid Prototyping with High Power Fiber Lasers. Mater. Des. 2008, 29, 2072–2075. [Google Scholar] [CrossRef]
  19. Zhan, Y.; Liu, C.; Zhang, J.; Mo, G.; Liu, C. Measurement of Residual Stress in Laser Additive Manufacturing TC4 Titanium Alloy with the Laser Ultrasonic Technique. Mater. Sci. Eng. A 2019, 762, 138093. [Google Scholar] [CrossRef]
  20. Fan, P.; Pan, J.; Ge, Y.; Zhan, Y. Finite Element Analysis of Residual Stress in TC4/TC11 Titanium Alloy Gradient Material Produced by Laser Additive Manufacturing. Chin. J. Lasers 2021, 48, 110–118. [Google Scholar]
  21. Samodurova, M.; Logachev, I.; Shaburova, N.; Samoilova, O.; Radionova, L.; Zakirov, R.; Pashkeev, K.; Myasoedov, V.; Trofimov, E. A Study of the Structural Characteristics of Titanium Alloy Products Manufactured Using Additive Technologies by Combining the Selective Laser Melting and Direct Metal Deposition Methods. Materials 2019, 12, 3269. [Google Scholar] [CrossRef]
  22. Li, H.M. Study on the Process Characteristics of Wire Based Laser Additive Manufacturing. Master’s Thesis, Chongqing University, Chongqing, China, 2017. [Google Scholar]
  23. Yin, B. Experimental Study on Laser Welding Technology of Invar Thick Plate Materials. Master’s Thesis, Dalian University of Technology, Dalian, China, 2009. [Google Scholar]
  24. Filippo, M.; Giuseppe, V.; Antonio, S.; Gianni, C. Finite Element Modelling of Wire-arc-additive-manufacturing Process. Procedia CIRP 2016, 55, 109–114. [Google Scholar]
  25. Yuan, D.; Gao, H.B.; Sun, X.J.; Zhou, C.P.; Sun, L.B.; Chen, Y.J.; Guo, C.H.; Niu, Z.Y.; Jiang, F.C. Methods and Techniques for Improving Microstructure and Performance of Metal Additively Manufactured Materials. Aeronaut. Manuf. Technol. 2018, 61, 40–48. [Google Scholar]
Figure 1. Grid diagram of substrate and cladding layer in AM.
Machines 10 01197 g001
Figure 2. Sketch of the three-dimensional model of the double ellipsoid heat source.
Machines 10 01197 g002
Figure 3. Thermophysical performance parameters of Ti-6Al-4V.
Machines 10 01197 g003
Figure 4. Temperature curve at different points of the cladding layer at equal intervals: (a) Temperature curve at different points of cladding layer in reference [22]; (b) finite element simulation of temperature curve at different points of cladding layer.
Machines 10 01197 g004
Figure 5. Stress cloud diagram and stress curve diagram of point A: (a) Stress cloud diagram of LAM; (b) stress curve diagram of point A.
Machines 10 01197 g005
Figure 6. Residual stress cloud diagram of cladding layer.
Machines 10 01197 g006
Figure 7. Residual stress curve along the path.
Machines 10 01197 g007
Figure 8. Specified stress revised direction.
Machines 10 01197 g008
Figure 9. Stress curves under different ambient temperatures: (a) Von Mises stress curve; (b) stress curve in x direction; (c) stress curve in y direction; (d) stress curve in z direction.
Machines 10 01197 g009
Figure 10. (a) Curve of residual stress at different ambient temperatures; (b) line chart of maximum residual stress at different ambient temperatures.
Machines 10 01197 g010
Figure 11. Stress curves under different substrate thicknesses: (a) Von Mises stress curve; (b) stress curve in x direction; (c) stress curve in y direction; (d) stress curve in z direction.
Machines 10 01197 g011
Figure 12. (a) Curve of residual stress under different substrate thicknesses; (b) line chart of maximum residual stress under different substrate thicknesses.
Machines 10 01197 g012
Figure 13. Stress curves under different wire temperatures: (a) Von Mises stress curve; (b) stress curve in x direction; (c) stress curve in y direction; (d) stress curve in z direction.
Machines 10 01197 g013
Figure 14. (a) Curve of residual stress under different wire temperatures; (b) line chart of maximum residual stress under different wire temperatures.
Machines 10 01197 g014
Table 1. Chemical compositions of Ti-6Al-4V wire and substrate.
CompositionAlVFeCTi
wire5.83.80.090.01Bal
substrate5.54.80.40.2Bal
Publisher’s Note: MDPI stays neutral with regard to jurisdictional claims in published maps and institutional affiliations.

