1. Introduction
The threaded connection is a common connection method in modern industry. In some high-end aerospace precision products, the precision threaded connection is widely used due to its ease of installation [
1]. For example, the micro constant force locking mechanism in a pendulum accelerometer assembles parts with multiple materials and cross-scale characteristics together through threaded pairs [
2]. However, due to the irreversibility of precision product assembly, as well as the unavoidable geometric deviations during thread machining and manufacturing, it is easy to cause the problem of discrete distribution of preload force [
3] and uneven distribution of stress [
4,
5]; the slight deformation and stress concentration of the instrument parts caused can have a great impact on the accuracy [
6,
7]. For example, for a precision optical system [
8], the peak-to-valley (PV) of the wavefront is usually required to be less than 63 nm, and a 1 N change in the preload force will change the wavefront peak-to-valley value (PV) by 2 nm, i.e., a few percentage points of error in the preload force will also result in a considerable change in the PV value.
In the assembly of high-end aerospace precision products, the dispersion of the preload is very likely to cause the problem of out-of-tolerance of product accuracy. Many scholars have studied the influencing factors of preload dispersion through theoretical and finite element analysis and experiments [
9,
10,
11,
12,
13]. The research of Wettstein [
14] shows that up to 30–40 parameters can influence the torque-preload relationship in threaded fasteners, such as material [
15], surface finish [
16], etc. Grabon [
17] et al. studied the effect of the thread manufacturing process on the dispersion of preload through experiments. Liu [
18] and Zou et al. [
11,
19] studied the variation law of the thread friction coefficient under lubrication conditions and found that the use of lubricant can effectively reduce thread preload dispersion. Nassar [
20,
21,
22] did some research on the influence of preload dispersion by theoretical and experimental analysis and proposed a new torque-preload relationship, but the practical application is more cumbersome. Shigley and Mischke [
23] proposed an alternative formulation of the torque–preload relationship, which incorporates the thread lead angle and the profile angle but does not address the influence of the thread geometry deviation on preload dispersion. The torque–preload relationship for threaded connections is usually determined in the laboratory under different application conditions, while the torque–preload relationship for high-end aerospace precision products is difficult to control precisely due to the harsh and changing application environment; there is little research on the geometric deviation of precision threads on the performance of small-sized threaded connections.
The non-uniform stress distribution under the action of thread tightening and its time-varying additional error are important factors affecting the precision and stability of precision products, and for this reason, relevant scholars have carried out a series of related studies on stress distribution and time-varying additional error in threaded connections [
24,
25]. Nassar et al. [
26] experimentally investigated the variation law of the torque–preload conversion relationship for different materials and different thread parameters, and the results show that the contact stress has a large influence on the friction coefficient and the thread stress is not uniformly distributed. Similarly, Pirmoradian et al. [
27] pointed out the phenomenon of uneven stress distribution on the thread pair in their research and verified this conclusion through a photobomb freeze experiment. Marshall [
28] used the ultrasonic method to study the contact pressure of bolted connections. Regarding the additional error under time-varying, Chen et al. [
29] conducted fatigue tests on bolts and nuts with a small pitch difference and found that the pitch deviation affects the secondary stress distribution of the thread, thus significantly affecting the fatigue performance of the bolt. The numerical analysis methods have the advantages of being intuitive, reliable, fast, and accurate, providing new ideas for the study of stress distribution on complex structures [
30,
31]. Zeng [
32] gave the shear stress distribution on the connected structure by building a three-dimensional solid model of the screw, and Cho [
33] constructed a two-dimensional axisymmetric model to predict the effect of the number of bolt petal cross-sections on deformation and stress distribution. Ranjan et al. [
34] found that for the thread pair in the tangential direction, the larger the diameter, the greater the stress. Long et al. [
35] analyzed the stress distribution law of ordinary triangular threaded bolt-nut under the action of axial force through finite element numerical analysis and found that the closer to the end face, the higher the axial stress. Lu [
36] established a three-dimensional finite element model of thread root to study the influence of Young’s modulus
, axial total load
, friction coefficient
, radial thickness
, number of threads engaged
, thread defects, and other factors on the load distribution. Existing research has investigated the distribution of stresses on joint structures by means of experimental and numerical analysis, but there is no definitive conclusion on the uniformity of stress distribution due to the tightening action under thread manufacturing errors.
In summary, although the existing scholars have conducted a series of research on precision threaded connection, there is no clear conclusion on the dispersion of preload and non-uniform distribution of corresponding stress caused by thread manufacturing error in practical application. At the same time, most of the existing research focuses on large-size threaded connection, but there is little research on small-size threaded connection commonly used in high-end precision products. In addition, due to the difficulty of measurement in the tightening process of small-sized screws, the dispersion of preload force and the uneven distribution of assembly stress caused by inevitable manufacturing errors have a great impact on the accuracy and stability of high-end precision products, so it is necessary to study the engagement mechanism and stress distribution law of tiny-size threaded connections under manufacturing errors to improve their tightening accuracy and product stability.
Based on this, this paper focuses on the influence of precision thread manufacturing error on the mechanism of thread engagement and stress distribution law in the assembly process of high-end precision products. Firstly, a three-dimensional finite element model of thread refinement of high-end precision products is established. Secondly, the engagement of precision threads under the condition of thread geometric deviation is analyzed, and the influence of geometric deviation on the stress distribution on the screw and the connector is discussed. Finally, the accuracy of the thread engagement simulation model and the analysis method is verified by the small-size thread friction coefficient experiment. The relevant research contents have important theoretical and engineering significance for improving the screw tightening accuracy and the uniformity of screw contact stress distribution in aerospace precision products.
2. Analysis of Influencing Factors of Thread Engagement
The common size of threaded connections in high-end aerospace precision products is M2–M4. Due to mold wear and other reasons, geometric manufacturing deviations are prone to occur in the processing of tiny size threads, causing dispersion errors in preload force and uneven distribution of connection stress in actual assembly applications. This section deduces the relationship between the thread geometric parameters and each torque and preload force during tightening, and then analyzes the influence of geometric deviation on the size of the preload and stress distribution.
The torque is divided into three components according to the classical torque input formula of Motosh [
37,
38], thread tightening torque
, frictional torque on the end face of the screw head
, and thread friction torque
, as shown in Formula (1), where the thread tightening torque
generates the preload force, and the dispersion of the preload mainly comes from the uncertain influence of the other two friction torques
,
in the tightening process.
To study the torque–preload relationship during the tightening and engagement of precision threads, we create a local three-dimensional representation of the thread surface as shown in
Figure 1. Rotate
on the
plane of the global coordinate system by an angle of
around the
axis to get
, and then fix the
side to rotate
angle to get
, the thread surface can be represented by the plane
as its relationship in the global coordinate. We define the tangent direction along the thread surface as
, the direction perpendicular to the thread surface as
,
, and
can be expressed by the global coordinate system as the following formula.
The tightening torque applies the load to the screw, and we can obtain the thread tightening torque and thread friction torque by integrating the contact pressure on the thread surface over the contact area on the thread surface, and the screw head friction torque can be obtained by integrating the contact pressure on the bolt head over the contact area on the screw head, as shown in Equations (4)–(6).
where
,
is the friction coefficient of the contact surface;
is the thread profile angle;
is the thread helix angle,
;
,
are the contact pressures of the thread surface and the end surface of the screw head;
and
are the equivalent contact radius of the thread surface and the end surface of the screw head.
The equivalent contact radius is related to the geometric parameters of the thread and pressure distribution. The pressure distribution of different bolt support surfaces will change the effective radius
and
of the bearing surface, resulting in different frictional torques. When there are geometric deviations in the threads, such as inconsistencies in the thread angle
, pitch
, and pitch diameter
of different screws, the contact pressure and friction radius on the thread surface and the end surface of the screw head change, resulting in a change in the size of the friction torque and causing dispersion of the preload force of different bolts. To further analyze the stress distribution in the precision threaded connection structure, we simplify the threaded tooth as a cantilever beam structure and the force on the threaded tooth as a concentrated force
, as shown in
Figure 2a; the stress distribution in the threaded connection can be expressed as:
where
is the radial contact area of any cross-section on the threaded structure.
Figure 2b shows the simulated stress distribution of the cross-section on the connected structure.
The axial load at any section is:
where
is the effective engagement length, and
is a parameter about the thread structure, related to the geometric parameters of the thread. When it changes, the axial load component
at any cross-section in the thread changes, as can be seen from the Equation (7), affecting the stress distribution on the connection cross-section. Therefore, when there is a thread manufacturing error, the assembly stress distribution is complex and uneven along the screw axis at different screw connection positions.
Based on the above analysis, when there is a geometric deviation between different bolts, the equivalent contact radius during the tightening process changes, which affects the dispersion of the precision thread preload. At the same time, the concentrated force on the thread changes during an engagement, increasing the degree of uneven distribution of contact stress on the threaded connection structure. The friction coefficient of the contact surface is related to the material of the part itself, so we do not consider it here.
3. Influence of Geometric Deviation on Preload Dispersion
According to the above analysis, the geometrical deviation is extremely critical to the preload and stress distribution, while theoretical analysis and empirical formulas are far from sufficient for small-sized connection structures in precision instruments. To support the quantitative control of the connection process and determine the influence of geometric deviation on the preload and stress distribution, this section presents a parametric simulation analysis of the thread engagement process by establishing a refined three-dimensional model.
3.1. Parametric Finite Element Model
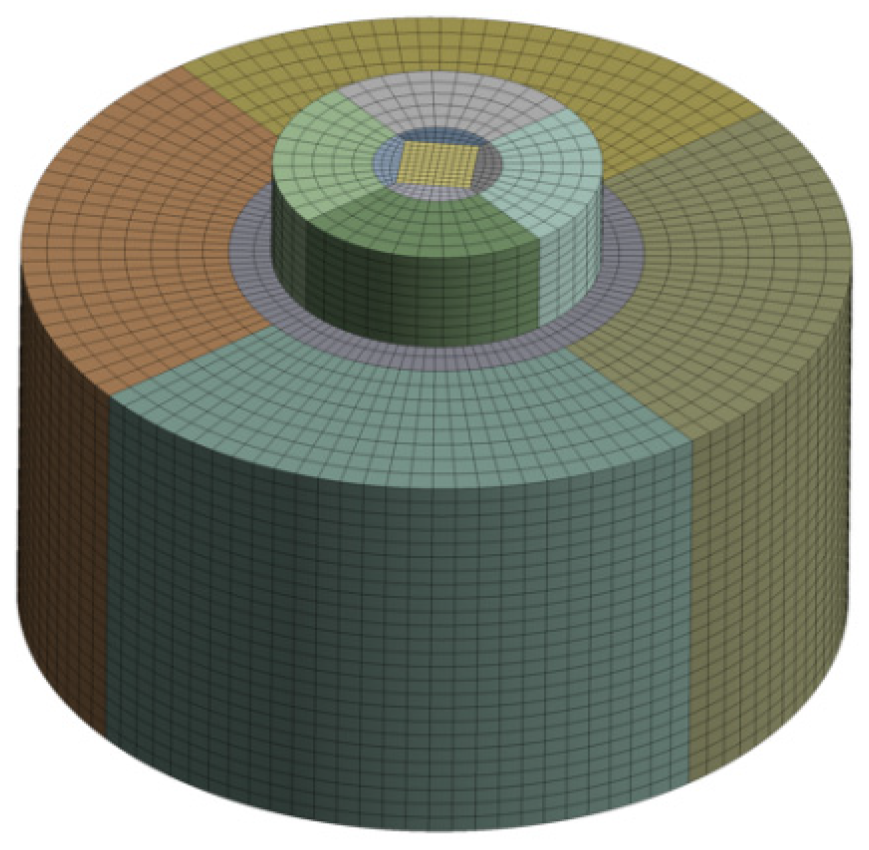
By using the static structure module in the finite element analysis software ANSYS Workbench Mechanical, the tightening process under the geometric deviation of the contact surface is numerically simulated, and a parametric geometric model composed of
M2 screws and connectors is established. The connected part is simplified as a circular cylinder, as shown in
Figure 3. The parameterized geometric quantities include the thread pitch
, the pitch diameter of the thread
, and the thread profile angle
. The value ranges are set as shown in
Table 1.
The model contact surface in the numerical simulation model is frictional contact, the friction coefficient is set to 0.15. A unilateral nonlinear contact that allows separation and frictional sliding are set, and the contact penetration distance measurement and contact force calculation are performed based on the Cescotto and Charlier models using the extended Lagrangian contact algorithm. Applying torque to the screw head is used to simulate the tightening of the screw during the actual assembly process. Also, because of the difficulty in the convergence of the nonlinear simulation calculation of the threaded structure, downward pressure is applied on the end face of the screw head at the beginning of the calculation, and the force is canceled in the subsequent calculation steps to increase the convergence of the calculation.
3.2. Parametric Finite Element Results
Under the premise of no thread geometric interference, set the pitch
to
as the independent variable, and other parameters remain unchanged. The correlation curves comparing the tightening process under the internal and external pitch errors are shown in
Figure 4a. Under the same input torque, the torque loading is in a linear process, and the final preload force increases when the external thread deviation increases; when the internal thread error increases, the final preload force decreases slightly. Taking the pitch of 0.4 mm as the standard, the change of the thread preload under the deviation of the internal and external pitch is calculated. As shown in
Figure 4b, it can be seen that the deviation of the external thread has a more obvious effect on the dispersion of the preload than the deviation of the internal thread.
We set the pitch diameter of thread
to
, and keep other parameters unchanged. The result is shown in
Figure 5a below. Under the same tightening torque loading, the preload force slightly increased with the change of the pitch diameter of thread deviation, but the change was not significant. Taking the pitch diameter of thread 1.740 mm as the standard, according to
Figure 5b, with the increase of the pitch diameter of thread
, the dispersion degree of the preload force also increases, and the degree of its effect on preload force variation is similar to the effect on pitch variation.
When machining threads, the angle of the turning tool or the machining accuracy and wear of the thread mold will cause the deviation of the profile angle. In the simulation calculation, we set the profile angle α of the external thread to be 57°~63°, and keep other parameters unchanged, and extract the preload in the result, as shown in
Figure 6a. Taking the profile angle of 60° as the standard, the preload force becomes smaller when the tooth angle decreases, and the preload force increases when the tooth angle increases. From
Figure 6b, the influence of thread angle is a little bit greater than the influence of pitch and mid diameter.
Based on the above analysis, the geometric deviation of the thread has a certain influence on the final preload, among which the thread pitch deviation and the median deviation have a similar degree of influence on the preload force, while the thread tooth angle deviation has a more obvious influence on the preload force, which increases with the increase of the thread tooth angle, without affecting the thread engagement.
3.3. Analysis and Discussion of the Thread Engagement Process
According to the above analysis, the existence of geometric deviation affects the dispersion of preload to some extent. Here we number the threads close to the screw head from 1 to n along the screw axis, and number the threads close to the screw head as 1. Furthermore, we analyze the thread engagement under geometric deviation, and study the stress distribution of the connecting structure under geometric deviation.
In the case of a smaller external thread pitch than the internal thread pitch, the initial engagement is such that the nth thread at the far end of the screw is in close-fitting contact, while the remaining threads have not yet started to make contact. With the loading of the tightening torque, the No. n screw tooth is compressed and deformed, the No. n-1 screw tooth gradually starts to fit into contact, the screw tooth near the screw head fits into contact first, while eventually the screw tooth around the screw head does not fit as well as the screw tooth near the end of the screw, and the stress distribution area shrinks. From the first four stress distribution diagrams in
Figure 7 (from left to right), as the male thread pitch decreases, the screw teeth near the screw head fit more tightly, causing the contact stress cone to move up and the stress distribution area to shrink inwards. Conversely, as the internal thread pitch decreases (the last four stress distribution diagrams in
Figure 7), the thread at the end of the screw fits tighter and the stress distribution area spreads outwards.
We set the pitch diameter of the thread to be reduced to the negative direction deviation. In the case of the negative direction deviation of the external thread, during the initial engagement, only the area close to the top of the tooth is in contact with the internal and external threads. Compared with the case of no deviation, the contact area is reduced, and the contact stiffness is weakened. As the threads are tightened further, the threads are more likely to be deformed by extrusion and the stress distribution area is more likely to shrink. The stress distribution diagram in
Figure 8 shows that the contact stiffness of the screw thread weakens as the median diameter decreases, and the stress distribution on the joint structure concentrates around the screw head, and the distribution area shrinks.
When the initial engagement condition is set to a large external thread angle, the external thread near the root area is in contact with the internal thread near the top area, and the fit is not tight, the stress area is concentrated in the contact area between the root of the external thread and the top of the internal thread. With the further increase of tightening torque, the tooth top area of internal thread contact is more likely to produce extrusion deformation, and the contact area changes from initial line to surface contact, and finally reaches a stable contact state. As shown in the simulation in
Figure 9, as the external thread tooth angle increases, the stress concentrates around the screw head and the distribution area shrinks.
Based on the above analysis, the geometric deviation of the thread affects the engagement of the thread in actual tightening and has a certain impact on stress distribution. When the pitch of the external thread decreases, the pitch diameter of the thread decreases, or the profile angle of the external thread increases, the contact stress cone on the connection structure moves upward and contracts toward the area around the screw head, which is prone to stress concentration, which reduces the stability of the assembled product and brings instability factors.
5. Discussion
The thread end friction torque is equal to the product of the preload force with and equivalent friction radius and end friction coefficient, while the presence of the amount of geometric deviation does not affect the magnitude of the friction coefficient on its contact surface. The change in end friction torque is consistent with the change in the equivalent contact radius of the end face, so the change in end friction torque under thread deviation can be taken as the change in the equivalent contact radius of the end face. The change in equivalent contact radius for each thread deviation is inversely proportional to the final preload force, as shown on the right-hand axis of
Figure 12a–c. The most significant change in the equivalent contact radius is for the thread angle deviation, while the change in the final preload force is equally significant. We statistically analyzed the correlation between the change of preload force and the change of equivalent contact radius and, as shown in
Figure 13, the relationship between preload force and friction radius was strongest for the presence of mid-diameter deviations, with a maximum correlation of 99.79%. Therefore, in combination with the stress distribution characteristics of the connection structure under geometrical deviation in
Section 3.3, we can conclude that in the presence of geometrical deviation, the contact state on the threaded tooth surface changes, increasing or decreasing the equivalent friction radius, resulting in a change in the stress distribution area on the connection structure and a change in the ratio of unit input torque to preload force, which ultimately leads to a dispersion of the preload force.
In actual products, threaded connections are not used alone. Usually, there are multiple threaded connections. In this case, uneven preload and stress distribution often seriously affect the system accuracy of precision products, and it is essential to ensure consistent preload and uniform stress distribution across multiple threaded joints. The use of screws with a similar amount of deviation in a symmetrically distributed structure is more likely to reduce the dispersion of the preload force than to improve the accuracy of the threads, so that the stress distribution in the connection tends to be uniform and the stability of the product is improved.
6. Conclusions
This paper carries out a study on the effect of geometric deviations in precision threaded joints on preload dispersion and stress distribution, and analyses the effect of pitch deviation, mid-diameter deviation, and tooth angle deviation on the mechanism of precision thread engagement. The main conclusions are as follows:
- i.
Geometrical deviations affect the contact state on the threaded tooth surface, increasing or decreasing the equivalent friction radius, affecting the stress distribution area on the connection structure, changing the ratio of unit input torque to preload and leading to a dispersion of preload.
- ii.
The geometrical deviation of the precision thread affects the friction radius during the engagement process, resulting in a discrete distribution of the final preload. The magnitude of the preload force is inversely proportional to the direction of variation of the thread pitch deviation and thread median deviation, and positively proportional to the direction of variation of the thread angle deviation. Among them, the variation of friction radius is larger under the influence of tooth profile angle deviation.
- iii.
Precise thread geometry deviations alter the meshing mechanism, resulting in uneven stress distribution on the connector. When the pitch diameter and pitch of the thread decrease, the contact stress on the thread pair concentrates in the direction of the head of the screw, and the stress on the end face of the connector concentrates inward; when the thread profile angle decreases, the stress moves to the tail of the screw, and the stress on the end face of the connector diffuses outward.
In complex precision electromechanical products, the connection is often symmetrical and multi-layered. Due to the inevitable machining errors in threads, it is undesirable to pursue manufacturing accuracy of threads in order to reduce the impact of the threaded connection structure on product accuracy. In the actual production task, the geometric deviation of the precision threads is measured and grouped in advance, and a precision thread connection with similar deviation is selected on a symmetrical structure, which is conducive to improving the consistency of the preload and the uniformity of stress distribution.


