1. Introduction
Considering the necessity to respect always more stringent legislation in terms of the criteria for pollutants and particulate emissions (e.g., Euro VII in Europe), vehicle development has become, in recent years, an increasingly complex process [
1,
2,
3]. The interest of the automotive industries in sustainable mobility requires accurate and precise design choices starting from the earlier stages of product development, with an increasing support from numerical models in the experimental phase [
4,
5].
Therefore, the use of accurate and predictive models of engine behavior and its main components to improve vehicle operating conditions and reduce time-to-market for the technologies compliant with in-force and upcoming emission regulations is fundamental for the industry.
In this context, the virtualization of engine components and, more generally, of the entire vehicle is strongly encouraged and supported. The development of model-in-the-loop (MiL) and hardware-in-the-loop techniques has complemented traditional experimental campaigns. These investigations have resulted in consequent cost reductions and in the enhancement of reproducing complex strategies in multiple engine operating conditions [
6,
7,
8].
At the same time, machine learning (ML) has also shown promising results for a wide range of ICE applications including engine modeling, control and optimization [
4].
The advanced simulation tools available, in fact, permit us to investigate and achieve high engine efficiency with reduced fuel consumption and emissions. Modeling approaches are generally categorized as 0D, 1D and 3D, with increasing complexity degrees and computational time [
9].
Considering the high level of accuracy and their extreme versatility, 1D thermofluid dynamic simulations allow for a reliable reproduction of the system, both in a steady state and during the driving cycle, in a reasonable and short time.
The literature is extensive in describing the modeling of different engines and aftertreatment systems [
10,
11,
12]. However, most of these available models are validated individually and they are not designed to be connected to each other.
In addition, especially in the mentioned dynamic conditions, due to experimental uncertainties related to the data acquisition process (e.g., during strong acceleration phases), limitations in the proper data initialization are present, which may interfere with the proper calibration of the model itself. These phenomena are particularly evident in the chemical species acquisition of the exhaust gases and in the characterization of combustion turbulence.
This work integrates in a unified co-simulation environment a 1D heavy-duty CNG SI 6-cyl engine model and its related Three-Way Catalyst model, developed with the use of GT-Suite from Gamma Technologies, realizing a single numerical configuration toward a fully virtual vehicle design.
The challenge for this research is to link an engine model, developed with unsteady flows by using an explicit Euler solver, with an aftertreatment model, provided with a specific kinetic scheme and conceived as a quasi-steady model.
Hence, the chemical and fluid dynamic behaviors of the ATS model are decoupled. The input conditions for the quasi-steady TWC model simulation, represented by the thermofluid dynamic conditions and the engine-out pollutant concentration, are provided by the 1D unsteady engine model through appropriate links developed in Simulink.
One of the main objectives of this analysis is the development of a control architecture, built in MATLAB/Simulink, that not only connects the described Engine + ATS system but which retains its effectiveness for any application, including in different vehicle categories or those developed with other tools. In particular, one of the targets of this research study is the reproduction of engine-out and tailpipe emissions, both in steady-state and dynamic conditions.
The management of the simulation of each component in a unified platform is a multidisciplinary activity that finds its way into numerous applications. As an example, with the use of such a platform, Fang et al., constructed a detailed aeroengine control model based on a functional mock-up interface [
13], whereas Cech et al. designed a model-based control of a steam turbine [
14].
Sweafford et al., assessed the advantages and disadvantages of co-simulation between an engine model implemented in GT-Suite and a control model implemented in Simulink for a series and parallel co-simulation [
15].
An interesting contribution was given by Datar et al. to link a generic vehicle body model, developed in ADAMS, with a tire model developed in FTire and a simplified powertrain model in PSAT [
16]. In such research, the investigation is carried out with a generic model of a conventional engine for the kinematics analysis and the interaction between the different subcomponents in a multiphysics domain. The combustion process, as well as the formation of pollutants and their conversion into an aftertreatment device, is not treated.
A similar approach to the analysis described in this paper about co-simulation on the MATLAB/Simulink platform between an engine model, a vehicle plant and an ECU model, developed in GT-Suite, was provided by Barasa et al. [
17].
The functional mock-up interface for co-simulation has shown high potential in the past [
18]. A detailed method for the modeling of a distributed engine control system with thermodynamic models and their surrounding network was proposed by Pedersen et al. [
19].
At the same time, enhancements in engine control through a coupling procedure of unsteady 1D and quasi-steady 3D simulations was described in [
20].
An integrated methodology for the coupling between a 1D GT-Suite model and 3D converge CFD model was proposed by Millo et al., showing good potential in the reproduction of NOx and soot emissions [
21].
A 1D–3D approach for characterization of the exhaust flow properties of a diesel engine was described by Kong [
22], proving high accuracy and a considerable reduction in computational time.
Extensive works built in the OpenModelica environment are presented by Tucki et al. [
23,
24], who proposes the simulation of numerous driving cycles for the reproduction of fuel consumption and CO
2 emissions.
This co-simulation framework is validated with a reference to a real HD CNG 6-cyl engine configuration set-up in a test cell using a large database of experimental data in steady-state and dynamic conditions. In the first instance, given the acquisition of the in-cylinder pressures, the validation of the system took place in the entire engine workplan in steady-state conditions through the comparison and validation of the main thermofluid dynamic variables. Subsequently, the response of the global model was validated through multiple tests under different operating conditions carried out with a wide variation of the air-to-fuel ratio. These tests made it possible to evaluate not only the engine and combustion model response in operating areas far from the stoichiometric condition but, in particular, provide an important contribution to understanding the main conversion phenomena present in a TWC for NG engines.
Finally, the global model developed was validated during a world harmonized transient cycle (WHTC) with numerous cut-off phases and abrupt accelerations, showing good and encouraging results in view of the subsequent use of this architecture for multiple applications.
With a favorable ratio of accuracy to computation time, the architecture allows complex phenomena to be handled flexibly, and sets the stage for the next fully virtual vehicle design.
2. Experimental Layout
The experimental activities were carried out on an NG heavy-duty SI PFI engine, compliant with the EURO VI regulation. The characteristics of the engine, typically employed for on-road applications of trucks and buses, are shown in
Table 1.
The adopted natural gas mixture comes from the local distribution network and has a minimum methane contribution of 85%. The PFI injectors installed on the engine are fed from the line at a pressure of about 10 barG. Fuel consumption is measured with an Emerson Coriolis flow meter, whereas an ultrasonic flow meter from AVL monitors the intake air flow rate. A fast-response variable-frequency dynamometer is coupled to the engine, allowing us to reproduce the fixed steady-state point as well as the dynamic conditions. The indicated pressure signals are acquired using an AVL Indicom indicating system that was specifically designed for the purposes of this study using in-cylinder Kistler Type 6052C piezoelectric pressure sensors.
The Pd/Rh-based TWC used for these tests, designed for natural gas applications and consisting of a honeycomb geometry with a common cell density and substrate thickness equal to 400/4 cpsi/mil, is equipped with two sampling lines upstream and downstream of it to monitor the exhaust gas concentration.
A scheme of the experimental layout and the main instrumentation adopted is shown in
Figure 1. Furthermore,
Table 2 reports the main technical specifications of the instruments used in the experimental campaign.
3. Engine and Three-Way Catalyst Model
The engine model was developed in GT-Suite. The heat exchange model, as well as the control of the fuel consumption, the turbocharger and the main characteristics, are validated against the engine set-up in the test cell. The main set of equations for the 1D numerical model used for the engine simulations, which require the use of an explicit solver, are reported in this section. This approach, based on the perfect gas assumption that assumes there is no transport of species or chemical reactions along the intake and exhaust ducts, is only briefly recalled here as it is widely consolidated in the literature [
9].
The solver provides the calculation of the mass flow, density and internal energy for each timestep through the conservation equations.
The “Quasi-Steady” mathematical model used for the characterization of the TWC has been appropriately described in [
25]. In the present work, the main assumptions adopted for the model’s validation are reported hereafter. Changes in potential and kinetic energy are neglected along the catalytic converter and so are the heat losses to the surroundings. Radial diffusion is not considered.
The main approximation of this category of solvers derives from the short residence time of the gas in the aftertreatment device compared to the time scale of the other phenomena, such as real driving cycles or the reactor warm-up. For this reason, the substantial approximation makes it possible to replace the substantial derivative that appears in all the channel gas phases with a space derivative.
The other governance equations describing the phenomena in the ATS are as follows:
The convective heat transfer coefficient is computed based on the Nusselt number:
The Nusselt number
is expressed using the relation proposed by Hawthorn for laminar flow (
).
The correlation used for the Nusselt number to describe turbulent flow (
is proposed by Gnielinski:
For the transition phase, the Nusselt number is estimated with linear interpolation between the laminar and turbulent flow [
26,
27].
4. Co-Simulation Approach
Modern vehicles are becoming increasingly complex with several highly interactive subsystems, such as the electronic control module, combustion and injection management, and turbocharging and aftertreatment systems. In addition, considering the hybridization process, reliable and robust numerical models are increasingly in demand.
Although one-dimensional fluid dynamic simulation can provide high-fidelity information for analyzing the engine performance, the control system design and models involving the kinetic scheme of a catalytic converter require simplified models. Integrated simulation for engine dynamic analysis and control system design is mainly attributable to advancements in computer technology. These simulations can facilitate the performance analysis and control strategy development and permit us to align the results against a real engine [
28].
In this research activity, the parallel co-simulation between the engine and TWC model is performed in MATLAB/Simulink, which allows for the simultaneous control of components of different physical domains (e.g., thermodynamic, chemical, electrical, etc.) in a single platform.
The choice of this co-simulation environment has multiple advantages. Firstly, it allows the use of specific tools that are particularly reliable for each component, ensuring high reliability and reproducibility of the experimental data. Furthermore, it permits the combination of models developed with different software, preserving the main characteristics of each specific solver. However, among the limitations of such a framework, although of minor importance with respect to the primary objective of this research, there is a long preprocess phase for the data initialization of the global model and the requirement of multiple licenses for each of the submodels used.
Nevertheless, with the aim of optimizing the behavior of the entire vehicle system and reducing development costs, the modeling of the Engine + ATS and further subcomponents, in view of a virtual engine test bench design, plays a central and prominent role [
29].
There are basically two methods in which GT-SUITE/Simulink coupling can be accomplished:
Compiling the Simulink model into a .dll (dynamic-link library) file and importing it into a GT-SUITE model. In this configuration, GT-SUITE governs the simulation.
Converting the GT-SUITE model into an s-function (a function in the Laplace-transformed “s-domain”) and bringing it into the Simulink environment in order to govern the simulation directly from Simulink.
Advantages and drawbacks of the GT-SUITE/Simulink co-simulation change depending on the method adopted. In the first approach, the “GT-SUITE Model (Master)” Simulink block is used to generate a C-code through the Simulink Coder and compile a .dll file of the Simulink model involved in the co-simulation. The resulting file is then brought inside the GT-SUITE model. This method gives the possibility to load multiple Simulink models inside a single GT-SUITE one and allows for the flexibility of simulating multiple GT cases while still utilizing important GT tools such as a direct optimizer. The main drawback, which is also the reason why this approach has not been used in this research activity, is that only one GT-SUITE model can be included in the co-simulation layout.
With the second method, in which the simulation is governed by Simulink, a reverse linking approach may be realized with respect to the previous methodology. The GT-SUITE model is, in fact, converted into an s-function and used as an elementary block of the model.
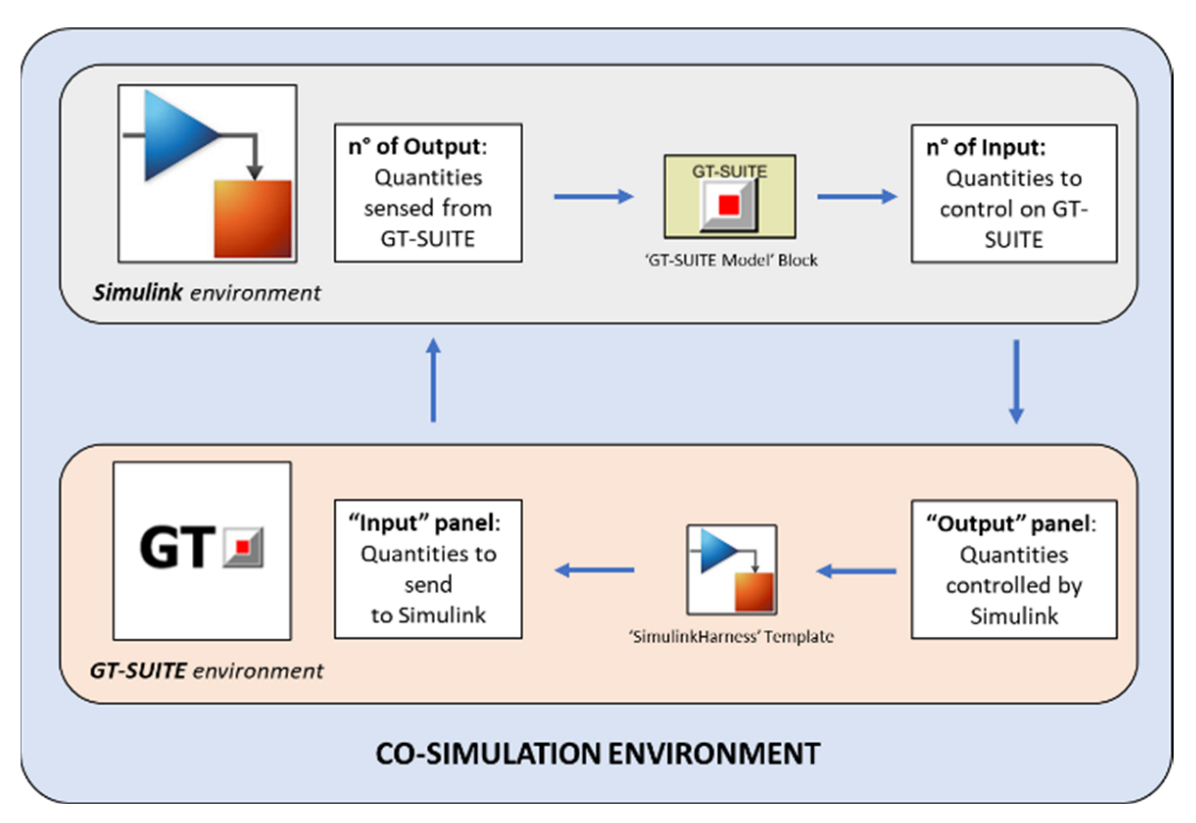
However, both approaches are governed by an internal software template called “SimulinkHarness”. In this template, the user can also select the master software that will govern the co-simulation (“run_from_simulink” or “import_simulink_model”). In addition, it is necessary to indicate the variables that the two software programs must exchange in order to start the simulation. In this research activity, the input quantities required to run the model were entered through the definition of appropriate routines developed in MATLAB.
As shown in the
Figure 2, once the “SimulinkHarness” model has been included in the GT model and all necessary connections have been implemented, the s-functions corresponding to the GT model must be included in the Simulink model. In the used s-function blocks (“GT-SUITE Model” or “GT-SUITE Model (Master)”), the number of inputs and outputs involved in co-simulation must be specified.
Figure 3 shows a diagram of the logical process behind the run of each simulation. Using dedicated scripts developed in MATLAB, the experimental data required to initialize the model are extracted, and subsequently, given as input to Simulink. The chosen operating condition is obviously extracted from the experimental database. Although engine speed value is easily imposed as an actual operating condition, the desired engine brake torque needs a dedicated control strategy to reach the target value.
For this purpose, two different torque control procedures were compared. In the first approach, a closed-loop PID control, designed by means of the “Ziegler–Nichols” method and shown in
Figure 4, ensures that the required torque is obtained and the selected engine point is correctly reproduced.
In the second approach, represented in
Figure 5, the controller for targeting the desired torque is directly implemented in the engine model. As in the first approach, it also receives input values from the MATLAB script.
A comparison of the two alternatives did not reveal any substantial differences in terms of results achieved. The “Controller Throttle” used in GT-Suite showed a slightly lower computational burden than the PID control developed in Simulink. However, the advantage is limited to a few seconds for a single case, whereas it can become greater where more conditions need to be simulated. For this reason, the second approach described was used in this research activity. However, for further investigations in which a new engine model should be used, it may be more useful to use the first approach as it is more flexible and can possibly be also interfaced with other software.
5. Steady-State Conditions
To constitute a wide range of tests identifying engine behavior, 25 operating conditions were selected from the entire workplan. These are represented in
Figure 6 and consist of five different engine speeds for five load levels, from very low to maximum torque. The in-cylinder pressure from the intermediate cylinder 3 was measured under each of the abovementioned conditions. The cylinder was selected as it is considered to be more representative of engine variability than a peripheral one.
In order to achieve reliable modeling of the combustion process, the aim is to reproduce not only the pressure cycle of each tested condition, but also the main engine performance parameters. Therefore, a reverse engineering methodology called “Three-Pressure Analysis” (TPA) was used to obtain the burn rate, defined in GT-Suite as the instantaneous rate of fuel consumption within the cylinder combustion process [
30]. This methodology, well established in the field of 1D modeling of engines, requires three pressure:
intake port pressure,
exhaust port pressure and
in-cylinder pressure.
The use of this procedure was necessary due to the lack of a valid predictive model for CNG engines in the GT-Suite Platform. It has been proved that the predictive spark-ignition turbulent flame model “SITurb”, implemented in GT-Suite, is not suitable for describing the combustion evolution of a HD engine fueled with natural gas at its current set-up. The reason is related to the inability of the code to consider the influence of the in-cylinder flow on the turbulent flame speed with a single set of parameters for all points in the engine map. In fact, for this specific engine type, turbulence in the combustion process is generated primarily by swirl and squish flow motions, unlike in conventional tumble-assisted SI engines [
31].
Since the HD CNG SI combustion system is derived from a diesel configuration, some features of the flow-field are retained as a certain swirl level that has no or very low tumble [
32]. At the same time, an increase in the tumble and turbulence intensity was found in CNG engines [
33]. Future efforts should be made to develop a fully predictive combustion model specific for such engines.
Figure 7 shows the optimal numerical/experimental agreement for three operating conditions with different loads. At the same time, the heat exchange model was appropriately calibrated to obtain the correct values for fuel consumption and temperatures at the cylinder outlet and in the exhaust duct.
An empirical relationship that links convective heat exchange to engine speed was employed to achieve good reproducibility of the heat exchanges. For the sake of synthesis, the percentage deviation of the temperature at the TWC inlet is shown in
Figure 8A. The values obtained are very close to the experimental data, demonstrating the good calibration of the parameters involving heat exchange. Attention was paid to such parameters as they are transferred from the Simulink platform to the ATS model. As an indication of the high accuracy in reproducing the experimental data in the whole engine workplan, the deviation percentages of the air mass flow rate and fuel mass flow rate are shown in
Figure 8B.
In accordance with
Figure 9, the parameters to be transferred to the ATS model are recorded in a block called “out.engine_out”. In this template, the pressure and temperature at the turbine outlet, the exhaust gas flow rate and the concentrations of the main pollutants are stored. The final output of the global model is included in the block “out.ATS_out” and represents the tailpipe condition.
The aforementioned combustion model includes the formation of nitrogen oxides NOx and carbon oxides CO/CO
2; these submodels were suitably calibrated for the purposes of this activity, and they will be described in more detail in the following section. In GT-Suite, however, no valid submodel was found for the correct reproduction of unburnt hydrocarbons and, specifically, methane. In this regard, to obtain a suitable set-up of conditions that did not significantly alter the air-to-fuel ratio of the exhaust gas, the experimental CH
4 concentration was entered in the “out.engine.out” block. At the same time, as described in [
25], the same empirical correlation was used to calculate the H
2 concentration at the ATS inlet.
Once the connection between the engine model and the ATS model was accomplished, it was necessary to proceed with the backpressure calibration to avoid changing the engine performance and fuel consumption. In fact, it is well known that the ATS presence, generally equipped with numerous channels to increase the impact between the exhaust gas flow and the catalytic surface, leads to a pressure drop between the turbine outlet and the external environment. In order to obtain an adequate reproducibility of the backpressure in each of the 25 operating conditions in the entire engine workplan, the measured pressure drops across the catalyst were correlated with the exhaust gas flow rate.
In the TWC model, a virtual connection element (“orifice”) already present in the software was used to replicate a specified pressure deviation or an eventual pipe restriction. With the aim of ensuring high reliability of the experimental data, especially during dynamic conditions, a relation to the calculation of the forward discharge coefficient (Cd,f) of this element was appropriately identified.
Figure 10 shows global good agreement between the measured pressure drop and the simulated data.
6. Steady-State λ Variations
In order to assess the response of the global model and, in particular, of the Three-Way Catalyst with a given exhaust gas composition from the engine model, an experimental campaign was carried out with a wide λ variations, from rich to lean (0.90 to 1.10) conditions at steady-state conditions. These tests were performed at different engine speeds (1100, 1600 and 1900 rpm) and torque values (20%, 40%, 60%, 80% and 100%). For the sake of brevity, only the 1900 × 100% operating condition is shown in
Figure 11 and
Figure 12.
The TPA-derived combustion model allows for the calculation of the main engine-out emissions, such as CO2, CO and NOx.
Nitrogen oxide emissions were modeled by relying on the extended Zeldovich mechanism, which consists of three reversible chemical reactions, reported below:
This model assumes the dissociation of N
2 and O
2 in atoms due to the high temperatures (over 2000 K) of the gases obtained in the reaction area of the flame front. Each reaction holds a reaction rate that is implemented in the mathematical model as follows:
| N2 oxidation rate: | |
| N oxidation rate: | |
| OH reduction rate: | |
The CO formation model is described by the equilibrium of its oxidation reaction and is essentially related to the efficiency achieved during the combustion process. CO can oxidize in CO
2, according to the reaction:
The rate constant for this reaction is:
These pollutant formation submodels were calibrated in accordance with the aforementioned experimental campaign of 25 tests within the entire engine workplan. Since the measurement of the in-cylinder pressure is available only under stoichiometric conditions, the same combustion profile derived from TPA at λ = 1.00 was also extended to rich and lean mixture conditions. Although this is a relatively strong assumption, given the absence of experimental data on in-cylinder pressures, the engine-out results shown in
Figure 11 produced promising responses. In fact, the model replicates with a good degree of accuracy the emission trend from rich to lean. A minor gap is found in the residual oxygen concentration, particularly in the rich condition up to the stoichiometric lambda value. This phenomenon, however, depends on a different concentration of residual oxygen at the engine-out obtained within the steady-state experimental campaign with respect to the lambda sweep tests.
Figure 12 shows the comparison between the measured and calculated species conversion of CO
2, CO, NO, O
2 and CH
4, and the corresponding simulated engine-out concentration (already observed in
Figure 11, represented by the dashed blue line). The kinetic scheme was described and calibrated in [
25]. Despite the deviations in concentrations observed in
Figure 11, the TWC model shows good reliability in reproducing CO and NO conversion.
There is a slight increase in the CO2 concentration, especially under rich conditions and in the range of stoichiometric conditions, as the TWC model totally consumes the residual O2 by oxidizing the CO species.
The methane conversion model involves the use of the following reactions:
Since oxygen was totally depleted by CO due to a probable mismatch in the reaction rate of its oxidation, the CH
4 conversion model does not correctly replicate the experimental data. In particular, there is a total conversion of methane in the lean conditions, as already described in [
25]. In addition, due to a non-perfect alignment of the H
2O concentration, the rate of the water–gas shift reaction is too low to achieve adequate conversion under rich conditions.
The TWC model, essentially, reproduces the conversion trends of the main pollutants. However, an alignment of the rate of some reaction of the kinetic scheme would improve the current response of the model. Nevertheless, it was decided not to pursue this route as it would have increased the computational time without providing any further benefit to the real target of the work, which is the simultaneous co-simulation between the engine and ATS models. Moreover, this should be performed once the combustion model is fully calibrated. In fact, although it has provided promising results with the TPA methodology, it is not yet fully predictive and robust enough to properly work under conditions with extremely rich or lean mixtures.
7. Dynamic Conditions
A phase of the entire cycle (930–1130 s) was selected as representative of a driving condition with high dynamics, numerous accelerations, and cut-off phases. Such conditions are known to be a challenge for engine and ATS modeling. An appropriate control logic, calibrated based on the accelerator pedal signal, allowed us to validate the model both in regular operations and during the multiple cut-off phases. After a comparison with the engine torque, the accelerator pedal signal is converted into a column of values in binary code, which determines the engine working conditions in the normal execution (positive torque) and cut-off phases.
The previously mentioned pressure profiles within the engine workplan were used to simulate the engine combustion process. When the engine is at an intermediate condition, an automatic linear interpolation is performed to better simulate the combustion profile.
Figure 13 shows the comparison between the simulated exhaust gas mass flow rate and the measured trace. The logic implemented in the software allows both idle conditions and peaks due to strong acceleration that is replicated with good accuracy.
One of the main advantages of co-simulation for this type of engine is in the accurate reproduction of dynamic maneuvers. Indeed, based on the described WHTC, there are numerous accelerations and changes in the operating condition that results in different concentrations in terms of engine-out species. During an experimental campaign in test cells, these concentrations are detected by the analyzer, each with its distinct acquisition time. However, when strong and abrupt accelerations and maneuver changes are present (e.g., a rapid cut-off phase), there are some misalignments in the individual monitoring of the concentration of each gaseous component, especially in correspondence with emission peaks, which are additionally related to the instantaneous exhaust gas flow rate. From this perspective, the model results obtained are certainly a reliable indicator for the accurate reproduction of these kinds of simulations, since the instantaneous flow rate is evaluated according to the solver timestep.
Figure 14 and
Figure 15 show the main engine-out and tailpipe chemical species as already presented in the steady-state tests. The concentrations were normalized with respect to the maximum obtained in the whole cycle to preserve OEM sensitive data.
As described in previous tests, a slight deviation between the CO and CO2 engine-out arises. However, the trend is captured well by the engine model. The deviations match the results already seen in the steady state in terms of magnitude. CO emission peaks that follow cut-offs show some larger deviations. The main reason that can be ascribed to the high dynamics of the maneuver and the decay in combustion efficiency is the sudden acceleration. As the combustion profile is imposed, a further improvement is to be found in the calibration of a predictive model, which can act on this aspect. The model reproduces the NOx concentration in a consistent and reliable way. The slight differences found are attributable to λ fluctuations in the stoichiometric range. At the same time, the residual oxygen concentration is also well reproduced. Particularly noticeable is the high amount of O2 present in the cut-off phases.
The TWC model has a comprehensive mechanism to describe the oxygen storage phenomenon. It is particularly pronounced in the maneuvers that follow the cut-off phases. In fact, during the idle step, a high concentration of O2 crosses the TWC and is stored in the reactor in cerium oxides. This oxygen amount is then available to oxidize the other species from the exhaust gases. An evident signal for monitoring the OSC is the typical “delay” that occurs after the end of the cut-off phase and the beginning of the acceleration between the oxygen concentration upstream and downstream from the TWC.
With regard to carbon oxides, the model reproduces the main conversion phenomena with good accuracy, although there is a slight underestimation of the CO2 tailpipe concentration. The latter is due to the incomplete conversion of methane by the TWC model via steam reforming, as illustrated in the steady-state section above.
Residual NOx emissions are well replicated by the model, although some limited spikes are present. These are, essentially, due to instantaneous lean conditions in the mixture, which do not allow the model to fully convert nitrogen oxides. However, their contribution over the entire cycle is minimal, making the TWC kinetic scheme an excellent starting point for further improvements and developments.
8. Conclusions
The development, calibration and validation of a multiphysic co-simulation platform for a heavy-duty engine fueled with natural gas (and/or biomethane) and equipped with a Three-Way Catalyst has been described in the present manuscript. This activity was carried out with the specific aim of providing a validated simulation package that is useful for powertrain architecture design in an industrial environment using vehicle digital twins.
The co-simulation is an effective and necessary strategy, especially for the reproduction of highly dynamic tests.
The main steps and results of the work are listed below:
The obtained results made it possible to evaluate the in-cylinder pressure of each operating condition with a high degree of accuracy. At the same time, the performance parameters are closely reproduced; the upstream ATS temperature has a maximum error of 2.7% in very low load conditions and an average percentage deviation of 0.5–1.5% for the other operating conditions in the whole engine workplan. Air and fuel flow rates are reproduced with a deviation percentage of less than 1.5% and 2.8%, respectively.
Development of a control logic in MATLAB/Simulink to bridge a 1D engine model with unsteady flows and a quasi-steady TWC model with a proper reproduction of the wave action in the pipes, performance engine parameters and catalyst pressure drop.
Good numerical/experimental comparison in CO2, CO, NOx and O2 engine-out and tailpipe concentrations in the entire experimental campaign. Larger gaps are present in extremely rich conditions (λ ≈ 0.90) for CO and O2 and are due to inaccuracies related to the extension of the combustion model in such critical operating conditions. However, acceptable results of the main emission trends in the λ sweep were achieved. The use of a specific kinetic scheme for a CNG TWC also made it possible to accurately reproduce CO, CO2 and NO in the tailpipe. A more pronounced deviation occurs in the calculation of residual O2 in rich and stoichiometric conditions. At the same time, there is an imprecise reproduction of conversion phenomena involving CH4 under the same conditions due to inaccuracies in the aforementioned residual oxygen and a different rate of WGS reaction. These effects were reflected with a similar consideration during the selected timeframe of the WHTC, representative of a driving condition with high dynamics. However, given the critical and challenging conditions in which the global model works, this result can be considered a good starting point for further developments.
The next steps of the modeling activity will be:
Implementation of a specific predictive combustion model for CNG engines which is also valid in rich and lean conditions.
Based on the combustion model, an optimization of the methane conversion mechanism in the TWC kinetic scheme will be carried out.
The addition and connection of further submodels in view of a broader modeling of the entire vehicle.
Considering the growing interest of engine makers in sustainable powertrains fueled with alternative fuels, e.g., biomethane, hydrogen and e-methane, the availability of high-fidelity and fast models for these systems is becoming a must in the propulsion system design phase. The authors believe that the provided information will be helpful in the continuous development work of vehicle digitalization.


 ,
, 


