
A Digital Twin Architecture Model Applied with MLOps Techniques to Improve Short-Term Energy Consumption Prediction †


 , , ,
, , ,
Abstract
:1. Introduction
2. Research Methodology
2.1. Research Context
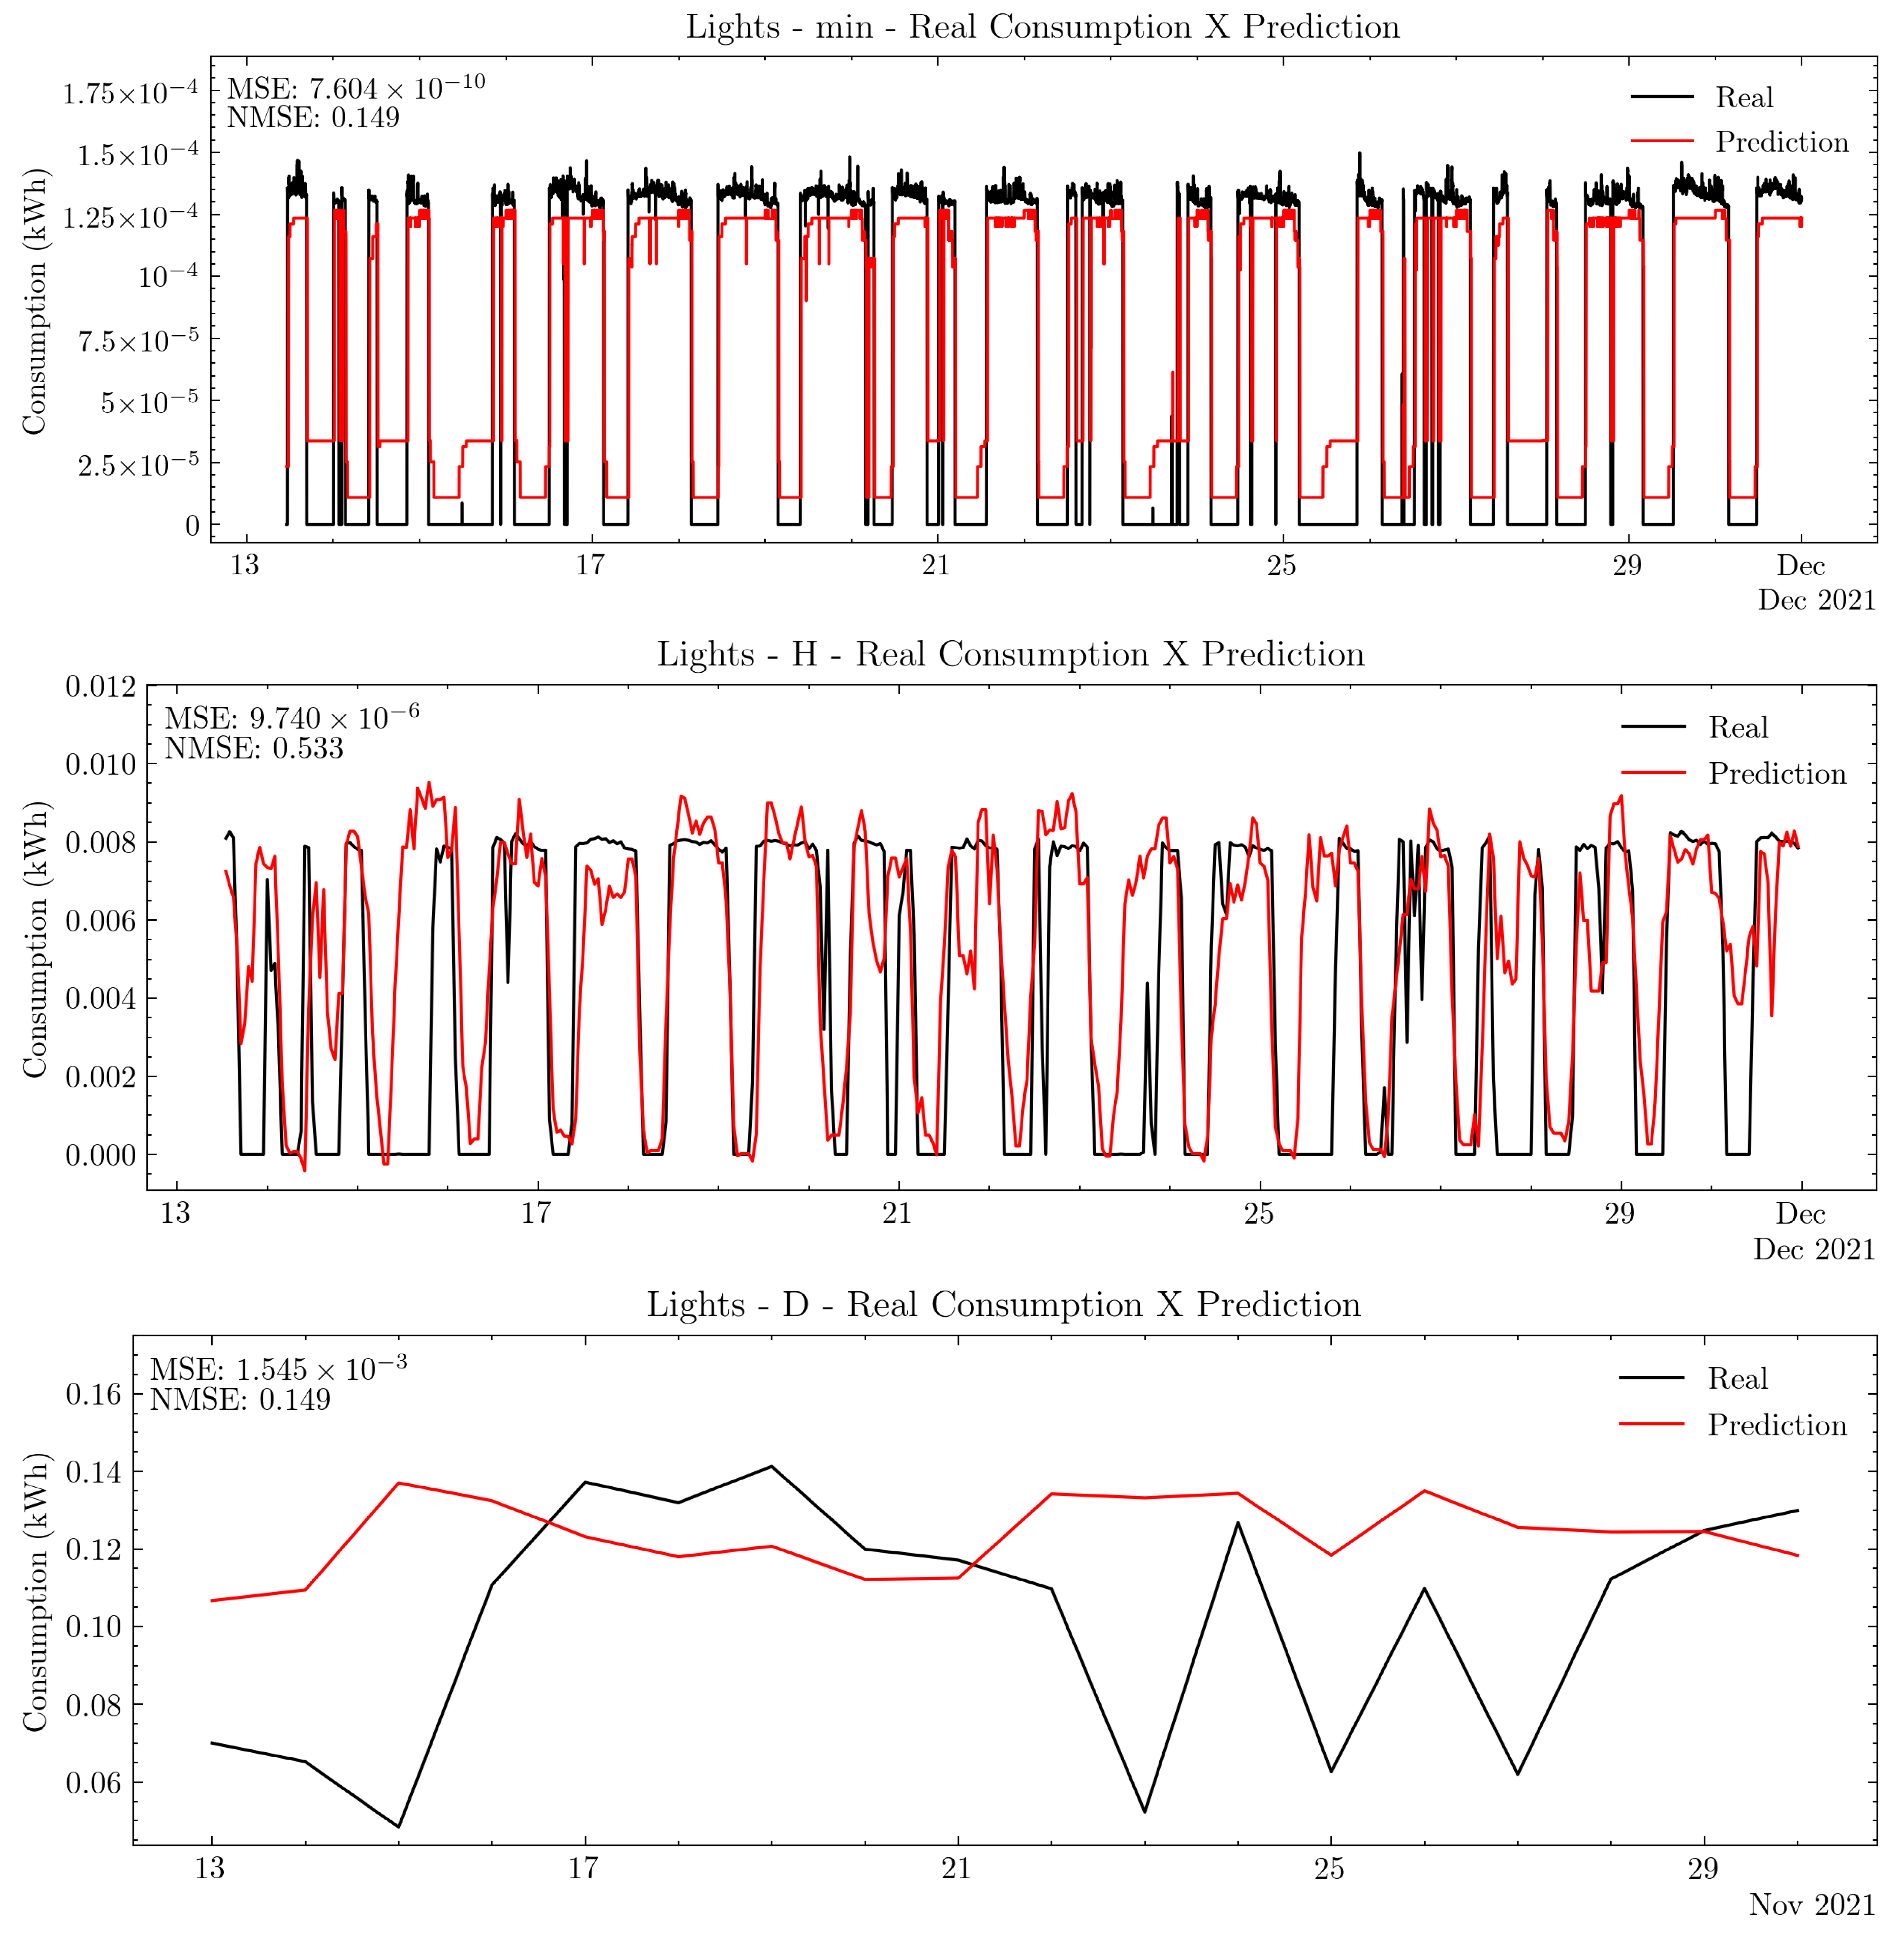
2.2. Short Term Energy Consumption Prediction
2.3. MLops
2.4. Digital Twin
3. Digital Twin Mlops Method
3.1. Digital Twin Architecture Requirements
- How may it improve human–computer interaction (HCI) by applying personalization techniques considering the customer as an energy consumer, home environment, home places, appliances, and specific and distributed IoT devices to measure power consumption?
- Considering that HCI may use natural language to implement natural language interactions, it is crucial to consider the memory aspect to create continuous and evolutive engagement levels. In this context, investigating how using a digital twin supports natural language interactions is a must.
- How does it integrate digital twin and machine learning models to map seasonal behavior of energy consumption and to execute prediction functions and to help with energy awareness personalized suggestions?
3.2. Smart Home Testbed
3.3. Mlops
3.3.1. Data Loading
3.3.2. Pre-Processing
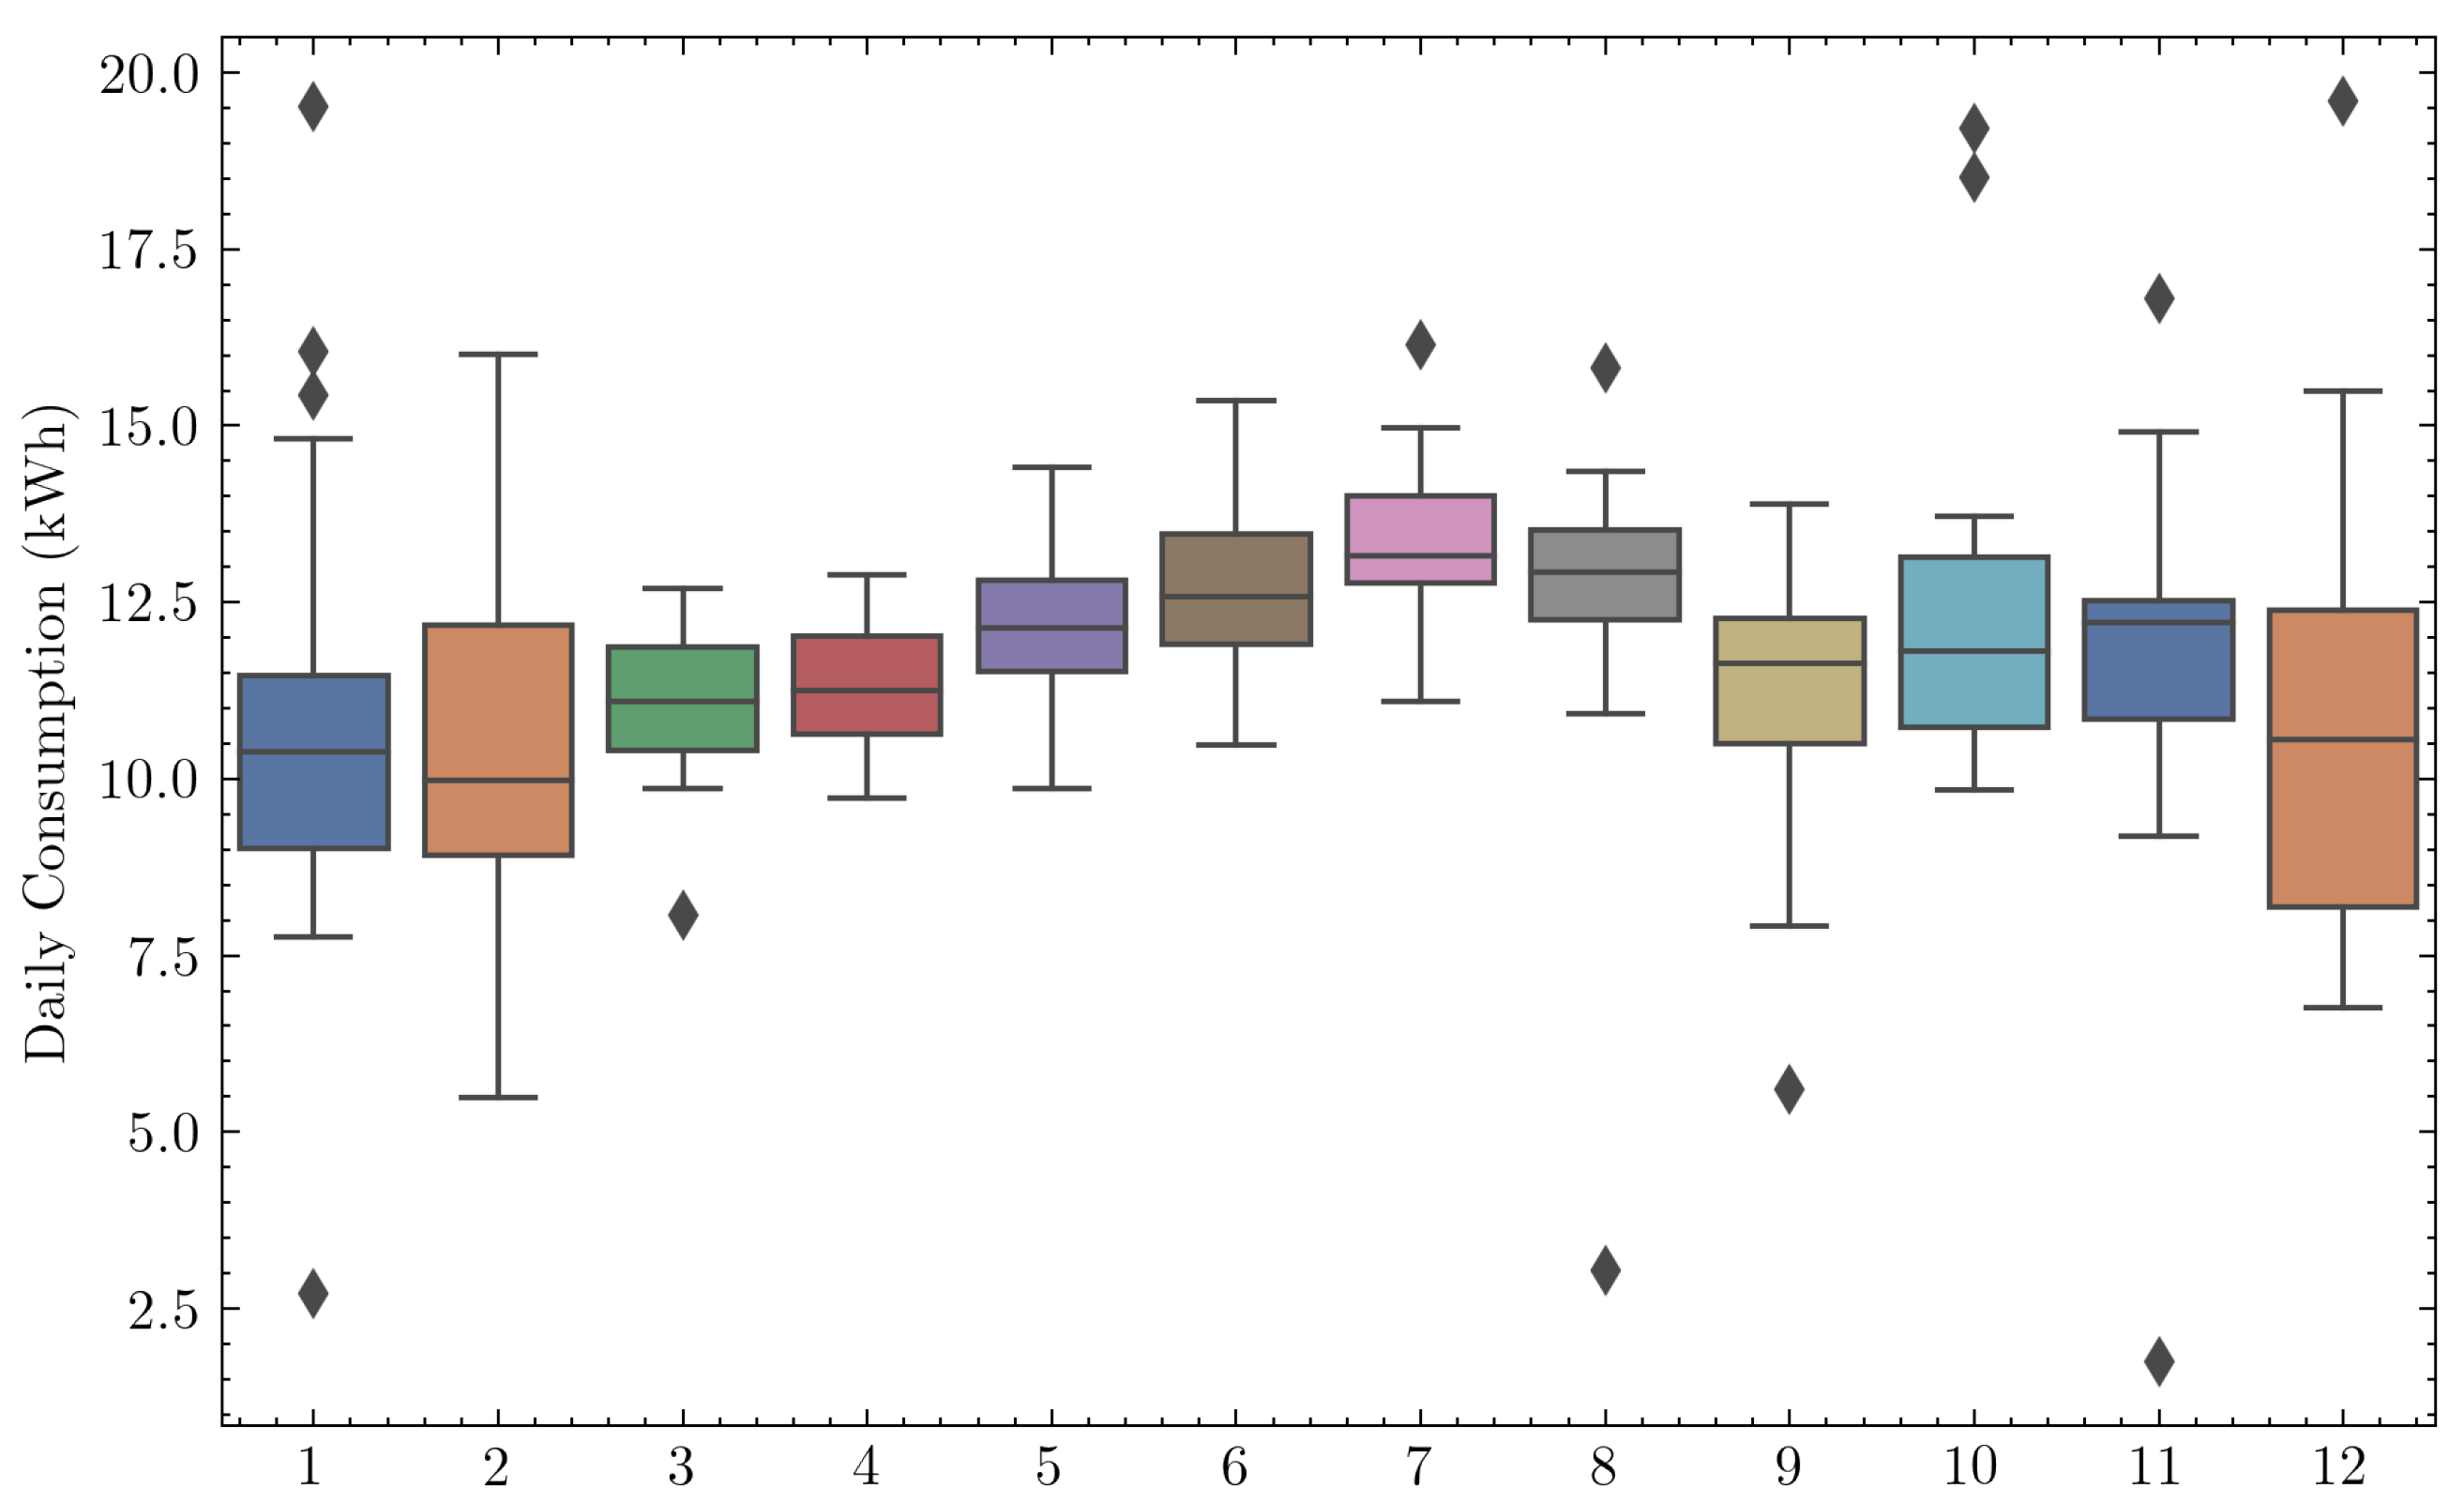
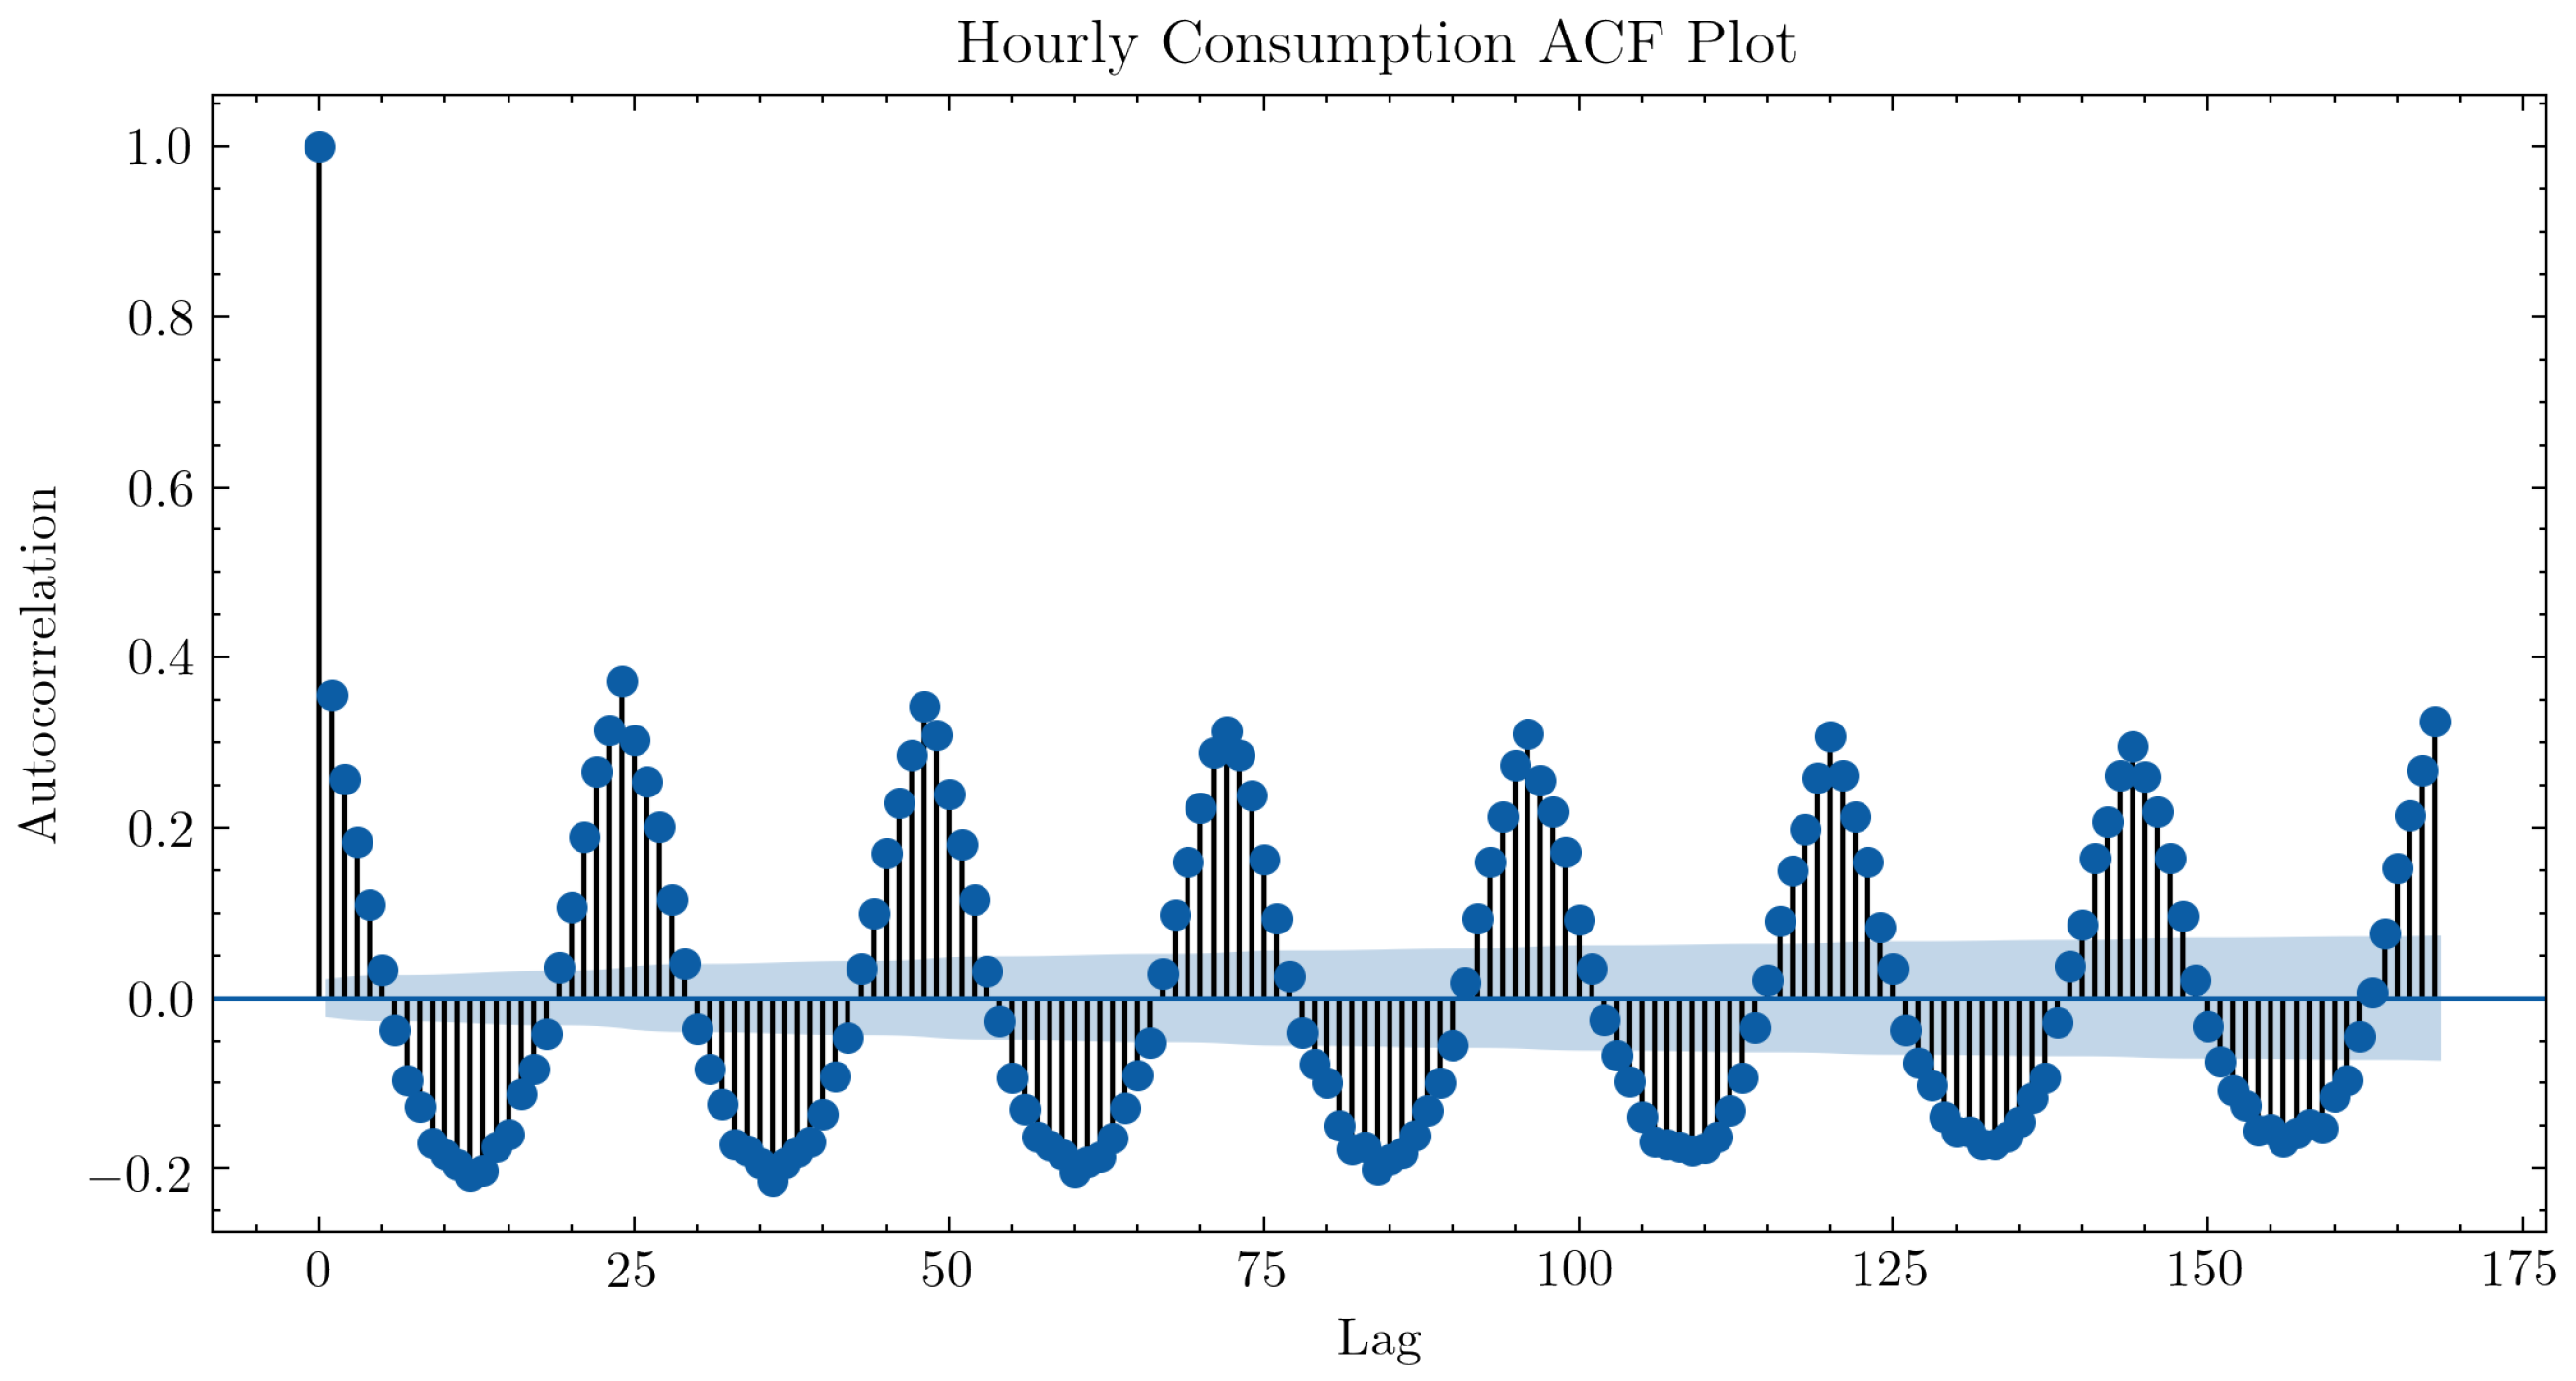
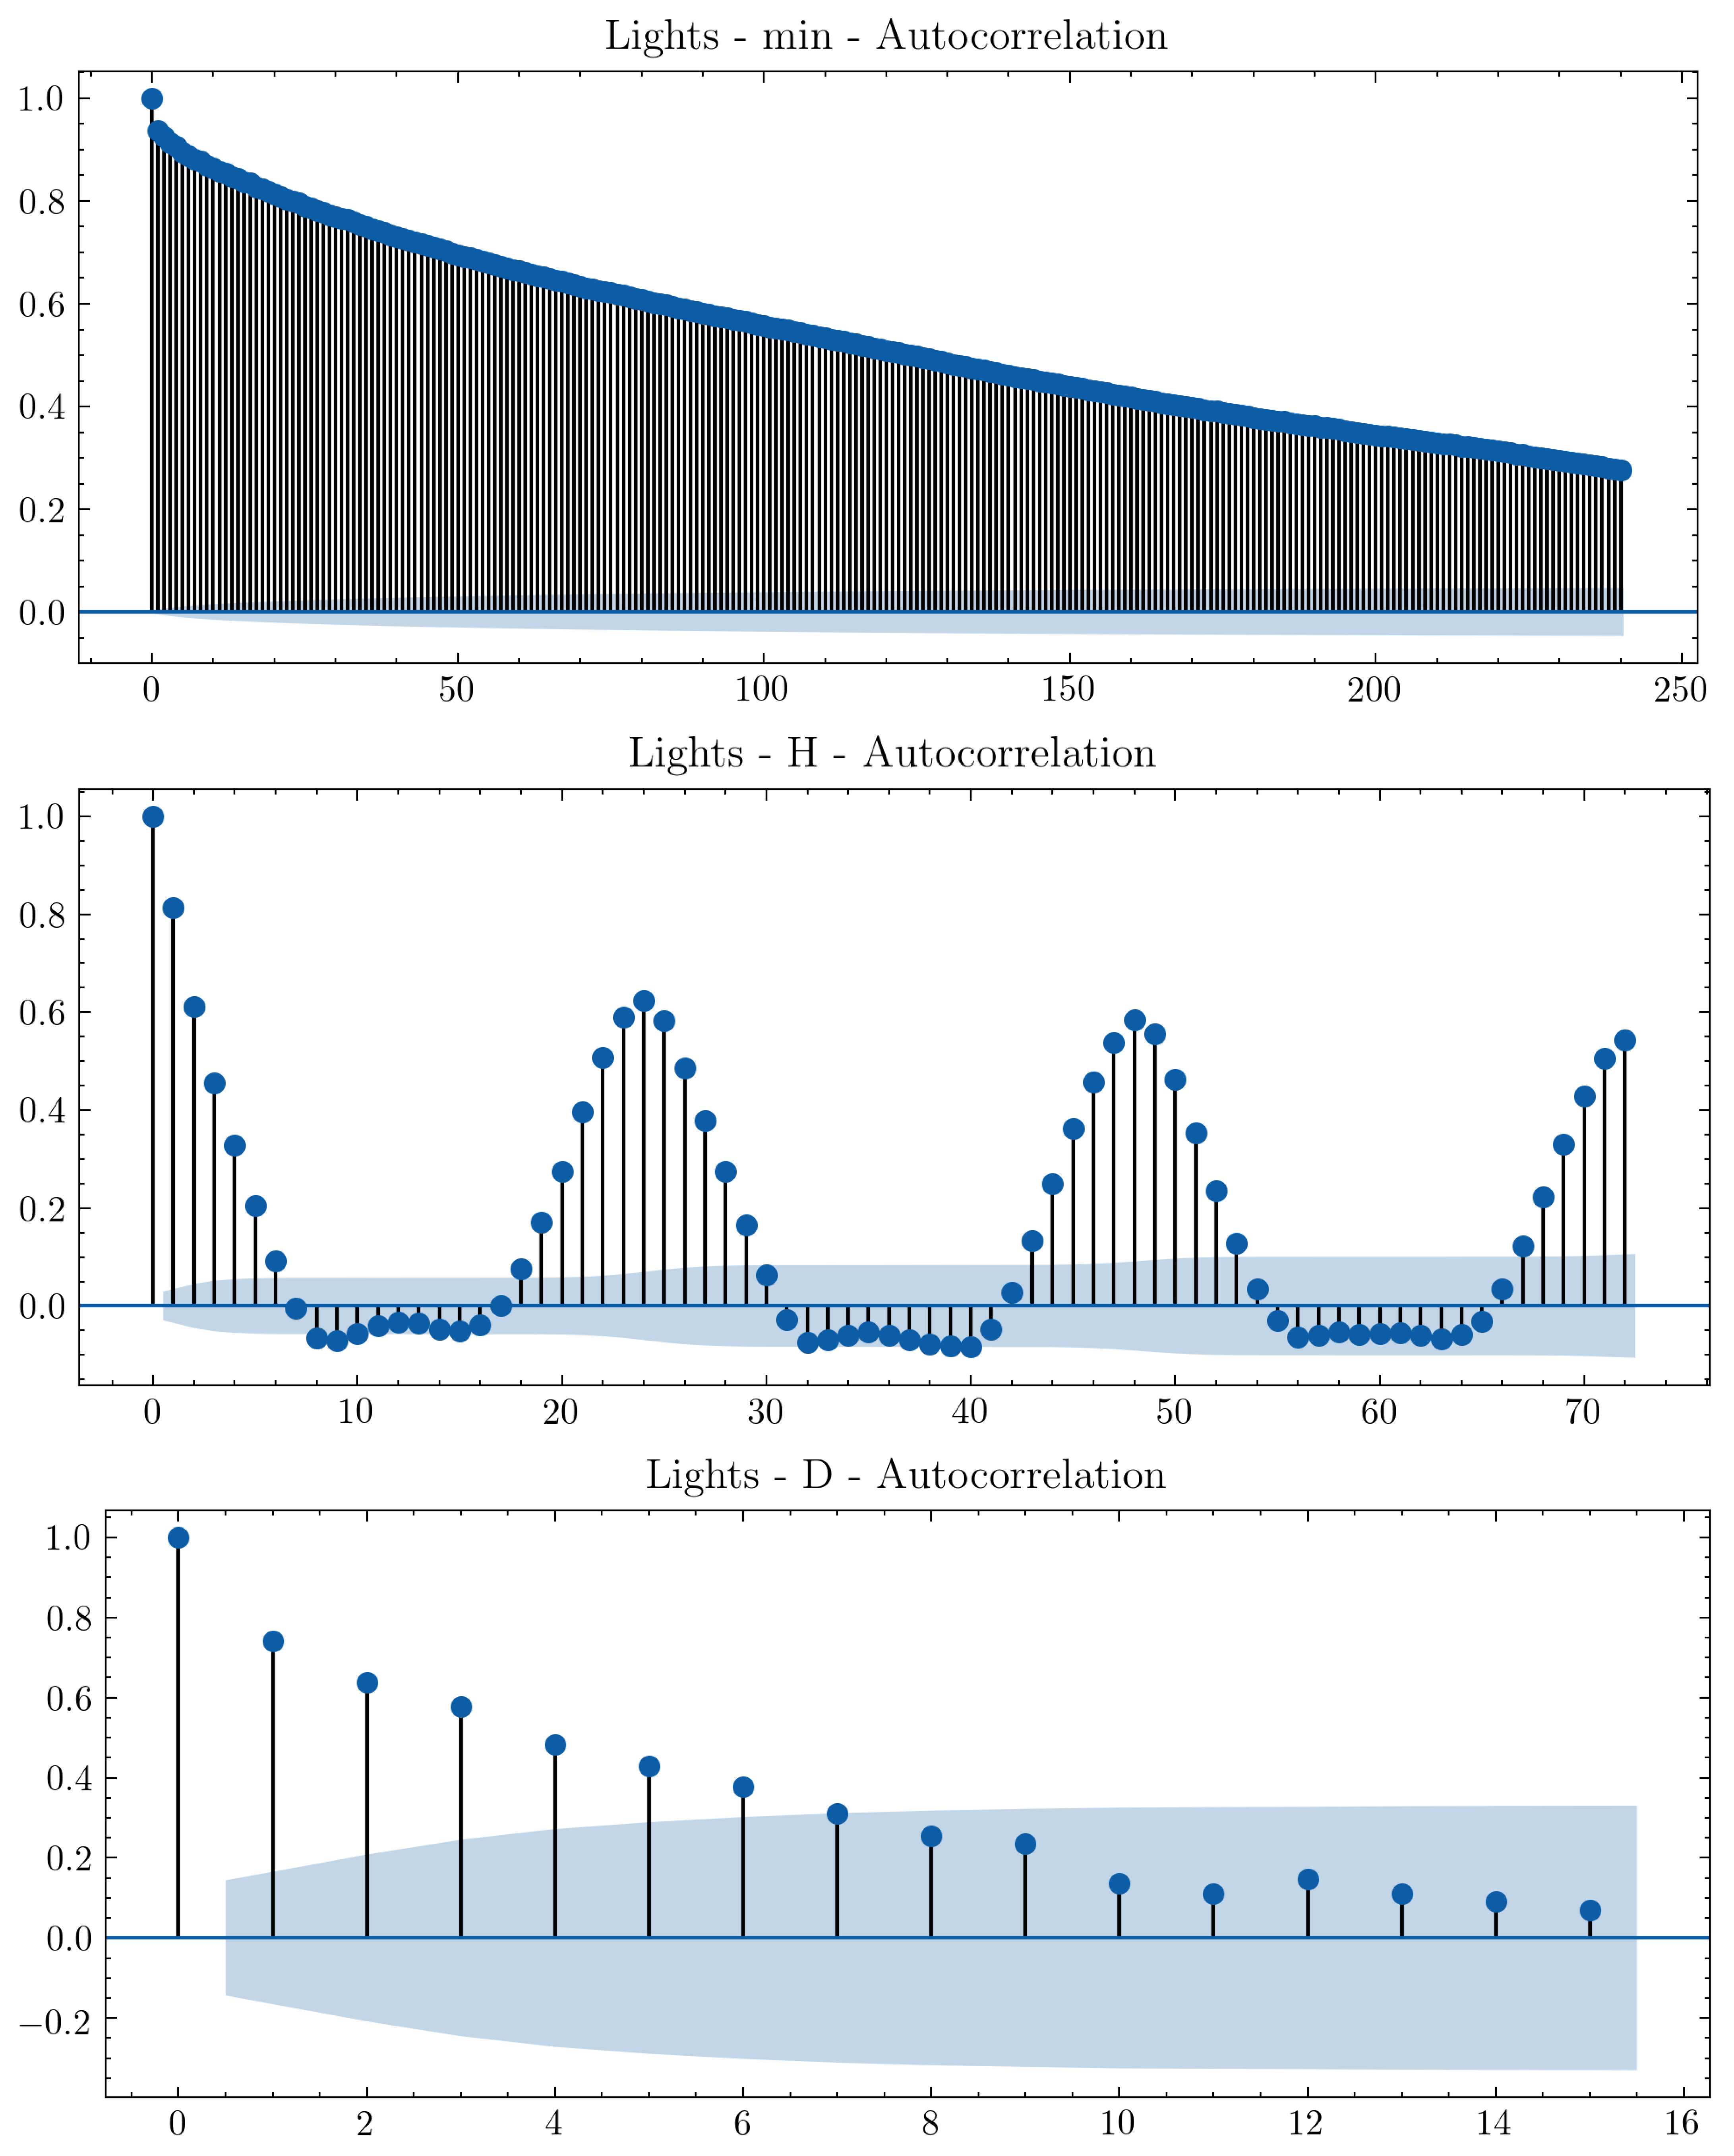
3.3.3. Exploratory Data Analysis
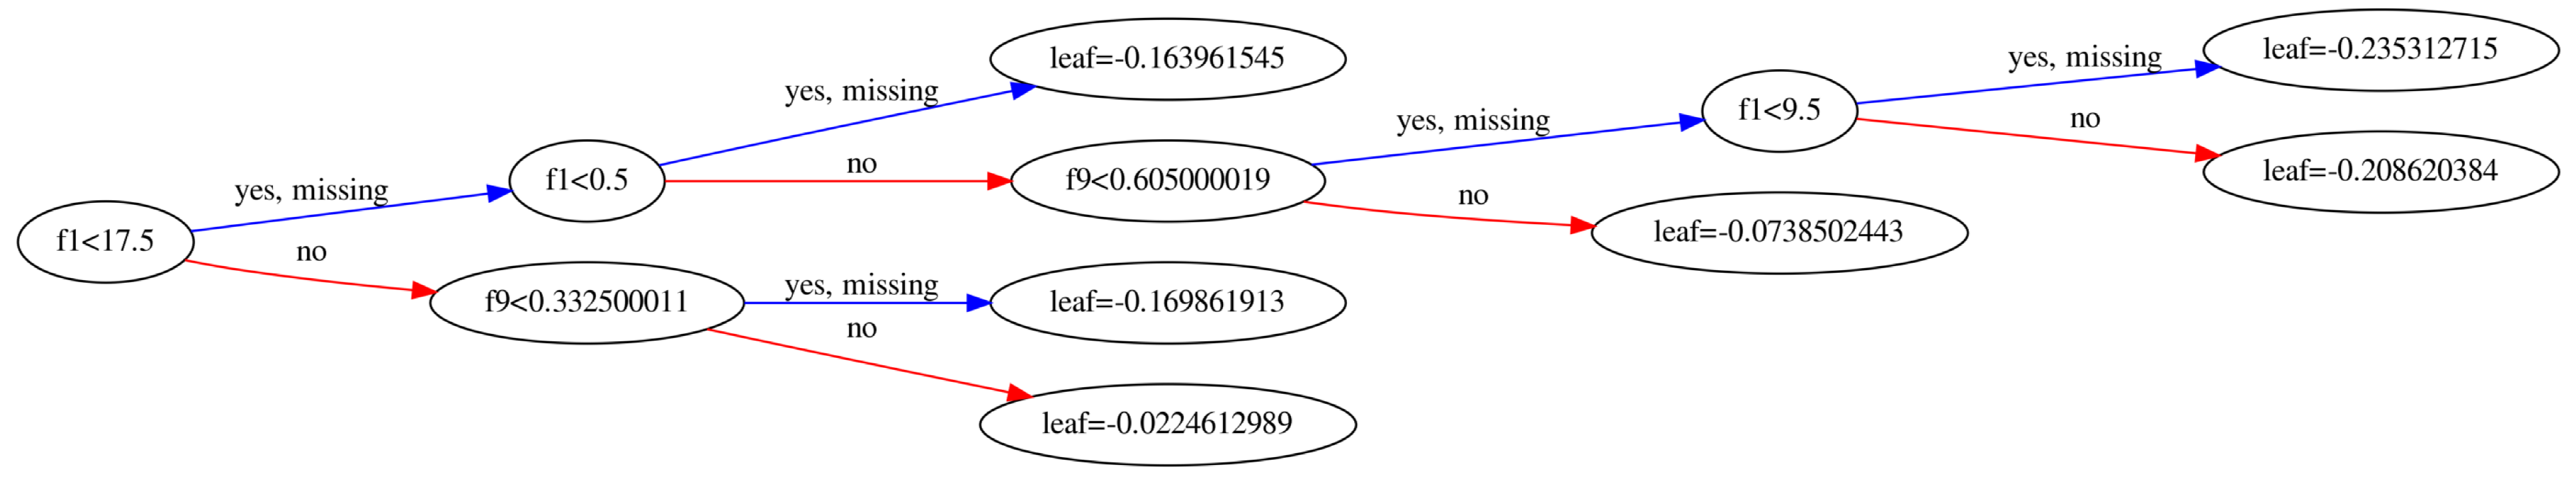
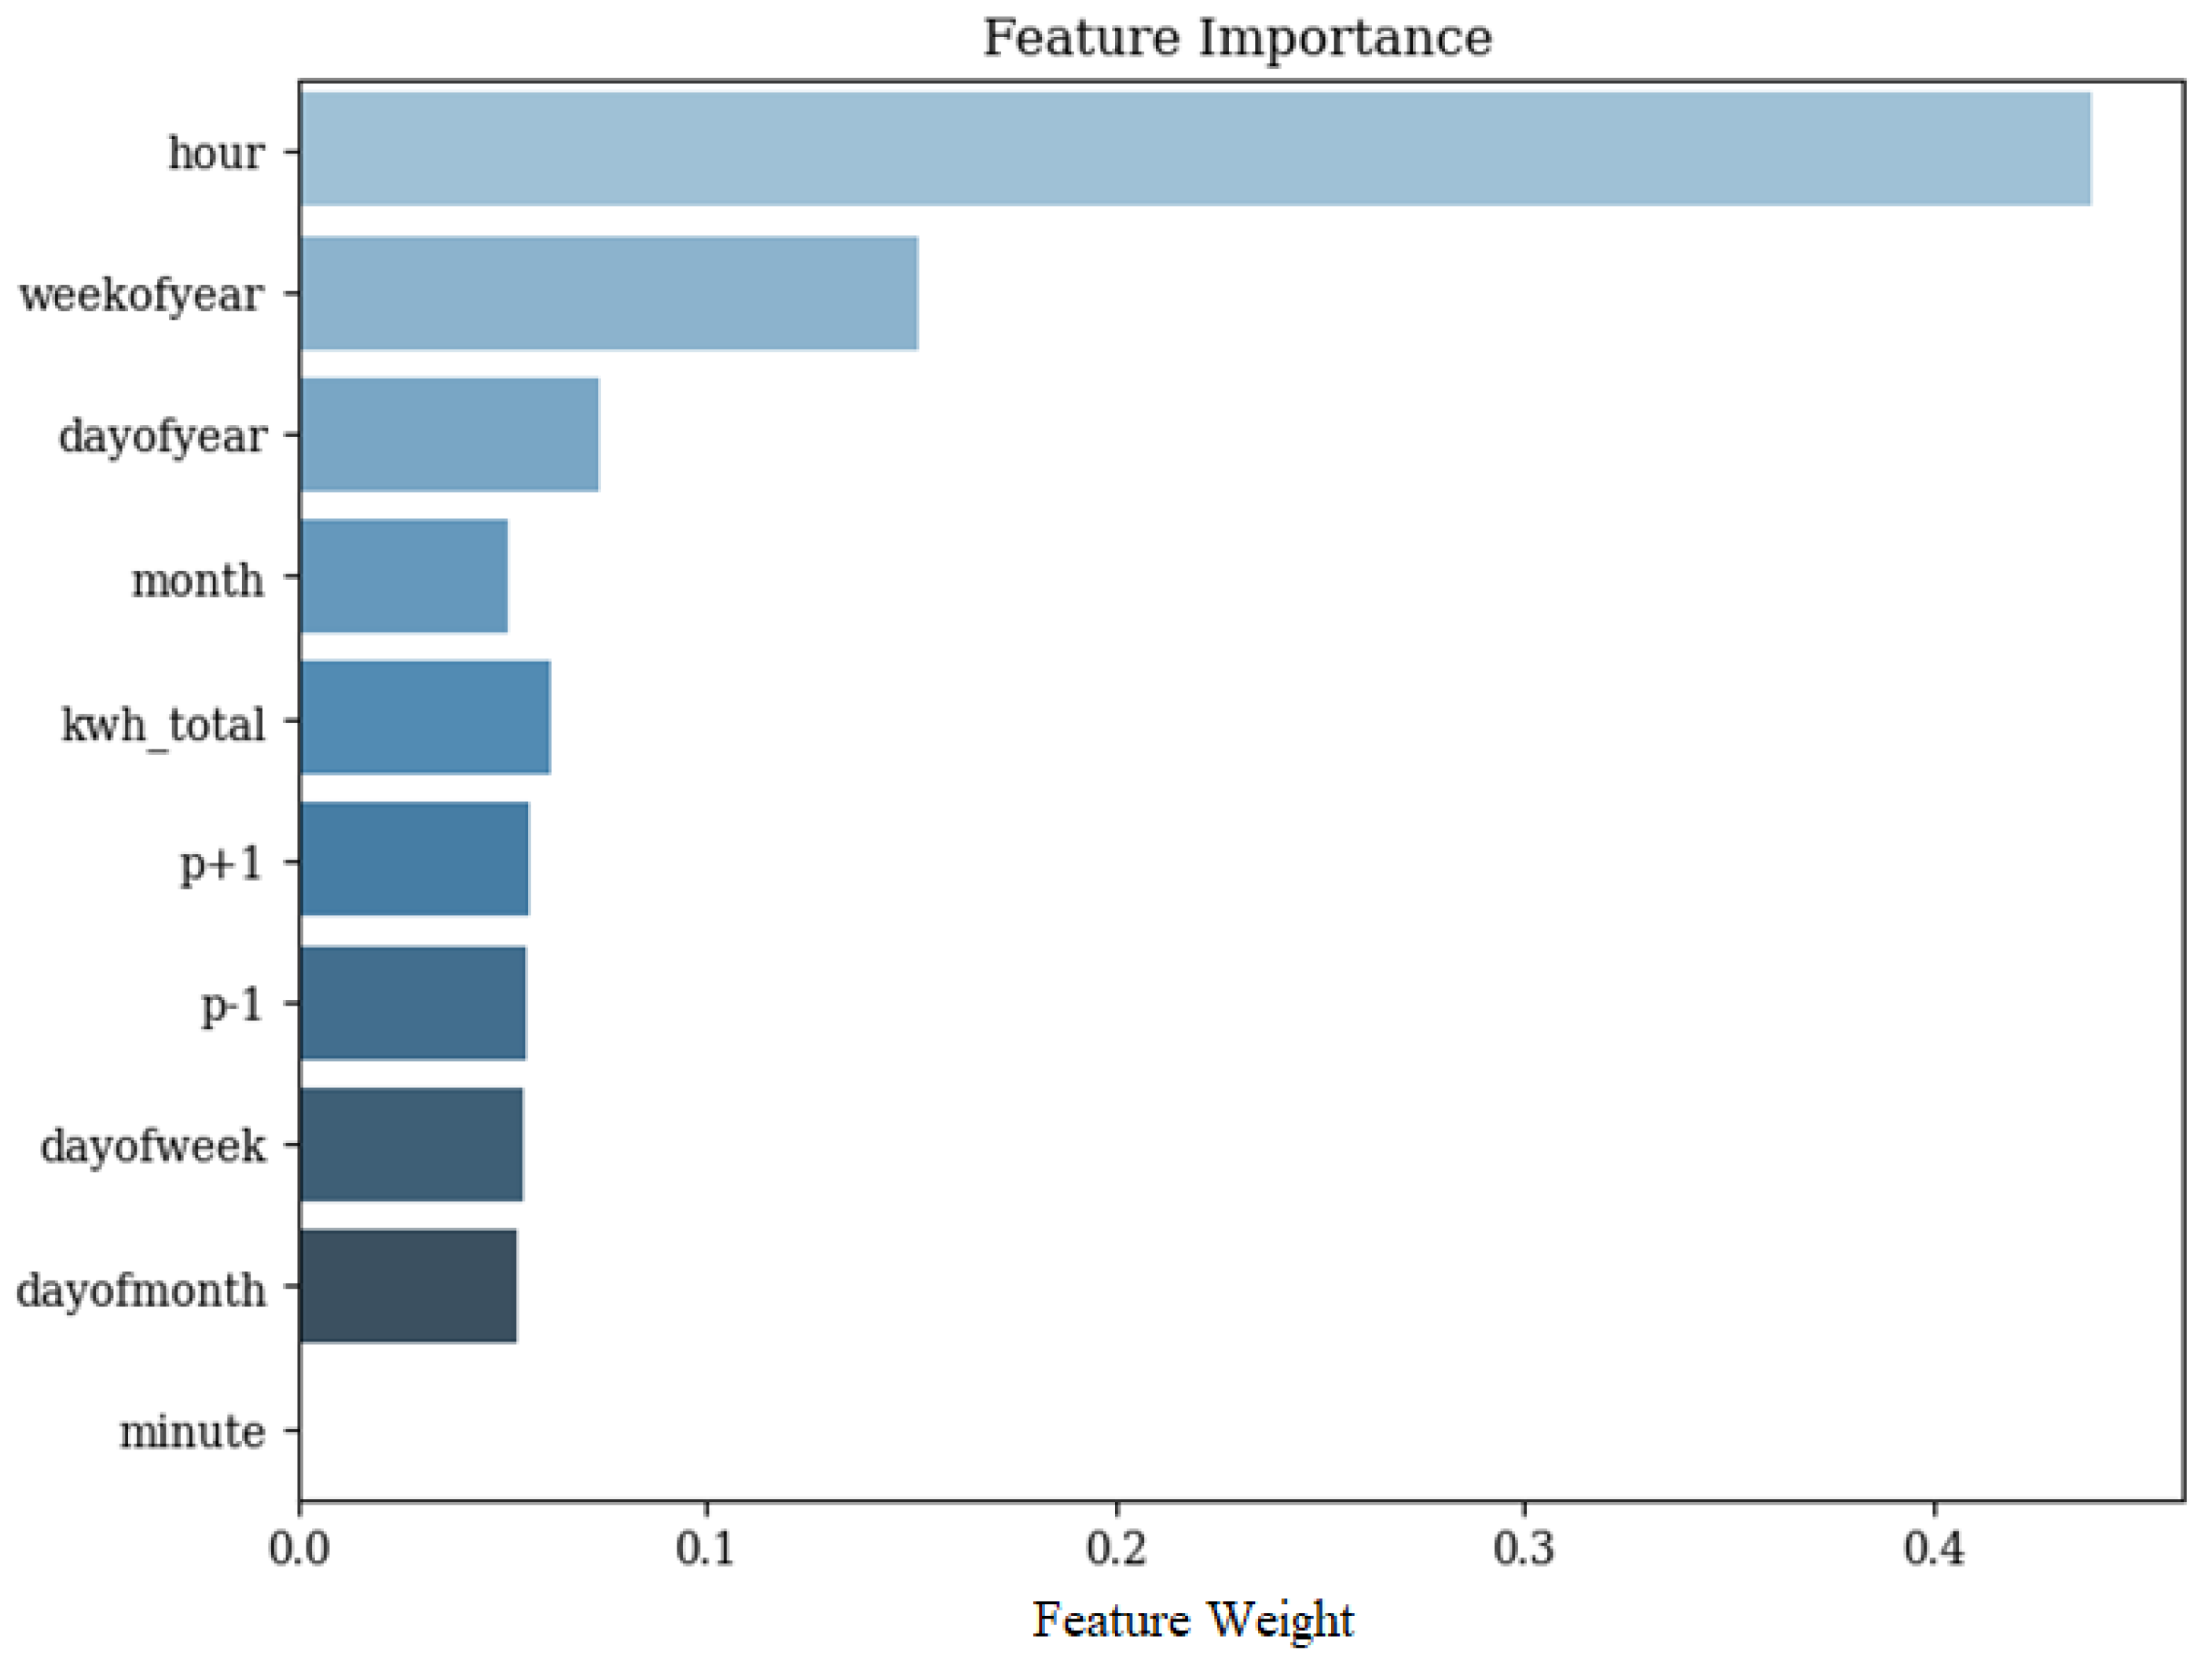
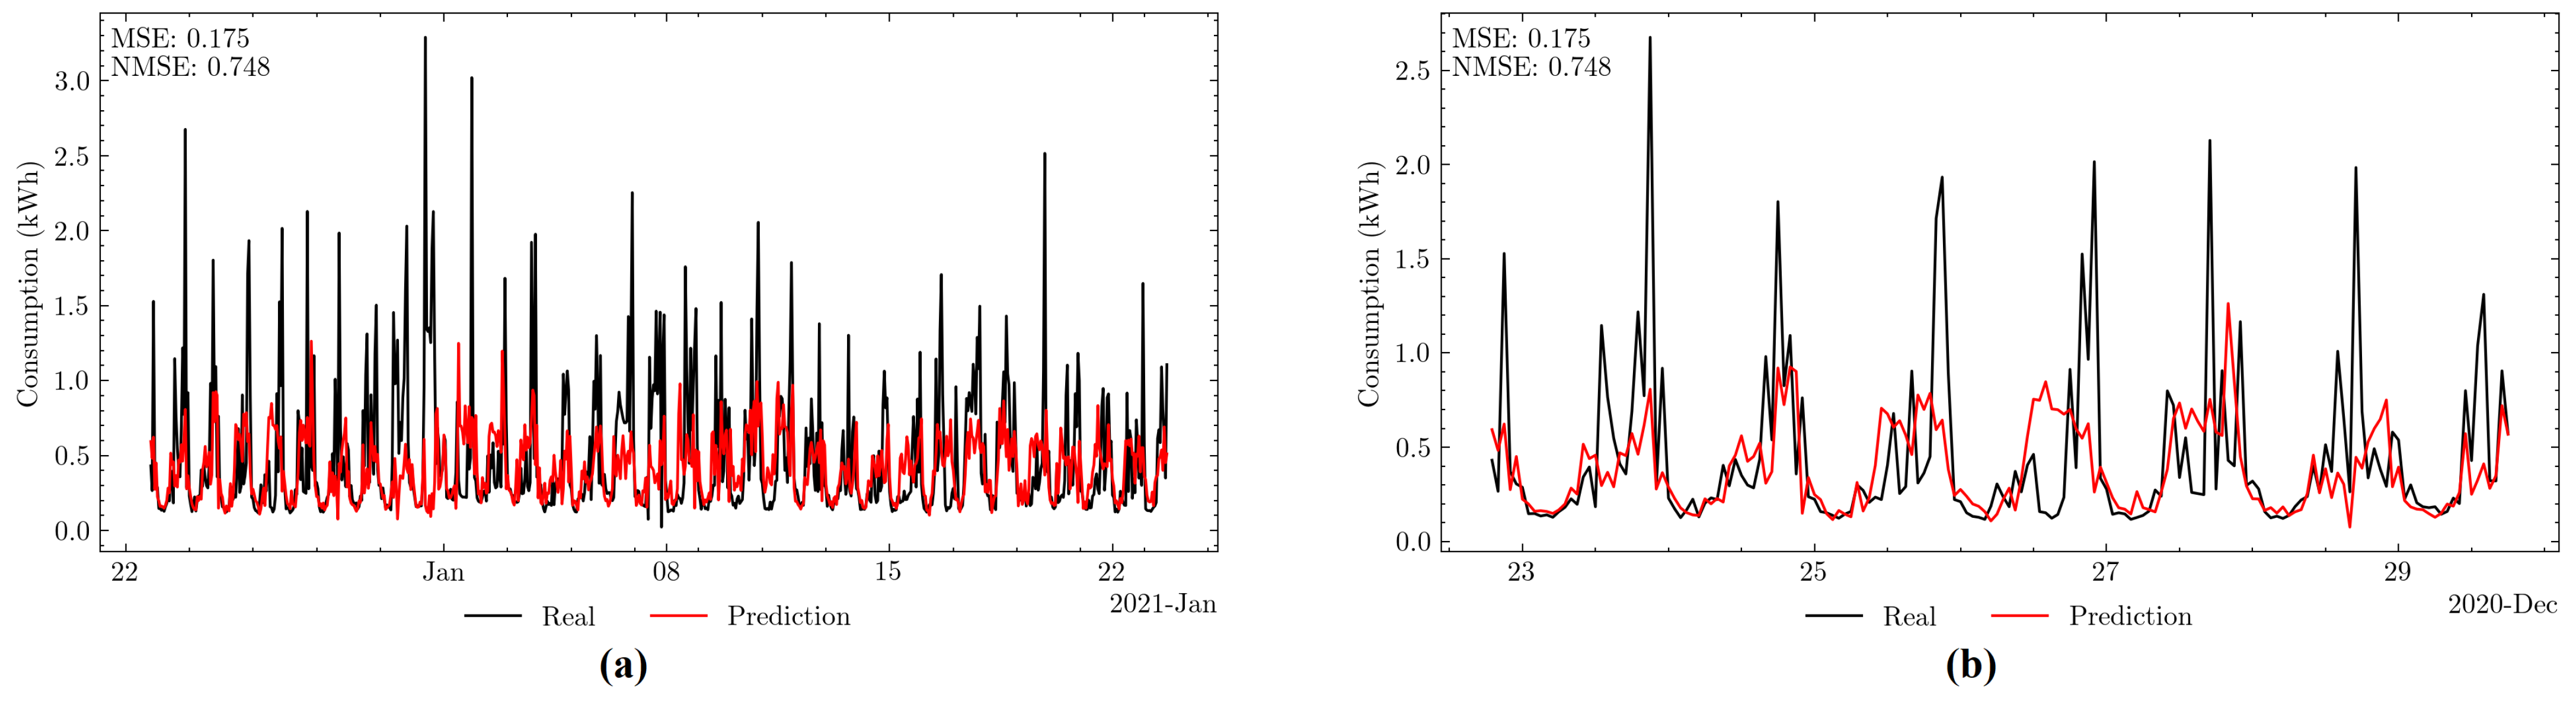
3.3.4. Model Training and Prediction
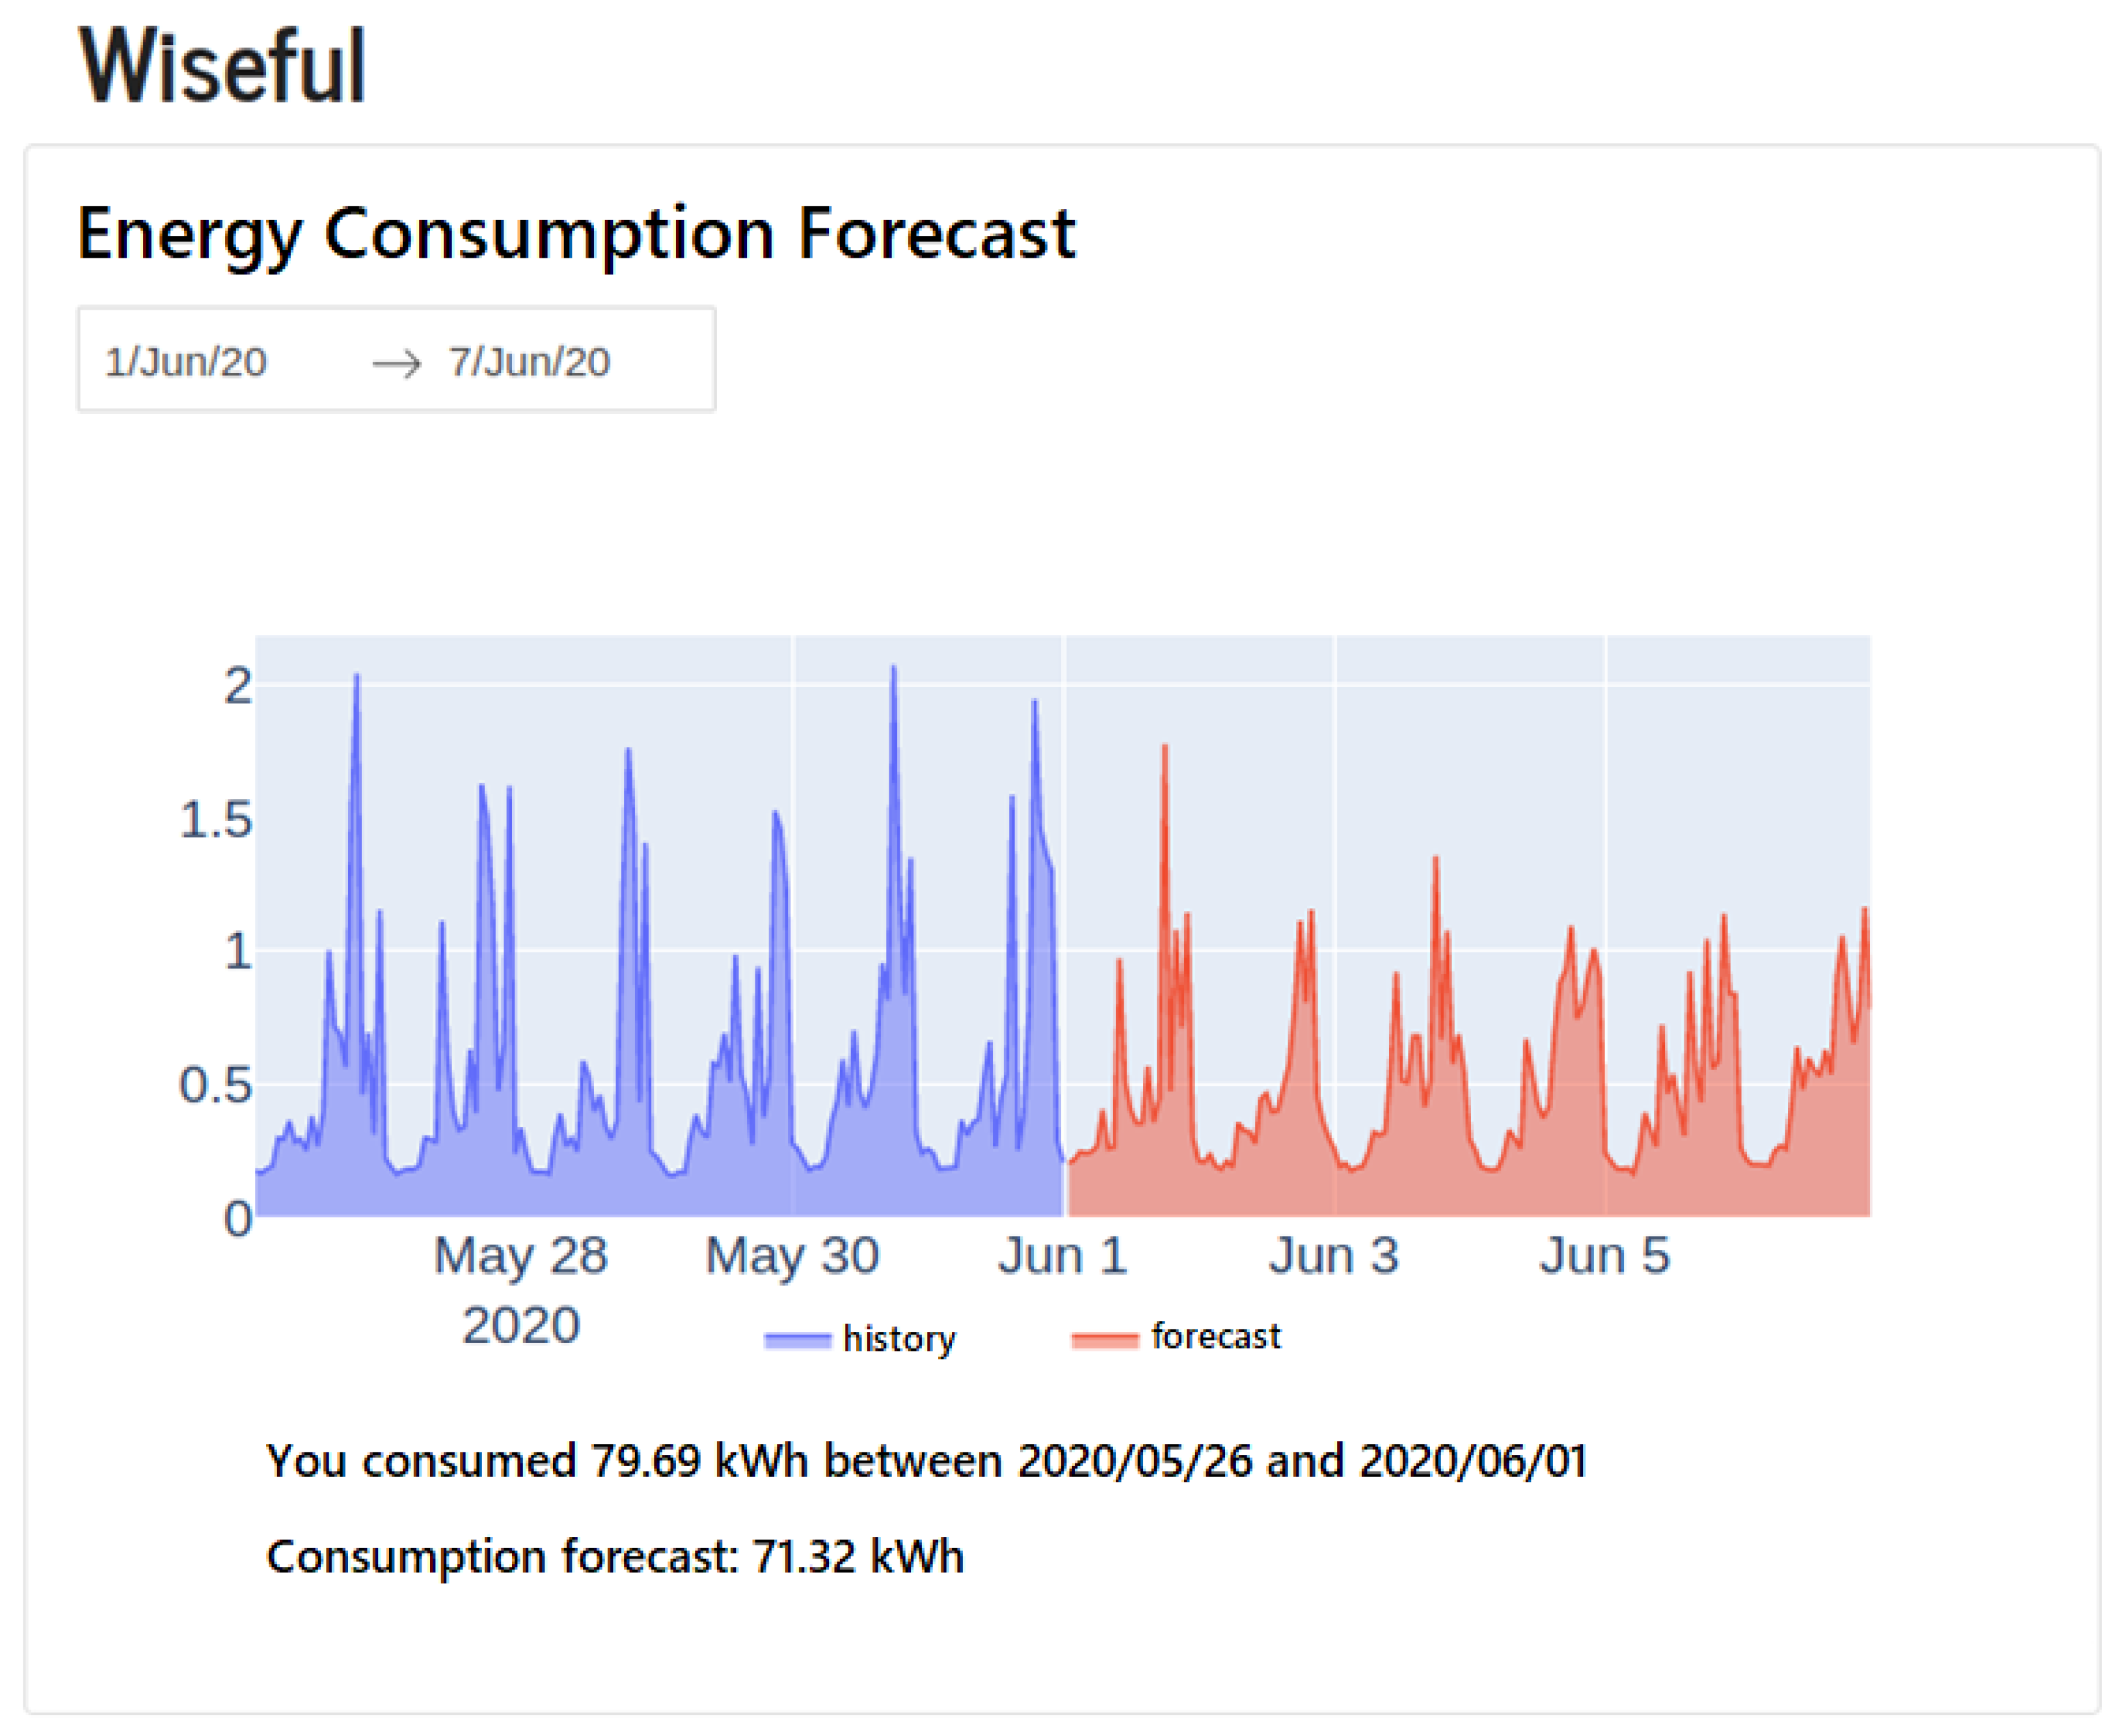
3.3.5. Inference
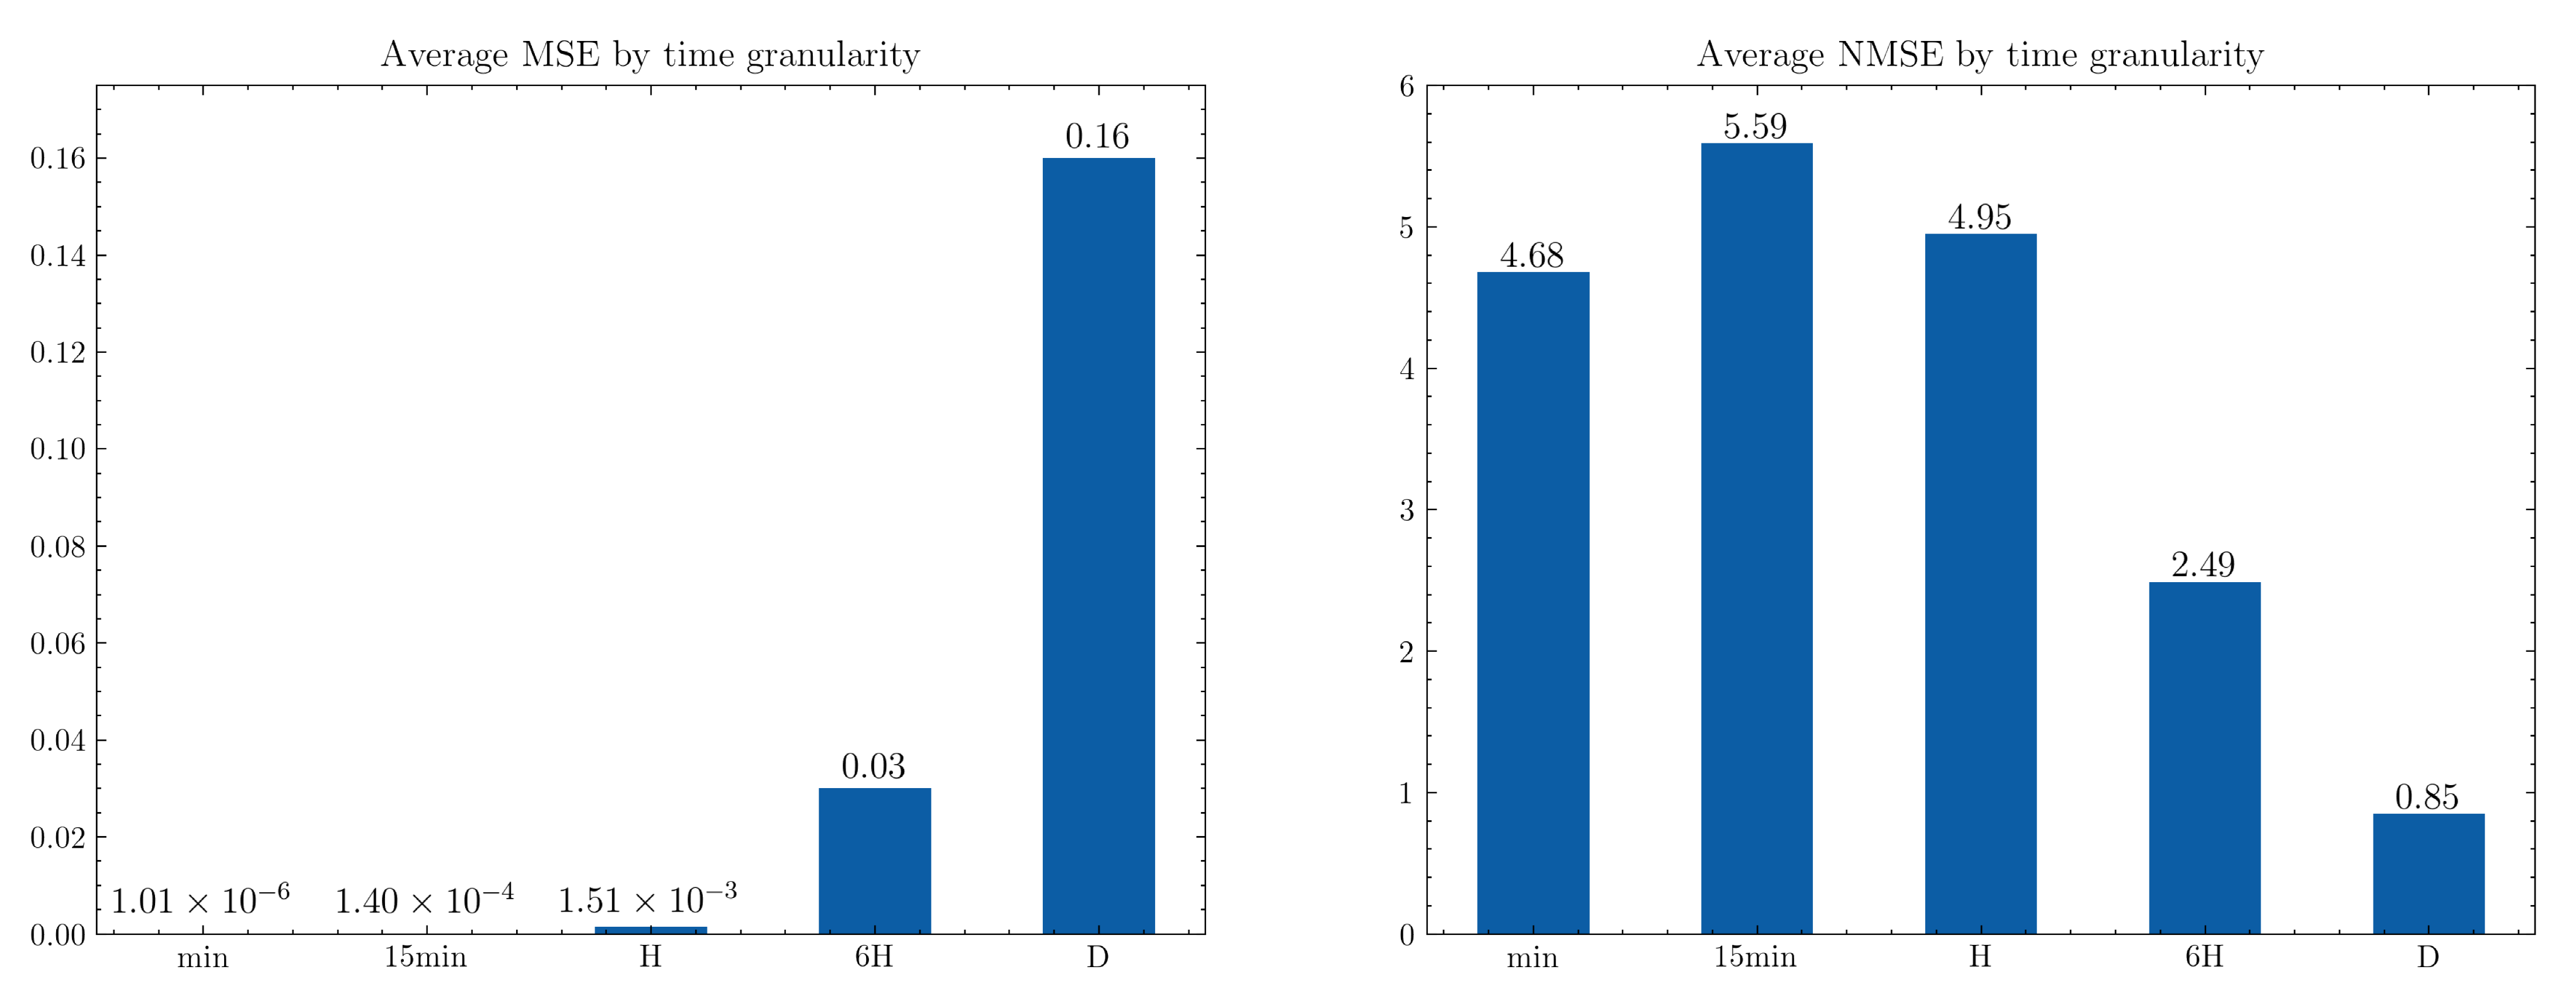
3.3.6. Evaluation
4. Results
4.1. Mlops Tests
4.2. Use of Digital Twin Data to Improve Forecasting Accuracy
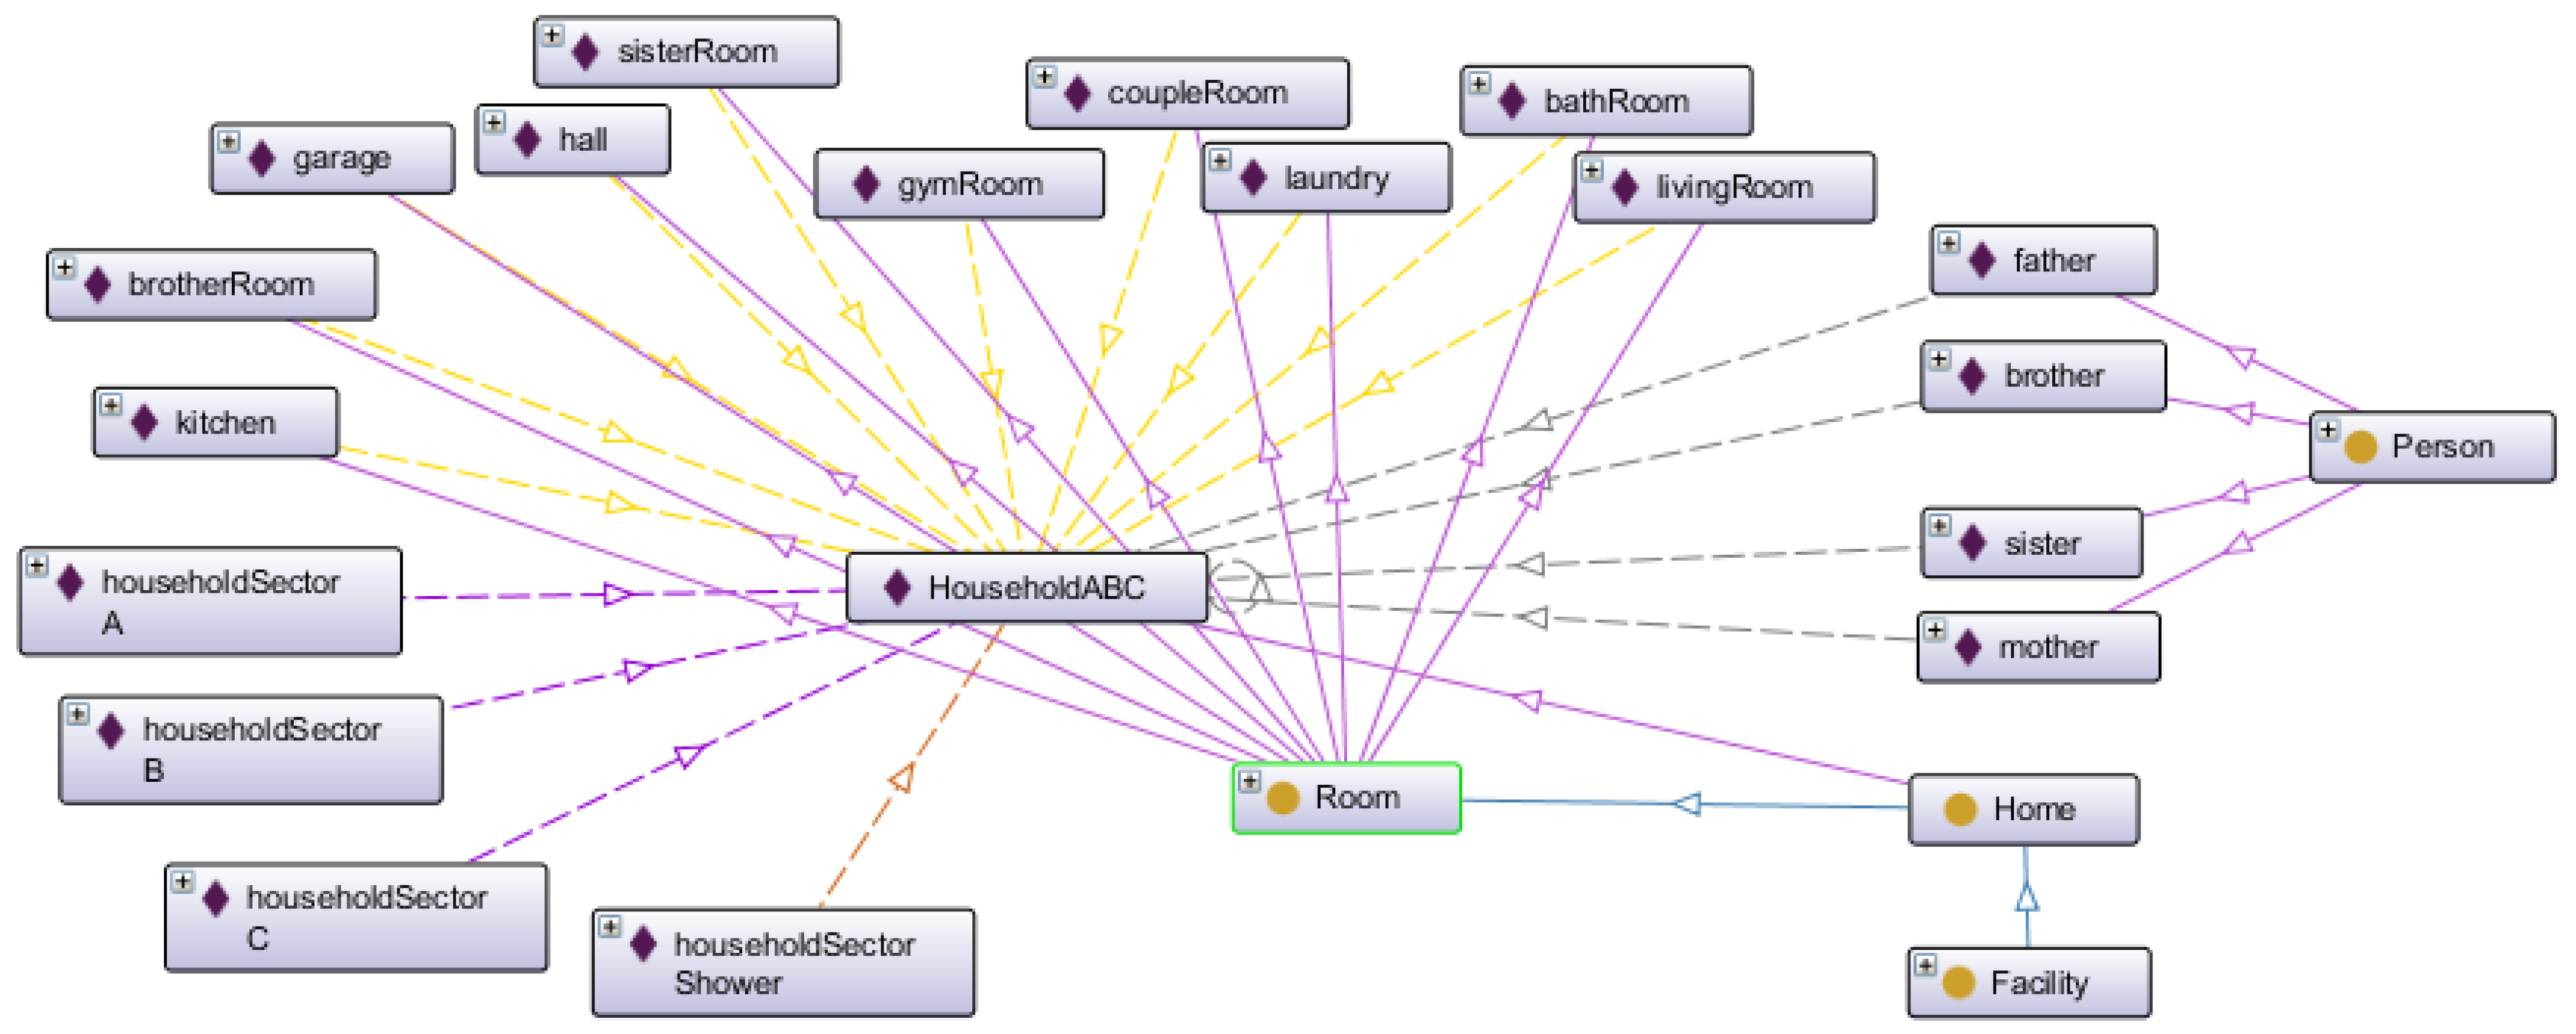
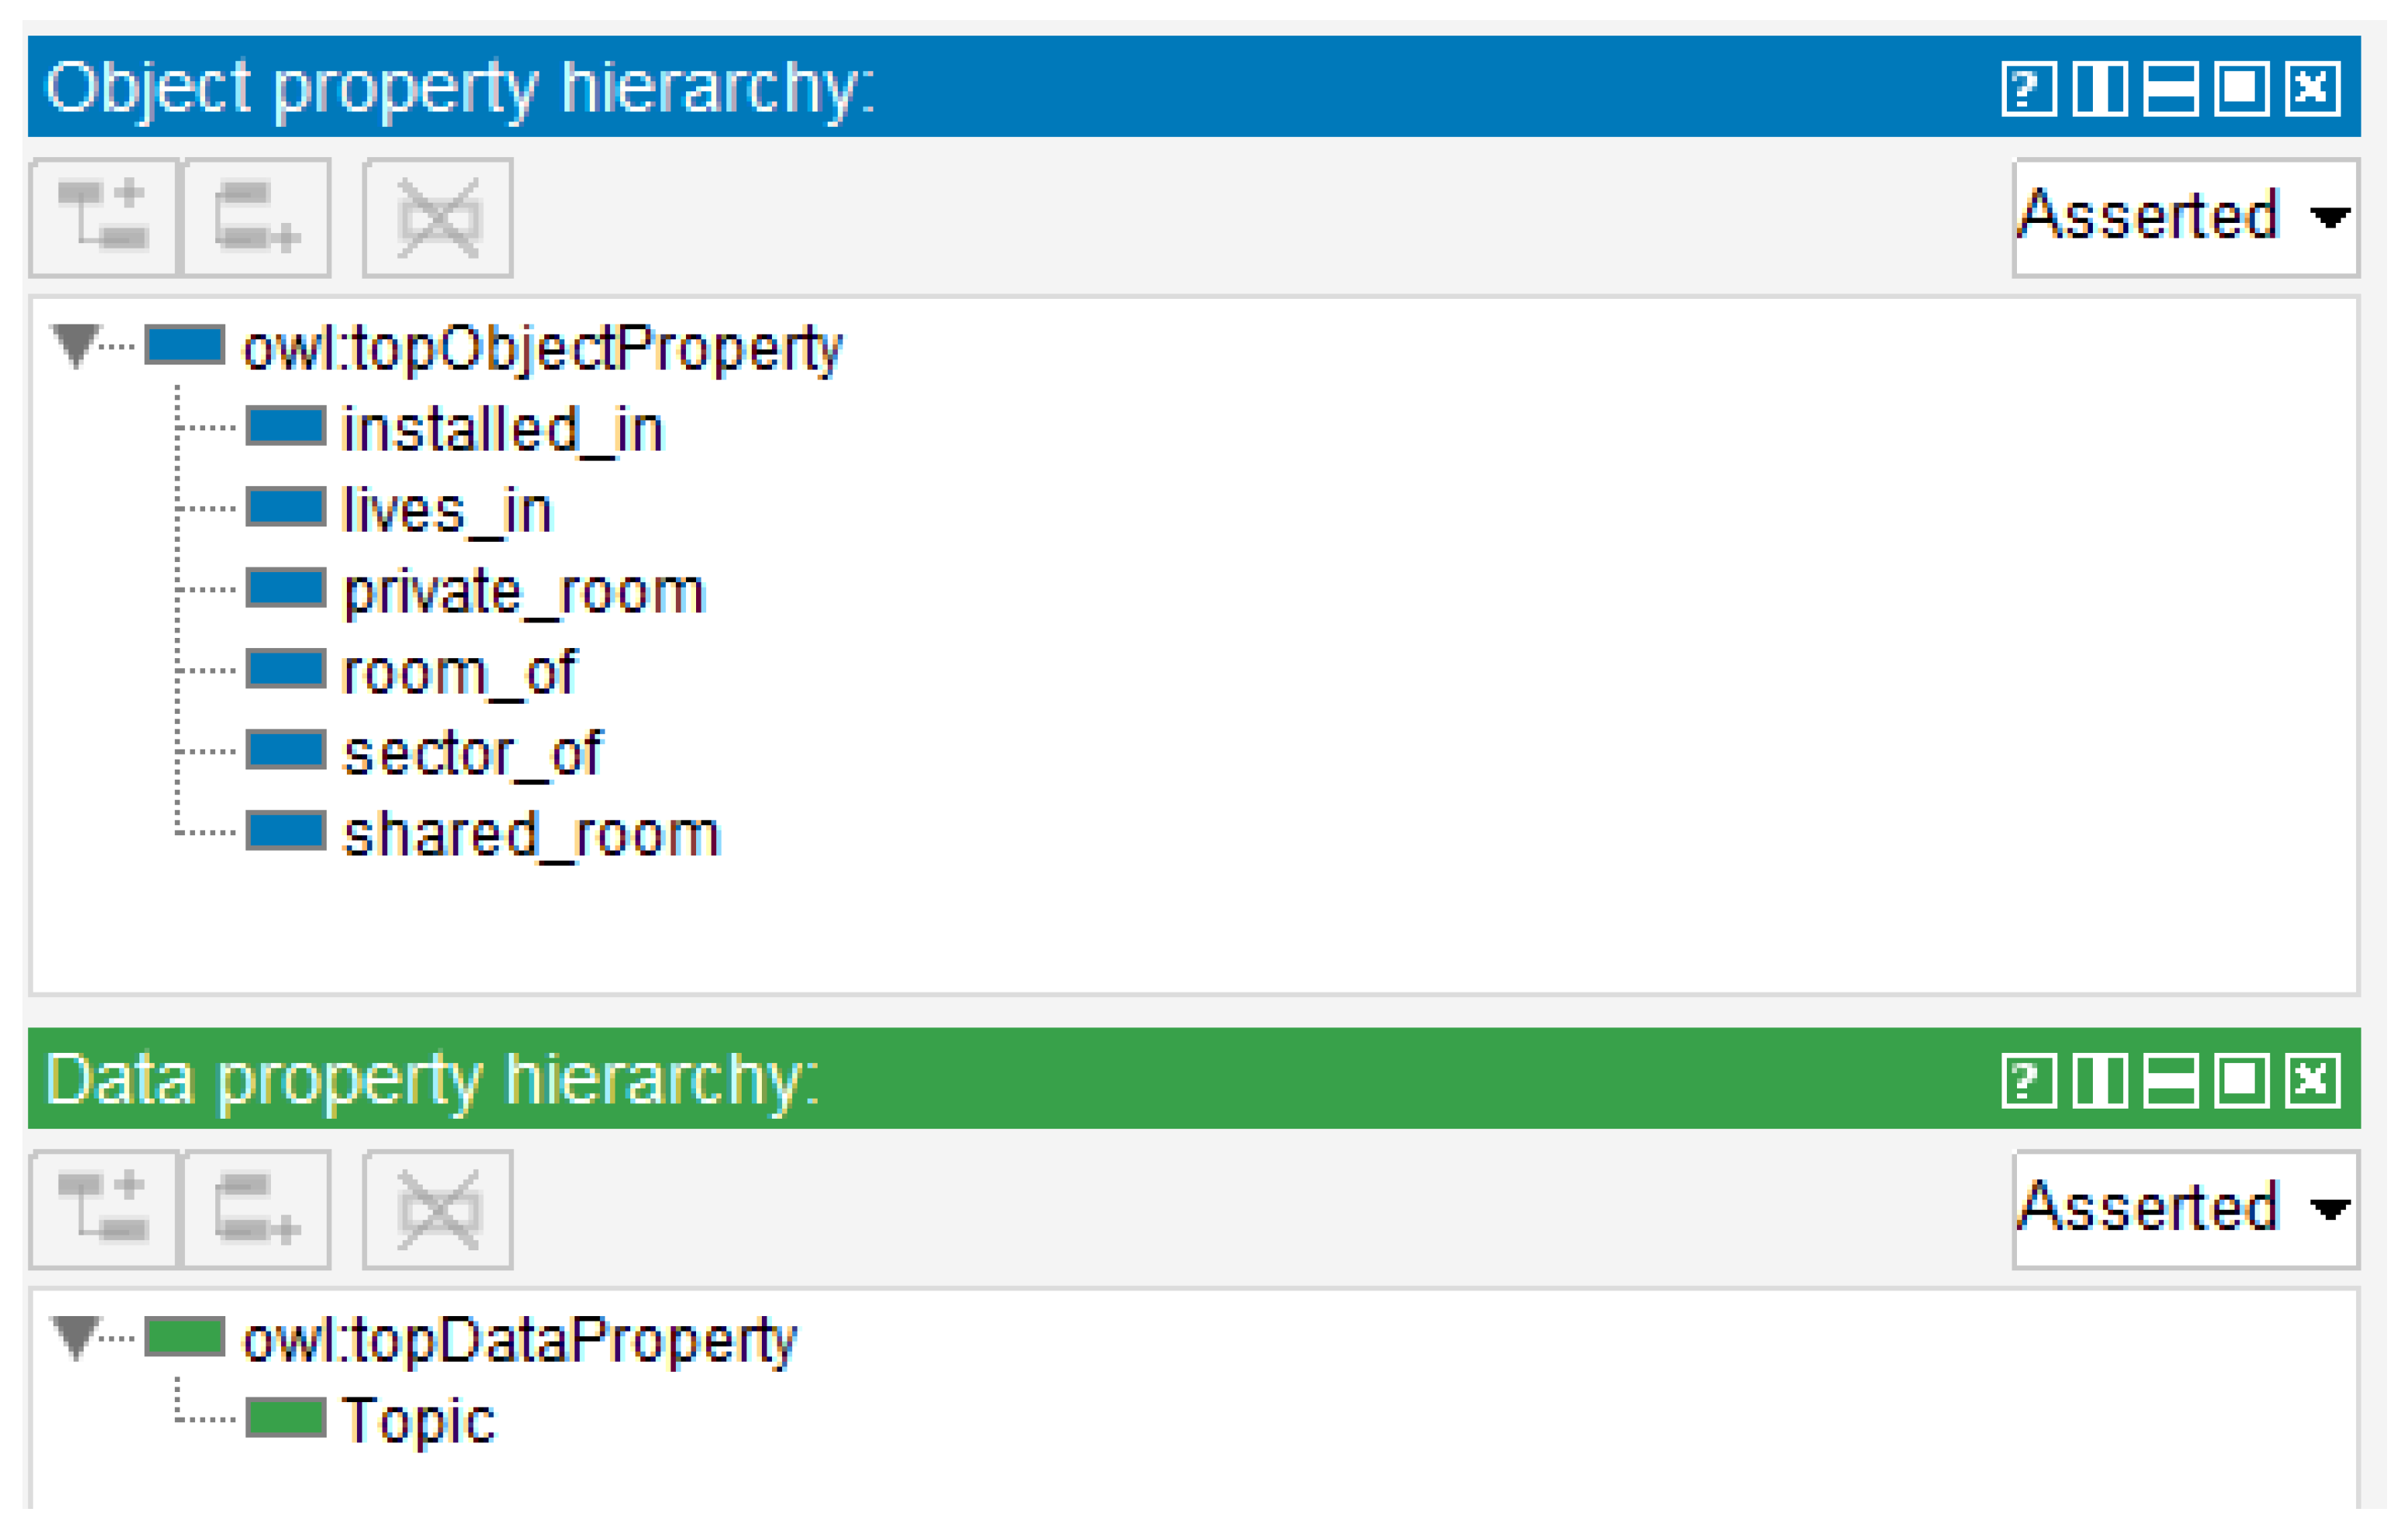
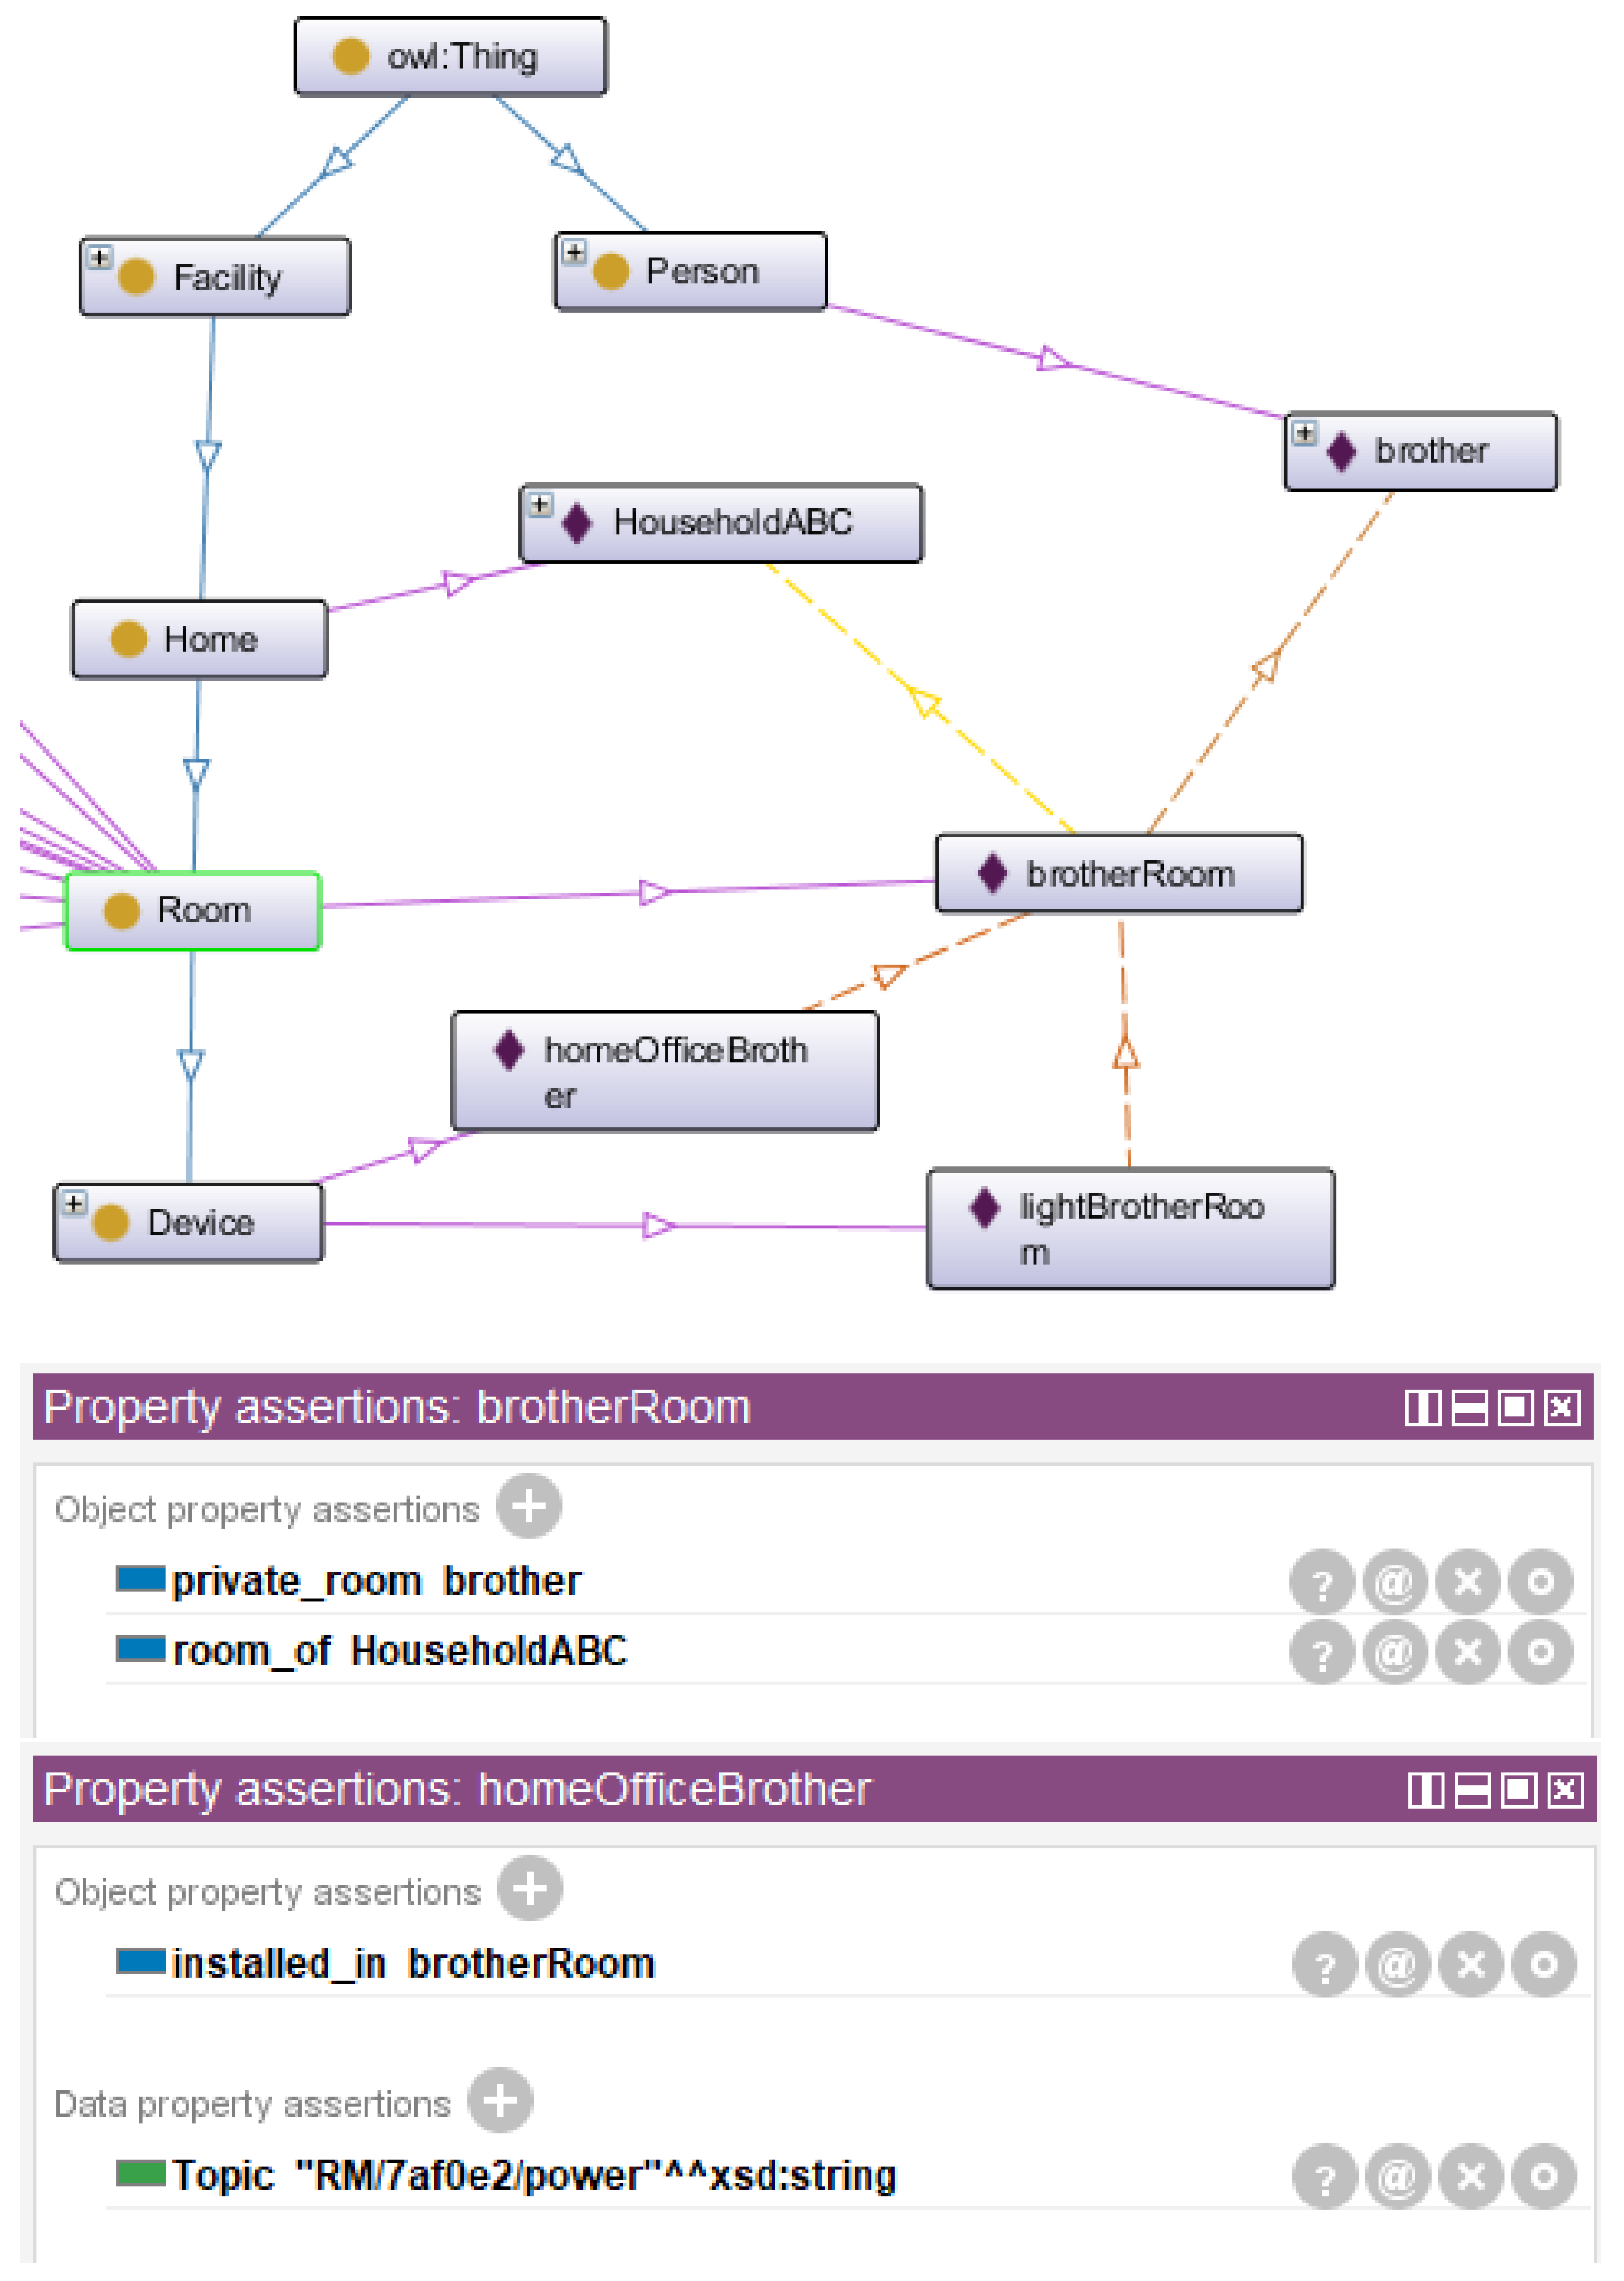
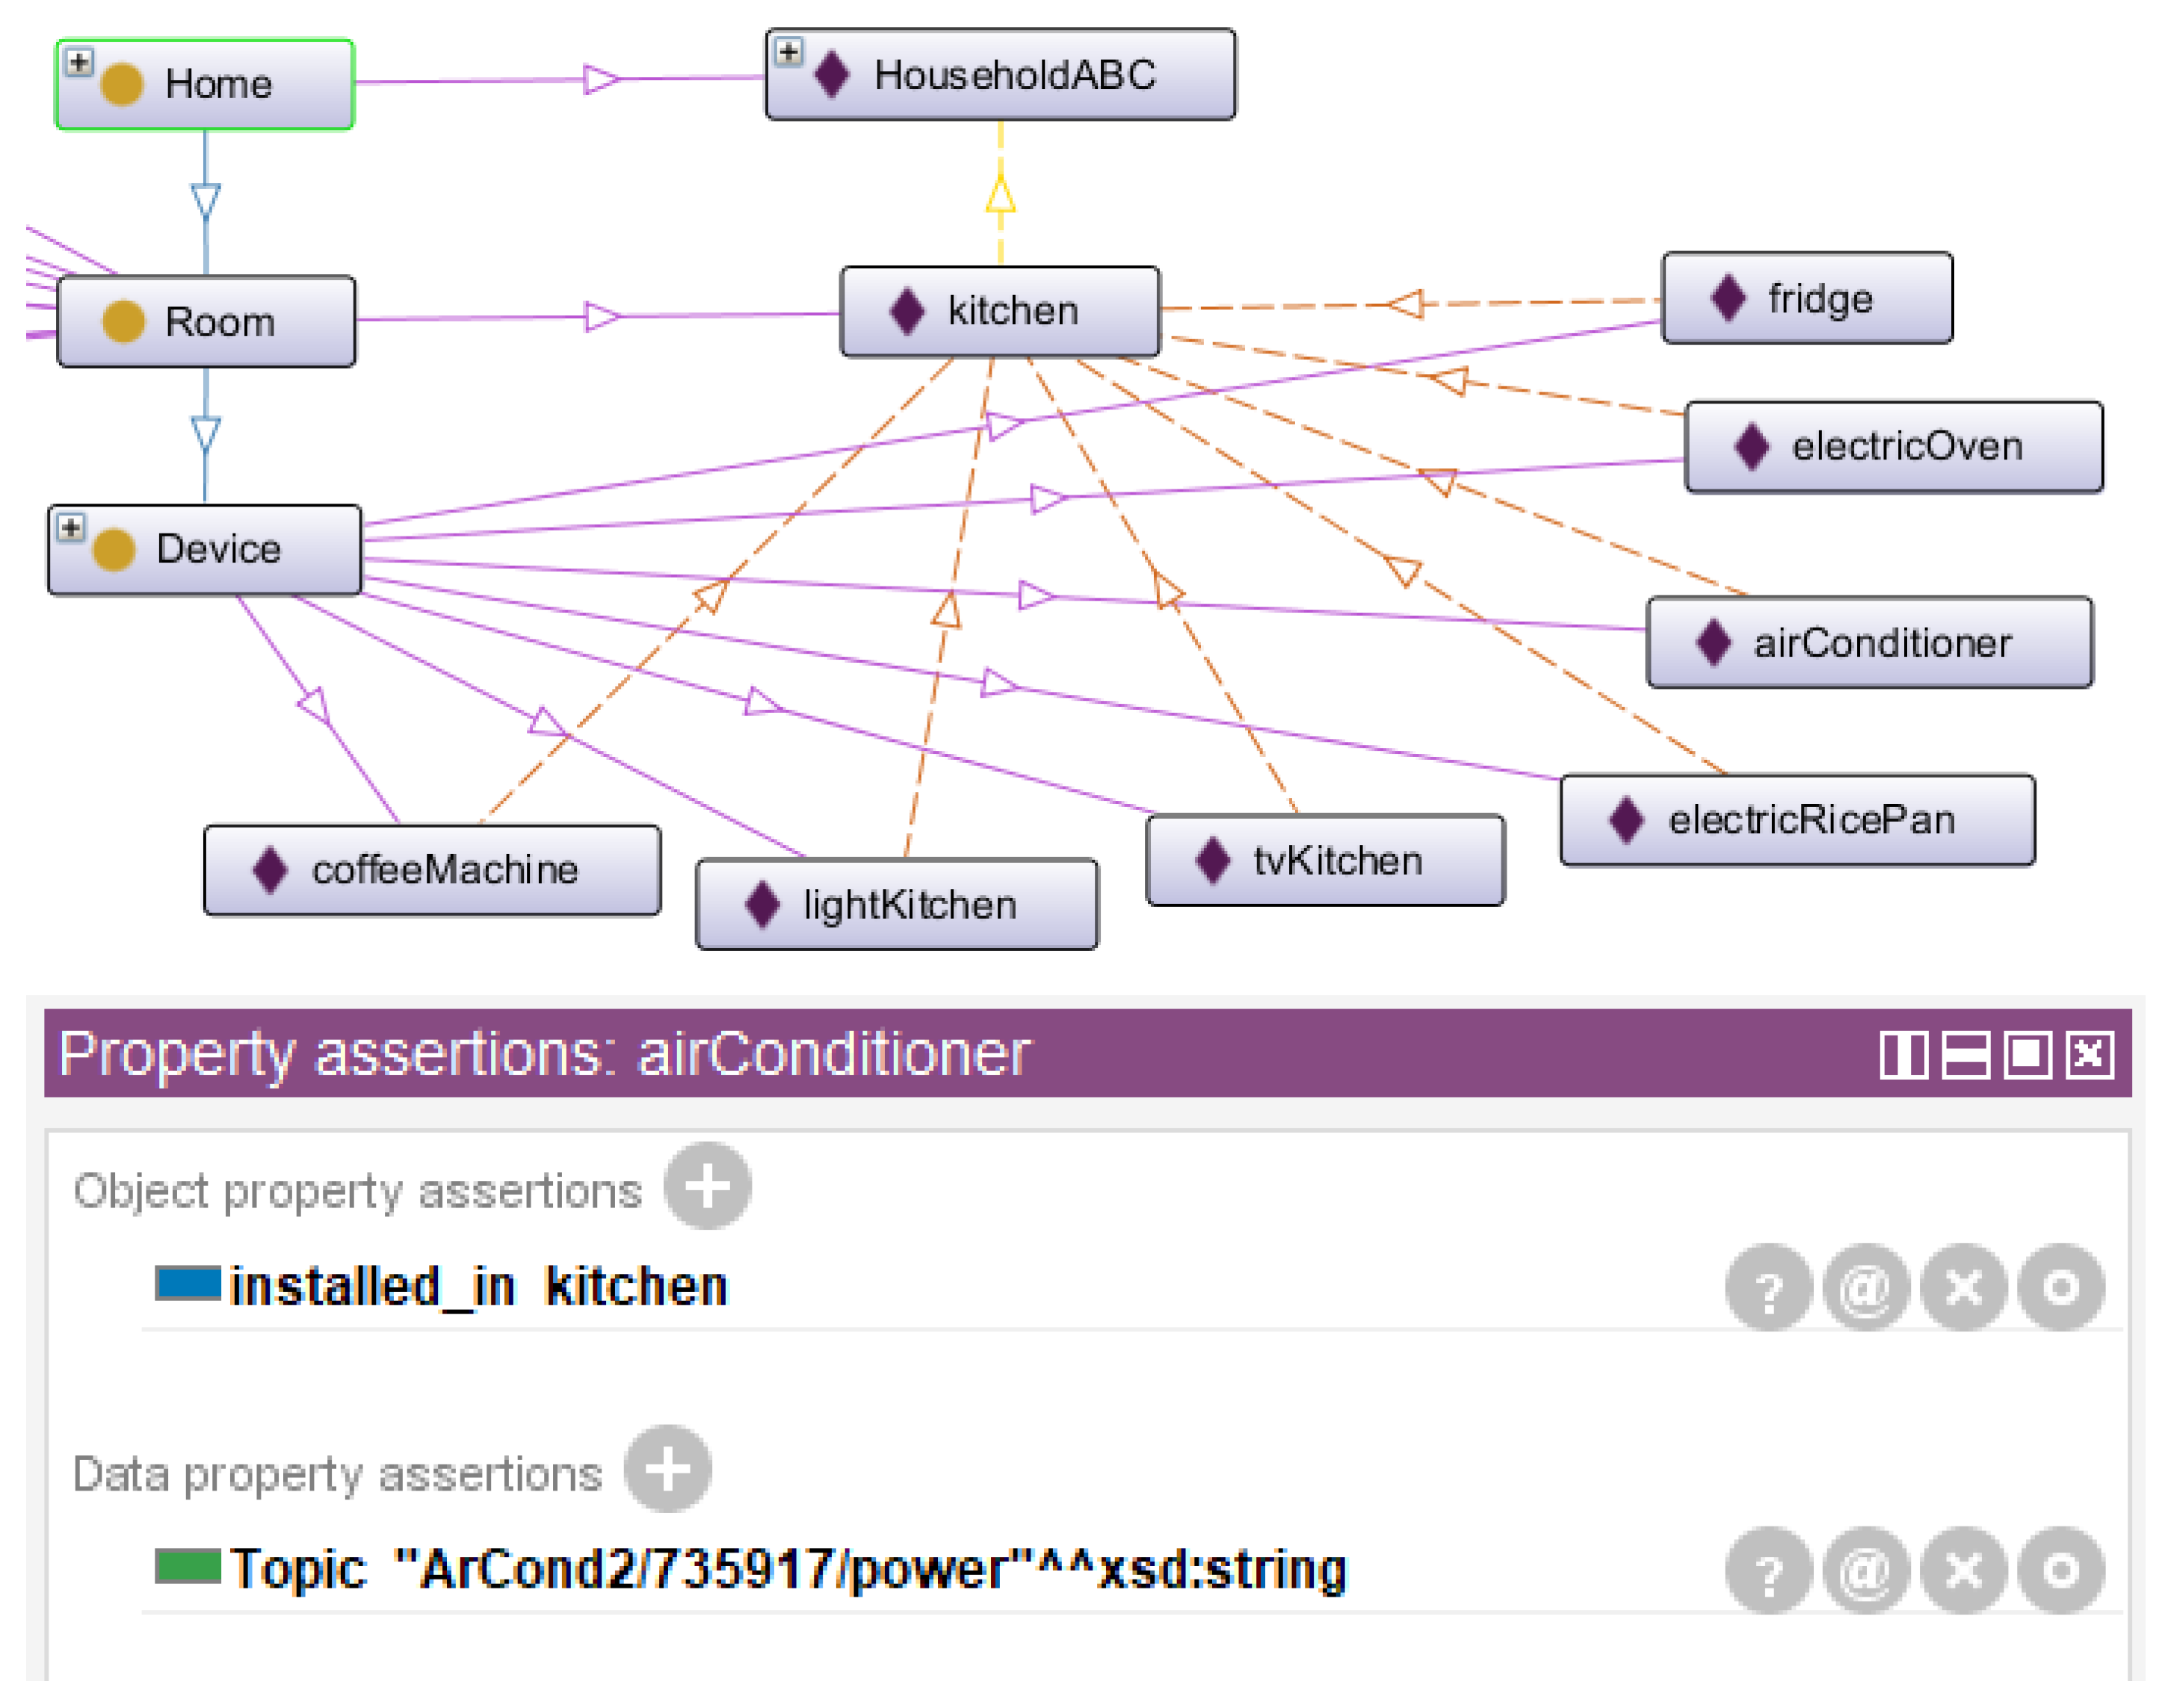
4.3. Digital Twin Ontology
5. Discussion
5.1. Comparison with Related Work
5.2. Known Limitations and Future Work
5.3. Development Considerations
6. Conclusions
Author Contributions
Funding
Institutional Review Board Statement
Informed Consent Statement
Conflicts of Interest
References
- Iqbal, S.; Sarfraz, M.; Ayyub, M.; Tariq, M.; Chakrabortty, R.K.; Ryan, M.J.; Alamri, B. A Comprehensive Review on Residential Demand Side Management Strategies in Smart Grid Environment. Sustainability 2021, 13, 7170. [Google Scholar] [CrossRef]
- Cruz, C.; Palomar, E.; Bravo, I.; Aleixandre, M. Behavioural patterns in aggregated demand response developments for communities targeting renewables. Sustain. Cities Soc. 2021, 72, 103001. [Google Scholar] [CrossRef]
- Hayashi, V.T.; Arakaki, R.; Fujii, T.Y.; Khalil, K.A.; Hayashi, F.H. B2B B2C Architecture for Smart Meters using IoT and Machine Learning: A Brazilian Case Study. In Proceedings of the 2020 International Conference on Smart Grids and Energy Systems (SGES), Perth, Australia, 23–26 November 2020. [Google Scholar] [CrossRef]
- Hayashi, V.; Fujii, T.; Arakaki, R.; Amaral, H.; Souza, A. Boa Energia: Base de Dados Pública de Consumo Residencial com Qualidade de Dados. In Anais de XXXVIII Simpósio Brasileiro de Telecomunicações e Processamento de Sinais; Sociedade Brasileira de Telecomunicações: Rio de Janeiro, Brazil, 2020. [Google Scholar]
- Carrie Armel, K.; Gupta, A.; Shrimali, G.; Albert, A. Is disaggregation the holy grail of energy efficiency? The case of electricity. Energy Policy 2013, 52, 213–234. [Google Scholar] [CrossRef] [Green Version]
- Humeau, S.; Wijaya, T.K.; Vasirani, M.; Aberer, K. Electricity load forecasting for residential customers: Exploiting aggregation and correlation between households. In Proceedings of the 2013 Sustainable Internet and ICT for Sustainability (SustainIT), Palermo, Italy, 30–31 October 2013. [Google Scholar]
- Martins, P.B.d.M.; Pinto, R.G.D.; Bittencourt, S.P. Load Disaggregation of Industrial Machinery Power Consumption Monitoring Using Factorial Hidden Markov Models. In Proceedings of the International Workshop on Non-Intrusive Load Monitoring (NILM), Austin, TX, USA, 7–8 March 2018; p. 6. [Google Scholar]
- Lusis, P.; Khalilpour, K.R.; Andrew, L.; Liebman, A. Short-term residential load forecasting: Impact of calendar effects and forecast granularity. Appl. Energy 2017, 205, 654–669. [Google Scholar] [CrossRef]
- Alanezi, A.; P Hallinan, K.; Elhashmi, R. Using Smart-WiFi Thermostat Data to Improve Prediction of Residential Energy Consumption and Estimation of Savings. Energies 2021, 14, 187. [Google Scholar] [CrossRef]
- Villa, S.; Sassanelli, C. The Data-Driven Multi-Step Approach for Dynamic Estimation of Buildings’ Interior Temperature. Energies 2020, 13, 6654. [Google Scholar] [CrossRef]
- Kaur, M.J.; Mishra, V.P.; Maheshwari, P. The convergence of digital twin, IoT, and machine learning: Transforming data into action. In Digital Twin Technologies and Smart Cities; Springer: Berlin, Germany, 2020; pp. 3–17. [Google Scholar]
- Fujii, T.Y.; Ruggiero, W.V.; do Amaral, H.L.; Hayashi, V.T.; Arakaki, R.; Khalil, K.A. Desafios para Aplicação de MLOps na Previsão do Consumo Energético. In Proceedings of the 2021 14th IEEE International Conference on Industry Applications (INDUSCON), São Paulo, Brazil, 15–18 August 2021; pp. 455–462. [Google Scholar]
- Alsalemi, A.; Sardianos, C.; Bensaali, F.; Varlamis, I.; Amira, A.; Dimitrakopoulos, G. The role of micro-moments: A survey of habitual behavior change and recommender systems for energy saving. IEEE Syst. J. 2019, 13, 3376–3387. [Google Scholar] [CrossRef]
- Alsalemi, A.; Himeur, Y.; Bensaali, F.; Amira, A.; Sardianos, C.; Varlamis, I.; Dimitrakopoulos, G. Achieving domestic energy efficiency using micro-moments and intelligent recommendations. IEEE Access 2020, 8, 15047–15055. [Google Scholar] [CrossRef]
- Zehir, M.A.; Ortac, K.B.; Gul, H.; Batman, A.; Aydin, Z.; Portela, J.C.; Soares, F.J.; Bagriyanik, M.; Kucuk, U.; Ozdemir, A. Development and field demonstration of a gamified residential demand management platform compatible with smart meters and building automation systems. Energies 2019, 12, 913. [Google Scholar] [CrossRef] [Green Version]
- Zhang, Y.; Srivastava, A.K.; Cook, D. Machine learning algorithm for activity-aware demand response considering energy savings and comfort requirements. IET Smart Grid 2020, 3, 730–737. [Google Scholar] [CrossRef]
- Fathy, Y.; Jaber, M.; Nadeem, Z. Digital Twin-Driven Decision Making and Planning for Energy Consumption. J. Sens. Actuator Netw. 2021, 10, 37. [Google Scholar] [CrossRef]
- Hyndman, R.J.; Athanasopoulos, G. Forecasting: Principles and Practice; OTexts: Melbourne, Australia, 2021. [Google Scholar]
- Rossana, R.J.; Seater, J.J. Temporal Aggregation and Economic Time Series. J. Bus. Econ. Stat. 1995, 13, 441–445. [Google Scholar]
- Sprenger, J.; Weinberger, N. Simpson’s Paradox. In The Stanford Encyclopedia of Philosophy, 2021th ed.; Zalta, E.N., Ed.; Metaphysics Research Lab, Stanford University: Palo Alto, CA, USA, 2021. [Google Scholar]
- Kong, W.; Dong, Z.Y.; Hill, D.J.; Luo, F.; Xu, Y. Short-term residential load forecasting based on resident behaviour learning. IEEE Trans. Power Syst. 2018, 33, 2017–2018. [Google Scholar] [CrossRef]
- Ben Taieb, S.; Hyndman, R.J. A gradient boosting approach to the Kaggle load forecasting competition. Int. J. Forecast. 2014, 30, 382–394. [Google Scholar] [CrossRef] [Green Version]
- Veit, A.; Goebel, C.; Tidke, R.; Doblander, C.; Jacobsen, H.A. Household electricity demand forecasting—Benchmarking state-of-the-art methods. In Proceedings of the e-Energy 2014—Proceedings of the 5th ACM International Conference on Future Energy Systems, Cambridge, UK, 11–13 June 2014; pp. 233–234. [Google Scholar]
- Gerossier, A.; Girard, R.; Bocquet, A.; Kariniotakis, G. Robust day-ahead forecasting of household electricity demand and operational challenges. Energies 2018, 11, 3503. [Google Scholar] [CrossRef] [Green Version]
- The daily and hourly energy consumption and load forecasting using artificial neural network method: A case study using a set of 93 households in Portugal. Energy Procedia 2014, 62, 220–229. [CrossRef] [Green Version]
- Kong, W.; Dong, Z.Y.; Jia, Y.; Hill, D.J.; Xu, Y.; Zhang, Y. Short-Term Residential Load Forecasting Based on LSTM Recurrent Neural Network. IEEE Trans. Smart Grid 2019, 10, 841–851. [Google Scholar] [CrossRef]
- Serrenho, T.; Bertoldi, P. Smart Home and Appliances: State of the Art; Technical Report; Publications Office of the European Union: Luxembourg, 2019. [Google Scholar]
- Amaral, H.L.; Maginador, J.A.; Ayres, R.M.; De Souza, A.N.; Gastaldello, D.S. Integration of consumption forecasting in smart meters and smart home management systems. In Proceedings of the SBSE 2018—7th Brazilian Electrical Systems Symposium, Niteroi, Brazil, 12–16 May 2018; pp. 1–6. [Google Scholar]
- Wang, Y.; Chen, Q.; Hong, T.; Kang, C. Review of Smart Meter Data Analytics: Applications, Methodologies, and Challenges. IEEE Trans. Smart Grid 2019, 10, 3125–3148. [Google Scholar] [CrossRef] [Green Version]
- Tushar, W.; Saha, T.K.; Yuen, C.; Liddell, P.; Bean, R.; Poor, H.V. Peer-to-Peer Energy Trading With Sustainable User Participation: A Game Theoretic Approach. IEEE Access 2018, 6, 62932–62943. [Google Scholar] [CrossRef]
- Pratt, A.; Krishnamurthy, D.; Ruth, M.; Wu, H.; Lunacek, M.; Vaynshenk, P. Transactive Home Energy Management Systems: The Impact of Their Proliferation on the Electric Grid. IEEE Electrif. Mag. 2016, 4, 8–14. [Google Scholar] [CrossRef]
- Haben, S.; Ward, J.; Vukadinovic Greetham, D.; Singleton, C.; Grindrod, P. A new error measure for forecasts of household-level, high resolution electrical energy consumption. Int. J. Forecast. 2014, 30, 246–256. [Google Scholar] [CrossRef] [Green Version]
- Stefan, A.; Athitsos, V.; Das, G. The move-split-merge metric for time series. IEEE Trans. Knowl. Data Eng. 2013, 25, 1425–1438. [Google Scholar] [CrossRef] [Green Version]
- Guen, V.L.; Thome, N. Shape and Time Distortion Loss for Training Deep Time Series Forecasting Models. arXiv 2019, arXiv:1909.09020. [Google Scholar]
- Murphy, A.H. What Is a Good Forecast? An Essay on the Nature of Goodness in Weather Forecasting. Weather Forecast. 1993, 8, 281–293. [Google Scholar] [CrossRef] [Green Version]
- Breck, E.; Cai, S.; Nielsen, E.; Salib, M.; Sculley, D. The ML test score: A rubric for ML production readiness and technical debt reduction. In Proceedings of the 2017 IEEE International Conference on Big Data (Big Data), Boston, MA, USA, 11–14 December 2017; Volume 47, pp. 1123–1132. [Google Scholar]
- Sugimura, P.; Hartl, F. Building a reproducible machine learning pipeline. arXiv 2018, arXiv:1810.04570. [Google Scholar]
- Senapathi, M.; Buchan, J.; Osman, H. DevOps Capabilities, Practices, and Challenges. In Proceedings of the 22nd International Conference on Evaluation and Assessment in Software Engineering 2018, Christchurch, New Zealand, 28–29 June 2018; ACM: New York, NY, USA, 2018; pp. 57–67. [Google Scholar]
- Sculley, D.; Holt, G.; Golovin, D.; Davydov, E.; Phillips, T.; Ebner, D.; Chaudhary, V.; Young, M.; Crespo, J.F.; Dennison, D. Hidden technical debt in machine learning systems. Adv. Neural Inf. Process. Syst. 2015, 2015, 2503–2511. [Google Scholar]
- Google Cloud. MLOps: Continuous Delivery and Automation Pipelines in Machine Learning; Google LLC: Mountain View, CA, USA, 2020. [Google Scholar]
- Guajardo, J.A.; Weber, R.; Miranda, J. A model updating strategy for predicting time series with seasonal patterns. Appl. Soft Comput. J. 2010, 10, 276–283. [Google Scholar] [CrossRef]
- Kent, L.; Snider, C.; Hicks, B. Early stage digital-physical twinning to engage citizens with city planning and design. In Proceedings of the 2019 IEEE Conference on Virtual Reality and 3D User Interfaces (VR), Osaka, Japan, 23–27 March 2019; pp. 1014–1015. [Google Scholar]
- Koreshoff, T.L.; Leong, T.W.; Robertson, T. Approaching a human-centred internet of things. In Proceedings of the 25th Australian Computer-Human Interaction Conference: Augmentation, Application, Innovation, Collaboration, Adelaide, Australia, 19–25 November 2013; pp. 363–366. [Google Scholar]
- Chen, S.; Xu, H.; Liu, D.; Hu, B.; Wang, H. A vision of IoT: Applications, challenges, and opportunities with china perspective. IEEE Internet Things J. 2014, 1, 349–359. [Google Scholar] [CrossRef]
- Eyre, J.; Freeman, C. Immersive Applications of Industrial Digital Twins. Ind. Track EuroVR 2018, 11–20. Available online: https://publications.vtt.fi/pdf/technology/2018/T339.pdf (accessed on 29 October 2021).
- Bezborodova, O.; Bodin, O.; Gerasimov, A.; Kramm, M.; Rahmatullov, R.; Ubiennykh, A. «Digital Twin» Technology in Medical Information Systems; Journal of Physics: Conference Series; IOP Publishing: Bristol, UK, 2020; Volume 1515, p. 052022. [Google Scholar]
- Raes, L.; Michiels, P.; Adolphi, T.; Tampere, C.; Dalianis, T.; Mcaleer, S.; Kogut, P. DUET: A Framework for Building Secure and Trusted Digital Twins of Smart Cities. IEEE Internet Comput. 2021. [Google Scholar] [CrossRef]
- Kuller, M.; Kohlmorgen, F.; Karaoğlan, N.; Niemeyer, M.; Kunold, I.; Wöhrle, H. Conceptual design of a digital twin based on semantic web technologies in the smart home context. In Proceedings of the 2020 IEEE 3rd International Conference and Workshop in Óbuda on Electrical and Power Engineering (CANDO-EPE), Budapest, Hungary, 18–19 November 2020; pp. 000167–000172. [Google Scholar]
- Maryasin, O. Home Automation System Ontology for Digital Building Twin. In Proceedings of the 2019 XXI International Conference Complex Systems: Control and Modeling Problems (CSCMP), Samara, Russia, 3–6 September 2019; pp. 70–74. [Google Scholar]
- Raggett, D. The web of things: Challenges and opportunities. Computer 2015, 48, 26–32. [Google Scholar] [CrossRef]
- Goddard, M. The EU General Data Protection Regulation (GDPR): European regulation that has a global impact. Int. J. Mark. Res. 2017, 59, 703–705. [Google Scholar] [CrossRef]
- Pinheiro, P.P. Proteção de Dados Pessoais: Comentários à Lei n. 13.709/2018-LGPD; Saraiva Educação SA: São Paulo, Brazil, 2020. [Google Scholar]
- Arakaki, R.; Hayashi, V.T.; Ruggiero, W.V. Available and Fault Tolerant IoT System: Applying Quality Engineering Method. In Proceedings of the 2020 International Conference on Electrical, Communication, and Computer Engineering (ICECCE), Istanbul, Turkey, 12–13 June 2020; pp. 1–6. [Google Scholar]
- Chen, T.; Guestrin, C. XGBoost: A scalable tree boosting system. In Proceedings of the ACM SIGKDD International Conference on Knowledge Discovery and Data Mining, San Francisco, CA, USA, 13–17 August 2016; pp. 785–794. [Google Scholar]
- Burleyson, C.D.; Rahman, A.; Rice, J.S.; Smith, A.D.; Voisin, N. Multiscale effects masked the impact of the COVID-19 pandemic on electricity demand in the United States. Appl. Energy 2021, 304, 117711. [Google Scholar] [CrossRef]
- Plotly Technologies Inc. Dash; Plotly Technologies Inc.: Montreal, QC, Canada, 2021. [Google Scholar]
- Ashton, K. That ‘internet of things’ thing. RFID J. 2009, 22, 97–114. [Google Scholar]
- Beck, K. Test-Driven Development: By Example; Addison-Wesley Professional: Upper Saddle River, NJ, USA, 2003. [Google Scholar]


| Paper | # of Houses | Appliance Data | Models Used | Metrics | Time Granularity | Forecast Horizon | Experiment Period |
|---|---|---|---|---|---|---|---|
| [6] | 25 | no | SVR, ANN | NRMSE | 30 min | 1–24 h | 18 months |
| [8] | 27 | no | Gradient boosting | RMSE | 30 min | 1– 24 h | 35 months |
| [23] | 7 | yes | Multiple | MAPE | 15–60 min | 15–1440 min | 9 months |
| [21] | 1 | yes | LSTM | MAPE | 30 min | 30 min | 24 months |
| [24] | 20 | no | Hierarchical | NMAE, NQS | hourly | 24 h | 12 months |
| [25] | 93 | no | ANN | R2, MAPE, SDE | hourly | 1–24 h | 17 months |
| Aspect | Conventional | Using Digital Twin |
|---|---|---|
| Database entities (energy consumption data) | Energy-consumption registers Database entities: 1. House; 2. User (energy consumer); 3. Family (people and energy consumer); 4. Convenience (places of the house); 5. Electrical appliances; 6. IoT devices. | Digital space implementing real world elements as software objects from Digital Twin mechanisms includes the following: 1. A digital object of the house; 2. A digital object of user-consumer; 3. A digital object of each family member (energy consumers); 4. A digital object of each convenience (each one with energy consumer devices); 5. A digital object of electrical appliances; 6. A digital object of each IoT device. |
| Data titular and controller (According to the Brazilian’s LGPD law) | All data stored as registers of a centralized database, and operated by the digital platform. Each data titular can go along only with his/her registers processing. | Each digital twin stores the corresponding data collected. According to law requirements, the user owns data and acts as titular and controller, in cooperation with the platform that acts as a data operator. |
| Real-time data (IoT) | Registers on database (events): 7. Timestamp; 8. Measurements; 9. IoT devices; 10. Relationship (House, User-consumer, Convenience). | Digital software objects register their own collected events: Convenience(4), Electrical appliance(5), and IoT device (6): 7. TimeStamp (4) (5) (6); 8. Measurements (4) (5) (6). |
| Natural language for information obtained from the user | The centralized database registers provides information in the right column table. | Each digital software objects register data provided by the user, connecting directly to digital twin implementation (house, user- consumer, convenience, electrical appliance, and IoT device) |
| Machine Learning (e.g., Chatbot) | Historical data include talking with limited and centralized memory. The conversational interaction is almost repetitive and focused on a set of users profiles. | With the digital twin, all interaction and memorization connect the correct user. In this implementation, the more historical data, the more maturity accomplished. |
| Machine Learning (Prediction) | Machine Learning implemented for: 11. Learning and showing seasonal information, using events data; 12. Predicting energy-consuming data, using events data. All data parametrization refers to sets of the same profile user. | Machine Learning parameters mapping directly for each digital twin software objects; that is, all data and all objects relations of real-world elements (house, user, family, conveniences, appliances, and IoT): 9. Learn and show seasonal data with precision and helpful information; 10. Predict energy-consumption data with precision according to all parameters related to his software objects. |
| Data organization | Huge centralized database, where sets of user-profile foundation to process intelligent services. | A federation of databases. Each database corresponds to one group of user-consumer implementing digital twin of real-world energy consumers. |
| Model | MSE | Adjusted Error |
|---|---|---|
| Reference Model | 0.0479 (0%) | 0.2535 (0%) |
| Reference + 1st Derivative | 0.0476 (−0.62%) | 0.2529 (−0.24%) |
| Reference + Indoor Temperature | 0.0502 (+4.80%) | 0.2568 (+1.30%) |
| Reference + Consumption from 25 and 23 h ago | 0.0415 (−13.36%) | 0.2043 (−19.40%) |
| Category | Test 1 | Test 2 | Test 3 | Test 4 | Test 5 | Test 6 | Test 7 |
|---|---|---|---|---|---|---|---|
| Data | A | M | M | N/A | N/A | A | M |
| Model | A | N/A | A | A | M | M | - |
| Infrastructure | A | - | - | A | M | N/A | - |
| Monitoring | - | A | N/A | A | M | A | - |
| Paper | # of Houses | Appliance Data | Models Used | Metrics | Time Granularity | Forecast Horizon | Experiment Period |
|---|---|---|---|---|---|---|---|
| [6] | 25 | no | SVR, ANN | NRMSE | 30 min | 1–24 h | 18 months |
| [8] | 27 | no | Gradient boosting | RMSE | 30 min | 1–24 h | 35 months |
| [23] | 7 | yes | Multiple | MAPE | 15–60 min | 15–1440 min | 9 months |
| [21] | 1 | yes | LSTM | MAPE | 30 min | 30 min | 24 months |
| [24] | 20 | no | Hierarchical | NMAE, NQS | hourly | 24 h | 12 months |
| [25] | 93 | no | ANN | R2, MAPE, SDE | hourly | 1–24 h | 17 months |
| Wiseful | 4 | yes | Gradient Boosting | MSE, NMSE | 1–1440 min | 15–1440 min | 19 months |
Publisher’s Note: MDPI stays neutral with regard to jurisdictional claims in published maps and institutional affiliations. |
© 2021 by the authors. Licensee MDPI, Basel, Switzerland. This article is an open access article distributed under the terms and conditions of the Creative Commons Attribution (CC BY) license (https://creativecommons.org/licenses/by/4.0/).
Share and Cite
Fujii, T.Y.; Hayashi, V.T.; Arakaki, R.; Ruggiero, W.V.; Bulla, R., Jr.; Hayashi, F.H.; Khalil, K.A. A Digital Twin Architecture Model Applied with MLOps Techniques to Improve Short-Term Energy Consumption Prediction. Machines 2022, 10, 23. https://doi.org/10.3390/machines10010023
Fujii TY, Hayashi VT, Arakaki R, Ruggiero WV, Bulla R Jr., Hayashi FH, Khalil KA. A Digital Twin Architecture Model Applied with MLOps Techniques to Improve Short-Term Energy Consumption Prediction. Machines. 2022; 10(1):23. https://doi.org/10.3390/machines10010023
Chicago/Turabian StyleFujii, Tiago Yukio, Victor Takashi Hayashi, Reginaldo Arakaki, Wilson Vicente Ruggiero, Romeo Bulla, Jr., Fabio Hirotsugu Hayashi, and Khalil Ahmad Khalil. 2022. "A Digital Twin Architecture Model Applied with MLOps Techniques to Improve Short-Term Energy Consumption Prediction" Machines 10, no. 1: 23. https://doi.org/10.3390/machines10010023