Article

A Performance Prediction Method for a High-Precision Servo Valve Supported by Digital Twin Assembly-Commissioning

1
College of Mechanical Engineering, Donghua University, Shanghai 201620, China
2
Department of Mechanical Engineering, Auckland University, Auckland 1010, New Zealand
*
Author to whom correspondence should be addressed.
Machines 2022, 10(1), 11; https://doi.org/10.3390/machines10010011
Submission received: 3 November 2021 / Revised: 15 December 2021 / Accepted: 21 December 2021 / Published: 23 December 2021
(This article belongs to the Special Issue Industrial Informatics and Digital Twin)

Abstract

:
The manufacturing of a high-precision servo valve belongs to multi-variety, small-batch, and customized production modes. In the process of assembly and commissioning, various characteristic parameters are critical indicators to measure product performance. To meet the performance requirements of a high-precision servo valve, the traditional method usually relies on the test bench and manual experience for continuous trial and error commissioning, which significantly prolongs the whole assembly-commissioning cycle. Therefore, this paper proposed a performance prediction method for a high-precision servo valve supported by digital twin assembly-commissioning. Firstly, the cloud-edge computing network is deployed in the digital twin assembly-commissioning system to improve the efficiency and flexibility of data processing. Secondly, the method workflow of performance prediction is described. In order to improve the accuracy of measurement data, a data correction method based on model simulation and gross error processing is proposed. Aiming at the problem of high input dimension of the prediction model, a key assembly feature parameters (KAFPs) selection method, based on information entropy (IE), is proposed and given interpretability. Additionally, to avoid the poor prediction accuracy caused by small sample data, a performance prediction method based on TrAdaboost was utilized. Finally, the hysteresis characteristic commissioning of a high-precision servo valve is taken as an example to verify the application. The results indicate that the proposed method would enable accurate performance prediction and fast iteration of commissioning decisions.

1. Introduction

With the rapid development of high-precision manufacturing technology, high-precision servo valves are widely used in aerospace, watercraft, and automotive industries. In order to meet the quality requirements of a high-precision servo valve, assembly and commissioning are required. Among them, the geometric accuracy requirements are met through the assembly process, and the performance accuracy requirements are met through commissioning, as shown in Figure 1. In the assembly-commissioning of a high-precision servo valve, various characteristic parameters (such as hysteresis, nonlinearity, zero bias, etc.) are important indicators to measure the product performance. The traditional assembly-commissioning method is based on repeated tests and manual experience, resulting in poor quality and low efficiency. Therefore, it is of great significance to study a fast and accurate performance prediction method to assist commissioning decision-making in improving the assembly-commissioning efficiency of a high-precision servo valve.
At present, the construction of the prediction model includes the physical method and data-driven method [1]. Generally, there is an uncertain and nonlinear relationship between the performance of a high-precision servo valve and assembly characteristic parameters. Physical methods are complicated to comprehensively describe the complex mapping relationship, resulting in poor prediction accuracy. With the rapid development of digital measurement technology and machine-learning algorithms in recent years, data-driven prediction technology has become a research hotspot. Feng et al. proposed an integrated prediction method of assembly quality based on edge computing [2]. Diao et al. proposed a quality prediction method for purifier carrier products based on improved principal component analysis and a modified support vector machine [3]. Wei et al. proposed a kernel-based hybrid manifold learning and support vector machine algorithm for aero-engine product quality prediction. The data-driven prediction method is based on the algorithm model [4]. When the measurement data are insufficient or inaccurate, the algorithm model only depends on the previously collected data, significantly affecting the prediction results [5]. Although a data-driven prediction algorithm has been widely used in product assembly, it has defects due to the lack of connection between prediction solution and decision-making.
In recent years, the digital twin has been widely promoted as a critical technology to realize intelligent manufacturing [6]. Digital twin assembly-commissioning is a new generation of intelligent assembly-commissioning technology [7,8]. Based on the digital information model and driven by the twin data of the assembly-commissioning context, digital twin assembly-commissioning uses intelligent prediction, monitoring and decision-making to realize the quality control of the geometry and performance of high-precision products. Digital twin not only relies on the measured data to predict the quality deviation from the theoretical operation but also provides a comprehensive method to interpret and integrate the collected data in the virtual space. Based on the continuous adaptation to the changes of environment and operating conditions, the digital twin high-fidelity model provides a solution for accurate performance prediction and commissioning decision-making of complex assembly. In addition to establishing a high-fidelity model reflecting physical products, the efficient processing and analysis of twin data is also an important challenge. The existing high-precision servo valve assembly workshop usually only deploys the cloud center to process and analyze the data. However, there are a large number of data acquisition points and analysis models in the assembly process of high-precision products, which makes it inefficient and economical to transmit all data to the cloud through the network. In the edge computing architecture, all the data collected in the physical space no longer need to be uploaded to the cloud center. Still, some data can be processed quickly by deploying in the network edge nodes. In this way, the pressure of network broadband can be greatly reduced. Therefore, to reduce the data transmission delay and retain the high-performance computing of digital twin assembly, the use of edge computing is an effective solution to realize fast processing and flexible computing of twin data [9].
This paper presents a digital twin system framework for predicting the assembly-commissioning performance of a high-precision servo valve. In the framework, data storage, geometric model construction (or reuse), and integrated algorithm model construction are generated through the cloud center. Edge computing is used for data processing, performance prediction, and commissioning decision guidance. In the prediction process of high-precision servo valves, the main problems solved in this paper are summarized as follows:
(1) To improve the accuracy of measurement data, the measurement data are corrected by high fidelity digital twin model simulation and gross error processing.
(2) To reduce the data dimension of the prediction model, the IE method is used to select the KAFPs that affect the assembly performance index. Moreover, the KAFPs selection process is interpretable.
(3) To avoid the model overfitting caused by small sample data, a TrAdaboost prediction algorithm model is proposed. In addition, the commissioning decision is assisted according to the prediction results.
The rest of this paper is organized as follows: Section 2 introduces the literature review of digital twin assembly, cloud edge computing, and digital measurement. Section 3 proposes the performance prediction framework and method workflow supported by digital twin assembly-commissioning technology in detail. In Section 4, the hysteresis characteristic of a double-nozzle flapper servo valve is taken as an example to verify the effectiveness of the prediction method in this paper. Finally, Section 5 concludes and outlines future work.

2. Related Work

In this section, we mainly summarize the current digital twin assembly methods, digital twin and cloud-edge computing, and digital measurement methods to support the research of this paper.

2.1. Digital Twin-Based Assembly Method

The concept of the digital twin was first proposed by Grieves in a whole life cycle class at the University of Michigan, and is defined as a “virtual digital expression equivalent to physical products” [10,11]. To more precisely describe the concept of the digital twin, Tao et al. believe that digital twin is a simulation process that makes full use of the physical model, sensor update, operation history, and other data; integrates multi-disciplinary, multi-physical quantity, multi-scale and multi probability; and completes mapping in a virtual space, to reflect the whole life cycle process of corresponding physical equipment [6]. In recent years, digital twin technology has been widely used in various fields. At present, the application of digital twin technology in product assembly has achieved experimental research results.
In terms of system framework: Tao et al. introduced the product assembly method based on digital twin and discussed the key technologies involved in the development of the cyber-physical fusion system for complex product assembly processes [12]. Taking aviation complex products as the research object, Liu et al. proposed an intelligent management and control framework of assembly workshops based on digital twin [13]. Luis et al. present a novel methodology for process automation design, enhanced implementation, and real-time monitoring in operation based on creating a digital twin of the manufacturing process with an immediate virtual-reality interface to be used as a virtual test before the physical implementation [14]. Guo et al. proposed an assembly island manufacturing system based on digital twin technology, which takes digital twin service as an enabling technology [15]. Yi et al. proposed a digital twin reference model for intelligent assembly process design and built a three-tier intelligent assembly application framework based on digital twin [16]. In constructing the digital twin model: In order to realize the difficult transition of digital twins from conceptual model to virtual representation, Gregorio et al. proposed a hybrid representation of integrated digital twin, which uses the digital twin model to manage the geometric deviation in the assembly process [17]. Polini et al. investigated a digital twin tool to manage the geometric changes of parts from manufacturing to assembly [18]. A digital twin derived from a digital product description will automatically perform assembly planning and orchestrate the production resources in a manufacturing cell. Seppo et al. proposed a digital twin model derived from digital products, which can automatically execute the assembly plan and coordinate the production resources in the manufacturing unit [19]. Sun et al. [7] introduced a product digital twin model construction method including all assembly elements.
In the design stage of the servo valve, virtual simulation technology is usually used to plan and verify the assembly process. However, in the actual assembly stage, virtual space and physical space are independent of each other. The determination of assembly process parameters and commissioning decisions completely depends on manual experience (Brief process: first, obtain the test data on the experimental bench. Then, the performance index is calculated. Finally, trial and error commissioning are carried out according to manual experience until the performance index is met), which leads to low assembly efficiency. The application of digital twin technology in product assembly can quickly break through the bottleneck of current virtual assembly technology and realize the iterative interaction of virtual and real assembly spaces. The servo valve digital twin model can evolve dynamically with the assembly process in establishing servo valve digital twin assembly-commissioning systems. The analysis of the collected physical assembly process data is helpful to assist the intelligent decision-making of the commissioning process.

2.2. Digital Twin and Cloud-Edge Computing

With the development of intelligent sensors and the industrial Internet of things, intelligent assembly workshop needs to adopt high-performance methods to collect and process a large amount of data collected from the field. As a remote data processing architecture, cloud computing allows massive data processing in remote data centers [20]. However, cloud computing technology has challenges in meeting the requirements of real-time response and extensive data transmission. In the edge computing architecture, user data no longer need to be uploaded to the cloud data center. However, it can be processed quickly through the edge nodes deployed at the edge of the network, which dramatically reduces the pressure of network bandwidth and the energy consumption of intelligent devices at the edge of the network. To take the advantage of cloud computing and edge computing, cloud edge collaboration, as a new computing model, has become a new research trend [21]. With the increase of data-intensive applications and computing-intensive applications, it is necessary to use the mighty computing power of cloud computing, the response characteristics of communication resources, and short-time transmission of edge computing to realize and complete the corresponding application requests. Through cloud-edge collaboration, the value of edge computing and cloud computing is maximized to improve the performance of applications [22] effectively. For example, Xu et al. proposed a cloud-edge collaborative computing framework that can be used in distributed neural networks, improving task scheduling algorithms’ adaptive ability [23]. Aiming at the requirements of cloud processing and analysis and real-time edge computing of massive manufacturing data generated by a large number of IoT devices at the bottom of the intelligent factory, a cloud-edge collaboration-based intelligent factory industrial IoT architecture and the configuration method of edge nodes and cloud application services are proposed [24]. Song et al. proposed a cloud edge collaborative intelligent method for object detection. It was applied to emulator string-recognition defect detection in power IoT [25].
In a digital twin system, edge computing complements cloud computing by allowing dynamic storage, transmission, and processing of high-frequency physical system data between edge and cloud. This system flexibility is suitable for industrial environments that require high-speed synchronization and real-time response. Tao et al. proposed a cell-level digital twin architecture based on cloud computing, fog computing and edge computing [21]. Huang et al. provided a feasible method to ensure high-performance anomaly detection by implementing digital twinning technology in dynamic industrial edge/cloud networks [9]. However, the digital twin assembly technology based on edge calculation lacks concrete implementation in the field of high-precision product assembly. Therefore, we further introduce cloud-edge computing into the digital twin assembly-commissioning system of servo valves, to accelerate the data processing efficiency and flexibility of the system.

2.3. Digital Measurement

The digital measurement is the technology based on the digitalized models, supported by the digital measurement devices (i.e., laser scanners, radar scanners, etc.), which is capable of automatic, rapid and precise measurement of assembly feature parameters. Jafar et al. took the lead in applying digital measurement technology to aircraft flexible docking [26,27]. Maropoulos et al. proposed measurement-assisted assembly (MAA) technology, which realizes the flexibility measurement of crucial features in the assembly process of complex products [28]. Compared with traditional measurement technology, MAA significantly improves measurement accuracy and efficiency. In order to improve the success rate of one-time assembly in the actual assembly scene, Cui et al. studied the assemblability of large-scale parts by analyzing the assembly measurement data of actual parts [29]. Bao et al. registered the key features of the MBD model and point cloud model through digital measurement technology in the assembly process, to build a semi-physical model containing actual geometric information [30]. To improve the assembly efficiency of aircraft large-size components, Chen et al. proposed a new measurement-aided assembly method to realize process integration and data fusion based on key measurement features [31]. Wang et al. proposed an optimal pose calculation method using digital measurement technology to obtain the assembly clearance of wing assembly [32].
With the continuous improvement of the accuracy and efficiency of digital measurement equipment, digital measurement technology has become an essential auxiliary assembly technology. In the digital twin assembly-commissioning system of servo valves, digital measurement technology replaces the traditional manual measurement method to realize the accurate and rapid collection of product assembly process data. For example, the traditional assembly clearance methods usually use a feeler gauge or visual inspection. This has poor measurement accuracy and low measurement efficiency and cannot obtain the whole picture of assembly clearance. In this paper, the measurement is carried out by a 3-dimensional (3D) laser scanner. Firstly, the measuring points of the two parts are obtained as the pose reference of the assembly. Before assembly, the butt-joint surface of the part is scanned by laser to get the point cloud data of the butt-joint surface and the coordinates of its auxiliary measurement points. Then, in the assembly process, the parts are driven for virtual assembly by the change of assembly pose of the measurement points. Finally, the clearance measurement is completed.

3. Performance Prediction Supported by Digital Twin Assembly-Commissioning

This section constructs the performance prediction framework supported by digital twin assembly-commissioning technology and describes the task deployment of the framework structure. In addition, this section briefly describes the method workflow for implementing performance prediction.

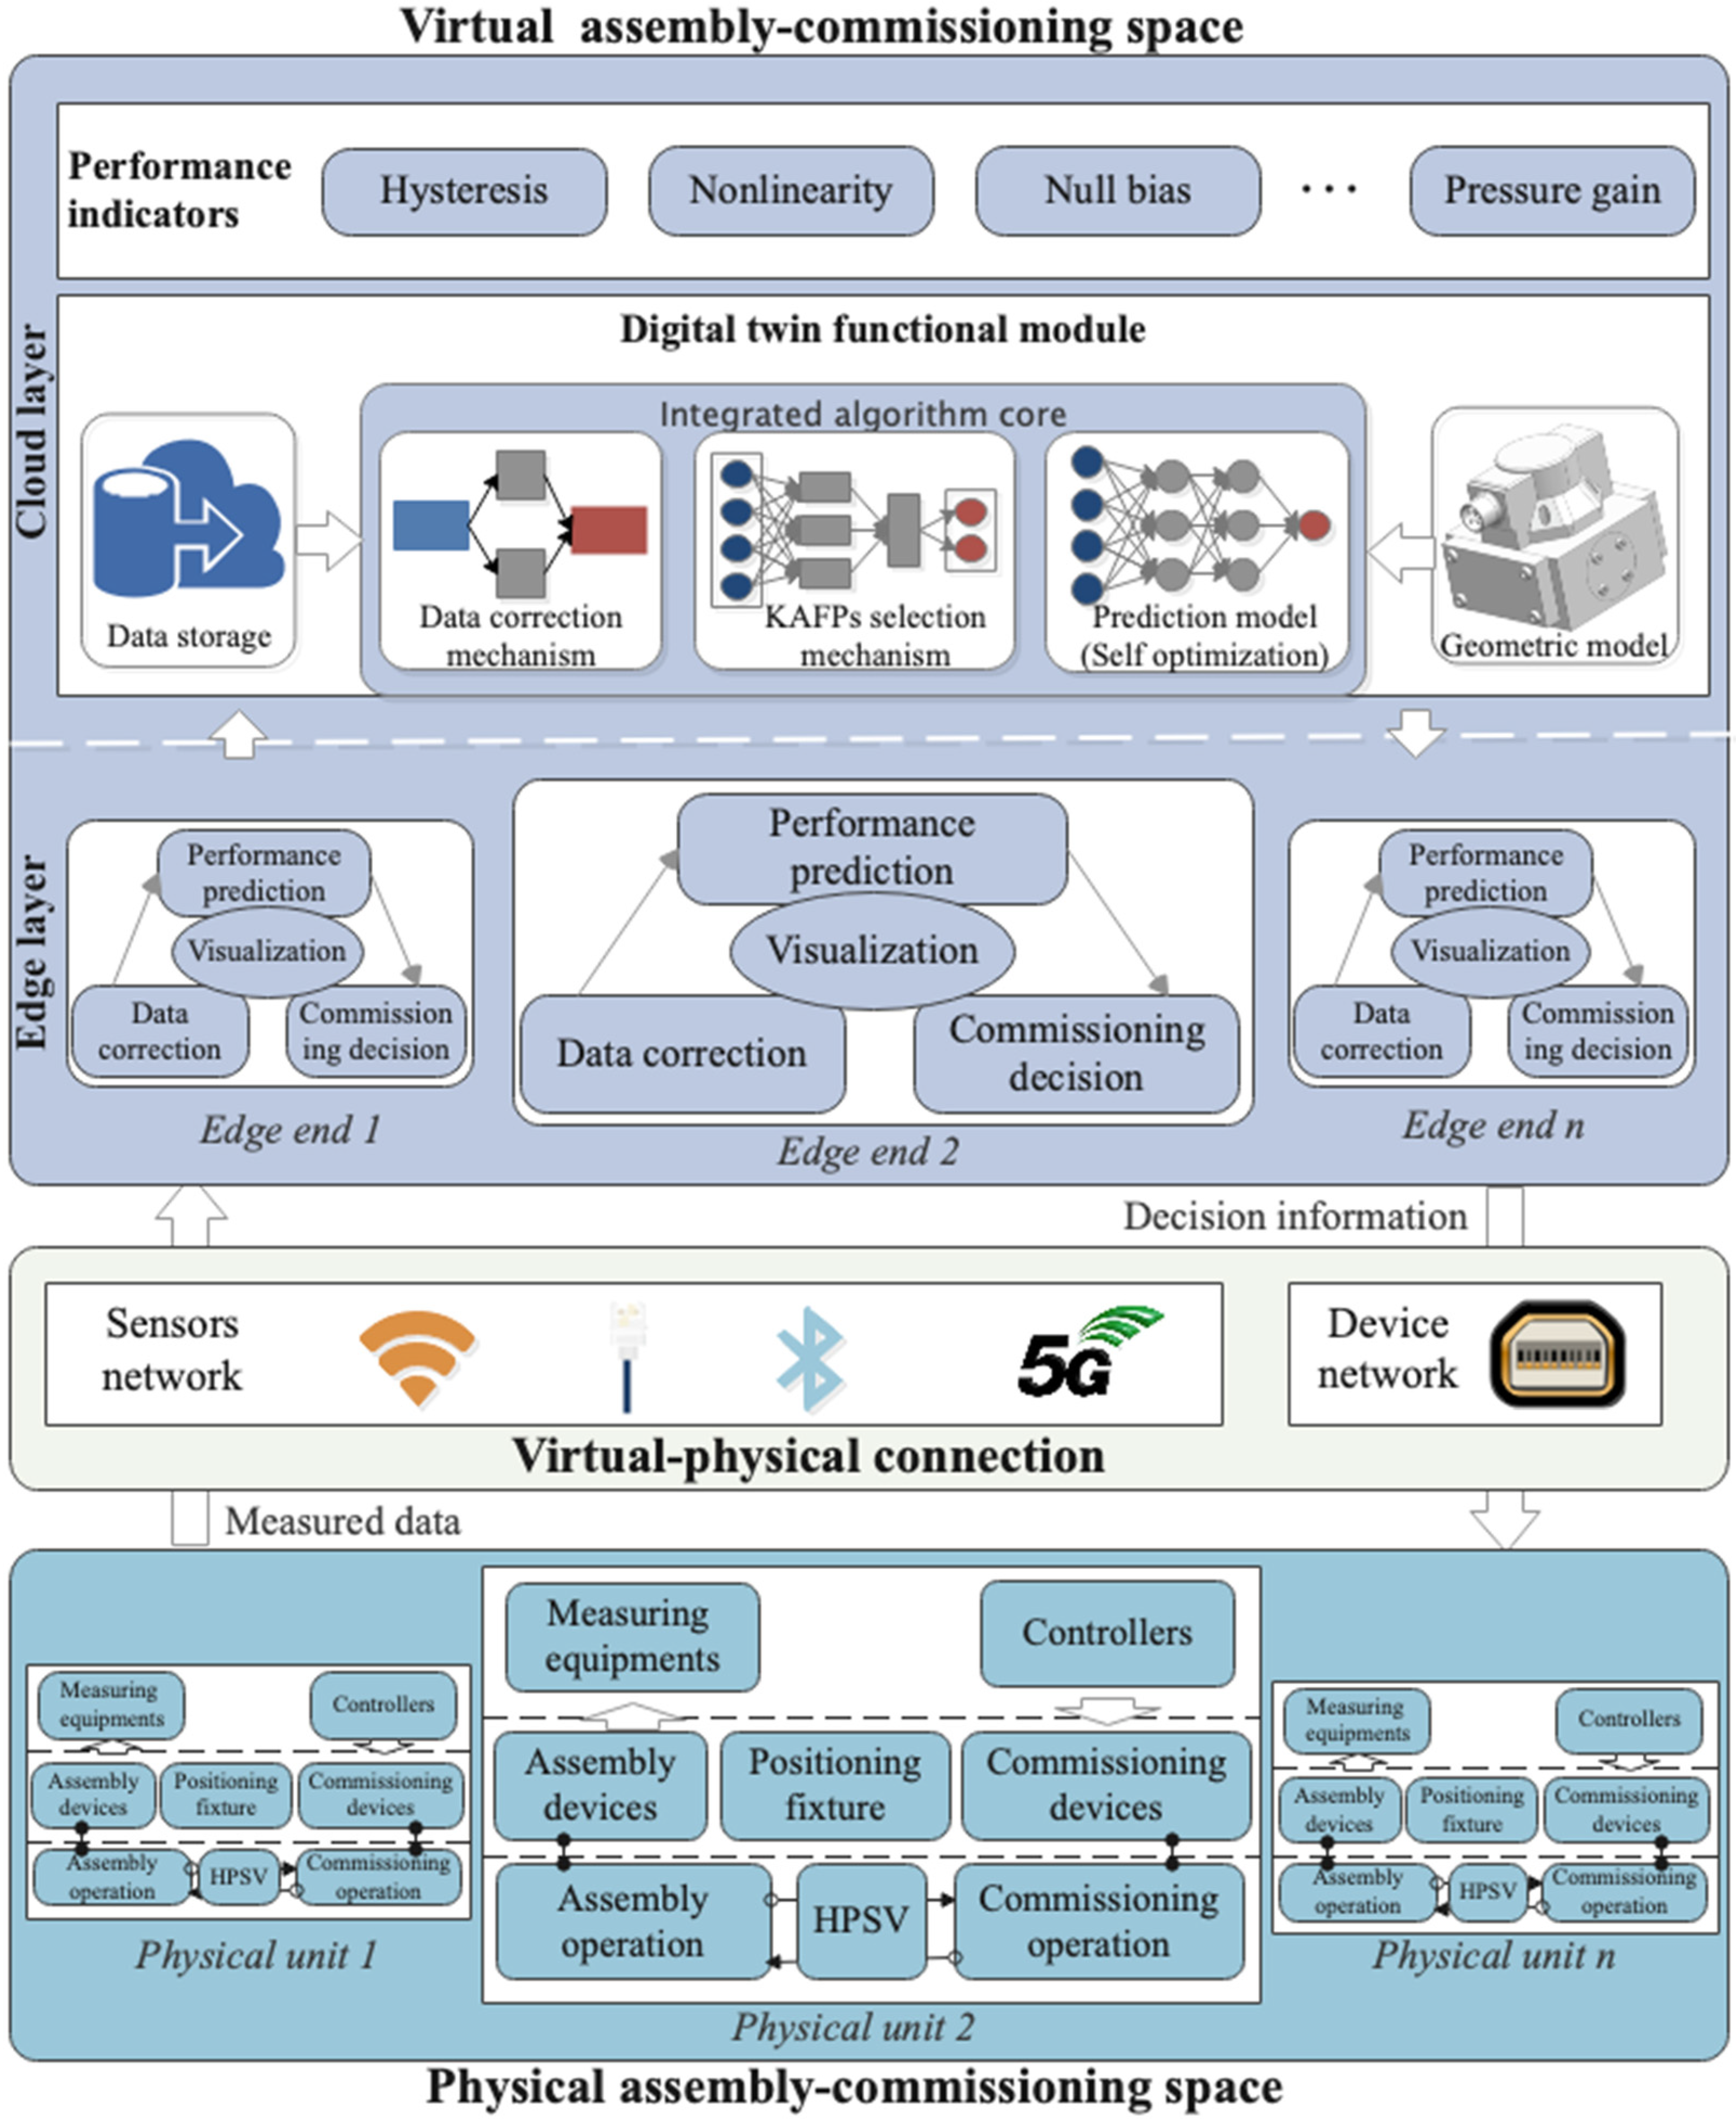
3.1. The Performance Prediction Framework

In the digital twin white paper, GRIEVES proposed a digital twin three-dimensional reference model including virtual space, physical space, and connection [10]. Based on the three-dimensional reference model, this section introduces the cloud-edge network deployment. We put forward the performance prediction framework of a high-precision servo valve supported by digital twin assembly-commissioning technology, as shown in Figure 2. The framework is divided into physical assembly-commissioning space, virtual-physical connection, and virtual assembly-commissioning space. Among them, the virtual assembly-commissioning space includes the edge layer and cloud layer.

3.1.1. Physical Assembly-Commissioning Space

The physical assembly-commissioning space aims to perform the assembly tasks (including assembly operations and commissioning operations) issued by the production plan. Compared with the traditional assembly workshop, the digital twin assembly workshop is equipped with the ability of interconnection and data fusion of multi-source heterogeneous elements, such as real-time perceptual access and interworking of data between device and device, or device and products [33]. Therefore, besides the original digital assembly device, several types of digital measurement equipment are utilized for data acquisition, i.e., binocular camera, 3D laser scanner, and torque sensor, etc. At the same time, the device controller receives the commissioning control command issued by the edge layer.

3.1.2. Virtual–Physical Connection

Virtual–physical connection is the link between physical and virtual assembly-commissioning spaces. Through virtual–physical connection, the data collected in the physical space is transmitted to the edge layer of the virtual space for processing and analysis. In addition, the commissioning decision information of the edge layer can also be sent to the physical space. The different assembly, commissioning, and measuring equipment have different data transmission modes in the data transmission process. Generally, the measuring equipment mainly includes Wi-Fi, Bluetooth, LAN, and other communication modes. The device controller is used for data interaction with the edge layer through the device network.

3.1.3. Virtual Assembly-Commissioning Space

The virtual assembly-commissioning space is the digital reconstruction and mapping of the physical assembly space. The introduction of edge computing and cloud computing technologies facilitates data processing and analysis processes.
(1) Cloud layer
The cloud has strong resource service capability. In this research, the cloud is used in three aspects: (1) Historical data storage: historical data can be stored in the cloud layer for a long time and can be recalled directly when in use. (2) Geometric model construction or reuse: the cloud layer can generate or reuse the geometric model according to the simulation requirements of the edge layer. (3) Integrated algorithm model construction: the measurement data correction mechanism, KAFPs selection mechanism and performance prediction model are generated. The mechanism established can participate in the training of the prediction model and then be applied to the performance prediction task of the edge layer. The optimal performance prediction model trained in the cloud layer can be directly downloaded to the edge layer for use. In addition, when the network is idle, the cloud can update the performance prediction model on a regular basis.
(2) Edge layer
Edge layer refers to the processing and analysis of data at the edge of the physical device. The introduction of distributed edge computing reduces the pressure on the network throughput of device and cloud, alleviates the data analysis load of cloud center, and improves the data analysis response efficiency. The edge layer is used for measurement data correction, online performance prediction, and commissioning decision. In addition, the edge layer supports assembly process simulation and real-time visualization. Different from the traditional ideal geometric model, the digital twin model established in the digital twin assembly system has the characteristic of high fidelity.

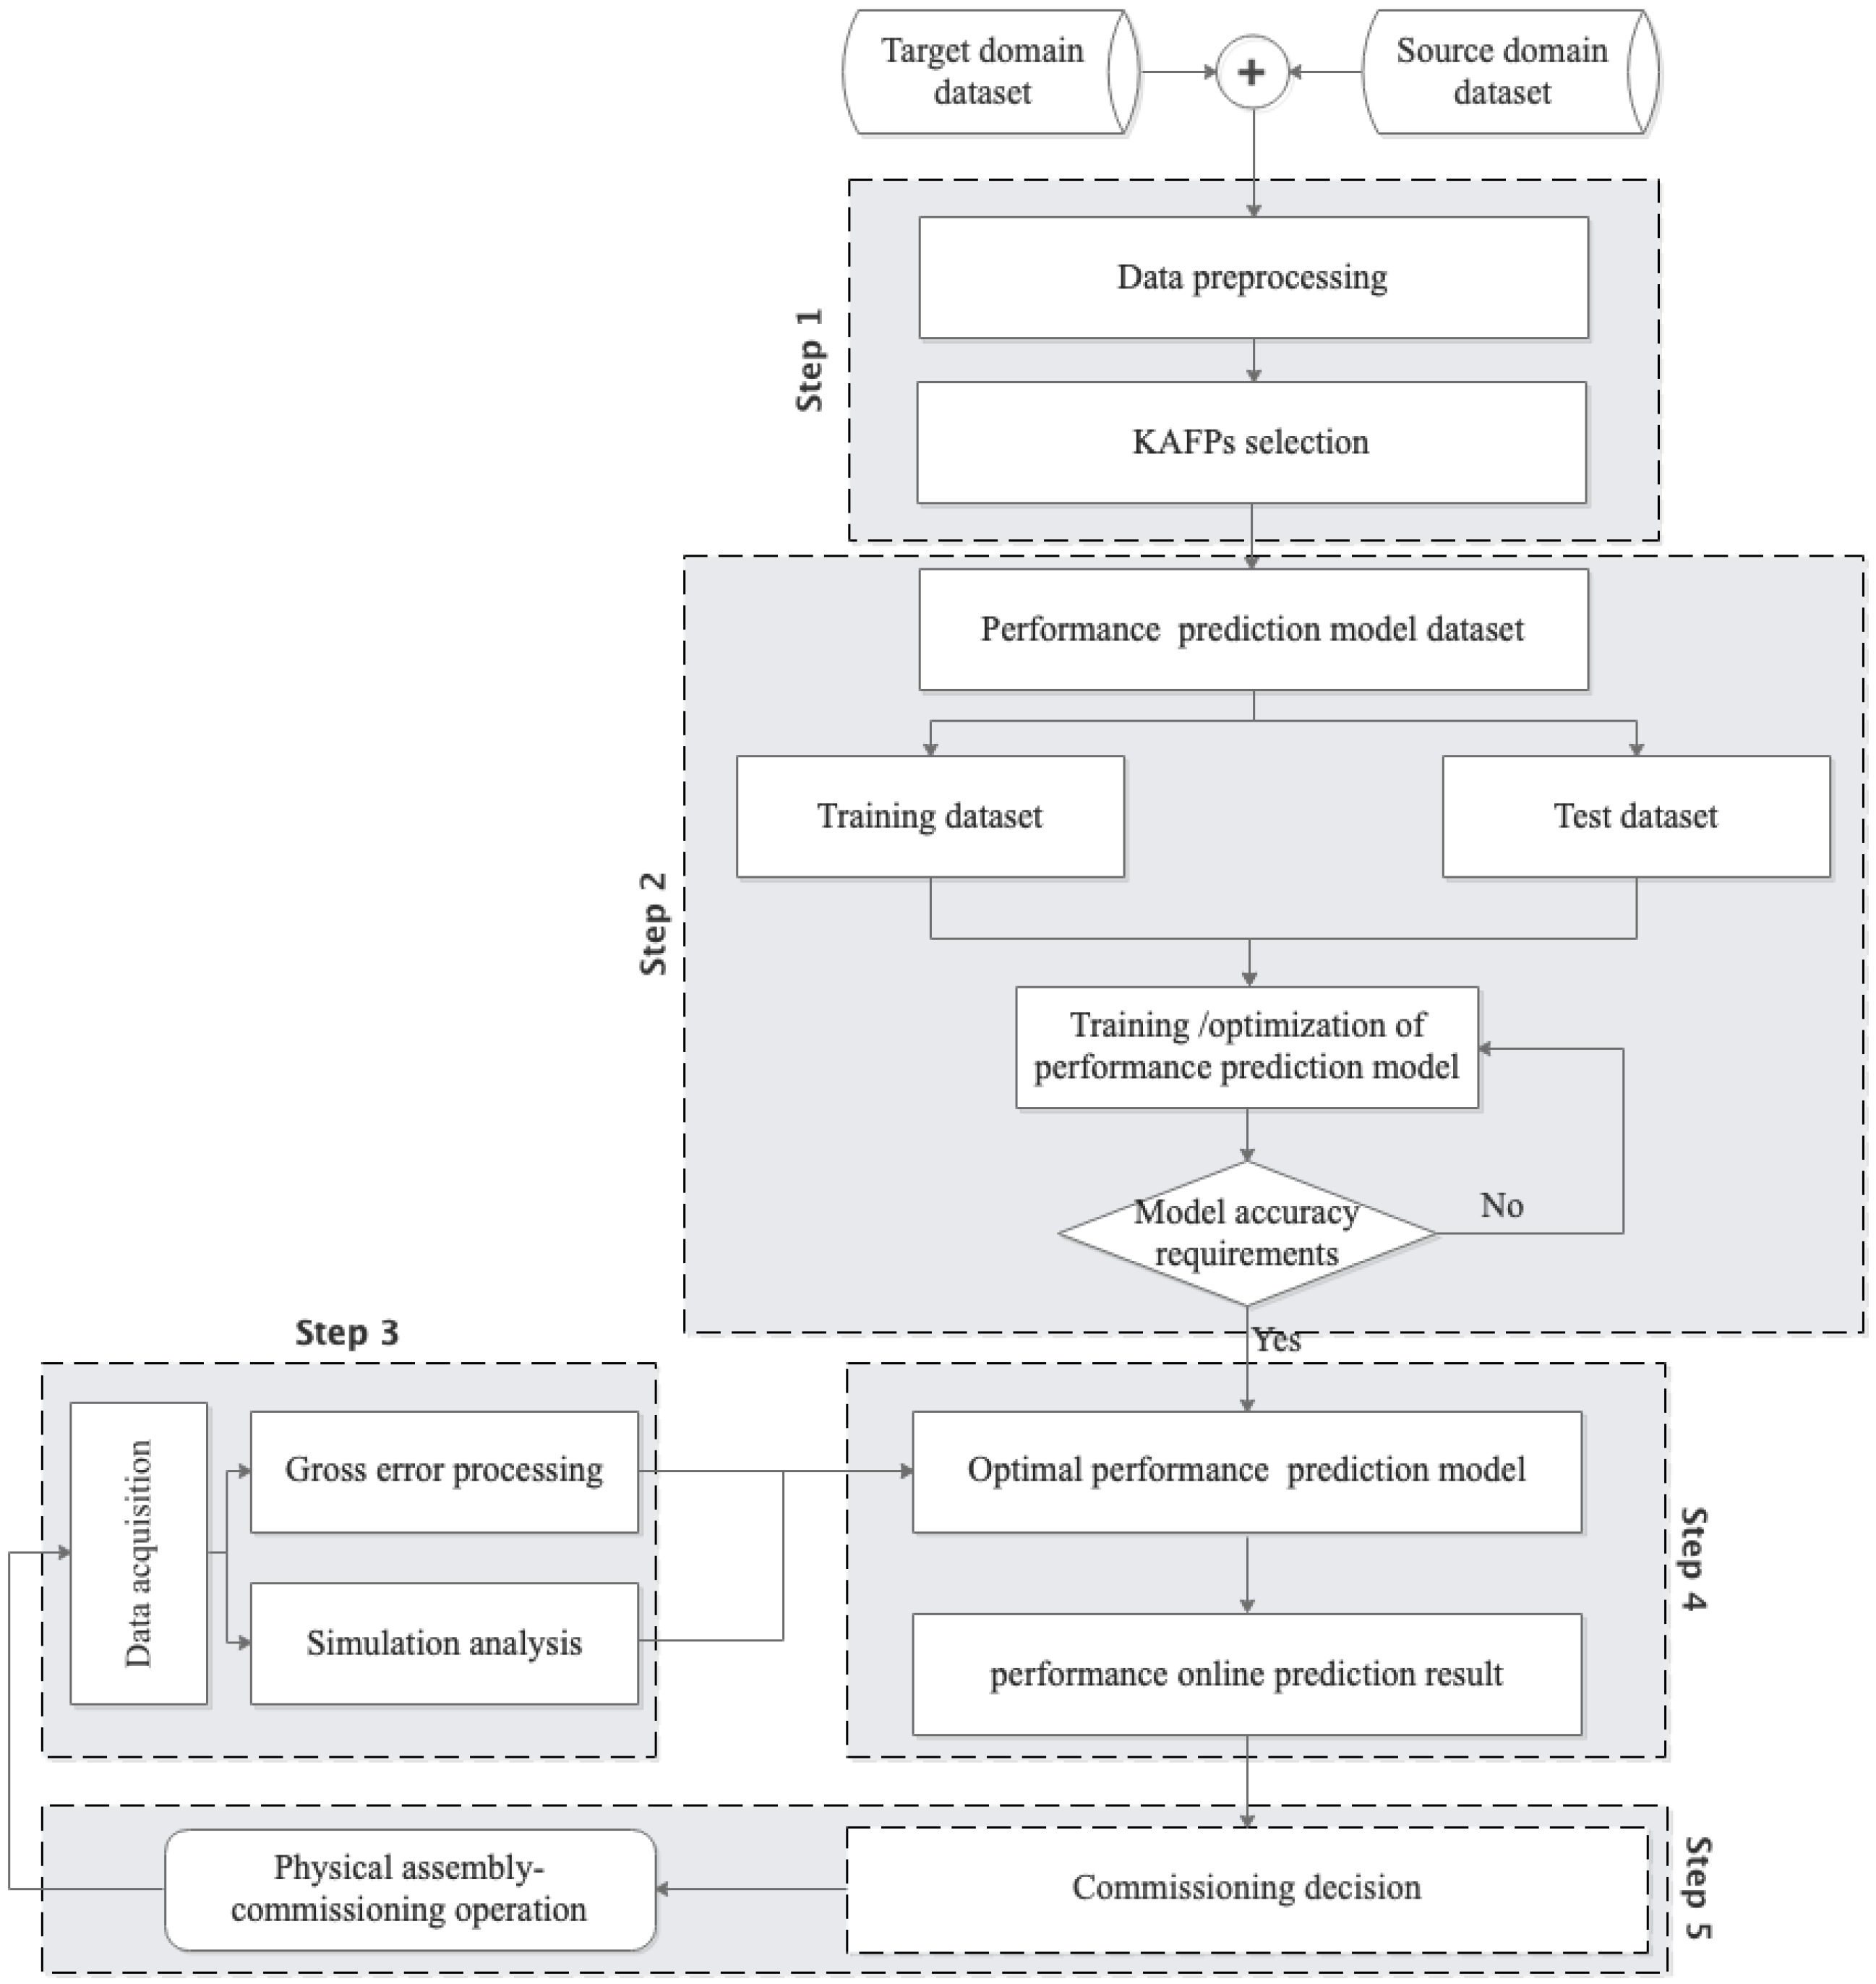
3.2. The Performance Prediction Workflow

This section introduces the performance prediction process supported by digital twin assembly-commissioning technology. As shown in Figure 3, the performance prediction process includes five steps: (1) selection of KAFPs, (2) construction and optimization of the performance prediction model, (3) measurement data acquisition and correction, (4) online performance prediction, and (5) commissioning decision.

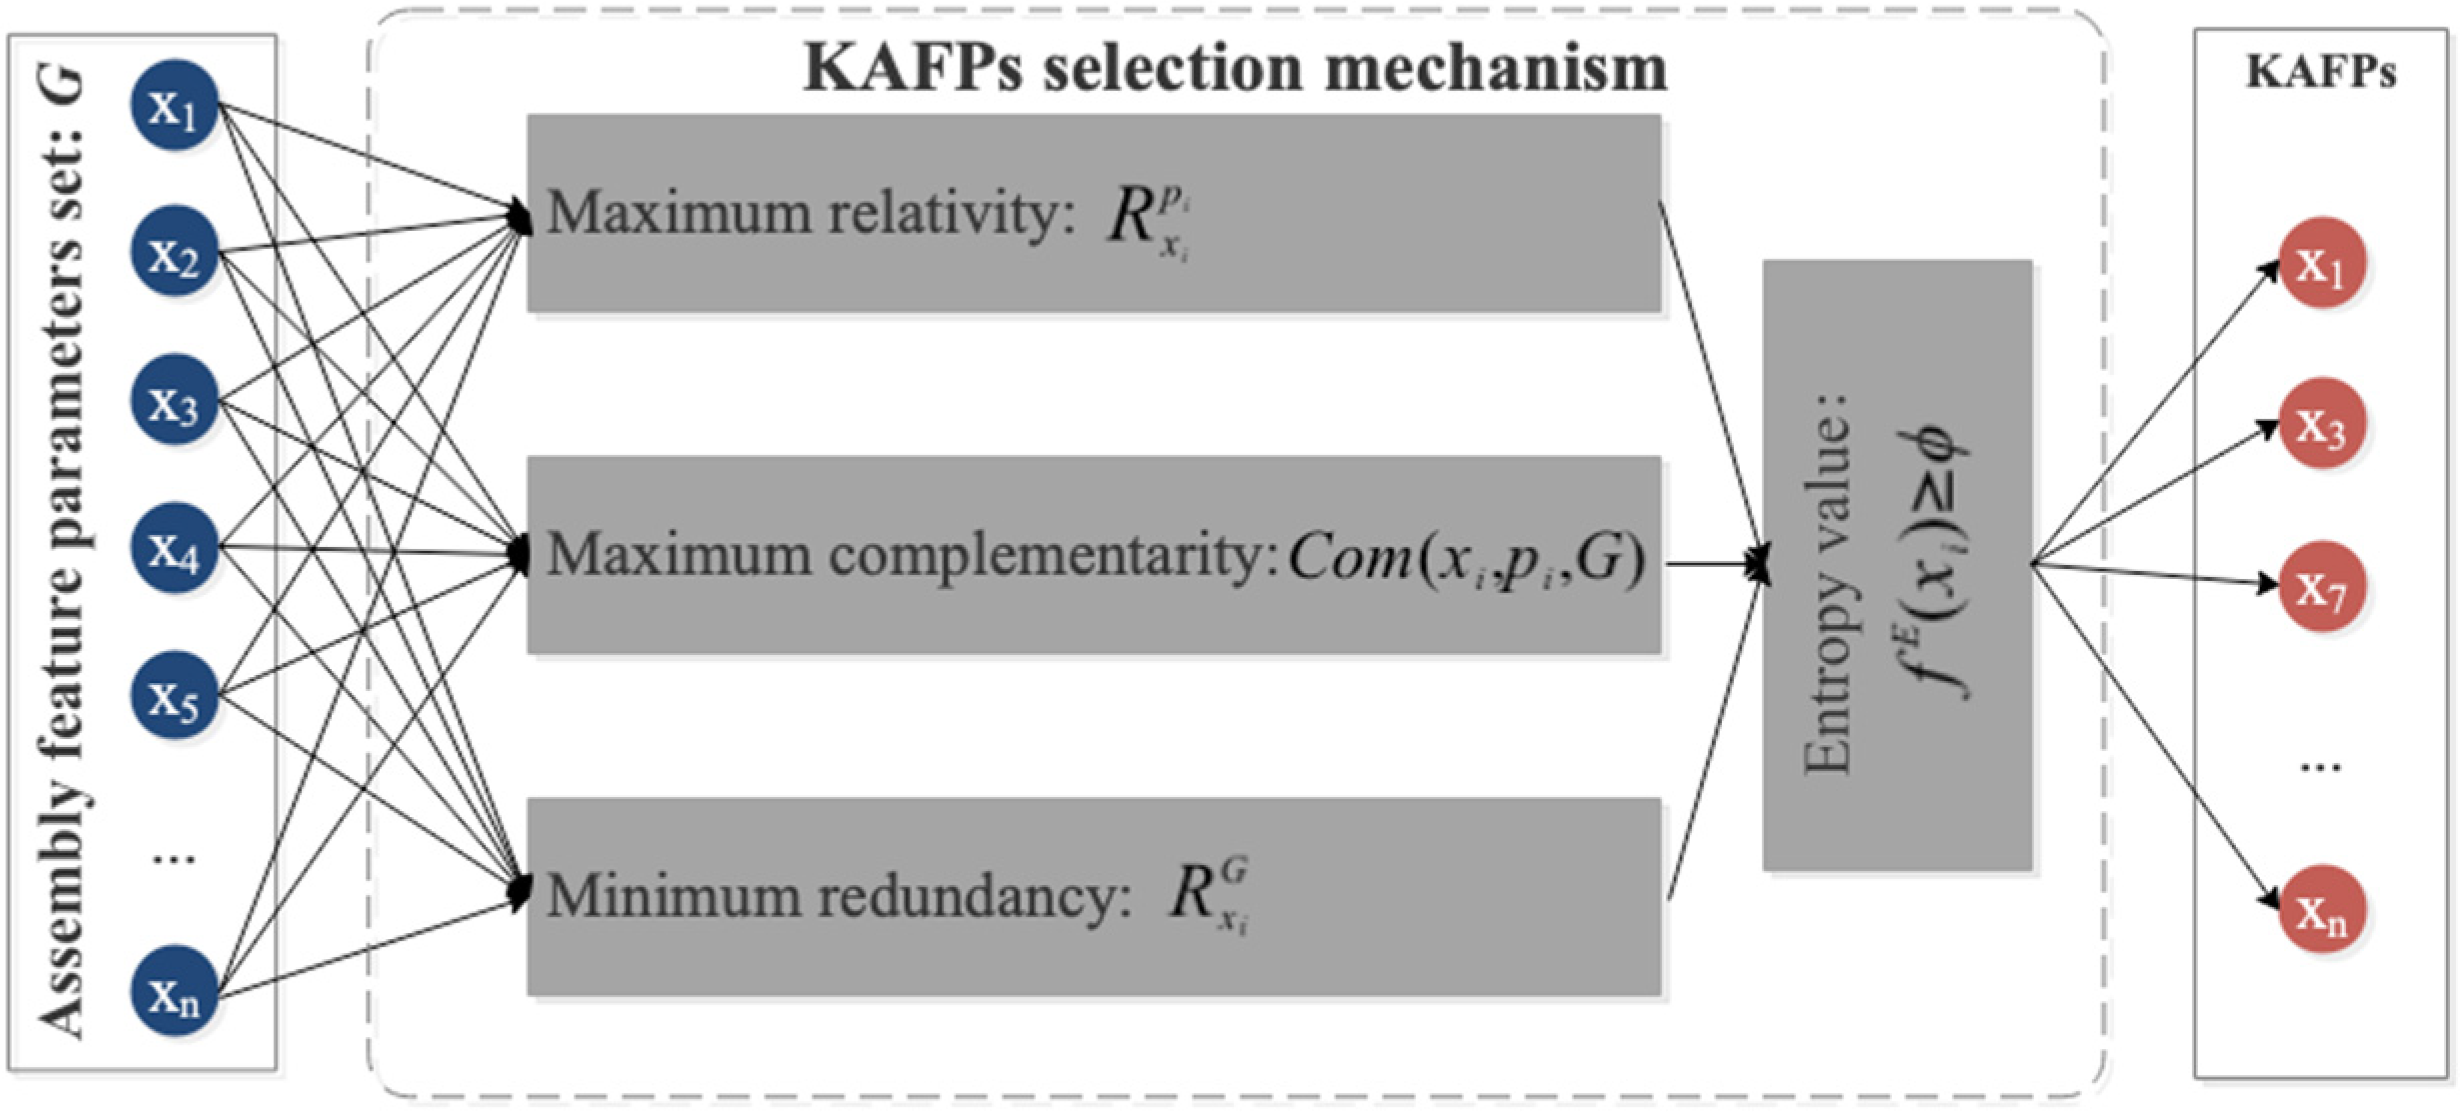
3.2.1. Selection of KAFPs

In the assembly-commissioning process of a high-precision servo valve, the assembly feature parameters to be measured increase with the number of parts and components involved in the assembly. However, most of the measured assembly feature parameters have a weak relationship with a particular performance index. Therefore, to improve the training accuracy and convergence speed of the model, it is necessary to select the KAFPs when constructing the data set. The KAFPs selection mechanism established in the cloud layer can not only be applied to the training process of the performance prediction model, but also realize the rapid extraction of input factors of a prediction model in the online prediction process of the edge layer. The KAFPs selection mechanism established in the cloud layer can be applied for the training of the performance prediction model and the rapid extraction of input factors for the prediction model in the edge layer.
The method based on IE measures the correlation between features by quantifying the uncertainty of the action law between features. It is suitable for the analysis of complex correlation [34] and makes the selection of KAFPs interpretable. This research utilizes IE for the selection of KAFPs. As shown in Figure 4, the entropy f E of KAFPs are designed based on comprehensive consideration of correlation, complementarity, and redundancy. When a performance index P and assembly feature parameters set are known, the correlation between assembly feature parameters and performance index is measured. The calculation method is shown in Equation (1). When the candidate parameters are the first assembly feature parameters identified, that is, the KAFPs set D is an empty set, the candidate parameters are screened only by the correlation between the candidate parameters x i and the performance index P . When the KAFPs set D is not empty, the assembly feature parameters with maximum correlation, maximum complementarity and minimum redundancy are selected by comprehensively considering three kinds of correlation relations.
f E ( x i ) = α × R x i P β × R x i D + ( 1 α β ) ( C o m ( x i , P , D ) )
where R x i P represents the correlation between candidate assembly feature parameters x i and P ; R x i D represents the redundancy between candidate x i and D ; C o m ( x i , P , D ) represents the complementarity of x i to the current D ; α and β is a weight variable, which is determined by the analysis of test results, and α , β , ( α + β ) [ 0 ,   1 ] .
(1) Correlation
In the process of measuring the correlation between x i and P , the correlation between x i and P refers to the ability of x i to explain the fluctuation of P accuracy. The correlation measurement can be measured by calculating the mutual information value between x i and P . The definition of correlation R x i P between x i and P is shown in Equation (2), where I ( x i ; P ) represents the mutual information value of x i and P .
R x i P = I ( x i ; P )
Mutual information describes the degree of interdependence between two variables, which measures the amount of standard information between two variables. It can be regarded as the amount of information about another variable contained in one variable. As shown in Equation (3), when x i and P are independent of each other, P is easy to get I, which indicates that there is no same information between variables x i and P . On the contrary, the stronger the correlation between variables x i and P , the higher the mutual information I ( x i ; P ) , and the greater the amount of the same information contained between the two parameters.
I ( x i ; P ) = i = 1 n p ( x i ; P ) log 2 p ( x i ; P ) p ( x i ) p ( P )
(2) Redundancy
Based on the analysis of correlation, the redundancy between assembly features is measured. In identifying performance and KAFPs, if there is self-similarity between x i and D , and the addition of x i will increase the information redundancy in D . Therefore, redundancy can be measured by the amount of common information between x i and D . The definition of redundancy R x i D between x i and D is shown in Equation (4).
R x i D = I ( x i ; D )
The mutual information I ( x i ; D ) of x i and D refers to the mutual information of all assembly features in x i and D . I ( x i ; D ) is calculated by calculating the mutual information of all assembly features in x i and D .
(3) Complementarity
Based on the analysis of correlation and redundancy, the complementarity between assembly feature parameters is measured. In the recognition process of P and x i , in addition to the information of D and P , if there is additional common information between candidate x i and P , the assembly feature parameters are considered to be complementary. The complementary definition of assembly feature parameters is shown in Equation (5).
C o m ( x i , P , G ) = I ( x i , P | D )
It represents the correlation between parameters x i and P when D containing multiple KAFPs is known.

3.2.2. Construction and Optimization of Performance Prediction Model

In this paper, the performance prediction model is trained and optimized in clouds. Since the production of the high precision servo valve is in small batches, the data sample size of the single-type model is limited. Therefore, aiming at the performance prediction task of a high-precision servo valve under small samples, a typical transfer learning algorithm, TrAdaboost, is proposed to solve the regression problem. It assumes that the source training data comes from different source domains. In each iteration, the source domain most related to the target domain is selected to train the weak learner, and finally, the strong learner is obtained.
Although the production batch of a single model of a high-precision servo valve is small, there are many derivative models. This provides essential data support for the optimization of the prediction model. With the increase of different derivative models of a high-precision servo valve, the source domain data set of migration learning is expanding. The continuous iterative optimization of the performance prediction model can be realized by continuously developing the derivative models completed in production to the source domain data set.
(1) Construction of data set
The data set of the performance prediction model is composed of D = { x 1 , x 2 , , x n , P } . Suppose there are N high-precision servo valves of similar models to the target, and there are source domain training data set D a = i = 1 N D a i = D a 1 + D a 2 + + D a N and one target domain training data set D b . D a is used to improve the learning performance of the target learner function: f b : X y .
(2) Construction of TrAdaboost prediction model
In TrAdaboost, a weak learner is trained in each training set by calling the traditional weak learner model. All weak learners are formed into a set of weak learners. The error of each weak learner on the target training set is calculated and the corresponding weight is increased. The weighted weak learners are integrated to obtain the candidate learners of the current iteration. The process is: Calculate the error of the candidate learner on the target training set and the training set in different source domains and update the weight of the source domain samples. Retrain the samples after updating the weight and cycle successively until the maximum number of iterations M.
The specific algorithm steps are as follows:
(i) Initialize the weight vector ( w a 1 , w a 2 , , w a N , w b ) .
Where, w a k = ( w a k 1 , w a k 2 , , w a k n a k ) is the weight vector of the k-th source domain training sample.
w b = ( w b 1 , w b 2 , , w b n b ) is the weight vector of training samples in the target domain.
(ii) Calculate the weak learner coefficient:
β a = 1 / ( 1 + 2 ln ( n a ) / M )
where, n a is the number of training samples in all source domains.
(iii) Normalize the weight vector:
P t = w t i = 1 n b w i t ,   t = ( 1 , 2 , · · · , M )
(iv) In the merged dataset D = D a k + D b , the base learner is called to obtain the weak candidate learner ( f b t ) k . Calculate the error of ( f b t ) k in target domain D b :
( ε b t ) k = j = 1 n b w b j k = 1 N [ ( f b t ) k y b j ] i = 1 n b w b i
At the same time, the weight of the weak learner ( f b t ) k is updated until N source domains are traversed.
(v) Acquire the learner of iteration t-th:
( ε b t ) k = j = 1 n b w b j k = 1 N [ ( f b t ) k y b j ] i = 1 n b w b i
At the same time, the error of f b t in D b is calculated:
( w b t ) k = e 1 ( ε b t ) k e ( ε b t ) k
(vi) Set β b t = ε b t 1 ε b t , C t = 2 ( 1 ε b t ) .
In order to meet | β b t | 1 . When ε Over 0.5, set ε = 0.5. At the same time, adding dynamic factor C t to the source domain sample weight can prevent weight transfer and obtain the source domain sample weight vector update mechanism.
(vii) Update the source domain sample weight vector w a k ( t + 1 ) · i = C t w a k t · i ( β a ) t = 1 M [ f b t y b j ] . Where, i D a k ;
Update the target domain sample weight vector w b ( t + 1 ) · i = w b t · i ( β b t ) t = 1 M [ f b t y b j ] . Where i D b .
(viii) When the maximum number of iterations M is reached, the final strong learner is obtained:
f b = t = 1 M ( ln 1 β b t ) g ( x )
where, g ( x ) is all β b t f b t Median of.
(3) TrAdaboost evaluation index
This paper uses the target domain test sample data set to evaluate the strong learner model. In the evaluation indicators of the model, different evaluation indicators focus on different aspects. The evaluation of various models by the single index is lacking comprehensiveness, so it is necessary to carry out multi-index comprehensive evaluation of different models. Therefore, after multiple cycle calculations, this paper selects explained variance score (EVS), mean square error (MSE), mean absolute error (MAE) and determination coefficient R2 to evaluate the accuracy of the prediction model, as shown in Table 1.
Among the four indicators, EVS explains the variance score of the regression model, and its value range is [0, 1]. The closer it is to 1, the more the independent variable can explain the variance change of the dependent variable, and the smaller the value, the worse the effect. MSE calculates the mean value of the square sum of the errors of the sample points corresponding to the fitting data and the original data. The more prominent the value, the better the fitting effect. MAE calculates the mean value of the square sum of the errors of the sample points corresponding to the fitting data and the original data. The more obvious the value, the better the fitting effect. R2 is the standard for evaluating the excellent fitting of the regression model. The closer R2 is to 1, the better the fitting effect of this model on the data.

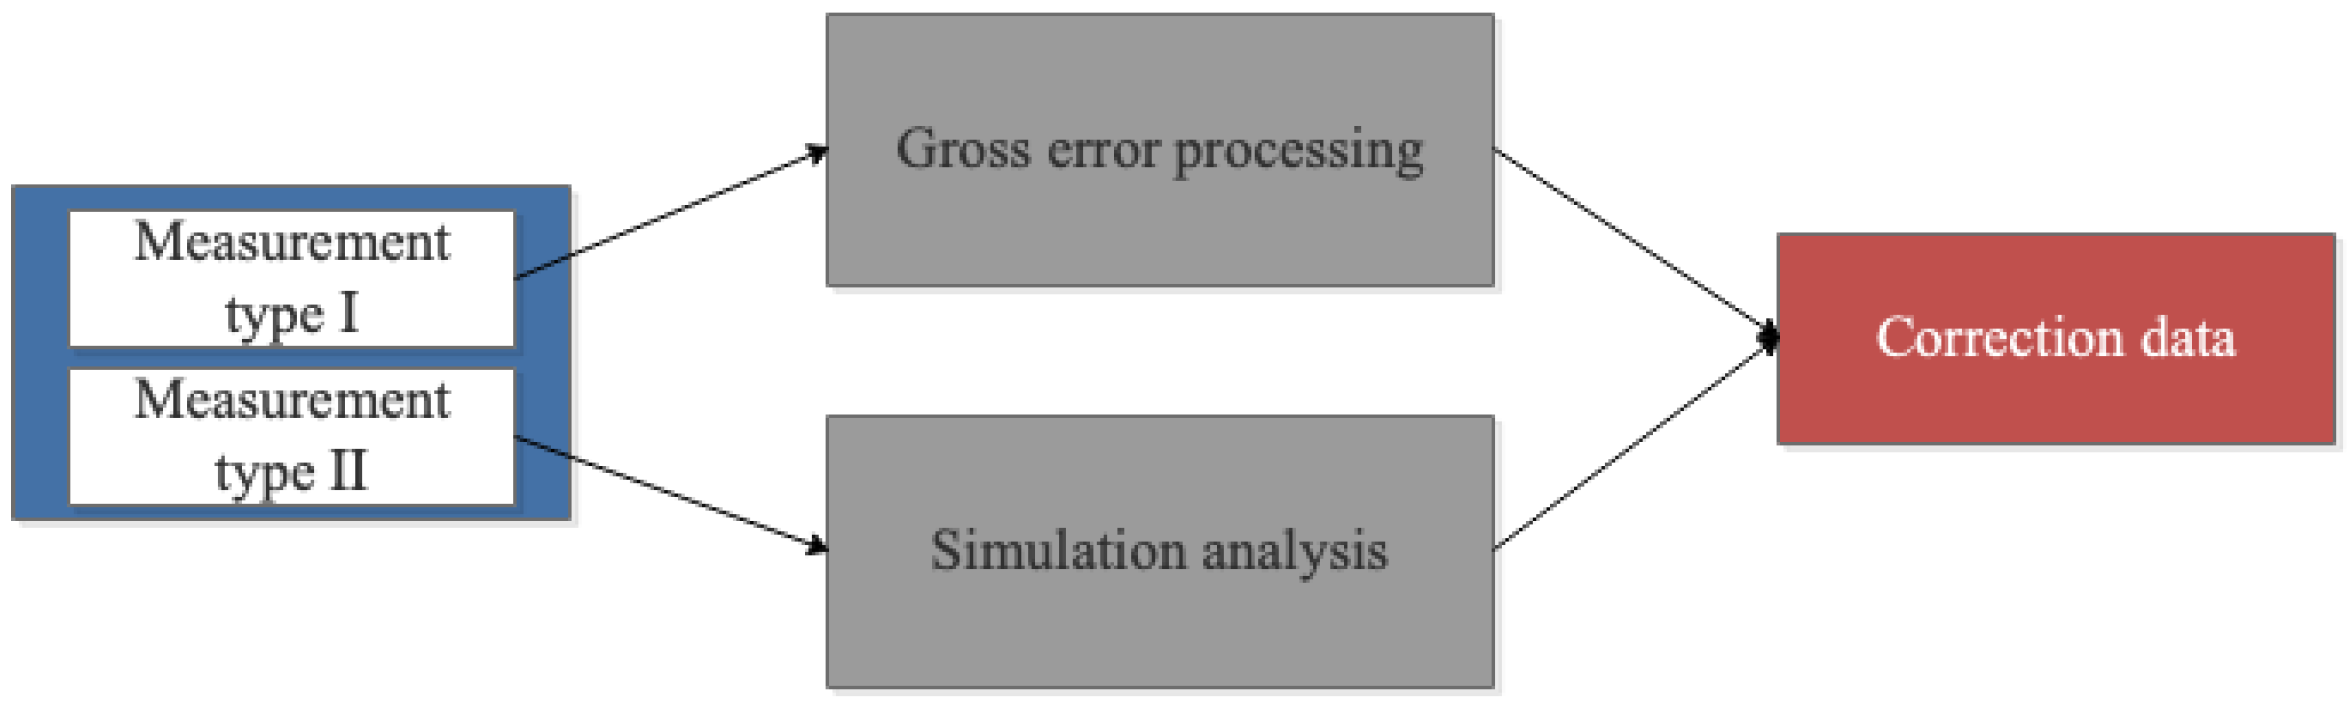
3.2.3. Measurement Data Acquisition and Correction

The premise of accurate performance prediction is to ensure the accuracy of measurement data. The data sources are divided into equipment control data and external measurement data in the physical assembly-commissioning space. The device control data can be obtained directly through the device controller. External measurement data is mainly obtained through measurement equipment. However, in the assembly process of a high-precision servo valve, there are still the following challenges to the accuracy of measurement equipment data: (1) affected by the equipment and environment, the one-time measurement data of assembly feature parameters have a high probability of abnormality; (2) some assembly feature parameters change greatly before and after assembly. Thus, the secondary measurement cannot be carried out after assembly. For example, the stiffness of the force feedback rod changes before and after assembly.
As shown in Figure 5, the measurement data are defined as type I and type II, respectively, according to the above challenges. The two types of data are processed separately.
(1) Gross error processing
For measurement type I, the gross error processing approach can be used to eliminate abnormal data in multiple measurement data. Since the number of measurements is relatively small (generally less than 10), the Romanowski test (t-test criterion) is utilized for the calculation of the gross error. The rules are as follows:
Firstly, the equivalent accuracy measurement data are compared if x j is the suspicious data in the measured value. Then the average value of the remaining measured data is calculated after removing the data, as shown in Formula (12):
x ¯ = 1 n i = 1 i j n x i
The difference between each measured data point and the mean is called residual, which is recorded as:
v i = x i x ¯
Secondly, the estimation of the standard deviation of the measurement column after deleting the suspected value is calculated. The calculation method is as follows:
e = 1 n 1 ( i = 1 n v i 2 )
Thirdly, the residual v j = x j x ¯ of suspicious data is obtained. Then, the deleted measured value x j is judged according to the discriminant whether there is the gross error:
| v j | = K e
where, K is the detection coefficient. The value of K is determined by the tested coefficient of confidence and measurement times check t distribution.
Equation (15) indicates that x contains a gross error and should be deleted.
(2) Simulation analysis
For measurement type II, the digital twin model of the subassembly is used to modify the parameters through finite element simulation. The digital twin geometric model of a high-precision servo valve adopts the MBD model and point cloud reverse model [7]. To improve the high fidelity of the model, the reverse modeling technology based on the point cloud is used to correct the machining deviation. Among them, parts with high surface morphology requirements (such as valve core, valve sleeve, etc.) can be constructed by skin model [35]. In addition, a simulation environment with the same or as similar as the measurement conditions must be established in the virtual space. Finally, the measured data are corrected according to the simulation results.

3.2.4. Online Performance Prediction

The optimal performance prediction model trained in the cloud is deployed in the edge layer for online performance prediction. The traditional performance prediction method usually adopts the offline method. With the support of digital twin technology, this paper realizes the rapid online prediction of product performance through the real-time access of measurement data. In the edge layer, on the one hand, it can provide a cache of prediction results. On the other hand, the prediction results can be compared with the practical test results to identify whether the performance prediction model needs to be optimized and updated.

3.2.5. Commissioning Decision

Commissioning refers to fine-tuning various assembly feature parameters to meet product performance indicators. The traditional commissioning method is to judge whether fine-tuning is needed according to the test results. In this research, the commissioning is conducted based on the data-driven performance prediction results. This approach provides the rapid iteration of prediction and commissioning and a more accurate commissioning scheme given the correlation between performance and KAFPs.

4. Case Study

In this paper, the servo valve assembly-commissioning of a specific type of nozzle baffle is taken as an example, and the hysteresis characteristics are used to verify the effectiveness of the method proposed. Figure 6 shows the key internal structure of the servo valve.

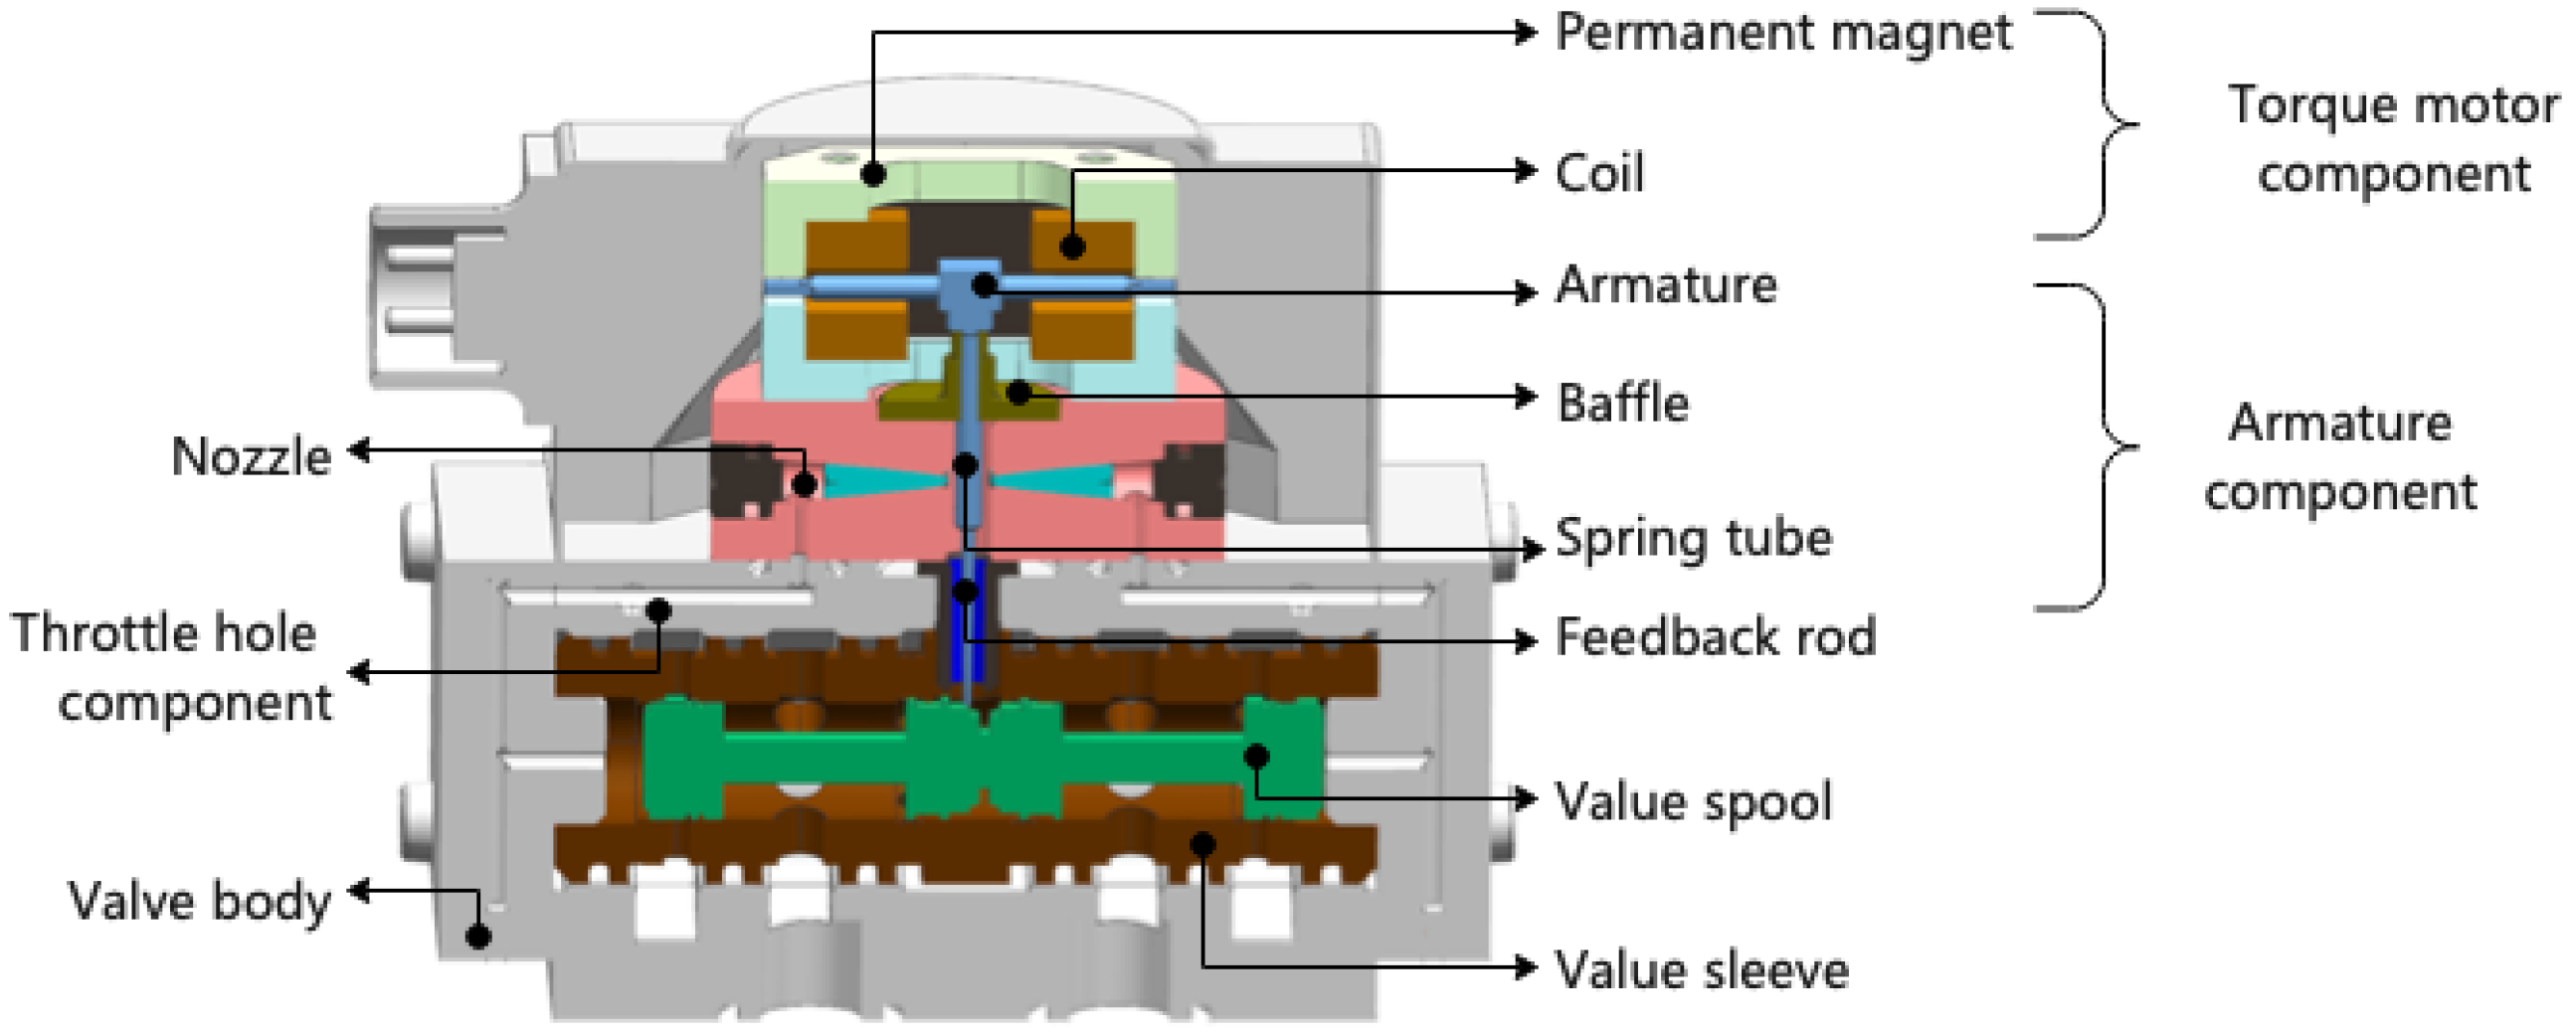
4.1. Servo Valve Assembly-Commissioning Process Description

The assembly process of servo valves is complex, and a number of performance indexes need to be commissioned at the same time, as shown in Table 2. Hysteresis refers to the percentage of the maximum difference between the two currents that produce the output flow of the system and the rated current when circulating between the positive and negative rated currents at a speed less than the speed at which the dynamic characteristics work. The hysteresis characteristic of a high-precision servo valve directly affects the stability of the servo system. In the traditional method, firstly, the test environment is configured for the servo valve, and the test bench is used to test the flow data and control current of the servo valve. Then, the specific hysteresis value is obtained by manual calculation. Finally, according to the obtained hysteresis value, it is commissioned by manual experience. Traditional methods usually require a lot of test configuration time and human experience.

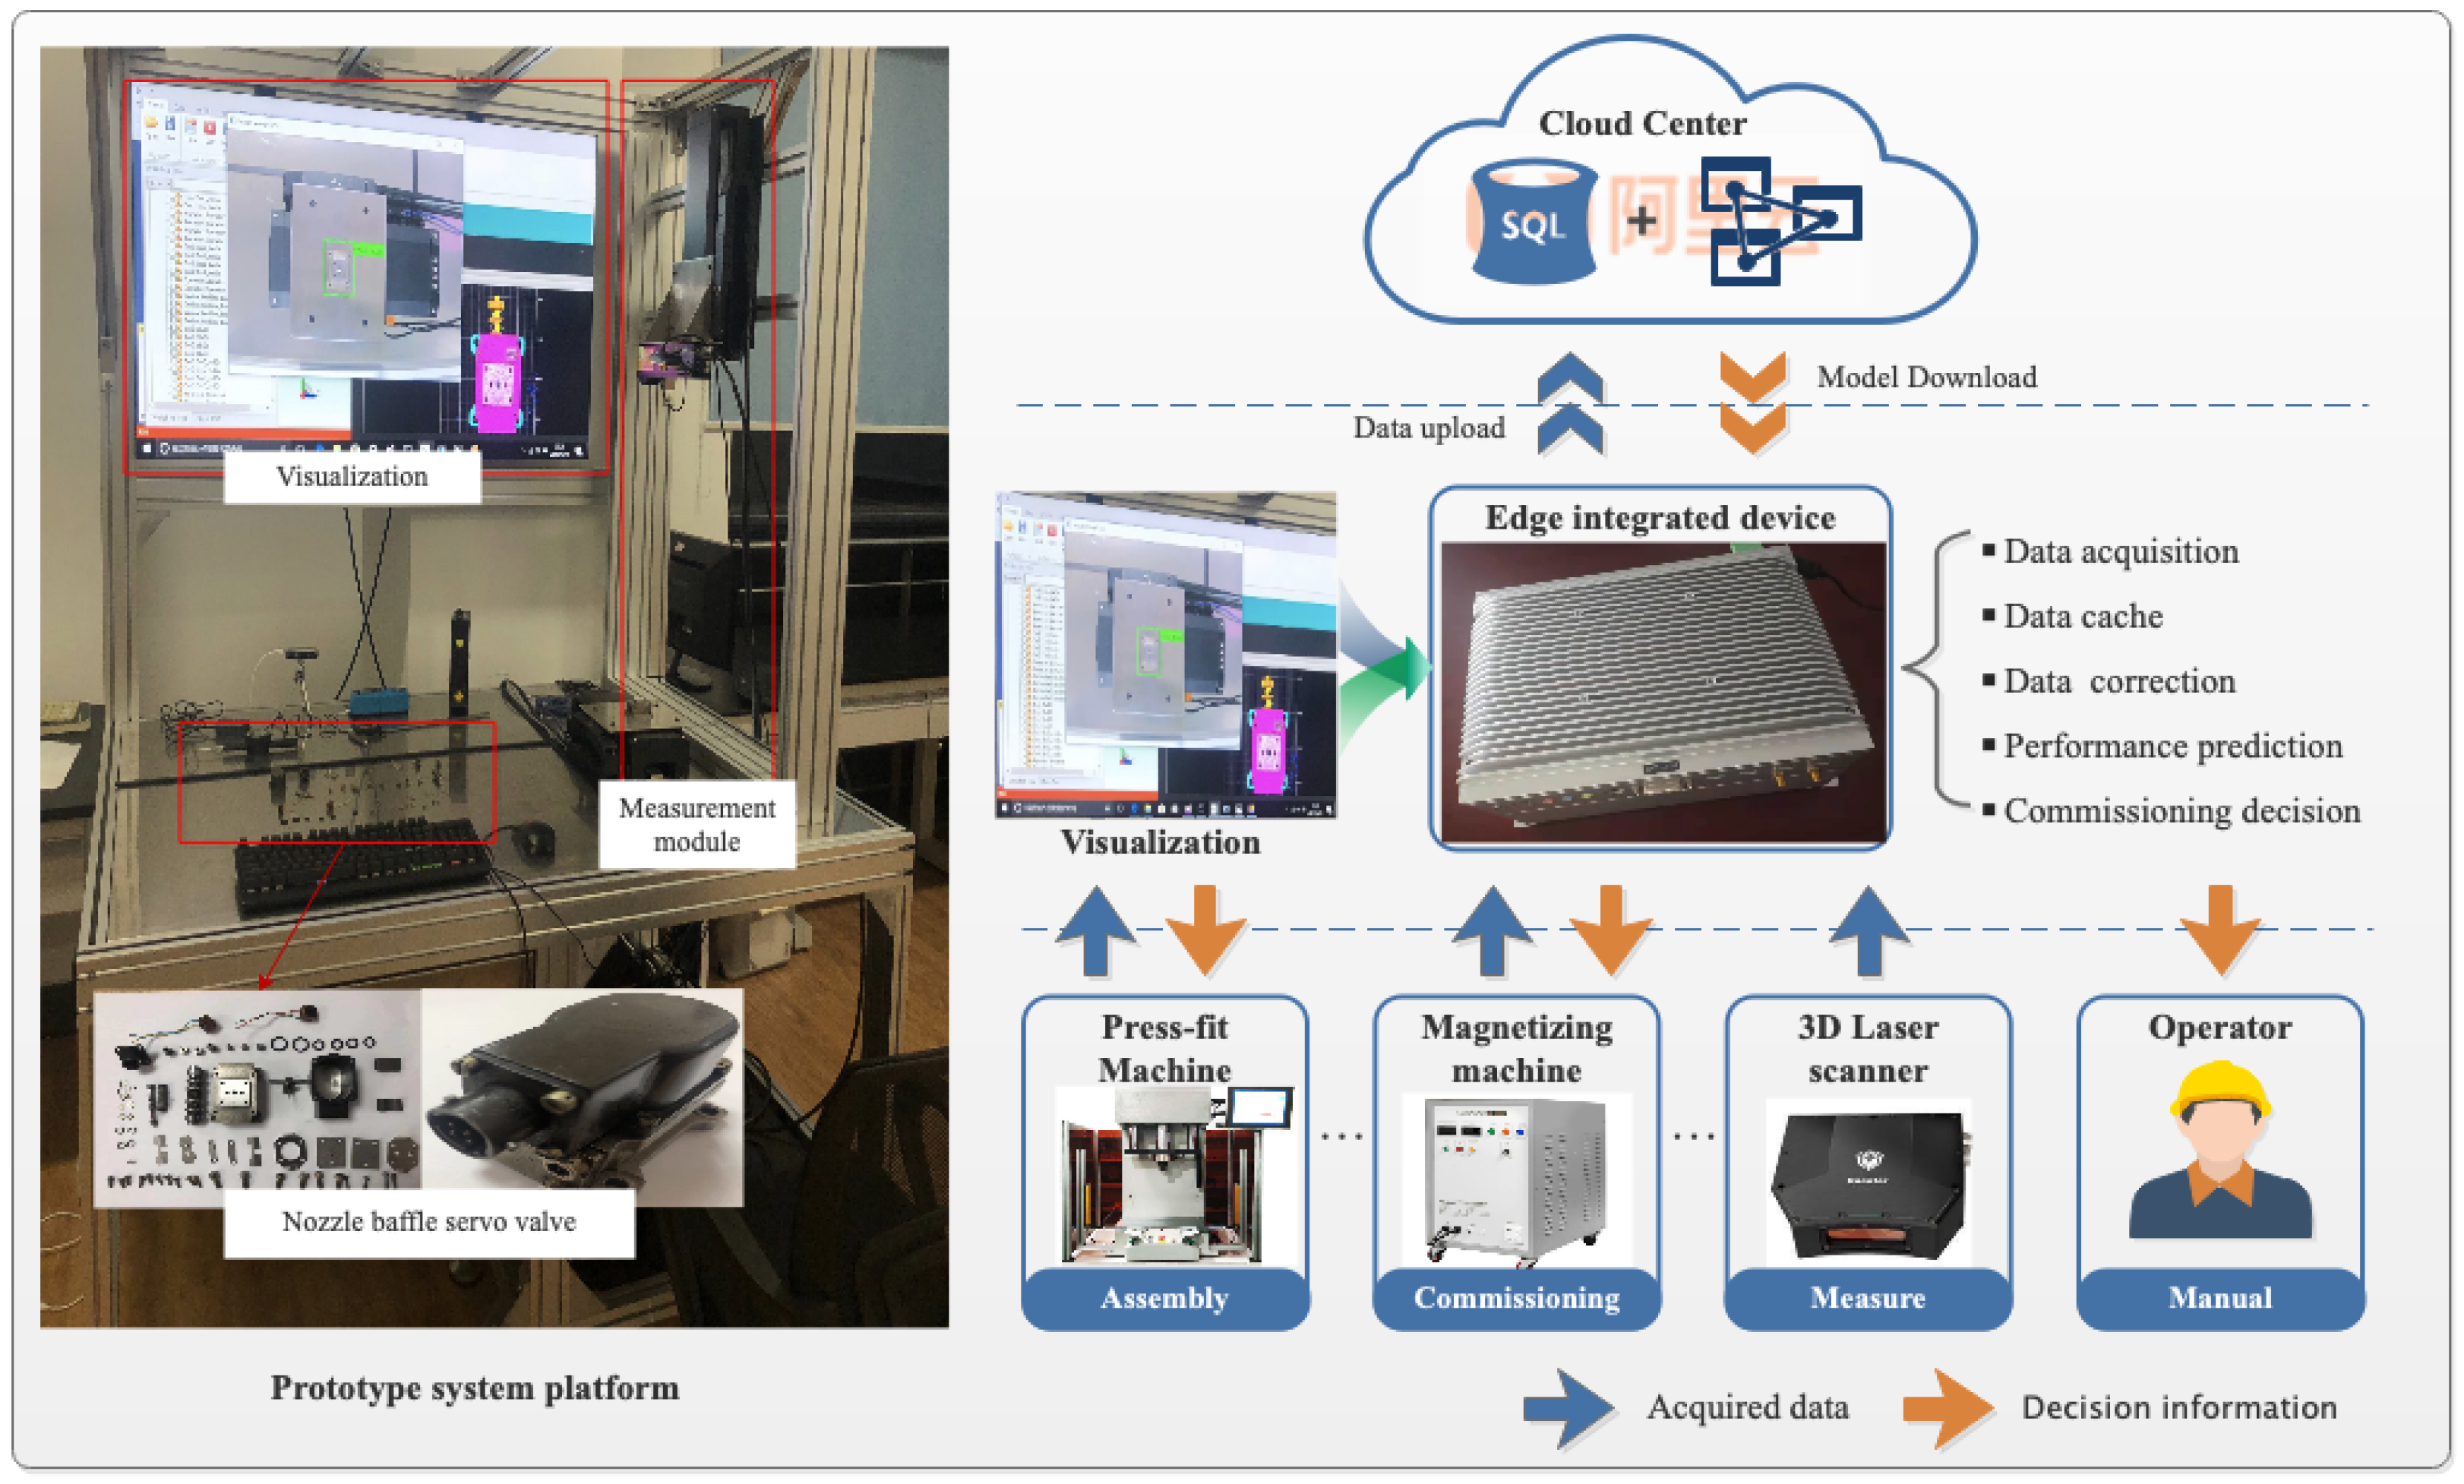
4.2. Network Deployment of Digital Twin Prototype System

The network environment of the digital twin assembly-commissioning system is deployed in this case, as shown in Figure 7. The physical environment includes a commissioning platform, visual board, digital measuring equipment, assembly and commissioning device and edge machine. As an edge layer device for performance prediction, the edge machine is deployed around the assembly and commissioning device. In the data measurement of the assembly process, we installed the measurement module on the experimental platform. In addition to the ammeter and electromagnetic flowmeter, we mainly measure the assembly geometric feature parameters by a 3-D laser scanner (LMI Gocator). The maximum assembly accuracy of the servo valve is 10 µm, while the maximum measurement accuracy of the 3-D laser scanner is 1 µm, which can meet the measurement accuracy requirements.
In the edge layer, firstly, the measured data are preprocessed. Then, the input parameters of the hysteresis prediction model are selected through the KAFPs selection mechanism, and the data are corrected. Finally, the commissioning decision is assisted according to the hysteresis prediction results. When the network is idle, the edge layer will upload some cached data to the cloud for storage as historical data. Alibaba Cloud ECS server is adopted for the cloud platform. Among them, we use MySQL database for data storage; use object storage service (OSS) to store algorithm models; and usually store geometric models in folders. In the cloud layer, the product high fidelity geometric model, KAFPs selection mechanism and optimal hysteresis prediction model can be provided for the edge layer. When the network is idle, the cloud optimizes the prediction model according to the newly uploaded historical data, and the edge layer prediction model is updated.

4.3. Method Implementation

According to the workflow of the performance prediction method described in Section 3.2, the hysteresis characteristic is predicted online, and the commissioning decision is made.

4.3.1. Selection of KAFPs

In a high-precision servo valve assembly process, there are 18 candidate assembly feature parameters affecting hysteresis characteristics. To train and test the prediction model, we collected historical data from the private cloud center as data samples for hysteresis characteristic prediction. Table 3 shows the original data listed.
In this paper, the KAFPs are selected by the method of IE. Under the constraints of maximum correlation, maximum complementarity and minimum redundancy, the entropy obtained by each assembly feature parameter appears by polarization. According to entropy f E , 11 KAFPs affecting hysteresis characteristics are selected. The specific selection results are shown in Table 4.

4.3.2. Measurement Data Correction

Among the 11 KAFPs affecting hysteresis characteristics, x14 and x15 need to obtain the assembled stiffness through simulation analysis. The remaining nine KAFPs need to be corrected through gross error processing. As shown in Table 5, the comparison results of parameter values before and after correction are shown, in which the parameters requiring gross error processing are repeatedly measured seven times.

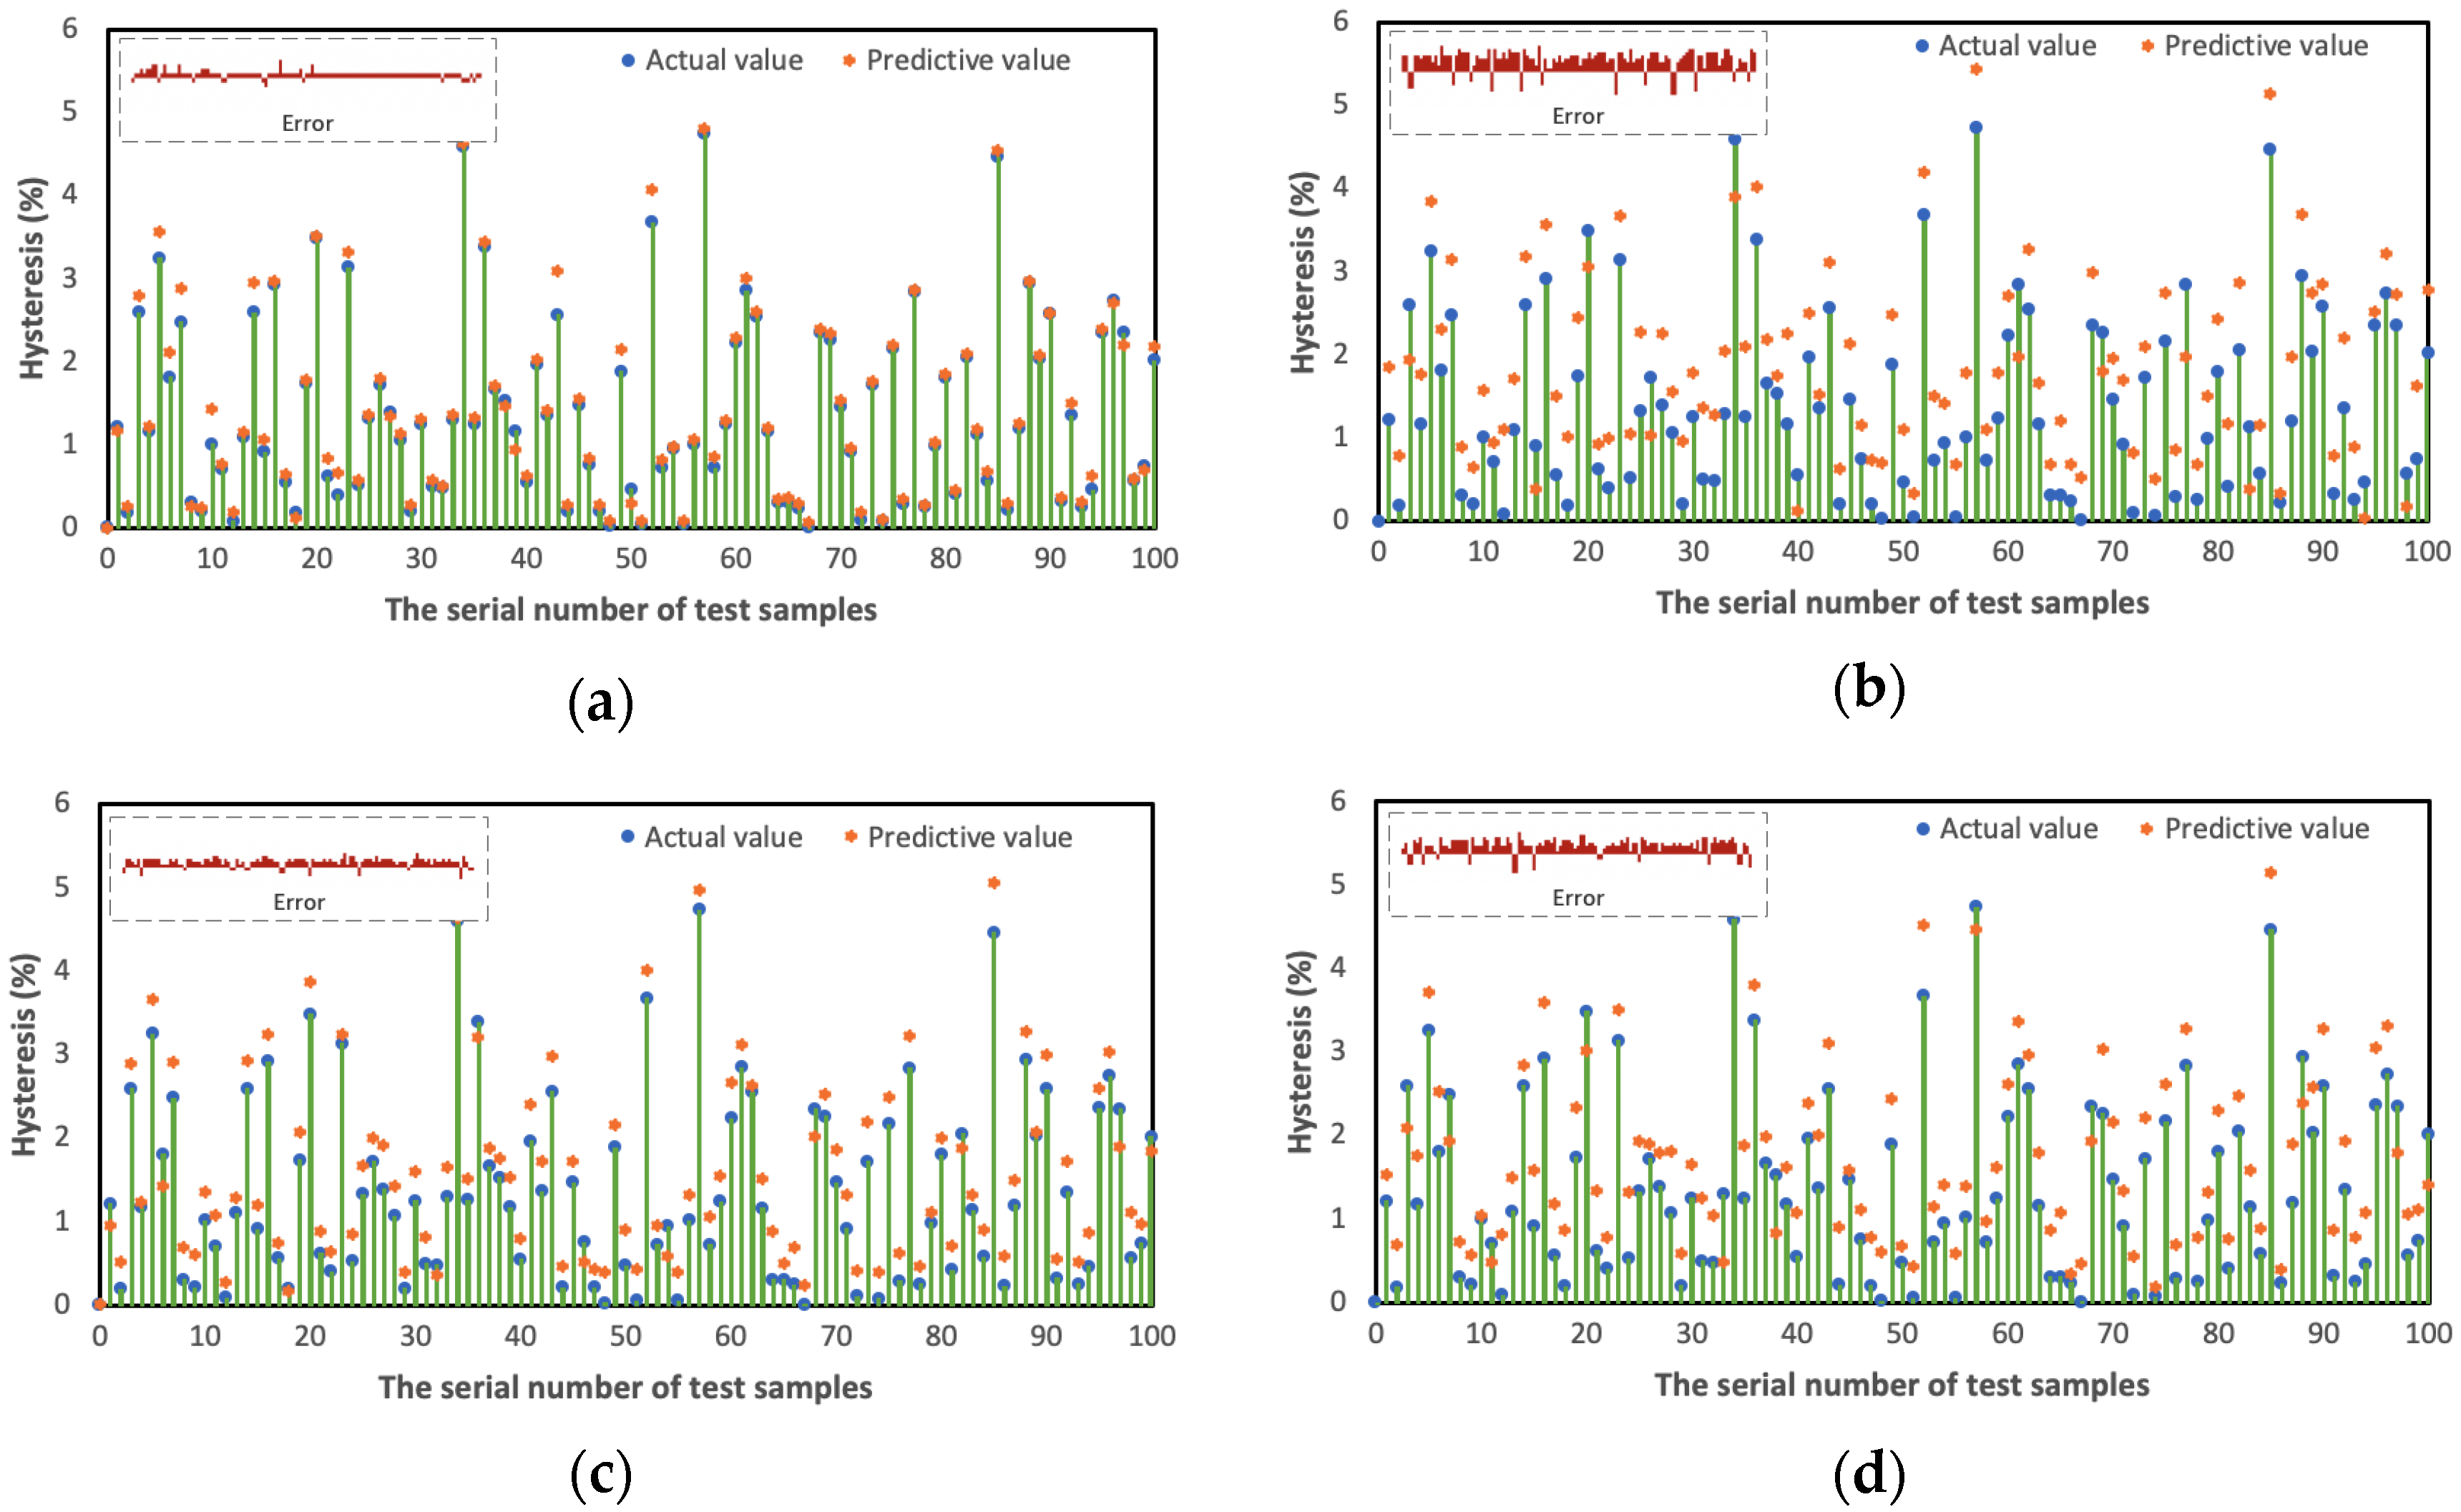
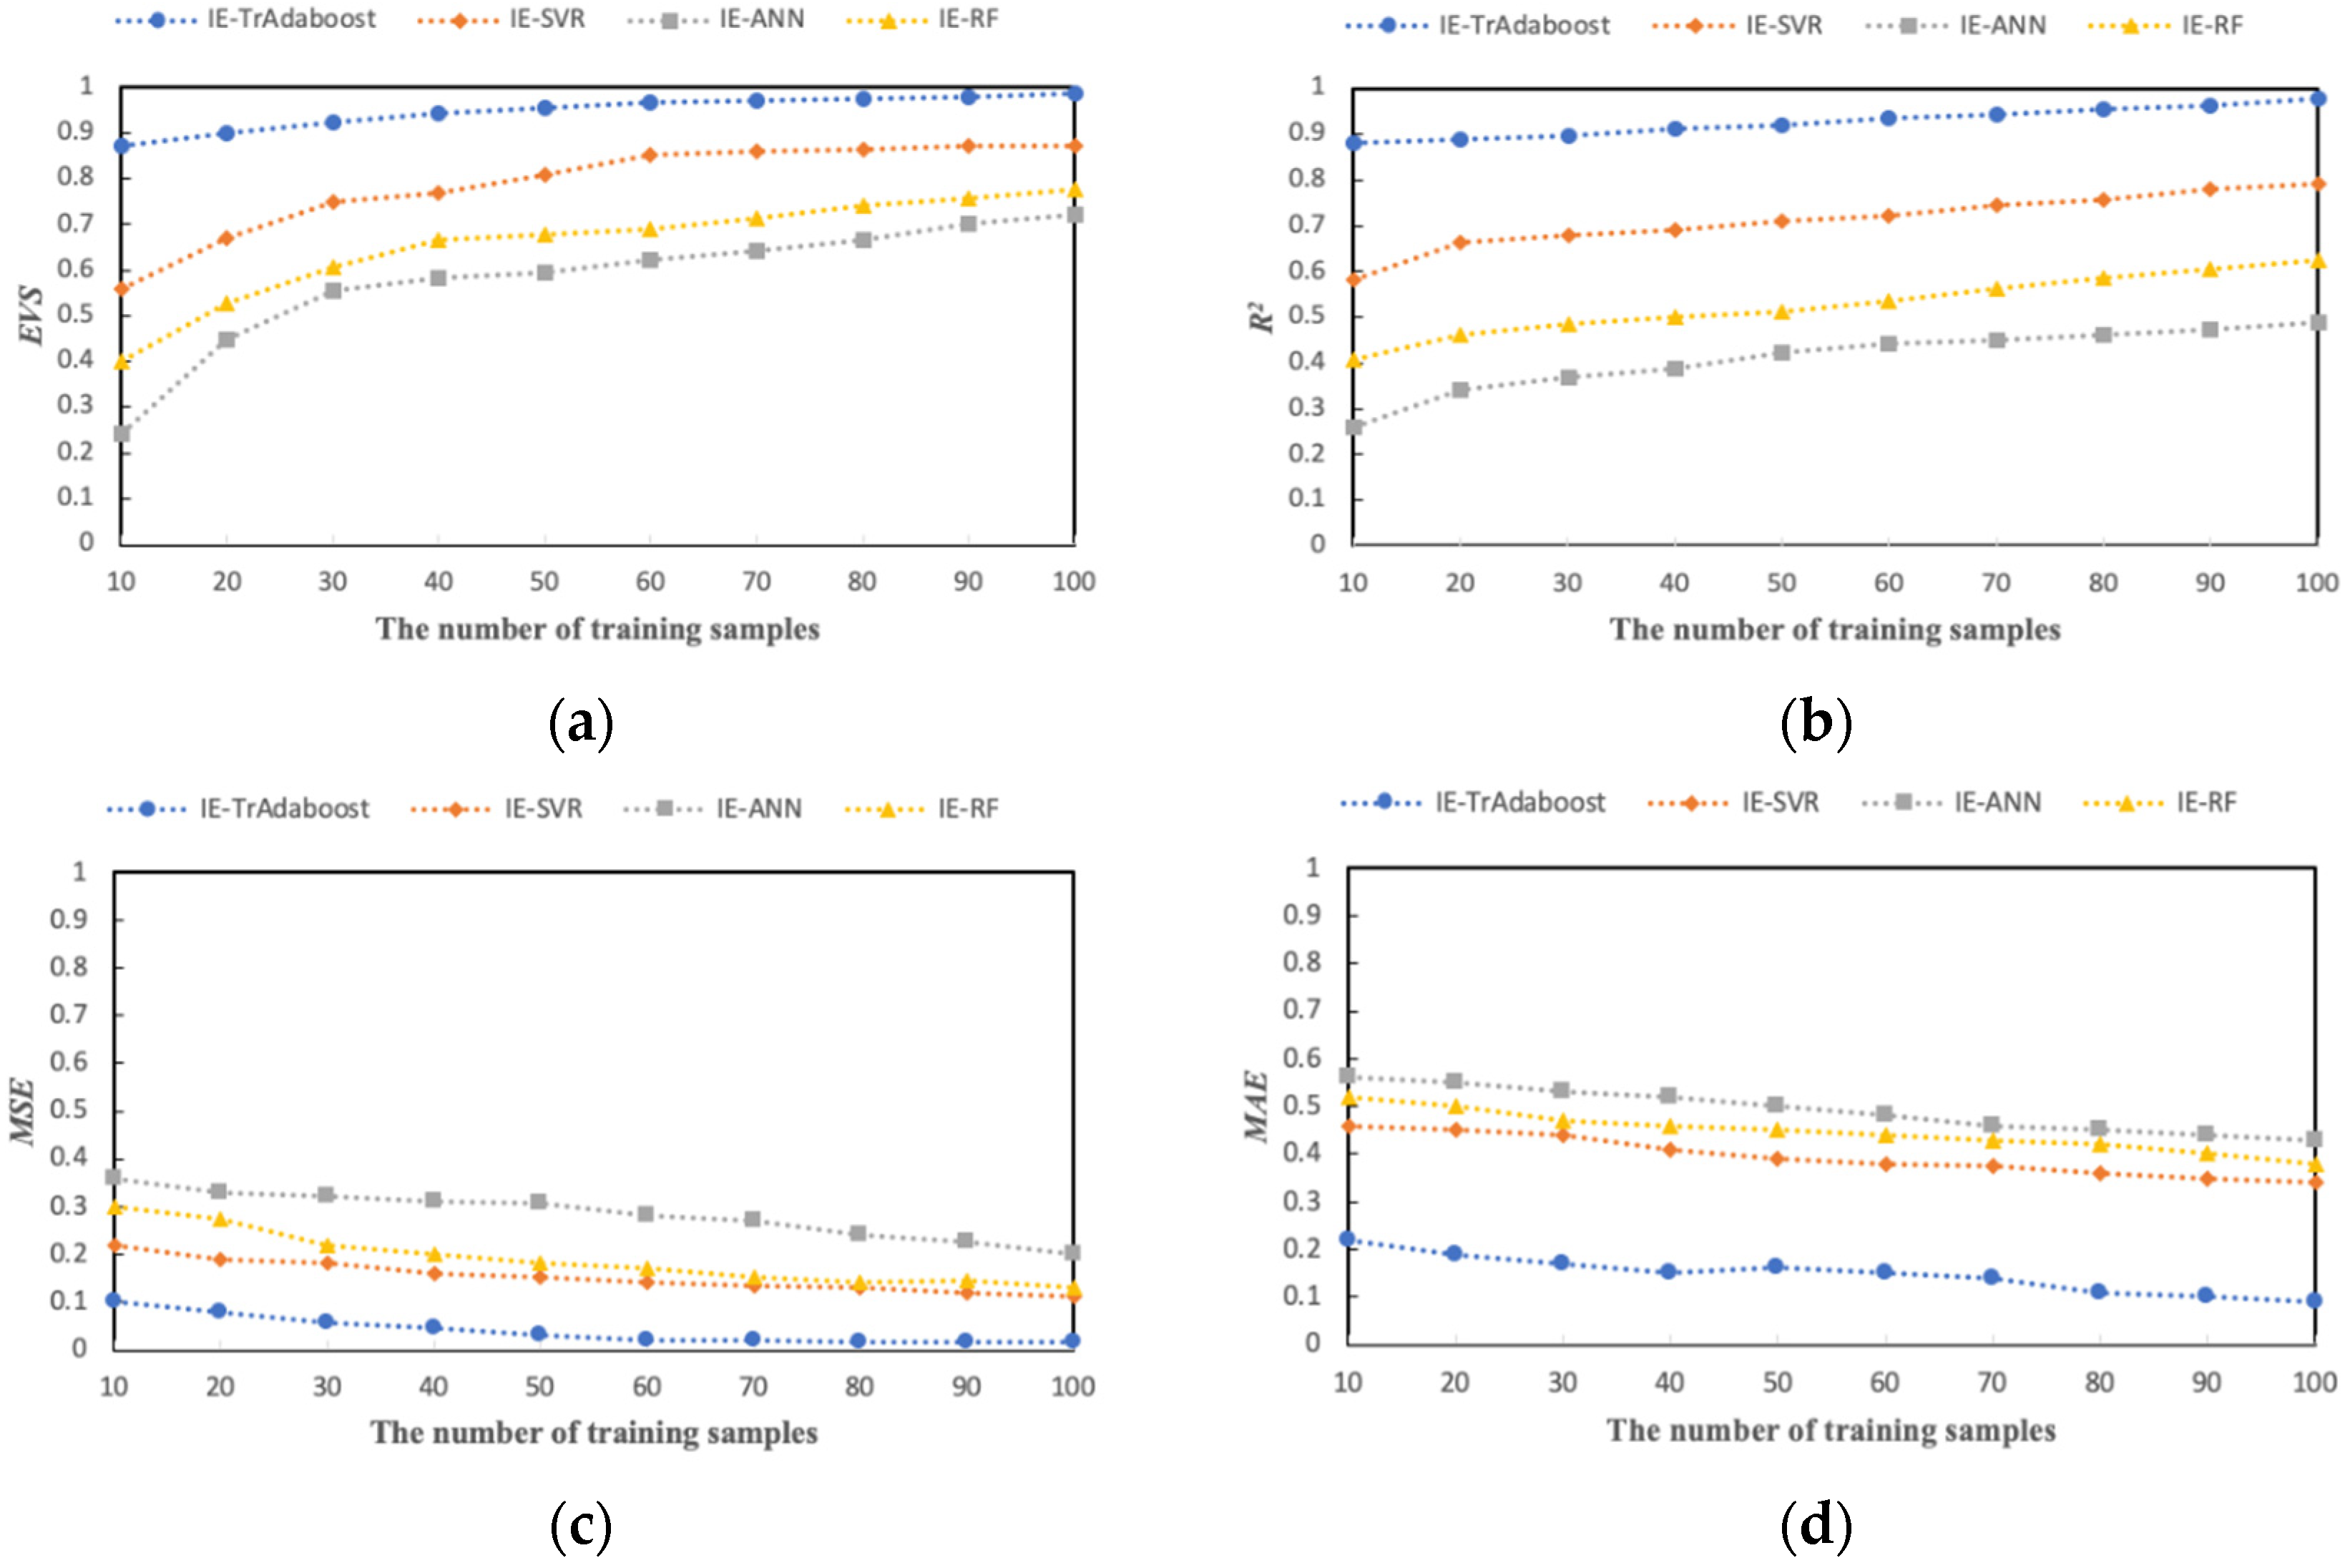
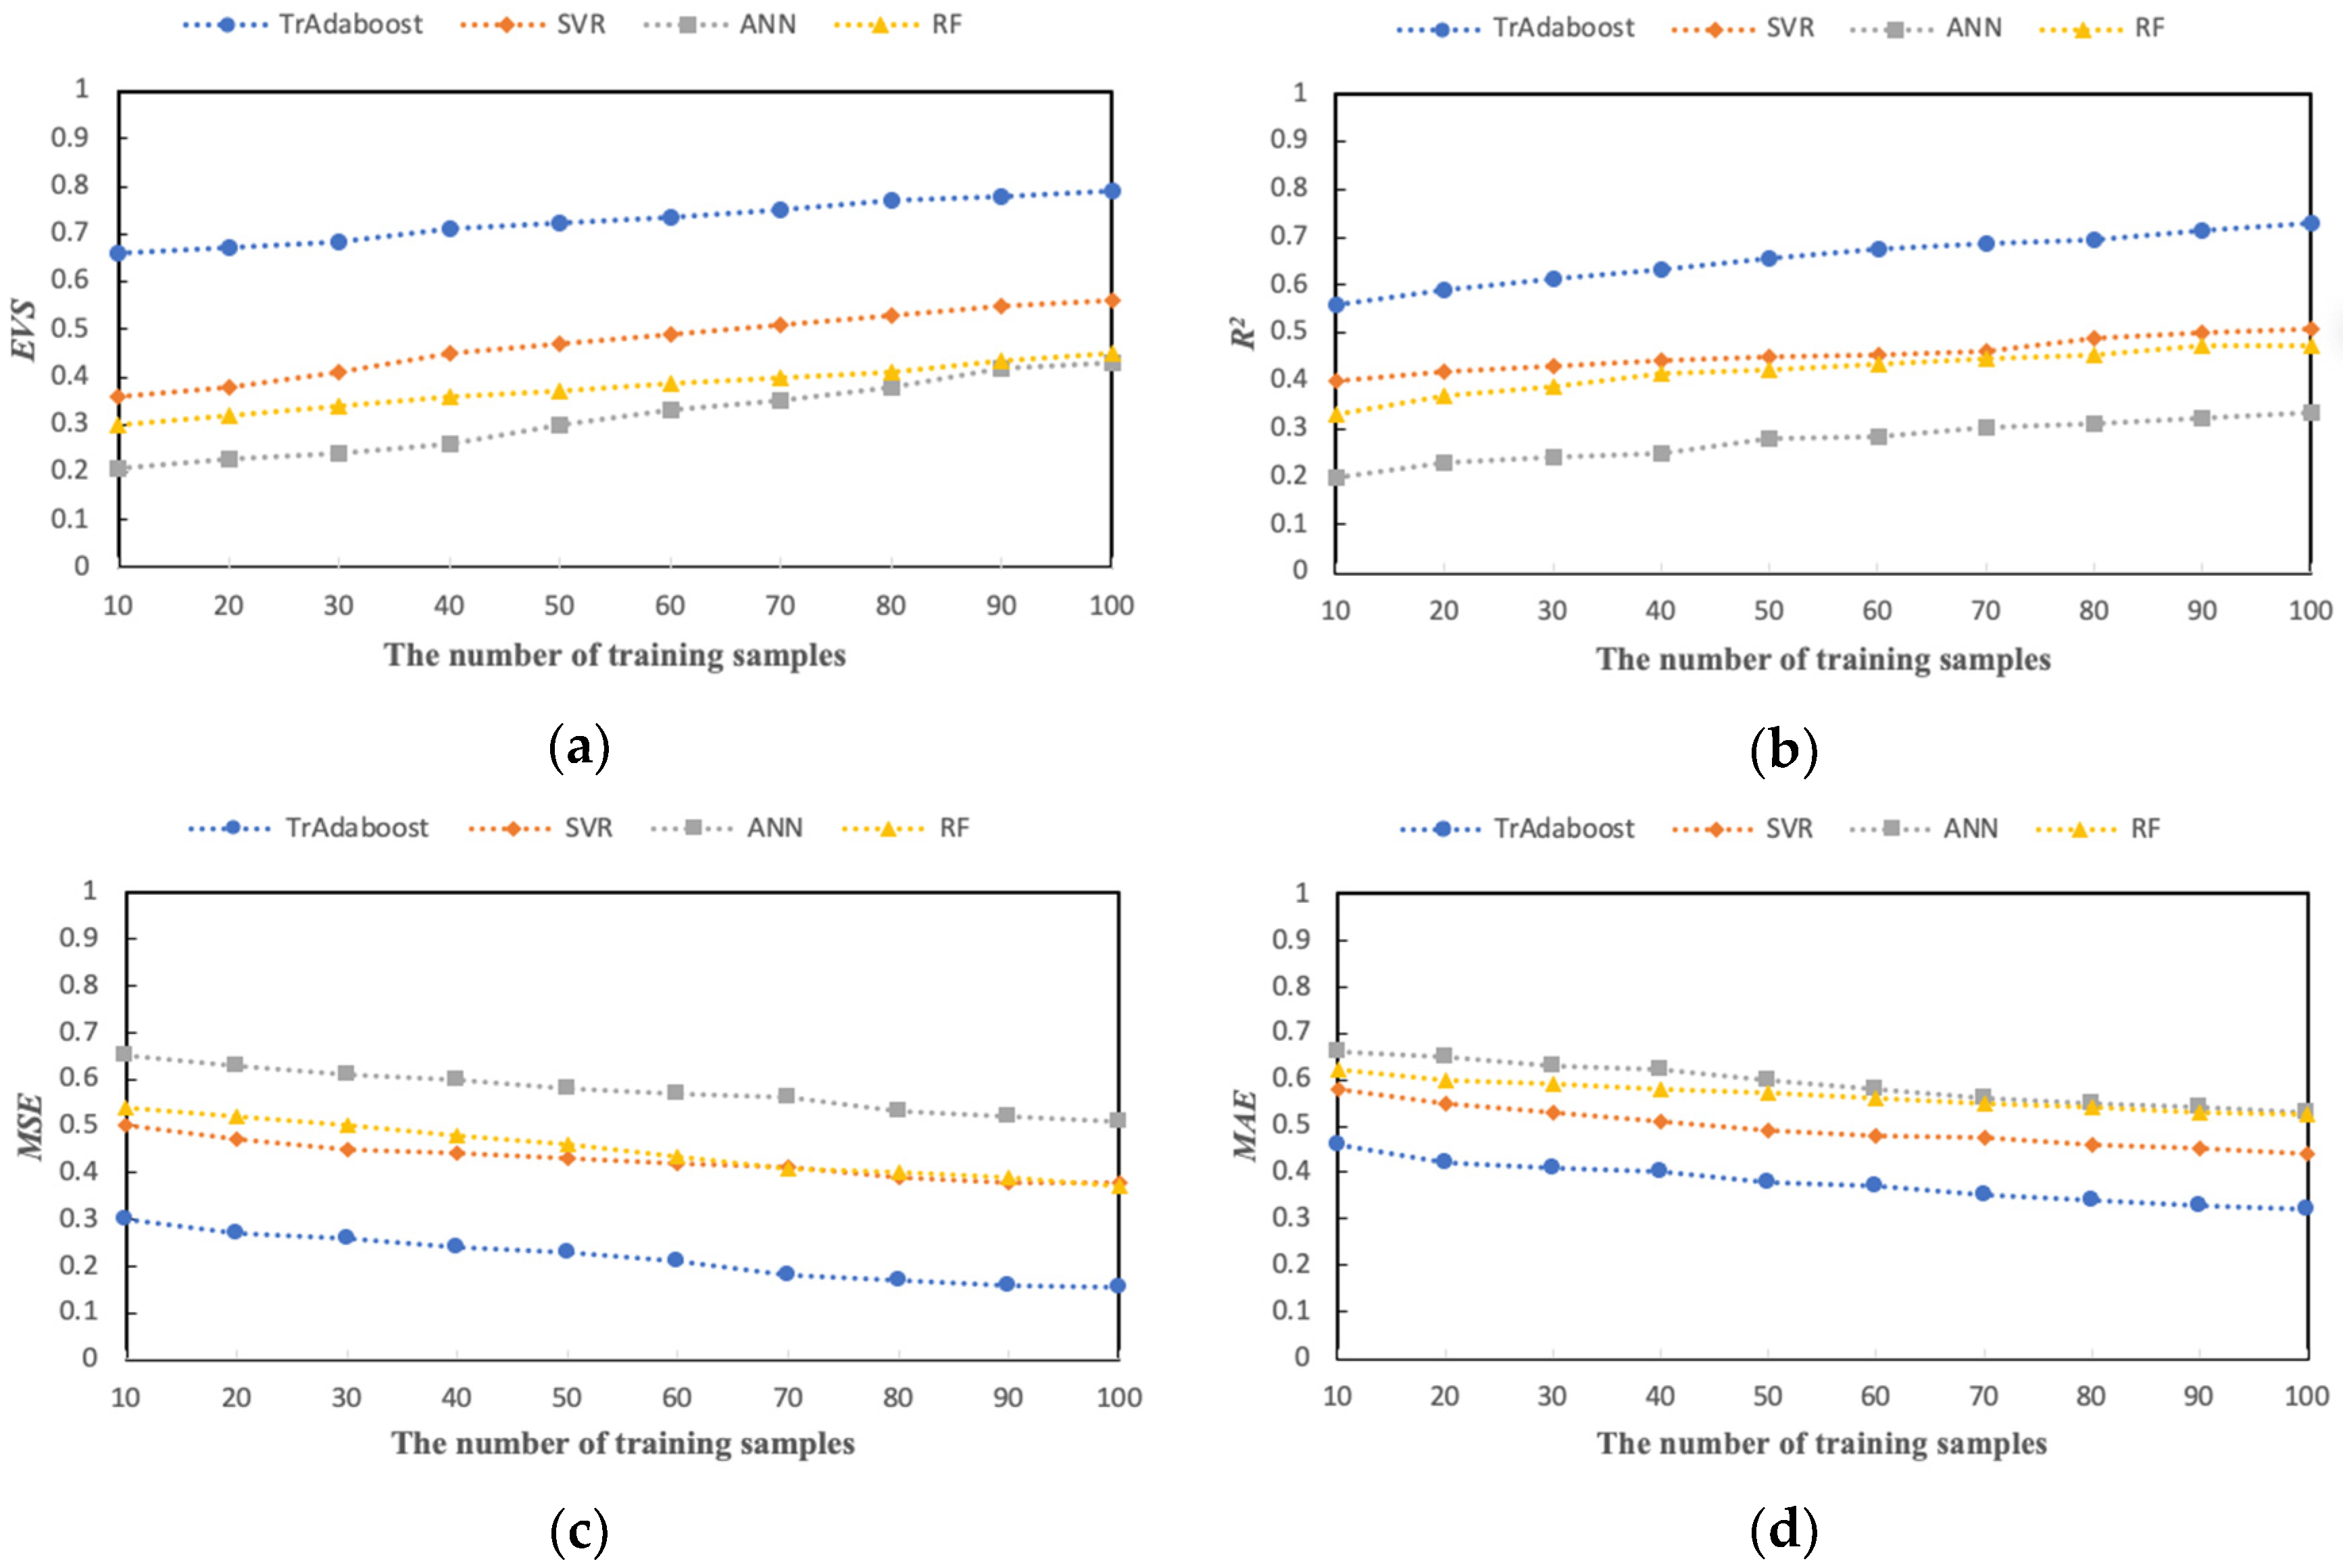
4.3.3. Prediction of Hysteresis Characteristic

In this case, 2200 groups of data of 11 similar models are selected as the data source. Among them, 10 types of assembly process data are selected to construct the source domain data set, and the total number of samples in the data set is 2000 groups. The target domain data set is constructed from the assembly process data of the remaining one model, in which 100 groups of data samples are randomly selected as the test set. In addition, the remaining 100 groups of data samples are set as the training set for training. In order to verify the superiority of the prediction model, this case compares the error between the prediction results of IE-TrAdaboost, IE-ANN, IE-SVR, and IE-RF models and the actual value. Simultaneously, EVS, MSE, MAE, and R2 are used to evaluate the model’s performance. In the construction of the model, we selected 11 KAFPs as inputs and one output (hysteresis value). The parameters of each model are shown in Table 6.
(1) Error comparison between predicted results and actual values
Each prediction model is trained with the set target domain sample set, and the prediction results are obtained through the target domain test samples. Figure 8 shows the prediction effect of each model when the target domain training samples are 100 groups. It can be seen from the test results that the error fluctuation range of the IE-ANN model and IE-RF model is extensive, the prediction error is significant; The error fluctuation range of the IE-TrAdaboost model and IE-SVR model is small, but the prediction results of the IE-TrAdaboost model is closer to the actual value.
(2) Comparison of performance evaluation of different prediction models
As shown in Figure 9, each prediction model is trained with the data set selected from the KAFPs to obtain the evaluation results, in which the evaluation results are normalized. The evaluation results show that IE TrAdaboost performs best in the four evaluation indexes and IE-ANN performs worst. At the same time, with the continuous increase of sample data, the performance of various prediction models is improved. This means that when the sample data size reaches a certain degree, the accuracy of various prediction models is excellent.
As shown in Figure 10, each model uses the data set without KAFPs selection to obtain the evaluation results, in which the evaluation results are normalized. In the evaluation results, the performance of each model is lower than that after training and extraction of KAFPs. In particular, the fitting effect of the prediction model on the data is reduced to less than 0.8. The experimental results indicate that the prediction model with the selection of KAFPs has better performance.

4.3.4. Commissioning Decision

The hysteresis characteristic index of a high-precision servo valve selected in this case is ≤3%. When the predicted value of hysteresis characteristic is more than 3%, commissioning is required. There are two ways to commission at present: the first is superimposed chatter on the coil drive current, such as independent PWM flutter, parasitic PWM chatter, etc. The second is to commission the assembly feature parameters, such as commissioning the matching clearance of valve core and valve hole, nozzle flow, etc. When the hysteresis characteristic value is out of range, the first scheme is usually adopted. When the hysteresis characteristic value exceeds the capacity greatly, the second commissioning method is generally adopted. Under the condition of hysteresis characteristic prediction results and performance KAFPs correlation, the operator can quickly obtain the best commissioning strategy. The intelligent commissioning strategy includes qualitative and quantitative descriptions. This paper mainly studies the qualitative description (11 KAFPs). Under the digital twin technology, the iterative interaction between virtual space (specifically includes performance prediction and commissioning decisions) and physical space (specifically includes commissioning and secondary assembly process) is realized until the performance requirements are achieved.

4.4. Discussion

In this case, the cloud-edge collaborative network is utilized in the digital twin system of a high-precision servo valve. The method proposed in this paper is implemented in hysteresis characteristic commissioning, while the experimental analysis results obtained are shown in Table 7. The obtained result is the mean value of 100 groups of data.
In summary, some conclusions can be drawn from the above results.
(1) From the perspective of measurement data accuracy, the modified assembly feature data has higher prediction accuracy. For the performance of high-precision products, small changes in assembly feature parameters would significantly impact the performance of high-precision products.
(2) With regards to the data dimension, the model trained by the KAFPs selection data set has better performance. There are many redundant assemblies features irrelevant to a particular performance in the assembly process. Therefore, the selection of KAFPs is vital for prediction models and commissioning decisions.
(3) In terms of the sample data, the prediction results of hysteresis characteristics of small sample data by the TrAdaboost prediction algorithm proposed are closest to the actual value. At the same time, the model evaluation results indicate the superiority of the performance of the TrAdaboost model.
(4) The traditional performance commissioning method obtains the performance data through the test bench and then obtains the commissioning decision-making scheme through manual experience. The average time from obtaining the hysteresis characteristic value to obtaining the commissioning scheme cycle is counted. The results show that the commissioning cycle of the proposed method is 8% ( E f f i c i e n c y = P r o p o s e d   m e t h o d / c y c l e T r a d i t i o n   m e t h o d / c y c l e × 100 % ) of that of the traditional method. This further proves the value of this method in improving the assembly-commissioning efficiency of a high-precision servo valve.

5. Conclusions and Future Work

In the process of a high-precision servo valve assembly-commissioning, to solve the problem of a long period of traditional performance index commissioning methods, a performance prediction framework supported by digital twin assembly-commissioning technology is proposed in this paper. Data analysis and decision-making tasks are carried out by allocating supervised machine learning between the physical, edge, and cloud layers. The network deployment method provides a feasible method for realizing digital twin technology in dynamic industrial cloud-edge networks to ensure high-performance prediction and commissioning decision-making. In the performance prediction process of a high-precision servo valve, the accuracy of data samples is improved by measuring data correction. Then, an IE-TrAdaboost prediction model is proposed for high-precision performance prediction under high-dimensional and small sample data. Finally, the proposed method is verified by hysteresis characteristics. The experimental results indicate that the proposed method can greatly improve the assembly-commissioning efficiency.
In the digital twin assembly system, the performance control of a high-precision servo valve needs to predict a variety of performance indicators and intelligently recommend quantitative commissioning parameters. The main contribution of this paper is to investigate the performance prediction of a high-precision servo valve to assist commissioning decision-making. In the future, to apply the method proposed in practical projects, further research would need to focus on multi-performance index-oriented optimization and intelligent recommendation of global quantitative commissioning parameters.

Author Contributions

Conceptualization, X.S. and J.B.; methodology, X.S.; software, X.S. and S.L.; data curation, X.S. and S.L.; writing—original draft preparation, X.S.; writing—review and editing, J.L. and Z.L. All authors have read and agreed to the published version of the manuscript.

Funding

This work was supported by the Fundamental Research Funds for the Central Universities and Graduate Student Innovation Fund of Donghua University (CUSF-DH-D-2020051). And the National Key R&D Program of China (2019YFB1706300).

Institutional Review Board Statement

Not applicable.

Informed Consent Statement

Not applicable.

Data Availability Statement

Not applicable.

Conflicts of Interest

The authors declare no conflict of interest.

References

  1. Luo, W.C.; Hu, T.L.; Ye, Y.X.; Zhang, C.R.; Wei, Y.L. A hybrid predictive maintenance approach for CNC machine tool driven by digital twin. Robot. Comput.-Integr. Manuf. 2020, 65, 101974. [Google Scholar] [CrossRef]
  2. Feng, Y.X.; Wang, T.Y.; Hu, B.T.; Yang, C.; Tan, J.R. An integrated method for high-dimensional imbalanced assembly quality prediction supported by edge computing. IEEE Access 2020, 8, 71279–71290. [Google Scholar] [CrossRef]
  3. Diao, G.Z.; Zhao, L.P.; Yao, Y.Y. A dynamic quality control approach by improving dominant factors based on improved principal component analysis. Int. J. Prod. Res. 2015, 53, 4287–4303. [Google Scholar] [CrossRef]
  4. Wei, Z.; Feng, Y.X.; Hong, Z.X.; Qu, R.X.; Tan, J.R. Product quality improvement method in manufacturing process based on kernel optimisation algorithm. Int. J. Prod. Res. 2017, 55, 5597–5608. [Google Scholar] [CrossRef]
  5. Bouzidi, Z.; Terrissa, L.S.; Zerhouni, N.; Ayad, S. An efficient cloud prognostic approach for aircraft engines fleet trending. Int. J. Comput. Appl. 2020, 5, 514–529. [Google Scholar] [CrossRef]
  6. Tao, F.; Zhang, M. Digital twin shop-floor: A new shop-floor paradigm towards smart manufacturing. IEEE Access 2017, 5, 20418–20427. [Google Scholar] [CrossRef]
  7. Sun, X.M.; Bao, J.S.; Li, J.; Zhang, Y.M.; Liu, S.M. A digital twin-driven approach for the assembly-commissioning of high precision products. Robot. Comput.-Integr. Manuf. 2020, 61, 1–14. [Google Scholar] [CrossRef]
  8. Sun, X.M.; Zhang, R.; Liu, S.M.; Lv, Q.B.; Bao, J.S.; Li, J. A digital twin-driven human–robot collaborative assembly-commissioning method for complex products. Int. J. Adv. Manuf. Technol. 2021, 1–14, early access. [Google Scholar] [CrossRef]
  9. Huang, H.Y.; Yang, L.; Wang, Y.B.; Xu, X.; Lu, Y.Q. Digital twin-driven online anomaly detection for an automation system based on edge intelligence. J. Manuf. Syst. 2021, 59, 138–150. [Google Scholar] [CrossRef]
  10. Grieves, M.W. Virtually Perfect: Driving Innovative and Lean Products through Product Lifecycle Management; Space Coast Press: Cocoa Beach, FL, USA, 2011. [Google Scholar]
  11. Grieves, M.W.; Vickers, J. Digital Twin: Mitigating Unpredictable, Undesirable Emergent Behavior in Complex Systems; Springer: Cham, Switzerland, 2017; pp. 85–113. [Google Scholar]
  12. Tao, F.; Liu, W.R.; Liu, J.H.; Liu, X.J.; Liu, Q. Digital twin and its potential application exploration. Comput. Integr. Manuf. Syst. 2018, 24, 1–18. [Google Scholar]
  13. Zhuang, C.B.; Liu, J.H.; Xiong, H. Digital twin-based smart production management and control framework for the complex product assembly shop-floor. Int. J. Adv. Manuf. Technol. 2018, 96, 1149–1163. [Google Scholar] [CrossRef]
  14. Perez, L.; Rodriguez-Jimenez, S.; Rodriguez, N.; Usamentiaga, R.; Garcia, D.F. Digital twin and virtual reality based methodology for multi-robot manufacturing cell commissioning. Appl. Sci. 2020, 10, 3633. [Google Scholar] [CrossRef]
  15. Guo, D.Q.; Zhong, R.Y.; Lin, P.; Lyu, Z.Y.; Rong, T.M.; Huang, G.Q. Digital twin-enabled graduation intelligent manufacturing system for fixed-position assembly islands. Robot. Comput.-Integr. Manuf. 2020, 63, 101917. [Google Scholar] [CrossRef]
  16. Yi, Y.; Yan, Y.H.; Liu, X.J.; Ni, Z.H.; Feng, J.D. Digital twin-based smart assembly process design and application framework for complex products and its case study. J. Manuf. Syst. 2020, 58, 94–107. [Google Scholar] [CrossRef]
  17. Gregorio, J.L.; Lartigue, C.; Thiebaut, F.; Lebrun, R. A digital twin-based approach for the management of geometrical deviations during assembly processes. J. Manuf. Syst. 2021, 58, 108–117. [Google Scholar] [CrossRef]
  18. Polini, W.; Corrado, A. Digital twin of composite assembly manufacturing process. Int. J. Prod. Res. 2020, 58, 5238–5252. [Google Scholar] [CrossRef]
  19. Sierla, S.; Kyrki, V.; Aarnio, P.; Vyatkin, V. Automatic assembly planning based on digital product descriptions. Comput. Ind. 2018, 97, 34–46. [Google Scholar] [CrossRef]
  20. Shi, W.; Cao, J.; Zhang, Q.; Li, Y.; Xu, L. Edge computing: Vision and challenges. IEEE Internet Things J. 2016, 3, 637–646. [Google Scholar] [CrossRef]
  21. Tao, F.; Zhang, M.; Nee, A.Y.C. Digital Twin and Cloud, Fog, Edge Computing. Digital Twin Driven Smart Manufacturing; Elsevier: Amsterdam, The Netherlands, 2019; pp. 171–181. [Google Scholar]
  22. Zhang, P.N.; Li, X.F.; Wu, D.P.; Wang, R.Y. Edge-cloud collaborative entity state data caching strategy toward networking search service in CPSs. IEEE Trans. Ind. Inform. 2021, 17, 6906–6915. [Google Scholar] [CrossRef]
  23. Xu, S.H.; Zhang, Z.J.; Kadoch, M.; Cheriet, M. A collaborative cloud-edge computing framework in distributed neural network. EURASIP J. Wirel. Commun. Netw. 2020, 1, 211. [Google Scholar] [CrossRef]
  24. Ding, K.; Chan, T.S.; Wang, Y.; Zhu, X.K.; Zhang, F.Q. Industrial Internet of things architecture and autonomous production control technologies for smart factories based on cloud-edge interplay. Comput. Integr. Manuf. Syst. 2019, 25, 3127–3138. [Google Scholar]
  25. Song, C.H.; Xu, W.X.; Han, G.J.; Zeng, P.; Wang, Z.F. A cloud edge collaborative intelligence method of insulator string defect detection for power IIoT. IEEE Internet Things J. 2021, 8, 7510–7520. [Google Scholar] [CrossRef]
  26. Jamshidi, J.; Owen, G.W.; Mileham, A.R. A new data fusion method for scanned models. J. Comput. Inf. Sci. Eng. 2006, 6, 340–348. [Google Scholar] [CrossRef]
  27. Jamshidi, J.; Kayani, A.; Iravani, P.; Maropoulos, P.G.; Summers, M.D. Manufacturing and assembly automation by integrated metrology systems for aircraft wing fabrication. Proc. Inst. Mech. Eng. Part B J. Eng. Manuf. 2010, 224, 25–36. [Google Scholar] [CrossRef]
  28. Maropoulos, P.G.; Muelaner, J.E.; Summers, M.D.; Martin, O.C. A new paradigm in large-scale assembly-research priorities in measurement assisted assembly. Int. J. Adv. Manuf. Technol. 2014, 70, 621–633. [Google Scholar] [CrossRef] [Green Version]
  29. Cui, Z.Z.; Du, F.Z. A coordination space model for assemblability analysis and optimization during measurement-assisted large-scale assembly. Appl. Sci. 2020, 10, 3331. [Google Scholar] [CrossRef]
  30. Bao, J.S.; Li, Z.Q.; Xiang, Q.; Wu, D.L.; Zheng, X.H. The modeling, evolutionary and application of quasi-physical virtual assembly. J. Mech. Eng. 2018, 54, 61–69. [Google Scholar] [CrossRef]
  31. Chen, Z.H.; Du, F.Z.; Tang, X.Q. Position and orientation best-fitting based on deterministic theory during large scale assembly. J. Intell. Manuf. 2015, 29, 827–837. [Google Scholar] [CrossRef]
  32. Wang, Q.; Dou, Y.D.; Li, J.X.; Ke, Y.L.; Keogh, P. An assembly gap control method based on posture alignment of wing panels in aircraft assembly. Assem. Autom. 2017, 37, 422–433. [Google Scholar] [CrossRef] [Green Version]
  33. Liu, J.H.; Sun, Q.C.; Cheng, H.; Liu, X.K.; Ding, X.Y. The State-of-the-art, Connotation and Developing Trends of the Products Assembly Technology. J. Mech. Eng. 2018, 54, 2–28. [Google Scholar] [CrossRef]
  34. Wang, J.L.; Zhang, J. Big data driven key factor identification for cycle-time forecasting of wafer lots in semiconductor wafer fabrication system. J. Mech. Eng. 2018, 54, 185–191. [Google Scholar] [CrossRef]
  35. Schleich, B.; Anwer, N.; Mathieu, L.; Wartzack, S. Shaping the digital twin for design and production engineering. CIRP Ann. 2017, 66, 141–144. [Google Scholar] [CrossRef] [Green Version]
Figure 1. The connotation of the assembly-commissioning process.
Machines 10 00011 g001
Figure 2. The framework for performance prediction supported by digital twin.
Machines 10 00011 g002
Figure 3. The flowchart of the proposed performance prediction method.
Machines 10 00011 g003
Figure 4. Selection mechanism of KAFPs.
Machines 10 00011 g004
Figure 5. Measurement data correction.
Machines 10 00011 g005
Figure 6. The key internal structure of the servo valve.
Machines 10 00011 g006
Figure 7. Prototype system platform deployment.
Machines 10 00011 g007
Figure 8. The prediction effect of each model. ((a) IE-TrAdaboost; (b) IE-ANN; (c) IE-SVR; (d) IE-RF).
Machines 10 00011 g008
Figure 9. The performances of prediction model with KAFPs selection. ((a) EVS; (b) R2; (c) MSE; (d) MAE).
Machines 10 00011 g009
Figure 10. The performances of the prediction model without KAFPs selection. ((a) EVS; (b) R2; (c) MSE; (d) MAE).
Machines 10 00011 g010
Table 1. Calculation Method of four indicators.
IndexesCalculation
EVS EVS = 1 V a r { y y ^ } V a r { y }
MSE MSE = 1 n i = 1 n ( y y ^ ) 2
MAE MAE = 1 n i = 1 n | y y ^ |
R2 R 2 = 1 i = 1 n ( y     y ^ ) 2 i = 1 n ( y     y ¯ ) 2
Table 2. Assembly-commissioning process and control parameters.
Assembly Process StepsControl Parameters
Component
assembly
Assembly of valve sleeve componentReturn oil damper hole size
Assembly of throttle hole componentInterference fit between throttle hole and oil filter
Blockage of pressure nozzle sealSealing plugging and interference fit of nozzle tail hole
Assembly of torque motor componentArmature clearance;
Median moment;
Pure steel degree;
Hysteresis band
Assembly-
commissioning
Pre-pressure nozzleSpacing between nozzle and baffle
Preinstall valve sleeve, spool, throttle hole component, armature component, moment motor on valve bodyGeometric dimensions
Fine assembly and commissioning:
comprehensive commissioning of resolution, hysteresis, static characteristics, phase bandwidth, bias, non-linearity, degree of asymmetry, zero position leakage, etc.
Geometric dimensions;
The performance of the front stage is stable;
Pre-stage pressure gain;
Remaining magnetism of shell;
Hydraulic zero position;
Mechanical zero position;
Electromagnetic zero position; etc.
Table 3. The original data of KAFPs affecting hysteresis characteristics.
NumberAssembly Feature ParametersSample 1Sample 2Sample 3Sample 4Sample 5
x1Clearance between valve core and valve sleeve hole (mm)0.00320.00350.00330.00300.0033
x2Clearance between valve sleeve and valve body (mm)0.00120.00220.00170.00190.0016
x3Interference between spring tube and baffle (mm)0.01410.01220.01310.01450.0134
x4Parallelism between spring tube base and armature pole shoe (mm)0.02000.01800.02200.02700.0300
x5Parallelism between spring tube base and armature pole shoe (mm)0.01270.01430.01290.01380.0121
x6Clearance of bushing 1 (mm)0.00500.00490.00570.00620.0055
x7Clearance of bushing 2 (mm)0.00600.00550.00580.00540.0048
x8Clearance of bushing 3 (mm)0.00530.00450.00670.00410.0066
x9Clearance of bushing 4 (mm)0.00660.00710.00540.00570.0072
x10Shell left end face runout (mm)0.01820.01280.01120.01450.0162
x11Shell right end face runout (mm)0.01190.01380.01230.01200.0155
x12Thickness of left gasket (mm)0.77100.71200.79100.78900.7540
x13Thickness of right gasket (mm)0.77400.73100.77200.76100.7580
x14Spring tube stiffness (106 N/m)0.5570.5070.5930.4820.524
x15Stiffness of feedback rod (106 N/m)3.6673.6423.7793.8413.476
x16Left nozzle flow (L/min)138142136133147
x17Right nozzle flow (L/min)134139141133135
x18Demagnetization voltage (V)3942374041
PHysteresis (%)0.2210.3810.2600.2280.293
Note: the pressure difference between throttle and nozzle is 10 MPa.
Table 4. The KAFPs selection results.
NumberKAFPs
x1Clearance between the valve core and valve sleeve hole (mm)
x2Clearance between valve sleeve and valve body (mm)
x3Interference between spring tube and baffle (mm)
x4The parallelism between spring tube base and armature pole shoe (mm)
x5Interference between spring tube and armature (mm)
x8Clearance of bushing 3 (mm)
x9Clearance of bushing 4 (mm)
x14Spring tube stiffness (106 N/m)
x15Stiffness of feedback rod (106 N/m)
x16Left nozzle flow (L/min)
x17Right nozzle flow (L/min)
Table 5. Measurement data correction results.
Number1234567Correction Value
x10.00320.00330.00320.00350.00330.00340.00360.0033
x20.00220.00200.00170.00190.00180.00190.00170.0018
x30.01410.01420.01410.01420.01430.01460.01430.0142
x40.02090.02110.02100.02040.02080.02070.02080.0209
x50.01270.01330.01290.01280.01270.01280.01290.0128
x80.00610.00640.00630.00610.00650.00640.00630.0063
x90.00660.00700.00620.00670.00650.00690.00660.0067
x140.5590.524
x153.6693.641
x16138135136135137138134136
x17136142135137137138131137
Table 6. The parameters of algorithm model.
Algorithm ModelParameters
IE-TrAdaboostWeak learner: 4-layer neural network model; Hidden neuron:
21 × 2; α: 0.05; N: 10
IE-ANN4-layer neural network model; Hidden neuron: 23 × 2; α: 0.05;
IE-SVRKernel: rbf, C: 1e3; Gamma = 0.01
IE-RFMax_depth: 80; Max_features: 3; Min_samples_leaf: 4; Min_samples_split: 10; N_eatimators: 200
Table 7. The experimental analysis results.
Correction + IE + TrAdaboostIE + TrAdaboostTrAdaboost
Relative error0.35%1.83%5.26%
Traditional methodProposed method
Cycle20 min1.6 min
Publisher’s Note: MDPI stays neutral with regard to jurisdictional claims in published maps and institutional affiliations.

