Article

Corn Disease Recognition Based on Attention Mechanism Network

1
College of Electrical and Electronic Engineering, Anhui Science and Technology University, Bengbu 233030, China
2
College of Artificial Intelligence, Nankai University, Tianjin 300350, China
*
Author to whom correspondence should be addressed.
Axioms 2022, 11(9), 480; https://doi.org/10.3390/axioms11090480
Submission received: 18 July 2022 / Revised: 2 September 2022 / Accepted: 13 September 2022 / Published: 18 September 2022
(This article belongs to the Special Issue A Hybrid Analysis of Information Technology and Decision Making)

Abstract

:
To extract more accurate and abundant features of corn disease and solve the problems of rough classification and low recognition accuracy, the attention mechanism is introduced into the field of corn disease recognition. The corn disease recognition model (AT-AlexNet) is proposed based on an attention mechanism. The network was based on AlexNet, and the new down-sampling attention module was constructed to enhance the foreground response of the disease; the Mish activation function was introduced to improve the nonlinear expression of the network; the new module of the full connection layer was designed to reduce the network parameters. In the experiment of the enhanced corn disease datasets, the average recognition accuracy of the attention-based network model AT-AlexNet is 99.35%. The recognition accuracy of using the Mish activation function is 0.65% higher than that of the ReLu activation function. The experiments show that compared with other identification methods, the proposed method has better classification performance for corn diseases.

1. Introduction

The accurate identification of diseases is the premise of scientific control and the basis of effectively improving crop yield. Currently, traditional machine and deep-learning methods are mainly used in crop disease detection [1,2,3,4]. Traditional machine-learning techniques to detect crop diseases are usually divided into four stages: image preprocessing, image segmentation, feature extraction, and classification [5,6,7,8]. There are some problems in feature extraction, such as the artificial feature pattern setting, the stability of feature extraction, and the significant influence of the environment, which lead to the traditional algorithms being unable to detect disease accurately. Deep-learning technology builds a disease recognition network by extracting the disease feature information on the crop surface, which avoids the problem of time-consuming and laborious feature extraction, and improves the recognition accuracy of crop diseases [9,10,11].

Related Work and Motivation

In recent years, deep learning [12,13,14] has shown good performance in fields such as computer vision, due to its powerful feature of self-learning capability, providing a new solution for pattern recognition, image processing, speech recognition, and other fields [15,16,17,18]. It has become a reality to detect and recognize disease images in the complex background by using this technology. Convolutional neural networks (CNN) [19,20,21,22,23] can automatically extract the relevant features from input images independently of specific features of images and have been widely used in the field of crop disease identification, such as corn. For example, Sladojevic et al. [24] used AlexNet architecture to realize multi-plant disease image recognition. Sun Jun et al. [25] combined batch normalization and global pooling to improve the AlexNet classic network recognition model. The final average test recognition accuracy on the PlantVillage plant disease dataset reached 99.56%. In the corn disease recognition, the traditional CNN network was improved by using the combination of dilated convolution and multi-scale convolution to obtain higher accuracy or a faster training speed [26,27,28]. Fan Xiang Peng et al. [29] optimized CNN using the L2 regularization method and Dropout algorithm, which improved the average recognition accuracy by 9.02% compared to the pre-optimization, and achieved an accuracy of 83.3% in the recognition of diseases in the corn field. An improved LeNet model was proposed by changing the size and depth of the convolution kernel, and the classification test of three corn diseases was carried out on the PlantVillage dataset, which improved the classification accuracy [30]. On the basis of the DenseNet model, the structure was adjusted, and migration learning was introduced, and a Mobile-DANet model was proposed, which achieved an average accuracy of 95.86% in corn disease recognition [31]. Xu Jinghui et al. [32] deleted the fully connected layer of the VGG16 network model and redesigned it. Then, the pre-training parameters of the VGG16 model were directly transferred to the newly synthesized model, and the datasets of corn leaf spot, rust, and healthy leaves were used to continue training to obtain the recognition model of the two diseases, and the average accuracy of 95.33% was obtained. Vision Transformer (ViT) [33] can use the self-attention mechanism to obtain the global features of the image, not only to capture the dependencies between adjacent elements. It has achieved excellent performance in image classification tasks and requires fewer training resources. However, ViT has high requirements of datasets and weak generalization ability. It needs to be pre-trained on larger datasets (ImageNet, CIFAR-100, VTAB, etc.), and then the model is transferred to small datasets for fine-tuning training. In order to improve the quality of model recognition, more authors are no longer limited to the extension and stacking of the depth and width of the convolutional blocks. The authors gradually integrate the attention mechanism into the convolutional neural network, and conduct some exploratory research. For example, Jia Zhaohong et al. [34] proposed a bilinear attention tomato disease period-recognition method based on Res2Net, which improved the fine-grained representation ability of the network through multi-scale features and attention mechanism. The classification accuracy of the tomato leaf disease datasets of 7 different species and 14 disease degrees was 98.66% and 86.89%, respectively. Huang Linsheng et al. [35] introduced the Inception module into the residual network (ResNet18). They added the attention mechanism SE-Net to obtain an average recognition accuracy of 95.62% on eight crop disease datasets in a real field environment. Sun Wenbin et al. [36] introduced the attention module SMLP into the ResNet network, which reduced the number of model layers and improved its recognition rate. The accuracy rate in the Plant Village datasets reached 99.32%. Liu Bin et al. [37] introduced the CBAM attention module into the Inception-ResNet V2 network to improve the network’s feature extraction ability and the classification performance under the fine-grained classification task of the model. Although CNN has achieved excellent results in the identification of crop diseases and insect pests and made some breakthroughs in the utilization of attention mechanism, it still has some problems.
  • Different types of diseases have little difference in appearance at the initial stage of growth. The diseases may overlap with light intensity changes, noise, background interference, etc. The convolutional neural network can automatically extract image features and overcome the defects of traditional methods, while the convolution kernel performs feature fusion on the local area when extracting the feature map and captures the local spatial relationship, resulting in classification errors;
  • The attention mechanism is still in the exploratory stages of improving the image feature extraction ability of CNN models. At present, the typical attention modules in convolutional neural networks mainly include the SE attention mechanism [38] and the CBAM attention mechanism [39], which use global pooling to extract high-level features of disease images, decouple the channel correlation and spatial correlation of features, and improve the ability of detailed disease-feature extraction to a certain extent. However, these cannot capture the nonlinear relationship between channels, and the use of global pooling compresses the dimension of features, resulting in the loss of detailed information.
In aiming at the shortcomings of the existing CNN network and attention mechanism and in order to realize the accurate classification and recognition of corn common rust, bipolar maydis, own spot, Curvularia lunata (wakker) Boed spot, Northern leaf blight, and sheath blight, a new corn disease identification network AT-AlexNet is proposed in this paper based on the AlexNet network, fusing the down-sampling attention module (Down AM). The 1 × 1 convolution and 3 × 3 group-convolution are used to decouple the channel correlation and spatial correlation of features, respectively [40], to find the critical information in the features and then superimpose on the original down-sampling results. This module can enhance the foreground response of the disease during the down-sampling process, which is conducive to the retention of detailed characteristics of diseases, and improve the ability of the network to detect multiple diseases. The main innovations or contributions of this paper are as follows:
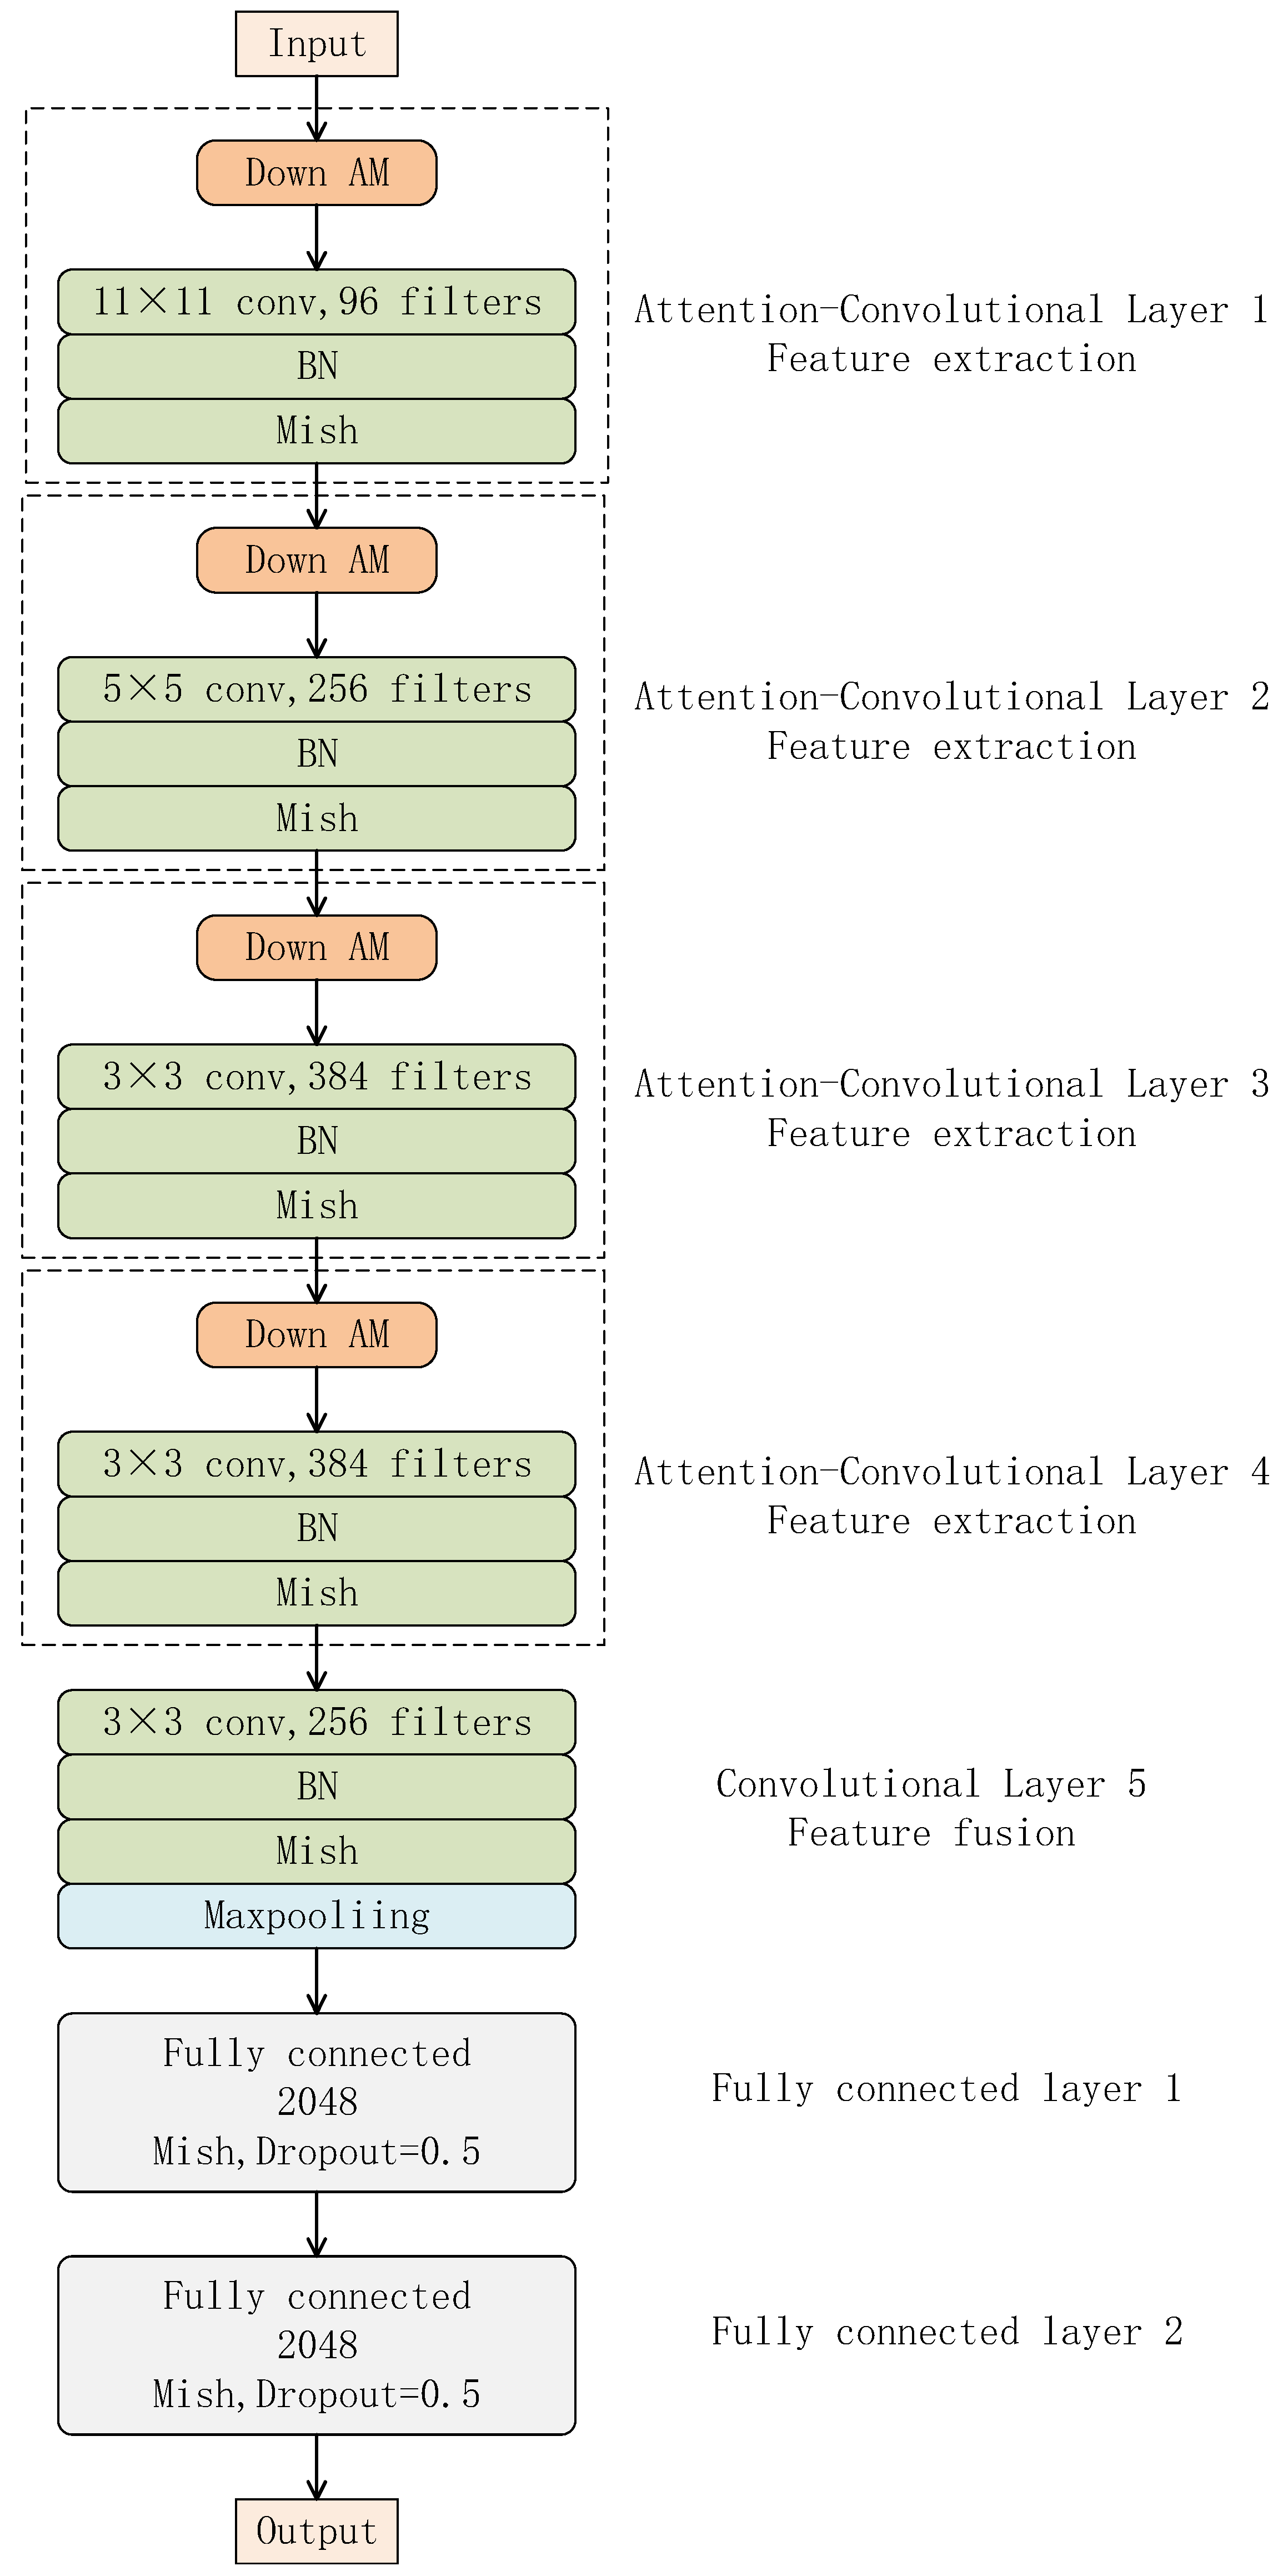
  • In the field of crop diseases, the attention mechanism is introduced, and the down-sampling attention module is designed and embedded into the AlexNet network to reduce the loss of detailed disease-feature information and improve the network’s ability to extract disease features;
  • By using group convolution in the network, the recognition accuracy of the model is improved while the parameters are reduced;
  • The Mish function is used to improve the traditional ReLu activation function in the convolutional neural network to enhance the non-linear expression ability of the network;
  • A new fully connected layer is constructed to reduce the model’s parameters. Finally, the corn disease identification and the detection algorithm AT-AlexNet of attention neural network are formed, which are trained and tested on the datasets of six corn diseases and verify the feasibility and accuracy of the model proposed in this paper.

2. Materials and Methods

2.1. Data Sources

The experimental data came from the Anhui Academy of Agricultural Sciences and were taken manually in the corn field with camera equipment. To ensure the diversity of data, multi-angle photography was carried out. The image background contained straw, soil, weeds, and other complex conditions. There are 470 images of common rust, 645 images of bipolar maydis, 260 images of own spot, 546 images of Curvularia lunata (wakker) Boed spot, 356 images of Northern leaf blight, and 448 images of sheath blight; a total of 2725 images of corn disease. The symptoms of six corn diseases are shown in Figure 1.

2.2. Data Preprocessing

2.2.1. Data Augmentation

In the process of image acquisition, affected by factors such as changes in light intensity, noise, mechanical vibration, etc., the poor imaging quality of a few images leads to the formation of complex samples, resulting in the degradation of disease-detection performance. In order to enhance the robustness of the network and improve the detection ability of the network for difficult samples, the data enhancement technique is used to expand the training data. One is to increase the number of disease image samples, and the other is to simulate the different light and shooting angles in the actual field to increase the diversity of sample characteristics and improve the data quality. The dataset of this paper adopts the following six data augmentation methods: (1) random rotation; (2) horizontal shift; (3) vertical shift; (4) random shear; (5) random zoom; (6) horizontal flip. By changing the position and direction of the picture, it can simulate the shooting of different camera positions, shear and zoom can select different positions of the image for training, and the final enhanced dataset is 10,785. The original image and the enhanced image are shown in Table 1.

2.2.2. Sample Normalization

This paper adjusts the pictures in the dataset to the same size, 256 × 256 pixels; all pictures are in JPG format. To reduce the amount of calculation, each channel pixel is normalized to prevent the gradient explosion problem in the model training and accelerate the convergence of the model.

2.3. Experiment Method

The data used in this paper are corn disease data in the field environment, including noise information such as background interference. With the increase in network depth, the weight of noise information in the feature map is also increasing, which reduces the accuracy of the disease identification. The feature maps obtained by image information through convolution and pooling operations usually lack the distinction of the importance of each channel. Assuming that the convolution kernel is an N-dimensional channel, a new characteristic map of N channels will be generated after convolution. For each channel on the feature map, a weight coefficient is used to represent the correlation between different channels and the extracted disease features. The larger the weight coefficient, the higher the correlation of the channel, and the greater the contribution of the extracted features. The weight of each channel can be adjusted by using the attention mechanism, and the importance of each channel can be obtained by assigning weights to different positions, help the model to capture semantic information that is more helpful for the recognition task, enhance the practical features, suppress the importance of interfering elements such as noise, reduce its negative impact on model recognition, and increase the representation of the network. Finally, the purpose of improving the recognition performance of the model is achieved [41,42,43].
Due to the problem of information loss in the process of conventional channel attention acquisition, the disease information is lost. An attention neural network AT-AlexNet based on down-sampling attention and AlexNet network is proposed to detect and identify 6 diseases of corn in this paper. The structure of the AT-AlexNet network model is mainly divided into 3 parts, the feature extraction module, the feature fusion module, and the fully connected classification module. The overall framework of the model is shown in Figure 2.
The down-sampling attention module can increase the receptive field so that the subsequent convolution kernels can learn more global information. The AT-AlexNet feature-extraction module includes a down-sampling attention module and an ordinary convolution layer; the batch normalization layer (BN) and nonlinear layer (Mish) are added after convolution operation to accelerate the convergence speed of the model and improve the stability of the network at the same time. The feature fusion module consists of 256 3 × 3 convolution kernels, BN layers, Mish layers, and maximum pooling, fully fused with the image features extracted based on the attention mechanism to obtain the final corn disease feature information. The fully connected classification module uses two layers of fully connected and softmax layers to classify the extracted disease-feature images. The fully connected layer is reconstructed and designed, and 2048 neurons are used to replace 4096 neurons in the fully connected layer of the AlexNet network, thereby reducing the number of parameters in the model. A Mish activation function is used in each fully connected layer to increase the nonlinearity of the network, and the dropout strategy is used to suppress overfitting.

2.3.1. Basic Network

The recognition of corn disease proposed in this paper is based on the AlexNet network. The entire network structure parameters of AlexNet are shown in Figure 3. The AlexNet network consists of 5 convolutional layers (Conv), 3 pooling layers (Max pool), 2 fully connected layers (FC), and the Softmax layer. The AlexNet network has large parameters, the model is easy to over-fit, and the generalization ability in the other datasets is weak. Introducing the down-sampling attention module enhances the disease-feature information, thereby improving the network’s ability to detect multiple diseases. This research mainly embeds the attention module in the first 4 convolution layers of the network and reconstructs the full connection layer of the network.

2.3.2. Down-Sampling Attention Module

The down-sampling layer has two functions, one is to reduce the amount of calculation and prevent overfitting; the other is to increase the receptive field so that the subsequent convolution kernels can learn more global information. Commonly used down-sampling methods mainly use 3 × 3 convolution with stride 2 or 2 × 2 max pooling with stride 2 [25,44]. However, these two methods will, to a certain extent, cause the loss of useful information.
A down-sampling attention module (Down AM) with two parallel channels is constructed in this paper to obtain better representational power. Its structure is shown in Figure 4. One is used for the 3 × 3 conventional convolution down-sampling with stride 2. Batch Normalization is used to bring each neuron closer to the saturated region in the value interval. It is projected into the normal distribution with the mean value of 0 and the variance of 1 to accelerate the convergence of the model. When combined with the Mish nonlinear layer, the nonlinear characteristics are greatly increased on the premise that the size of the feature map is unchanged, thereby improving the expression ability of the network. The other is down-sampled by 2 × 2 max pooling to increase the receptive field, and then decoupled with two consecutive 1 × 1 convolutions and 3 × 3 group convolutions, respectively, the channel correlation and spatial correlation of features. To enhance the feature information and reduce the loss of disease feature information, then the dimension of the image is changed by 1 × 1 convolution, and Batch Normalization is added while using the Mish activation function. Finally, the feature maps obtained from the two channels are fused, and the final sparse feature map is output through 1 × 1 convolutional dimension reduction.

2.3.3. Mish Activation Function

In order to avoid destroying the interest manifold of the network, an activation function is introduced into the network to increase the nonlinearity of the neural network model. The ReLu activation function is widely used in the convolutional neural network because of its linear and unsaturated form, which overcomes the advantage of gradient vanishing. The ReLu function is directly truncated when negative, and the gradient is not smooth enough. Therefore, a new activation function, Mish function [45], is proposed to optimize the network in this paper. The Mish activation function shown in Equation (1) is used in the network’s convolution layer and full connection layer modules. Mish is a smooth nonmonotonic activation function that successfully avoids the problem of gradient saturation because of its boundless characteristics. When it is negative, it is not completely truncated. Still, it does allow a relatively small negative gradient to flow to ensure information flow and stabilize the network’s gradient flow. The expression of the Mish activation function is:
Mish = x tanh ( ln ( 1 + e x ) )

2.3.4. Group Convolution

Group convolution (GC) can be regarded as the sparse operation that improves the model’s recognition accuracy while reducing the number of parameters. The method of grouping convolution can increase the diagonal correlation between convolution kernels of adjacent layers and reduce training parameters and overfitting, similar to the effect of regularization. The calculation process of group convolution is shown in Figure 5. The number of input feature channels C is divided into G groups, and the convolution kernels are divided into G groups. The number of channels of each convolution kernel is C/G. After group convolution, the output of the G group is spliced to obtain the feature map with N channels. The parameter size of the grouped convolution is as Equation (2):
P G C = K × K × C G × N
where G is the number of groups of input characteristic channels; it can be seen that the group convolution reduces the parameters and the amount of calculation, the total amount of parameters is reduced to 1/G of the original, and the amount of calculation is also 1/G of the conventional convolution, thereby improving the efficiency of the network.

2.3.5. Batch Normalization

Equations (3) and (4) are used to force the distribution of input values of any neuron in each layer of the neural network to be pulled back to the standard normal distribution to speed up network convergence and improve gradient vanishes [25].
μ = 1 n i = 1 n x i
σ = 1 n i = 1 n ( x i μ ) 2
where μ and σ in Equations (3) and (4) represent the mean and variance of each training batch data, respectively, which are substituted into Equation (5), normalize the training data of this batch to obtain x i , where ε is a small positive constant and the denominator is avoided to be 0:
x i = x i - μ σ 2 + ε
In order to prevent the destruction of the feature distribution during the normalization process, the transformation formula shown in Equation (6) is used to return to the original feature distribution. Here, γ i and β i represent the reconstruction parameters learned, which are calculated by Equations (7) and (8):
y i = γ i x i + β i
γ i = V a r [ x i ]
β i = E [ x i ]

2.3.6. Dropout Strategy

By randomly resetting the weights of some neurons to 0 in each training process, the inhibited neurons temporarily do not participate in the forward propagation of the network. They still retain their weights to suppress the occurrence of overfitting effectively and then to improve the model’s generalization ability. The regularization parameter in the model is set to 0.3, and 30% of neurons are discarded [46]. The calculation method of the Dropout strategy is shown in Equations (9)–(12):
r j l ~ B e r n o u l l i ( p )
y ˜ ( l ) = r ( l ) y ( l )
z i ( l + 1 ) = w i ( l + 1 ) y ˜ ( l ) + b i ( l + 1 )
y i ( l + 1 ) = f ( z i ( l + 1 ) )
where y ˜ ( l ) represents the output of some neurons in this layer; w i ( l + 1 ) , b i ( l + 1 ) and z i ( l + 1 ) represent the ( l + 1 ) -th weight value and bias in the i -th layer, respectively; f ( ) represents the activation function; B e r n o u l l i ( p ) represents the binomial probability distribution.

2.3.7. Softmax Classification

This paper uses the softmax classifier to recognize and classify the diseases. Softmax classification is a supervised learning method used to deal with multi-classification problems. Its basic principle is the ratio of the index of a neuron to the sum of the indices of all neurons in the matrix, and the node with the most significant ratio is selected as the classification result. The output results of the full connection layer are sent to the softmax logistic regression model for category judgment, and the probability distribution of each category can be calculated by Equation (13):
P i = e x i i = 1 c e x i , i = 1 , 2 , , c
where P i is the probability of classification for each category; x i is the output of the fully connected layer; c is the total number of categories in the dataset.
Label smoothing is performed before label input so that the overfitting phenomenon can be effectively suppressed when calculating the loss value, as shown in Equation (14):
y i = ( 1 ε ) y i + ε c
where y i is the real predicted value, and the binary_crossentropy loss function is calculated using the obtained classification results and the regularized labels, as shown in Equation (15). According to the obtained loss function value, the network weight parameters are adjusted by backpropagation:
L o s s = 1 c i = 1 c y i log ( P i ) + ( 1 y i ) log ( 1 P i )

2.3.8. Model Computation Flow

The specific implementation steps of the attention neural network model AT-AlexNet proposed in this paper for corn disease recognition are shown in Figure 6.
Step 1: Read the disease image data, adjust the sample size uniformly to 256 × 256 pixels, and perform normalization processing on each channel pixel;
Step 2: Input the processed data into the down-sampling attention module, use 1 × 1 convolution and 3 × 3 group convolution to decouple the channel correlation and spatial correlation of features, divide the importance of image features, and obtain feature maps available attention information;
Step 3: Extract multi-dimensional image feature information through 96 × 11 × 11 convolution kernels to obtain a 32 × 32 × 96 feature map. Through the BN layer, each neuron is projected into the normal distribution with the mean value of 0 and the variance of 1 by Equations (3)–(8), and the Mish activation function is used to increase the nonlinear relationship between the layers of the neural network;
Step 4: Same as above, after 4 consecutive feature extractions of attention modules and convolution kernels of different sizes, a feature map of 4 × 4 × 384 is finally obtained;
Step 5: The final feature map is fused with the deep-level image feature information extracted by 256 × 3 × 3 convolution kernels, and the data dimension of the feature map is reduced by 3 × 3 max pooling, and the final 2 × 2 × 256 disease feature map is output;
Step 6: The flatten layer performs one-dimensional transformation of the multi-dimensional characteristic matrix output from the last pooling layer, and converts it from a 2 × 2 × 256 matrix to a 1 × 1024 vector;
Step 7: The disease features output by the previous stage are weighted and summed by two fully connected layers. The class-discriminative local information in the convolutional and pooling layers is integrated, and the learned distributed features are mapped to the sample label space. After the neuron is activated by the Mish activation function, the dropout mechanism is added, and the weights of some hidden layer nodes are randomly reset to zero using Equations (9)–(12) to reduce the amount of model parameters;
Step 8: The output result of the fully connected layer is sent to the softmax logistic regression model to judge the category by Equation (13), and finally realize the recognition and classification of the input disease image.

2.3.9. Model Evaluation Index

In classification, there is usually a problem with imbalanced datasets. However, using training and testing accuracy to evaluate model performance is not comprehensive enough, resulting in high accuracy but the misclassification of minority samples. To evaluate the recognition performance of the network model AT-AlexNet proposed in this paper, Accuracy, Precision, Recall, and F1 score are used as the evaluation indexes of the model. The expressions are shown as follows:
Accuracy is the ratio of correctly identified samples to the total number of samples in the classification task:
A c c u r a c y = T P + T N T P + T N + F P + F N
Precision is the proportion of correct predictions by the classification model in a given test set:
P r e c i s i o n = T P T P + F P
Recall is the rate at which the classification model correctly predicts positive classes in a given test set:
R e c a l l = T P T P + F N
F1_score can comprehensively consider precision and recall;
F 1 _ score = 2 × P r e c i s i o n × R e c a l l P r e c i s i o n + R e c a l l
where T P is the number of correctly classified positive samples; T N is the number of correctly classified negative samples; F P is the number of incorrectly classified positive samples; and F N is the number of incorrectly classified negative samples.
In addition, the loss value in the model training process is another indicator to judge the model’s performance. The faster the value of the loss function decreases, the faster the model converges; the smaller the value of the loss function, the stronger the robustness of the model and the better the performance.

3. Results

3.1. Experimental Environment

The experiment is under the operating environment of the Windows 10 (64-bit) operating system, the processor model is Intel(R) Core(TM) i5-10400F CPU@2.90 GHz, and the computer memory is 16 GB. It is completed under the Python 3.6.2, Tensorflow-gpu 1.14 + Keras 2.2.4 deep learning framework environment, which was developed by Google.

3.2. Training Parameter Settings

As for the data training and testing preparation, 80% and 20% of the datasets (the corn disease original and the enhanced datasets) were prepared for the training and testing datasets, respectively. The training datasets were used as the model’s input data, and the test datasets were used to evaluate the performance of the final model. Taking into account the experimental equipment and the training effect of the model, the stochastic gradient descent (SGD) was used to optimize the network weight during the training process. The initial learning rate was set to 0.01, the momentum was set to 0.9, and the decay coefficient was set to 0.0008. The batch-size was set to 32. The epoch is the number of iterations in the model training process, all of the training samples are iterated once as 1 epoch, and the number of training iteration epochs was set to 60 in this paper. The hyperparameter settings in the model training process of this paper are shown in Table 2.

3.3. Experimental Design

The experiment was divided into three parts: For exploring the effect of datasets (original dataset A and enhanced dataset B), different batch sizes (8, 16, 32), and different learning rates (0.1, 0.01, 0.001) on the disease detection results of the model, a total of 18 trials were conducted. The training and testing results of each group of experiments are shown in Table 3; through the ablation experiment of the AT-AlexNet network structure, the effect of the proposed module and improvement on the performance of the corn disease detection network was verified; the performance differences between AT-AlexNet and other network models in corn disease detection were compared under the same experimental conditions.

3.4. Analysis and Comparison of Training Results

Table 3 shows that the different datasets, batch sizes, and learning rates significantly impact the model’s performance during training and testing.

3.4.1. Analysis of the Impact of Data Enhancement

When the batch size is set to 32 and the learning rate is 0.01, the training and testing accuracy and loss value curves using two datasets (A and B) are shown in Figure 5. The recognition accuracy of the two models (AT-AlexNet-A and AT-AlexNet-B) for six diseases is shown in Table 4.
It can be seen from Table 4 that the AT-AlexNet-B model has a higher accuracy rate for disease identification, with the lowest accuracy of 98.39%. While the AT-AlexNet-A model can recognize the disease types, its accuracy is not high, so the possibility exists of recognizing the disease as other disease types. For example, the accuracy rate of the AT-AlexNet-A model in identifying Bipolaris maydis disease is 91.06%, so the probability of identifying different disease types is 8.94%. It is shown that the data enhancement improves the recognition accuracy of disease and the robustness of the model. Figure 7 shows that the accuracy and loss value curves of the AT-AlexNet-A model on the training and test datasets are both slow to converge, and the testing accuracy is 98.20%. The training and testing accuracy of the AT-AlexNet-B model under the enhanced dataset is higher, and the convergence speed is faster. The testing accuracy is 99.78%, 1.35% higher than the original datasets, and no overfitting occurred.

3.4.2. Analysis of the Impact of Batch-Size

When the training datasets are large, if the samples are input to the neural network at one time, it may lead to overflow, and the error will fall into the local minimum. For example, suppose that only one sample is read at a time. In that case, the training time will be long and inefficient, the objective function value obtained on each training sample may vary greatly, and the model’s generalization ability to the sample is poor. Therefore, it is necessary to set an appropriate batch-size value and input the samples into the network in batches for learning to make the model achieve the optimal final convergence accuracy.
To verify the effect of batch sizes on model performance, this paper set the batch size of the model to 8, 16, and 32 in turn and trained from scratch on the enhanced datasets. At the initial learning rate of 0.01, the accuracy and loss value curves of the training set and the test set of different batch sizes in the training process are shown in Figure 8.
With the increase in the batch size, the accuracy curves of the model on the training set and test set increase faster, and the final accuracy rate also increases. At the same time, the decrease rate of the loss value curve increases, the final loss value decreases, and the oscillation amplitude of the accuracy rate curve and the loss value curve decreases significantly. When the batch-size value is increased from 8 to 16, the training accuracy of the model increases by 1.52%. When the batch-size value is increased from 16 to 32, the training accuracy of the model increases by 0.21%, and the increase is decreased. Therefore, the final batch size selected in this paper was 32 to train on the datasets so that the model can achieve the optimal effect.

3.4.3. Analysis of the Impact of Learning Rate

The learning rate determines whether the model can converge on the optimal global solution and the convergence time on the optimal solution. When the learning rate is too small, the model will converge slowly, increase the time to find the optimal value, and easily trap the network in the local minimum or saddle point. When the learning rate is too large, the convergence speed of the model will be accelerated. The loss function will still, simultaneously, cross the optimal global value directly, and the model will oscillate around the optimal value and cannot converge.
At the learning rate of 0.1, 0.01, and 0.001, the training and testing accuracy of the model is shown in Table 3. When the learning rate is 0.1, the gradient oscillation amplitude of the loss function is large, and the training and testing accuracy of the model is low. When the learning rate is 0.01, the training and testing accuracy of the model is higher, and the increase is more significant. When the learning rate is 0.001, the model gradually deviates from the optimal global value, and overfitting occurs. Figure 9 shows the training, testing accuracy, and loss value curves of different learning rates when the batch size of the enhanced datasets is 32. Therefore, it can be seen that when the learning rate is set to 0.01, the model is trained best.

3.5. Network Structure Ablation Test

To verify the effectiveness of the model proposed in this paper in corn disease recognition, ablation experiments are performed on the model. Based on the AlexNet network, the network model presented in this paper is called AT-AlexNet. Modifying the activation function of AT-AlexNet to ReLu, the obtained network is called AT-AlexNet-R. The loss function of AT-AlexNet is adjusted to the CrossEntropy Loss, and the obtained network is called AT-AlexNet-C. The experiment results are shown in Table 5 and Figure 10.
The comparison of the AlexNet and AT-AlexNet results shows that the F1 score of the AT-AlexNet model is increased by 1.29%, the recognition accuracy is increased by 1.3%, and the test accuracy is increased by 1.73%. As seen in Figure 10, the AT-AlexNet network has a faster convergence speed and smoother curve. While the convergence speed of the AlexNet network is slow, an apparent overfitting phenomenon occurs. It shows that the down-sampling attention module can enhance the foreground response of the disease during the down-sampling process and improve the detection performance of the model. From the comparison of the results of AT-AlexNet and AT-AlexNet-R, it can be seen that the Mish activation function has a more vital nonlinear expression ability and a better effect than the ReLu activation function, and the recognition accuracy is improved by 0.65%. The test accuracy is improved by 0.19%. The comparison results of AT-AlexNet and AT-AlexNet-C show that the Binary_crossentropy loss function is adjusted to the CrossEntropy Loss function, the recognition accuracy decreases, and the convergence speed is slower. Therefore, under careful consideration, this paper uses the AT-AlexNet network model to detect corn diseases.

3.6. Model Effect Test

In classification problems, there is usually a problem with imbalanced datasets. It is not comprehensive enough to evaluate model performance only by training and testing accuracy. This will result in a high accuracy rate but misclassification of minority class samples. In this paper, the recognition performance of the model is comprehensively evaluated by calculating the Precision, Recall, F1 value, and Accuracy of the model. The calculation results are shown in Table 6. The average accuracy of the model after testing is 99.35%. The best classification effect is Northern leaf blight and own spot disease, with a recognition accuracy of 100%, and the lowest is Bipolaris maydis disease, with a recognition accuracy of 98.39%.

3.7. Model Performance Comparison Test

To further verify the detection performance of the model in this paper, under the same experimental conditions, the performance of the AT-AlexNet network was compared with the classical networks of LeNet and GoogLeNet on the training set and test set after data enhancement, and each model was iterated 60 times. The experiment results are shown in Table 7 and Figure 11.
Table 7 shows that the training accuracy of each model has reached more than 95%, indicating that the deep learning model has an excellent performance in classifying crop diseases. The accuracy of the model AT-AlexNet proposed in this paper is 99.78% on the testing set, which is 3.81% and 0.06% higher than the LeNet and GoogLeNet models, respectively. Among them, the Precision, Recall, and F1 score of the GoogLeNet model are slightly higher than those of the AT-AlexNet model.
As seen from Figure 11, during the training process, around the tenth iteration, the accuracy and loss value of the AT-AlexNet model on the training set and the testing set tend to converge, the curves are smooth, and higher accuracy and lower loss values are obtained. At the 20th iteration of the GoogLeNet model, the training set’s accuracy and loss value curves gradually converge. However, the testing set’s accuracy and loss value curves still oscillate greatly, and the model is overfitting. The convergence rate of the LeNet model is slow, it starts to converge when the model is iterated 50 times, and the effect on the testing set is poor.
In comprehensive comparison, under the same experimental conditions, compared with LeNet and GoogLeNet models, the model constructed in this paper has a higher recognition accuracy, a faster convergence speed, and no overfitting phenomenon, so the model has better performance in the recognition and detection of corn diseases.

4. Discussion

In the down-sampling attention module of the AT-AlexNet network, without adding the BN layer and Mish layer, the obtained network is called AT-AlexNet-D. The comparative test results of the two networks are shown in Table 8.
Through the comparison of the results of AT-AlexNet and AT-AlexNet-D, it can be seen that in the process of decoupling channel attention and spatial attention, the use of batch normalization (BN) and nonlinear activation function (Mish) increases the nonlinearity of the network, the performance of the down-sampling attention module is improved, and the recognition accuracy of the model is increased by 4.77%.
To solve the problem of information loss in the process of conventional channel attention acquisition, this paper adds the down-sampling attention module to make the model pay more attention to the valuable information for disease classification and recognition and to reduce the interference of the useless information, thereby avoiding the loss of detailed features of the disease. The network has high recognition accuracy and provides a new method for the recognition technology of crop diseases.

Model Application Guide

The ablation experiments of network structure show that the Mish activation function has a stronger nonlinear expression ability, which makes the network easier to optimize. The recognition accuracy of the model using the Mish activation function is 0.65% higher than that of the ReLu function. Similar to general deep learning, the size of the learning rate determines whether the model can converge to the global optimal solution and the time it takes to converge to the optimal solution. In parameter fine-tuning, when the learning rate is set to 0.1, the accuracy rate is generally low, and the loss value is also large. Moreover, a large learning rate will lead to a slower convergence speed and cause the accuracy rate and loss value curve to oscillate. Therefore, the learning rate of the model chosen in this paper was 0.01, so that the model converged on the global optimal solution. The batch-size value directly affects the recognition accuracy of AT-AlexNet, and the choice of the batch-size value is affected by the experimental environment and model factors. Through multiple experiments, the batch size value of this paper was finally determined to be 32 for the model training to ensure that the model was in the best state. In the analysis of the impact of datasets on the model performance, it can be seen that the data expansion improves the identification accuracy of the disease, can effectively alleviate the overfitting phenomenon, and thus improve the generalization ability of the model.
The corn disease recognition model based on the attention mechanism in this paper performed well in terms of disease detail-feature extraction, reduction in the feature information loss and network parameter calculation, and high recognition accuracy. However, at present, only six typical corn diseases were identified, and there are certain limitations in the scale of training samples and disease types. In future research, the disease types and sample size can be increased to make the model more generalizable and practical. In addition, integrating convolution network models with better performance, such as CoAtNet network [47], Efficientnet, etc., to study new, more practical and higher precision corn disease recognition networks is also a direction that can be explored.

5. Conclusions

This paper proposes the down-sampling attention module to address the problems of low recognition rate and poor accuracy of recognizing corn diseases. It constructs an attention-based corn disease recognition model AT-AlexNet. The average recognition accuracy of the model for 6 corn diseases is 99.35%. The results show that introducing the attention mechanism and adding the down-sampling attention module can enhance the ability to extract detailed features, reduce the loss of disease feature information, and help improve the recognition performance of the model. The comparison test results with other networks prove the effectiveness and accuracy of the proposed method, with higher recognition accuracy, shorter training and testing time, which has practical application value.

Author Contributions

Conceptualization, H.G. and Y.W.; methodology, H.G. and Y.W.; software, Y.W.; validation, Y.W.; formal analysis, Y.W.; investigation, H.G. and Y.W.; resources, H.G.; data curation, H.G.; writing—original draft preparation, Y.W.; writing—review and editing, Y.W., H.G. and J.T.; visualization, H.G. and Y.W.; supervision, H.G.; project administration, H.G. All authors have read and agreed to the published version of the manuscript.

Funding

This research was funded by the Natural Science Foundation of Anhui Province, China, grant number 1808085MF183, and Anhui University Top-notch Talents Academic Funding Project under grant number gxbjZD2020079.

Data Availability Statement

Not applicable.

Acknowledgments

The authors would like to express their thanks to the Anhui Academy of Agricultural Sciences for their help with the data preparation for this study.

Conflicts of Interest

The authors declare no conflict of interest.

References

  1. Parraga-Alava, J.; Cusme, K.; Loor, A.; Santander, E. RoCoLe: A robusta coffee leaf images dataset for evaluation of machine learning based methods in plant diseases recognition. Data Brief 2019, 25, 104414. [Google Scholar] [CrossRef] [PubMed]
  2. Tan, L.; Lu, J.; Jiang, H. Tomato Leaf Diseases Classification Based on Leaf Images: A Comparison between Classical Machine Learning and Deep Learning Methods. AgriEngineering 2021, 3, 542–558. [Google Scholar] [CrossRef]
  3. Zou, J.Z.; Ya, J.X.; Li, H.; Shuai, C.; Huang, D. Bridge apparent damage detection based on the improved YOLO v3 in complex background. J. Railw. Sci. Eng. 2021, 18, 3257–3266. [Google Scholar]
  4. Hou, J.X.; Li, R.; Deng, H.X.; Li, H.F. Leaf disease identification of fusion channel information attention network. Comput. Eng. Appl. 2020, 56, 124–129. [Google Scholar]
  5. Xie, C.Y.; Wu, D.; Wang, C.; Li, Y. Insect Pest Leaf Detection System Based on Information Fusion of Image and Spectrum. Trans. Chin. Soc. Agric. Mach. 2013, 44, 269–272. [Google Scholar]
  6. Arnal Barbedo, J.G. Digital image processing techniques for detecting, quantifying and classifying plant diseases. SpringerPlus 2013, 2, 660. [Google Scholar] [CrossRef]
  7. Prasad, S.; Peddoju, S.K.; Ghosh, D. Multi-resolution mobile vision system for plant leaf disease diagnosis. Signal Image Signal Image Video Processing 2016, 10, 379–388. [Google Scholar] [CrossRef]
  8. Chaudhary, P.; Chaudhari, A.K.; Godara, S. Color transform based approach for disease spot detection on plant leaf. Int. J. Comput. Sci. Telecommun. 2012, 3, 65–70. [Google Scholar]
  9. Mohanty, S.P.; Hughes, D.P.; Salathé, M. Using Deep Learning for Image-Based Plant Disease Detection. Front. Plant Sci. 2016, 7, 1419. [Google Scholar] [CrossRef]
  10. Yang, G.F.; Yang, Y.; He, Z.K.; Zhang, X.Y.; He, Y. A rapid, low-cost deep learning system to classify strawberry disease based on cloud service. Integr. Agric. 2022, 21, 460–473. [Google Scholar]
  11. Too, E.C.; Yujian, L.; Njuki, S.; Yingchun, L. A comparative study of fine-tuning deep learning models for plant disease identification. Comput. Electron. Agric. 2019, 161, 272–279. [Google Scholar] [CrossRef]
  12. Anitescu, C.; Atroshchenko, E.; Alajlan, N.; Rabczuk, T. Artificial neural network methods for the solution of second order boundary value problems. Comput. Mater. Contin. 2019, 59, 345–359. [Google Scholar] [CrossRef]
  13. Guo, H.; Zhuang, X.; Chen, P.; Alajlan, N.; Rabczuk, T. Stochastic deep collocation method based on neural architecture search and transfer learning for heterogene.ous porous media. Eng. Comput. 2022, 26, 1–26. [Google Scholar]
  14. Guo, H.; Zhuang, X.; Chen, P.; Alajlan, N.; Rabczuk, T. Analysis of three-dimensersional potential problems in non-homogeneous media with physics-informed deep collocation method using material transfer learning and sensitivity analysis. Eng. Comput. 2022, in press. [Google Scholar] [CrossRef]
  15. Szegedy, C.; Liu, W.; Jia, Y.; Sermanet, P.; Reed, S.; Anguelov, D.; Erhan, D.; Vanhoucke, V.; Rabinovich, A. Going deeper with convolutions. In Proceedings of the IEEE Conference on Computer Vision and Pattern Recognition, Boston, MA, USA, 7–12 June 2015. [Google Scholar]
  16. Janssens, O.; Slavkovikj, V.; Vervisch, B.; Stockman, K.; Loccufier, M.; Verstockt, S.; Van de Walle, R.; Van Hoecke, S. Convolutional Neural Network Based Fault Detection for Rotating Machinery. J. Sound. Vib. 2016, 377, 331–345. [Google Scholar] [CrossRef]
  17. Wang, K.; Wang, T.; Liu, L.; Yuan, C. Human behaviour recognition and monitoring based on deep convolutional neural networks. Behav. Inform. Technol. 2019, 40, 1–12. [Google Scholar] [CrossRef]
  18. Arefan, D.; Mohamed, A.A.; Berg, W.A.; Zuley, M.L.; Sumkin, J.H.; Wu, S. Deep learning modeling using normal mammograms for predicting breast cancer risk. Med. Phys. 2020, 47, 110–118. [Google Scholar] [CrossRef]
  19. Brahimi, M.; Boukhalfa, K.; Moussaoui, A. Deep Learning for Tomato Diseases: Classification and Symptoms Visualization. Appl. Artif. Intell. 2017, 31, 1–17. [Google Scholar] [CrossRef]
  20. Wang, D.F.; Wang, J. Crop disease classification with transfer learning and residual networks. Trans. Chin. Soc. Agric. Eng. 2021, 37, 199–207. [Google Scholar]
  21. Zeiler, M.D.; Fergus, R. Visualizing and understanding convolutional networks. Eur. Conf. Comput. Vision. 2014, 8689, 818–833. [Google Scholar]
  22. Lei, F.Y.; Liu, X.; Dai, Q.Y.; Ling, W.K. Shallow convolutional neural network for image classification. SN Appl. Sci. 2020, 2, 1–8. [Google Scholar] [CrossRef]
  23. Tian, J.; Zhang, J.; Xue, M.A.; Xu, X.; Wen, C. A Convolutional Neural Network Based Method for ECG Signal Recognition. J. Hangzhou Dianzi Univ. (Nat. Sci.) 2018, 38, 62–66. [Google Scholar]
  24. Sladojevic, S.; Arsenovic, M.; Anderla, A.; Culibrk, D.; Stefanovic, D. Deep Neural Networks Based Recognition of Plant Diseases by Leaf Image Classification. Comput. Intel. Neurosc. 2016, 2016, 3289801. [Google Scholar] [CrossRef]
  25. Sun, J.; Tan, W.J.; Mao, H.P.; Wu, X.H.; Chen, Y.; Wang, L. Recognition of multiple plant leaf diseases based on improved convolutional neural network. Trans. Chin. Soc. Agric. Eng. 2017, 33, 209–215. [Google Scholar]
  26. Lv, M.; Zhou, G.; He, M.; Chen, A.; Zhang, W.; Hu, Y. Maize leaf disease identification based on feature enhancement and DMS-robust alexnet. IEEE Access 2020, 8, 57952–57966. [Google Scholar] [CrossRef]
  27. Waheeda, A.; Goyala, M.; Guptaa, D.; Khannaa, A.; Hassanienb, A.E.; Pandeyc, H.M. An optimized dense convolutional neural network model for disease recognition and classification in corn leaf. Comput. Electron. Agric. 2020, 175, 105456. [Google Scholar] [CrossRef]
  28. Bao, W.; Huang, X.; Hu, G.; Liang, D. Identification of maize leaf diseases using improved convolutional neural network. Trans. Chin. Soc. Agric. Eng. 2021, 37, 160–167. [Google Scholar]
  29. Fan, X.P.; Zhou, J.P.; Xu, Y.; Peng, X. Corn disease recognition under complicated background based on improved convolutional neural network. Trans. Chin. Soc. Agric. Eng. 2021, 52, 210–217. [Google Scholar]
  30. Priyadharshini1, R.A.; Arivazhagan, S.; Arun, M.; Mirnalini, A. Maize leaf disease classification using deep convolutional neural networks. Neural Comput. Appl. 2019, 31, 8887–8895. [Google Scholar] [CrossRef]
  31. Chen, J.; Wang, W.; Zhang, D.; Zeb, A.; Nanehkaran, Y.A. Attention embedded lightweight network for maize disease recognition. Plant Pathol. 2021, 70, 630–642. [Google Scholar] [CrossRef]
  32. Xu, J.H.; Shao, M.Y.; Wang, Y.C.; Han, W.T. Recognition of Corn Leaf Spot and Rust Based on Transfer Learning with Convolutional Neural Network. Trans. Chin. Soc. Agric. Mach. 2020, 51, 230–236. [Google Scholar]
  33. Dosovitskiy, A.; Beyer, L.; Kolesnikov, A.; Weissenborn, D.; Houlsby, N. An Image is Worth 16x16 Words: Transformers for Image Recognition at Scale. arXiv Prepr. 2020, arXiv:2010.11929. [Google Scholar]
  34. Jia, Z.H.; Zhang, Y.Y.; Wang, H.T.; Liang, D. Identification Method of Tomato Disease Period Based on Res2Net and Bilinear Attention Mechanism. Trans. Chin. Soc. Agric. Mach. 2022, 1–10. [Google Scholar]
  35. Huang, L.S.; Luo, Y.W.; Yang, X.D.; Yang, G.J.; Wang, D.Y. Crop Disease Recognition Based on Attention Mechanism and Multi-scale Residual Network. Trans. Chin. Soc. Agric. Mach. 2021, 52, 264–271. [Google Scholar]
  36. Sun, W.B.; Wang, R.; Gao, R.H.; Li, Q.F.; Wu, H.R.; Feng, L. Crop Disease Recognition Based on Visible Spectrum and Improved Attention Module. Spectrosc. Spect. Anal. 2022, 42, 1572–1580. [Google Scholar]
  37. Liu, B.; Xu, H.W.; Li, C.Z.; Song, H.L.; He, D.J.; Zhang, H.X. Apple Leaf Disease Identification Method Based on Snapshot Ensemble CNN. Trans. Chin. Soc. Agric. Mach. 2022, 53, 286–294. [Google Scholar]
  38. Jie, H.; Li, S.; Gang, S.; Albanie, S. Squeeze-and-excitation networks. IEEE. Trans. Pattern. Amal. Mach. Intell. 2017, 42, 2011–2023. [Google Scholar]
  39. Woo, S.; Park, J.; Lee, J.Y.; Kweon, I.S. CBAM: Convolutional Block Attention Module. In Proceedings of the European Conference on Computer Vision, Munich, Germany, 8–14 September 2018; Springer: Cham, Switzerland; pp. 3–19. [Google Scholar]
  40. Chollet, F. Xception: Deep Learning with Depthwise Separable Convolutions. In Proceedings of the 2017 IEEE Conference on Computer Vision and Pattern Recognition, Honolulu, HI, USA, 21–26 July 2017; pp. 1800–1807. [Google Scholar]
  41. Du, L.Q.; Yu, Y.W. Deterioration Prediction of Machine Tools’ motion accuracy Combining Attention Mechanism under the Framework of Deep Learning. Trans. Chin. Soc. Agric. Mach. 2022. accepted. [Google Scholar]
  42. Mo, R.P.; Si, X.S.; Li, T.M.; Zhu, X. Bearing life prediction based on multi-scale features and attention mechanism. J. Zhejiang Univ. Eng. Sci. 2022, 56, 1447–1456. [Google Scholar]
  43. Zhang, W.; Li, P. Facial Expression Recognition Network Based on Attention Mechanism. J. Tianjin Univ. Sci. Technol. 2022, 55, 706–713. [Google Scholar]
  44. He, K.; Zhang, X.; Ren, S.; Sun, J. Deep Residual Learning for Image Recognition. In Proceedings of the 2016 IEEE Conference on Computer Vision and Pattern Recognition, Las Vegas, NV, USA, 27–30 June 2016; pp. 770–778. [Google Scholar]
  45. Misra, D. Mish: A self regularized non-monotonic neural activation function. arXiv 2019, arXiv:1908.08681. [Google Scholar]
  46. Su, S.F.; Qiao, Y.; Rao, Y. Recognition of grape leaf diseases and mobile application based on transfer learning. Trans. Chin. Soc. Agric. Eng. 2021, 37, 127–134. [Google Scholar]
  47. Dai, Z.; Liu, H.; Le, Q.V.; Tan, M. CoAtNet: Marrying Convolution and Attention for All Data Sizes. Comput. Vis. Pattern Recognit. 2021, 34, 3965–3977. [Google Scholar]
Figure 1. Corn disease samples. Note: (a) Own spot; (b) Northern leaf blight; (c) Sheath blight; (d) Curvularia lunata (wakker) Boed spot; (e) Bipolaris maydis; (f) Common rust.
Axioms 11 00480 g001
Figure 2. The overall framework of the corn disease identification algorithm.
Axioms 11 00480 g002
Figure 3. AlexNet basic network.
Axioms 11 00480 g003
Figure 4. The down-sampling attention module.
Axioms 11 00480 g004
Figure 5. Group convolution.
Axioms 11 00480 g005
Figure 6. Computation flow of AT-AlexNet model for corn disease identification.
Axioms 11 00480 g006
Figure 7. Training and testing accuracy and loss value curves of different datasets. (a) Training accuracy; (b) Training loss; (c) Testing accuracy; (d) Testing loss.
Axioms 11 00480 g007
Figure 8. Training and testing accuracy and loss value curves of different batch-sizes. (a) Training accuracy; (b) Training loss; (c) Testing accuracy; (d) Testing loss.
Axioms 11 00480 g008
Figure 9. Training and testing accuracy and loss value curves of different learning rates. (a) Training accuracy; (b) Training loss; (c) Testing accuracy; (d) Testing loss.
Axioms 11 00480 g009
Figure 10. Test accuracy and loss value curves of different disease detection networks. (a) Testing accuracy; (b) Testing loss.
Axioms 11 00480 g010
Figure 11. Accuracy and loss value curves of different model training and testing. (a) Training accuracy; (b) Training loss; (c) Testing accuracy; (d) Testing loss.
Axioms 11 00480 g011aAxioms 11 00480 g011b
Table 1. Statistics of corn pests and diseases’ dataset.
Disease NameNumber of Original
Samples/Piece
Number of Enhanced Samples/PieceSample Label
Common rust47018801
Bipolaris maydis64518352
Own spot26016603
Northern leaf blight35617804
Sheath blight44817925
Curvularia lunata (wakker) Boed spot54618386
Total272510,7856
Table 2. Hyperparameter settings for model training.
HyperparametersSetting
Optimizer typesSGD
Momentum0.9
Weight decay0.0008
Learning rate0.01
Batch size32
Epoch60
Table 3. Accuracy and loss value of AT-AlexNet model training and testing.
NumberDatasetsBatch-SizeLearning RateTraining AccuracyTest AccuracyTraining LossTest Loss
1A80.172.2471.564.45404.5635
20.0196.4297.090.08630.0815
30.00196.2397.190.09710.0745
4160.170.8671.014.67244.6491
50.0198.8498.170.03450.0536
60.00196.6697.310.08590.0664
7320.191.9791.470.20140.2222
80.0198.9498.200.02870.9820
90.00195.9796.940.10120.0759
10B80.172.3372.424.43864.4242
110.0197.7998.910.05750.0298
120.00196.1998.030.09930.0521
13160.172.3372.424.45984.4454
140.0199.3199.300.02000.0210
150.00197.4198.630.06860.0386
16320.197.5597.750.06700.0653
170.0199.5299.780.01380.0067
180.00197.8298.530.05870.0404
Table 4. Model recognition accuracy before and after data augmentation.
ModelCommon RustBipolaris maydisCurvularia lunata (Wakker) Boed SpotNorthern Leaf BlightSheath BlightOwn Spot
AT-AlexNet-A93.20%91.06%95.58%92.96%96.36%100%
AT-AlexNet-B99.46%98.39%99.18%100%99.06%100%
Table 5. AT-AlexNet network ablation test.
Network ModelPrecisionRecallF1 ScoreAccuracyTest Accuracy
AlexNet98.06%98.05%98.06%98.05%98.05%
AT-AlexNet99.35%99.35%99.35%99.35%99.78%
AT-AlexNet-R98.71%98.70%98.70%98.70%99.59%
AT-AlexNet-C99.14%99.12%99.13%99.12%99.12%
Table 6. The recognition accuracy of the model.
Disease TypesPrecisionRecallF1 Score Accuracy
Common rust100%98%99%99%
Bipolaris maydis98%99%99%98%
Curvularia lunata (wakker) Boed spot98%99%99%99%
Northern leaf blight99%100%99%100%
Sheath blight99%98%98%99%
Own spot99%100%100%100%
Average99%99%99%99%
Table 7. The comparative experiment of corn disease detection networks.
Network StructurePrecisionRecallF1 ScoreTraining Accuracy Test Accuracy
AT-AlexNet99.35%99.35%99.35%99.52%99.78%
LeNet95.99%95.97%95.98%97.58%95.97%
GoogLeNet99.73%99.72%99.72%99.52%99.72%
Table 8. A comparative test of AT-AlexNet and AT-AlexNet-D networks.
Network ModelPrecisionRecallF1 ScoreAccuracyTraining Accuracy Test Accuracy
AT-AlexNet99.35%99.35%99.35%99.35%99.52%99.78%
AT-AlexNet-D94.62%94.58%94.60%94.58%97.90%98.23%
Publisher’s Note: MDPI stays neutral with regard to jurisdictional claims in published maps and institutional affiliations.

