

A New Emergency-Risk-Evaluation Approach under Spherical Fuzzy-Information Environments


Department of Management Sciences, R.O.C. Military Academy, Kaohsiung 830, Taiwan
Axioms 2022, 11(9), 474; https://doi.org/10.3390/axioms11090474
Submission received: 11 August 2022
/
Revised: 13 September 2022
/
Accepted: 15 September 2022
/
Published: 16 September 2022
(This article belongs to the Special Issue Mathematics of the COVID-19)
Abstract
:When major emergencies or accidents occur, risk evaluation and prediction are the most important means to reduce their impact. Typical risk evaluation uses the failure mode and effects analysis (FMEA) method for failure-risk ranking and control. However, when faced with severe special infectious diseases such as COVID-19, there are many cognitive and information uncertainties that the FMEA method is unable to effectively handle. To effectively deal with the issue of risk evaluation when major emergencies or accidents occur, this paper integrated the risk-priority number and spherical fuzzy-sets methods to propose a novel emergency-risk-evaluation method. In the numerical verification, this paper applied the example of preventing secondary COVID-19 transmissions in hospitals to explain the calculation procedure and validity of the proposed new emergency-risk-evaluation approach. The calculation results were also compared with the typical RPN, fuzzy-set, and intuitionistic fuzzy-set methods. The calculation results showed that the proposed new emergency-risk-evaluation approach could effectively handle the cognitive and informational uncertainties of emergency-risk-evaluation issues during the COVID-19 pandemic.
1. Introduction
When emergencies or emerging disease events occur, correct risk assessment and forecasting ensure that disasters have a minimal impact on people. However, when emergencies occur, the information used for risk assessment usually contains uncertainty. For example, at the end of 2019, the first suspected case of Corona Virus Infectious Disease 2019, named COVID-19, was reported in Wuhan, Hubei Province, China. Since then, COVID-19 has quickly spread to many countries, causing 220 million infections and 4.6 million deaths up until September 2021. Facing the pandemic of this emerging infectious disease, risk evaluation and control have become important and critical issues. Successful epidemic-risk control effectively reduces the infection rate and rates of infectious diseases and allows people to return to normal life as soon as possible. However, due to the lack of statistical data and the lack of understanding of new infectious diseases, coupled with the continuous mutation of COVID-19, a significant amount of risk-evaluation information is uncertain or unclear.
Zadeh [1] first presented the fuzzy-sets theory (FS) to process uncertain information in daily life. FS is a generalization of crisp sets and uses the membership degree (MD) to express fuzzy phenomena in daily life. MD indicates the degree of the membership of this x in A; . In the FS method, the non-membership degree (NMD) . Since then, the FS method has been widely applied in many different fields, such as imbalanced data classification [2], electronic commerce [3], healthcare information systems [4], medical diagnosis [5], smart data [6], risk assessment [7], portfolio selection [8], supplier selection [9], and so on. In order to overcome the limitations of simultaneous MD and NMD, Atanassov [10] presented intuitionistic fuzzy sets (IFS), which uses MD and NMD to deal with intuitionistic fuzzy information in different decision-making problems. It is worth noting that satisfies the conditions . If , IFS A regresses to an FS [11]. Thus, IFS is a generalization of the FS and crisp sets. People’s opinions are typically expressed in four ways: yes, no, abstain, and refuse. In order to fully express people’s ideas, Cuong [12] extended the concept of IFS to proposed picture fuzzy sets (PFS) to process the fuzzy information in daily life. PFS uses MD , the indeterminacy degree and NMD to express the fuzzy phenomena of people’s opinions. , and must satisfy the condition . Extending the concept of PFS, Gundogdu and Kahraman [13] presented the spherical fuzzy set (SFS) to handle the uncertainty of expert evaluations. SFS widens the space of , , and and must satisfy the conditions and 0 . For example, suppose the experts’ evaluation of the attribute values for a decision-making problem indicate that the MD, the indeterminacy degree, and NMD are 0.8, 0.2, and 0.2, respectively. PFS is unable to process these data (), but SFS can do so effectively (. Therefore, SFS can handle information and data that the crisp set, FS, IFS, and PFS cannot.
When faced with a new disease pandemic, a lack of understanding of the disease and a lack of relevant background knowledge or data cause the decision information to contain fuzzy, incomplete, and indeterminate information. SFS can effectively and simultaneously handle crisp, fuzzy, incomplete, and indeterminate information when handling multi-criteria decision-making (MCDM) problems. Currently, the SFS method is widely applied in different decision-making fields, such as advertising-strategy selection [14], internet financial soft-power assessments [15], COVID-19 patient-care and hospital-admission arrangements [16], occupational-health-and-safety risk assessments [17], blood-supply-chain networks [18], green-supplier selection [19], solar gel batteries [20], and so on.
The failure mode and effects analysis (FMEA) method is an important and critical risk-evaluation and management approach. The different FMEA types include system FMEA, process FMEA, design FMEA, service FMEA, and so on. The main objective of the FMEA method is to confirm the risk level of system-component failure at the initial stage of product design or development, and then use limited resources to reduce the risk of possible product failures. FMEA was first proposed by the US military in the 1950s to improve and enhance the reliability of its weapons systems. The FMEA method is a step-by-step process that starts by establishing the goal of the risk evaluation and then confirms the potential failure modes, potential causes, and potential effects, and finally decides on the risk ranking of the failure items. Traditionally, the typical FMEA method uses three risk factors to calculate the risk priority number (RPN) for ranking the possible failure risk of system-component failure. The three risk factors, occurrence (O), severity (S), and detection (D), are used to describe each failure item. The RPN is the product of these three risk factors. Each risk factor can be rated from 1 to 10; thus, the RPN value ∈ [1, 1000]. A system component with a higher RPN value indicates a higher failure risk and should be given a higher risk priority to prevent failure from occurring. Currently, the FMEA method is widely used in different fields, such as floating offshore wind turbines [21], blood-transfusion processes [22], medication safety [23], color super twisted-nematic liquid crystal displays [24], production-base selection [25], thin-film-transistor liquid crystal displays [26], maritime autonomous surface ships [27], and brachytherapy treatments [28], etc.
In order to effectively handle risk-evaluation information that is uncertain or that has unclear issues when emergencies or emerging disease events occur, this paper integrates the FMEA and SFS methods to propose a new emergency-risk-evaluation approach. For the certain, uncertain, and ambiguous data provided by experts simultaneously, this paper uses spherical fuzzy number to simultaneously consider the MD, indeterminacy degree, and NMD for each failure item. Therefore, the proposed method can provide more complete and reasonable information processing than fuzzy sets and intuitionistic fuzzy sets when considering information on failure items.
The rest of this paper is organized as follows. Section 2 provides a brief introduction to the basic concepts and arithmetic operations of the FMEA and SFS methods. Section 3 proposes a new emergency-risk-evaluation approach that integrates the FMEA and SFS techniques to perform risk evaluations when emergencies or emerging disease events occur. In Section 4, a numerical example of preventing secondary COVID-19 transmissions in hospitals is presented, and the calculation results are compared with those of the typical RPN, FS, and IFS methods. The final section is the conclusion and provides possible future research directions.
2. Preliminaries
This section presents the basic concepts and related definitions of the FMEA and SFS methods to explain the proposed new emergency-risk-evaluation approach.
2.1. Failure Mode and Effects Analysis
FMEA was originally proposed by the US military in the 1950s and was used by the National Aeronautics and Space Administration for the Apollo space missions in the 1960s. The FMEA method is often used in the design or research-and-development stage of a product to ensure that the product quality meets design requirements. The FMEA method has been adopted by many international standards, such as MIL-STD-1629, MIL-STD-1629A, ISO-9000, IEC 60812, QS-9000, AIAG-VDA FMEA, and SAE J1739 [29,30].
The typical FMEA method uses three risk factors to conduct failure-risk assessments. The three risk factors, occurrence (O), severity (S), and detection (D), are used to describe each failure item. The risk factor is scored according to a ten-point ordinal measurement scale and determined by the FMEA team members. The FMEA method uses the risk-priority number (RPN) to rank the failure risks. RPN is a tool for numerically assessing risk levels, and the value of the RPN is the product of the three risk factors, as shown below:
A higher RPN value represents a higher risk of failure and indicates that a higher failure risk priority should be given. The traditional scales of O, S, and D are shown in Table 1.
2.2. Spherical Fuzzy Set
SFS uses a larger preference domain than PFS to more flexibly reflect the expert evaluation information for dealing with MCDM problems. SFS is an extension of crisp sets, FS, IFS, and PFS. The definitions and algorithmic rules related to SFS are as follows:
Definition 1
([18]). An SFS T on the universe set X is defined as
where ,, and must satisfy the condition 0. The values of , , and are the MD, indeterminacy degree, and NMD, respectively.
Furthermore, represents the refusal degree of .
Definition 2
([31]). Let and represent any two SFSs. The addition, multiplication, multiplication with the constant k, and exponent algorithm rules of the SFS can be defined as:
Definition 3
Definition 4
([33]). For the SFSs , the spherical fuzzy weighted geometric mean (SFWGM) operator has the weighted vector . The aggregated value of SFWGM can be defined as:
where and .
Definition 5
([34]). Let be any SFS. The score value (SC) and accuracy value (AC) can be defined as follows:
where and .
Definition 6
- (1)
- If , then .
- (2)
- If, and , then .
- (3)
- If, and, then.
3. Proposed Novel Emergency-Risk-Evaluation Approach
In the face of new diseases and major epidemics, the correctness of risk evaluation will be the key to governments’ pursuit of economic stability and people’s return to normal life. The FMEA method is an important risk-evaluation approach that is widely used to meet product-design and robustness requirements. However, during the emergency-risk evaluation of major incidents, the evaluation data provided by experts often contain certain, uncertain, and ambiguous data at the same time. The presence of uncertain and unclear information leads to difficulties in risk evaluation. In order to effectively handle new disease-risk evaluation issues when the available information is uncertain and unclear, this study used different linguistic terms and spherical fuzzy numbers to indicate the risk level of the three risk factors, O, S, and D, as shown in Table 2. The proposed new emergency-risk-evaluation approach used SFS to handle the cognitive and informational uncertainties of emergency-risk-evaluation issues during the COVID-19 pandemic. Next, the SFWA and SFWGM operators were used to calculate the spherical fuzzy RPN values of each failure item. Finally, SC and AC were used to rank the failure risks of each failure item to provide decision makers with a decision-making reference.
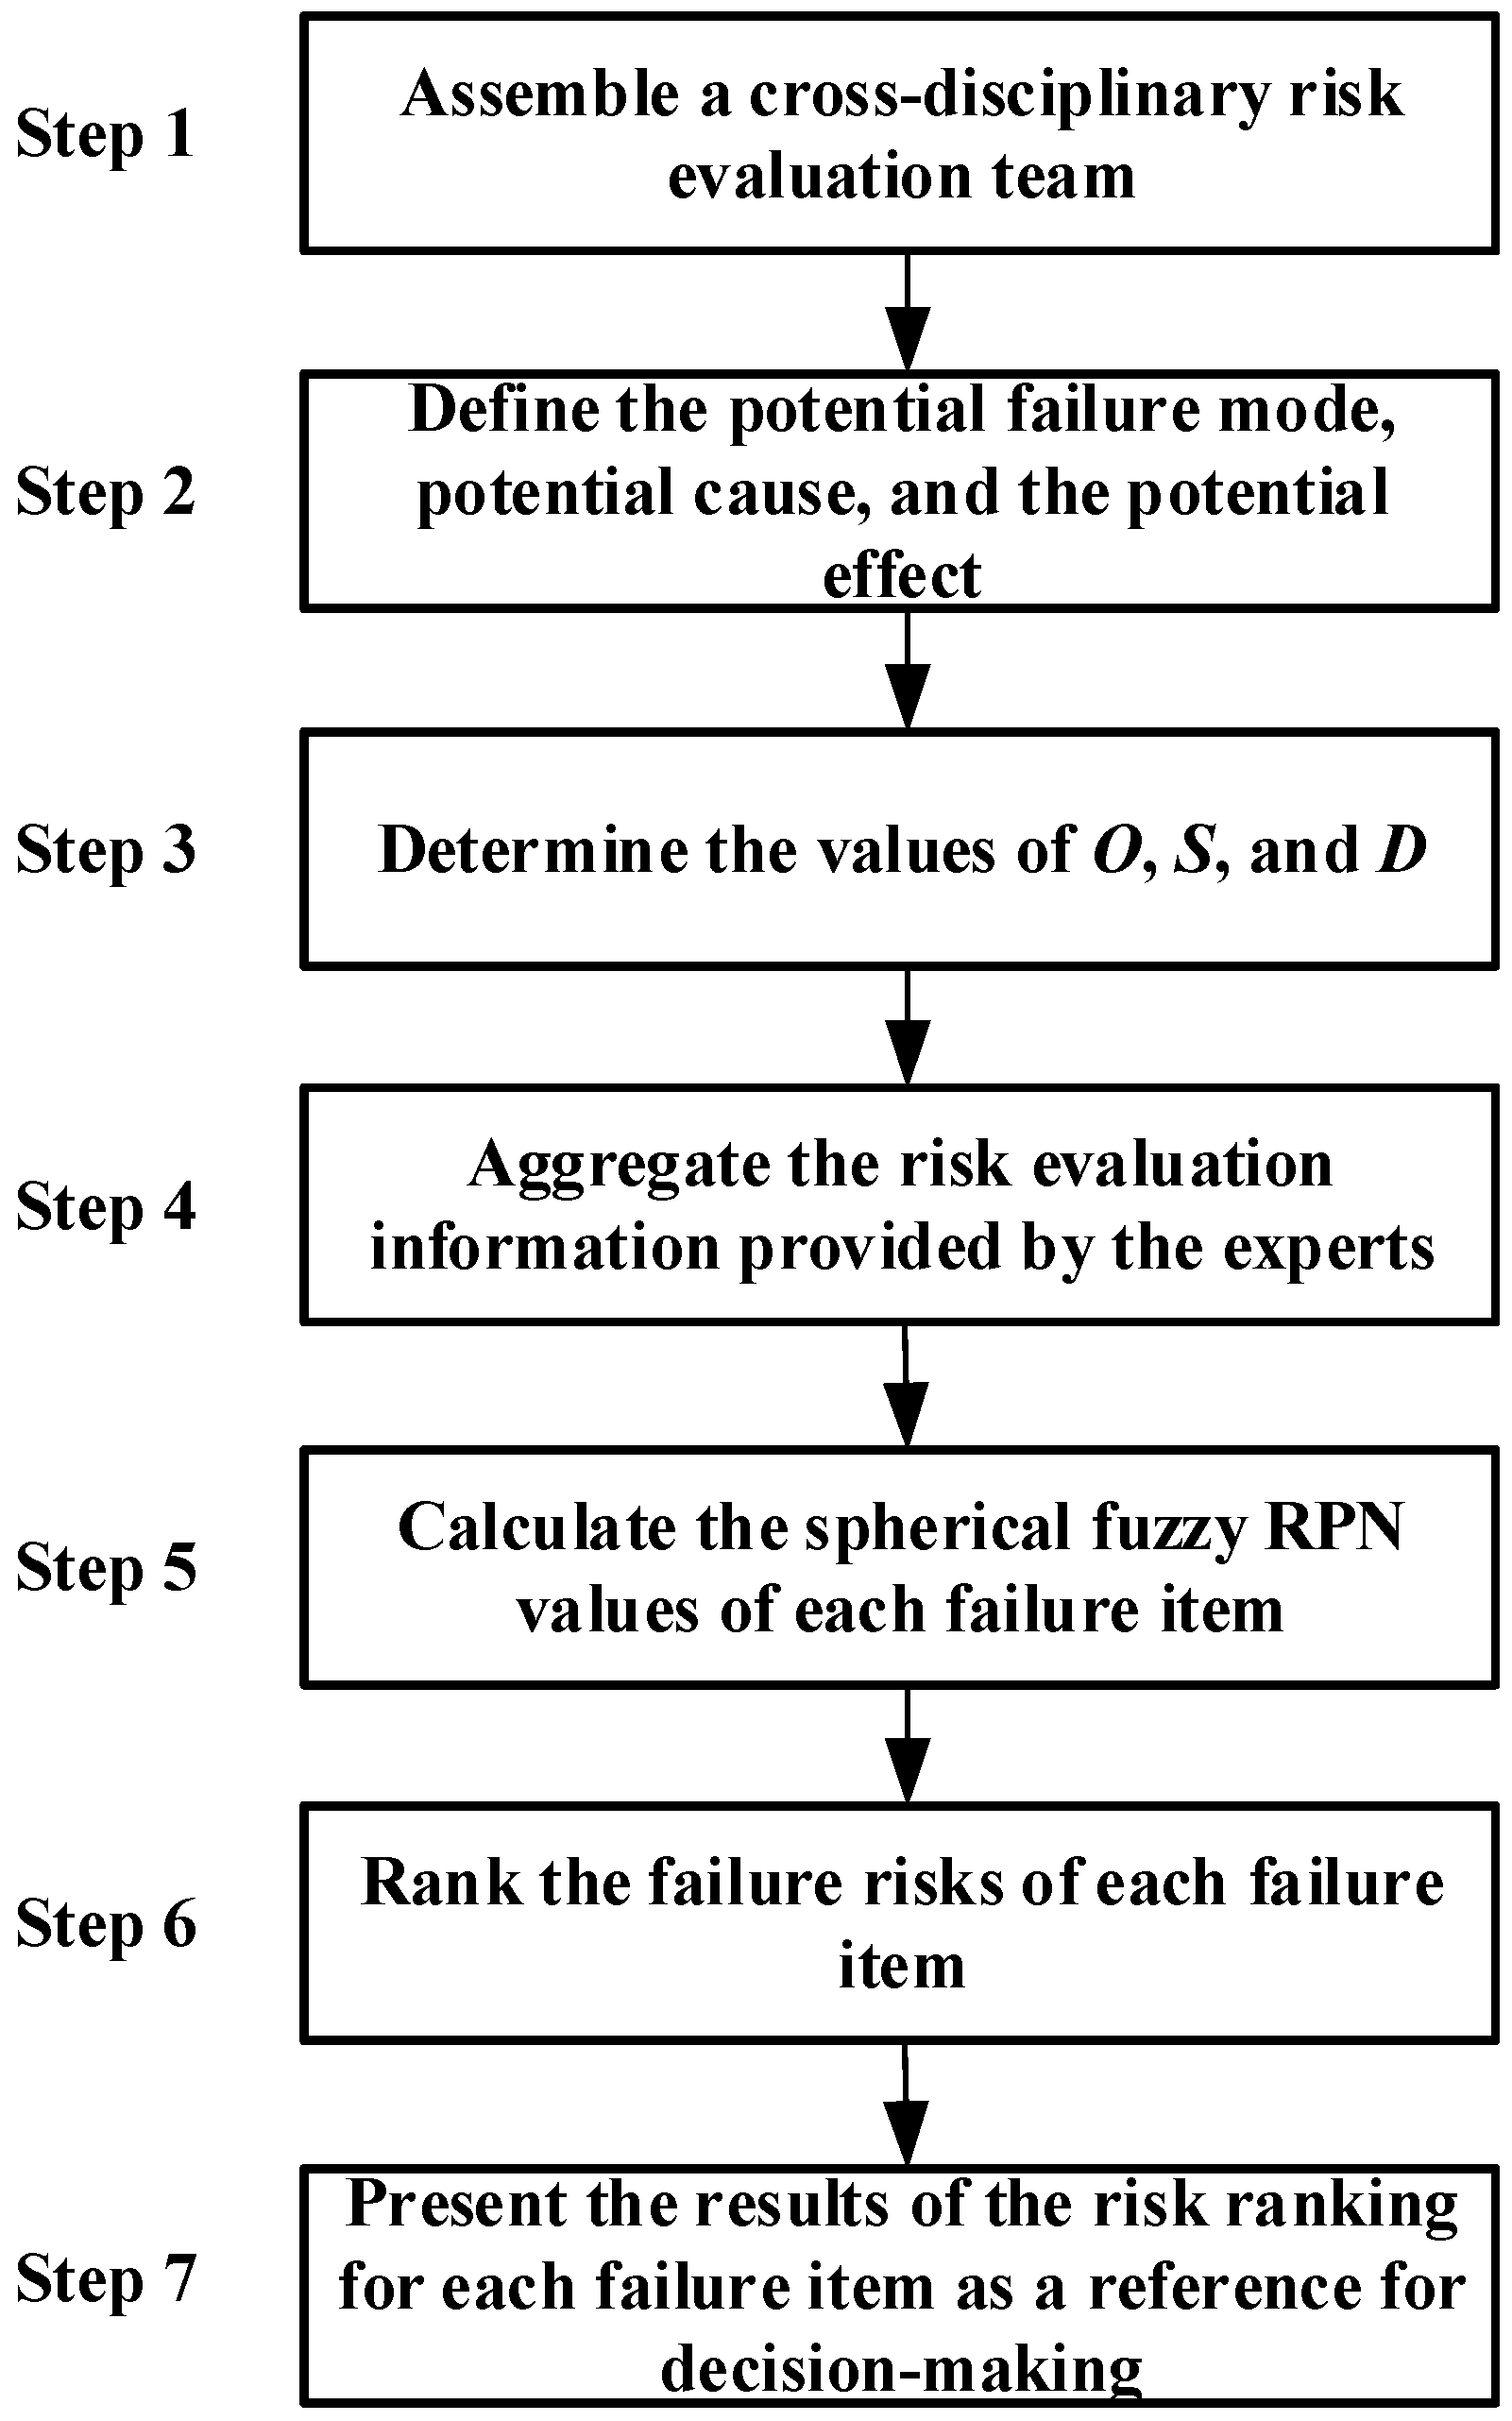
The procedure of the proposed emergency risk evaluation approach followed seven steps (Figure 1).
- Step 1. Assemble a cross-disciplinary risk-evaluation team.
Use the topic objectives of the risk evaluation to assemble a cross-disciplinary risk-evaluation team.
- Step 2. Define the potential failure mode, potential cause, and potential effect.
Members of the risk-evaluation team hold discussions to define the potential failure mode, potential cause, and potential effect of failure.
- Step 3. Determine the values of O, S, and D.
Experts use their own backgrounds and experience to determine the values of O, S, and D.
- Step 4. Aggregate the risk-evaluation information provided by the experts.
Use the SFWA operator (Equation (7)) to aggregate the risk-evaluation information provided by the experts.
- Step 5. Calculate the spherical fuzzy RPN values of each failure item.
Use the SFWGM operator (Equation (8)) to calculate the spherical fuzzy RPN values of each failure item.
- Step 6. Rank the failure risks of each failure item.
Use the values of SC (Equation (9)) and AC (Equation (10)) and the comparison rules of definition 6 to rank the failure risks of each failure item.
- Step 7. Present the results of the risk ranking for each failure item as a reference for decision making.
4. Numerical Example
COVID-19 is an emerging, highly infectious disease. The earliest case of the virus was reported in Wuhan city, China, in 2019 and quickly spread to various countries. COVID-19 has a similar genetic form to the SARS coronavirus (SARS-CoV); thus, its original nomenclature was SARS-CoV-2 [35]. As of September 2021, COVID-19 had resulted in 220 million confirmed cases and 4.66 million deaths; moreover, the COVID-19 virus continues to produce new variants that deeply affect people’s lives.
This section uses the risk evaluation for preventing secondary COVID-19 transmissions in a non-COVID-19-specialized hospital as an example to prove the effectiveness of the proposed novel emergency-risk-evaluation approach. The non-COVID-19-specialized hospital used as the risk-evaluation case was St. Paul’s Hospital’s Millennium Medical College, located in Addis Ababa, Ethiopia (adapted from [36]). FMEA was performed at the hospital’s entrance to reduce the spread of asymptomatic COVID-19 from patients into the hospital. The risk-evaluation example included 15 failure items. The potential failure mode, potential cause, and potential effect of each failure item are shown in Table 3 [36]. Three experts conducted the evaluations based on 15 failure items of COVID-19 patients’ secondary transmissions (Table 3); next, using Table 2, the appropriate spherical fuzzy-number expressions for the S, O, and D values were chosen for each failure item, as shown in Table 4.
4.1. Typical Risk-Priority-Number-Method Solution
The typical RPN method is the most commonly-used risk evaluation method in industry and the military. The RPN method uses the three risk factors, O, S, and D, to calculate the RPN value, which is the product of the three risk factors. A system component with a higher RPN value indicates a higher failure risk, and a higher risk priority should be given to prevent failure from occurring. According to Table 2 and Table 4, Equation (1) was used to calculate the RPN value, as shown in Table 5.
For example, the S values of failure-item 1 given by the three experts, shown in Table 4, are (0.7, 0.3, 0.3), (0.7, 0.3, 0.3), and (0.6, 0.4, 0.4), respectively. According to Table 2, these three spherical fuzzy numbers correspond to the semantic levels of 7, 7, and 6, respectively. Consequently, the arithmetical mean is calculated as follows:
(7 + 7 + 6)/3 = 6.667
4.2. Fuzzy-Set-Method Solution
Zadeh [1] first introduced FS and used MD to express uncertain information about human cognition. FS is an extension of the crisp set. Moreover, NMD . Using the values in Table 4, this study used the fuzzy weighted arithmetic mean (FWAM) to compute the aggregate value of different risk factors for different items, and the results are shown in Table 6. Next this study used Equation (12) to compute the fuzzy weighted geometric mean (FWGM) value. The results are shown in Table 6.
Definition 7
4.3. Intuitionistic-Fuzzy-Set-Method Solution
Extending the concept of FS, Atanassov [9] presented IFS to handle problems related to intuitionistic fuzzy information in daily life. IFS uses MD and NMD to express uncertain information about human cognition. IFS is an extension of FS and crisp sets. Moreover, . Using the values in Table 4, this study used the arithmetic mean to compute the aggregate value of different risk factors for different items. The results are shown in Table 8. Next, this study used Equation (14) to compute the intuitionistic fuzzy weighted geometric mean (IFWGM) value. The results are shown in Table 8.
Definition 8
([39]). For the IFSs , the intuitionistic fuzzy weighted arithmetic mean (IFWAM) operator and the IFWGM operator has the weighted vector . The aggregated value of IFWAM and the IFWGM can be defined as:
where and .
4.4. Proposed-Approach Solution
The proposed approach integrates the risk-priority number and SFS methods to handle the issue of risk evaluation when major emergencies or accidents occur. The SFS is an extension of the IFS, FS, and crisp sets. According to the evaluation objective of assembling a cross-disciplinary risk-evaluation team, the team members defined the potential failure mode, potential cause, and potential effect, as shown in Table 3 (steps 1–2). The team members then determined the value of O, S, and D, respectively, as shown in Table 4 (step 3).
- Step 4. Aggregate the risk-evaluation information provided by the experts
Using the values in Table 4, this study used the SFWA operator (Equation (7)) to aggregate the risk-evaluation information provided by the experts. The results are shown in Table 10.
- Step 5. Calculate the spherical fuzzy RPN values of each failure item
Using the results of step 4, this study used the SFWGM operator (Equation 8) to calculate the spherical fuzzy RPN values of each failure item. The results are shown in Table 10.
When the indeterminacy degree equals 0, and the sum of membership degree and non-membership degree is less than or equals to 1, the membership degree results of SFWGM value are the same as the IFWGM values. When the indeterminacy degree equals 0, and the membership degree equals 1 minus the non-membership degree, the results of the IFWGM values are the same as the FWGM values.
- Step 6. Rank the failure risks of each failure item
Using the values in Table 10, this study used Equations (9) and (10) to calculate the SC and AC values of the proposed approach. The results are shown in Table 11.
- Step 7. Provide the results of the risk ranking for each failure item as a decision-making reference.
The results of the risk ranking could provide decision makers with a reference for resource reallocation or for using limited resources to prevent the occurrence of high-risk failure items.
4.5. Comparison between and Discussion of Different Calculation Methods
In order to explain the calculation procedure and verify the effectiveness of the proposed method in this paper, this study used the prevention of secondary COVID-19 transmissions in a non-COVID-19-specialized hospital as an illustrative example, as shown in Section 4. The objective of the FMEA was to reduce the spread of COVID-19 from asymptomatic patients in the hospital. This study compared the differences between the calculation results of the different methods, including the typical RPN method, the FS method, and the IFS method, and proposed a new emergency-risk-evaluation approach. The results are shown in Table 12. The Spearman’s rank correlation coefficients of the four different calculation methods are shown in Table 13. According to Table 13, the Spearman’ s rank correlation coefficient was 0.961, which is between the proposed new emergency-risk -valuation approach and the IFS method, indicating a very high positive correlation. However, the Spearman’s rank correlation coefficient was 0.793, which is between the proposed new emergency-risk-evaluation approach and the FS method and typical RPN method, indicating a high positive correlation. These four different calculation methods used the same input data (Table 4) for their respective calculations.
The main difference between the proposed approach and the other three methods was the information extraction and use. In terms of the information extraction and use, the typical RPN method only uses a single linguistic-term set to calculate the RPN value, which ignores the different potential forms of information. Since the typical RPN method only handles semantic information, the risk-ranking results for secondary COVID-19 transmissions were: .
The FS method only uses the MD of the failure items to perform risk evaluation, resulting in biased analysis results. Since the typical RPN method only handles fuzzy information, the risk-ranking results for secondary COVID-19 transmissions were: .
The IFS method applied more detailed information extraction than the typical RPN method and the FS method and used the MD and NMD of the failure items to perform risk evaluation and ranking. The IFS method can handle semantic information, fuzzy information, and intuitionistic fuzzy information. The risk-ranking results for secondary COVID-19 transmissions were: . However, the IFS method still cannot handle the indeterminacy degree and the refusal degree of failure items for human-cognition uncertainties.
The proposed method used SFS to fully consider the MD, indeterminacy degree, NMD, and refusal degree of the failure items. The proposed method can handle semantic information, fuzzy information, intuitionistic fuzzy information, and spherical fuzzy information. Therefore, the proposed method was a generalization of the typical RPN method, FS method, and IFS method. The risk-ranking results for secondary COVID-19 transmissions obtained by the proposed method were: .
5. Conclusions and Future Research Directions
The FMEA method is an effective way to effectively discuss risk assessment and prevention. However, incomplete and unclear failure-item information leads to difficulties in risk assessment. Different information-processing methods lead to different risk-ranking results for failure items. SFS can provide more detailed information considerations than the typical RPN method, FS method, and IFS method. In addition, it aligns more closely with real-world situations. In the numerical verification, this paper applied the example of preventing secondary COVID-19 transmissions in hospitals to explore the impact of different information-processing methods on risk-ranking results. A lack of reference materials for emerging diseases that continuously mutate into new mutant strains has caused higher transmission and fatality rates than for the original COVID-19 virus. As the available information about COVID-19 is uncertain and unclear, there are difficulties in risk evaluation. Thus, this paper proposed a new emergency-risk-evaluation approach under spherical fuzzy information environments, based on using SFS to aggregate and process spherical fuzzy information and then using FMEA as the risk-evaluation tool.
The advantages of the proposed emergency-risk-evaluation approach were as follows:
- (1)
- The proposed emergency-risk-evaluation approach can handle incomplete and unclear information.
- (2)
- The proposed emergency-risk-evaluation approach can handle information that is absent from failure items.
- (3)
- The proposed emergency-risk-evaluation approach can handle the refusal information of failure items.
- (4)
- The typical RPN method, FS method, and IFS method are special forms of the proposed method.
Future studies can use the proposed novel emergency-risk-evaluation method to explore different MCDM problems, such as supplier selection, performance evaluation, the allocation of available resources, medical-risk evaluation, human-resource management, green environmental issues, and so on.
Funding
The authors would like to thank the National Science and Technology Council, Taiwan, for financially supporting this research under contract no. MOST 110-2410-H-145-001, MOST 111-2221-E-145-003.
Institutional Review Board Statement
Not applicable.
Informed Consent Statement
Not applicable.
Data Availability Statement
Not applicable.
Conflicts of Interest
The author declares no conflict of interest.
References
- Zadeh, L.A. Fuzzy sets. Inf. Control. 1965, 8, 338–353. [Google Scholar] [CrossRef]
- Patel, H.; Rajput, D.S.; Stan, O.P.; Miclea, L.C. A new fuzzy adaptive algorithm to classify imbalanced data. CMC-Comput. Mat. Contin. 2022, 70, 73–89. [Google Scholar] [CrossRef]
- Karthik, R.V.; Ganapathy, S. A fuzzy recommendation system for predicting the customers interests using sentiment analysis and ontology in e-commerce. Appl. Soft. Comput. 2021, 108, 107396. [Google Scholar] [CrossRef]
- Nadeem, M.; Al-Amri, J.F.; Subahi, A.F.; Seh, A.H.; Khan, S.A.; Agrawal, A.; Khan, R.A. Multi-level hesitant fuzzy based model for usable-security assessment. Intell. Autom. Soft Comput. 2022, 31, 61–82. [Google Scholar] [CrossRef]
- Liu, X.D.; Wang, Z.W.; Zhang, S.T.; Garg, H. Novel correlation coefficient between hesitant fuzzy sets with application to medical diagnosis. Expert Syst. Appl. 2021, 183, 115393. [Google Scholar] [CrossRef]
- Xie, X.; Zhang, Q.C. An edge-cloud-aided incremental tensor-based fuzzy c-means approach with big data fusion for exploring smart data. Inf. Fusion 2021, 76, 168–174. [Google Scholar] [CrossRef]
- Yener, Y.; Can, G.F. A FMEA based novel intuitionistic fuzzy approach proposal: Intuitionistic fuzzy advance MCDM and mathematical modeling integration. Expert Syst. Appl. 2021, 183, 115413. [Google Scholar] [CrossRef]
- Paul, T.K.; Pal, M.; Jana, C. Portfolio selection as a multicriteria group decision making in Pythagorean fuzzy environment with GRA and FAHP framework. Int. J. Intell. Syst. 2022, 37, 478–515. [Google Scholar] [CrossRef]
- Wen, T.C.; Chang, K.H.; Lai, H.H. Integrating the 2-tuple linguistic representation and soft set to solve supplier selection problems with incomplete information. Eng. Appl. Artif. Intell. 2020, 87, 103248. [Google Scholar] [CrossRef]
- Atanassov, K.T. Intuitionistic fuzzy sets. Fuzzy Sets Syst. 1986, 20, 87–96. [Google Scholar] [CrossRef]
- Chang, K.H.; Cheng, C.H. A risk assessment methodology using intuitionistic fuzzy set in FMEA. Int. J. Syst. Sci. 2010, 41, 1457–1471. [Google Scholar] [CrossRef]
- Cuong, B.C. Picture fuzzy sets. J. Comput. Sci. Cybern. 2014, 30, 409–420. [Google Scholar]
- Gundogdu, F.K.; Kahraman, C. Spherical fuzzy sets and spherical fuzzy TOPSIS method. J. Intell. Fuzzy Syst. 2019, 36, 337–352. [Google Scholar] [CrossRef]
- Farrokhizadeh, E.; Seyfi-Shishavan, S.A.; Gundogdu, F.K.; Donyatalab, Y.; Kahraman, C.; Seifi, S.H. A spherical fuzzy methodology integrating maximizing deviation and TOPSIS methods. Eng. Appl. Artif. Intell. 2021, 101, 104212. [Google Scholar] [CrossRef]
- Ashraf, S.; Abdullah, S. Decision aid modeling based on sine trigonometric spherical fuzzy aggregation information. Soft Comput. 2021, 25, 8549–8572. [Google Scholar] [CrossRef]
- Khan, A.; Abosuliman, S.S.; Ashraf, S.; Abdullah, S. Hospital admission and care of COVID-19 patients problem based on spherical hesitant fuzzy decision support system. Int. J. Intell. Syst. 2021, 36, 4167–4209. [Google Scholar] [CrossRef]
- Liu, R.; Zhu, Y.J.; Chen, Y.; Liu, H.C. Occupational health and safety risk assessment using an integrated TODIM-PROMETHEE model under linguistic spherical fuzzy environment. Int. J. Intell. Syst. 2021, 36, 6814–6836. [Google Scholar] [CrossRef]
- Seyfi-Shishavan, S.A.; Donyatalab, Y.; Farrokhizadeh, E.; Satoglu, S.I. A fuzzy optimization model for designing an efficient blood supply chain network under uncertainty and disruption. Ann. Oper. Res. 2021. [Google Scholar] [CrossRef]
- Zhang, H.Y.; Wei, G.W.; Chen, X.D. CPT-MABAC method for spherical fuzzy multiple attribute group decision making and its application to green supplier selection. J. Intell. Fuzzy Syst. 2021, 41, 1009–1019. [Google Scholar] [CrossRef]
- Yahmadi, R.; Brik, K.; ben Ammar, F. Fuzzy risk priority number assessment for solar gel battery manufacturing defects. Eng. Fail. Anal. 2021, 124, 105327. [Google Scholar] [CrossRef]
- Li, H.; Diaz, H.; Soares, C.G. A failure analysis of floating offshore wind turbines using AHP-FMEA methodology. Ocean Eng. 2021, 234, 109261. [Google Scholar] [CrossRef]
- Yu, A.Y.; Liu, H.C.; Zhang, L.; Chen, Y. A new data envelopment analysis-based model for failure mode and effect analysis with heterogeneous information. Comput. Ind. Eng. 2021, 157, 107350. [Google Scholar] [CrossRef]
- Anjalee, J.A.L.; Rutter, V.; Samaranayake, N.R. Application of failure mode and effects analysis (FMEA) to improve medication safety in the dispensing process—A study at a teaching hospital. Sri Lanka BMC Public Health 2021, 21, 1430. [Google Scholar] [CrossRef]
- Chang, K.H.; Wen, T.C. A novel efficient approach for DFMEA combining 2-tuple and the OWA operator. Expert Syst. Appl. 2010, 37, 2362–2370. [Google Scholar] [CrossRef]
- Du, Z.J.; Chen, Z.X.; Yu, S.M. Improved failure mode and effect analysis: Implementing risk assessment and conflict risk mitigation with probabilistic linguistic information. Mathematics 2021, 9, 1266. [Google Scholar] [CrossRef]
- Chang, K.H. Evaluate the orderings of risk for failure problems using a more general RPN methodology. Microelectron. Reliab. 2009, 49, 1586–1596. [Google Scholar] [CrossRef]
- Chang, C.H.; Kontovas, C.; Yu, Q.; Yang, Z.L. Risk assessment of the operations of maritime autonomous surface ships. Reliab. Eng. Syst. Saf. 2021, 207, 107324. [Google Scholar] [CrossRef]
- Chang, K.H. A novel risk ranking method based on the single valued neutrosophic set. J. Ind. Manag. Optim. 2022, 18, 2237–2253. [Google Scholar] [CrossRef]
- Chang, K.H.; Wen, T.C.; Chung, H.Y. Soft failure mode and effects analysis using the OWG operator and hesitant fuzzy linguistic term sets. J. Intell. Fuzzy Syst. 2018, 34, 2625–2639. [Google Scholar] [CrossRef]
- Wen, T.C.; Chung, H.Y.; Chang, K.H.; Li, Z.S. A flexible risk assessment approach integrating subjective and objective weights under uncertainty. Eng. Appl. Artif. Intell. 2021, 103, 104310. [Google Scholar] [CrossRef]
- Mathew, M.; Chakrabortty, R.K.; Ryan, M.J. A novel approach integrating AHP and TOPSIS under spherical fuzzy sets for advanced manufacturing system selection. Eng. Appl. Artif. Intell. 2020, 96, 103988. [Google Scholar] [CrossRef]
- Ullah, K.; Mahmood, T.; Jan, N.; Ahmad, Z. Policy decision making based on some averaging aggregation operators of t-spherical fuzzy sets; a multi-attribute decision making approach. Ann. Optim. Theory Pract. 2020, 3, 69–92. [Google Scholar]
- Mahmood, T.; Ullah, K.; Khan, Q.; Jan, N. An approach toward decision-making and medical diagnosis problems using the concept of spherical fuzzy sets. Neural. Comput. Appl. 2019, 31, 7041–7053. [Google Scholar] [CrossRef]
- Chen, Y.J.; Munir, M.; Mahmood, T.; Hussain, A.; Zeng, S.Z. Some generalized T-spherical and group-generalized fuzzy geometric aggregation operators with application in MADM problems. J. Math. 2021, 2021, 5578797. [Google Scholar] [CrossRef]
- Chen, L.C.; Chang, K.H. A novel corpus-based computing method for handling critical word ranking issues: An example of COVID-19 research articles. Int. J. Intell. Syst. 2021, 36, 3190–3216. [Google Scholar] [CrossRef]
- Teklewold, B.; Anteneh, D.; Kebede, D.; Gezahegn, W. Use of failure mode and effect analysis to reduce admission of asymptomatic COVID-19 patients to the adult emergency department: An institutional experience. Risk Manag. Healthc. Policy 2021, 12, 273–282. [Google Scholar] [CrossRef]
- Casanovas, M.; Merigo, J.M. Fuzzy aggregation operators in decision making with Dempster-Shafer belief structure. Expert Syst. Appl. 2012, 39, 7138–7149. [Google Scholar] [CrossRef]
- Wang, Y.M.; Chin, K.S.; Poon, G.K.K.; Yang, J.B. Risk evaluation in failure mode and effects analysis using fuzzy weighted geometric mean. Expert Syst. Appl. 2009, 36, 1195–1207. [Google Scholar] [CrossRef]
- Ouyang, Y.; Pedrycz, W. A new model for intuitionistic fuzzy multi-attributes decision making. Eur. J. Oper. Res. 2016, 249, 677–682. [Google Scholar] [CrossRef]
Figure 1.
The procedure of the proposed new emergency-risk-evaluation approach.


Table 1.
Traditional evaluation scales for O, S, and D in FMEA.
| Rating | O | S | D |
|---|---|---|---|
| 10 | Extremely high | Hazardous | Almost impossible |
| 9 | Very high | Very high | Very slight |
| 8 | High | High | Slight |
| 7 | Moderately high | Moderately high | Very low |
| 6 | Medium | Moderately | Low |
| 5 | Low | Low | Medium |
| 4 | Very low | Very low | Moderately high |
| 3 | Slight | Slight | High |
| 2 | Very slight | Very slight | Very high |
| 1 | Almost never | Almost none | Almost certain |
Table 2.
Spherical fuzzy-number expressions for S, O, and D.
| Level | Linguistic Terms | Spherical Fuzzy Number | ||
|---|---|---|---|---|
| O | S | D | ||
| 10 | Extremely high | Hazardous | Almost impossible | (1.0, 0.0, 0.0) |
| 9 | Very high | Very high | Very slight | (0.9, 0.1, 0.1) |
| 8 | High | High | Slight | (0.8, 0.2, 0.2) |
| 7 | Moderately high | Moderately high | Very low | (0.7, 0.3, 0.3) |
| 6 | Medium | Moderately | Low | (0.6, 0.4, 0.4) |
| 5 | Low | Low | Medium | (0.5, 0.5, 0.5) |
| 4 | Very low | Very low | Moderately high | (0.4, 0.6, 0.4) |
| 3 | Slight | Slight | High | (0.3, 0.7, 0.3) |
| 2 | Very slight | Very slight | Very high | (0.2, 0.8, 0.2) |
| 1 | Almost never | Almost none | Almost certain | (0.1, 0.9, 0.1) |
Table 3.
FMEA of COVID-19 patients’ secondary transmissions.
| Item | Potential Failure Mode | Potential Cause | Potential Effect |
|---|---|---|---|
| 1 | Guards do not adopt standard precautions (SP) | Lack of precaution knowledge, compliance, monitoring mechanisms for compliance with precautions, and precaution facilities. | The guard is infected |
| 2 | Staff performing monitoring fail to take SP | Staff performing monitoring are infected | |
| 3 | Patients and caregivers do not take SP at the entrance of the hospital | Patients and attendants are infected | |
| 4 | People pass through the gate without being screened | Lack of monitoring, lack of staff at night causing service interruptions, and lack of strict enforcement at night time. | Increased risk of infection |
| 5 | Unreliable screening | Unreliable thermal scanners, inappropriate techniques, and asymptomatic patients. | Misdiagnoses |
| 6 | Patients bypass the pre-triage area | No waiting area, unavailable staff, no pre-triage area guide, and increased patient flow. | Patients infect others after triage |
| 7 | Pre-triage staff do not detect COVID-19 cases | Patients providing false information, atypical presentation, asymptomatic patients, misguided referral diagnoses, low suspicion index, and resource constraints for detecting non-suspected patients. | Patients infect others after triage |
| 8 | Unreliable vital signs | Vital-sign monitors do not work, and insufficient power. | Misdiagnoses and missed cases |
| 9 | Sharing of unsterilized medical equipment | Lack of compliance, increased workloads, lack of knowledge, and insufficient equipment. | Cross-infection between patients |
| 10 | Staff fail to take SP | Lack of precaution knowledge, compliance, precaution facilities, and compliance monitoring mechanisms. | Staff are infected |
| 11 | Patients and attendants fail to take SP in the pre-check room of the emergency room | Patients and attendants are infected | |
| 12 | Patients bypass the triage area | Unavailable staff, increased patient flow, no triage room guide, and insufficient waiting-area space. | Others are infected after patient triage |
| 13 | No vital signs taken | Use of pre-triage vital signs. | Misdiagnoses and missed cases |
| 14 | Low suspicion index | Misleading pre-triage and triage diagnoses | Misdiagnoses and missed cases |
| 15 | Cross-contamination | Poor ventilation; the distance between beds does not meet standards; completion of the aerosol-generation procedure in the same room; s materials and equipment shared between patients and used in common areas, such as toilets. | Cross-infection between staff and patients |
Table 4.
SFS of the S, O, and D for each failure item.
| Item | Expert 1 | Expert 2 | Expert 3 | ||||||
|---|---|---|---|---|---|---|---|---|---|
| O | S | D | O | S | D | O | S | D | |
| 1 | (0.7, 0.3, 0.3) | (0.2, 0.8, 0.2) | (0.4, 0.6, 0.4) | (0.7, 0.3, 0.3) | (0.2, 0.8, 0.2) | (0.4, 0.6, 0.4) | (0.6, 0.4, 0.4) | (0.2, 0.8, 0.2) | (0.4, 0.6, 0.4) |
| 2 | (0.3, 0.7, 0.3) | (0.3, 0.7, 0.3) | (0.4, 0.6, 0.4) | (0.3, 0.7, 0.3) | (0.2, 0.8, 0.2) | (0.5, 0.5, 0.5) | (0.3, 0.7, 0.3) | (0.3, 0.7, 0.3) | (0.5, 0.5, 0.5) |
| 3 | (0.8, 0.2, 0.2) | (0.3, 0.7, 0.3) | (0.6, 0.4, 0.4) | (0.8, 0.2, 0.2) | (0.2, 0.8, 0.2) | (0.7, 0.3, 0.3) | (0.7, 0.3, 0.3) | (0.2, 0.8, 0.2) | (0.6, 0.4, 0.4) |
| 4 | (0.4, 0.6, 0.4) | (0.2, 0.8, 0.2) | (0.6, 0.4, 0.4) | (0.4, 0.6, 0.4) | (0.2, 0.8, 0.2) | (0.6, 0.4, 0.4) | (0.4, 0.6, 0.4) | (0.2, 0.8, 0.2) | (0.5, 0.5, 0.5) |
| 5 | (0.3, 0.7, 0.3) | (0.5, 0.5, 0.5) | (0.5, 0.5, 0.5) | (0.3, 0.7, 0.3) | (0.5, 0.5, 0.5) | (0.5, 0.5, 0.5) | (0.4, 0.6, 0.4) | (0.4, 0.6, 0.4) | (0.5, 0.5, 0.5) |
| 6 | (0.3, 0.7, 0.3) | (0.2, 0.8, 0.2) | (0.6, 0.4, 0.4) | (0.3, 0.7, 0.3) | (0.2, 0.8, 0.2) | (0.6, 0.4, 0.4) | (0.3, 0.7, 0.3) | (0.2, 0.8, 0.2) | (0.5, 0.5, 0.5) |
| 7 | (0.3, 0.7, 0.3) | (0.5, 0.5, 0.5) | (0.8, 0.2, 0.2) | (0.4, 0.6, 0.4) | (0.6, 0.4, 0.4) | (0.8, 0.2, 0.2) | (0.4, 0.6, 0.4) | (0.6, 0.4, 0.4) | (0.8, 0.2, 0.2) |
| 8 | (0.3, 0.7, 0.3) | (0.5, 0.5, 0.5) | (0.5, 0.5, 0.5) | (0.3, 0.7, 0.3) | (0.5, 0.5, 0.5) | (0.6, 0.4, 0.4) | (0.3, 0.7, 0.3) | (0.5, 0.5, 0.5) | (0.6, 0.4, 0.4) |
| 9 | (0.7, 0.3, 0.3) | (0.4, 0.6, 0.4) | (0.6, 0.4, 0.4) | (0.6, 0.4, 0.4) | (0.3, 0.7, 0.3) | (0.7, 0.3, 0.3) | (0.6, 0.4, 0.4) | (0.5, 0.5, 0.5) | (0.7, 0.3, 0.3) |
| 10 | (0.4, 0.6, 0.4) | (0.2, 0.8, 0.2) | (0.6, 0.4, 0.4) | (0.4, 0.6, 0.4) | (0.2, 0.8, 0.2) | (0.6, 0.4, 0.4) | (0.5, 0.5, 0.5) | (0.3, 0.7, 0.3) | (0.7, 0.3, 0.3) |
| 11 | (0.5, 0.5, 0.5) | (0.3, 0.7, 0.3) | (0.5, 0.5, 0.5) | (0.5, 0.5, 0.5) | (0.2, 0.8, 0.2) | (0.7, 0.3, 0.3) | (0.5, 0.5, 0.5) | (0.2, 0.8, 0.2) | (0.7, 0.3, 0.3) |
| 12 | (0.2, 0.8, 0.2) | (0.3, 0.7, 0.3) | (0.7, 0.3, 0.3) | (0.2, 0.8, 0.2) | (0.3, 0.7, 0.3) | (0.7, 0.3, 0.3) | (0.3, 0.7, 0.3) | (0.3, 0.7, 0.3) | (0.7, 0.3, 0.3) |
| 13 | (0.2, 0.8, 0.2) | (0.5, 0.5, 0.5) | (0.5, 0.5, 0.5) | (0.2, 0.8, 0.2) | (0.6, 0.4, 0.4) | (0.5, 0.5, 0.5) | (0.2, 0.8, 0.2) | (0.6, 0.4, 0.4) | (0.4, 0.6, 0.4) |
| 14 | (0.6, 0.4, 0.4) | (0.7, 0.3, 0.3) | (0.8, 0.2, 0.2) | (0.5, 0.5, 0.5) | (0.7, 0.3, 0.3) | (0.8, 0.2, 0.2) | (0.5, 0.5, 0.5) | (0.6, 0.4, 0.4) | (0.8, 0.2, 0.2) |
| 15 | (0.5, 0.5, 0.5) | (0.5, 0.5, 0.5) | (0.7, 0.3, 0.3) | (0.5, 0.5, 0.5) | (0.5, 0.5, 0.5) | (0.7, 0.3, 0.3) | (0.5, 0.5, 0.5) | (0.5, 0.5, 0.5) | (0.8, 0.2, 0.2) |
Table 5.
The RPN of secondary COVID-19 transmissions.
| Item | O | S | D | RPN |
|---|---|---|---|---|
| 1 | 6.667 | 2.000 | 4.000 | 53.333 |
| 2 | 3.000 | 2.667 | 4.667 | 37.333 |
| 3 | 7.667 | 2.333 | 6.333 | 113.296 |
| 4 | 4.000 | 2.000 | 5.667 | 45.333 |
| 5 | 3.333 | 4.667 | 5.000 | 77.778 |
| 6 | 3.000 | 2.000 | 5.667 | 34.000 |
| 7 | 3.667 | 5.667 | 8.000 | 166.222 |
| 8 | 3.000 | 5.000 | 5.667 | 85.000 |
| 9 | 6.333 | 4.000 | 6.667 | 168.889 |
| 10 | 4.333 | 2.333 | 6.333 | 64.037 |
| 11 | 5.000 | 2.333 | 6.333 | 73.889 |
| 12 | 2.333 | 3.000 | 7.000 | 49.000 |
| 13 | 2.000 | 5.667 | 4.667 | 52.889 |
| 14 | 5.333 | 6.667 | 8.000 | 284.444 |
| 15 | 5.000 | 5.000 | 7.333 | 183.333 |
Table 6.
FWGM values of secondary COVID-19 transmissions.
| Item | O | S | D | FWGM |
|---|---|---|---|---|
| 1 | (0.670, 0.000, 0.330) | (0.200, 0.000, 0.800) | (0.400, 0.000, 0.600) | (0.377, 0.000, 0.623) |
| 2 | (0.300, 0.000, 0.700) | (0.268, 0.000, 0.732) | (0.469, 0.000, 0.531) | (0.335, 0.000, 0.665) |
| 3 | (0.771, 0.000, 0.229) | (0.235, 0.000, 0.765) | (0.637, 0.000, 0.363) | (0.487, 0.000, 0.513) |
| 4 | (0.400, 0.000, 0.600) | (0.200, 0.000, 0.800) | (0.569, 0.000, 0.431) | (0.357, 0.000, 0.643) |
| 5 | (0.335, 0.000, 0.665) | (0.469, 0.000, 0.531) | (0.500, 0.000, 0.500) | (0.428, 0.000, 0.572) |
| 6 | (0.300, 0.000, 0.700) | (0.200, 0.000, 0.800) | (0.569, 0.000, 0.431) | (0.324, 0.000, 0.676) |
| 7 | (0.368, 0.000, 0.632) | (0.569, 0.000, 0.431) | (0.800, 0.000, 0.200) | (0.551, 0.000, 0.449) |
| 8 | (0.300, 0.000, 0.700) | (0.500, 0.000, 0.500) | (0.569, 0.000, 0.431) | (0.440, 0.000, 0.560) |
| 9 | (0.637, 0.000, 0.363) | (0.406, 0.000, 0.594) | (0.670, 0.000, 0.330) | (0.557, 0.000, 0.443) |
| 10 | (0.435, 0.000, 0.565) | (0.235, 0.000, 0.765) | (0.637, 0.000, 0.363) | (0.402, 0.000, 0.598) |
| 11 | (0.500, 0.000, 0.500) | (0.235, 0.000, 0.765) | (0.644, 0.000, 0.356) | (0.423, 0.000, 0.577) |
| 12 | (0.235, 0.000, 0.765) | (0.300, 0.000, 0.700) | (0.700, 0.000, 0.300) | (0.367, 0.000, 0.633) |
| 13 | (0.200, 0.000, 0.800) | (0.569, 0.000, 0.431) | (0.469, 0.000, 0.531) | (0.376, 0.000, 0.624) |
| 14 | (0.536, 0.000, 0.464) | (0.670, 0.000, 0.330) | (0.800, 0.000, 0.200) | (0.660, 0.000, 0.340) |
| 15 | (0.500, 0.000, 0.500) | (0.500, 0.000, 0.500) | (0.738, 0.000, 0.262) | (0.569, 0.000, 0.431) |
Table 7.
SC and AC values for different failure items.
| Item | SC | AC |
|---|---|---|
| 1 | −0.246 | 1.000 |
| 2 | −0.329 | 1.000 |
| 3 | −0.027 | 1.000 |
| 4 | −0.286 | 1.000 |
| 5 | −0.144 | 1.000 |
| 6 | −0.351 | 1.000 |
| 7 | 0.103 | 1.000 |
| 8 | −0.119 | 1.000 |
| 9 | 0.114 | 1.000 |
| 10 | −0.196 | 1.000 |
| 11 | −0.154 | 1.000 |
| 12 | −0.267 | 1.000 |
| 13 | −0.247 | 1.000 |
| 14 | 0.319 | 1.000 |
| 15 | 0.139 | 1.000 |
Table 8.
IFWGM values of secondary COVID-19 transmissions.
| Item | O | S | D | IFWGM |
|---|---|---|---|---|
| 1 | (0.670, 0.000, 0.330) | (0.200, 0.000, 0.200) | (0.400, 0.000, 0.400) | (0.377, 0.000, 0.315) |
| 2 | (0.300, 0.000, 0.300) | (0.268, 0.000, 0.262) | (0.469, 0.000, 0.464) | (0.335, 0.000, 0.348) |
| 3 | (0.771, 0.000, 0.229) | (0.235, 0.000, 0.229) | (0.637, 0.000, 0.363) | (0.487, 0.000, 0.277) |
| 4 | (0.400, 0.000, 0.400) | (0.200, 0.000, 0.200) | (0.569, 0.000, 0.431) | (0.357, 0.000, 0.351) |
| 5 | (0.335, 0.000, 0.330) | (0.469, 0.000, 0.464) | (0.500, 0.000, 0.500) | (0.428, 0.000, 0.436) |
| 6 | (0.300, 0.000, 0.300) | (0.200, 0.000, 0.200) | (0.569, 0.000, 0.431) | (0.324, 0.000, 0.317) |
| 7 | (0.368, 0.000, 0.363) | (0.569, 0.000, 0.431) | (0.800, 0.000, 0.200) | (0.551, 0000, 0.338) |
| 8 | (0.300, 0.000, 0.300) | (0.500, 0.000, 0.500) | (0.569, 0.000, 0.431) | (0.440, 0.000, 0.416) |
| 9 | (0.637, 0.000, 0.363) | (0.406, 0.000, 0.391) | (0.670, 0.000, 0.330) | (0.557, 0.000, 0.362) |
| 10 | (0.435, 0.000, 0.431) | (0.235, 0.000, 0.229) | (0.637, 0.000, 0.363) | (0.402, 0.000, 0.346) |
| 11 | (0.500, 0.000, 0.500) | (0.235, 0.000, 0.229) | (0.644, 0.000, 0.356) | (0.423, 0.000, 0.371) |
| 12 | (0.235, 0.000, 0.229) | (0.300, 0.000, 0.300) | (0.700, 0.000, 0.300) | (0.367, 0.000, 0.277) |
| 13 | (0.200, 0.000, 0.200) | (0.569, 0.000, 0.431) | (0.469, 0.000, 0.464) | (0.376, 0.000, 0.375) |
| 14 | (0.536, 0.000, 0.464) | (0.670, 0.000, 0.330) | (0.800, 0.000, 0.200) | (0.660, 0.000, 0.340) |
| 15 | (0.500, 0.000, 0.500) | (0.500, 0.000, 0.500) | (0.738, 0.000, 0.262) | (0.569, 0.000, 0.431) |
Table 9.
SC and AC values obtained by the IFS method.
| Item | SC | AC |
|---|---|---|
| 1 | 0.062 | 0.692 |
| 2 | −0.013 | 0.684 |
| 3 | 0.210 | 0.763 |
| 4 | 0.006 | 0.708 |
| 5 | −0.008 | 0.864 |
| 6 | 0.007 | 0.641 |
| 7 | 0.213 | 0.890 |
| 8 | 0.024 | 0.856 |
| 9 | 0.195 | 0.919 |
| 10 | 0.056 | 0.749 |
| 11 | 0.052 | 0.794 |
| 12 | 0.090 | 0.644 |
| 13 | 0.001 | 0.752 |
| 14 | 0.319 | 1.000 |
| 15 | 0.139 | 1.000 |
Table 10.
SFWGM values of secondary COVID-19 transmissions.
| Item | O | S | D | SFWGM |
|---|---|---|---|---|
| 1 | (0.671, 0.330, 0.330) | (0.200, 0.800, 0.200) | (0.400, 0.600, 0.400) | (0.459, 0.541, 0.323) |
| 2 | (0.300, 0.700, 0.300) | (0.271, 0.732, 0.262) | (0.470, 0.531, 0.464) | (0.354, 0.648, 0.357) |
| 3 | (0.772, 0.229, 0.229) | (0.239, 0.765, 0.229) | (0.638, 0.363, 0.363) | (0.603, 0.399, 0.282) |
| 4 | (0.400, 0.600, 0.400) | (0.200, 0.800, 0.200) | (0.570, 0.431, 0.431) | (0.409, 0.591, 0.362) |
| 5 | (0.338, 0.665, 0.330) | (0.470, 0.531, 0.464) | (0.500, 0.500, 0.500) | (0.440, 0.561, 0.440) |
| 6 | (0.300, 0.700, 0.300) | (0.200, 0.800, 0.200) | (0.570, 0.431, 0.431) | (0.378, 0.623, 0.328) |
| 7 | (0.371, 0.632, 0.363) | (0.570, 0.431, 0.431) | (0.800, 0.200, 0.200) | (0.622, 0.379, 0.348) |
| 8 | (0.300, 0.700, 0.300) | (0.500, 0.500, 0.500) | (0.570, 0.431, 0.431) | (0.468, 0.532, 0.422) |
| 9 | (0.638, 0.363, 0.363) | (0.411, 0.594, 0.391) | (0.671, 0.330, 0.330) | (0.588, 0.415, 0.363) |
| 10 | (0.437, 0.565, 0.431) | (0.239, 0.765, 0.229) | (0.638, 0.363, 0.363) | (0.463, 0.539, 0.354) |
| 11 | (0.500, 0.500, 0.500) | (0.239, 0.765, 0.229) | (0.648, 0.356, 0.356) | (0.488, 0.514, 0.383) |
| 12 | (0.239, 0.765, 0.229) | (0.300, 0.700, 0.300) | (0.700, 0.300, 0.300) | (0.458, 0.544, 0.279) |
| 13 | (0.200, 0.800, 0.200) | (0.570, 0.431, 0.431) | (0.470, 0.531, 0.464) | (0.433, 0.568, 0.388) |
| 14 | (0.537, 0.464, 0.464) | (0.671, 0.330, 0.330) | (0.800, 0.200, 0.200) | (0.688, 0.313, 0.353) |
| 15 | (0.500, 0.500, 0.500) | (0.500, 0.500, 0.500) | (0.739, 0.262, 0.262) | (0.597, 0.403, 0.440) |
Table 11.
SC and AC values obtained by the proposed approach.
| Item | SC | AC |
|---|---|---|
| 1 | −0.186 | 0.608 |
| 2 | −0.422 | 0.672 |
| 3 | 0.124 | 0.602 |
| 4 | −0.313 | 0.648 |
| 5 | −0.315 | 0.702 |
| 6 | −0.352 | 0.638 |
| 7 | 0.122 | 0.652 |
| 8 | −0.242 | 0.680 |
| 9 | 0.042 | 0.649 |
| 10 | −0.202 | 0.630 |
| 11 | −0.173 | 0.650 |
| 12 | −0.164 | 0.583 |
| 13 | −0.285 | 0.660 |
| 14 | 0.251 | 0.696 |
| 15 | 0.000 | 0.713 |
Table 12.
Information used by different calculation methods and risk-ranking results.
| Calculation Method | Use of Information | Risk Ranking of Failed Items |
|---|---|---|
| Typical RPN method | Semantic information | |
| FS method | Fuzzy information | |
| IFS method | Intuitionistic fuzzy information | |
| Proposed new emergency-risk-evaluation approach | Spherical fuzzy information |
Table 13.
Spearman’s rank correlation coefficient.
| Method | Typical RPN Method | FS Method | IFS Method | Proposed New Emergency Risk Evaluation Approach |
|---|---|---|---|---|
| Typical RPN method | 1.000 | 1.000 | 0.729 | 0.793 |
| FS method | 1.000 | 1.000 | 0.729 | 0.729 |
| IFS method | 0.729 | 0.729 | 1.000 | 0.961 |
| Proposed new emergency-risk-evaluation approach | 0.793 | 0.793 | 0.961 | 1.000 |
Publisher’s Note: MDPI stays neutral with regard to jurisdictional claims in published maps and institutional affiliations. |
© 2022 by the author. Licensee MDPI, Basel, Switzerland. This article is an open access article distributed under the terms and conditions of the Creative Commons Attribution (CC BY) license (https://creativecommons.org/licenses/by/4.0/).
Share and Cite
MDPI and ACS Style
Chang, K.-H. A New Emergency-Risk-Evaluation Approach under Spherical Fuzzy-Information Environments. Axioms 2022, 11, 474. https://doi.org/10.3390/axioms11090474
AMA Style
Chang K-H. A New Emergency-Risk-Evaluation Approach under Spherical Fuzzy-Information Environments. Axioms. 2022; 11(9):474. https://doi.org/10.3390/axioms11090474
Chicago/Turabian StyleChang, Kuei-Hu. 2022. "A New Emergency-Risk-Evaluation Approach under Spherical Fuzzy-Information Environments" Axioms 11, no. 9: 474. https://doi.org/10.3390/axioms11090474
Note that from the first issue of 2016, this journal uses article numbers instead of page numbers. See further details here.