1. Introduction
1.1. Overview
Glycosylation and glycation are enzymatic and nonenzymatic reactions, respectively, in which glycan bind covalently with the other molecules like proteins [
1]. They are common types of protein post-translational modifications (PTMs). Both glycosylation and glycation have been indicated to play a significant role in human health. They are closely associated with various diseases such as coronavirus, Alzheimer’s, cancer, and diabetes diseases [
2,
3,
4,
5,
6].
N-linked glycosylation (Ngly) and O-linked glycosylation(Ogly) are the two most abundant types of protein glycosylation. Typically, N-linked glycosylation occurs when the glycan attaches to the Nitrogen atom of the Asparagine (Asn or N) amino acid of the protein. Ngly is identified by the sequence pattern N-X-S/T, where X is any amino acid other than Proline (P). The O-linked glycosylation occurs when the glycan attaches to the hydroxyl group of Serine (Ser or S) or Threonine (Thr or T) amino acid of the protein [
7]. The lysine glycation (Kgly) is the common glycation in which the glycan attaches to the lysine (Lys or K) amino acid of the protein [
8].
The identification of protein glycosylation/glycation sites benefits understanding the biological mechanism of PTM glycosylation/glycation and also helps treat their related diseases. However, not all these sites are glycosylated or glycated. It is known that the detection of glycosylation/glycation sites using experimental laboratory tools, like mass spectrometry and electrochemical chip, is time and cost-consuming. Alternatively, several computational approaches using machine learning have been implemented to predict the glycosylation/glycation sites efficiently [
9,
10].
1.2. Literature Review
Several representative tools for PTM glycosylation/glycation site prediction are briefly discussed here. Firstly, glycosylation site prediction methods are summarized. GPP [
11] uses the random forest (RF) machine learning method for predicting N-linked and O-linked glycosylation sites based on pairwise sequence patterns and structural features and protein–peptide sequences. Both GlycoPP [
12] and GlycoEP [
7] employ support vector machine learning method (SVM) for predicting N-linked and O-linked glycosylation sites in prokaryotes and Eukaryotic, respectively, based on amino acid composition (AAC), Binary encoding, position-specific scoring matrix (PSSM), and structural features. GlycoMine [
13] and GlycoMinestruct [
14] are tools to predict N-linked and O-linked glycosylation sites using the random forest (RF) technique. GlycoMine utilizes functional and sequence-based properties for feature representation while the GlycoMinestruct uses both sequence and structural features. SPRINT-Gly [
15] identifies N-linked and O-linked glycosylation sites using deep neural networks and SVM that are trained on huge datasets gathered from six human and mouse databases and based on various sequence, profile, and structural-based features. N-GlyDE [
16] is a two-stage N-linked glycosylation site prediction method that employs similarity voting as well as the SVM technique based on gapped dipeptide, Structural-based features. GlycoMine_PU [
10] predicts N-linked, O-linked, and C-linked glycosylation sites using a positive unlabeled (PU) learning algorithm based on a variety of sequence, profile and structural-based features. N-GlycoGo [
17] predicts N-linked glycosylation sites using XGBoost, an ensemble machine learning model based on eleven feature extraction techniques. PUStackNGly [
18] uses PU and stacking ensemble-based learning to predict N-linked glycosylation sites based on various sequence and structure-based features.
Regarding glycation site prediction, NetGlycate [
19] is a sequence-based predictor for glycation site prediction based on artificial neural networks (ANNs). PreGly [
20] uses SVM for the prediction of glycation sites based on AAC, amino acid Factor and composition k-spaced amino acid pairs (CKSAAP) features and using maximum relevance minimum redundancy (mRMR) and the incremental feature selection (IFS) methods for feature selection. Xu et al. developed Gly-PseAAC [
21], a glycation site prediction model based on sequence order information and position-specific amino acid propensity features using the SVM classifier. BPB_GlySite [
1] uses SVM to develop a glycation site prediction model based on bi-profile Bayes feature extraction. Zhao et al. developed Glypre [
22] model using SVM and based on position scoring function, AAindex, CKSAAP, and structure-based features. Islam et al. proposed iProtGly-SS [
5] to predict glycation sites using the SVM method and based on sequence and structure-based features. Reddy et al. [
9] developed GlyStruct, a glycation site predictor, using SVM machine learning and based on structural information of the amino acid residues. PredGly [
8] employs XGboost and SVM technique to predict glycation site based on combining physicochemical properties, evolutionary-derived and sequence-based features. Chen et al. [
6] proposed DeepGly model for glycation site prediction using a recurrent neural network (RNN) and a convolutional neural network (CNN). Liu et al. [
23] proposed BERT-Kgly using CNN deep learning to predict glycation site prediction and based on feature extracted by the Bidirectional Encoder Representations from Transformer (BERT). Our previous reviews [
24,
25] discuss the previous studies of PTM glycosylation/glycation site prediction in more details.
1.3. Protein Language Models
In recent years, deep learning-based language models (LMs) have advanced in the Natural Language Processing (NLP) field by feeding large text corpora. Deep learning LMs represent the language by learning to predict the next word in a sentence based on previous context or to reconstruct the corrupted text. These improvements have successfully been moved to the proteomics field by developing Transformer-based Language models for protein sequence representation learning known as Protein Language Models (PLMs) [
26]. PLMs based on the transformer architecture are trained on large protein sequence databases to predict masked or missing amino acids in the protein sequences using the masked language model. The transformer is a deep learning approach for producing a contextual embedding of amino acids in a protein sequence. By utilizing the masked language model, PLMs have the ability to establish a context around each amino acid and learn to “attend” or “focus” on amino acids and peptides that are significant in the current context. In addition, PLMs can capture the complicated interactions between amino acids in proteins [
27,
28].
Tokenization is one of the basic preprocessing steps in the NLP, which is splitting the sequence into individual atomic units of information called tokens. Most NLP models use the word as a token, but some models use the character as a token [
29]. Because protein sequences only have a small 20-character (’A’, ’C’, ’D’, ’E’, ’F’, ’G’, ’H’, ’I’, ’K’, ’L’, ’M’, ’N’, ’P’, ’Q’, ’R’, ’S’, ’T’, ’V’, ’W’, ’Y’) which expressing amino acids (denoted as residues), modeling problem is represented by character-level (amino acid level) PLMs rather than word-level models.
For prediction purposes, the protein sequence is encoded into numeric representing relevant features or descriptors by utilizing different feature extraction methods. Many methods have been implemented to extract meaningful and significant information from protein sequences such as amino acid compositions, evolutionary information, physicochemical, structural properties, and multiple sequence alignments (MSAs). In contrast, the sequence is embedded into numeric arrays using transformer-based PLMs without taking advantage of the properties and MSA of proteins.
1.4. Deep Learning
Deep Learning (DL) is the most recent advancement in the machine learning field based on artificial neural networks (ANNs). It has demonstrated near-human, and now super-human skills in a variety of applications such as pattern recognition, healthcare, autonomous vehicles, voice-to-text translations, NLP, and so on. DL consists of input, multiple hidden, and output layers. DLs with several hidden layers can have the powerful power to represent numerous features, process massive dataset sizes, and learn complex models for prediction purposes [
30,
31]. There are various types of DLS depending on the types of layers and learning methods used. The most common types of DLs are Recurrent Neural Network (RNN) [
32] and Convolutional Neural Network (CNN) [
33]. RNN is widely employed in research with sequential data in which it has the ability to memory. RNN has achieved a great performance in multiple areas such as NLP, speech recognition, as well as bioinformatics [
34,
35].
CNN, a public type of deep learning neural network, is originally proposed for image processing and computer vision, however, CNN has some successful examples that are used to process sequential data. CNN has the ability to extract the hierarchal and local feature patterns of raw data. Thus, CNN has achieved a great performance in several domains [
30,
35]. With Bioinformatics, CNN is applied in multiple areas such as cancer type classification [
36], protein–protein interaction [
37], DNA/RNA/residues binding prediction [
38], and protein structure prediction [
39]. In addition, there are some PTM site prediction studies that used CNN like in [
6,
23,
40,
41,
42,
43]. The CNN consists of a convolutional layer and an optional pooling layer with some extra variations to improve performance like batch normalization, data augmentation, dropout, and regularization. CNN is categorized into three types based on the moving direction of the kernel including 1-dimensional CNN (CNN1D), 2-dimensional CNN (CNN2D), and 3-dimensional CNN (CNN3D). The general type is the CNN2D which is used with the image data and CNN1D is usually with the sequential data [
30].
In this paper, we propose PTG-PLM, to improve the prediction performance of PTM site prediction. The PTG-PLM is based on convolutional neural network 1D (CNN1D), and embedding extracted from six recently published transformer-based protein language models (PLMs) including ProtBert-BFD, ProtBert, ProtAlbert, ProtXlnet, ESM-1b, and TAPE. Considering peptide sequences as sentences, such that PLMs transformers extract existing embedding characteristics and features from the natural language domain. Two benchmark datasets are used in this study for glycosylation and glycation site prediction. The model is evaluated and compared with the state-of-the-art existing tools as well as with state-of-the-art machine learning classifiers. The study shows that PTG-PLM outperforms the other tools and classifiers in terms of accuracy, recall, precision, F1, AUC, and MCC measuring metrics. The data and code of PTG-PLM are available in (
https://github.com/Alhasanalkuhlani/PTG-PLM). The PTG-PLM can be adjusted to be used for other types of PTM site prediction by modifying the parameters in the code.
2. Materials and Methods
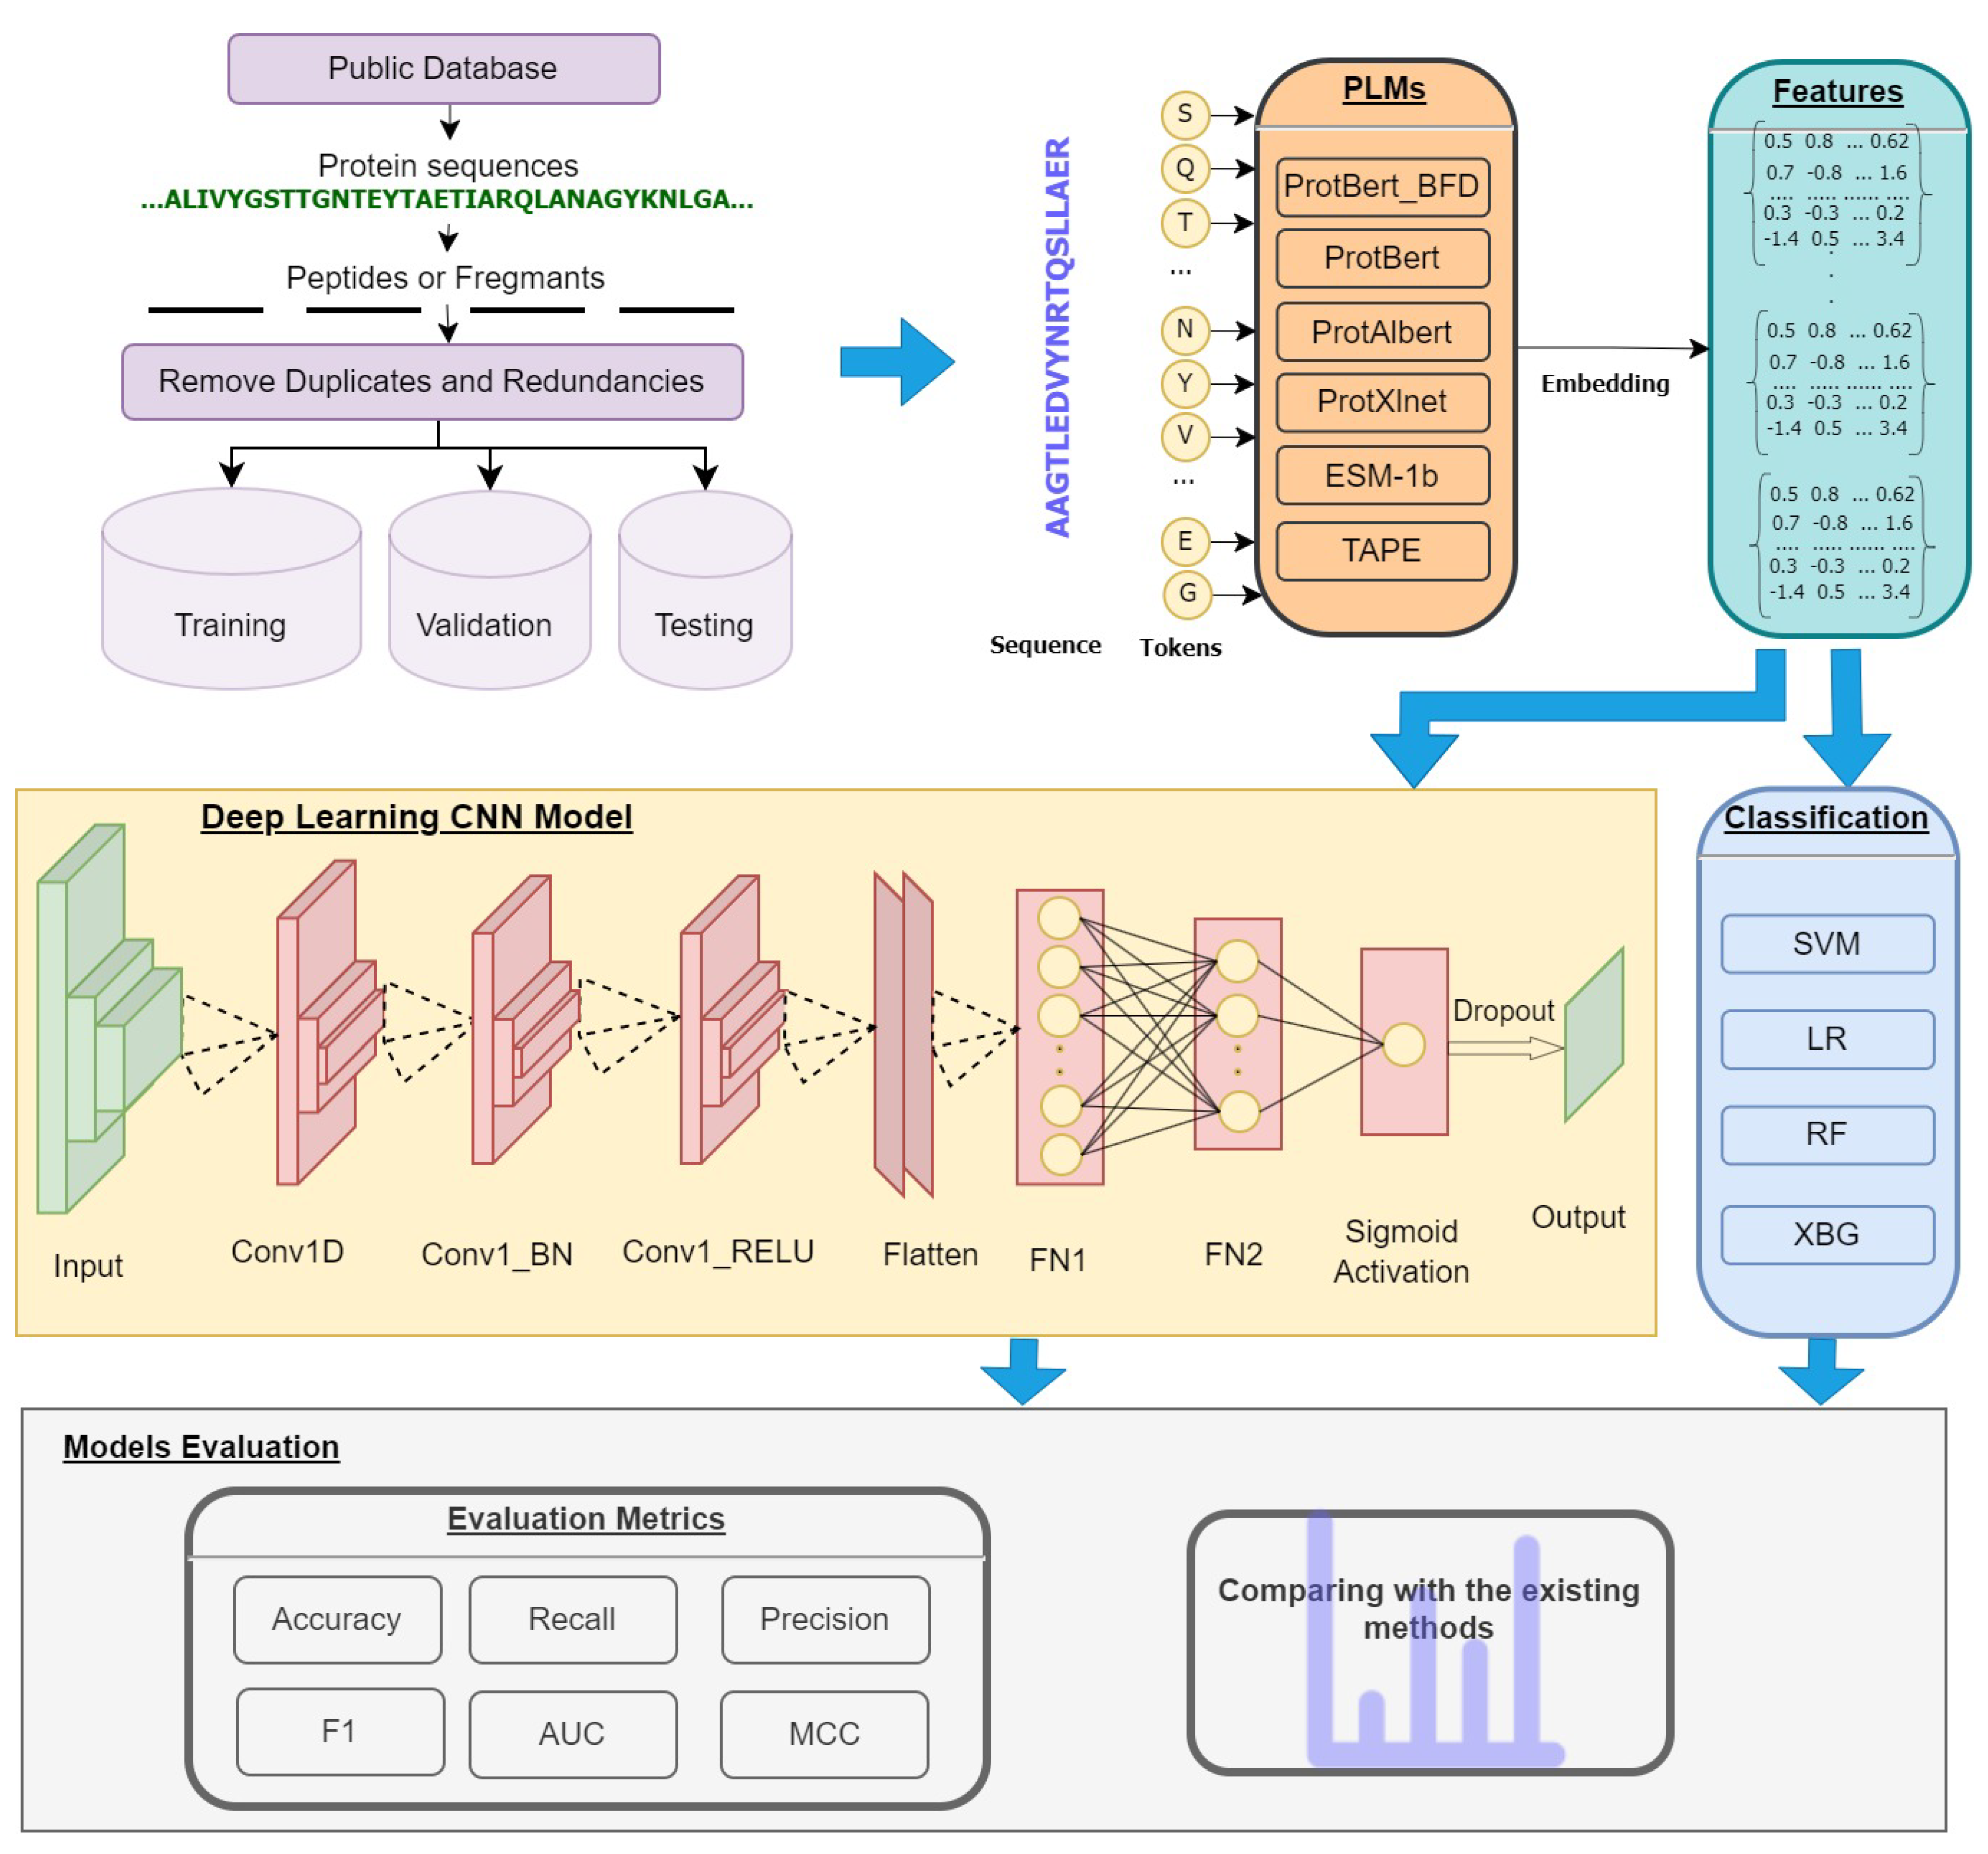
The general flowchart of PTG-PLM is shown in
Figure 1. PTG-PLM is a prediction model for glycan PTM site prediction, which is considered a binary classification problem. Firstly, protein sequences from public databases in FASTA format as well as the positive sites in each protein are fed as input. Then n-size peptides or fragments centered at the target sites are constructed from each protein sequence. Features for each peptide are extracted from six pre-trained protein language models (PLMs). For prediction purposes, the CNN deep learning model is used for training and evaluation. The model is evaluated by 5-fold cross-validation and independent tests using accuracy, recall, precision, F1, AUC, and MCC performance measures. The PTG-PLM is compared with the existing tools as well as the representative supervised-learning algorithms.
2.1. Datasets
In this work, we use two benchmark datasets for Ngly and Kgly site prediction. The two datasets have been used in previous studies. The first dataset (Ngly dataset) was obtained from the UniProt [
44] database and was previously used in our PUStackNGly [
18] study. Using the CD-HIT program [
45], the dataset’s redundancy was removed at the protein sequence and peptide levels with 30% identity. Ngly dataset contains 825 experimentally verified glycoproteins. These glycoproteins hold 2073 positive samples and 13,737 negative samples. The dataset is divided into 3 sets, including training, validation, and testing sets. For training and validation sets, a 1:1 balanced dataset that constructed, with 2027 positive samples and the same number of randomly selected negative samples, with 90% of these samples being used for training and 10% for validation. For independent testing and comparing, the same testing glycoproteins and samples in PUStackNGly were utilized, which contained 46 positive and 179 negative samples.
The second dataset (Kgly dataset) is collected in PredGly by Yu et al. [
8] and is also used in BERT-Kgly [
23]. It was collected from the PLMD database (
http://plmd.biocuckoo.org/ (accessed on 4 February 2022)). After redundancy removal by CD-HIT, the dataset contains 3969 positive and 82,270 negative samples. A balanced dataset consisting of 3573 positive and the same number of randomly selected negative samples for training and validation with 90% of these samples being used for training and 10% for validation. For independent testing and comparing, we utilized the same testing samples were used in BERT-Kgly, which contained 200 positive and 200 negative samples.
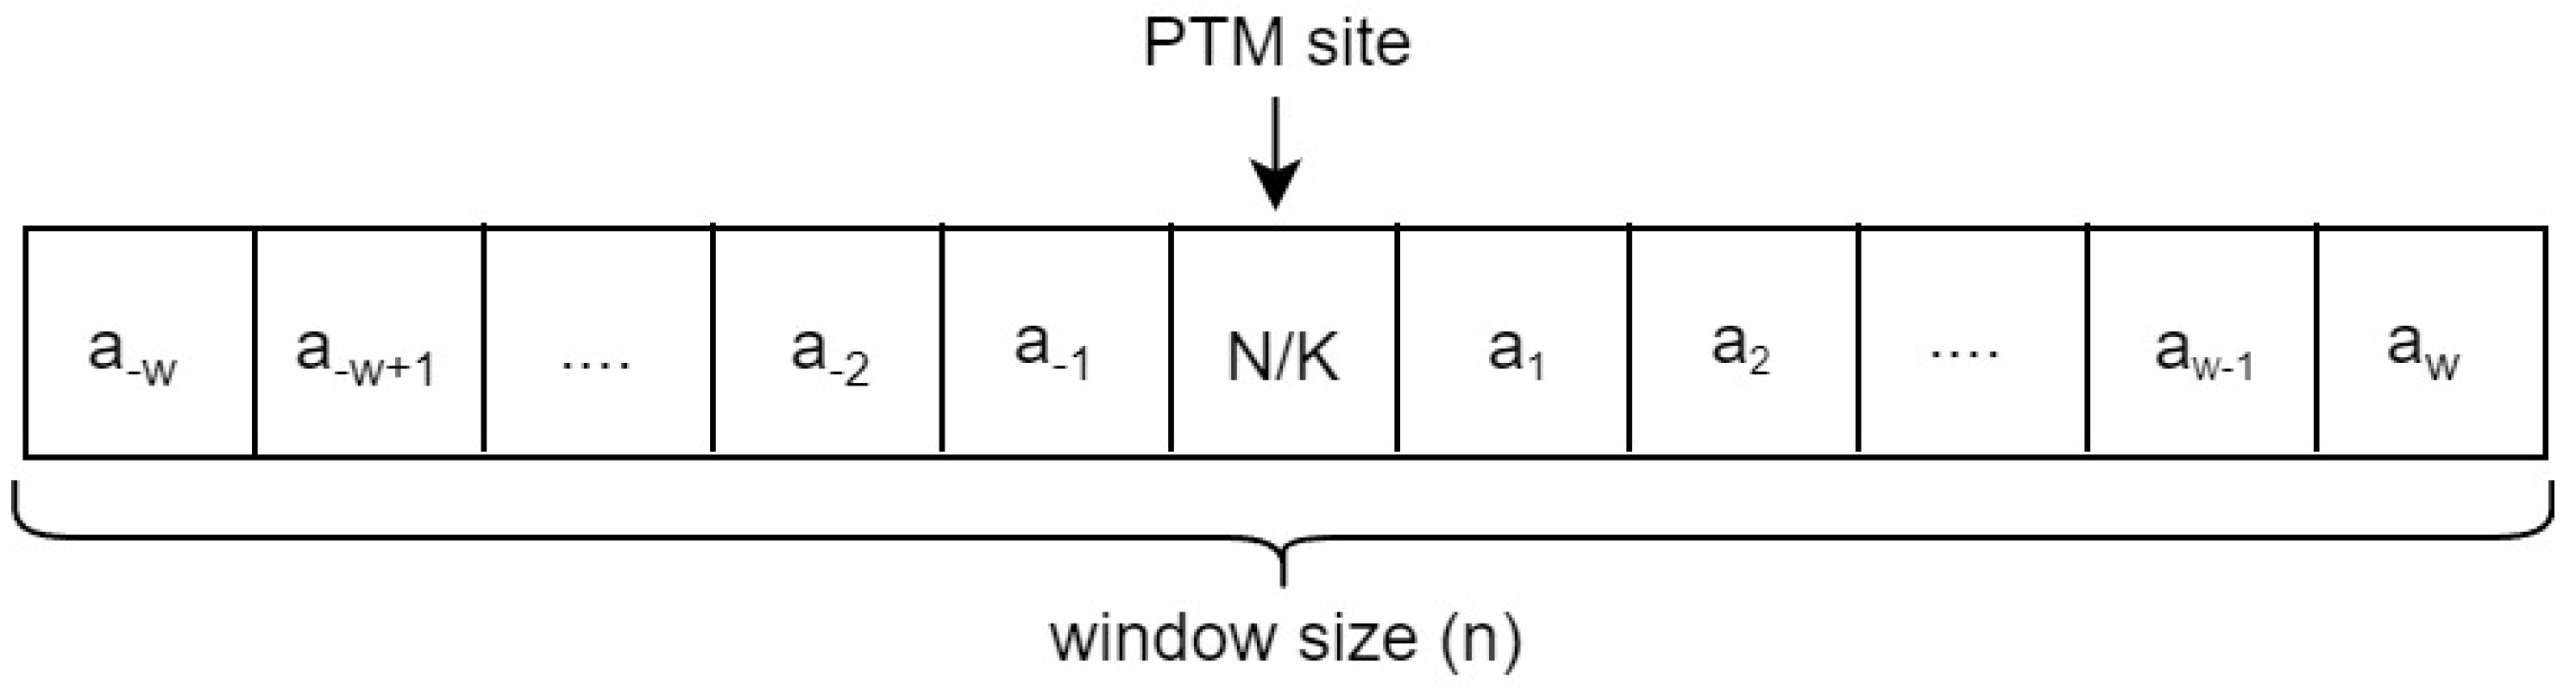
The samples in Ngly or Kgly are represented as fragments by using a sliding window approach in which the PTM site is in the middle and surrounded by w-residues from the downstream and upstream as shown in
Figure 2. The optimal size for the fragment used with the Ngly dataset in the PUStackNGly study was
n = 25 (that means
w = 12 downstream and upstream residues). With the Kgly dataset in the PredGly study, the optimal size for the fragment was
n = 31 (that means
w = 15 downstream and upstream residues). The number of surrounding residues (
w) can be set to a different value in PTG-PLM.
2.2. Embedding Using PLMs
PLMs allow us to extract features from only the evolutionary relationships present in tokens (amino acids) of protein sequences. Embedding is a way to encode the sequence (peptide sequence) into numeric representation by PLMs. Given peptide sequence
P (
) where each token
represents one amino acid and
n is the length of the peptide sequence, the embedding can be represented as:
where
is embedded numeric vectors that represent the token
.
Six pre-trained transformer-based PLMs are used to encode the peptide sequences including ProtBERT-BFD [
46], ProtBERT [
46], ProtALBERT [
46], ProtXLNet [
46], ESM-1b [
47] and TAPE [
48]. These PLMs are based on self-supervised masked language models, such as BERT [
49], Albert [
50], and XLNet [
51], that have demonstrated state-of-the-art performance on various NLP tasks. In the masked language models, a small percentage of randomly selected tokens are masked to an extra token, for example, to “X”. The masked language models model the product of conditional probabilities of tokens in each position given all other tokens in the sequence by replacing the token at each position with the masked token. This allows gaining the conditional non-independence between tokens on both sides of the masked token [
28]. The formula of the masked language model is represented as follows:
where
is the token in position
i and
n is the length of the sequence. The key differences between the used PLMs are the used dataset, pre-trained LM, number of layers, hidden layers size, number of attention heads, and number of parameters which are shown in
Table 1.
2.2.1. ProtBERT-BFD
ProtBERT-BFD is based on the BERT language model that is trained on the BFD [
52] (Big Fantastic Database) with over 2 billion protein sequences or 393 billion tokens. The number of layers was increased compared with the original BERT model. The features are extracted (embedding) from the last hidden state of the PLM with a size of 1024 ×
n, where
n is the length of the peptide sequence (
n = 25 for Ngly dataset and 31 for Kgly dataset).
2.2.2. ProtBERT
ProtBERT is based on the BERT language model that is trained on the UniRef100 [
53] database with about 216 million protein sequences. The number of layers was also increased compared with the original BERT model. The features are extracted (embedding) from the last hidden state of the PLM with the size 1024 ×
n, where
n is the length of the peptide sequence.
2.2.3. ProtAlbert
ProtAlbert is based on the Albert language model that is trained on the UniRef100 [
53] database with about 216 million protein sequences. The number of layers was also increased compared with the original Albert model. In addition, the global batch size was increased from 4096 to 10,752 because of the small number of vocabularies (20 amino acids) in proteins compared to thousands of words. The features are also extracted (embedding) from the last hidden state of the PLM with a size 4096 ×
n, where
n is the length of the peptide sequence.
2.2.4. ProtXLNet
ProtXLNet is based on the XLNet language model that is trained on the UniRef100 [
53] database with about 216 million protein sequences. The number of layers was increased to 30 layers compared with the original XLNet model. In addition, the global batch size was reduced to 1024. The features are also extracted (embedding) from the last hidden state of the PLM with the size 1024 ×
n, where
n is the length of the peptide sequence.
2.2.5. ESM-1b
ESM-1b is a transformer PLMs from Facebook AI Research based on the BERT language model that is trained on the UniRef50 [
53] database. The features are also extracted (embedding) from the last hidden state of the PLM with a size 1280 ×
n, where
n is the length of the peptide sequence.
2.2.6. TAPE
Tasks Assessing Protein Embeddings (TAPE) is based on the BERT language model that is trained on the Pfam database [
54] with about 31 million protein sequences. The features are also extracted (embedding) from the last hidden state of the PLM with a size 768 ×
n, where
n is the length of the peptide sequence.
The number of extracted features for each sample or peptide sequence in the two datasets using embedding by each PLM is shown in
Table 2 which is calculated by the product between the length of the sequence and the number of last hidden layers of the PLMs.
2.3. CNN Deep Learning
The structure of the used CNN model is shown in
Figure 1. The CNN model consists of multiple blocks/layers that map the embedded features to the target PTM site class (0 for negative or 1 for positive):
- (i)
Input:
The input to the CNN model is the extracted features from PLMs embedding. It is a 3D array with size () where m is the number of samples, n is the length of the sample and f is the number of features for each token in the sample.
- (ii)
Convolutional block:
A convolutional block consists of three sublayers: the first is the CNN1D layer, batch normalization, and activation function. Unlike fully connected networks, CNNs includes conditional connections to calculate local features called feature map. The filters and kernel size (
k) that represent the output of CNN1D and the length of the CNN1D window, respectively, are used as parameters by CNN1D to handle convolution operations. Depending on the kernel (
k), multiple feature extractors
where
, represented as follows [
55]:
where * represents the convolution operation,
represents the grid representation for the previous layer. The convolution outputs
are treated as slides and compounded to form a large tensor of convolution layer. The previous equation represents the convolution operation that can be presented as the transformation similar to DNN:
where
is the original vector representation of
, which is gained as a result of the convolution of the input data from the previous layer (
) with the tensor
W (containing filters), and adding bias
b.
The second sublayer of the convolution block is the batch normalization that typically normalizes the input data for the next layers, reduces the risk of overfitting, allows higher learning rates, and makes the training of the CNN faster and more stable [
55]. The third sublayer of the convolution block is the activation function which is a non-linear mathematical function used to generate a high-level feature map of CNN. We use the present rectified linear unit (ReLU) activation function which is represented as:
- (iii)
Flatten layer:
The output feature map of the CNN layer is typically flattened, i.e., converted into low-dimension to be fitted to the next fully connected network layers.
- (iv)
Last layer activation function:
Finally, a different activation function is applied to the output of the last FNN. This function is a decision function for the final output of the CNN model. Since our data class label is binary, the Sigmoid function is used which gives a value between 0 and 1. The Sigmoid function is represented as:
CNN model is trained to classify glycosylation/glycation sites into two classes: positive (glycosylated/glycated) or negative (non-glycosylated/non-glycated) using the binary cross-entropy as a loss function and Adam optimizer. This optimizer depends on the learning rate, batch size, and maximum epoch hyperparameters which help the model to adjust its kernels or weights during the training. The early stopping strategy is utilized on the cost of the validation set to terminate the training process when the accuracy does not increase with the patience value “8”.
Different hyperparameters have experimented with the different layers of the CNN model based on the two datasets and the different PLMs. The optimal hyperparameters are clarified in
Table 3.
2.4. Machine Learning Algorithms
To demonstrate the effectiveness of the embeddings of PLMs, the CNN model is compared with four machine learning algorithms namely, SVM, Logistic Regression (LR), RF, and XGBoost. SVM, LR, and RF algorithms are applied using the Scikit-learn Python library [
56], while XGBoost is applied using the XGBoost Python library [
57].
2.4.1. SVM
SVM is a state-of-the-art classifier originally developed by Vapnik and Cortes [
58]. SVM has been widely used in computational biology and bioinformatics. The mean idea of SVM is to classify by determining the optimal separator hyperplane that maximizes the margin between the classes.
2.4.2. Logistic Regression (LR)
Because the dependent outcome is discrete (positive/negative), LR is a common machine learning method in clinical research. For classification, LR calculates the probability of the discrete binary classes [
59].
2.4.3. Random Forest (RF)
RF [
60] is an ensemble-based machine learning algorithm that is based on the decision tree approach. It is used extensively in computational biology because it is simple and appropriate for high-dimensional data. It is made up of several decision trees, each of which has multiple nodes and routes. Each node has its own set of rules for choosing between two or more routes. The final result of RF is generated by combining the decision tree outcomes.
2.4.4. XGBoost (XGB)
XGB [
57] is also an ensemble learning method that is based on the tree boosting framework. It is an ensemble tree algorithm that implements boosting learners using the gradient descent technique which has the benefit to deal with high dimensional data.
The hyperparameters for the four machine learning classifiers are shown in
Table 4 along with the used value for each parameter.
2.5. Model Evaluation
Five-fold cross-validation and independent test are used to evaluate the PTG-PLM model and compare it with the other tools. Several evaluation metrics are employed in this work, including accuracy, Matthew’s correlation coefficient (
), recall, precision, and
-score which are illustrated as:
where
(True Positive) is the number of positive sites that are correctly predicted,
(True Negative) is the number of negative sites that are correctly predicted,
(False Positive) is the number of positive sites that are incorrectly predicted, and
(False Negative) is the number of negative sites that are incorrectly predicted. In addition, we use the
metric, the area under the receiver operating characteristic curve (ROC), that measures the classifier’s ability for separating data of the two classes by plotting the true positive rate (
) against the false positive rate (
).
3. Results
In this section, we present the achieved experimental results of PTG-PLM. PTG-PLM is performed on the Ngly and Kgly datasets for glycosylation/glycation site prediction. Each dataset is divided into three sets: training, validation, and testing set. The number of samples in each dataset was described in
Section 2.1. The training sets are used for training the models as well as evaluating using the cross-validation method. The validation sets are used by the CNN model to adjust its hyperparameters and weights during the training process. In contrast, the testing sets are used for independent testing and comparing PTG-PLM with the other machine learning techniques as well as comparing with the existing tools of glycosylation/glycation site prediction. Six recent PLMs including ProtBERT-BFD, ProtBERT, ProtALBERT, ProtXLNet, ESM-1b and TAPE are employed to encode peptide (samples) sequences. PLMs extract features from the peptide sequences based on the tokenization and embedding strategies. The description of PLMs was clarified in
Section 2.2. PTG-PLM is performed using each PLMs individually. The PLMs embedding and CNN model training are implemented using Python 3.7.13 on Google Colab Pro (
https://colab.research.google.com/ (accessed on 10 February 2022)) with GPUs (RAM 16g) and high RAM (28G).
3.1. Evaluation Using Cross-Validation on the Ngly Dataset
A five-fold cross-validation method is used in which the Ngly training set is randomly divided into five sets (folds). Overall the five-folds, four folds are used for training and the remaining one for testing.
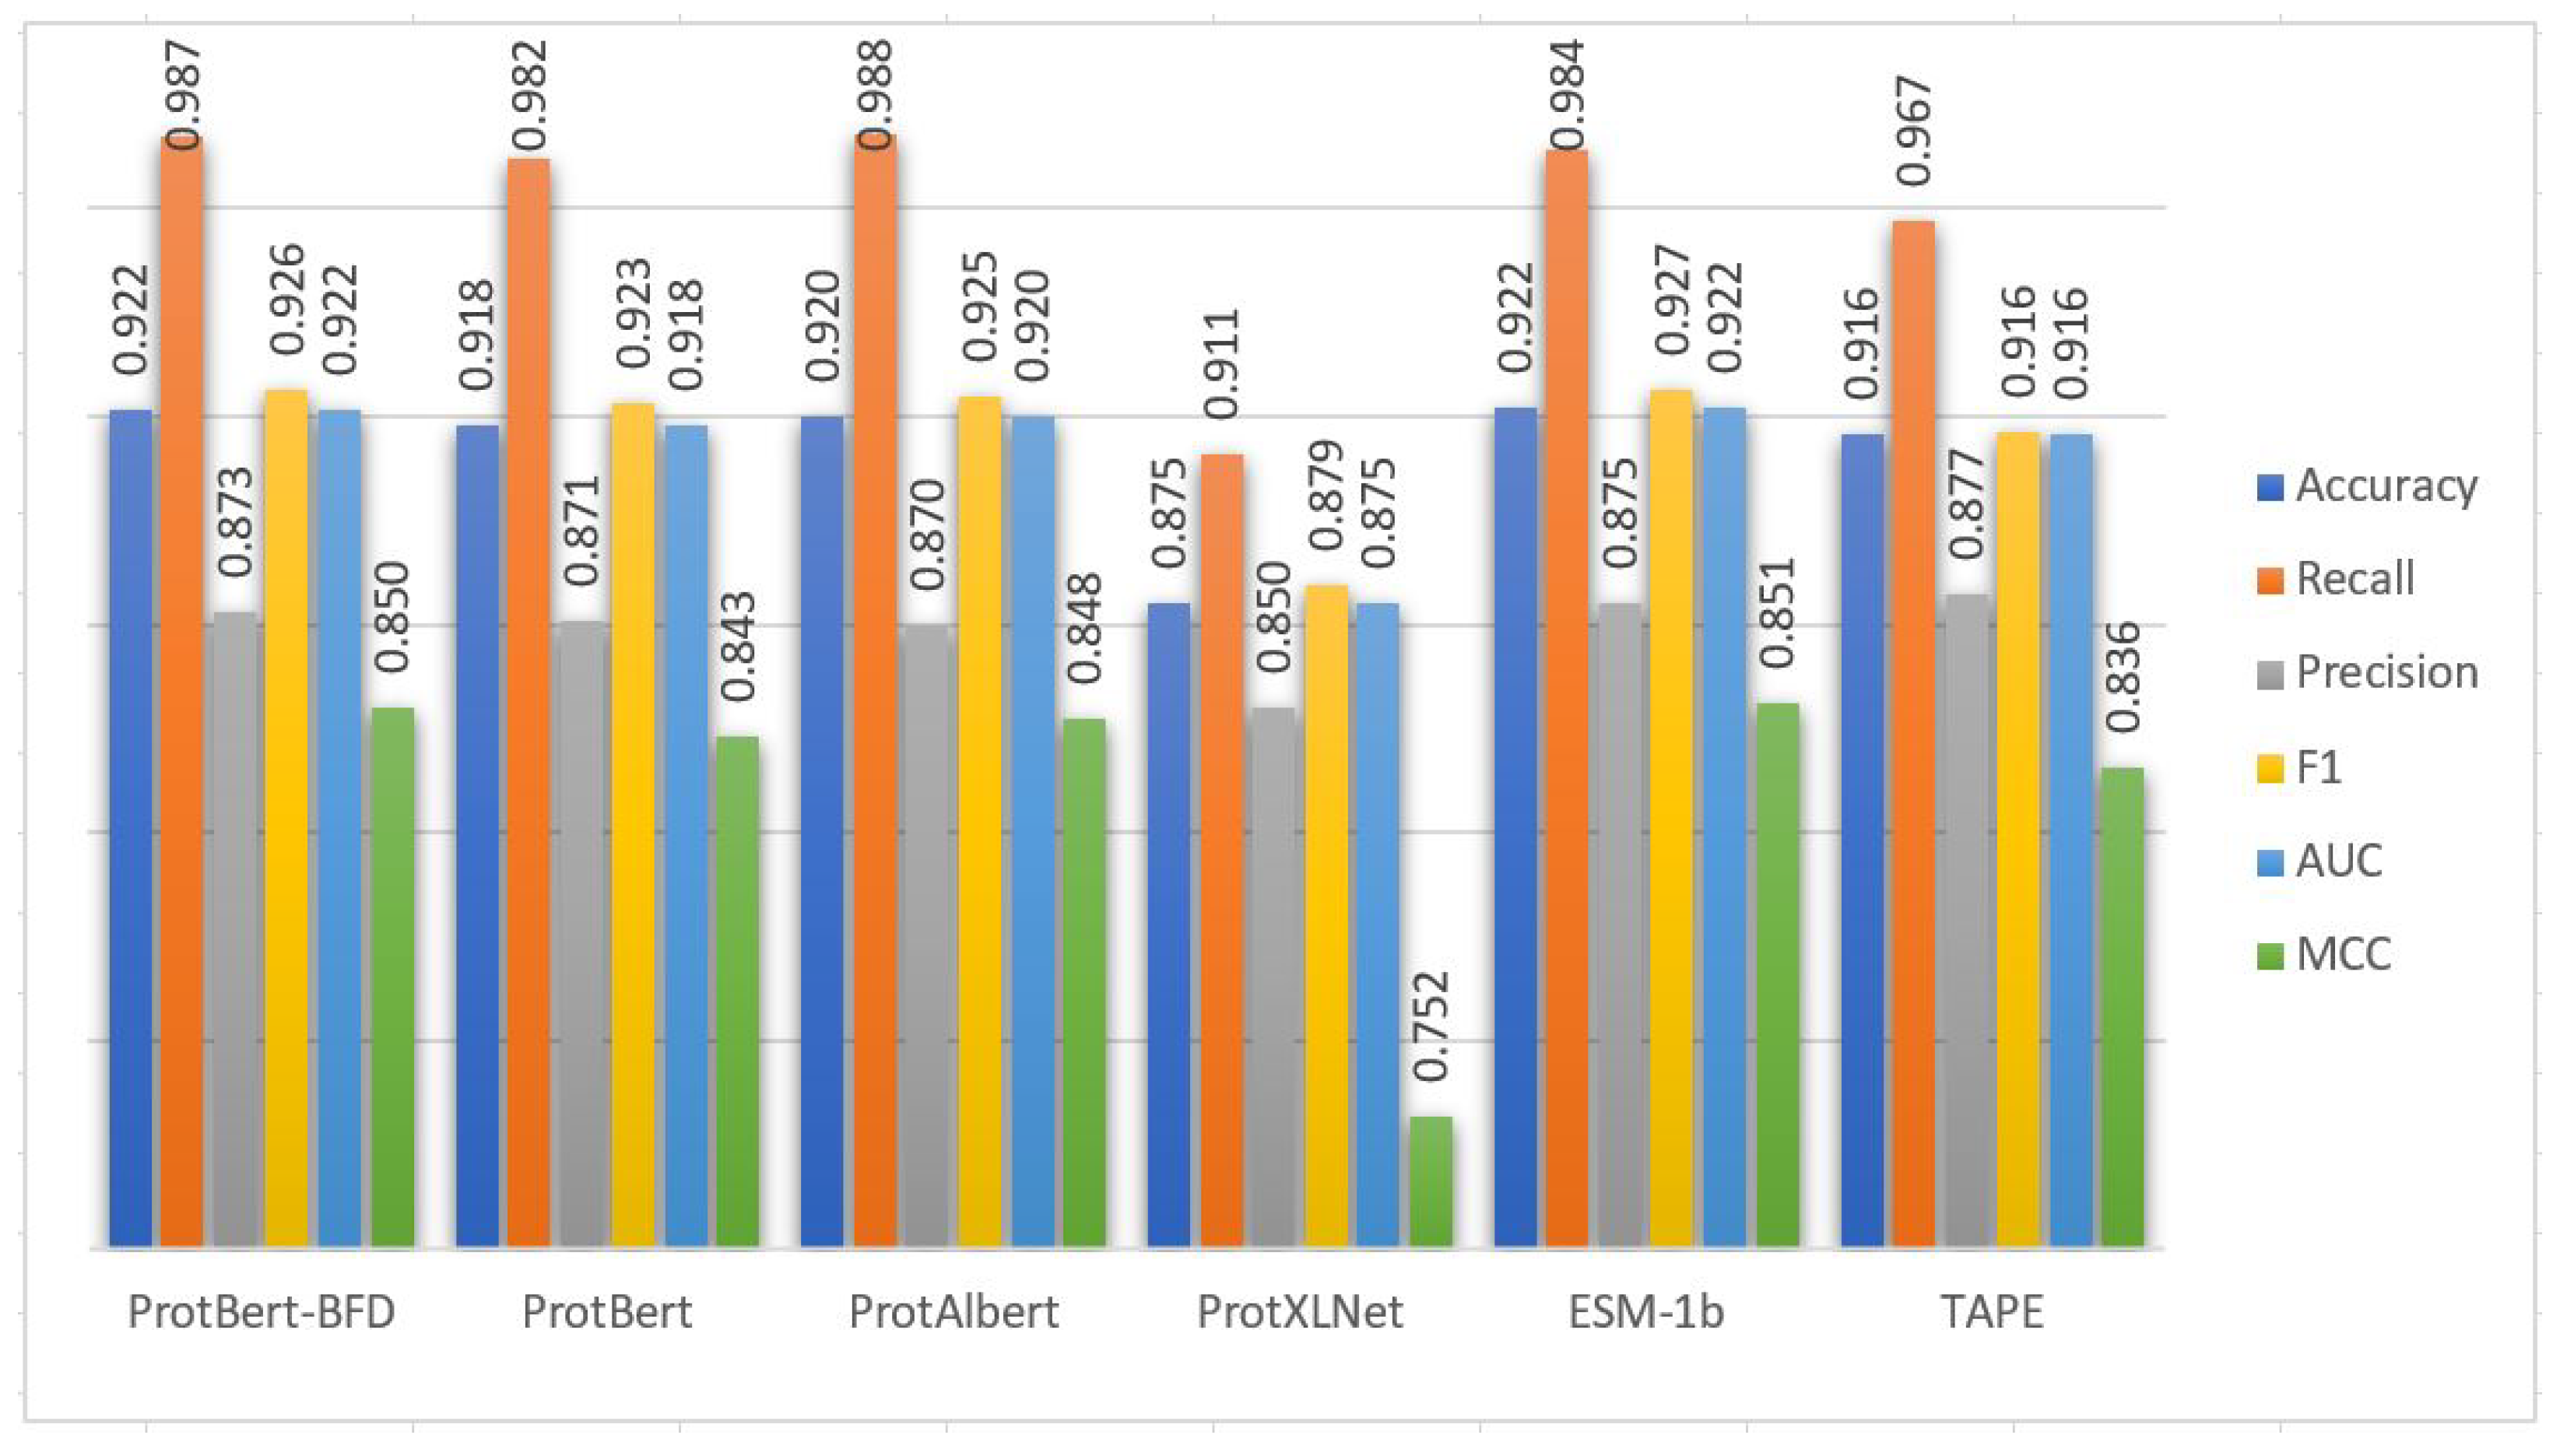
Table 5 and
Figure 3 show the performance of the CNN model using cross-validation on the extracted features from the Ngly training set based on the six PLMs embedding. From
Table 5 and
Figure 3, the performance of the CNN model based on the embedding extracted from ESM-1b PLM is generally better than the embeddings extracted from the other PLMs in terms of accuracy, recall, precision, F1, AUC, and MCC performance metrics. The performance of the CNN model based on all PLMs is great in general and close to each other except with the ProtXLNet. The model performance based on ProtXLNet PLM decreases about 10% from the ESM-1b PLM in terms of MCC measure. The five-fold cross-validation standard deviations are also consistently low based on the six PLMs (
Table 5). These results demonstrated that the prediction capabilities of the models in general are stable.
3.2. Evaluation Using Cross-Validation on the Kgly Dataset
Five-fold cross-validation is also applied to the training set of Kgly dataset to evaluate the CNN model based on the embedding from the six PLMs.
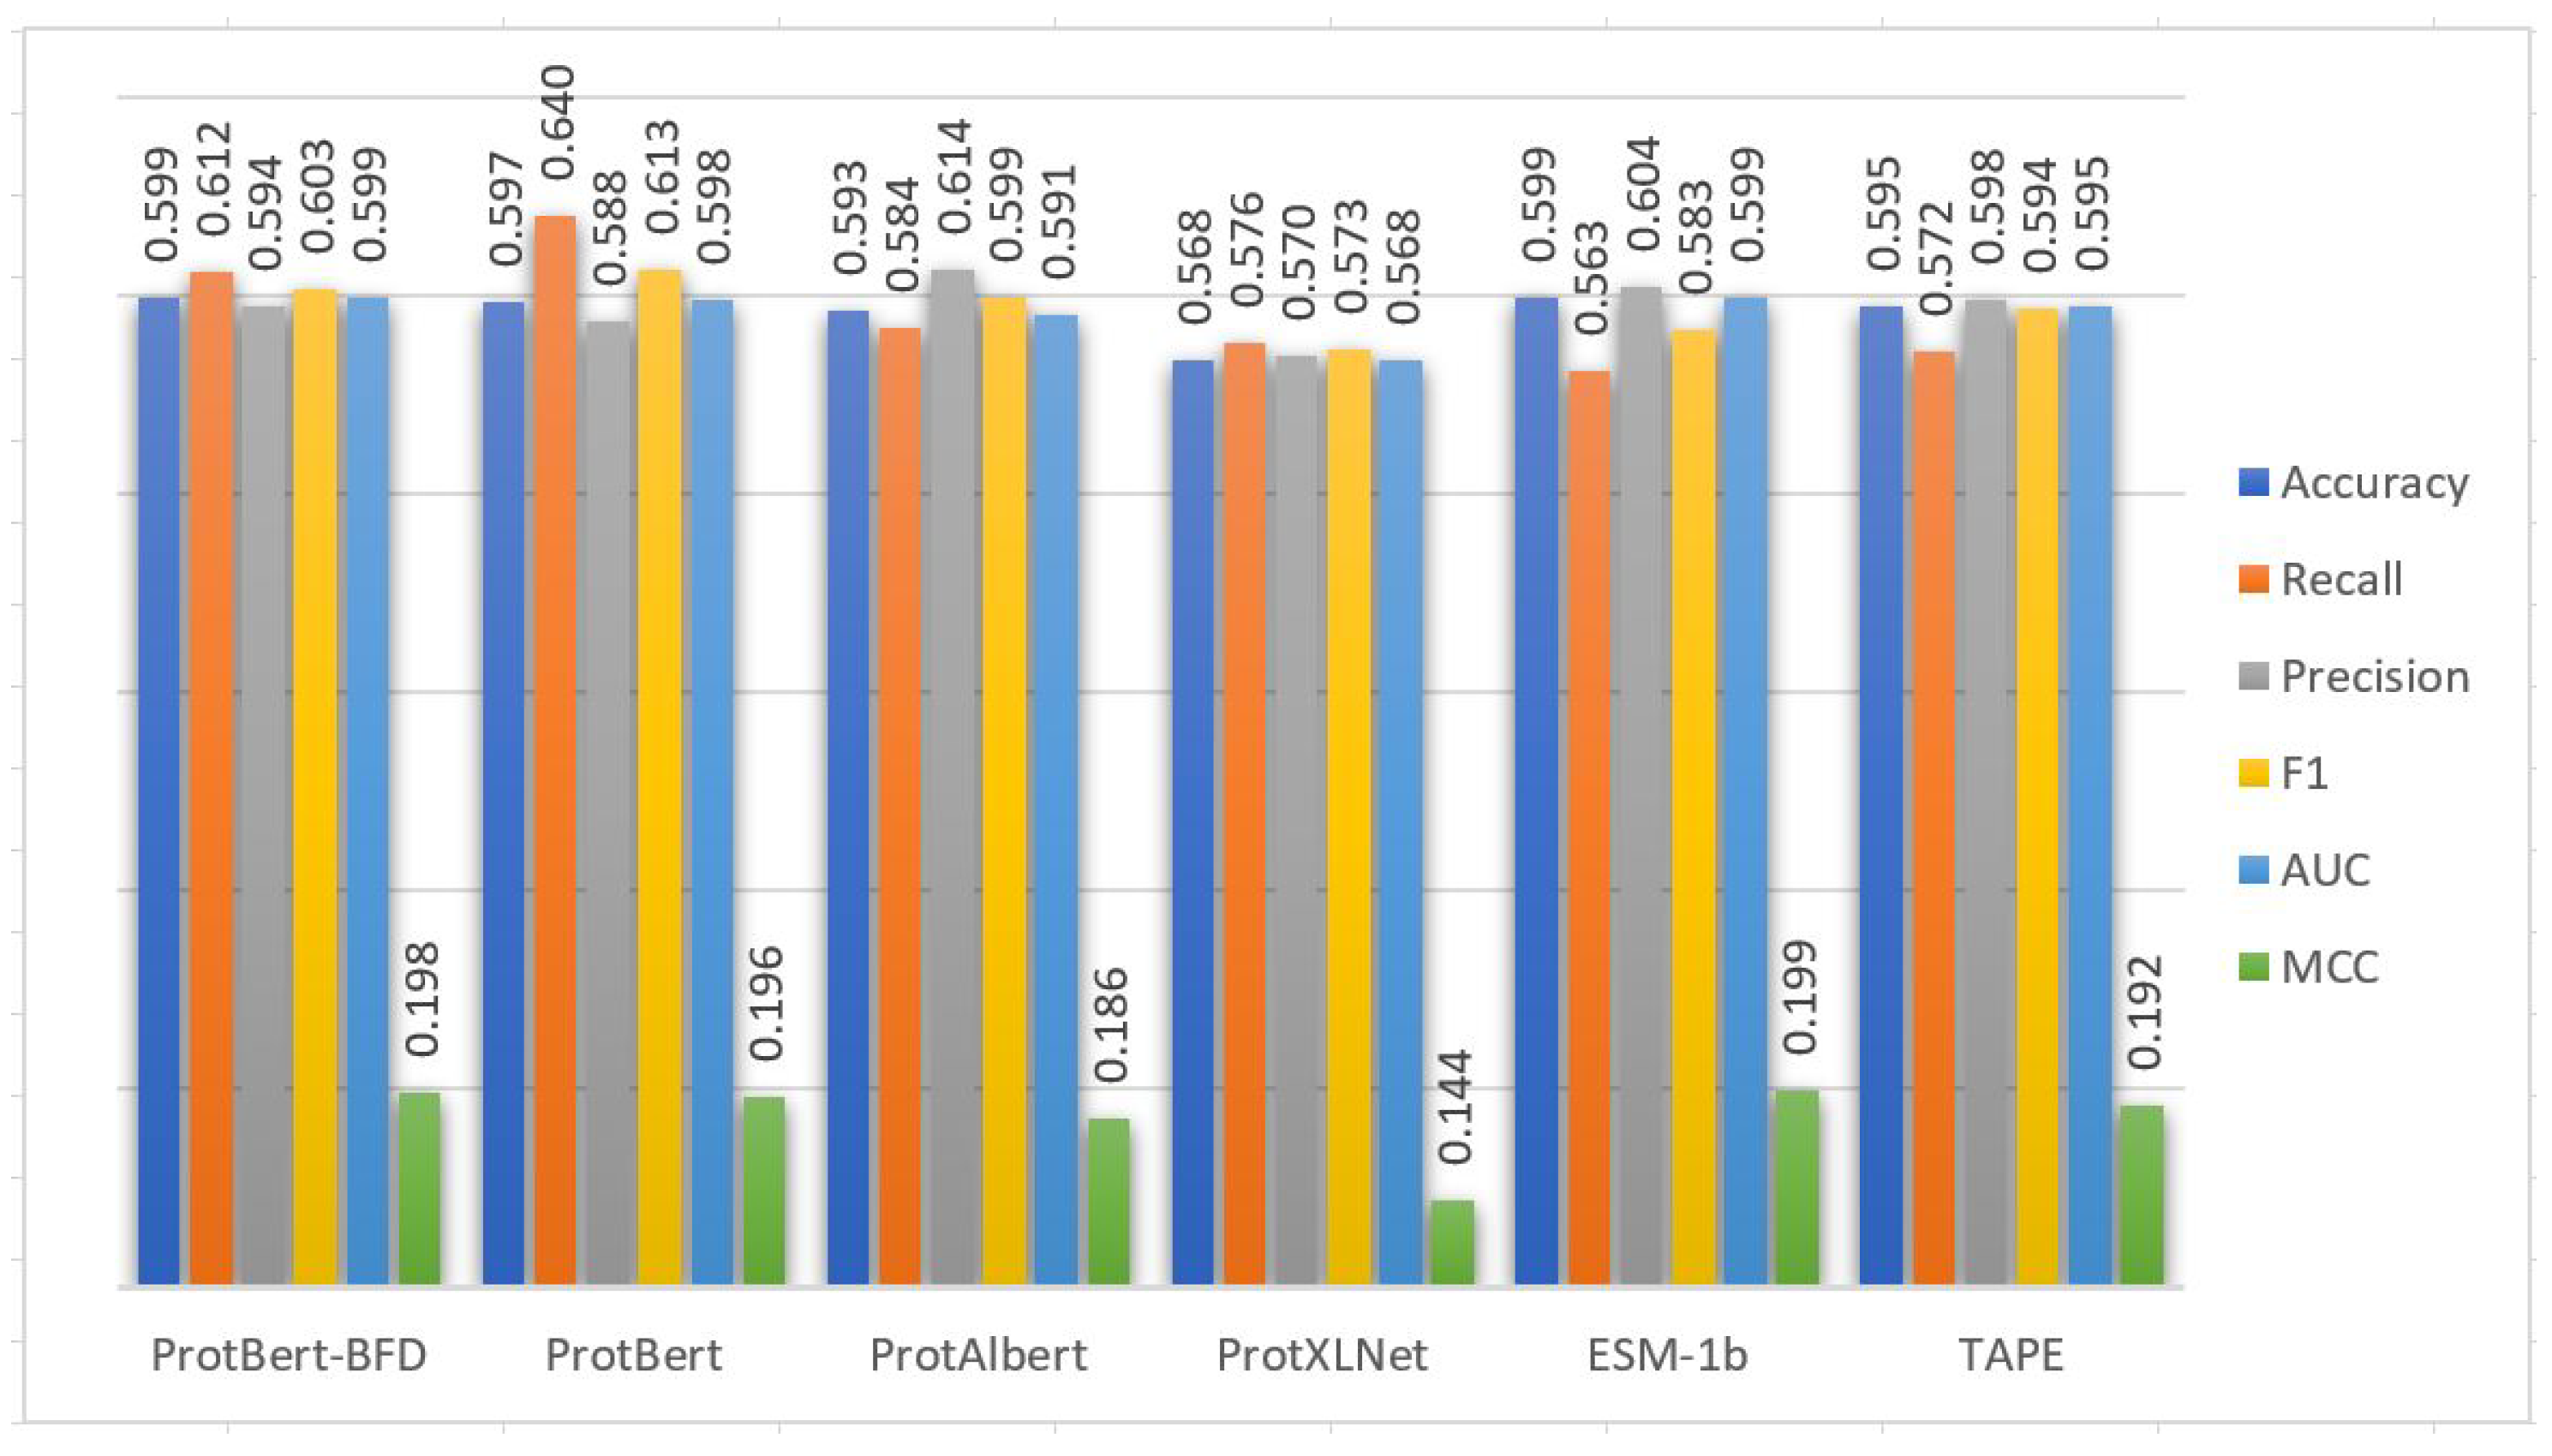
Table 5 and
Figure 4 show the performance of the CNN model using cross-validation on the extracted features from the Kgly training set based on the six PLMs embedding. From
Table 6 and
Figure 4, the performance of the CNN model based on the embedding extracted from ESM-1b PLM is also better than the embeddings extracted from the other PLMs in terms of accuracy, recall, precision, F1, AUC, and MCC performance metrics. The performance of the CNN model based on all PLMs is great in general and close to each other except PTG-PLM with the ProtXLNet that gets some The model performance based on ProtXLNet PLM decreases about 5% from the ESM-1b PLM in the term of MCC measure. The five-fold cross-validation standard deviations are also consistently low based on the six PLMs (
Table 6). These results demonstrated that the prediction capabilities of the models in general are stable.
3.3. Comparing with Supervised Learning Methods
On the testing sets of Ngly and Kgly datasets, the PTG-PLM model is compared with four state-of-the-art supervised learning methods: SVM, LR, RF, and XGB based on the embedding extracted for the six PLMs.
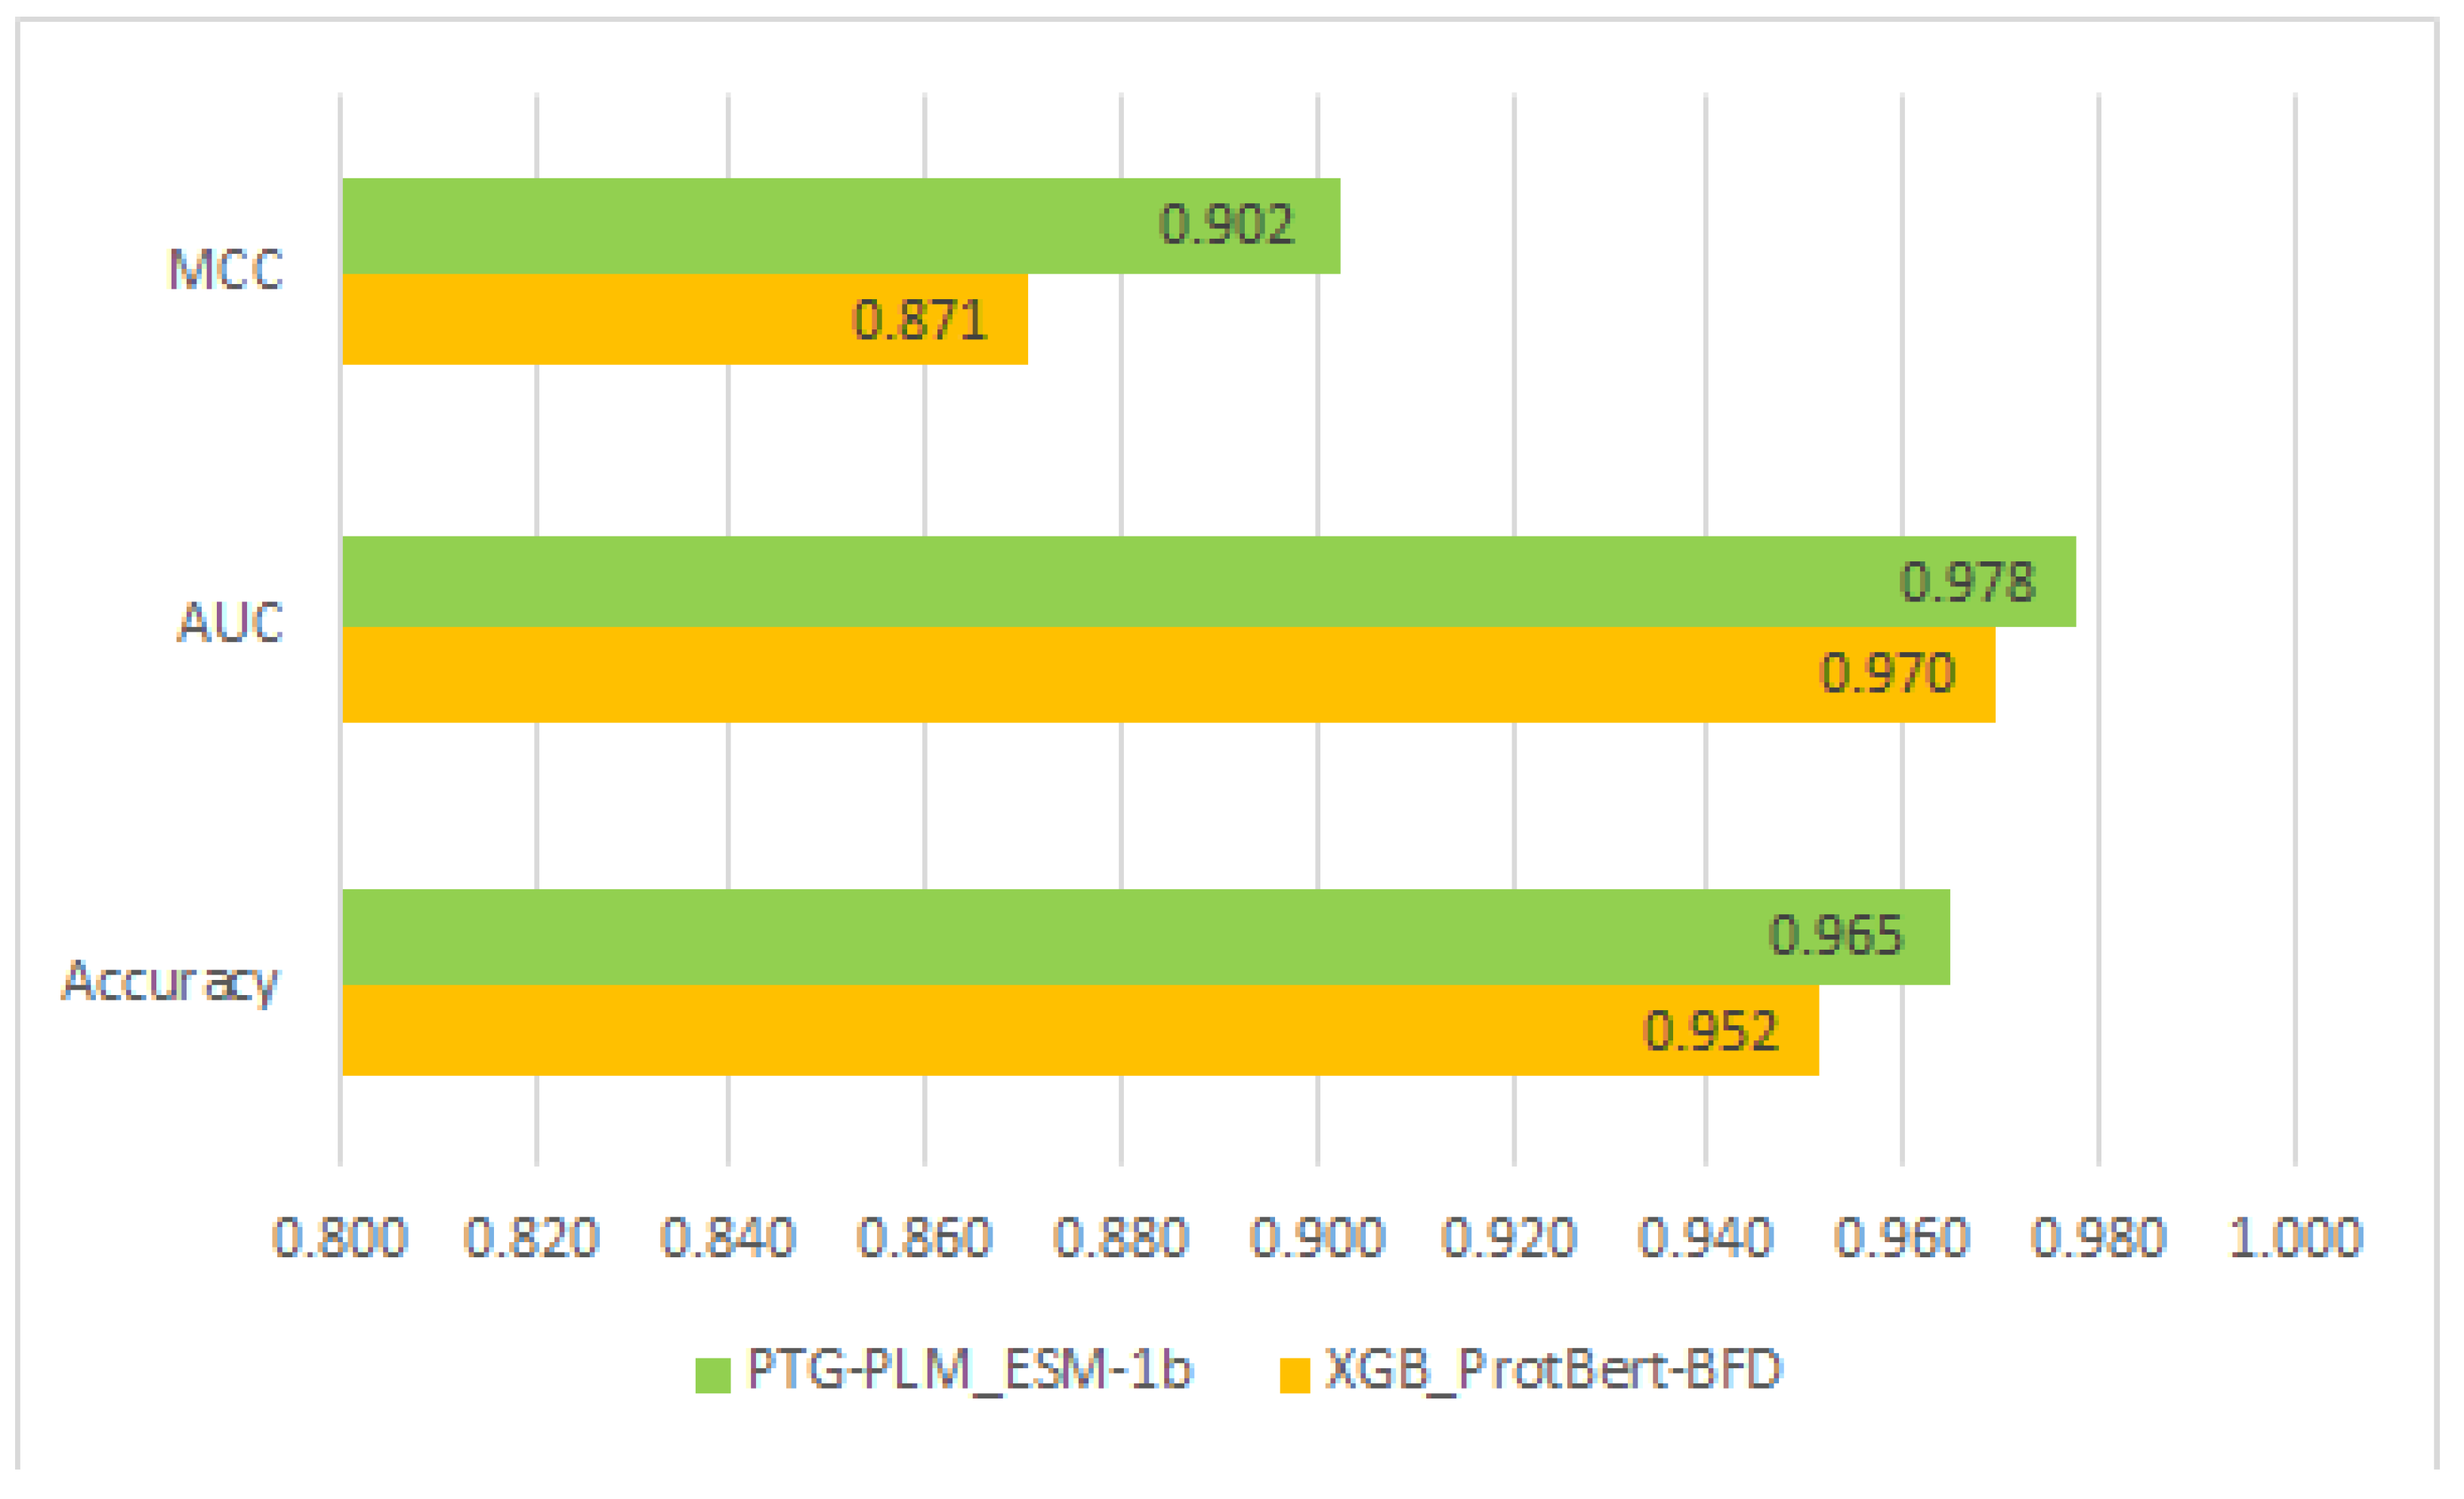
Table 7 illustrates the performance of PTG-PLM compared with supervised learning methods based on embedding extracted from the six PLMs on the Ngly independent dataset. The comparison is measured by three performance metrics: accuracy, AUC, and MCC. Generally, the PTG-PLM outperforms the other supervised learning methods in terms of accuracy, AUC, and MCC. Moreover,
Table 7 shows that the highest performance of PTG-PLM on the independent dataset is based on the embedding of the ESM-1b transformer with a 0.965 accuracy, 0.978 AUC, and 0.902 MCC. On the other hand, the highest performance between the four supervised learning methods is with the XGB model and based on the embedding of ProtBert-BFD transformer with a 0.952 accuracy, 0.970 AUC, and 0.871 MCC. The comparison of performance between the best PTG-PLM model based on ESM-1b and the best-supervised learning model (XGB) based on ProtBert-BFD is shown in
Figure 5.
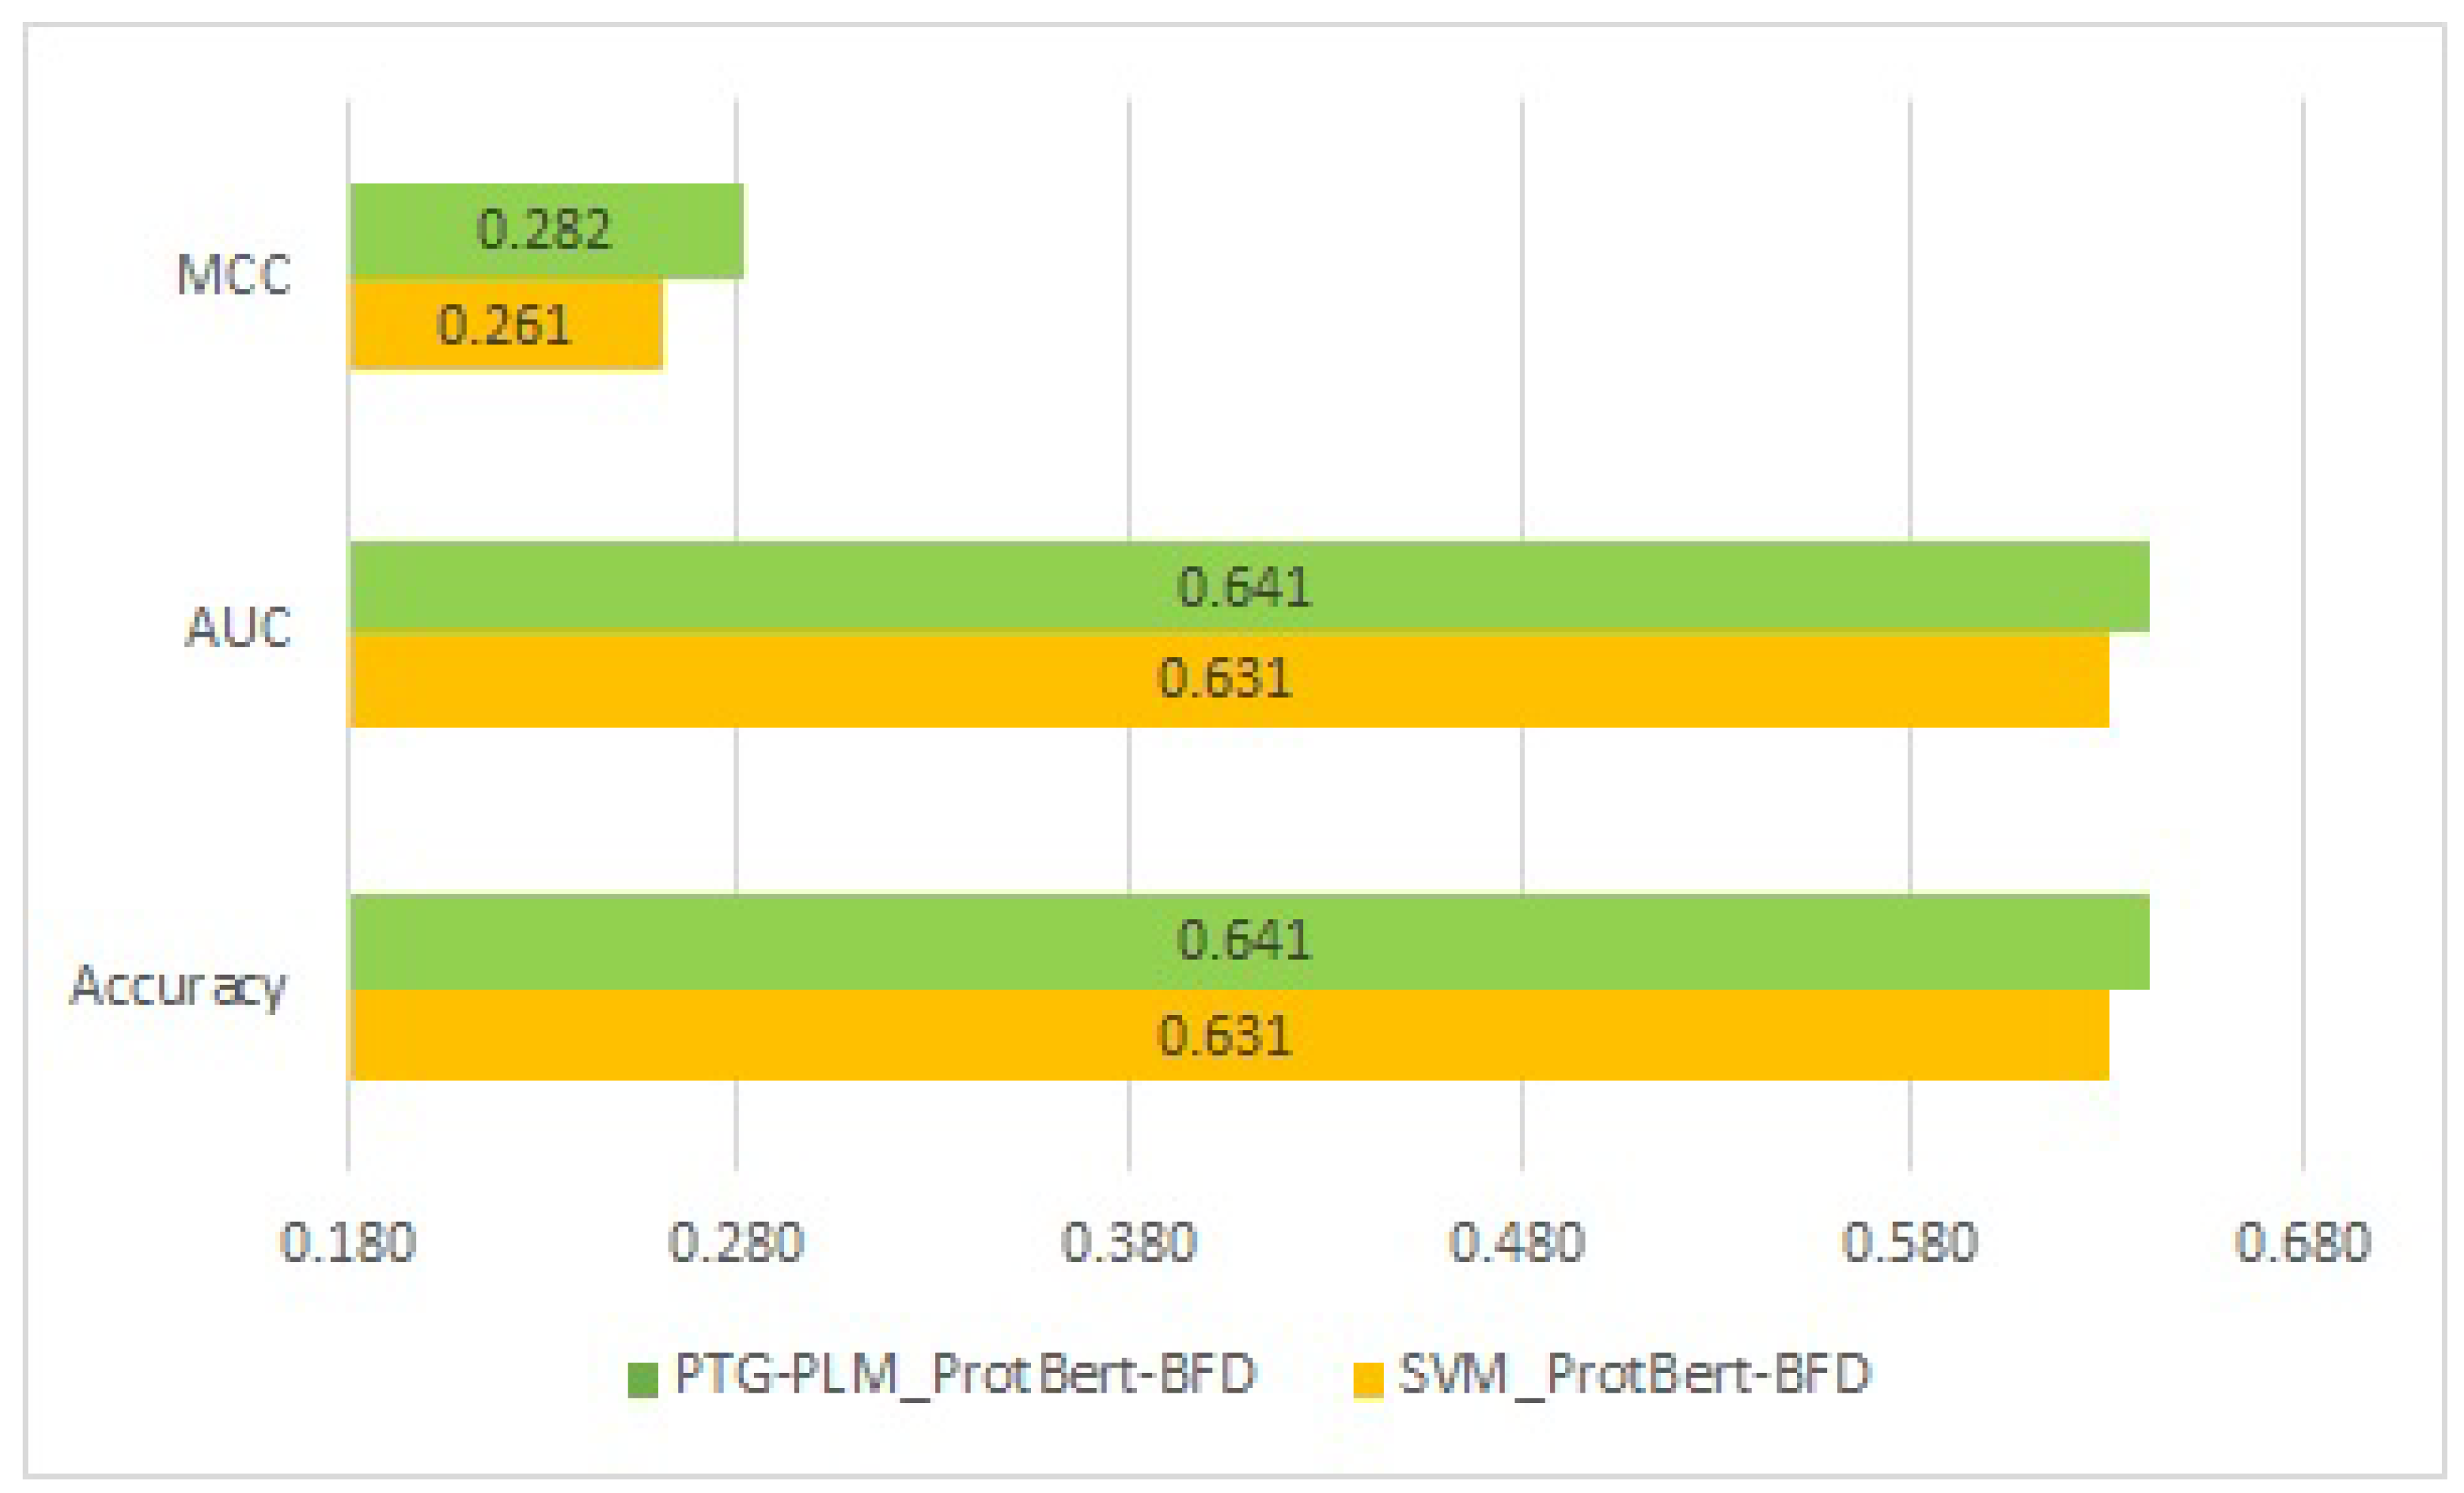
Based on the Kgly independent set, the PTG-PLM is also compared with the four supervised learning based on the embedding features extracted using the six PLMs.
Table 8 shows the comparative performance in terms of accuracy, AUC, and MCC. As shown in the table, the PTG-PLM outperforms the four supervised learning methods across all the PLMs. Furthermore, PTG-PLM with the ProtBert-BFD PLM has the best performance on the Kgly independent dataset with a 0.641 accuracy, 0.641 AUC, and 0.282 MCC. When comparing the four supervised learning methods, SVM with the ProtBert-BFD PLM has the highest performance on the Kgly independent dataset with a 0.631 accuracy, 0.631 AUC, and 0.261 MCC. The comparison of performance between the two best models, PTG-PLM with the ProtBert-BFD and SVM with the ProtBert-BFD, on the Kgly dataset is shown in
Figure 6.
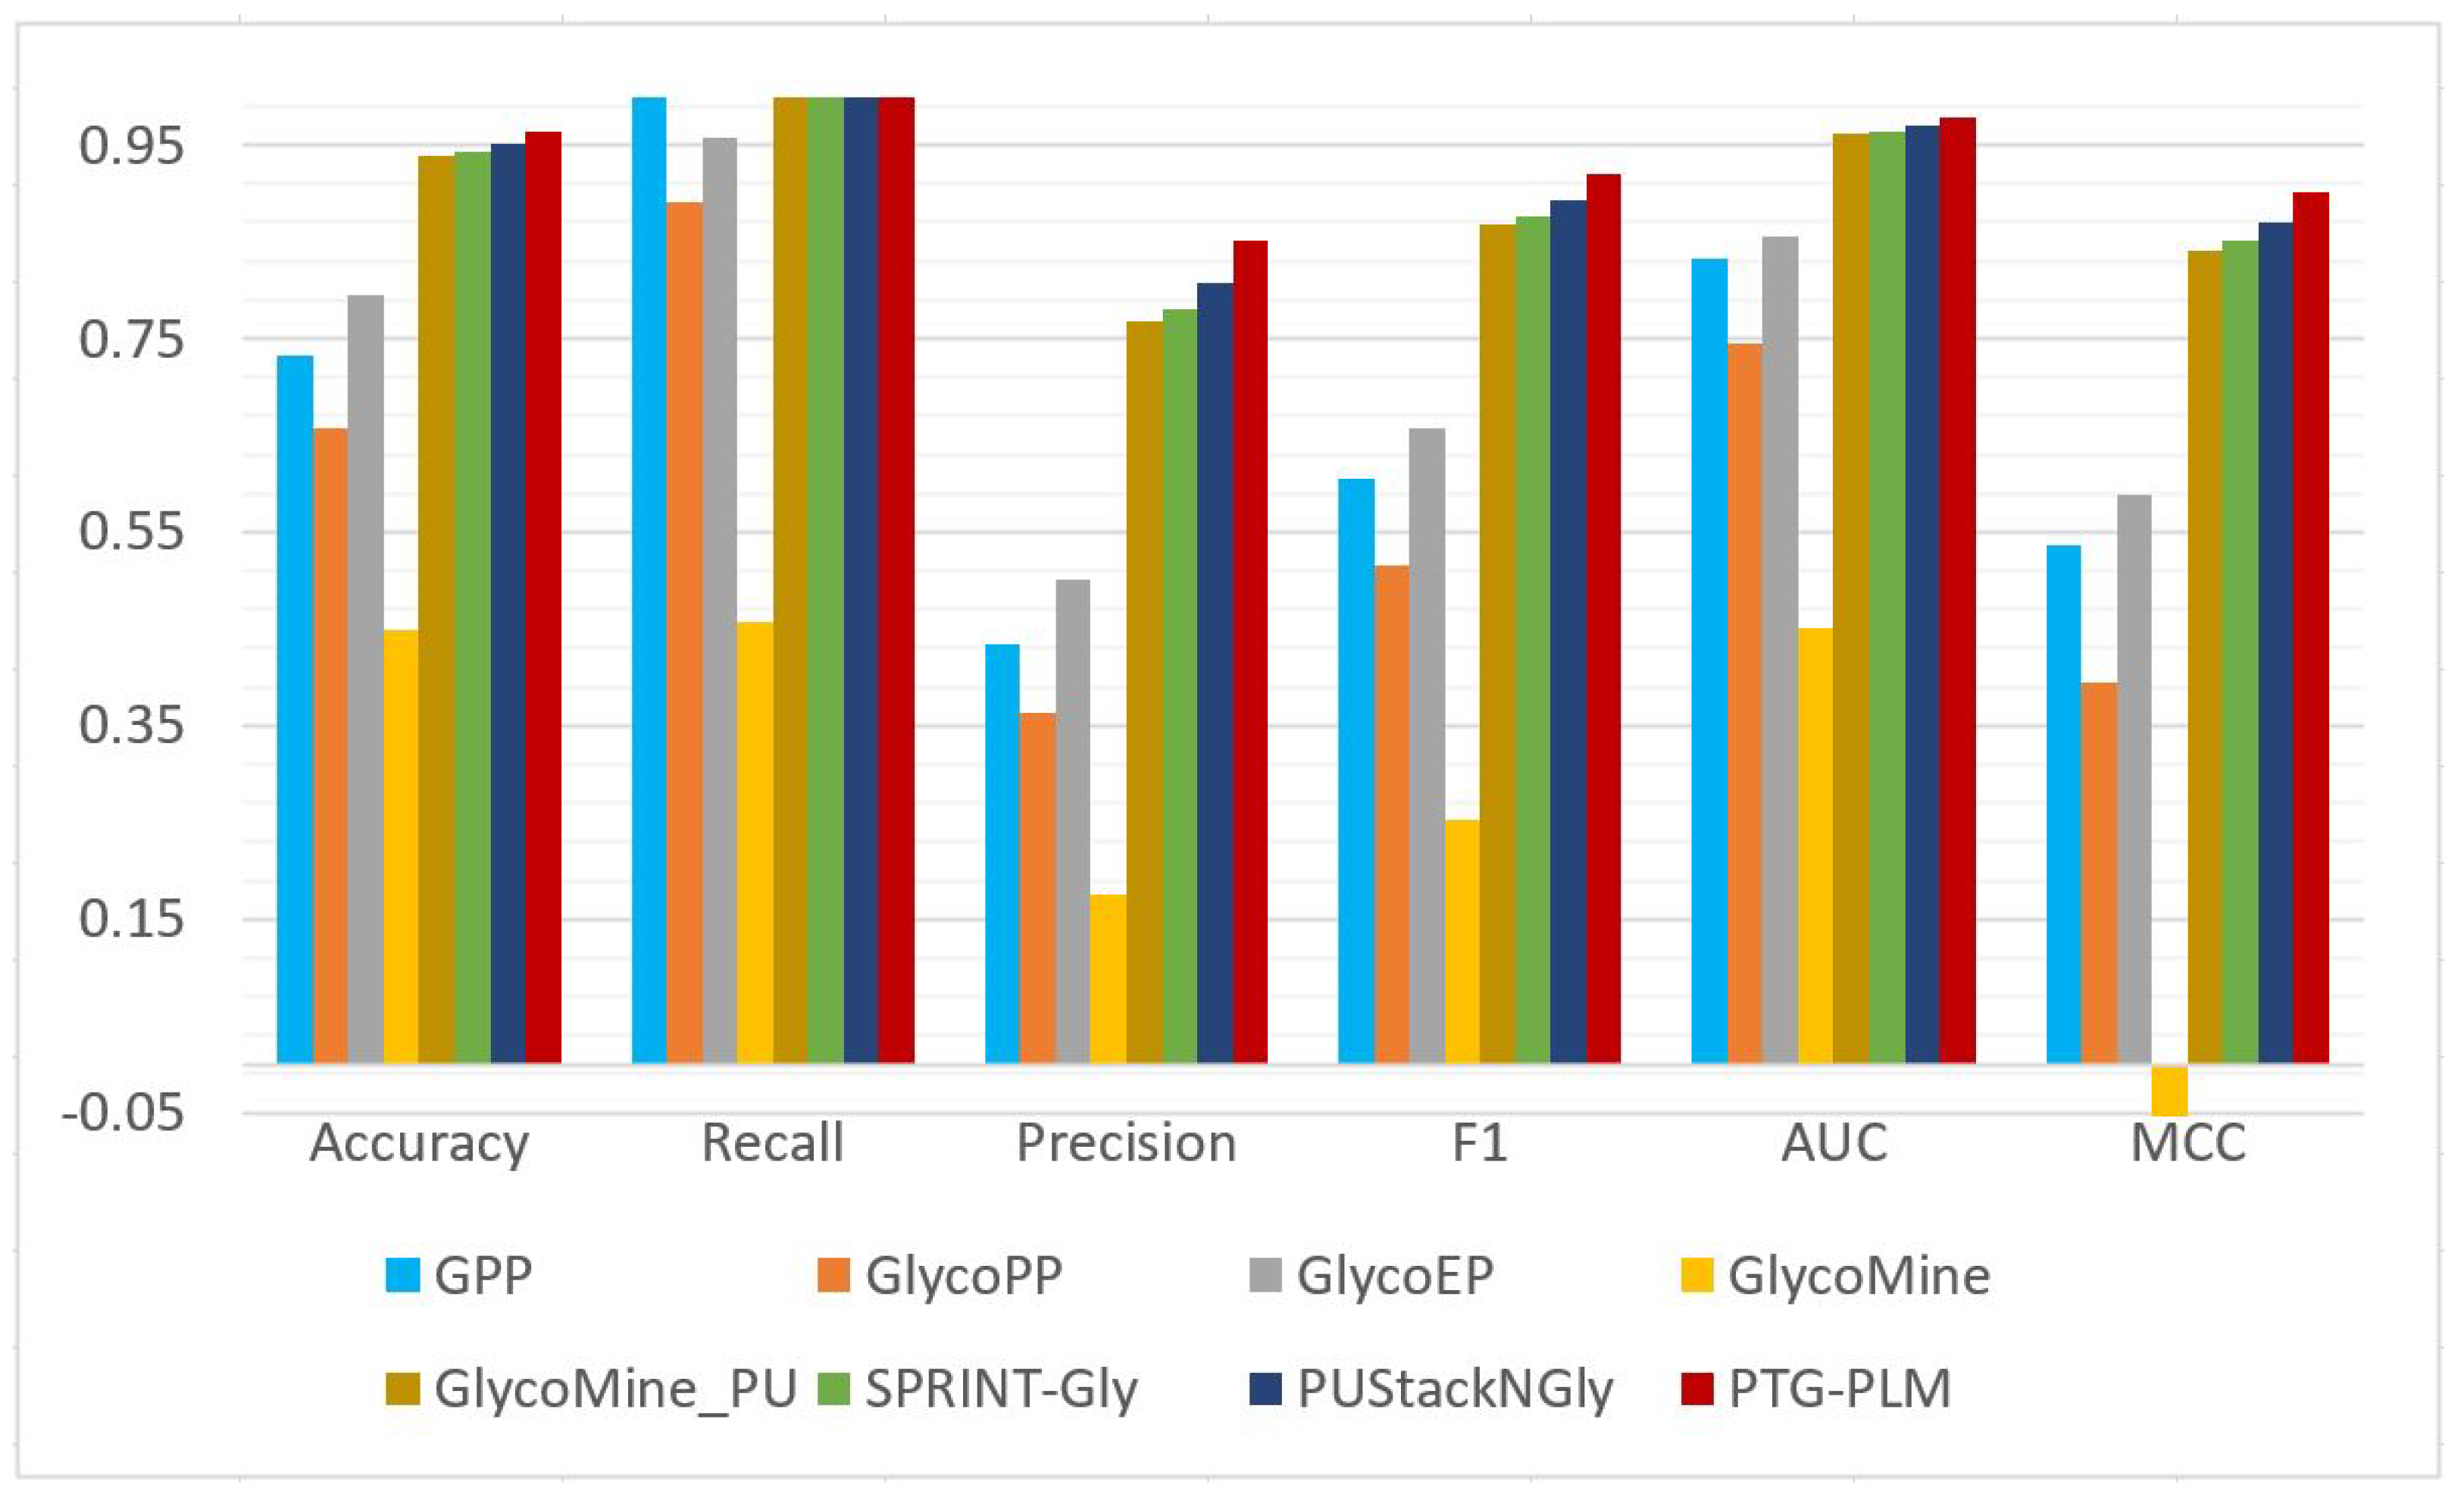
3.4. Comparing with Existing Tools for Ngly Site Prediction
The prediction performance of PTG-PLM is compared with the existing tools for Ngly site prediction on the Ngly independent dataset which is obtained from a previous study, PUStack-NGly. Besides PUStack-NGly, six other tools including SPRINT-GLY, GlycoMine_PU, GlycoMine, GlycoEP, GlycoPP, and GPP are compared with PTG-PLM on the same testing dataset. These tools are described briefly in
Section 1.2 On the Ngly independent dataset, PTG-PLM based on embedding extracted from ESM-1b PLM has the best performance as was shown in
Table 7. So, we compare the performance of PTG-PLM based on ESM-1b embedding against the seven Ngly existing tools in terms of accuracy, recall, precision, F1, AUC, and MCC as shown in
Table 9 and
Figure 7. It is shown that PTG-PLM outperforms the existing tools for Ngly site prediction with a 0.965 accuracy, 1 recall, 0.852 precision, 0.92 F1, 0.978 AUC, and 0.902 MCC.
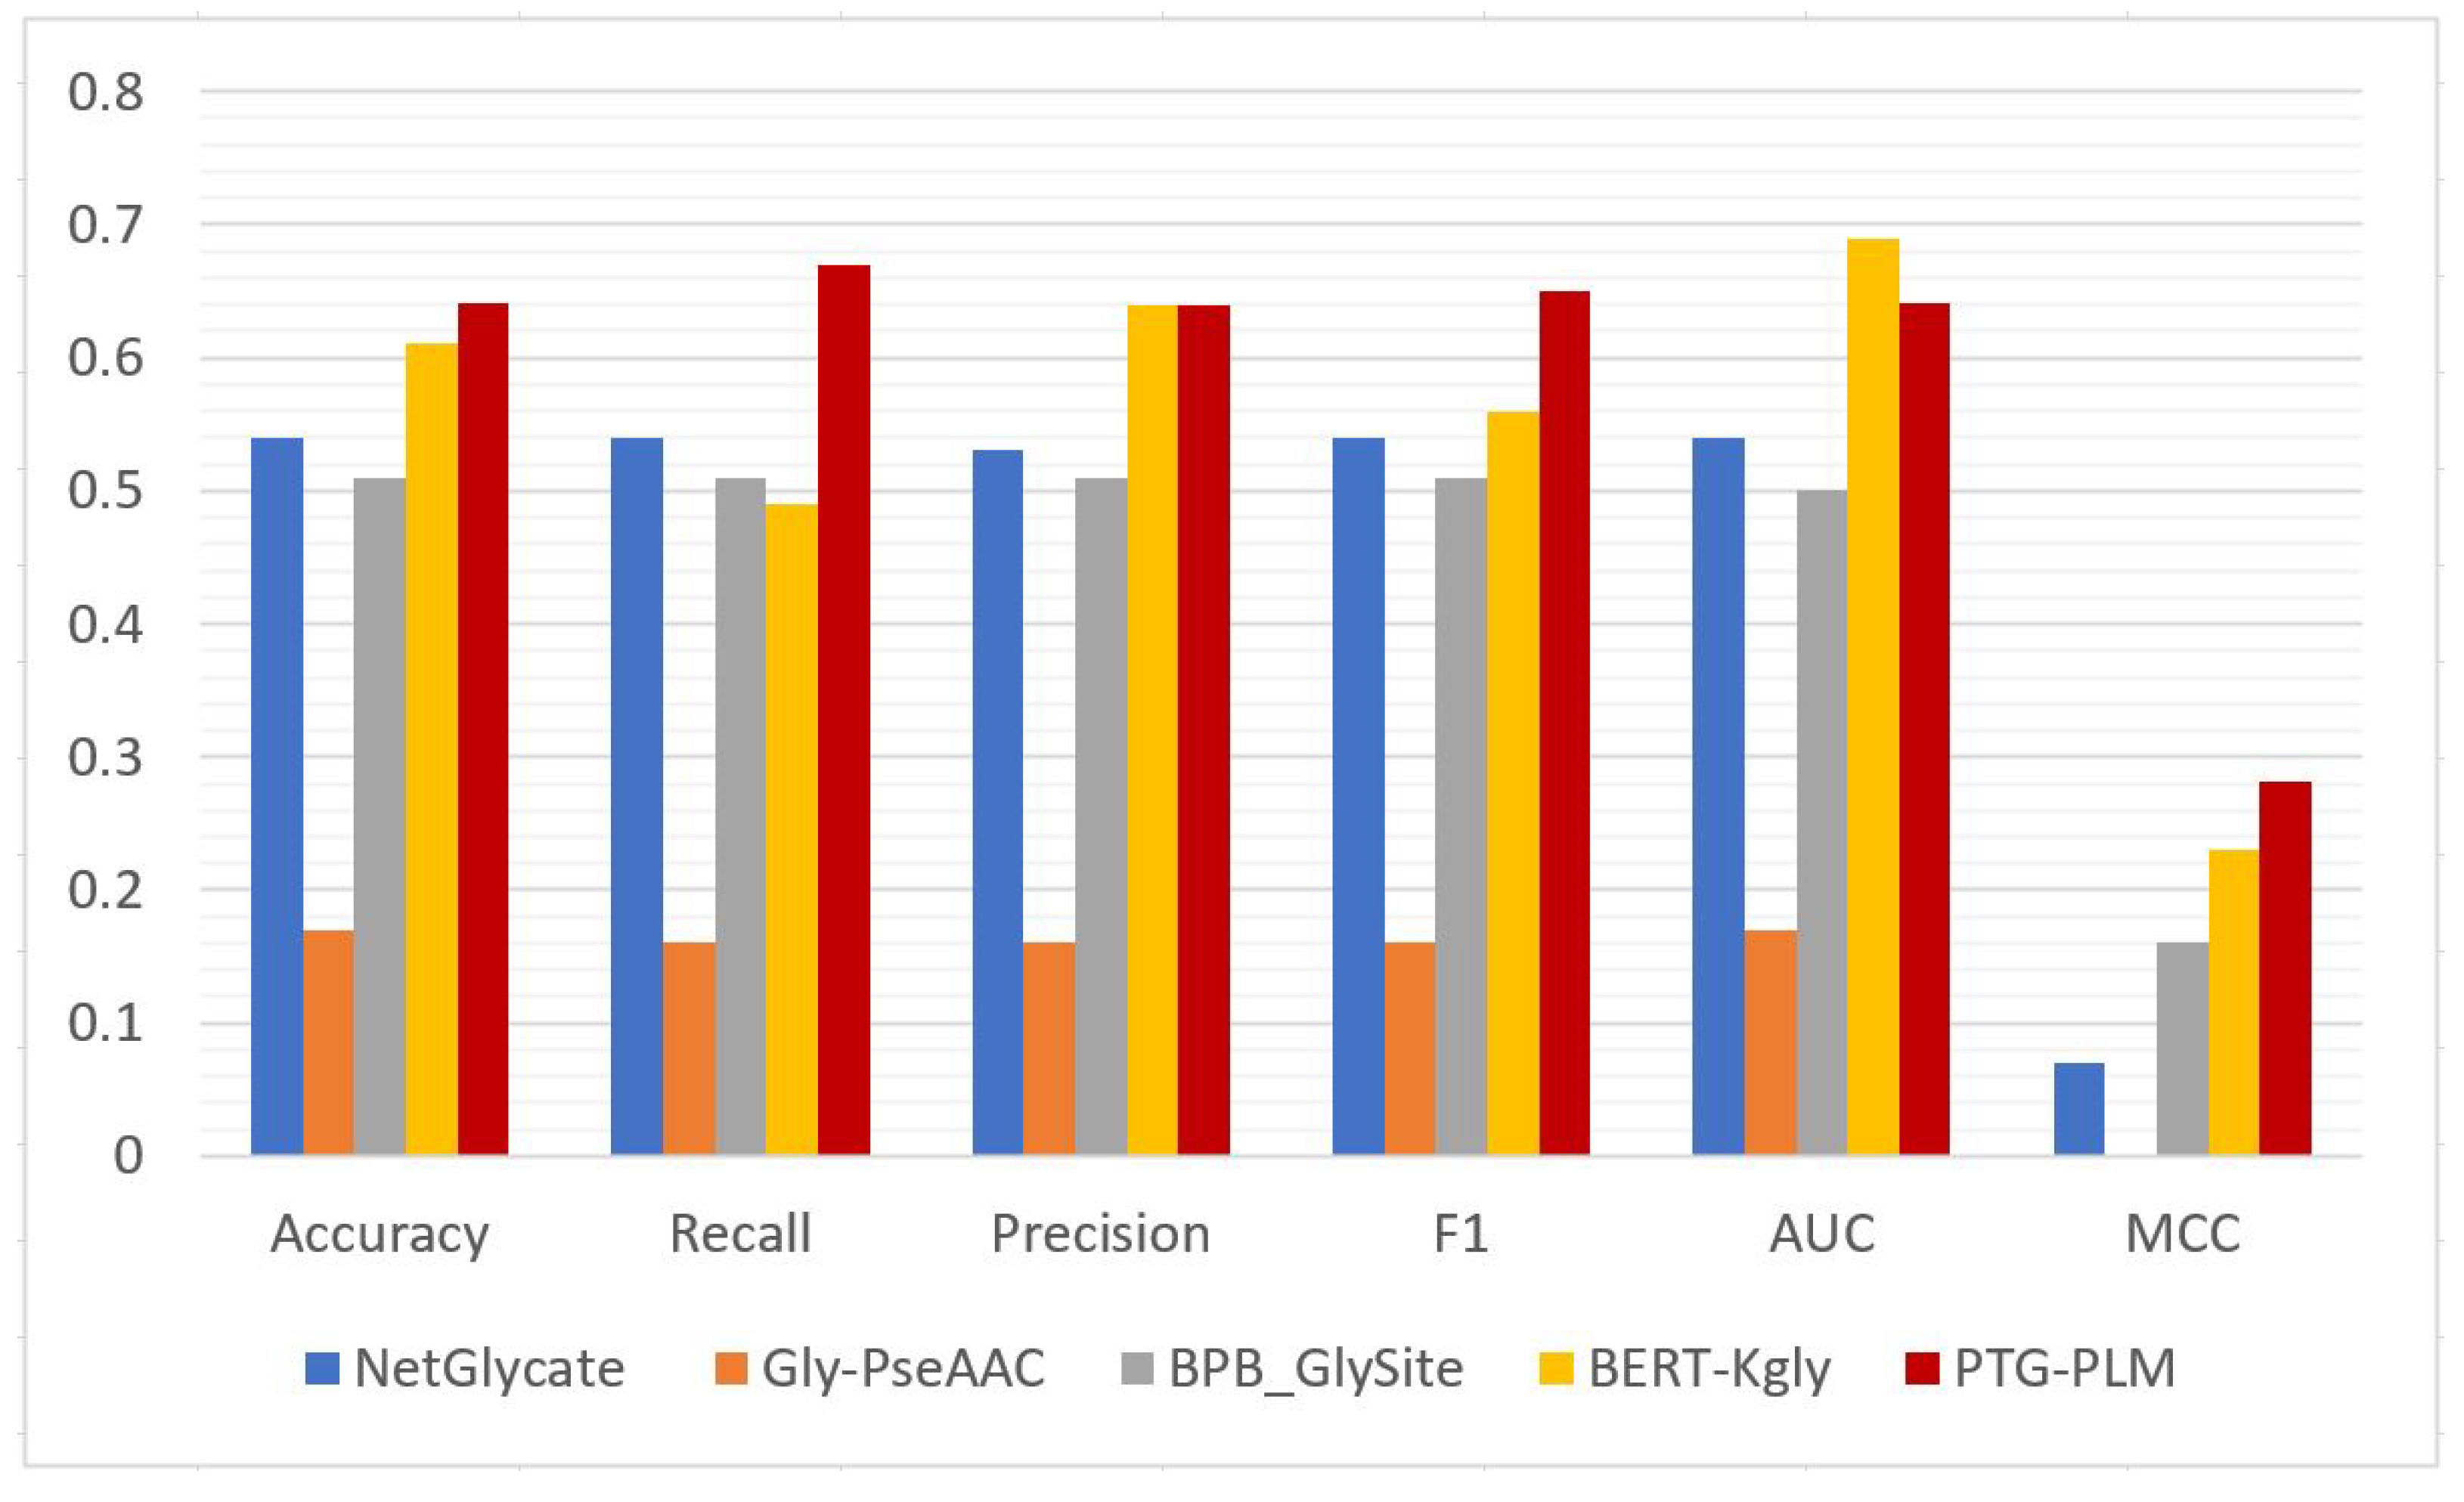
3.5. Comparing with Existing Tools for the Kgly Site Prediction
The prediction performance of PTG-PLM is compared with the existing tools for Kgly site prediction on the Kgly independent dataset which is obtained from PredGly and is BERT-Kgly. We compare PTG-PLM with four existing tools for Kgly site prediction including BERT-Kgly, NetGlycate, Gly-PseAAC, and BPB- GlySite on the same Kgly independent dataset. These tools are also described briefly in
Section 1.2. On the Kgly independent dataset, PTG-PLM based on embedding extracted from ProtBert-BFD PLM has the best performance as was shown in
Table 8. So, we compare the performance of PTG-PLM based on ProtBert-BFD embedding against the four Kgly existing tools in terms of accuracy, recall, precision, F1, AUC, and MCC as shown in
Table 10 and
Figure 8. It is shown that PTG-PLM outperforms the existing tools for Kgly site prediction with a 0.64 accuracy, 0.67 recall, 0.64 precision, 0.65 F1, and 0.28 MCC. Regarding the AUC metric, the BERT-Kgly is better than our model.
4. Discussion
In this work, we built a new model, PTG-PLM, for glycosylation/glycation site prediction based on features extracted from pre-trained protein language models (PLMs) and CNN deep learning. Generally, although CNN is ideal for image data while RNN is ideal for sequential data, there are successful studies that use CNN applied to sequence data and got great performance like [
23,
41,
42]. In addition, CNN is easier and faster in training when compared with RNN [
41]. Thus, we used CNN deep learning method to build our PTG-PLM model. Regarding feature extraction, According to the advances in protein language models (PLMs) that are based on state-of-the-art transformers, six pre-trained PLMs were used for extracting embedding features from protein–peptide sequences. These PLMs include ProtBERT-BFD, ProtBERT, ProtALBERT, ProtXLNet, ESM-1b, and TAPE. Experimental results indicate that PTG-PLM based on these PLMs embedding outperforms the existing tools for Ngly/Kgly site prediction except the PTG-PLM based on ProtXLNet embedding for Ngly site prediction that gave lower performance than some existing tools (
Table 9 and
Table 10). Generally, we can see that PTG-PLM models based on ESM-1b and ProtBERT-BFD have better performance than the models based on the other four PLMs and they were considered for comparison with the existing tools for Ngly and Kgly site prediction, respectively. We think this advantage comes from the fact that ESM-1b and ProtBERT-BFD are trained on large datasets and have larger layers (33 layers and 30 layers, respectively) when compared with the other four PLMs. Overall, we found that Ngly’s performance results with all models are far superior to Kgly’s performance results. That is because the Ngly sites typically occur in the pattern or motif N-X-S/T where X is any amino acid other than Proline (P), whereas Kgly sites lack any pattern or motifs.
Furthermore, four supervised learning methods (SVM, LR, RF, and XBG) were trained on the Ngly and Kgly datasets based on the same embedding extracted from the six PLMs. These machine learning methods were compared with PTG-PLM on the independent datasets for a fair evaluation of PTG-PLM. The performance was compared based on each PLM individually and the results showed that PTG-PLM has the best performance on the independent set (
Table 7 and
Table 8). Although the extracted features from the embedding of PLMs are large (
Table 2), some supervised learning methods achieved great performance as XBG based on ProtBert-BFD on the Ngly dataset and SVM based on ProtBert-BFD on the Kgly dataset. This indicates that features extracted using the embedding from PLMs transformer-based have a better performance than the features extracted by using the physicochemical, evolutionary, MSA, or structural-based properties for the peptide sequences. Likewise, the combination of PLMs embedding and CNN deep learning produces a model which outperformed the existing tools and the state-of-the-art machine learning methods on both Ngly and Kgly datasets.
Thus, PTG-PLM can be appropriate to predict the other types of PTMs. We can do that by configuring some important parameters of PTG-PLM like:
Fasta file that contains the protein sequences.
The number of residues that are surrounding the PTM residue from both sides (represented by w), in which the window size . For example, if then the window size .
PTM site residues represent the amino acid symbols that are related to the targeted PTM type. For example, for O-linked glycosylation site prediction, site = (’S’, ’T’); or for N-linked glycosylation site prediction, site = ’N’ and so on.
The used protein language model (PLM).
5. Conclusions
In this work, we proposed a new model (PTG-PLM) for Ngly and Kgly site prediction. Recently, NLP pre-trained language models have been transferred to process protein sequences. Our proposed, PTG-PLM, is based on CNN and embedding extracting using six protein language models (PLMs) including ProtBert-BFD, ProtBert, ProtAlbert, ProtXlnet, ESM-1b, and TAPE. The PLMs embedding extract information of evolutionary relationships and complicated interactions between tokens (amino acids) of peptide sequences without using the standard feature extraction methods such as MSA. The model was trained and evaluated on two Ngly and Kgly datasets that were used in previous studies. For evaluation, the model was evaluated using a five-fold cross-validation method based on every PLMs individually. The PTG-PLM models based on ESM-1b and ProtBert-BFD have resulted in better performance than the other used PLMs.
In addition, PTG-PLM was compared with SVM, LR, RF, and XBG machine learning methods. The performance results demonstrated that PTG-PLM outperforms the other models in terms of accuracy, AUC, and MCC. Moderately, XBG and SVM models based on ProtBert-BFD had a good performance. Moreover, seven existing tools for Ngly site prediction: PUStack-NGly, SPRINT-GLY, GlycoMine_PU, GlycoMine, GlycoEP, GlycoPP, and GPP were compared with PTG-PLM based on each used PLMs. Except with ProtXLNet PLM, PTG-PLM outperforms the existing tools for Ngly site prediction in terms of accuracy, recall, precision, F1, AUC, and MCC. Likewise, four existing tools for Kgly site prediction: BERT-Kgly, NetGlycate, Gly-PseAAC, and BPB- GlySite were compared with PTG-PLM based on each used PLMs. PTG-PLM also outperforms the existing tools for Kgly site prediction in terms of accuracy, recall, precision, F1, AUC, and MCC. The evaluation and comparison results indicate that the extracted features using PLMs are more informative than features extracted by the other feature extraction methods in the existing studies. In addition, CNN deep learning is better than the other machine learning methods in which the same features extracted by the six PLMs used in PTG-PLM that result in better performance. Thus, PTG-PLM can be used to predict the other types of PTMs by adjusting the PTG-PLM parameters.
Author Contributions
Conceptualization, A.A. and W.G.; methodology, A.A.; software, A.A.; validation, A.A. and W.G.; formal analysis, A.A.; writing—original draft preparation, A.A. and W.G.; writing—review and editing, W.G., M.R., M.G.V. and A.-b.M.S.; supervision, W.G., M.R., M.G.V. and A.-b.M.S. All authors have read and agreed to the published version of the manuscript.
Funding
This research received no external funding.
Institutional Review Board Statement
Not applicable.
Informed Consent Statement
Not applicable.
Data Availability Statement
Conflicts of Interest
The authors declare no conflict of interest.
Abbreviations
The following abbreviations are used in this manuscript:
| AUC | Area under the curve |
| CNNs | Convolutional Ceural Networks |
| CNN1D | 1-dimensional CNN |
| DL | Deep Learning |
| DNN | Deep Learning |
| FNN | Fully Connected Networks |
| Kgly | lysine glycation |
| LM | Language Model |
| LR | Logistic Regression |
| Ngly | N-linked glycosylation |
| MCC | Matthews Correlation Coefficient |
| ML | Machine learning |
| MSA | Multiple sequence alignments |
| NLP | Natural Language Processing |
| Ogly | O-linked glycosylation |
| PLM | Protein Language Model |
| PTMs | Post-Translational Modifications |
| ReLU | Rectified linear unit |
| RF | Random Forest |
| RNNs | Recurrent Neural Network |
| ROC | Receiver-operating characteristic |
| SVM | Support Vector Machine |
| XBG | XGBoost |
References
- Ju, Z.; Sun, J.; Li, Y.; Wang, L. Predicting lysine glycation sites using bi-profile Bayes feature extraction. Comput. Biol. Chem. 2017, 71, 98–103. [Google Scholar] [CrossRef] [PubMed]
- Hu, M.; Lan, Y.; Lu, A.; Ma, X.; Zhang, L. Glycan-based biomarkers for diagnosis of cancers and other diseases: Past, present, and future. In Progress in Molecular Biology and Translational Science; Elsevier: Amsterdam, The Netherlands, 2019; Volume 162, pp. 1–24. [Google Scholar]
- Regan, P.; McClean, P.L.; Smyth, T.; Doherty, M. Early Stage Glycosylation Biomarkers in Alzheimer’s Disease. Medicines 2019, 6, 92. [Google Scholar] [CrossRef]
- Watanabe, Y.; Berndsen, Z.T.; Raghwani, J.; Seabright, G.E.; Allen, J.D.; Pybus, O.G.; McLellan, J.S.; Wilson, I.A.; Bowden, T.A.; Ward, A.B.; et al. Vulnerabilities in coronavirus glycan shields despite extensive glycosylation. Nat. Commun. 2020, 11, 1–10. [Google Scholar]
- Islam, M.M.; Saha, S.; Rahman, M.M.; Shatabda, S.; Farid, D.M.; Dehzangi, A. iProtGly-SS: Identifying protein glycation sites using sequence and structure based features. Proteins Struct. Funct. Bioinform. 2018, 86, 777–789. [Google Scholar] [CrossRef]
- Chen, J.; Yang, R.; Zhang, C.; Zhang, L.; Zhang, Q. DeepGly: A deep learning framework with recurrent and convolutional neural networks to identify protein glycation sites from imbalanced data. IEEE Access 2019, 7, 142368–142378. [Google Scholar] [CrossRef]
- Chauhan, J.S.; Rao, A.; Raghava, G.P. In silico platform for prediction of N-, O-and C-glycosites in eukaryotic protein sequences. PloS ONE 2013, 8, e67008. [Google Scholar]
- Yu, J.; Shi, S.; Zhang, F.; Chen, G.; Cao, M. PredGly: Predicting lysine glycation sites for Homo sapiens based on XGboost feature optimization. Bioinformatics 2019, 35, 2749–2756. [Google Scholar] [CrossRef]
- Reddy, H.M.; Sharma, A.; Dehzangi, A.; Shigemizu, D.; Chandra, A.A.; Tsunoda, T. GlyStruct: Glycation prediction using structural properties of amino acid residues. BMC Bioinform. 2019, 19, 55–64. [Google Scholar] [CrossRef]
- Li, F.; Zhang, Y.; Purcell, A.W.; Webb, G.I.; Chou, K.C.; Lithgow, T.; Li, C.; Song, J. Positive-unlabelled learning of glycosylation sites in the human proteome. Bmc Bioinform. 2019, 20, 112. [Google Scholar] [CrossRef]
- Hamby, S.E.; Hirst, J.D. Prediction of glycosylation sites using random forests. Bmc Bioinform. 2008, 9, 500. [Google Scholar] [CrossRef]
- Chauhan, J.S.; Bhat, A.H.; Raghava, G.P.; Rao, A. GlycoPP: A webserver for prediction of N-and O-glycosites in prokaryotic protein sequences. PloS ONE 2012, 7, e40155. [Google Scholar] [CrossRef] [PubMed]
- Li, F.; Li, C.; Wang, M.; Webb, G.I.; Zhang, Y.; Whisstock, J.C.; Song, J. GlycoMine: A machine learning-based approach for predicting N-, C-and O-linked glycosylation in the human proteome. Bioinformatics 2015, 31, 1411–1419. [Google Scholar] [CrossRef] [PubMed]
- Li, F.; Li, C.; Revote, J.; Zhang, Y.; Webb, G.I.; Li, J.; Song, J.; Lithgow, T. GlycoMine struct: A new bioinformatics tool for highly accurate mapping of the human N-linked and O-linked glycoproteomes by incorporating structural features. Sci. Rep. 2016, 6, 1–16. [Google Scholar]
- Taherzadeh, G.; Dehzangi, A.; Golchin, M.; Zhou, Y.; Campbell, M.P. SPRINT-Gly: Predicting N-and O-linked glycosylation sites of human and mouse proteins by using sequence and predicted structural properties. Bioinformatics 2019, 35, 4140–4146. [Google Scholar] [CrossRef] [PubMed]
- Pitti, T.; Chen, C.T.; Lin, H.N.; Choong, W.K.; Hsu, W.L.; Sung, T.Y. N-GlyDE: A two-stage N-linked glycosylation site prediction incorporating gapped dipeptides and pattern-based encoding. Sci. Rep. 2019, 9, 1–11. [Google Scholar] [CrossRef]
- Chien, C.H.; Chang, C.C.; Lin, S.H.; Chen, C.W.; Chang, Z.H.; Chu, Y.W. N-GlycoGo: Predicting Protein N-Glycosylation Sites on Imbalanced Data Sets by Using Heterogeneous and Comprehensive Strategy. IEEE Access 2020, 8, 165944–165950. [Google Scholar] [CrossRef]
- Alkuhlani, A.; Gad, W.; Roushdy, M.; Salem, A.B.M. PUStackNGly: Positive-Unlabeled and Stacking Learning for N-Linked Glycosylation Site Prediction. IEEE Access 2022, 10, 12702–12713. [Google Scholar] [CrossRef]
- Johansen, M.B.; Kiemer, L.; Brunak, S. Analysis and prediction of mammalian protein glycation. Glycobiology 2006, 16, 844–853. [Google Scholar] [CrossRef]
- Liu, Y.; Gu, W.; Zhang, W.; Wang, J. Predict and analyze protein glycation sites with the mRMR and IFS methods. Biomed Res. Int. 2015, 2015, 561547. [Google Scholar] [CrossRef]
- Xu, Y.; Li, L.; Ding, J.; Wu, L.Y.; Mai, G.; Zhou, F. Gly-PseAAC: Identifying protein lysine glycation through sequences. Gene 2017, 602, 1–7. [Google Scholar] [CrossRef]
- Zhao, X.; Zhao, X.; Bao, L.; Zhang, Y.; Dai, J.; Yin, M. Glypre: In silico prediction of protein glycation sites by fusing multiple features and support vector machine. Molecules 2017, 22, 1891. [Google Scholar] [CrossRef] [PubMed]
- Liu, Y.; Liu, Y.; Wang, G.; Cheng, Y.; Bi, S.; Zhu, X. BERT-Kgly: A Bidirectional Encoder Representations from Transformers (BERT)-based Model for Predicting Lysine Glycation Site for Homo sapiens. Front. Bioinform. 2022, 12. [Google Scholar] [CrossRef]
- Alkuhlani, A.; Gad, W.; Roushdy, M.; Salem, A.B.M. Intelligent Techniques Analysis for Glycosylation Site Prediction. Curr. Bioinform. 2021, 16, 774–788. [Google Scholar] [CrossRef]
- Alkuhlani, A.; Gad, W.; Roushdy, M.; Salem, A.B.M. Artificial Intelligence for Glycation Site Prediction. IEICE Proc. Ser. 2021, 64. [Google Scholar] [CrossRef]
- Marquet, C.; Heinzinger, M.; Olenyi, T.; Dallago, C.; Erckert, K.; Bernhofer, M.; Nechaev, D.; Rost, B. Embeddings from protein language models predict conservation and variant effects. Hum. Genet. 2021, 1–19. [Google Scholar] [CrossRef]
- Thumuluri, V.; Martiny, H.M.; Almagro Armenteros, J.J.; Salomon, J.; Nielsen, H.; Johansen, A.R. NetSolP: Predicting protein solubility in Escherichia coli using language models. Bioinformatics 2022, 38, 941–946. [Google Scholar] [CrossRef]
- Bepler, T.; Berger, B. Learning the protein language: Evolution, structure, and function. Cell Syst. 2021, 12, 654–669. [Google Scholar] [CrossRef]
- Ofer, D.; Brandes, N.; Linial, M. The language of proteins: NLP, machine learning & protein sequences. Comput. Struct. Biotechnol. J. 2021, 19, 1750–1758. [Google Scholar]
- Kiranyaz, S.; Avci, O.; Abdeljaber, O.; Ince, T.; Gabbouj, M.; Inman, D.J. 1D convolutional neural networks and applications: A survey. Mech. Syst. Signal Process. 2021, 151, 107398. [Google Scholar] [CrossRef]
- Lan, K.; Wang, D.t.; Fong, S.; Liu, L.s.; Wong, K.K.; Dey, N. A survey of data mining and deep learning in bioinformatics. J. Med. Syst. 2018, 42, 1–20. [Google Scholar] [CrossRef]
- Schuster, M.; Paliwal, K.K. Bidirectional recurrent neural networks. IEEE Trans. Signal Process. 1997, 45, 2673–2681. [Google Scholar] [CrossRef]
- LeCun, Y.; Bottou, L.; Bengio, Y.; Haffner, P. Gradient-based learning applied to document recognition. Proc. IEEE 1998, 86, 2278–2324. [Google Scholar] [CrossRef]
- Alsayadi, H.; Abdelhamid, A.; Hegazy, I.; Taha, Z. Data Augmentation for Arabic Speech Recognition Based on End-to-End Deep Learning. Int. J. Intell. Comput. Inf. Sci. 2021, 21, 50–64. [Google Scholar] [CrossRef]
- Chen, X.; Li, C.; Bernards, M.T.; Shi, Y.; Shao, Q.; He, Y. Sequence-based peptide identification, generation, and property prediction with deep learning: A review. Mol. Syst. Des. Eng. 2021, 6, 406–428. [Google Scholar] [CrossRef]
- Mostavi, M.; Chiu, Y.C.; Huang, Y.; Chen, Y. Convolutional neural network models for cancer type prediction based on gene expression. BMC Med. Genom. 2020, 13, 1–13. [Google Scholar] [CrossRef]
- Wang, Y.; Li, Z.; Zhang, Y.; Ma, Y.; Huang, Q.; Chen, X.; Dai, Z.; Zou, X. Performance improvement for a 2D convolutional neural network by using SSC encoding on protein–protein interaction tasks. BMC Bioinform. 2021, 22, 1–16. [Google Scholar] [CrossRef]
- Littmann, M.; Heinzinger, M.; Dallago, C.; Weissenow, K.; Rost, B. Protein embeddings and deep learning predict binding residues for various ligand classes. Sci. Rep. 2021, 11, 1–15. [Google Scholar] [CrossRef]
- Cheng, J.; Liu, Y.; Ma, Y. Protein secondary structure prediction based on integration of CNN and LSTM model. J. Vis. Commun. Image Represent 2020, 71, 102844. [Google Scholar] [CrossRef]
- Luo, F.; Wang, M.; Liu, Y.; Zhao, X.M.; Li, A. DeepPhos: Prediction of protein phosphorylation sites with deep learning. Bioinformatics 2019, 35, 2766–2773. [Google Scholar] [CrossRef]
- Wang, D.; Zeng, S.; Xu, C.; Qiu, W.; Liang, Y.; Joshi, T.; Xu, D. MusiteDeep: A deep-learning framework for general and kinase-specific phosphorylation site prediction. Bioinformatics 2017, 33, 3909–3916. [Google Scholar] [CrossRef]
- Deng, Y.; Fu, Y.; Zhang, H.; Liu, X.; Liu, Z. Protein post-translational modification site prediction using deep learning. Procedia Comput. Sci. 2022, 198, 480–485. [Google Scholar] [CrossRef]
- Huang, G.; Shen, Q.; Zhang, G.; Wang, P.; Yu, Z.G. LSTMCNNsucc: A Bidirectional LSTM and CNN-Based Deep Learning Method for Predicting Lysine Succinylation Sites. Biomed Res. Int. 2021, 2021, 9923112. [Google Scholar] [CrossRef] [PubMed]
- Consortium, U. UniProt: A hub for protein information. Nucleic Acids Res. 2015, 43, D204–D212. [Google Scholar] [CrossRef] [PubMed]
- Fu, L.; Niu, B.; Zhu, Z.; Wu, S.; Li, W. CD-HIT: Accelerated for clustering the next-generation sequencing data. Bioinformatics 2012, 28, 3150–3152. [Google Scholar] [CrossRef]
- Elnaggar, A.; Heinzinger, M.; Dallago, C.; Rihawi, G.; Wang, Y.; Jones, L.; Gibbs, T.; Feher, T.; Angerer, C.; Steinegger, M.; et al. ProtTrans: Towards cracking the language of Life’s code through self-supervised deep learning and high performance computing. arXiv 2020, arXiv:2007.06225. [Google Scholar] [CrossRef]
- Rives, A.; Meier, J.; Sercu, T.; Goyal, S.; Lin, Z.; Liu, J.; Guo, D.; Ott, M.; Zitnick, C.L.; Ma, J.; et al. Biological structure and function emerge from scaling unsupervised learning to 250 million protein sequences. Proc. Natl. Acad. Sci. USA 2021, 118, e2016239118. [Google Scholar] [CrossRef]
- Rao, R.; Bhattacharya, N.; Thomas, N.; Duan, Y.; Chen, P.; Canny, J.; Abbeel, P.; Song, Y. Evaluating protein transfer learning with TAPE. Adv. Neural Inf. Process. Syst. 2019, 32, 9689–9701. [Google Scholar]
- Devlin, J.; Chang, M.W.; Lee, K.; Toutanova, K. Bert: Pre-training of deep bidirectional transformers for language understanding. arXiv 2018, arXiv:1810.04805. [Google Scholar]
- Lan, Z.; Chen, M.; Goodman, S.; Gimpel, K.; Sharma, P.; Soricut, R. Albert: A lite bert for self-supervised learning of language representations. arXiv 2019, arXiv:1909.11942. [Google Scholar]
- Yang, Z.; Dai, Z.; Yang, Y.; Carbonell, J.; Salakhutdinov, R.R.; Le, Q.V. Xlnet: Generalized autoregressive pretraining for language understanding. Adv. Neural Inf. Process. Syst. 2019, 32. [Google Scholar] [CrossRef]
- Steinegger, M.; Söding, J. Clustering huge protein sequence sets in linear time. Nat. Commun. 2018, 9, 1–8. [Google Scholar] [CrossRef]
- Suzek, B.E.; Wang, Y.; Huang, H.; McGarvey, P.B.; Wu, C.H.; Consortium, U. UniRef clusters: A comprehensive and scalable alternative for improving sequence similarity searches. Bioinformatics 2015, 31, 926–932. [Google Scholar] [CrossRef] [PubMed]
- Finn, R.D.; Bateman, A.; Clements, J.; Coggill, P.; Eberhardt, R.Y.; Eddy, S.R.; Heger, A.; Hetherington, K.; Holm, L.; Mistry, J.; et al. Pfam: The protein families database. Nucleic Acids Res. 2014, 42, D222–D230. [Google Scholar] [CrossRef] [PubMed]
- Patil, A.; Rane, M. Convolutional neural networks: An overview and its applications in pattern recognition. In Proceedings of the International Conference on Information and Communication Technology for Intelligent Systems, Ahmedabad, India, 15–16 May 2020; Springer: Berlin/Heidelberg, Germany, 2020; pp. 21–30. [Google Scholar]
- Pedregosa, F.; Varoquaux, G.; Gramfort, A.; Michel, V.; Thirion, B.; Grisel, O.; Blondel, M.; Prettenhofer, P.; Weiss, R.; Dubourg, V.; et al. Scikit-learn: Machine learning in Python. J. Mach. Learn. Res. 2011, 12, 2825–2830. [Google Scholar]
- Chen, T.; Guestrin, C. Xgboost: A scalable tree boosting system. In Proceedings of the 22nd ACM SIGKDD International Conference on Knowledge Discovery and Data Mining, San Francisco, CA, USA, 13–17 August 2016; pp. 785–794. [Google Scholar]
- Cortes, C.; Vapnik, V. Support-vector networks. Mach. Learn. 1995, 20, 273–297. [Google Scholar] [CrossRef]
- Tolles, J.; Meurer, W.J. Logistic regression: Relating patient characteristics to outcomes. JAMA 2016, 316, 533–534. [Google Scholar] [CrossRef]
- Breiman, L. Random forests. Mach. Learn. 2001, 45, 5–32. [Google Scholar] [CrossRef] [Green Version]
Figure 1.
The general flowchart of PTG-PLM.
Figure 1.
The general flowchart of PTG-PLM.
Figure 2.
Window size of sample sequence. The size of the window is in which w residues surrounding the PTM site from both left and right sides.
Figure 2.
Window size of sample sequence. The size of the window is in which w residues surrounding the PTM site from both left and right sides.
Figure 3.
Cross-validation performance results of PTG-PLM on the Ngly training dataset based on the six PLMs.
Figure 3.
Cross-validation performance results of PTG-PLM on the Ngly training dataset based on the six PLMs.
Figure 4.
Cross-validation performance results of PTG-PLM on the Kgly training dataset based on the six PLMs.
Figure 4.
Cross-validation performance results of PTG-PLM on the Kgly training dataset based on the six PLMs.
Figure 5.
Comparison of performance between the best PTG-PLM model (based on ESM-1b) and best-supervised learning model (XBG based on ProtBert-BFD) on the Ngly independent dataset.
Figure 5.
Comparison of performance between the best PTG-PLM model (based on ESM-1b) and best-supervised learning model (XBG based on ProtBert-BFD) on the Ngly independent dataset.
Figure 6.
Comparison of performance between the best PTG-PLM model (based on ProtBert-BFD) and the best-supervised learning model (SVM based on ProtBert-BFD) on the Kgly independent dataset.
Figure 6.
Comparison of performance between the best PTG-PLM model (based on ProtBert-BFD) and the best-supervised learning model (SVM based on ProtBert-BFD) on the Kgly independent dataset.
Figure 7.
Chart for the performance of PTG-PLM and the existing tools for Ngly site prediction.
Figure 7.
Chart for the performance of PTG-PLM and the existing tools for Ngly site prediction.
Figure 8.
Chart for the performance of PTG-PLM and the existing tools for Kgly site prediction.
Figure 8.
Chart for the performance of PTG-PLM and the existing tools for Kgly site prediction.
Table 1.
Key differences between the six used protein language models.
Table 1.
Key differences between the six used protein language models.
| PLM | Dataset | Pretrained LM | # of Layers | Hidden Layers Size | # of Attention Heads | # of Parameters |
|---|
| ProtBERT-BFD [46] | BFD | BERT | 30 | 1024 | 16 | 420 M |
| ProtBERT [46] | UniRef100 | BERT | 30 | 1024 | 16 | 420 M |
| ProtALBERT [46] | UniRef100 | Albert | 12 | 4096 | 64 | 224 M |
| ProtXLNet [46] | UniRef100 | XLNet | 30 | 1024 | 16 | 409 M |
| ESM-1b [47] | UniRef50 | BERT | 33 | 1280 | 20 | 650 M |
| TAPE [48] | Pfam | BERT | 12 | 768 | 12 | 92 M |
Table 2.
The size of embedding features that are extracted for a sample of both Ngly and Kgly datasets based on each used PLM.
Table 2.
The size of embedding features that are extracted for a sample of both Ngly and Kgly datasets based on each used PLM.
| PLM | # of Features in Ngly Dataset | # of Features in Kgly Dataset |
|---|
| ProtBERT-BFD | 25,600 | 31,744 |
| ProtBERT | 25,600 | 31,744 |
| ProtALBERT | 102,400 | 126,976 |
| ProtXLNet | 25,600 | 31,744 |
| ESM-1b | 32,000 | 39,680 |
| TAPE | 19,200 | 23,808 |
Table 3.
The optimal hyperparameters for the CNN model are based on each PLMs using both Ngly and Kgly datasets.
Table 3.
The optimal hyperparameters for the CNN model are based on each PLMs using both Ngly and Kgly datasets.
| Dataset | PLM | CNN1D Filters | CNN1D Kernel | FNN1 Layers | FNN2 Layers | Learning Rate | Batch Size |
|---|
| Ngly | ProtBERT-BFD | 256 | 3 | 128 | 32 | 0.0001 | 64 |
| ProtBERT | 256 | 5 | 128 | 32 | 0.0001 | 64 |
| ProtALBERT | 128 | 3 | 64 | 32 | 0.0001 | 64 |
| ProtXLNet | 512 | 3 | 256 | 32 | 0.001 | 8 |
| ESM-1b | 128 | 3 | 64 | 16 | 0.00001 | 64 |
| TAPE | 128 | 3 | 64 | 32 | 0.00001 | 64 |
| Kgly | ProtBERT-BFD | 256 | 10 | 128 | 64 | 0.0001 | 64 |
| ProtBERT | 128 | 8 | 64 | 32 | 0.0001 | 64 |
| ProtALBERT | 128 | 8 | 64 | 32 | 0.001 | 64 |
| ProtXLNet | 512 | 8 | 256 | 32 | 0.0001 | 64 |
| ESM-1b | 256 | 8 | 128 | 32 | 0.00001 | 64 |
| TAPE | 256 | 8 | 128 | 16 | 0.0001 | 64 |
Table 4.
Hyperparameters setting for the used machine learning classifiers and the used value for each parameter.
Table 4.
Hyperparameters setting for the used machine learning classifiers and the used value for each parameter.
| Classifier | Parameter | Range of Values | Used Value |
|---|
| SVM | kernal | linear, poly, rbf, sigmoid | rbf |
| C | 1 × 10 ,1, …, 1 × 10 | 1 |
| gama | scale, auto | scale |
| LR | penalty | L1, L2 | L2 |
| RF | n_estimators | 100 to 1000 | 100 |
| XGB | booster | gbtree, gblinear | gbtree |
| learning_rate | 0.01, 0.02, …, 0.1 | 0.1 |
| max_depth | 2 to 10 | 5 |
| min_child_weight | 1 to 9 | 5 |
| subsample | 0.2, 0.3, …, 0.9 | 0.9 |
Table 5.
Cross-validation performance results of CNN model based on the six PLMs on the Ngly dataset. The results of the five-fold cross-validation on the training dataset are represented by the average ± standard deviation for all performance measures.
Table 5.
Cross-validation performance results of CNN model based on the six PLMs on the Ngly dataset. The results of the five-fold cross-validation on the training dataset are represented by the average ± standard deviation for all performance measures.
| PLM | Accuracy | Recall | Precision | F1 | AUC | MCC |
|---|
| ProtBert-BFD | 0.922 ± 0.008 | 0.987 ± 0.005 | 0.873 ± 0.012 | 0.926 ± 0.007 | 0.922 ± 0.009 | 0.85 ± 0.016 |
| ProtBert | 0.918 ± 0.01 | 0.982 ± 0.01 | 0.871 ± 0.02 | 0.923 ± 0.01 | 0.918 ± 0.01 | 0.843 ± 0.018 |
| ProtAlbert | 0.92 ± 0.009 | 0.988 ± 0.005 | 0.87 ± 0.012 | 0.925 ± 0.009 | 0.92 ± 0.009 | 0.848 ± 0.016 |
| ProtXLNet | 0.875 ± 0.016 | 0.911 ± 0.02 | 0.85 ± 0.018 | 0.879 ± 0.017 | 0.875 ± 0.016 | 0.752 ± 0.033 |
| ESM-1b | 0.922 ± 0.01 | 0.984 ± 0.009 | 0.875 ± 0.018 | 0.927 ± 0.011 | 0.922 ± 0.008 | 0.851 ± 0.017 |
| TAPE | 0.916 ± 0.01 | 0.967 ± 0.013 | 0.877 ± 0.013 | 0.916 ± 0.01 | 0.916 ± 0.011 | 0.836 ± 0.02 |
Table 6.
Cross-validation performance of CNN model based on the six PLMs on the Kgly dataset. The results of the five-fold cross-validation on the training dataset are represented by the average ± standard deviation for all performance measures.
Table 6.
Cross-validation performance of CNN model based on the six PLMs on the Kgly dataset. The results of the five-fold cross-validation on the training dataset are represented by the average ± standard deviation for all performance measures.
| PLM | Accuracy | Recall | Precision | F1 | AUC | MCC |
|---|
| ProtBert-BFD | 0.599 ± 0.01 | 0.612 ± 0.04 | 0.594 ± 0.017 | 0.603 ± 0.02 | 0.599 ± 0.01 | 0.198 ± 0.014 |
| ProtBert | 0.597 ± 0.014 | 0.64 ± 0.041 | 0.588 ± 0.017 | 0.613 ± 0.017 | 0.59 ± 0.015 | 0.196 ± 0.031 |
| ProtAlbert | 0.593 ± 0.012 | 0.584 ± 0.05 | 0.614 ± 0.026 | 0.599 ± 0.05 | 0.591 ± 0.012 | 0.186 ± 0.024 |
| ProtXLNet | 0.568 ± 0.01 | 0.576 ± 0.05 | 0.57 ± 0.021 | 0.573 ± 0.06 | 0.568 ± 0.008 | 0.144 ± 0.02 |
| ESM-1b | 0.599 ± 0.009 | 0.563 ± 0.035 | 0.604 ± 0.009 | 0.583 ± 0.018 | 0.599 ± 0.008 | 0.199 ± 0.017 |
| TAPE | 0.595 ± 0.009 | 0.572 ± 0.043 | 0.598 ± 0.021 | 0.594 ± 0.03 | 0.595 ± 0.007 | 0.192 ± 0.014 |
Table 7.
Performance of PTG-PLM compared with four supervised learning methods on the Ngly independent dataset based on the six PLMs.
Table 7.
Performance of PTG-PLM compared with four supervised learning methods on the Ngly independent dataset based on the six PLMs.
| PLM -> | ProtBert-BFD | ProtBert | ProtAlbert | ProtXLNet | ESM-1b | TAPE |
|---|
Metric\
Model
| Accuracy | AUC | MCC | Accuracy | AUC | MCC | Accuracy | AUC | MCC | Accuracy | AUC | MCC | Accuracy | AUC | MCC | Accuracy | AUC | MCC |
|---|
| SVM | 0.947 | 0.967 | 0.861 | 0.943 | 0.964 | 0.851 | 0.943 | 0.964 | 0.851 | 0.877 | 0.858 | 0.66 | 0.947 | 0.967 | 0.861 | 0.943 | 0.964 | 0.851 |
| LR | 0.947 | 0.959 | 0.856 | 0.947 | 0.943 | 0.847 | 0.947 | 0.943 | 0.847 | 0.872 | 0.847 | 0.643 | 0.934 | 0.926 | 0.81 | 0.934 | 0.926 | 0.81 |
| RF | 0.947 | 0.943 | 0.847 | 0.943 | 0.94 | 0.836 | 0.943 | 0.956 | 0.845 | 0.89 | 0.874 | 0.694 | 0.952 | 0.97 | 0.871 | 0.947 | 0.967 | 0.861 |
| XGB | 0.952 | 0.97 | 0.871 | 0.938 | 0.945 | 0.83 | 0.947 | 0.967 | 0.861 | 0.903 | 0.923 | 0.756 | 0.947 | 0.967 | 0.861 | 0.943 | 0.964 | 0.851 |
| PTG-PLM | 0.956 | 0.972 | 0.881 | 0.956 | 0.972 | 0.881 | 0.952 | 0.97 | 0.871 | 0.938 | 0.929 | 0.821 | 0.965 | 0.978 | 0.902 | 0.956 | 0.972 | 0.881 |
Table 8.
Performance of PTG-PLM compared with four supervised learning methods on the Kgly independent dataset based on the six PLMs.
Table 8.
Performance of PTG-PLM compared with four supervised learning methods on the Kgly independent dataset based on the six PLMs.
| PLM -> | ProtBert-BFD | ProtBert | ProtAlbert | ProtXLNet | ESM-1b | TAPE |
|---|
Metric\
Model | Accuracy | AUC | MCC | Accuracy | AUC | MCC | Accuracy | AUC | MCC | Accuracy | AUC | MCC | Accuracy | AUC | MCC | Accuracy | AUC | MCC |
|---|
| SVM | 0.631 | 0.631 | 0.261 | 0.596 | 0.595 | 0.191 | 0.585 | 0.586 | 0.171 | 0.573 | 0.573 | 0.146 | 0.608 | 0.608 | 0.219 | 0.583 | 0.583 | 0.166 |
| LR | 0.613 | 0.613 | 0.226 | 0.558 | 0.558 | 0.116 | 0.606 | 0.606 | 0.211 | 0.565 | 0.565 | 0.131 | 0.573 | 0.573 | 0.147 | 0.54 | 0.541 | 0.082 |
| RF | 0.563 | 0.563 | 0.127 | 0.55 | 0.55 | 0.101 | 0.533 | 0.533 | 0.066 | 0.52 | 0.52 | 0.041 | 0.523 | 0.523 | 0.046 | 0.578 | 0.578 | 0.156 |
| XGB | 0.591 | 0.59 | 0.181 | 0.623 | 0.623 | 0.246 | 0.543 | 0.541 | 0.099 | 0.553 | 0.553 | 0.106 | 0.563 | 0.563 | 0.126 | 0.601 | 0.601 | 0.201 |
| PTG-PLM | 0.641 | 0.641 | 0.282 | 0.633 | 0.633 | 0.268 | 0.628 | 0.628 | 0.258 | 0.621 | 0.621 | 0.241 | 0.636 | 0.636 | 0.272 | 0.626 | 0.626 | 0.251 |
Table 9.
Comparison of performance of PTG-PLM against the existing tool for Ngly site prediction.
Table 9.
Comparison of performance of PTG-PLM against the existing tool for Ngly site prediction.
| Metric | Accuracy | Recall | Precision | F1 | AUC | MCC |
|---|
| Tool |
|---|
| GPP [11] | 0.7333 | 1 | 0.434 | 0.605 | 0.8324 | 0.5371 |
| GlycoPP [12] | 0.6578 | 0.891 | 0.363 | 0.516 | 0.7445 | 0.3945 |
| GlycoEP [7] | 0.7956 | 0.957 | 0.5 | 0.657 | 0.8554 | 0.5874 |
| GlycoMine [13] | 0.4489 | 0.4565 | 0.175 | 0.253 | 0.4517 | −0.0781 |
| GlycoMine_PU [10] | 0.9378 | 1 | 0.767 | 0.868 | 0.9609 | 0.8407 |
| SPRINT-Gly [15] | 0.9422 | 1 | 0.78 | 0.877 | 0.9637 | 0.8503 |
| PUStackNGly [18] | 0.9511 | 1 | 0.807 | 0.893 | 0.9693 | 0.8703 |
| PTG-PLM | 0.965 | 1 | 0.852 | 0.920 | 0.978 | 0.902 |
Table 10.
Comparison of the performance of PTG-PLM against the existing tool for Kgly site prediction.
Table 10.
Comparison of the performance of PTG-PLM against the existing tool for Kgly site prediction.
| Metric | Accuracy | Recall | Precision | F1 | AUC | MCC |
|---|
| Tool |
|---|
| NetGlycate [19] | 0.54 | 0.54 | 0.53 | 0.54 | 0.54 | 0.07 |
| Gly-PseAAC [21] | 0.17 | 0.16 | 0.16 | 0.16 | 0.17 | 0 |
| BPB_GlySite [1] | 0.51 | 0.51 | 0.51 | 0.51 | 0.5 | 0.16 |
| BERT-Kgly [23] | 0.61 | 0.49 | 0.64 | 0.56 | 0.69 | 0.23 |
| PTG-PLM | 0.64 | 0.67 | 0.64 | 0.65 | 0.64 | 0.28 |
| Publisher’s Note: MDPI stays neutral with regard to jurisdictional claims in published maps and institutional affiliations. |
© 2022 by the authors. Licensee MDPI, Basel, Switzerland. This article is an open access article distributed under the terms and conditions of the Creative Commons Attribution (CC BY) license (https://creativecommons.org/licenses/by/4.0/).

 ,
, 


