Article

A Recommendation Model for Selling Rules in the Telecom Retail Industry

1
Department of Marketing and Distribution Management, National Kaohsiung University of Science and Technology, Kaohsiung 824, Taiwan
2
Department of Information Management, Asia Eastern University of Science and Technology, New Taipei 220, Taiwan
3
Department of Seafood Science, National Kaohsiung University of Science and Technology, Kaohsiung 811, Taiwan
4
Department of Intelligent Commerce, National Kaohsiung University of Science and Technology, Kaohsiung 811, Taiwan
5
Department of Health Care Administration, Asia Eastern University of Science and Technology, New Taipei 220, Taiwan
*
Author to whom correspondence should be addressed.
Axioms 2022, 11(6), 265; https://doi.org/10.3390/axioms11060265
Submission received: 30 April 2022 / Revised: 29 May 2022 / Accepted: 29 May 2022 / Published: 1 June 2022
(This article belongs to the Special Issue A Hybrid Analysis of Information Technology and Decision Making)

Abstract

:
The recommendation of the optimal selling rules for any product or service is challenging, owing to the complexity of the customer’s behavior and the competitiveness existing in the telecom retail industry. This study proposes a recommendation model for selling rules that utilizes a hybrid decision-making approach based on K-means and the C5.0 decision tree to analyze the historical sales information of telecom retailers. To evaluate the efficacy of the proposed recommendation model, it was used to analyze original data from a case company. The results indicated that the proposed hybrid decision-making approach resulted in sales content with a high gross profit and high agreement rates. The experimental results show each cluster that can be used to identify rules for the combination of good tariff items in different tariff ranges. Rules for the recommendation of special tariffs are also established to assist salespeople.

1. Introduction

Concomitant with the advent of the Internet of Things (IoT), it became possible to obtain and store data quickly and cheaply in large quantities. However, owing to the huge amount of complex big data with multiple attributes involved, conventional statistical methods and data analysis tools can no longer suffice. Consequently, the question of how to extract effective and meaningful knowledge from these historical data has become an important research topic. In recent years, the most commonly used analysis method for big data involves applying data mining-related approaches to extract features and patterns from huge datasets [1,2,3] so as to obtain meaningful or valuable information.
Nowadays, in terms of big data, enterprises focus on Internet usage behavioral records and internal data. For the former, they primarily analyze behavioral records before the transaction, including web browsing records, hotspot analysis, and online purchase behavior [4,5]. The latter involves post-transaction records, such as sales receipts, sale mix, and merchandise turnover [6]. Data mining can be applied to analyze these different types of data effectively, observe the correlation between the data through a suitable data mining model [7], find important information hidden in the data, and provide enterprises with supporting evidence for improvement. Enterprises usually apply sales data to predictive marketing by analyzing historical sales data to predict future development in the market and further predict the enterprise’s future sales trends [8] as the basis for corporate decision making. Regarding decision making, enterprises or various industries can apply hybrid data envelopment analysis to solve performance evaluation problems [9].
This study utilizes a telecom cooperative store in Taiwan as the research object. The sales behavior of the telecom retail industry differs from that of the general retail industry, as the former is similar to that of the insurance industry. In the telecom retail industry, not only are goods sold, but it is also necessary to introduce telecom tariff bidding contracts that meet the needs of users. In particular, the sale of telecom tariffs is very complicated. A telecom carrier provides diversified telecom tariffs and contract periods [10] based on the needs of different customers. At the same time, it also provides different product discounts [11] and advance payment discounts [5] based on customer qualifications, county of residence, and professional status. Furthermore, it also provides different sales commissions to the telecom cooperative store for different telecom tariffs.
The important elements in the composition of project tariffs can be roughly categorized into seven items: commodity, commodity cost, commodity project price, project tariffs, number of contract periods, advance payments, and project commission. Among them, commodity project prices, advance payments, and project commission are affected by the different product discounts and advance payment discounts derived from factors such as customer qualifications, county of residence, and occupation. For example, with the same combination of smart mobile A and telecom tariffs, a contract period of 30 months or 24 months corresponds to a project commission of TWD 21,000 or TWD 16,000, respectively. With smart mobile A and smart mobile B, in combination with telecom carrier T, the project tariffs are both TWD 1599, and when the contract period is 24 months, the telecom tariff includes a project commission of TWD 16,000 and TWD 14,000, respectively. However, the seven items constituting the telecom tariff are all affected by changes in any factor such that hundreds of thousands of telecom tariff and commodity (TTC) mixes have been generated with combinations of different conditions. Consequently, salespeople may be unable to digest the content effectively and consequently sell a TTC mix that is unsuitable for the users and which also does not meet the corporate income.
Most of the existing studies on the telecom retail industry are primarily based on market segmentation or customer research. No study has been conducted on the improvement of gross profit in the telecom retail industry. Although several studies have been conducted on data mining and retail sales, no data exploration has been conducted to analyze the sales information of telecom retailers. Thus, the main purpose of this research study is to establish a recommendation model for selling rules by applying a hybrid decision-making approach based on K-means and the C5.0 decision tree to record historical sales under different TTC mixes and to select TTC mixes with higher revenue and higher transaction frequencies. The rules of these excellent combinations are further analyzed so as to allow salespeople to provide the TTC mix that meets the needs of and maximizes revenue for customers with different needs when selling. The contribution of the recommendation model for selling rules proposed in this research study is that, even with the same rules, different types of TTC mixes that include a variety of goods at different prices with different project tariffs can be proposed. Salespeople can therefore provide more types of TTC mixes in line with the customer’s needs and will thus have more opportunities to recommend TTC mixes with a higher gross profit to assist the telecom cooperative store in establishing effective sales behavior.
The remainder of this paper is organized as follows. Section 2 presents the existing studies related to data mining in the telecommunications industry and studies related to K-means clustering and C5.0 decision tree classification. Section 3 gives the research methodology based on rule analysis with C5.0 and the clustering process. Section 4 presents experimental results and discussion. Finally, Section 5 offers conclusions, research limitations, and directions for future research.

2. Related Work

This research study mainly focuses on telecom cooperative stores and data mining. The relevant literature on the telecom industry and data mining is therefore discussed from the following three perspectives: relevant development of the telecom industry in data mining, the use of data mining for sales behavior, and the data mining methods used in this research.

2.1. Data Mining in the Telecommunications Industry

The relevant studies on commercial applications of data mining in the telecommunications industry are focused mainly on market segmentation, consumer behavior, and customer loss [10]. Keramati and Marandi [12] used machine learning and a neural network to explore and analyze user service preferences, customer satisfaction, and consumer values and then performed cluster analysis of the differences between the clusters. Li et al. [13] explored factors of customer churn behavior and made research hypotheses based on accounting charge, usage, user data, and demographic variables. They reported that there is a significant relationship between the monthly call volume or usage and customer churn and that attention to gender and age can help increase the market share. Shirazi and Mohammadi [1] constructed a predictive churn model by utilizing big data. The data comprised information from web pages, the number of website visits, and phone conversation logs. They also examined the effects of different aspects of customers’ behavior on churning decisions. Cavalinhos et al. [14] provided an overview of what is currently known about the effect of the in-store use of mobile devices on the shopping experience to assist telecom cooperative stores in finding complementary TTC mixes. When a product is out of stock or a new product is on the market, it becomes possible to quickly understand the projected telecom tariff that the commodity can be matched with. The research mainly analyzed the tariffs proposed by telecom carriers to provide information to telecom cooperative stores as a reference for making decisions on TTC mix procurement.

2.2. K-Means Clustering

Sinaga and Yang [15] provided an unsupervised K-means clustering algorithm for finding the most representative data of each cluster as the cluster center from a large and multidimensional dataset. Through continuous iteration, the minimum value of the square of the distance between each data point and its cluster center is calculated, and the error of the distance within the cluster is gradually reduced. When the results of clustering no longer change, the clustering results and the cluster center obtained are approximately the optimal solution. K-means is an unsupervised machine learning method. It has the advantages of a high clustering speed and efficiency, and thus it is suitable for processing large datasets. The main principles of this algorithm are as follows: the K points are randomly selected as initial clustering centers, and then the distances between each sample and the total distance between clustering centers and each data are calculated [16]. Chowdhury et al. [17] attempted to solve the scalability problem of conventional K-means recommendation systems. The conventional recommendation systems based on K-means have randomly generated cluster center points initially, resulting in an unstable overall accuracy and increased training costs. Chowdhury et al. [17] proposed to select the cluster center points based on the underlying data structure and conducted a large number of experiments with five different types of datasets. It was concluded that the proposed method could converge faster than the conventional method, and the obtained clustering was more accurate. Ou et al. [18] used K-means for sales forecasting of perishable foods with multiple stores and communities, which is capable of providing operators with different marketing strategies for customers in different clusters to increase profits and save costs.
The K-means clustering algorithm calculates the distance between each data point and the cluster center and reduces the error function successively with the objective of minimizing the square error within each cluster. Its expression is as follows:
a r g m i n i = 1 k x j S i X j u i 2
where K is the number of clusters, Si is the cluster data, ui is the cluster center of the Kth cluster, and Xj is the ith data in the Kth cluster.

2.3. C5.0 Decision Tree Classification

Decision trees can be used in data mining to find rules from the classified data and use them for automatic classification and prediction of classification [19]. Depending on the different characteristics, classifications or decisions can be presented in a tree structure called a decision tree, based on which rules can be generated or discovered [20]. The C5.0 decision tree can effectively avoid noise and abnormal values in the training dataset, improve the processing of huge amounts of data, reduce memory consumption, increase accuracy, divide the dataset according to the maximum profit field [21], and handle continuous and categorical variables [22]. At present, C5.0 is widely used in related research studies in different fields. For example, Wang [23] proposed a classification model based on C5.0 to achieve effective descriptions of the clustering rules. The methods proposed herein can help retailers find and utilize complementary tariff products for mobile numbers as the basis for future sales and procurement. Chiang [24] applied the C5.0 decision tree for discovering valuable markets and mining useful customer rules that are applied to marketing information or customer relationship management (CRM) systems for identifying valuable customers and data-driven marketing strategies in Taiwan. Acquila-Natale and Iglesias-Pradas [25] utilized C5.0 to build a predictive model for identifying five categories related to perceived value, including perceived quality, monetary costs, non-monetary costs, hedonic elements, and brand knowledge, adding demographic characteristics and variables related to lock-in effects in multichannel shopping behavior.
The procedure of a C5.0 decision tree is as shown below:
Step 1. Dataset S is defined, which contains n different categories C as follows:
Ci (i = 1, 2, …, n)
S = {C1, C2, …, Cn}
Step 2. Expected information is calculated using the formula below:
i n f o ( S ) = i = 1 n ( C i , S ) | S | log 2 { f r e q ( ( C i , S ) | S | ) }
S represents all data, and f r e q ( ( C i , S ) | S | ) is the frequency of the ith category occurring in the dataset.
Step 3. Information gain is calculated.
According to the variable x, information of all data can be divided into m sub-datasets, expressed as
I n f o ( S ) = i = 1 n | S i | | S | × i n f o ( S i )
After dividing the data, the information gain by variable x is
Gain(A) = Info (S) − Infox(S)
Step 4. From Gain(A), the maximum information gain can be obtained and used as a branch node. The calculation procedure for other input properties is the same as the steps above, and when the result no longer changes, the calculation is stopped.
It is known from the above studies that, at present, the telecom retail industry is focused on market analysis and customer analysis. From the relevant research studies on data mining, it can be found that in many industries, data mining has already been introduced for sales-related analysis, but few research studies focus on the telecom retailer, who is close to consumers. Therefore, this research study analyzes the historical sales data of the telecom retail industry in an attempt to discover a project TTC mix with high gross profit that also meets consumer needs, thus providing a good project TTC mix model to salespeople to assist in sales.

3. Methodology

Based on data mining, this research study establishes a recommendation model for selling rules and provides accurate and highly similar TTC mixes to salespeople to assist with sales so that the salespeople can consider the needs of consumers and the interests of the company at the same time. The recommendation model for selling rules is a hybrid decision-making approach based on K-means and the C5.0 decision tree. This research study performs cluster analysis on historical sales data based on TTC mix components and gross profit to obtain the approximate optimal clustering results. However, the approximate optimal clustering results can neither express the clustering rules effectively and clearly nor be used as a model. Therefore, this research study will conduct rule analysis with C5.0 and establish a classification rule model based on the approximate optimal clustering results.

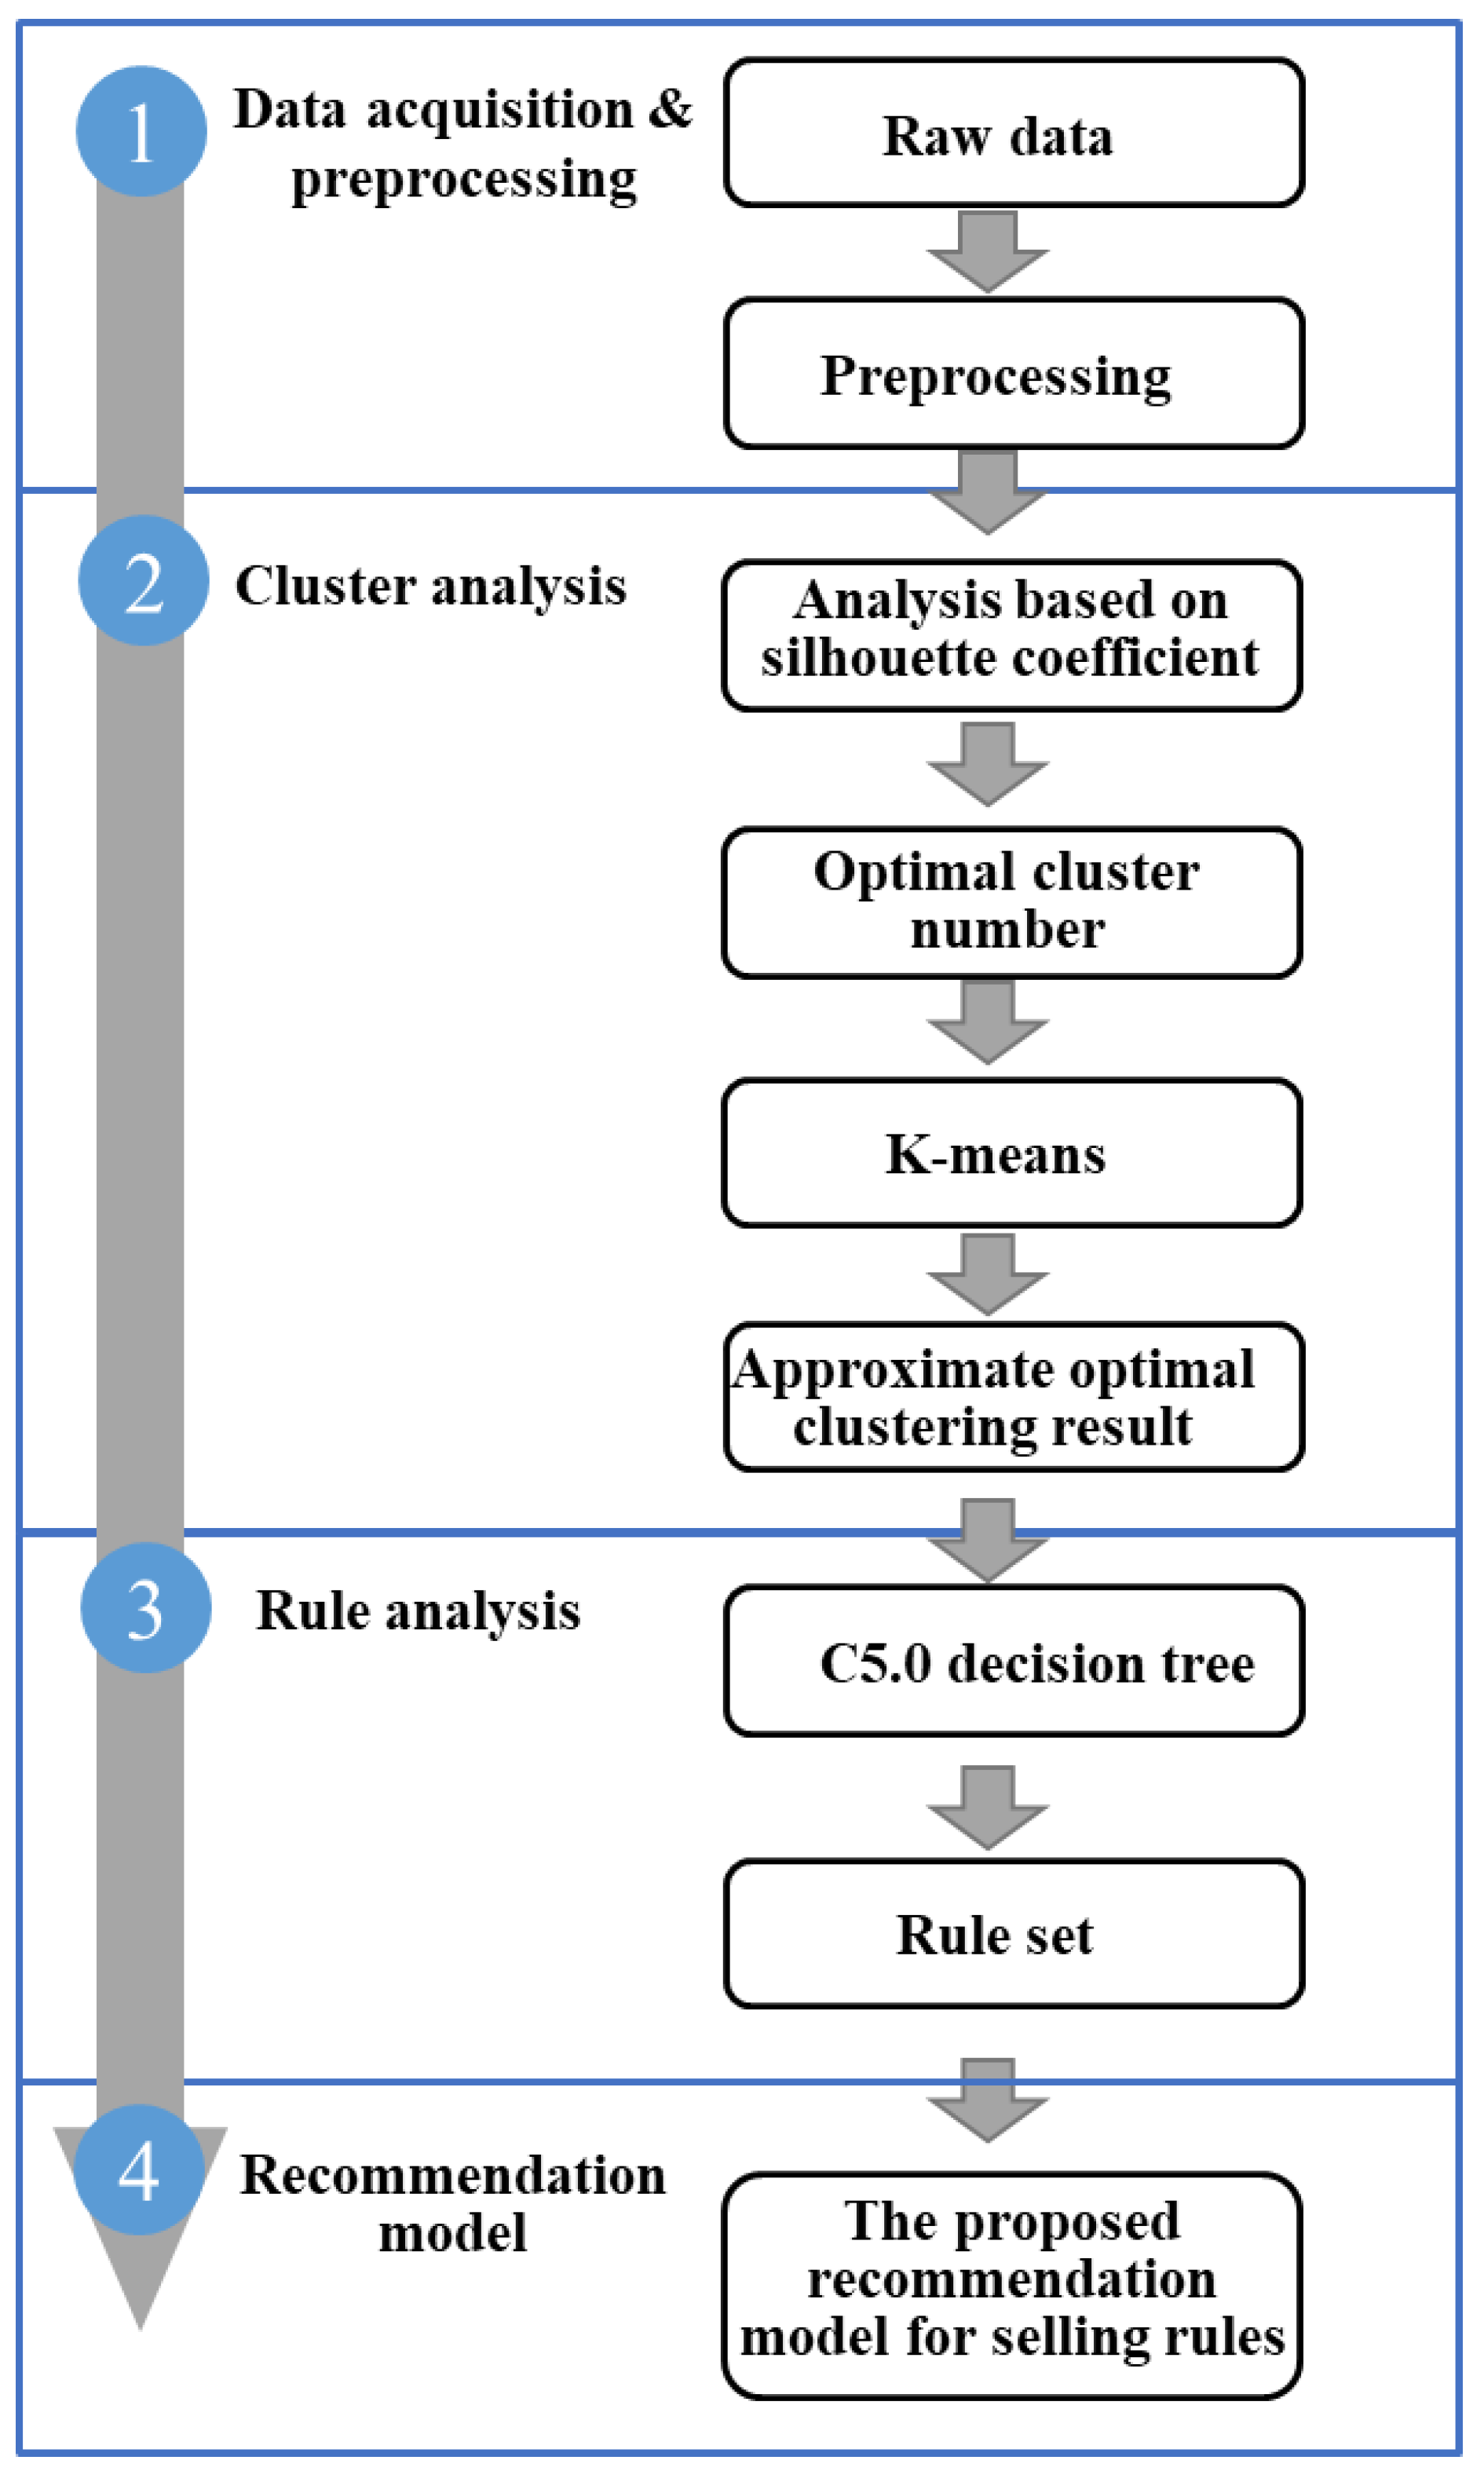
3.1. Research Framework

As shown in Figure 1, the framework of this research study consists of four stages: data acquisition and preprocessing, cluster analysis, rule analysis, and finally establishment of the proposed recommendation model for selling rules. The following subsections describe in detail the research roadmap.

3.2. Data Acquisition and Preprocessing

At this stage, the data required in this research study are acquired and sorted. Owing to the complexity in the components of the sales data of the telecom retail industry, it is necessary to determine the factors related to the problems this research study attempts to solve based on relevant research by scholars in the past and the practical experience of relevant personnel in the telecom retail industry as well as classify these factors based on relevant research by scholars in the past.

3.3. Cluster Analysis

At this stage, cluster analysis is performed on the data prepared such that data with high similarity can be classified into the same cluster until all the data in the dataset are given a clear classification. In this research study, K-means is used as the algorithm for the cluster analysis because of its high accessibility and fast convergence. Based on the calculated results of the silhouette coefficient, the number of clusters in the K-means algorithm is determined. Subsequently, cluster analysis based on the K-means algorithm is performed on the dataset acquired that has undergone preprocessing so as to obtain approximate optimal clustering results. The following are the steps in the procedure using the K-means algorithm in this research study:
  • Step 1. The number of clusters is set at K;
  • Step 2. K data points are selected as the cluster centers;
  • Step 3. The distance between each data point and each cluster center is calculated so as to classify the data point into its closest cluster;
  • Step 4. In each cluster, a new center is calculated using all data points belonging in the respective cluster;
  • Step 5. Step 3 and Step 4 are repeated until clustering results no longer change or the maximum number of iterations is reached.

3.4. Rule Analysis

At this stage, the main purpose is to determine the significance of each factor and a collection of rules through rule analysis. In this research study, the approximate optimal clustering results obtained through cluster analysis are combined with their corresponding original data. The significance of each factor as well as the rule collection of each cluster are obtained through rule analysis. The factor significance represents the influence of each factor on the sales behavior, while the rule collection expresses that this selling recommendation is a specific cluster when the sales behavior meets certain conditions. The recommendation model for selling rules proposed in this research study generates easy-to-interpret rules for different clusters. The IF part of the rule contains a combination of data attributes and the conjunction word (and), and the THEN part of the rule is the predicted classification attribute, as illustrated in the following example:
IF commodity cost > TWD 5001 AND selling gross profit > TWD 5001, THEN selling recommendation is Cluster 1
With the recommendation model for selling rules established in this research study, the TTC mix with a relatively high gross profit and the TTC mix with a relatively large number of sales in each cluster are determined. These two types of TTC mixes are ordered in terms of telecom tariffs and commodity costs to recommend the corresponding TTC mix.

4. Experimental Results and Discussion

4.1. Case Company and Data Preparation

The main operations of the case company in this research study involve telecom tariff services and general telecom commodity retail. The telecom tariff system was provided by the three main telecom carriers in Taiwan: F, W, and T. Their data quantities and ratios are shown in Table 1. In addition, the main services of the case company were personal mobile services, corporate network communication services, simple voice resale services, and mobile value-added services. The telecom tariff sales data covering the period between March 2020 and April 2021 were obtained from the case company, and the dataset covers more than 100 retail outlets.

4.2. Dataset and Preprocessing

Based on relevant research studies on the telecom retail industry by scholars [8,10] in the past and the case company’s sales experience, the sales data between March 2020 and April 2021 were analyzed. Subsequently, we concluded that the appropriate data attributes include commodity cost, commodity project price, project commission, gross profit, advance payments, and project tariffs, for which different price ranges were defined. The commodity cost is the cost of the matching products for the project. Based on relevant research studies on telecom tariffs [26,27], a commodity cost with an interval of 5000 can be divided into four levels: low-price commodity, medium-price commodity, medium-to-high-price commodity, and high-price commodity. The commodity project price is the price of the project with commodity. Based on relevant research studies on telecom tariffs [6,27], a commodity project price with an interval of 4000 can be divided into four levels: low-price project commodity, medium-price project commodity, medium-to-high-price project commodity, and high-price project commodity. The commission is the profit earned by salespeople for selling projects. The salespeople can decide whether to return the commission to the consumers so as to improve the probability of successful contracts. For the case company, with an interval of 3000, the commission could be divided into 12 levels. This research defined the selling gross profit and divided it into four intervals: low, medium, medium-high, and high. Advance payments are the fees consumers pay to the telecom carrier in advance, which can be used to pay for future telecom-related services. Based on the relevant research studies on telecom tariffs [27], advanced payments with an interval of 7000 can be divided into four levels: small advance payments, medium advance payments, medium-to-large advance payments, and large advance payments. The telecom tariff provided prices for different combinations of services to the telecom carriers which, with an interval of 200, were divided into 14 levels in this research study.

4.3. Experimental Results

In this research study, the dataset was divided into five clusters based on the K-means clustering algorithm, and rule analysis was carried out for the five clusters with the C5.0 decision tree. Table 2 shows the statistics of each cluster. Cluster 1 contained 3146 sales data points, corresponding to 30.5% of all data, with a total of 3 rules. Cluster 2 contained 1691 sales data points, corresponding to 16.39%, with a total of 5 rules. Cluster 3 contained 2493 sales data points, corresponding to 24.17% of all data, with only 1 rule. Cluster 4 contained 1977 sales data points, corresponding to 19.16% of all data, with a total of 8 rules. Cluster 5 contained 1009 sales data points, corresponding to 9.78% of all data, with a total of 3 rules.
By using the C5.0 decision tree algorithm, a total of 20 classification rules for the category of selling recommendation were extracted from the dataset, and they are listed in Table 3. Based on the 20 rules, the average classification accuracy was over 95% so that it could aid the salespeople of the case company to have better judgment for their selling recommendations as customers inquired about related tariffs. With accurate evaluation of the selling recommendation over time, the salespeople can not only make selling decisions on time but can also urge customers to complete a purchase behavior so as to improve the transaction rate and profit of the company.

4.4. Discussion

This research study used a hybrid decision-making approach based on K-means and the C5.0 decision tree to analyze a total of 10,316 data points from more than 100 communications retail stores to establish a recommendation model for selling rules, from which a recommendation list was selected. The following summarizes the characteristics of each cluster and puts forward respective suggestions, as shown in Table 4. Cluster 1 was represented by consumers who did not have much demand for commodity or telecom tariffs. It was assumed that if the salespeople can effectively increase consumer demand for telecom tariff, the gross profit can be increased effectively. Cluster 2 was represented by consumers who preferred mid-to-high-priced commodity, but they also hoped to have mid-to-high-priced telecom tariffs so as to obtain good commodity project prices. Cluster 3 was represented by consumers who had a relatively high demand for mobile and telecom tariffs and were willing to pay a premium commodity project price. The combination of high-price commodity with high-price telecom tariffs can create a good gross profit. Cluster 4 had similar commodity pricing to Cluster 1 but was better than Cluster 1 in that the consumers were willing to pay for relatively high project tariffs. If the consumers in Cluster 1 could be directed to Cluster 4, the gross profit could be increased effectively. Cluster 5 was represented by consumers who preferred high-price commodities and hoped to get some discounts at the commodity project price. However, the gross profit of commodities brought by high-cost commodities is not high. Therefore, it is recommended that the salespeople recommend relatively high telecom tariffs for this type of consumer to obtain relatively high project commissions, and part of the project commissions can also be given back to consumers to increase the sales success rate.

5. Conclusions

This research study used a hybrid decision-making approach comprising K-means and the C5.0 decision tree to establish a recommendation model for selling rules. Taking the telecom retail industry as the research target, thousands of historical sales data were analyzed using the proposed model so as to assist salespeople in providing TTX mixes that not only meet the customer’s needs but also maximize profit based on the different needs of the customers. The recommendation model for the selling rules of the case company contained 20 classification rules and 5 clusters for the following practical values: (1) providing accurate TTC mixes to assist salespeople in sales and (2) providing more highly similar TTC mixes to salespeople.
In the past, salespeople in the telecom retail industry could not provide the most suitable commodity mix immediately during sales as there are simply too many commodity mixes. However, using the proposed recommendation model for selling rules, salespeople are able to find the appropriate commodity from a huge pool of commodity mixes when they understand that the consumer needs a high-price commodity. Using the recommendation model for selling rules proposed in this research study, salespeople can not only obtain the commodity mix that meets the consumer needs but also recommend highly similar commodity mixes, such as a commodity mix in the same cluster but with a different telecom tariff or a different commodity cost. As such, the salespeople have more opportunities to provide a commodity mix with a higher gross profit.
One limitation of this research study is that it only analyzed the data of successful sales (i.e., TTC mixes that failed to sell or were not purchased by consumers were not included in this research study). In addition, the endpoint sales systems of the case company’s physical channels are all computer applications, so salespeople and customers cannot communicate on the same interface. Through computers, the salespeople obtain commodity information and provide customer information through spoken explanations. It is not a virtual channel that can record the browsed commodities, time, and preferences of every customer.
The suggestions for future development of this research are as follows. First, with the popularization of smart mobile devices in recent years, the research results can be presented to first-line salespeople through smart mobile devices in the form of an app to assist salespeople in sales and to provide more customized services according to consumer needs so as to improve consumer satisfaction. Second, artificial intelligence technologies such as face recognition, crowd analysis, and commodity recognition can be used to obtain information on other unsuccessful transactions in addition to successful sales data. In this way, the model proposed in this research study will become more robust.

Author Contributions

Conceptualization, T.-Y.O., W.-L.T., Y.-C.L. and F.-F.H.; data curation, W.-L.T.; methodology, T.-Y.O., W.-L.T., Y.-C.L., T.-H.C., S.-H.L. and F.-F.H.; project administration, T.-Y.O. and W.-L.T.; validation, T.-Y.O. and W.-L.T.; writing—original draft, T.-Y.O., W.-L.T., Y.-C.L., T.-H.C., S.-H.L. and F.-F.H.; writing—review and editing, T.-Y.O., W.-L.T., Y.-C.L. and F.-F.H.; resources, T.-H.C. and S.-H.L.; software, T.-H.C. and S.-H.L. All authors have read and agreed to the published version of the manuscript.

Funding

The authors thank the support of the marine characteristic cross-campus research project (111K02). The authors also thank ANT INTERACTION TECH Co., Ltd. for their resources and support.

Institutional Review Board Statement

Not applicable.

Informed Consent Statement

Not applicable.

Data Availability Statement

Not applicable.

Conflicts of Interest

The authors have no competing interest to declare.

References

  1. Shirazi, F.; Mohammadi, M. A big data analytics model for customer churn prediction in the retiree segment. Int. J. Inf. Manag. 2019, 48, 238–253. [Google Scholar] [CrossRef]
  2. Su, T.; Xu, H.; Zhou, X. Particle swarm optimization-based association rule mining in big data environment. IEEE Access 2019, 7, 161008–161016. [Google Scholar] [CrossRef]
  3. Wang, J.; Yang, Y.; Wang, T.; Sherratt, R.S.; Zhang, J. Big data service architecture: A survey. J. Internet Technol. 2020, 21, 393–405. [Google Scholar]
  4. Castelo-Branco, F.; Reis, J.L.; Vieira, J.C.; Cayolla, R. Business Intelligence and Data Mining to Support Sales in Retail. In Marketing and Smart Technologies; Springer: Singapore, 2020; pp. 406–4191. [Google Scholar]
  5. Krivosheya, E. The role of financial innovations in consumer behavior in the Russian retail payments market. Technol. Forecast. Soc. Chang. 2020, 161, 120304. [Google Scholar] [CrossRef]
  6. Hawthorne, R.; Grzybowski, L. Distribution of the benefits of regulation vs. competition: The case of mobile telephony in South Africa. Int. J. Ind. Organ. 2021, 74, 102673. [Google Scholar] [CrossRef]
  7. Gupta, M.K.; Chandra, P. A comprehensive survey of data mining. Int. J. Inf. Technol. 2020, 12, 1243–1257. [Google Scholar] [CrossRef]
  8. Gupta, V.K.; Ting, Q.U.; Tiwari, M.K. Multi-period price optimization problem for omnichannel retailers accounting for customer heterogeneity. Int. J. Prod. Econ. 2019, 212, 155–167. [Google Scholar] [CrossRef]
  9. Wang, C.N.; Nguyen, N.A.T.; Fu, H.P.; Hsu, H.P.; Dang, T.T. Efficiency assessment of seaport terminal operators using DEA Malmquist and epsilon-based measure models. Axioms 2021, 10, 48. [Google Scholar] [CrossRef]
  10. Espadinha-Cruz, P.; Fernandes, A.; Grilo, A. Lead management optimization using data mining: A case in the telecommunications sector. Comput. Ind. Eng. 2021, 154, 107122. [Google Scholar] [CrossRef]
  11. Chen, Y.; Cheung, C.M.; Tan, C.W. Omnichannel business research: Opportunities and challenges. Decis. Support Syst. 2018, 109, 1–4. [Google Scholar] [CrossRef]
  12. Keramati, A.; Marandi, R.J. Addressing churn prediction problem with Meta-heuristic, Machine learning, Neural Network and data mining techniques: A case study of a telecommunication company. Int. J. Future Comput. Commun. 2015, 4, 350. [Google Scholar] [CrossRef] [Green Version]
  13. Li, Y.; Hou, B.; Wu, Y.; Zhao, D.; Xie, A.; Zou, P. Giant fight: Customer churn prediction in traditional broadcast industry. J. Bus. Res. 2021, 131, 630–639. [Google Scholar] [CrossRef]
  14. Cavalinhos, S.; Marques, S.H.; de Fátima Salgueiro, M. The use of mobile devices in-store and the effect on shopping experience: A systematic literature review and research agenda. Int. J. Consum. Stud. 2021, 45, 1198–1216. [Google Scholar] [CrossRef]
  15. Sinaga, K.P.; Yang, M.S. Unsupervised K-means clustering algorithm. IEEE Access 2020, 8, 80716–80727. [Google Scholar] [CrossRef]
  16. Lingxian, Y.; Jiaqing, K.; Shihuai, W. Online Retail Sales Prediction with Integrated Framework of K-mean and Neural Network. In Proceedings of the 2019 10th International Conference on E-business, Management and Economics, Beijing, China, 15–17 July 2019; pp. 115–118. [Google Scholar]
  17. Chowdhury, K.; Chaudhuri, D.; Pal, A.K.; Samal, A. Seed selection algorithm through K-means on optimal number of clusters. Multimed. Tools Appl. 2019, 78, 18617–18651. [Google Scholar] [CrossRef]
  18. Ou, T.Y.; Chen, Y.J.; Tsai, W.L. Sales Forecasting of Perishable Foods with Multiple Stores and Communities- An Empirical Study of Convenience Stores in Taiwan. Int. J. Intell. Technol. Appl. Stat. 2020, 13, 385–409. [Google Scholar]
  19. Priyanka; Kumar, D. Decision tree classifier: A detailed survey. Int. J. Inf. Decis. Sci. 2020, 12, 246–269. [Google Scholar]
  20. Sato, N.; Kuruma, H.; Nakagawa, Y.; Ogawa, H. Formal Verification of a Decision-Tree Ensemble Model and Detection of Its Violation Ranges. IEICE Trans. Inf. Syst. 2020, 103, 363–378. [Google Scholar] [CrossRef] [Green Version]
  21. Lu, C.L.; Chen, C.T. A study of applying data mining approach to the information disclosure for Taiwan’s stock market investors. Expert Syst. Appl. 2009, 36, 3536–3542. [Google Scholar] [CrossRef]
  22. Wang, G.; Wu, N. A Comparative Study on Contract Recommendation Model: Using Macao Mobile Phone Datasets. IEEE Access 2020, 8, 39747–39757. [Google Scholar] [CrossRef]
  23. Wang, S.T. Integrating KPSO and C5. 0 to analyze the omnichannel solutions for optimizing telecommunication retail. Decis. Support Syst. 2018, 109, 39–49. [Google Scholar] [CrossRef]
  24. Chiang, W.Y. Using a data-driven marketing strategy on customer relationship management: An empirical case of urban coffee shops in Taiwan. Br. Food J. 2020, 123, 1610–1625. [Google Scholar] [CrossRef]
  25. Acquila-Natale, E.; Iglesias-Pradas, S. A matter of value? Predicting channel preference and multichannel behaviors in retail. Technol. Forecast. Soc. Chang. 2021, 162, 120401. [Google Scholar] [CrossRef]
  26. Berne, M.; Vialle, P.; Whalley, J. An analysis of the disruptive impact of the entry of Free Mobile into the French mobile telecommunications market. Telecommun. Policy 2019, 43, 262–277. [Google Scholar] [CrossRef]
  27. Ghodous, M.; Alesheikh, A.A.; Saeidian, B. Analyzing public participant data to evaluate citizen satisfaction and to prioritize their needs via K-means. FCM ICA 2016, 55, 70–81. [Google Scholar] [CrossRef]
Figure 1. Research framework.
Axioms 11 00265 g001
Table 1. The dataset among three telecom carriers.
Telecom Carrier FTelecom Carrier WTelecom Carrier TTotal
Number of data69001869154710,316
Ratio of data66.89%18.12%14.99%100%
Table 2. Summary of clusters.
ClusterNumber of RuleNumber of DataRatio of Data
Cluster 13314630.5%
Cluster 25169116.39%
Cluster 31249324.17%
Cluster 48197719.16%
Cluster 5310099.78%
Table 3. Rules obtained by using C5.0 decision tree classification.
NumberRules for the Category of Selling RecommendationAccuracy
Rule 1.1IF commodity cost < TWD 5001, and gross profit < TWD 5001, THEN selling recommendation is Cluster 1100%
Rule 1.2IF commodity cost between TWD 5001 and TWD 10,000, and gross profit < TWD 5001, THEN selling recommendation is Cluster 199%
Rule 1.3IF commodity cost < TWD 5001, and project commission between TWD 3001 and TWD 6000, THEN selling recommendation is Cluster 197%
Rule 2.1IF commodity cost between TWD 10,001 and TWD 15,001, and gross profit < TWD 5001, THEN selling recommendation is Cluster 2100%
Rule 2.2IF commodity cost between TWD 10,001 and TWD 15,001, and commodity project price between TWD 4001 and TWD 8000, THEN selling recommendation is Cluster 2100%
Rule 2.3IF commodity cost between TWD 10,001 and TWD 15,001, and commodity project price between TWD 8001 and TWD 12,000, THEN selling recommendation is Cluster 2100%
Rule 2.4IF commodity cost between TWD 10,001 and TWD 15,001, and commodity project price > TWD 12,000, THEN selling recommendation is Cluster 2100%
Rule 2.5IF commodity cost between TWD 10,001 and TWD 15,001, and gross profit between TWD 10,001 and TWD 15,001, THEN selling recommendation is Cluster 2100%
Rule 3.1IF commodity cost > TWD 15,001, and commodity project price > TWD 12,001, THEN selling recommendation is Cluster 3100%
Rule 4.1IF gross profit between TWD 5001 and TWD 10,000, and commodity project price < TWD 4001, THEN selling recommendation is Cluster 4100%
Rule 4.2IF commodity cost between TWD 5001 and TWD 10,000, and gross profit between TWD 5001 and TWD 10,000, THEN selling recommendation is Cluster 4100%
Rule 4.3IF commodity cost < TWD 5001, and gross profit between TWD 10,001 and TWD 15,000, THEN selling recommendation is Cluster 499%
Rule 4.4IF commodity cost < TWD 5001, and gross profit between TWD 5001 and TWD 10,000, THEN selling recommendation is Cluster 496%
Rule 4.5IF commodity cost between TWD 5001 and TWD 10,000, and gross profit between TWD 10,001 and TWD 15,000, THEN selling recommendation is Cluster 497%
Rule 4.6IF project tariffs between TWD 401 and TWD 600, and gross profit between TWD 5001 and TWD 10,000, and commodity project price between TWD 4001 and TWD 8000, THEN selling recommendation is Cluster 4100%
Rule 4.7IF commodity cost < TWD 5001, and gross profit > TWD 15,000, THEN selling recommendation is Cluster 489%
Rule 4.8IF commodity cost between TWD 5001 and TWD 10,000, and gross profit > TWD 15,000, THEN selling recommendation is Cluster 4100%
Rule 5.1IF commodity cost > TWD 15,001, and commodity project price between TWD 8001 and TWD 12,000, THEN selling recommendation is Cluster 5100%
Rule 5.2IF commodity cost > TWD 15,001, and commodity project price between TWD 4001 and TWD 8000, THEN selling recommendation is Cluster 5100%
Rule 5.3IF commodity cost > TWD 15,001, and commodity project price < TWD 4001, THEN selling recommendation is Cluster 5100%
Table 4. Summary of clustering results.
ItemCluster 1Cluster 2Cluster 3Cluster 4Cluster 5
Commodity costMedium-lowMedium-highHighMedium-lowHigh
Commodity project priceLowMedium-lowHighLowMedium-high
Gross profitLowLowLowLowLow
Project tariffsMedium-lowMedium-highHighMedium-highHigh
Project commissionLowMedium-lowMediumMediumMedium
Advance paymentsLowLowLowLowLow
Publisher’s Note: MDPI stays neutral with regard to jurisdictional claims in published maps and institutional affiliations.

