
Evaluating the Digital Transformation Performance of Retail by the DEA Approach


Abstract
:1. Introduction
2. Research Methodology
Data Envelopment Analysis
3. Research Scheme and Metrics Confirmation
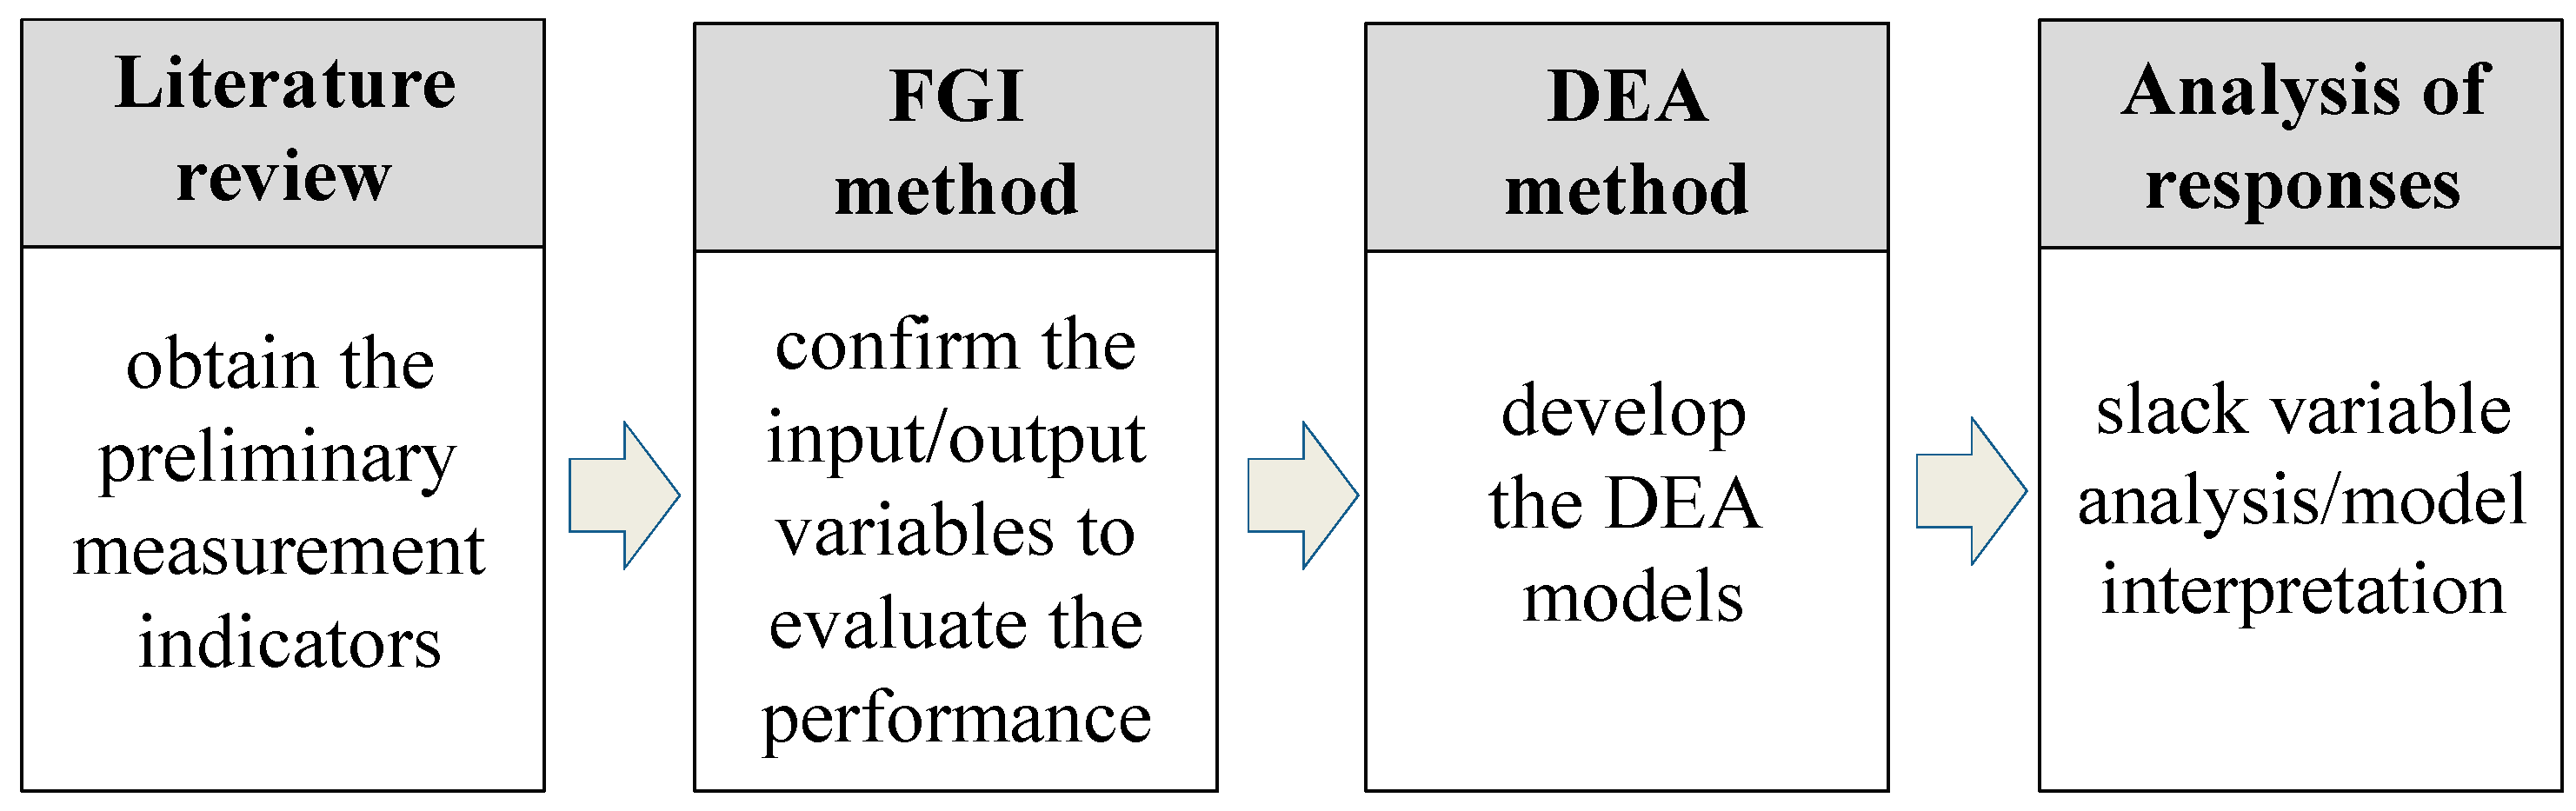
3.1. Research Scheme
3.2. Developing Digital Transformation Dimensions and Metrics
3.3. FGI and Confirming the Digital Transformation Metrics
4. Empirical Study
4.1. Data Collection
4.2. Analyzing the Efficiency of Digital Transformations by Retail Vendors
4.3. Slack Variable Analysis
5. Conclusions
Author Contributions
Funding
Data Availability Statement
Conflicts of Interest
Appendix A

| Variables/Dimensions | Indicators | Calculation/Question Statement | |
|---|---|---|---|
| Inputs | Ratio of existing digital transformation talents (RDTT) | - | RDTS = existing digital transformation talents/the total number of employees |
| Ratio of invested funds in digital transformation (RIFDT) | - | RIFDT = digital transformation budget/business turnover | |
| Ratio of the training hours of digital transformation (RTHDT) | - | RTHDT = training hours dedicated to the digital transformation/total training hours | |
| Output | Digital transformation techniques (DTT) | Digital infrastructure | The integrity of data security, information systems and information services is high. |
| Data value | The degree to which the company gathers, analyzes and applies information when making its business decisions is high. | ||
| Organizational operations (OO) | Leadership consensus | The degree of consensus among company leadership regarding the vision and strategies of the digital transformation and the company’s digital culture is high. | |
| Organizational capabilities | The degree of understanding and application of digital skills among the company’s staff, in both digital transformation and other departments, is high. | ||
| Ecosystems | The degree of information exchange and application between ecosystems is high. (Note: Ecosystems typically include multiple affiliate industries, and in a system, vendors not only work together but also engage in some degree of competition.) | ||
| Process optimization (PO) | Internal process optimization | The degree to which the company’s internal workflows (purchase orders, procurement, warehousing and interdepartmental collaborations) have been optimized and digitized is high. | |
| External process optimization | The degree to which the company’s external workflows (supply chains, sales channels, marketing channels, customer service and after-sales support) have been optimized and digitized is high. | ||
| Customer experiences (CE) | Customer acquisition | The ability of the company to collect and analyze internal and external data to further understand customer patterns, demands and preferences is high. | |
| Business models (BM) | Business model innovation | The ability of the company to develop innovative business models to open up new markets is high. |
References
- Tabrizi, B.; Lam, E.; Girard, K.; Irvin, V. Digital Transformation Is Not about Technology. Harv. Bus. Rev. 2019, 13, 54–73. [Google Scholar]
- Evans, N.D. Assessing Your Organization’s Digital Transformation Maturity. 2017. Available online: https://www.cio.com/article/3213194/assessing-your-organization-s-digitaltransformation-maturity.html (accessed on 15 March 2022).
- Deloitte. Digital Maturity Model Achieving Digital Maturity to Drive Growth. 2018. Available online: https://www2.deloitte.com/content/dam/Deloitte/global/Documents/Technology-Media-Telecommunications/deloitte-digital-maturity-model.pdf (accessed on 23 February 2022).
- Hess, T.; Benlian, A.; Matt, C.; Wlesbock, F. Options for Formulating a Digital Transformation Strategy. MIS Q. Exec. 2016, 15, 123–139. [Google Scholar] [CrossRef]
- Bradley, C.; Hirt, M.; Smit, S. Eight shifts that will take your strategy into high gear. The McKinsey Quarterly, 11 June 2018; 88–100. [Google Scholar]
- Mitrović, Đ. Broadband adoption, digital divide, and the global economic competitiveness of Western Balkan countries. Econ. Ann. 2015, 60, 95–115. [Google Scholar] [CrossRef]
- Kumar, S.; Russell, R.R. Technological change, technological catch-up, and capital deepening: Relative contributions to growth and convergence. Am. Econ. Rev. 2002, 92, 527–548. [Google Scholar] [CrossRef]
- Chetty, K.; Qigui, L.; Gcora, N.; Josie, J.; Wenwei, L.; Fang, C. Bridging the digital divide: Measuring digital literacy. Economics 2018, 12, 1–20. [Google Scholar] [CrossRef] [Green Version]
- Mehrabian, S.; Alirezaee, M.R.; Jahanshahloo, G.R. A complete efficiency ranking of decision making units in data envelopment analysis. Comput. Optim. Appl. 1999, 14, 261–266. [Google Scholar] [CrossRef]
- Raab, R.; Kotamraju, P. The efficiency of the high-tech economy: Conventional development indexes versus a performance index. J. Reg. Sci. 2006, 46, 545–562. [Google Scholar] [CrossRef]
- Ceccobelli, M.; Gitto, S.; Mancuso, P. ICT capital and labour productivity growth: A nonparametric analysis of 14 OECD countries. Telecommun. Policy 2012, 36, 282–292. [Google Scholar] [CrossRef] [Green Version]
- Mitrovic, D. Measuring the efficiency of digital convergence. Econ. Lett. 2020, 188, 2–4. [Google Scholar] [CrossRef]
- Magdalena, J.; Urbaniec, M. Development of Sustainability Competencies for the Labour Market: An Exploratory Qualitative Study. Sustainability 2019, 11, 5716. [Google Scholar] [CrossRef]
- Patton, M.Q. Qualitative Research and Evaluation Methods, 4th ed.; Sage Publications, Inc.: London, UK, 2015. [Google Scholar]
- Silverman, S.D. Doing Practical Research: A Practical Handbook; Sage Publications, Inc.: London, UK, 2005. [Google Scholar]
- Charnes, A.; Cooper, W.; Rhodes, E. Measuring the efficiency of decision making units. Eur. J. Oper. Res. 1978, 2, 429–444. [Google Scholar] [CrossRef]
- Tone, E.K. A Slack Based Measure of Efficiency in Data Envelopment Analysis. Eur. J. Oper. Res. 2001, 130, 498–509. [Google Scholar] [CrossRef] [Green Version]
- Avkiran, N.; Tone, K.; Tsutsui, M. Bridging radial and non-radial measures of efficiency in DEA. Ann. Oper. Res. 2008, 164, 127–138. [Google Scholar] [CrossRef]
- Farrell, M.J. The measurement of productive efficiency. J. R. Stat. Soc. Ser. A 1957, 120, 253–281. [Google Scholar] [CrossRef]
- Banker, R.D.; Charnes, A.; Cooper, W. Some models for estimating technical and scale inefficiencies in data envelopment analysis. Manag. Sci. 1984, 30, 1078–1092. [Google Scholar] [CrossRef] [Green Version]
- Kane, G.C.; Palmer, D.; Phillips, A.N.; Kiron, D.; Buckley, N. Strategy, Not Technology, Drives Digital Transformation; MIT Sloan Management Review and Deloitte University Press: Cambridge, MA, USA, 2015. [Google Scholar]
- Loonam, J.; Eaves, S.; Kumar, V.; Parry, G. Towards digital transformation: Lessons learned from traditional organization. Strateg. Change 2018, 27, 101–109. [Google Scholar] [CrossRef]
- Bughin, J.; Manyika, J.; Catlin, T. Twenty-Five Years of Digitization: Ten Insights into How to Play It Right; McKinsey Global Institute: San Francisco, CA, USA, 2019. [Google Scholar]
- OOSGA. Available online: https://global.oosga.com/solutions/tide/ (accessed on 16 March 2022).
- Digital Transformation Toolkit. 2020. Available online: https://www.dpc.sa.gov.au/data/assets/pdf_file/0008/46565/Digital_Transformation_Toolkit_Guide.pdf (accessed on 5 March 2022).
- Probst, L.; Lefebvre, V.; Martinez-Diaz, C.; Unlu Bohn, N.; PwC, D.; Klitou, J.C. Digital Transformation Scoreboard 2018: EU Businesses Go Digital: Opportunities, Outcomes and Uptake; European Commission: Luxembourg, 2018. [Google Scholar]
- Salesforce.com Report, What Is Digital Transformation. 2021. Available online: https://www.salesforce.com/products/platform/what-is-digital-transformation/ (accessed on 18 March 2022).
- Morakanyane, R.; Grace, A.; Philip, O. Conceptualizing digital transformation in business organizations: A systematic review of literature. In Proceedings of the 30th Bled eConference, Digital Transformation—From Connecting Things to Transforming Our Lives, Bled, Slovenia, 18–21 June 2017. [Google Scholar]
- Tichert, R. Digital Transformation maturity: A systematic review of literature. ACTA Univ. Agric. Silvic. Mendel. Bus. 2019, 67, 1673–1687. [Google Scholar] [CrossRef] [Green Version]
- Vial, G. Understanding Digital transformation: A review and a research agenda. J. Strateg. Inf. Syst. 2019, 29, 118–144. [Google Scholar] [CrossRef]
- Saarikko, T.; Westergren, U.H.; Blomquist, T. The internet of things: Are you ready for what’s coming? Bus. Horiz. 2017, 60, 667–676. [Google Scholar] [CrossRef]
- SAP Report. 2017. Available online: https://www.sap.com/taiwan/cmp/dg/tw-digital-transformation-report/typ.html (accessed on 8 March 2022).
- Graneheim, U.H.; Lundman, B. Qualitative content analysis in nursing research: Concepts, procedures and measures to achieve trustworthiness. Nurse Educ. Today 2004, 24, 105–112. [Google Scholar] [CrossRef]
- Krueger, R.A. Focus Groups: A Practical Guide for Applied Research, 2nd ed.; Sage Publications, Inc.: Thousand Oaks, CA, USA, 1994. [Google Scholar]
- Krueger, R.A.; Casey, M.A. Focus Groups: A Practical Guide for Applied Research, 3rd ed.; Sage Publications, Inc.: Thousand Oaks, CA, USA, 2000. [Google Scholar]
- Gürbüz, T. Enabling Digital Transformation in Education and Training: Towards Effective Human Capital Development, Middle East Technical University, Turkey. In Recent Developments in Individual and Organizational Adoption of ICTs; IGI Global: Hershey, PA, USA, 2021. [Google Scholar]
- Lefever, S.; Dal, M.; Matthiasdottir, A. Online data collection in academic research: Advantages and limitations. Br. J. Educ. Technol. 2007, 38, 574–582. [Google Scholar] [CrossRef]
- Wright, B.; Schwager, P.H. Online survey research: Can response factors be improved? J. Internet Commer. 2008, 7, 253–269. [Google Scholar] [CrossRef] [Green Version]
- Likert, R. A technique for the measurement of attitudes. Arch. Psychol. 1932, 22, 1–55. [Google Scholar]
- Vega, M.; Pardo, R.; Barrado, E.; Debán, L. Assessment of seasonal and polluting effects on the quality of river water by exploratory data analysis. Water Res. 1998, 32, 3581–3592. [Google Scholar] [CrossRef]
- Bughin, J.; Deakin, J.; O’Beirne, B. Digital Transformation: Improving the Odds of Success. The McKinsey Quarterly. 22 October 2019. Available online: https://www.mckinsey.com/business-functions/mckinsey-digital/our-insights/digital-transformation-improving-the-odds-of-success (accessed on 18 August 2020).


| Variables | Mean | Std. Dev. | Min. | Max. |
|---|---|---|---|---|
| RDTT (x1) | 0.157 | 0.055 | 0.000 | 0.200 |
| RIFDT (x2) | 0.089 | 0.004 | 0.068 | 0.090 |
| RTHDT (x3) | 0.254 | 0.385 | 0.000 | 1.000 |
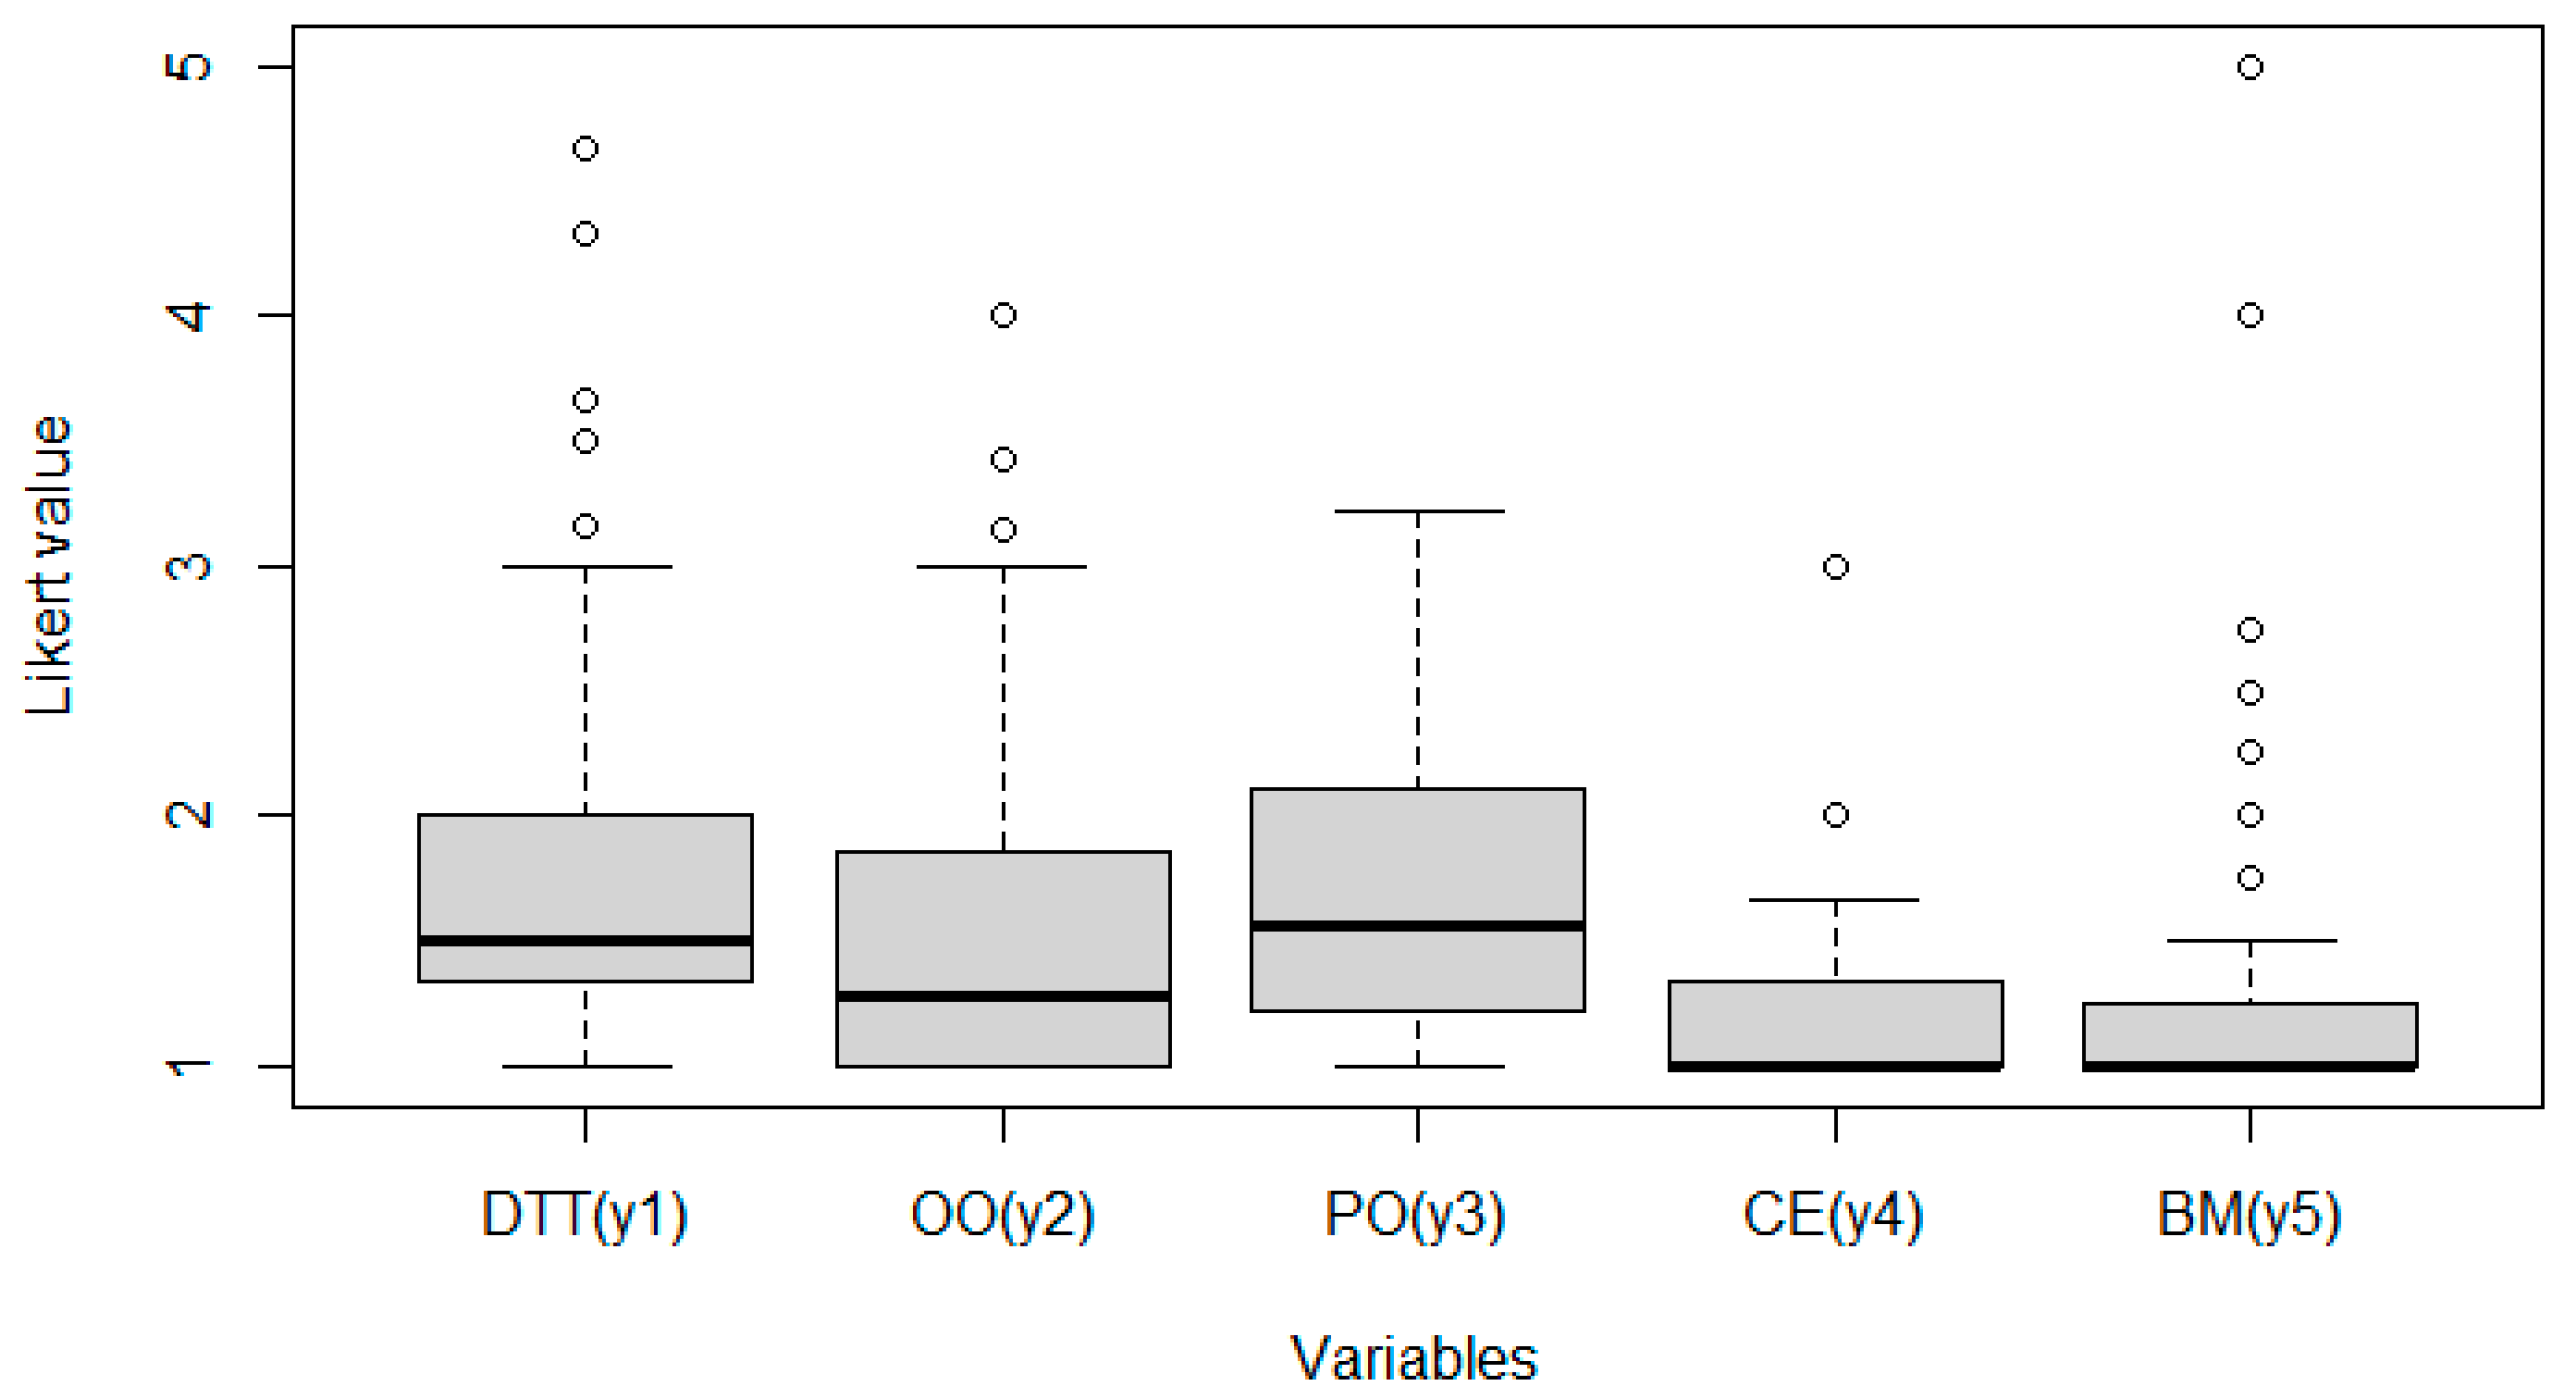
| DTT (y1) | 1.820 | 0.816 | 1.000 | 4.667 |
| OO (y2) | 1.583 | 0.698 | 1.000 | 4.000 |
| PO (y3) | 1.711 | 0.554 | 1.000 | 3.222 |
| CE (y4) | 1.204 | 0.437 | 1.000 | 3.000 |
| BM (y5) | 1.327 | 0.711 | 1.000 | 5.000 |
| RDTT (x1) | RIFDT (x2) | RTHDT (x3) | DTT (y1) | OO (y2) | PO (y3) | CE (y4) | BM (y5) | |
|---|---|---|---|---|---|---|---|---|
| RDTT (x1) | 1.000 | --- | --- | --- | --- | --- | --- | --- |
| RIFDT (x2) | 0.371 | 1.000 | --- | --- | --- | --- | --- | --- |
| RTHDT (x3) | 0.190 | 0.329 | 1.000 | --- | --- | --- | --- | --- |
| DTT (y1) | 0.195 | 0.026 | 0.231 | 1.000 | --- | --- | --- | --- |
| OO (y2) | 0.003 | 0.004 | 0.251 | 0.735 | 1.000 | --- | --- | --- |
| PO (y3) | 0.139 | 0.072 | 0.340 | 0.731 | 0.765 | 1.000 | --- | --- |
| CE (y4) | 0.137 | 0.010 | 0.272 | 0.450 | 0.632 | 0.634 | 1.000 | --- |
| BM (y5) | 0.054 | 0.017 | 0.195 | 0.647 | 0.625 | 0.481 | 0.248 | 1.000 |
| DMUs | OTE | TE | SE | RTS | DMUs | OTE | TE | SE | RTS |
|---|---|---|---|---|---|---|---|---|---|
| 1 | 0.109 | 1.000 | 0.109 | drs | 32 | 0.030 | 0.622 | 0.048 | drs |
| 2 | 1.000 | 1.000 | 1.000 | - | 33 | 0.017 | 0.651 | 0.026 | drs |
| 3 | 0.445 | 1.000 | 0.445 | irs | 34 | 0.018 | 0.622 | 0.029 | irs |
| 4 | 0.314 | 0.973 | 0.322 | drs | 35 | 0.028 | 0.563 | 0.050 | drs |
| 5 | 0.864 | 1.000 | 0.864 | drs | 36 | 0.017 | 0.700 | 0.024 | drs |
| 6 | 0.178 | 1.000 | 0.178 | irs | 37 | 1.000 | 1.000 | 1.000 | - |
| 7 | 0.005 | 0.725 | 0.007 | irs | 38 | 0.015 | 0.571 | 0.026 | drs |
| 8 | 0.091 | 1.000 | 0.091 | drs | 39 | 1.000 | 1.000 | 1.000 | - |
| 9 | 0.044 | 0.549 | 0.080 | drs | 40 | 0.022 | 1.000 | 0.022 | irs |
| 10 | 0.084 | 0.706 | 0.118 | drs | 41 | 1.000 | 1.000 | 1.000 | - |
| 11 | 0.173 | 0.818 | 0.212 | irs | 42 | 0.033 | 0.771 | 0.043 | drs |
| 12 | 0.528 | 1.000 | 0.528 | drs | 43 | 0.011 | 0.569 | 0.020 | drs |
| 13 | 0.002 | 0.498 | 0.004 | drs | 44 | 0.018 | 0.767 | 0.023 | drs |
| 14 | 0.255 | 1.000 | 0.255 | drs | 45 | 0.012 | 0.846 | 0.014 | drs |
| 15 | 0.131 | 0.576 | 0.228 | drs | 46 | 0.064 | 1.000 | 0.064 | drs |
| 16 | 0.196 | 1.000 | 0.196 | drs | 47 | 1.000 | 1.000 | 1.000 | - |
| 17 | 0.011 | 0.538 | 0.020 | drs | 48 | 0.160 | 1.000 | 0.160 | drs |
| 18 | 0.026 | 0.541 | 0.048 | drs | 49 | 0.181 | 1.000 | 0.181 | drs |
| 19 | 0.020 | 0.572 | 0.035 | drs | 50 | 0.051 | 0.705 | 0.072 | drs |
| 20 | 0.027 | 0.569 | 0.047 | irs | 51 | 0.080 | 1.000 | 0.080 | drs |
| 21 | 0.030 | 0.672 | 0.045 | drs | 52 | 0.014 | 0.616 | 0.023 | irs |
| 22 | 0.067 | 1.000 | 0.067 | drs | 53 | 0.017 | 0.477 | 0.035 | drs |
| 23 | 0.029 | 0.745 | 0.038 | drs | 54 | 0.013 | 0.543 | 0.024 | drs |
| 24 | 0.008 | 0.689 | 0.012 | drs | 55 | 0.021 | 0.512 | 0.040 | drs |
| 25 | 0.023 | 1.000 | 0.023 | drs | 56 | 0.031 | 0.726 | 0.043 | drs |
| 26 | 0.012 | 1.000 | 0.012 | irs | 57 | 0.072 | 0.890 | 0.081 | drs |
| 27 | 0.005 | 0.682 | 0.008 | drs | 58 | 0.016 | 0.569 | 0.029 | drs |
| 28 | 0.008 | 0.478 | 0.016 | drs | 59 | 1.000 | 1.000 | 1.000 | - |
| 29 | 0.024 | 0.642 | 0.037 | drs | 60 | 0.059 | 0.730 | 0.081 | drs |
| 30 | 0.028 | 0.570 | 0.049 | drs | 61 | 0.058 | 0.571 | 0.101 | drs |
| 31 | 0.021 | 0.977 | 0.022 | drs | 62 | 0.026 | 0.634 | 0.041 | drs |
| DMU | RDTT | RIFDT | PDTT | DMU | RDTT | RIFDT | PDTT |
|---|---|---|---|---|---|---|---|
| 1 | 0.000 | 0.001 | 0.000 | 30 | 0.084 | 0.000 | 0.000 |
| 3 | 0.075 | 0.000 | 0.076 | 31 | 0.204 | 0.000 | 0.000 |
| 4 | 0.094 | 0.087 | 0.000 | 32 | 0.063 | 0.085 | 0.000 |
| 5 | 0.077 | 0.086 | 0.000 | 33 | 0.303 | 0.000 | 0.000 |
| 6 | 0.052 | 0.080 | 0.277 | 34 | 0.130 | 0.000 | 0.000 |
| 7 | 0.064 | 0.150 | 0.056 | 35 | 0.190 | 0.000 | 0.000 |
| 8 | 0.000 | 0.090 | 0.000 | 36 | 0.314 | 0.000 | 0.000 |
| 9 | 0.054 | 0.000 | 0.000 | 38 | 0.298 | 0.000 | 0.000 |
| 10 | 0.040 | 0.000 | 0.000 | 40 | 0.053 | 0.087 | 0.000 |
| 11 | 0.000 | 0.000 | 0.623 | 42 | 0.157 | 0.000 | 0.000 |
| 12 | 0.082 | 0.059 | 0.000 | 43 | 0.223 | 0.014 | 0.000 |
| 13 | 0.501 | 0.250 | 0.116 | 44 | 0.062 | 0.000 | 0.000 |
| 14 | 0.076 | 0.076 | 0.000 | 45 | 0.030 | 0.016 | 0.000 |
| 15 | 0.003 | 0.000 | 0.000 | 46 | 0.000 | 0.003 | 0.000 |
| 16 | 0.058 | 0.081 | 0.732 | 48 | 0.000 | 0.095 | 0.000 |
| 17 | 0.275 | 0.004 | 0.000 | 49 | 0.064 | 0.073 | 0.000 |
| 18 | 0.068 | 0.000 | 0.000 | 50 | 0.000 | 0.000 | 0.266 |
| 19 | 0.228 | 0.000 | 0.000 | 51 | 0.000 | 0.064 | 0.000 |
| 20 | 0.015 | 0.004 | 0.000 | 52 | 0.412 | 0.001 | 0.055 |
| 21 | 0.000 | 0.010 | 0.107 | 53 | 0.022 | 0.016 | 0.070 |
| 22 | 0.076 | 0.093 | 0.000 | 54 | 0.378 | 0.005 | 0.000 |
| 23 | 0.003 | 0.000 | 0.000 | 55 | 0.185 | 0.010 | 0.000 |
| 24 | 0.487 | 0.037 | 0.000 | 56 | 0.146 | 0.000 | 0.000 |
| 25 | 0.098 | 0.000 | 0.000 | 57 | 0.047 | 0.000 | 0.000 |
| 26 | 0.000 | 0.045 | 0.000 | 58 | 0.310 | 0.005 | 0.000 |
| 27 | 0.254 | 0.133 | 0.000 | 60 | 0.095 | 0.057 | 0.000 |
| 28 | 0.396 | 0.050 | 0.039 | 61 | 0.052 | 0.000 | 0.000 |
| 29 | 0.080 | 0.015 | 0.000 | 62 | 0.011 | 0.012 | 0.025 |
Publisher’s Note: MDPI stays neutral with regard to jurisdictional claims in published maps and institutional affiliations. |
© 2022 by the authors. Licensee MDPI, Basel, Switzerland. This article is an open access article distributed under the terms and conditions of the Creative Commons Attribution (CC BY) license (https://creativecommons.org/licenses/by/4.0/).
Share and Cite
Kao, L.-J.; Chiu, C.-C.; Lin, H.-T.; Hung, Y.-W.; Lu, C.-C. Evaluating the Digital Transformation Performance of Retail by the DEA Approach. Axioms 2022, 11, 284. https://doi.org/10.3390/axioms11060284
Kao L-J, Chiu C-C, Lin H-T, Hung Y-W, Lu C-C. Evaluating the Digital Transformation Performance of Retail by the DEA Approach. Axioms. 2022; 11(6):284. https://doi.org/10.3390/axioms11060284
Chicago/Turabian StyleKao, Ling-Jing, Chih-Chou Chiu, Hung-Tse Lin, Yun-Wei Hung, and Cheng-Chin Lu. 2022. "Evaluating the Digital Transformation Performance of Retail by the DEA Approach" Axioms 11, no. 6: 284. https://doi.org/10.3390/axioms11060284