Article

Emeralds from the Most Important Occurrences: Chemical and Spectroscopic Data

Bahrain Institute for Pearls & Gemstones (DANAT), WTC East Tower, P.O. Box 17236 Manama, Bahrain
*
Author to whom correspondence should be addressed.
Minerals 2019, 9(9), 561; https://doi.org/10.3390/min9090561
Submission received: 1 August 2019 / Revised: 8 September 2019 / Accepted: 9 September 2019 / Published: 17 September 2019
(This article belongs to the Special Issue Mineralogy and Geochemistry of Gems)

Abstract

:
The present study applied LA–ICP-MS on gem-quality emeralds from the most important sources (Afghanistan, Brazil, Colombia, Ethiopia, Madagascar, Russia, Zambia and Zimbabwe). It revealed that emeralds from Afghanistan, Brazil, Colombia and Madagascar have a relatively lower lithium content (7Li < 200 ppmw) compared to emeralds from other places (7Li > 250 ppmw). Alkali element contents as well as scandium, manganese, cobalt, nickel, zinc and gallium can further help us in obtaining accurate origin information for these emeralds. UV-Vis spectroscopy can aid in the separation of emeralds from Colombia and Afghanistan from these obtained from the other sources as the latter present pronounced iron-related bands. Intense Type-II water vibrations are observed in the infrared spectra of emeralds from Madagascar, Zambia and Zimbabwe, as well as in some samples from Afghanistan and Ethiopia, which contain higher alkali contents. A band at 2818 cm−1, supposedly attributed to chlorine, was observed only in emeralds from Colombia and Afghanistan. Samples with medium to high alkalis from Ethiopia, Madagascar, Zambia and Zimbabwe can also be separated from the others by Raman spectroscopy based on the lower or equal relative intensity of the Type I water band at around 3608 cm−1 compared to the Type II water band at around 3598 cm−1 band (with some samples from Afghanistan, Brazil and Russia presenting equal relative intensities).

1. Introduction

Emeralds, together with rubies and sapphires (red and blue corundum), as well as jadeite “jade” (jadeitite), diamonds and natural pearls, have been the most sought-after gems for several centuries. Emerald is the bluish-green to green to yellowish-green variety of beryl (with an ideal formula of Be3Al2SiO18) coloured by chromium and/or vanadium (iron may also contribute to the colour, but to a lesser extent); beryl coloured solely by iron is green beryl (and not emerald) [1]. Transparent natural emeralds of homogenous vivid-green colour are the most researched. Most faceted gems are sold by carat (1 carat = 0.2 g), but their monetary value is not linearly correlated with their weight; bigger gems are rarer and can fetch higher prices. Absence or presence, type and degree of treatment are also important factors linked to gems’ monetary value. In the case of emeralds, most gem-quality faceted stones contain surface-reaching fissures and, some of them, also cavities. In order to improve their clarity, the vast majority of emeralds are “filled” with a material having a refractive index similar to that of emerald (oil, resin or other) that reduces the visibility of the fissures and, sometimes, the cavities [2,3,4]. The degree of emerald clarity enhancement, which is not always directly linked with the amount of filling material, ranges from none to significant, with the former being very rare and more desirable [5]. Geographic origin is frequently requested from gemmological laboratories by customers as it is used by gem dealers as a brand name, is sometimes linked with history, exoticism, spirituality, etc., and might play an important role in the monetary value of a gem [6,7,8,9,10,11,12,13,14,15,16,17,18,19,20,21,22,23]. In parallel, over the last two decades, ethical issues related to gem mining have been in the spotlight, and end consumers demand transparency about the mine-to-market supply chain, in addition to detailed information on stones’ provenance [23,24,25,26]. Origin determination for gems is also useful for archaeologists, curators, etc., as it can help them to better understand early trade routes [27,28,29,30,31,32,33,34,35,36,37,38,39,40].
Origin determination is based on gem characteristics linked to geological formation. However, gemmological laboratories are asked to issue reports mentioning a gem’s geographical origin, which is related to politics rather than geology [12,15]. Geographic origin determination is getting more complicated, considering that gems can grow in similar geologic environments but in different countries; e.g., emeralds associated with granites‒pegmatites and mafic‒ultramafic rocks as in Kafubu, Zambia; Malyshevsk (the Ural Mountains), Russia; Mananjary, Madagascar; etc. In parallel, a gem can grow in more than one geological environment in the same country; e.g., emeralds occur in Zambia in both Kafubu near Kitwe (associated with granites‒pegmatites and mafic‒ultramafic rocks; Type IA occurrence—see classification below) and Musakashi near Solwezi (in eluvial lateritic soils adjacent to quartz veins; Type IID occurrence—see classification below) [16,17,18,19,21,31,41,42].
Emerald is a relatively rare mineral because it needs common elements such as silicon (Si), aluminium (Al) and oxygen (O), together with less common elements (that are rarely encountered together) such as beryllium (Be)—enriched in the crust, chromium (Cr)—typically enriched in mantle rocks, and/or vanadium (V), with iron (Fe) in limited concentrations; however, it can be found on all continents except Antarctica [16,17,18,21]. Emeralds of gem quality and economic importance are not always formed though; several parameters play an important role in gem formation [43,44]. It is important to have the right ingredients in just the right amounts (as previously mentioned): favourable “thermobarometric conditions”, space to grow (with some exceptions), limited nucleation (i.e., few nuclei will evolve into a crystal) and stable growth conditions for a certain amount of time, but not for millions of years [44]. Importantly, post-growth phenomena that might damage the gem, such as mechanical fracturing, chemical etching, etc., should be absent [43].
A gemmological report with the origin for an emerald from a laboratory recognized by the international market can cost from ca. 100 up to 500 USD for gems <2 ct and >2000 USD for gems >50 ct, depending on the laboratory. Thus, gemmological laboratories receive principally medium- to high-quality “large” faceted (>0.5 ct and mostly >1 ct) emeralds “worth” an origin determination report. Nowadays these emeralds mostly come from Colombia (both the east and west side of central Cordillera), Zambia (Kafubu), Brazil (Itabira, Minas Gerais), Russia (Malyshevsk, the Ural mountains), Madagascar (Mananjary), Afghanistan (Panjsher Valley), Zimbabwe (Sandawana) and recently Ethiopia (Shakisso). In terms of monetary value, an emerald from Colombia fetches higher prices than an emerald of exactly the same size and quality from another country. Samples of similar size and quality other than Colombian fetch similar prices, but the traders still ask for an origin to be mentioned in the report.
The classification of emerald deposits is presented in several works, and recently an enhanced classification has been suggested [13,17,21]. According to this, the geological environment of the vast majority of occurrences producing gem-quality emeralds is classified as Type IA—tectonic‒magmatic-related hosted in mafic–ultramafic rocks [21]. Only emeralds from Colombia are classified as Type IIB; tectonic‒metamorphic-related hosted in sedimentary rock‒black shale and emeralds from Afghanistan (Panjsher Valley) are classified as Type IIC; tectonic‒metamorphic-related are hosted in metamorphic rocks [21].
Gemmological laboratories are issuing reports on emeralds (including origin determination), and coloured gems in general, after combining the results obtained by several methods [11,12,15,19,20]. The methods used should be non-destructive and rarely micro-destructive [45,46,47,48]. For the origin determination and characterization of emeralds, microscopy, FTIR (Fourier-Transform InfraRed) spectroscopy, UV-Vis-NIR (Ultraviolet-Visible-Near InfraRed) spectroscopy, chemistry such as EDXRF (Energy-Dispersive X-ray Spectroscopy), sometimes LA-ICP-MS (Laser Ablation–Inductively Coupled Plasma-Mass Spectrometry) as well as LIBS (Laser-Induced Breakdown Spectroscopy) and, in same cases, Raman and PL (photoluminescence) spectroscopy are used [6,7,11,12,15,19,20,23,31,40,41,42,49,50,51,52,53,54,55,56,57,58,59,60,61,62,63,64,65,66,67,68,69,70,71,72,73,74,75,76,77,78]. Oxygen isotopes as well as fluid inclusions are also used for their study (see [21] for more information and further references); however, these methods are currently rarely used by gemmological laboratories. Gem-quality emeralds present some characteristics that might help gemmological laboratories build an accurate database to trace the origin of an unknown sample, in contrast with some other gems which might be more challenging (e.g., sapphires). For instance, the majority of gem-quality emeralds are found in primary deposits [76]; they contain inclusions that are associated with their geology and, due to their crystal structure and chemistry, several minor and trace elements directly linked to their growth environments could be present.
For the present work, 62 samples from eight countries’ data were collected using LA-ICP-MS as well as UV-Vis-NIR, FTIR, Raman and PL spectroscopy. The data from the samples were compared, looking for potential differences linked to their geographical origin. This is the first study that combines all these methods on samples from the most important sources of gem-quality emeralds.

2. Materials and Methods

All 62 samples studied are listed in Table 1. Forty-three samples were rough, and small areas (“windows”) were cut and polished in order to acquire better spectroscopic and chemical data, four of them were oriented (i.e., cut and polished parallel and/or perpendicular to the c-axis) and fifteen were faceted (all from Brazil). Most of the samples studied had a green or dark green homogenous colour. All samples from Russia were light green; some of the samples from Brazil and Colombia were also light green. All samples from Russia presented numerous inclusions.
UV-Vis-NIR spectra were acquired using a Cary 5000 UV-Vis-NIR spectrometer (Varian Inc., Palo Alto, CA, USA) in the 250–1500 nm spectral range, with a spectral bandwidth and data interval of 0.7 nm and a scan rate of 60 nm/min for the UV-Vis region and a spectral bandwidth and data interval of 1.0 nm and a scan rate of 120 nm/min for the NIR region. Polarized spectra using a diffraction grating polarizer were acquired on the oriented samples.
FTIR spectra were acquired from 8000 to 300 cm−1 using a Nicolet iS5 spectrometer (Thermo Fischer Scientific, Waltham, MA, USA) with 4 cm−1 resolution and 500 scans (background spectra were collected using the same parameters). Most of the spectra were unpolarized (or partially oriented); i.e., acquired on randomly oriented samples; positioned to maximize the signal. The c-axis of unoriented samples was checked so that none of the spectra were acquired with the beam parallel to the axis.
The absorption coefficient (a) was plotted to all UV-Vis-NIR and FTIR spectra. This was calculated using the formula a = 2.303 A/d, where A is the absorbance and d is the path length (or sample thickness for measurements on parallel polished windows) in cm.
Raman spectra were acquired using a Renishaw inVia spectrometer (Renishaw plc, Wotton-under-Edge, Gloucestershire, UK) from 100 to 2000 cm−1 and from 3300 to 3950 cm−1, coupled with an optical microscope, 514 nm excitation wavelength (diode-pumped solid-state laser), 1800 grooves/mm grating, notch filter, 40-micron slit, a spectral resolution of around 2 cm−1 and calibrated using a diamond at 1331.8 cm−1. For the 100–2000 cm−1 range, 40 mW laser power on the sample was used to acquire all Raman spectra (except for one sample from Colombia and one sample from Afghanistan, where a laser power of 8 mW was used to avoid spectra saturation linked to high sample luminescence), 50× short distance objective lens, an acquisition time of 20 s and five accumulations. As for the 3300–3950 cm−1 range, laser power of 0.8 mW on the sample was used to acquire all Raman spectra, 50× short distance objective lens, an acquisition time of 10 s (except for one sample from Colombia, where an acquisition time of 5 s was used) and 60 accumulations (except for the aforementioned sample from Afghanistan, where 40 accumulations were used).
Photoluminescence spectra from 550 to 900 nm were acquired on the samples using the Raman spectrometer with a 0.04 mW laser power on the sample, 50× short distance objective lens and an acquisition time of 10 s; different parameters were used for a sample from Afghanistan: 0.00008 mW laser power and an acquisition time of 20 s. Most spectra were acquired parallel and perpendicular to the samples’ c-axis; the c-axis was positioned using a polariscope and a conoscope.
LA–ICP-MS chemical analysis was performed using an iCAP Q (Thermo Fisher Scientific; Waltham, MA, USA) Inductively Coupled Plasma-Mass Spectrometer (ICP-MS) coupled with a Q-switched Nd: YAG Laser Ablation (LA) device operating at a wavelength of 213 nm (Electro Scientific Industries, Fremont, CA, USA). A laser spot of 40 μm in diameter was used, along with a fluence of around 10 J/cm2 and a 10 Hz repetition rate. The laser warmup/background time was 20 s, the dwell time was 30 s, and the washout time was 50 s. For the ICP-MS operations, the forward power was set at ~1550 W, the typical nebulizer gas (argon) flow was ~1.0 L/min and the carrier gas (helium) set at ~0.80 L/min. The criteria for the alignment and tuning sequence were to maximize the beryllium (Be) counts and keep the ThO/Th ration below 2%. NIST 610 and NIST 612 glasses were used for calibration standards. The time-resolved signal was processed in Qtegra ISDS software (version 2.10, Thermo Fisher Scientific; Waltham, MA, USA) using silicon (29Si) as the internal standard, applying 31.35 wt % theoretical value for beryl. The limits of detection (LOD) and limits of quantification (LOQ) for each of the abovementioned elements are shown in Table 2. These limits differ from day to day (for every set of measurements), so they are presented as ranges, from the lowest to the highest. Three spots were analysed on every sample and five were analysed on samples from Ethiopia and Zimbabwe. The measured points were checked under a microscope (Nikon, Shinagawa, Tokyo, Japan) to make sure they are on green zones without inclusions (however, the presence of micro-inclusions cannot be completely ruled out).
The amount of water in emeralds is difficult to measure directly. However, it was found to be linked to Na2O concentration [79] and can be calculated using the following equation: H2O wt % = 0.5401 × ln(Na2O wt %) + 2.1867 [80].

3. Results and Discussion
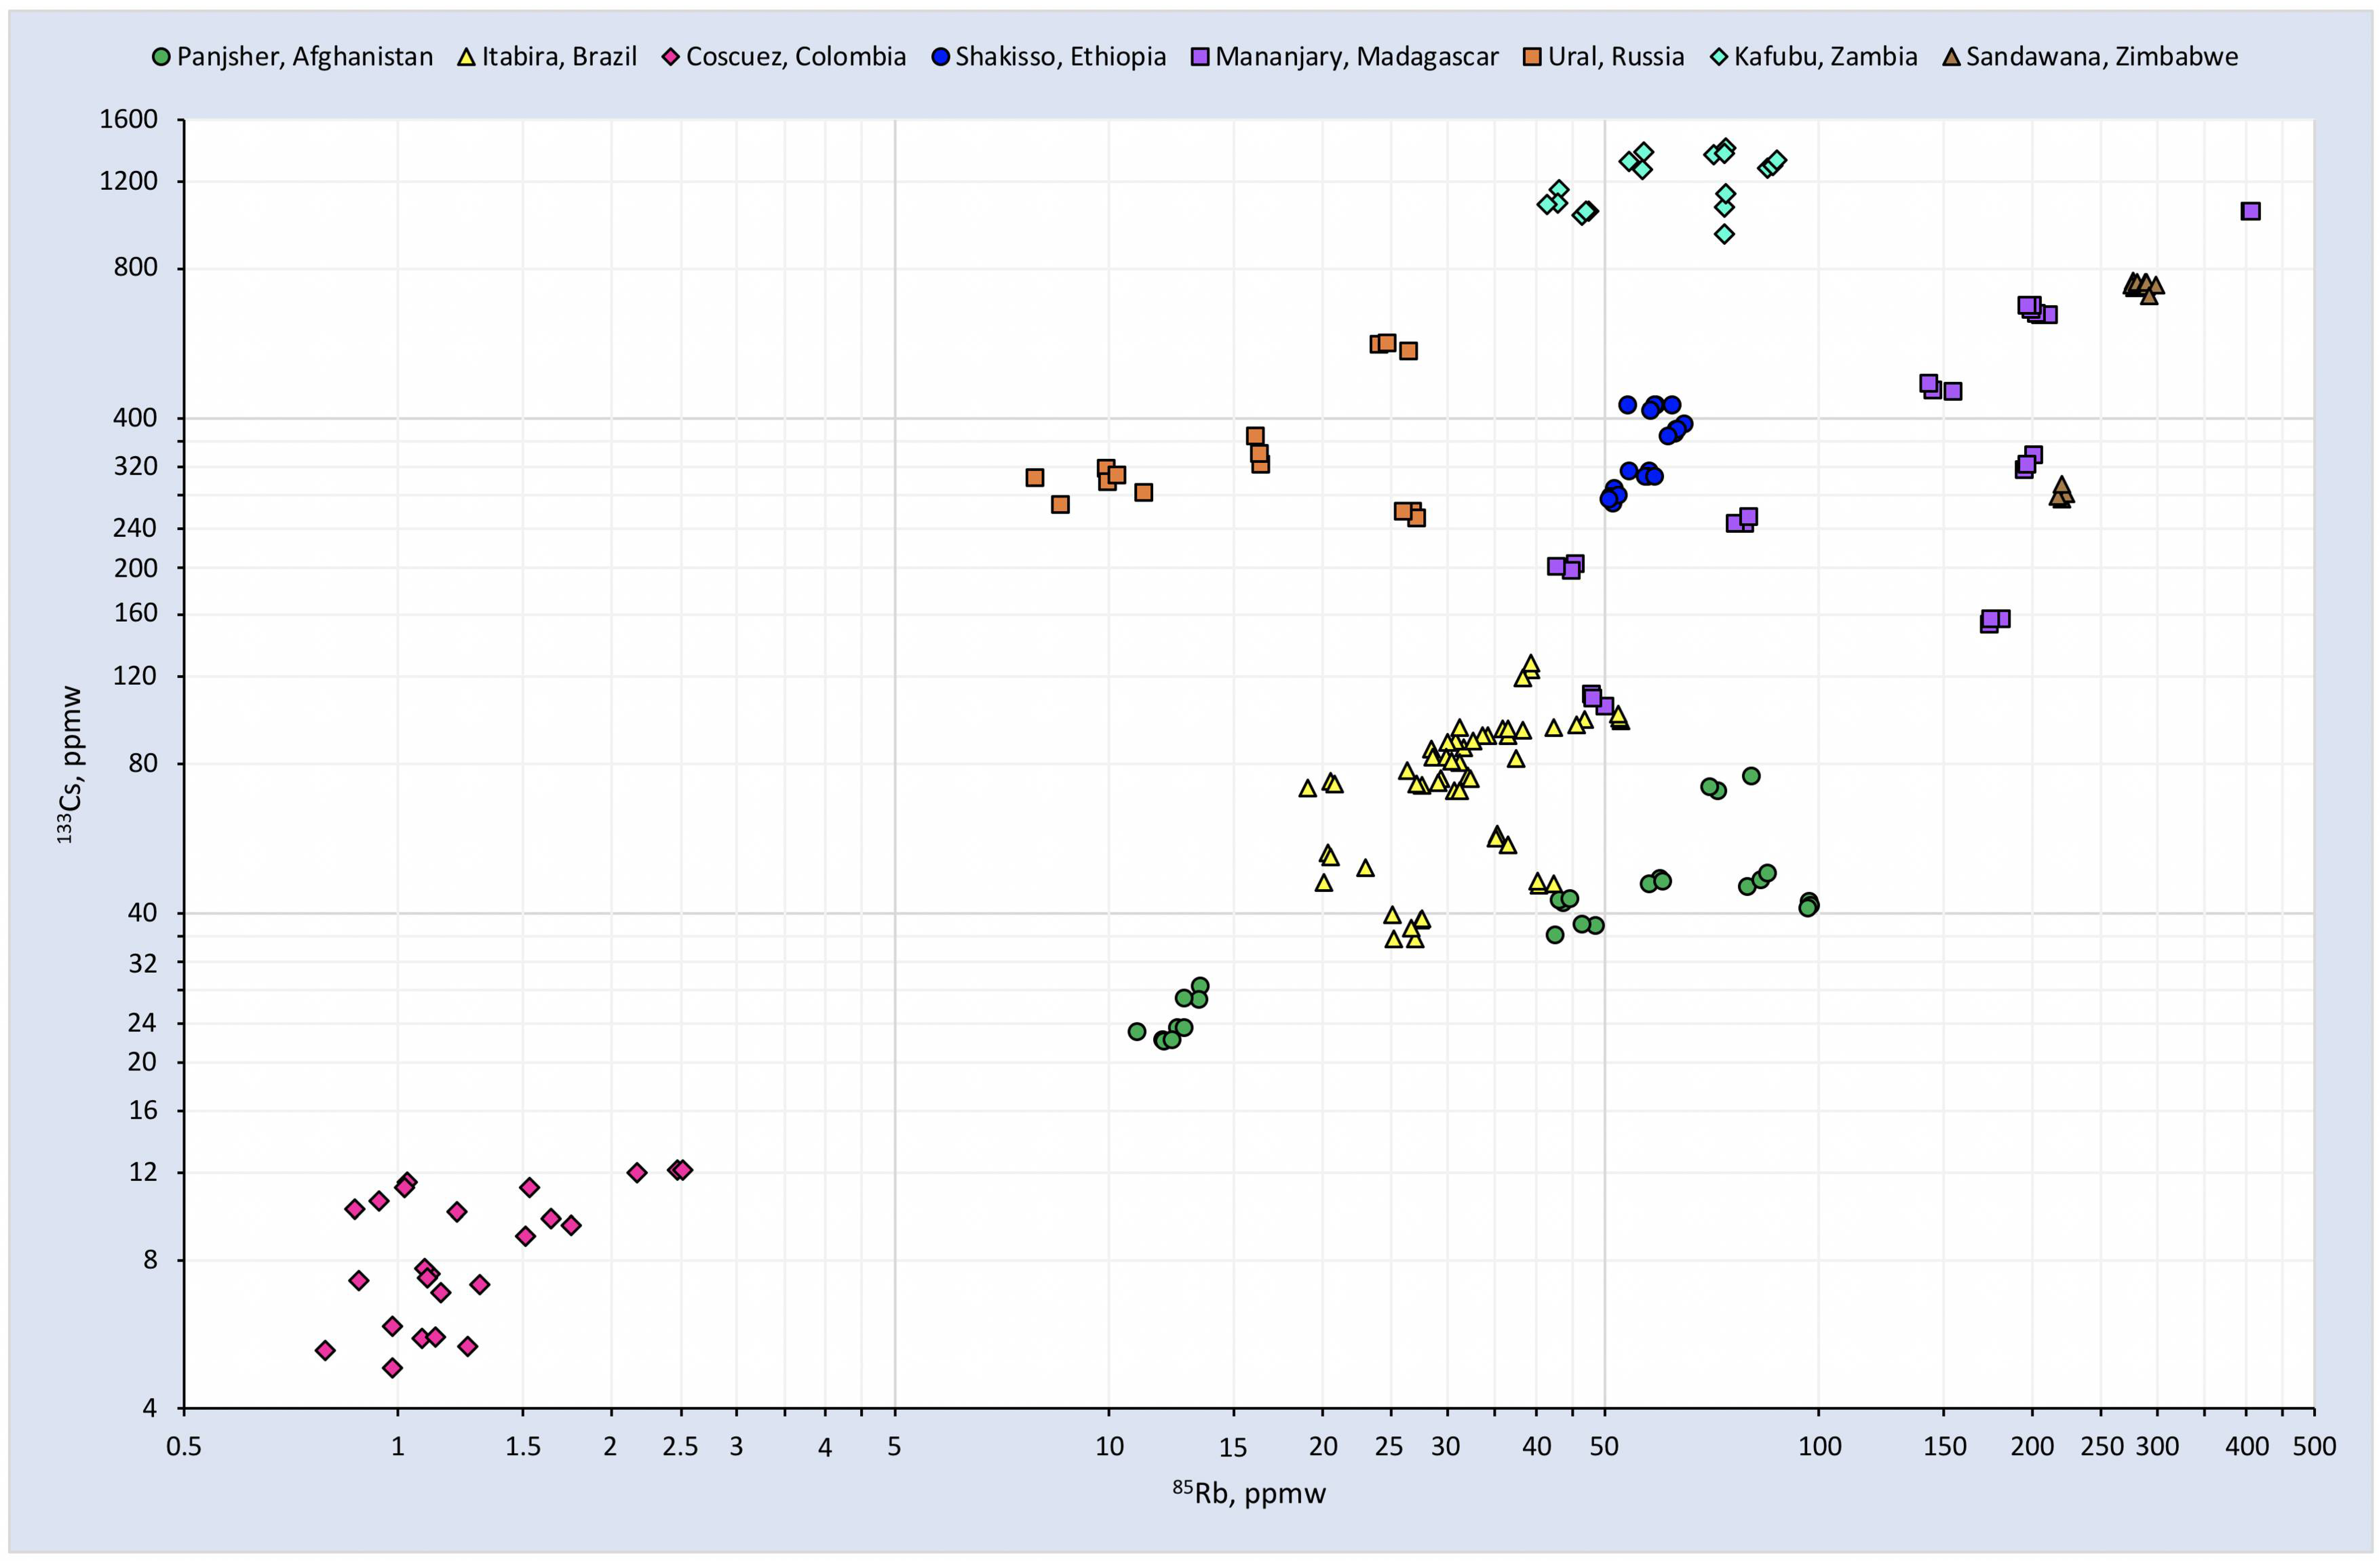
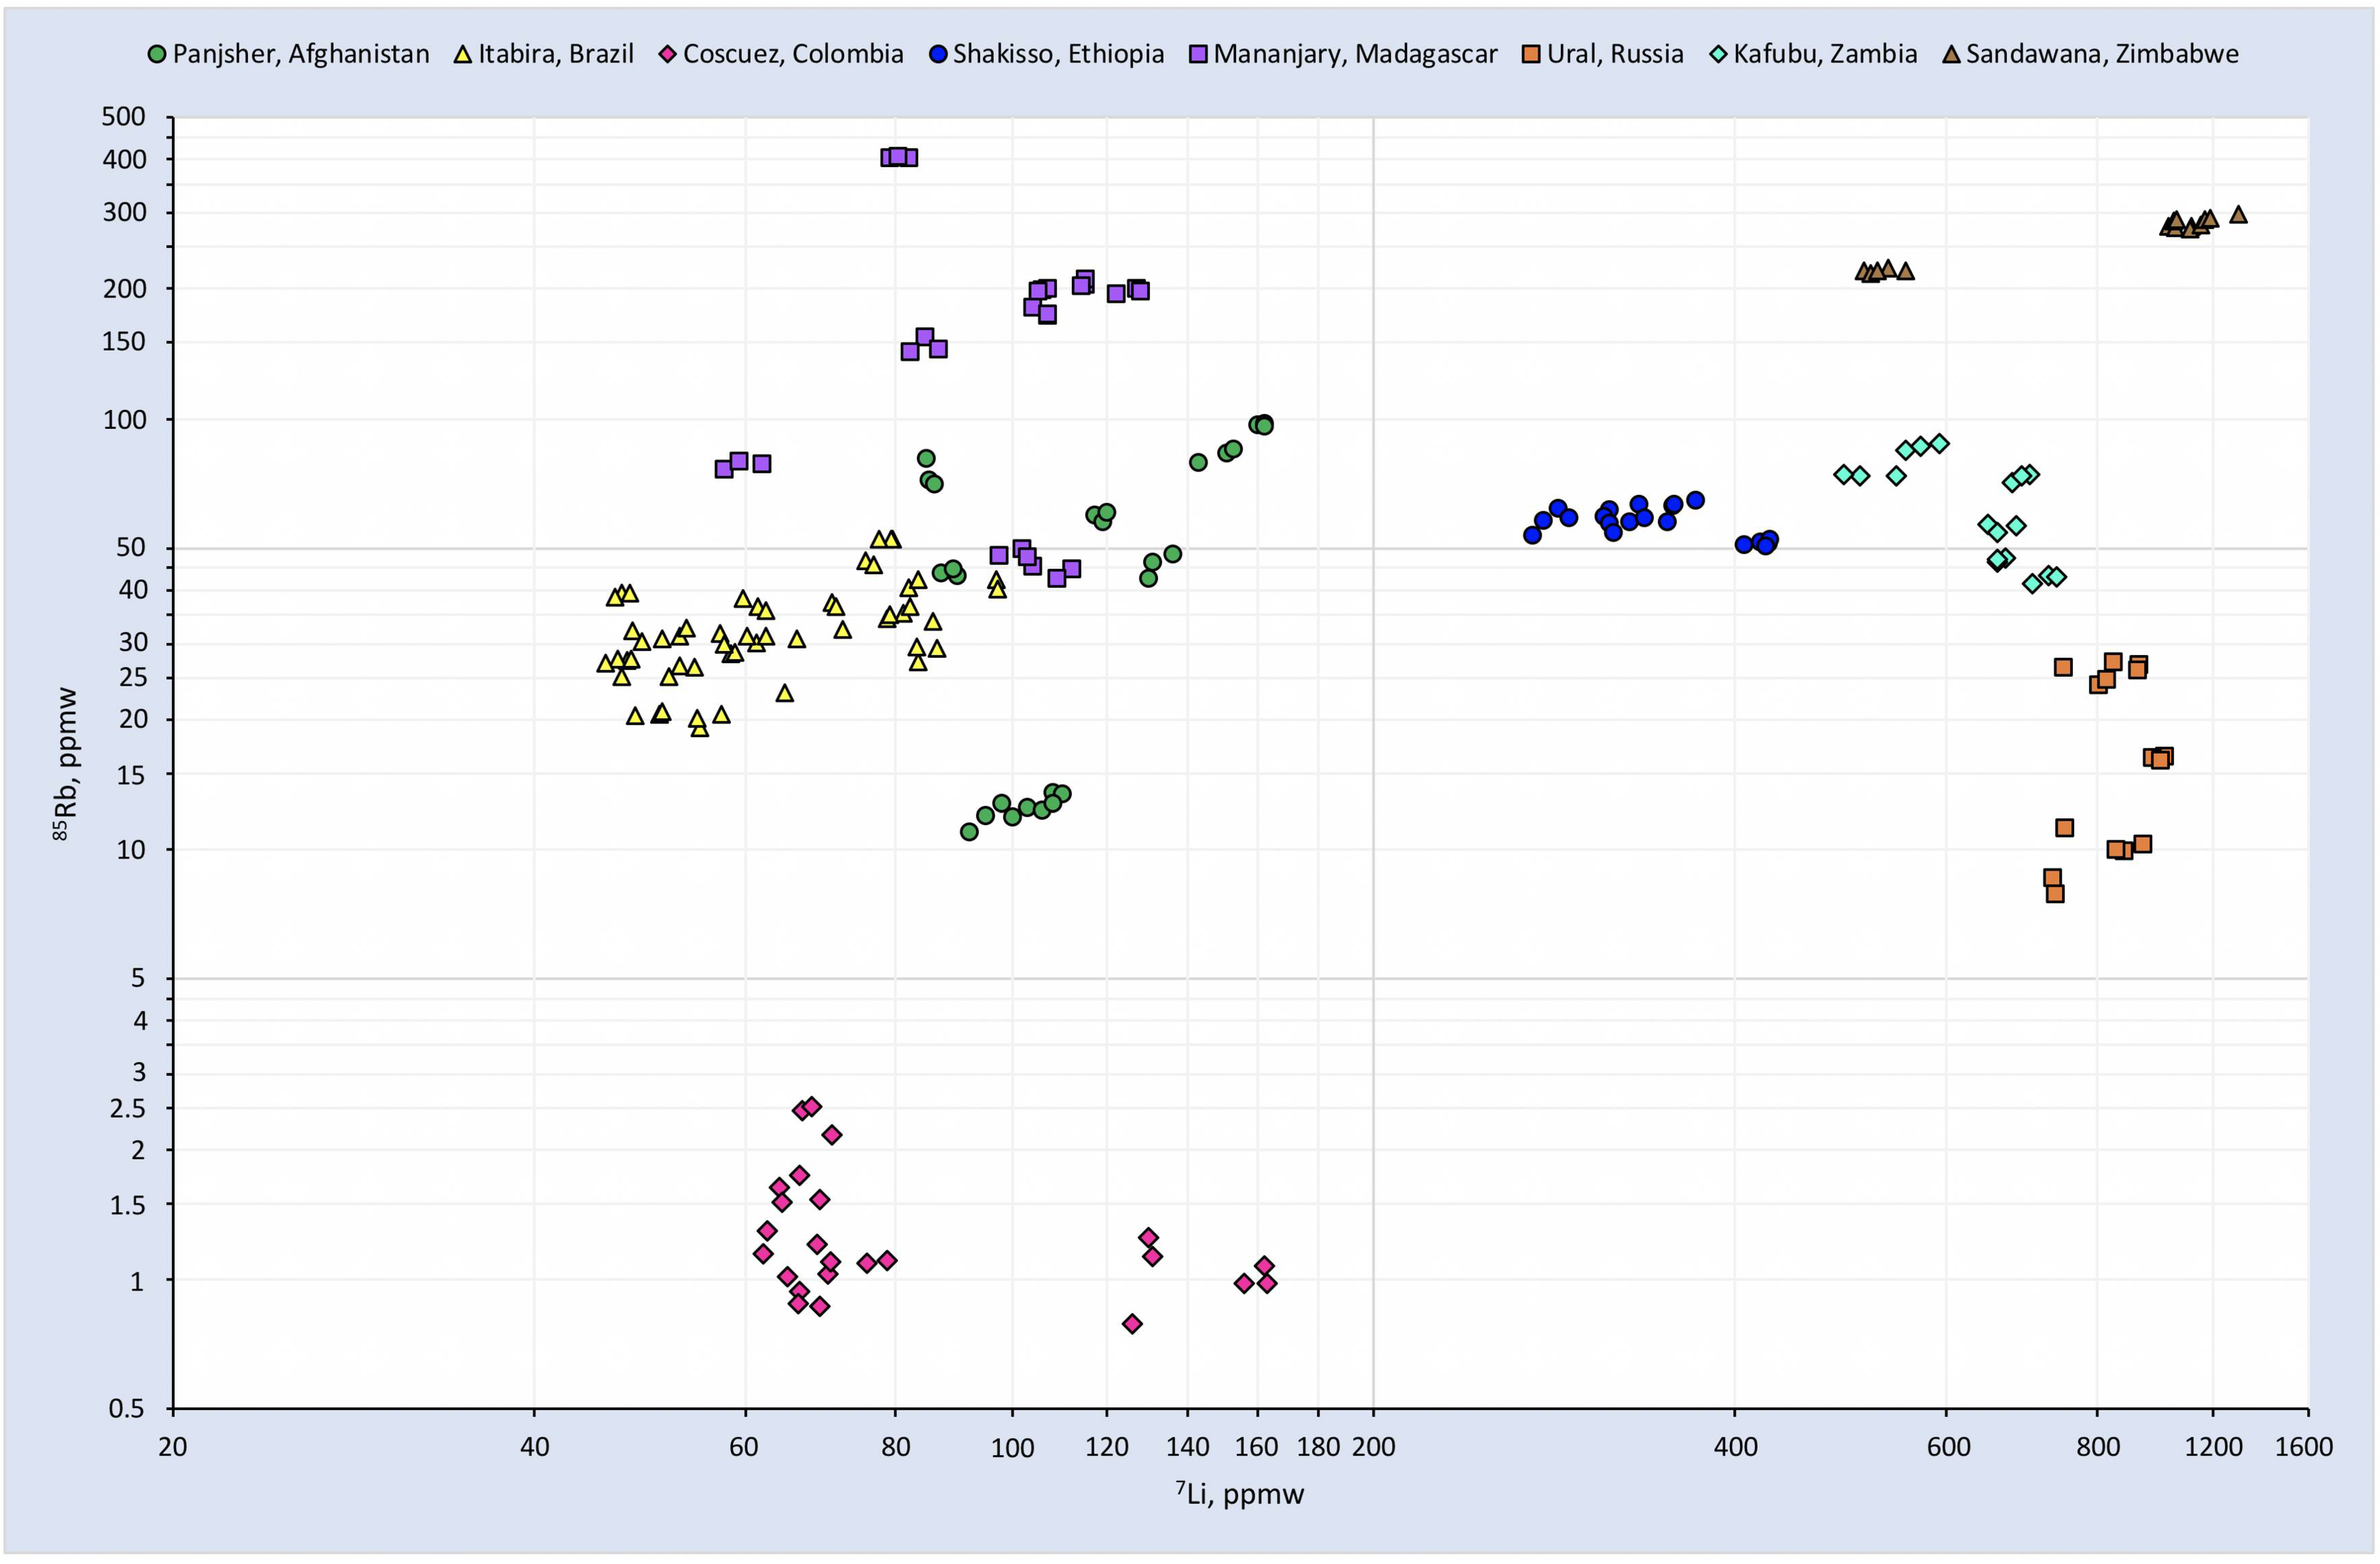
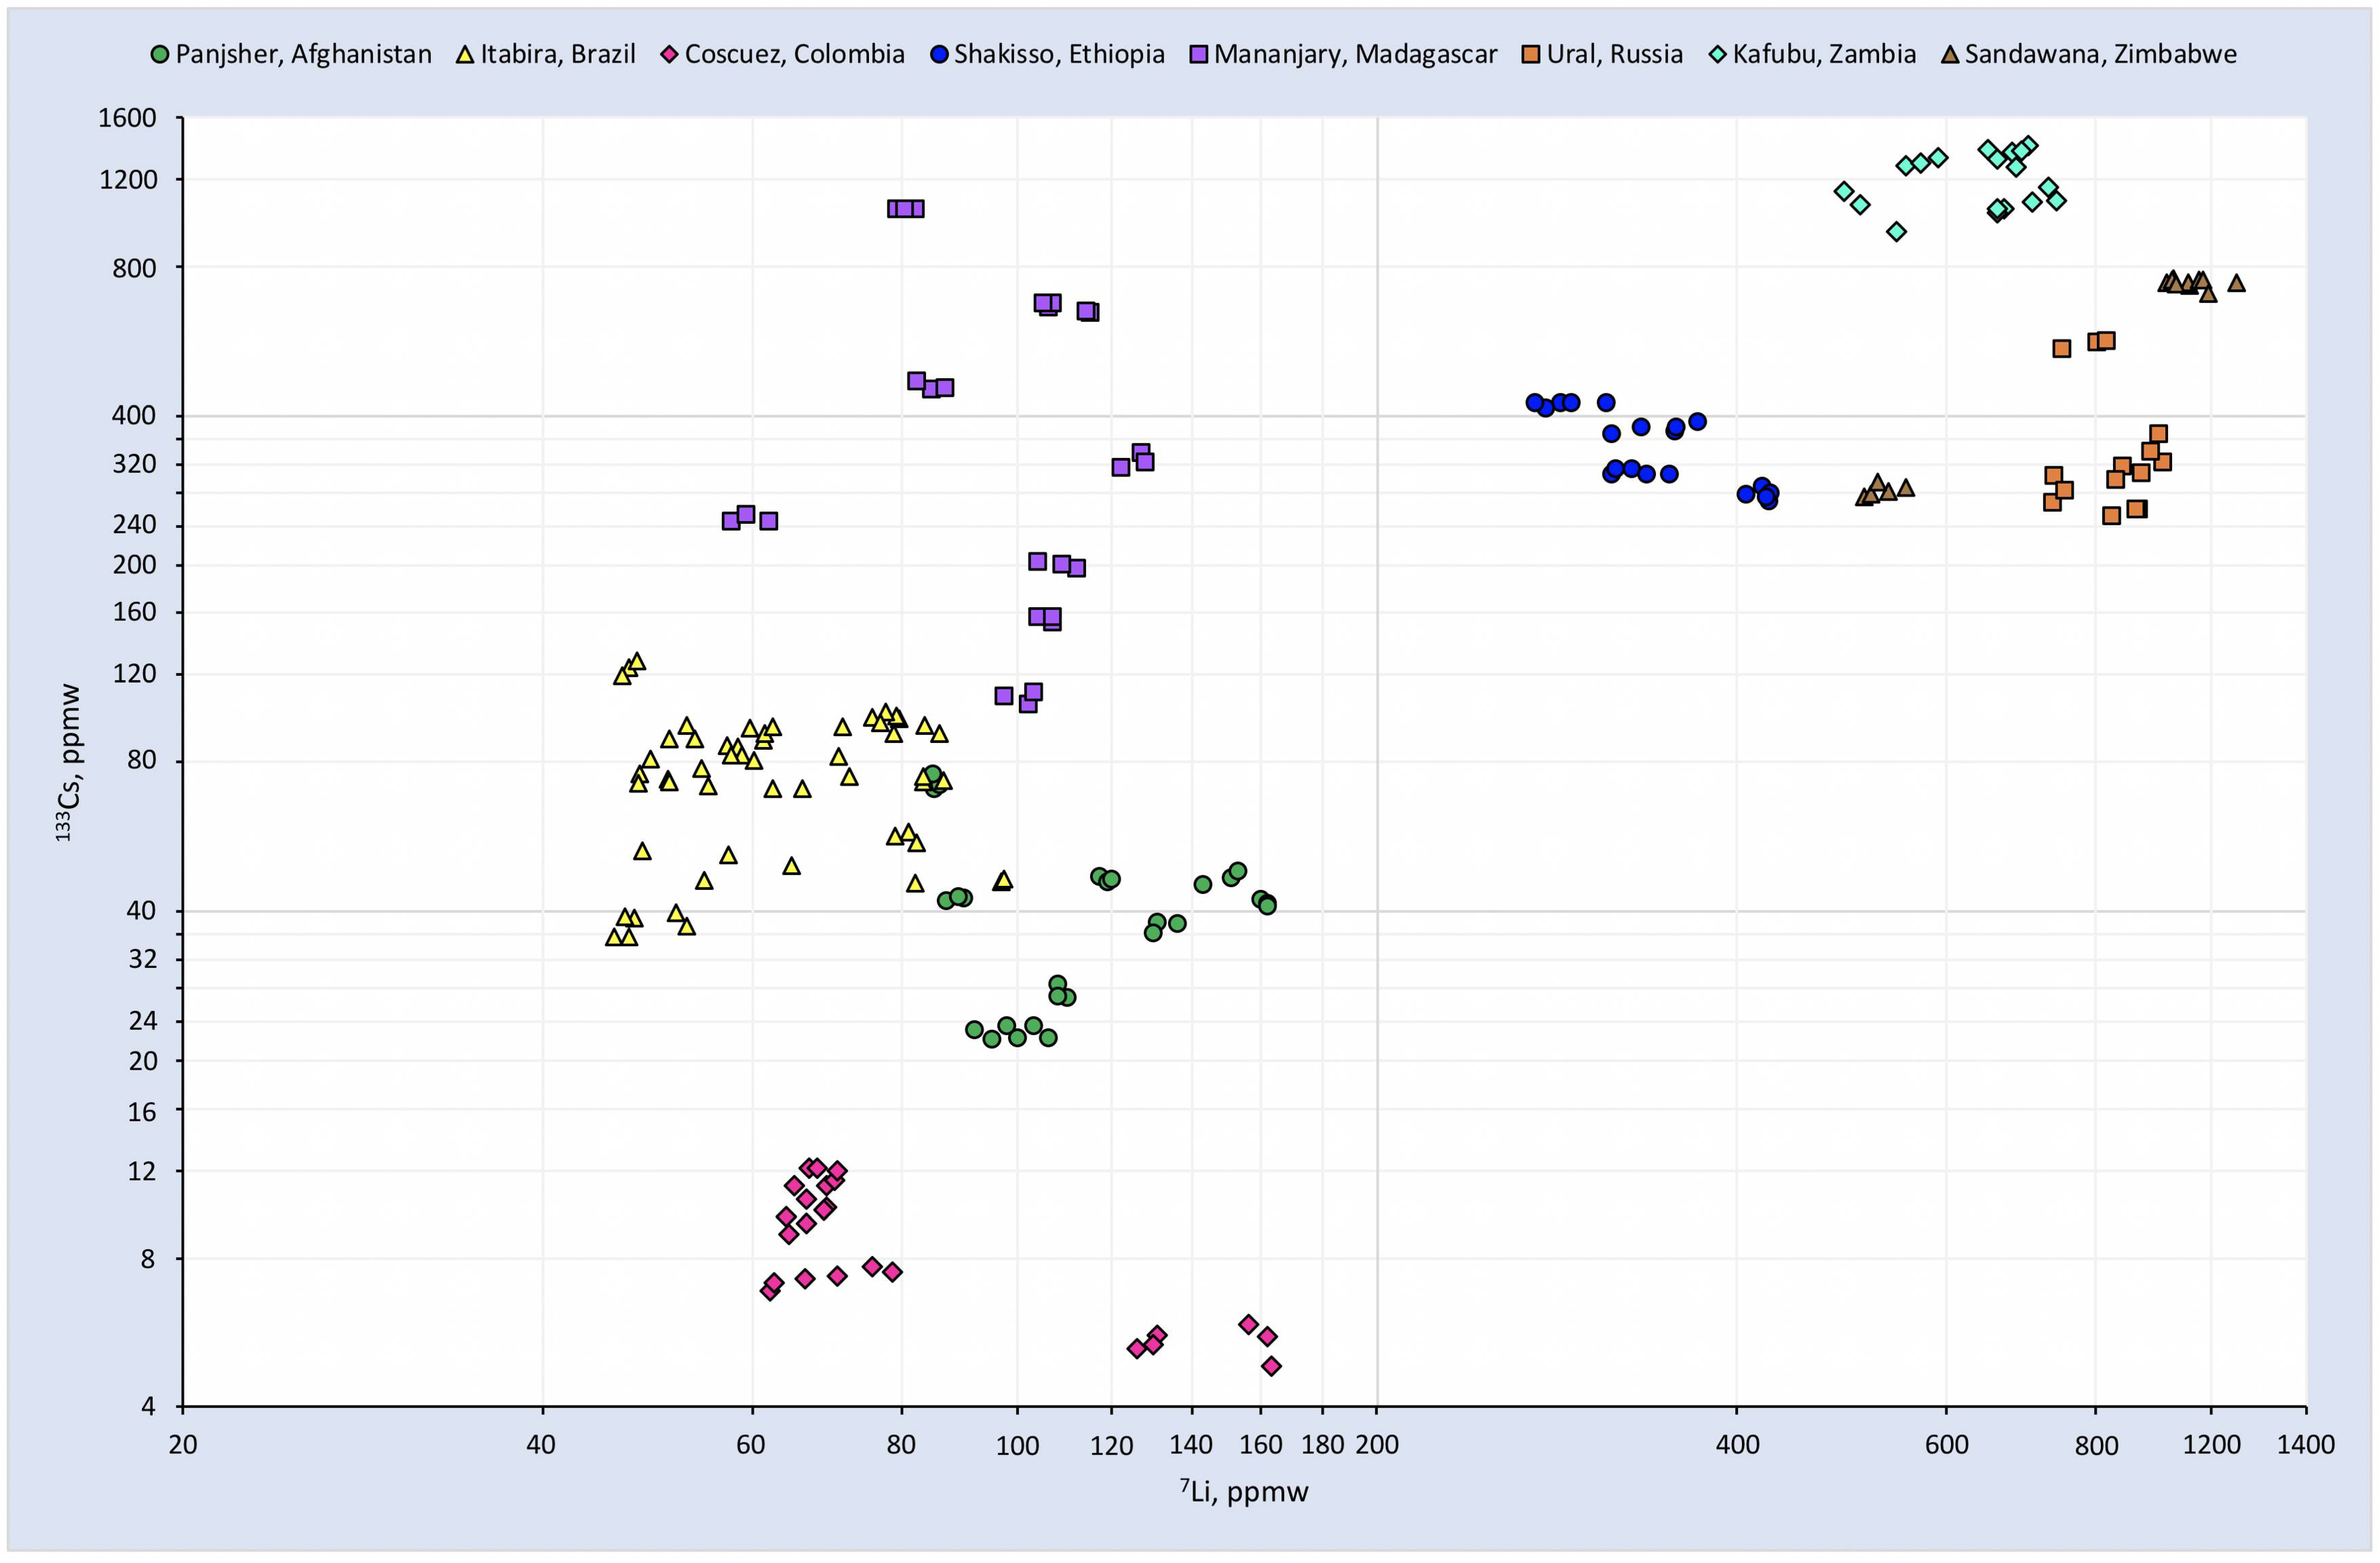
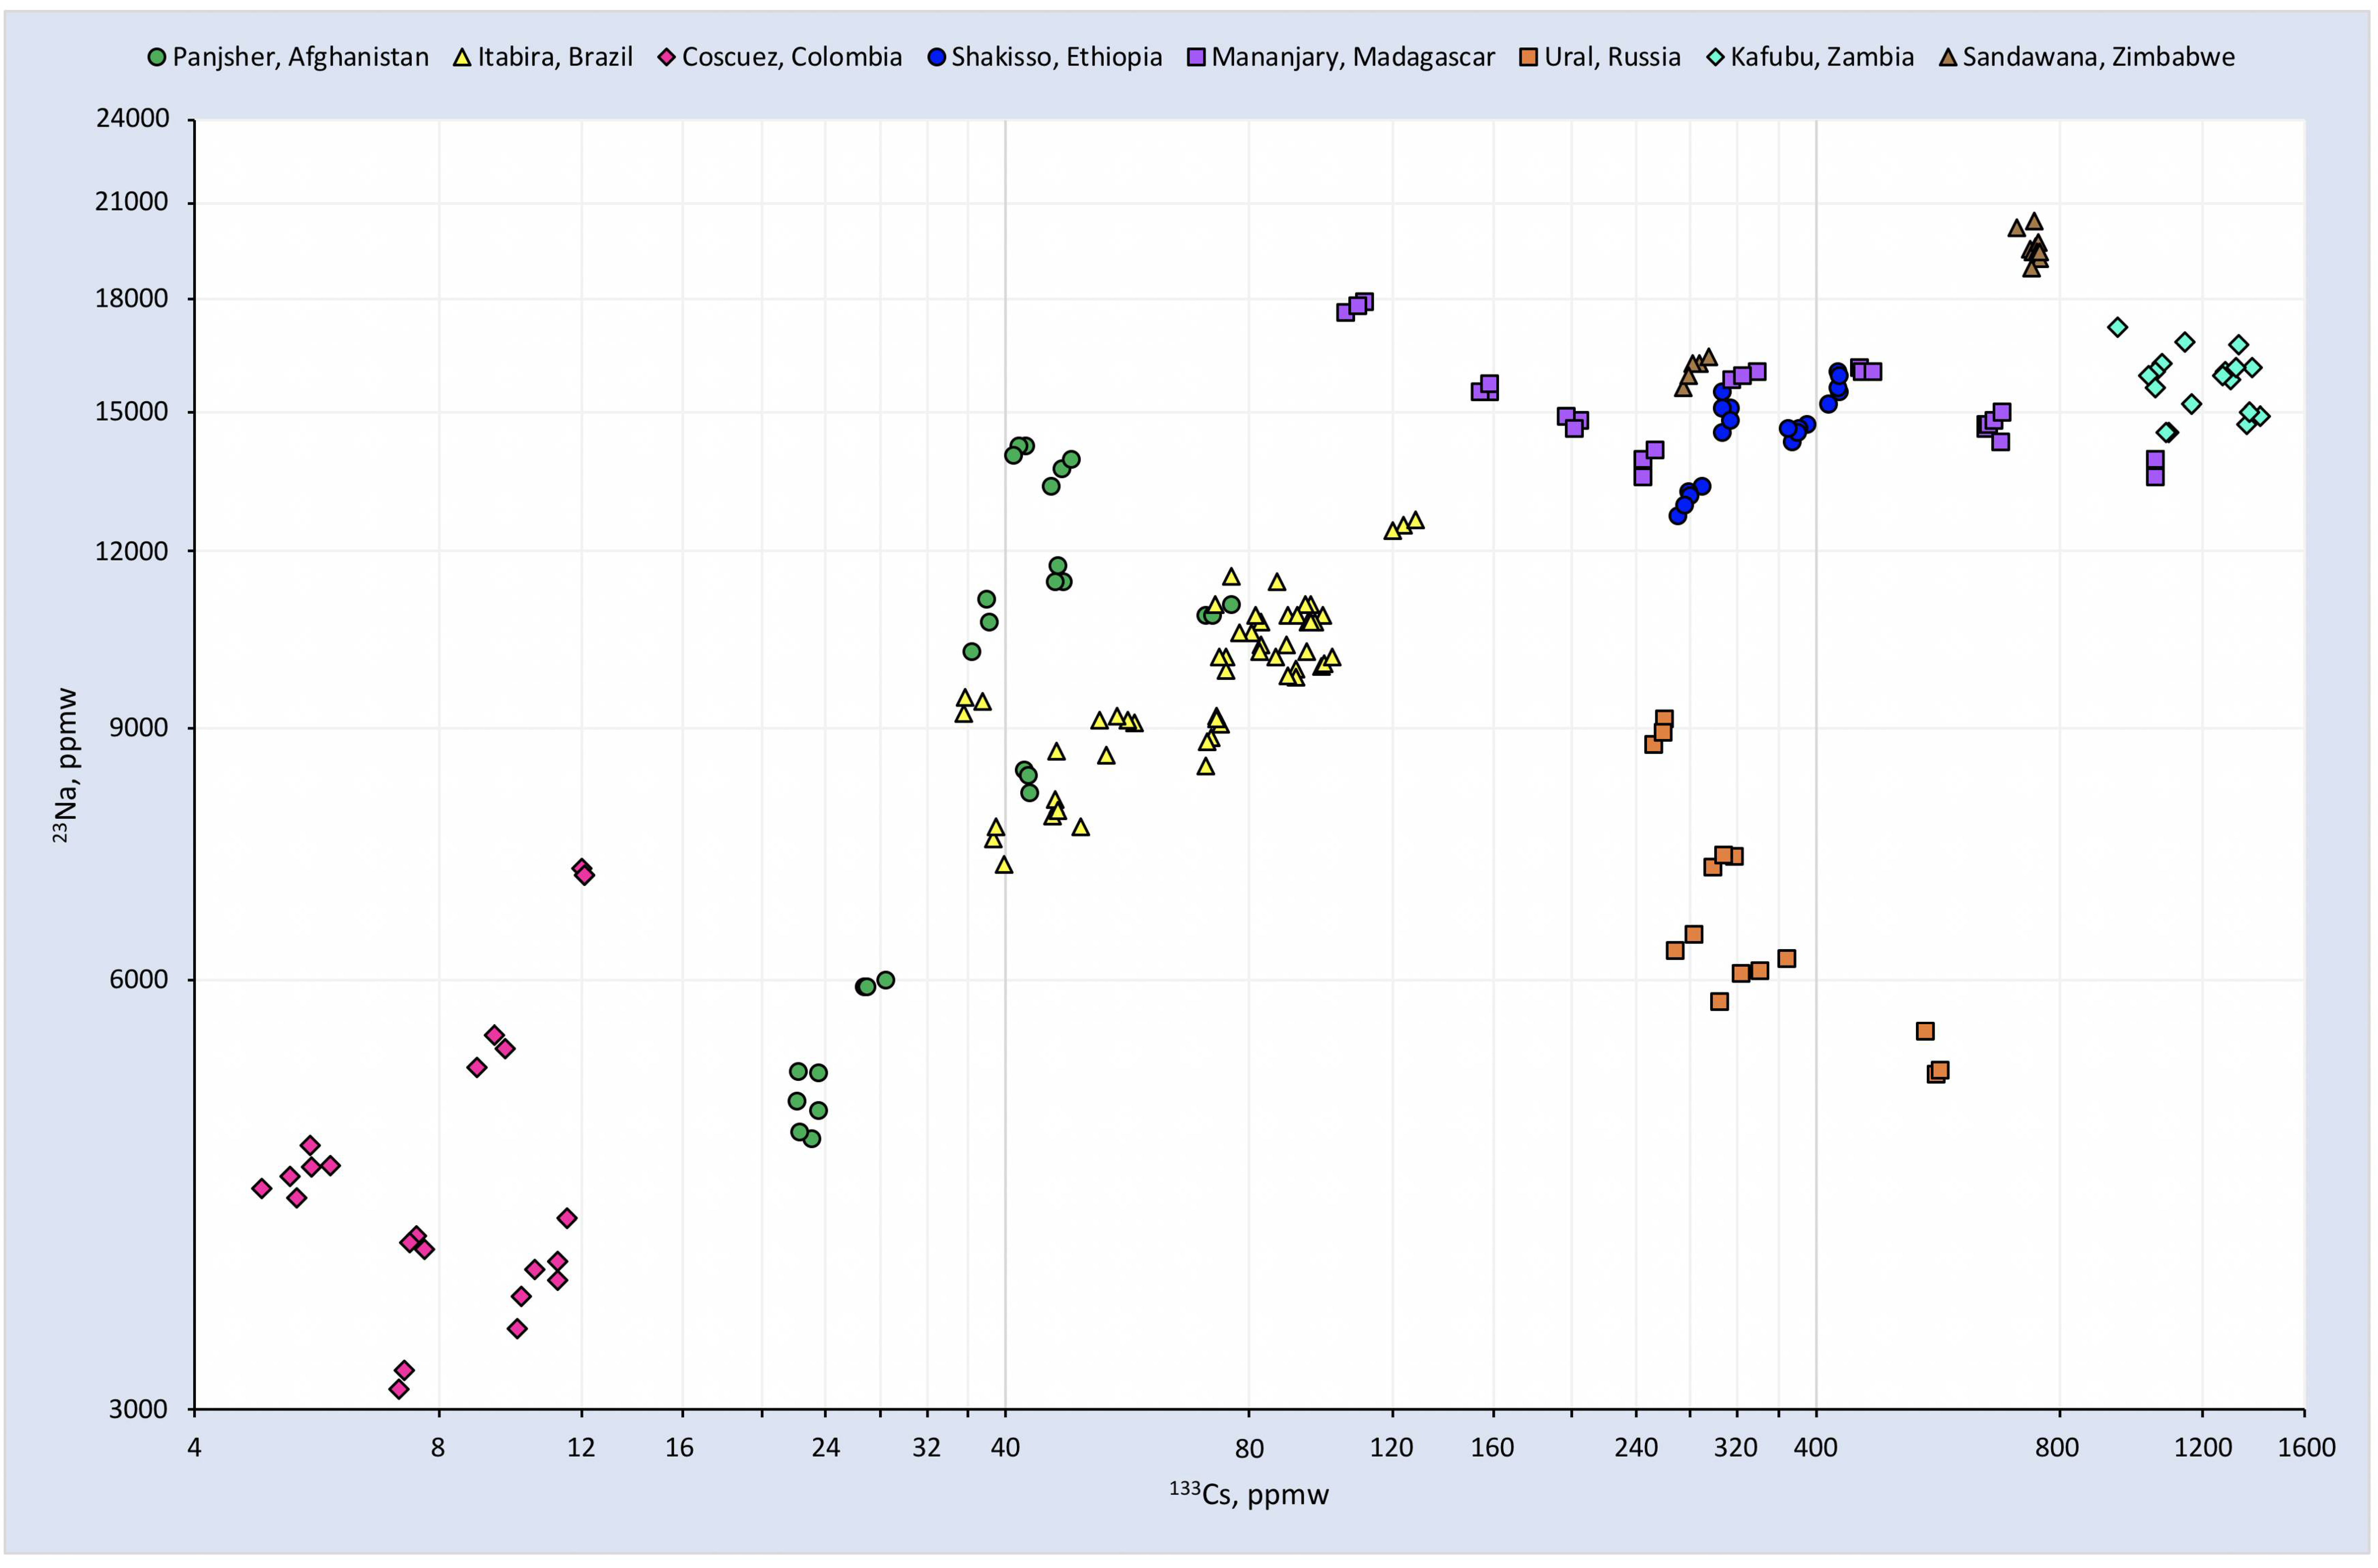
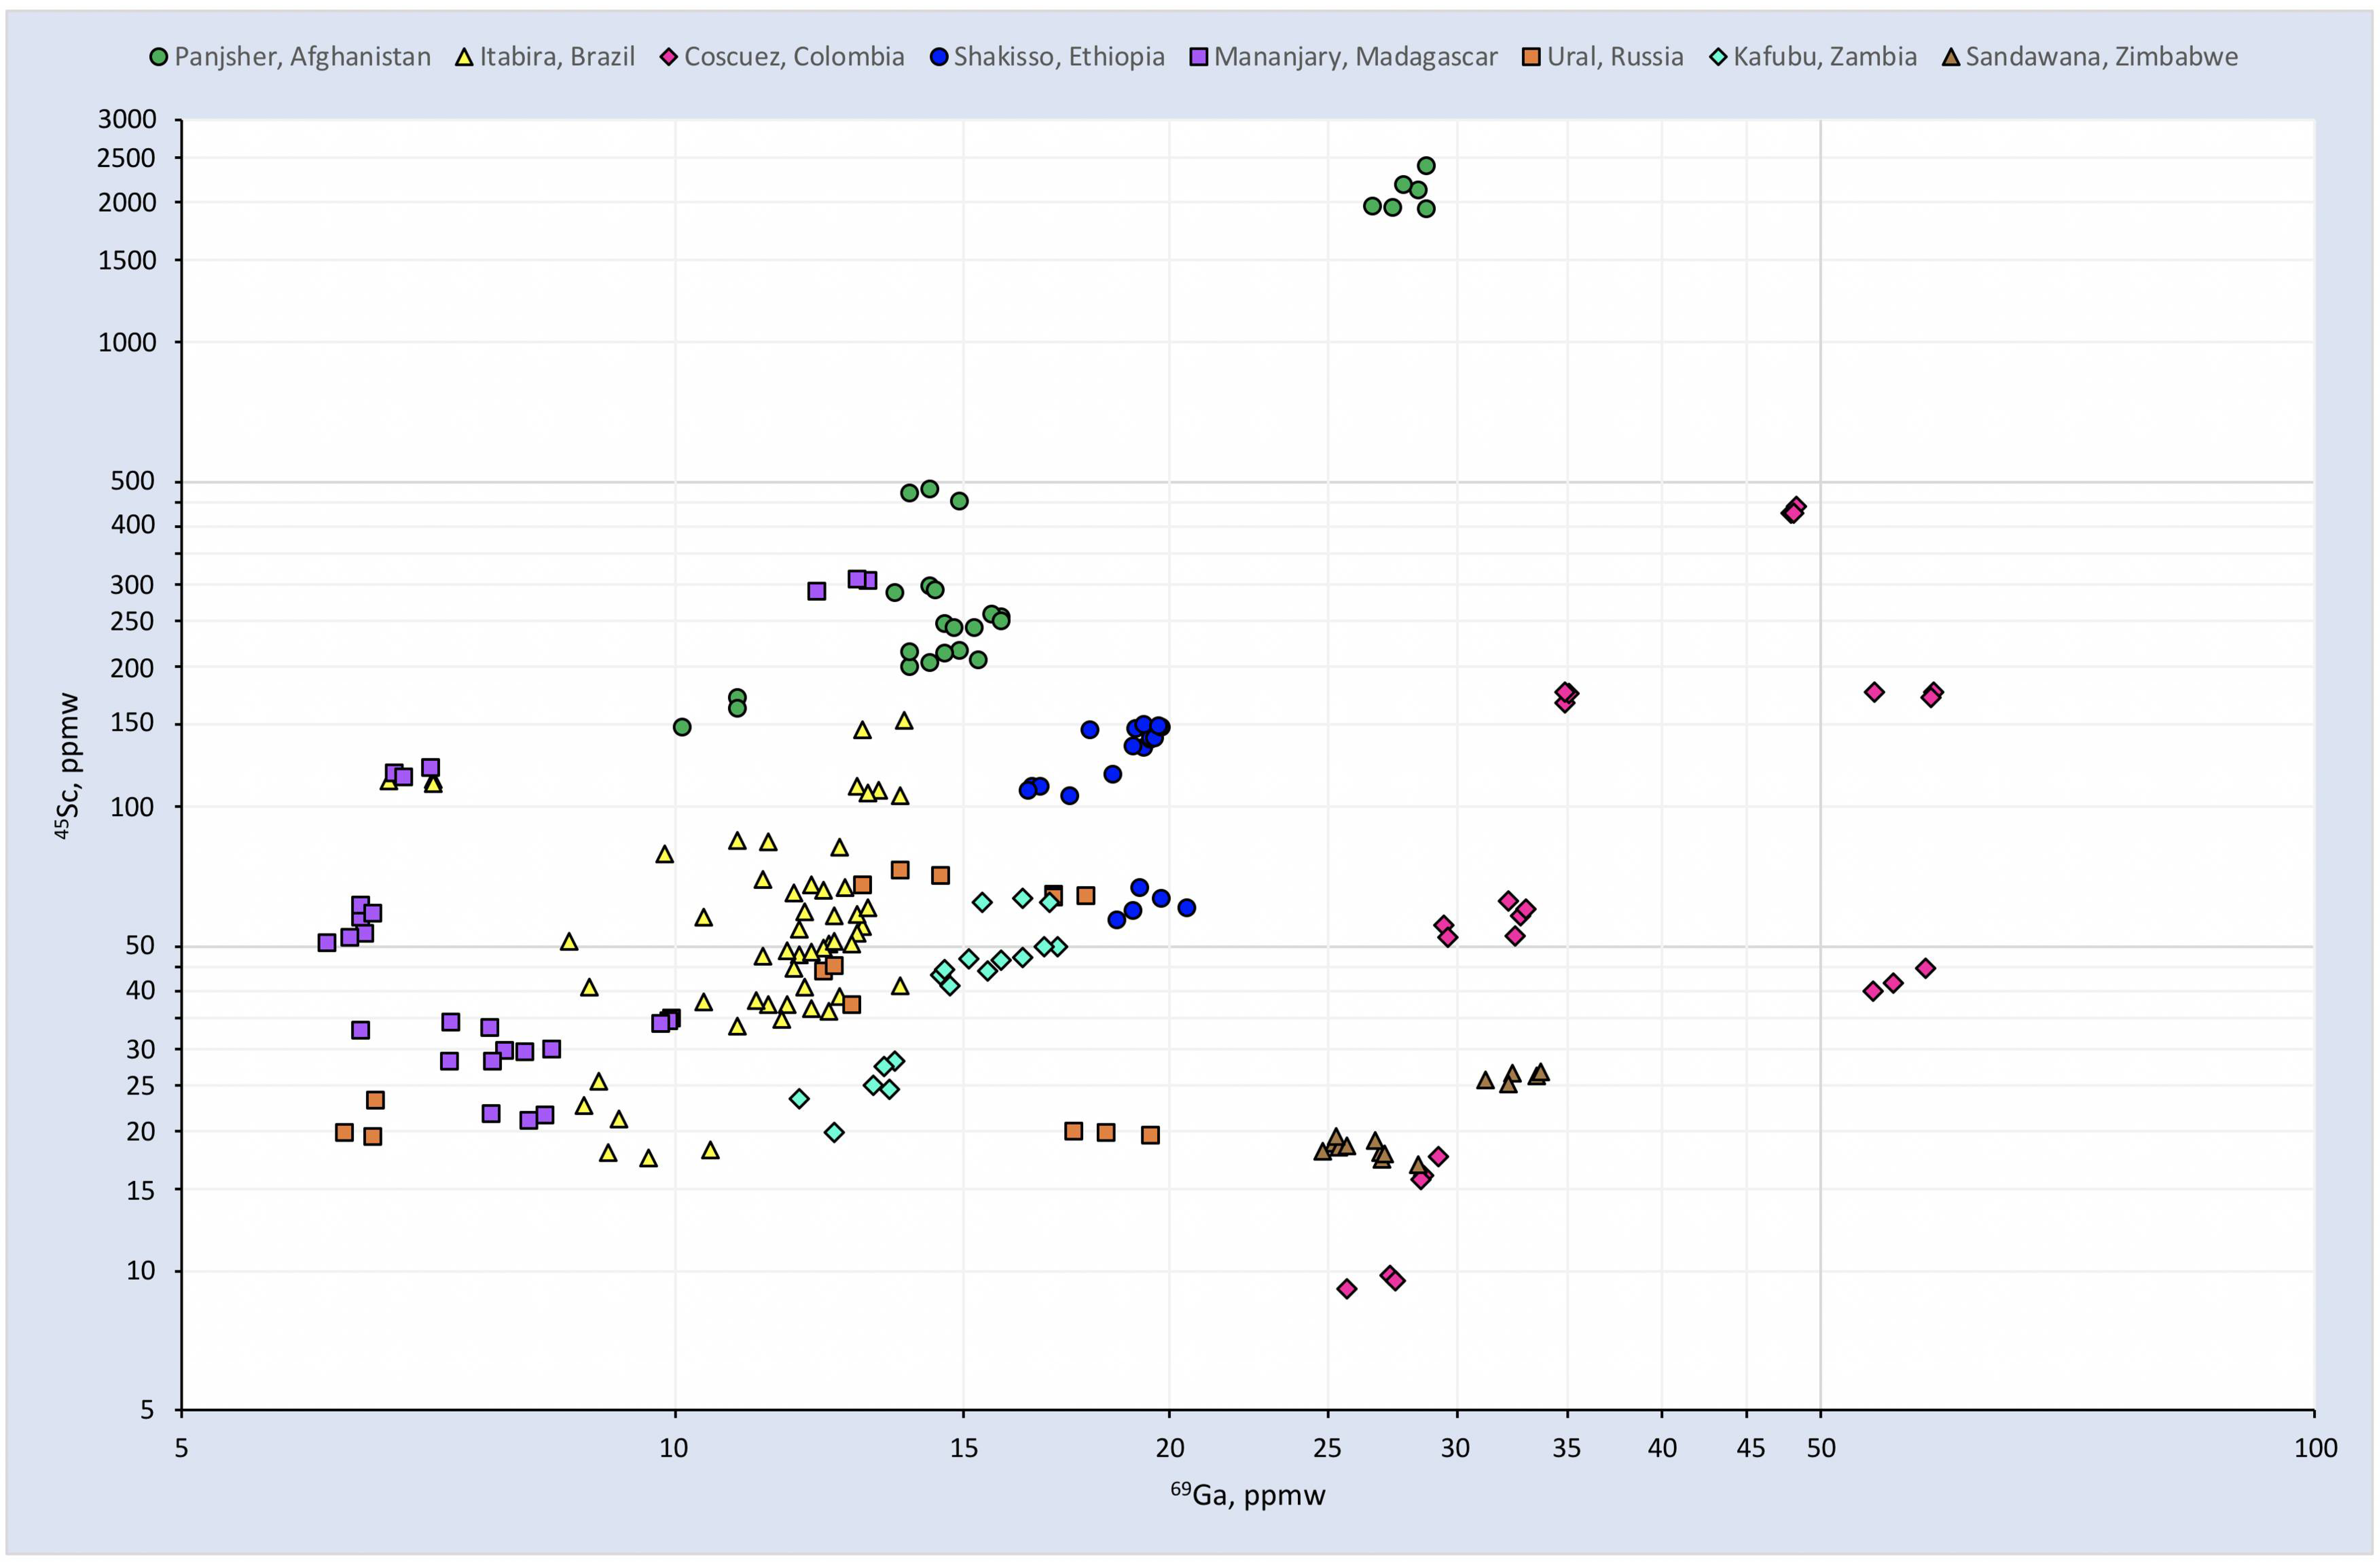
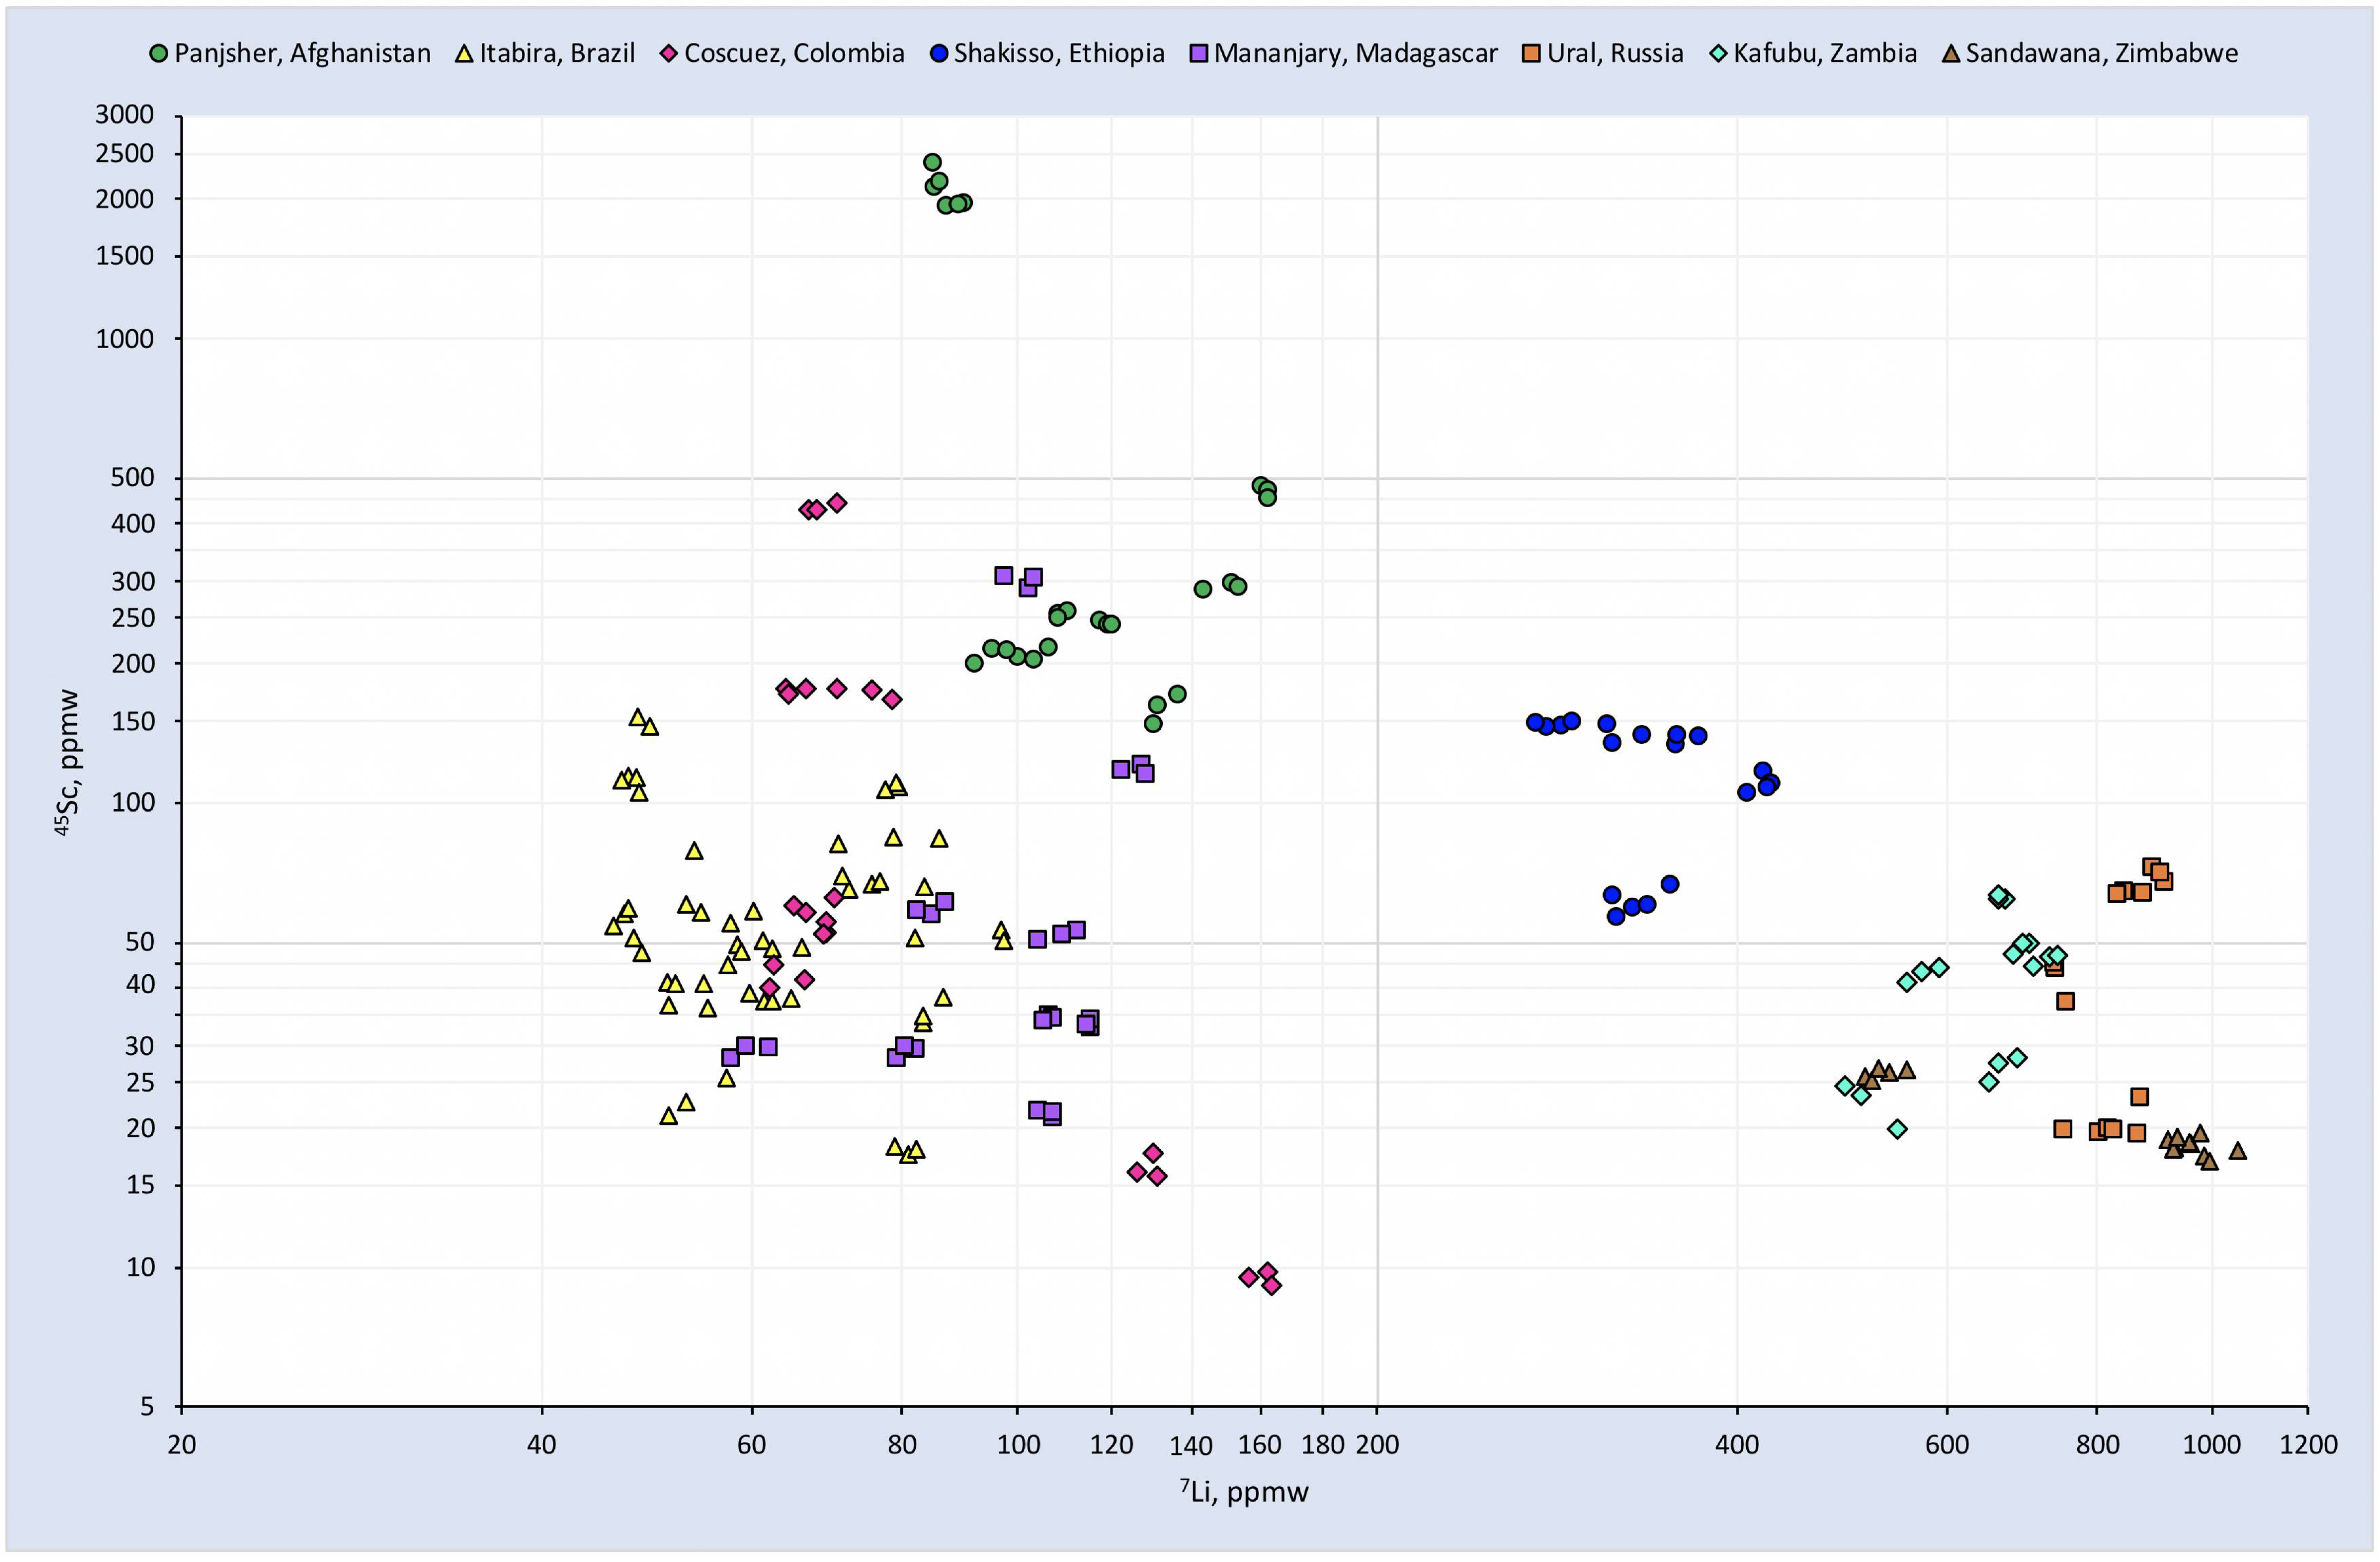
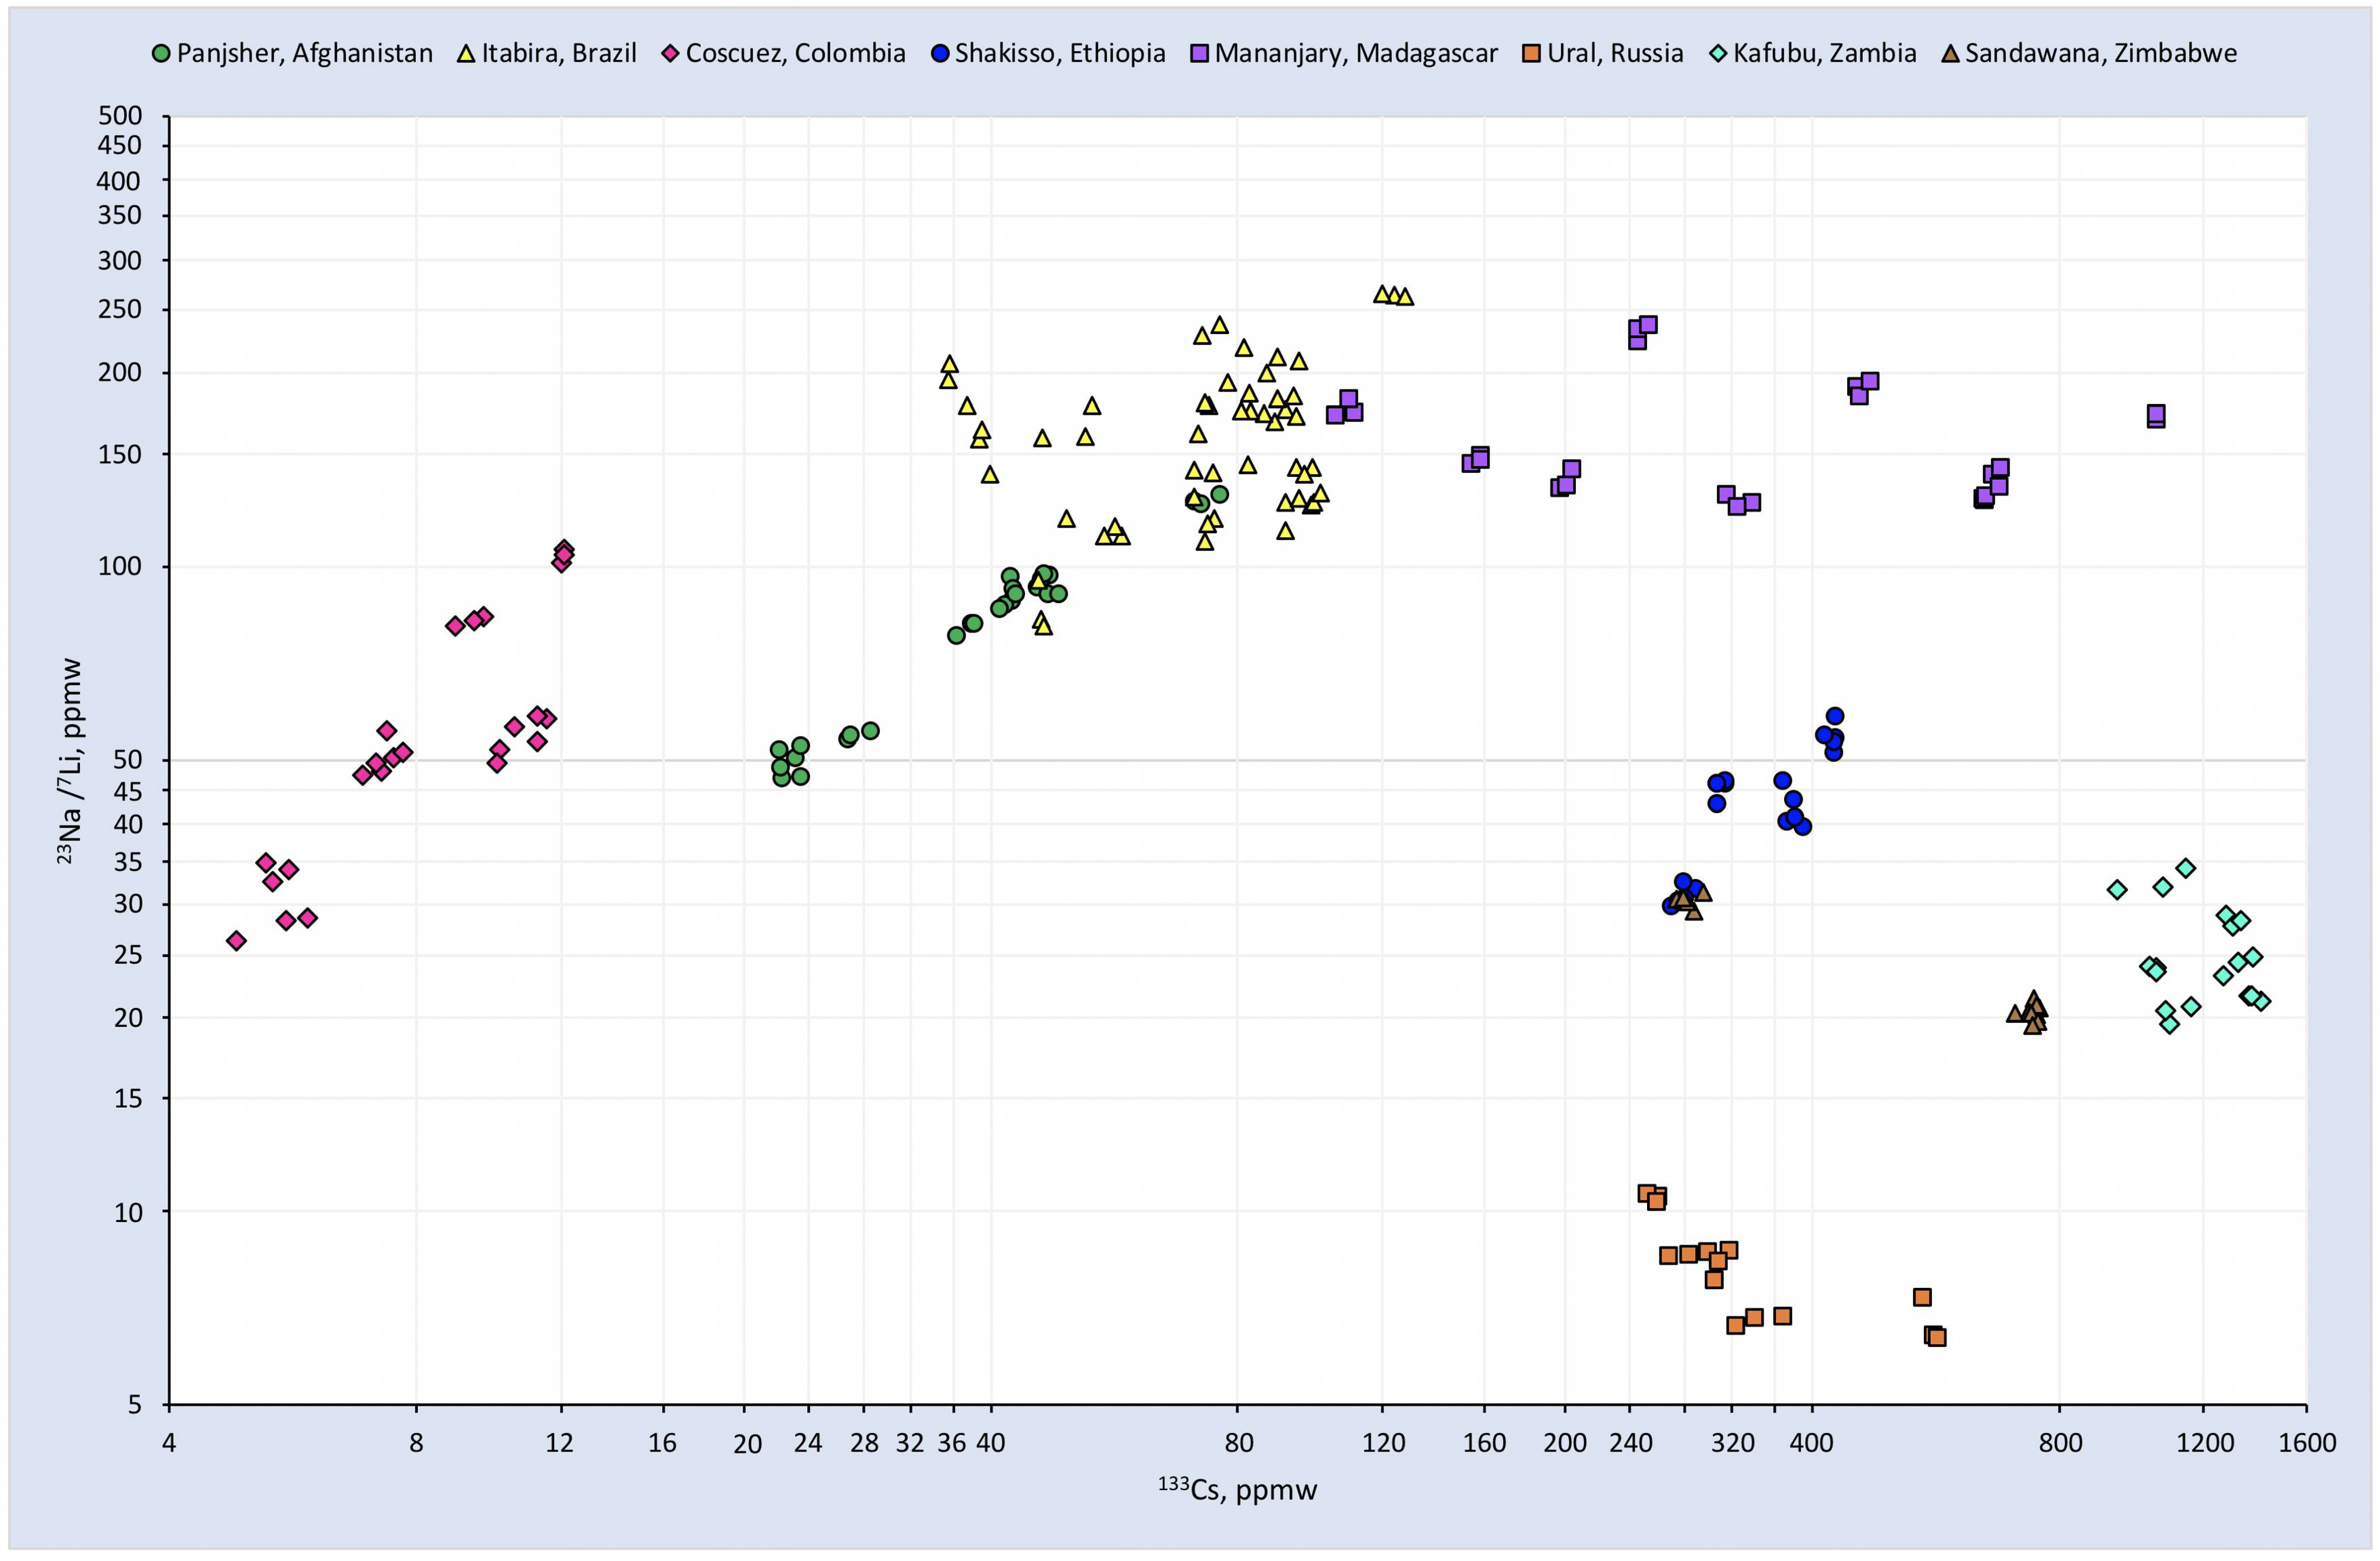
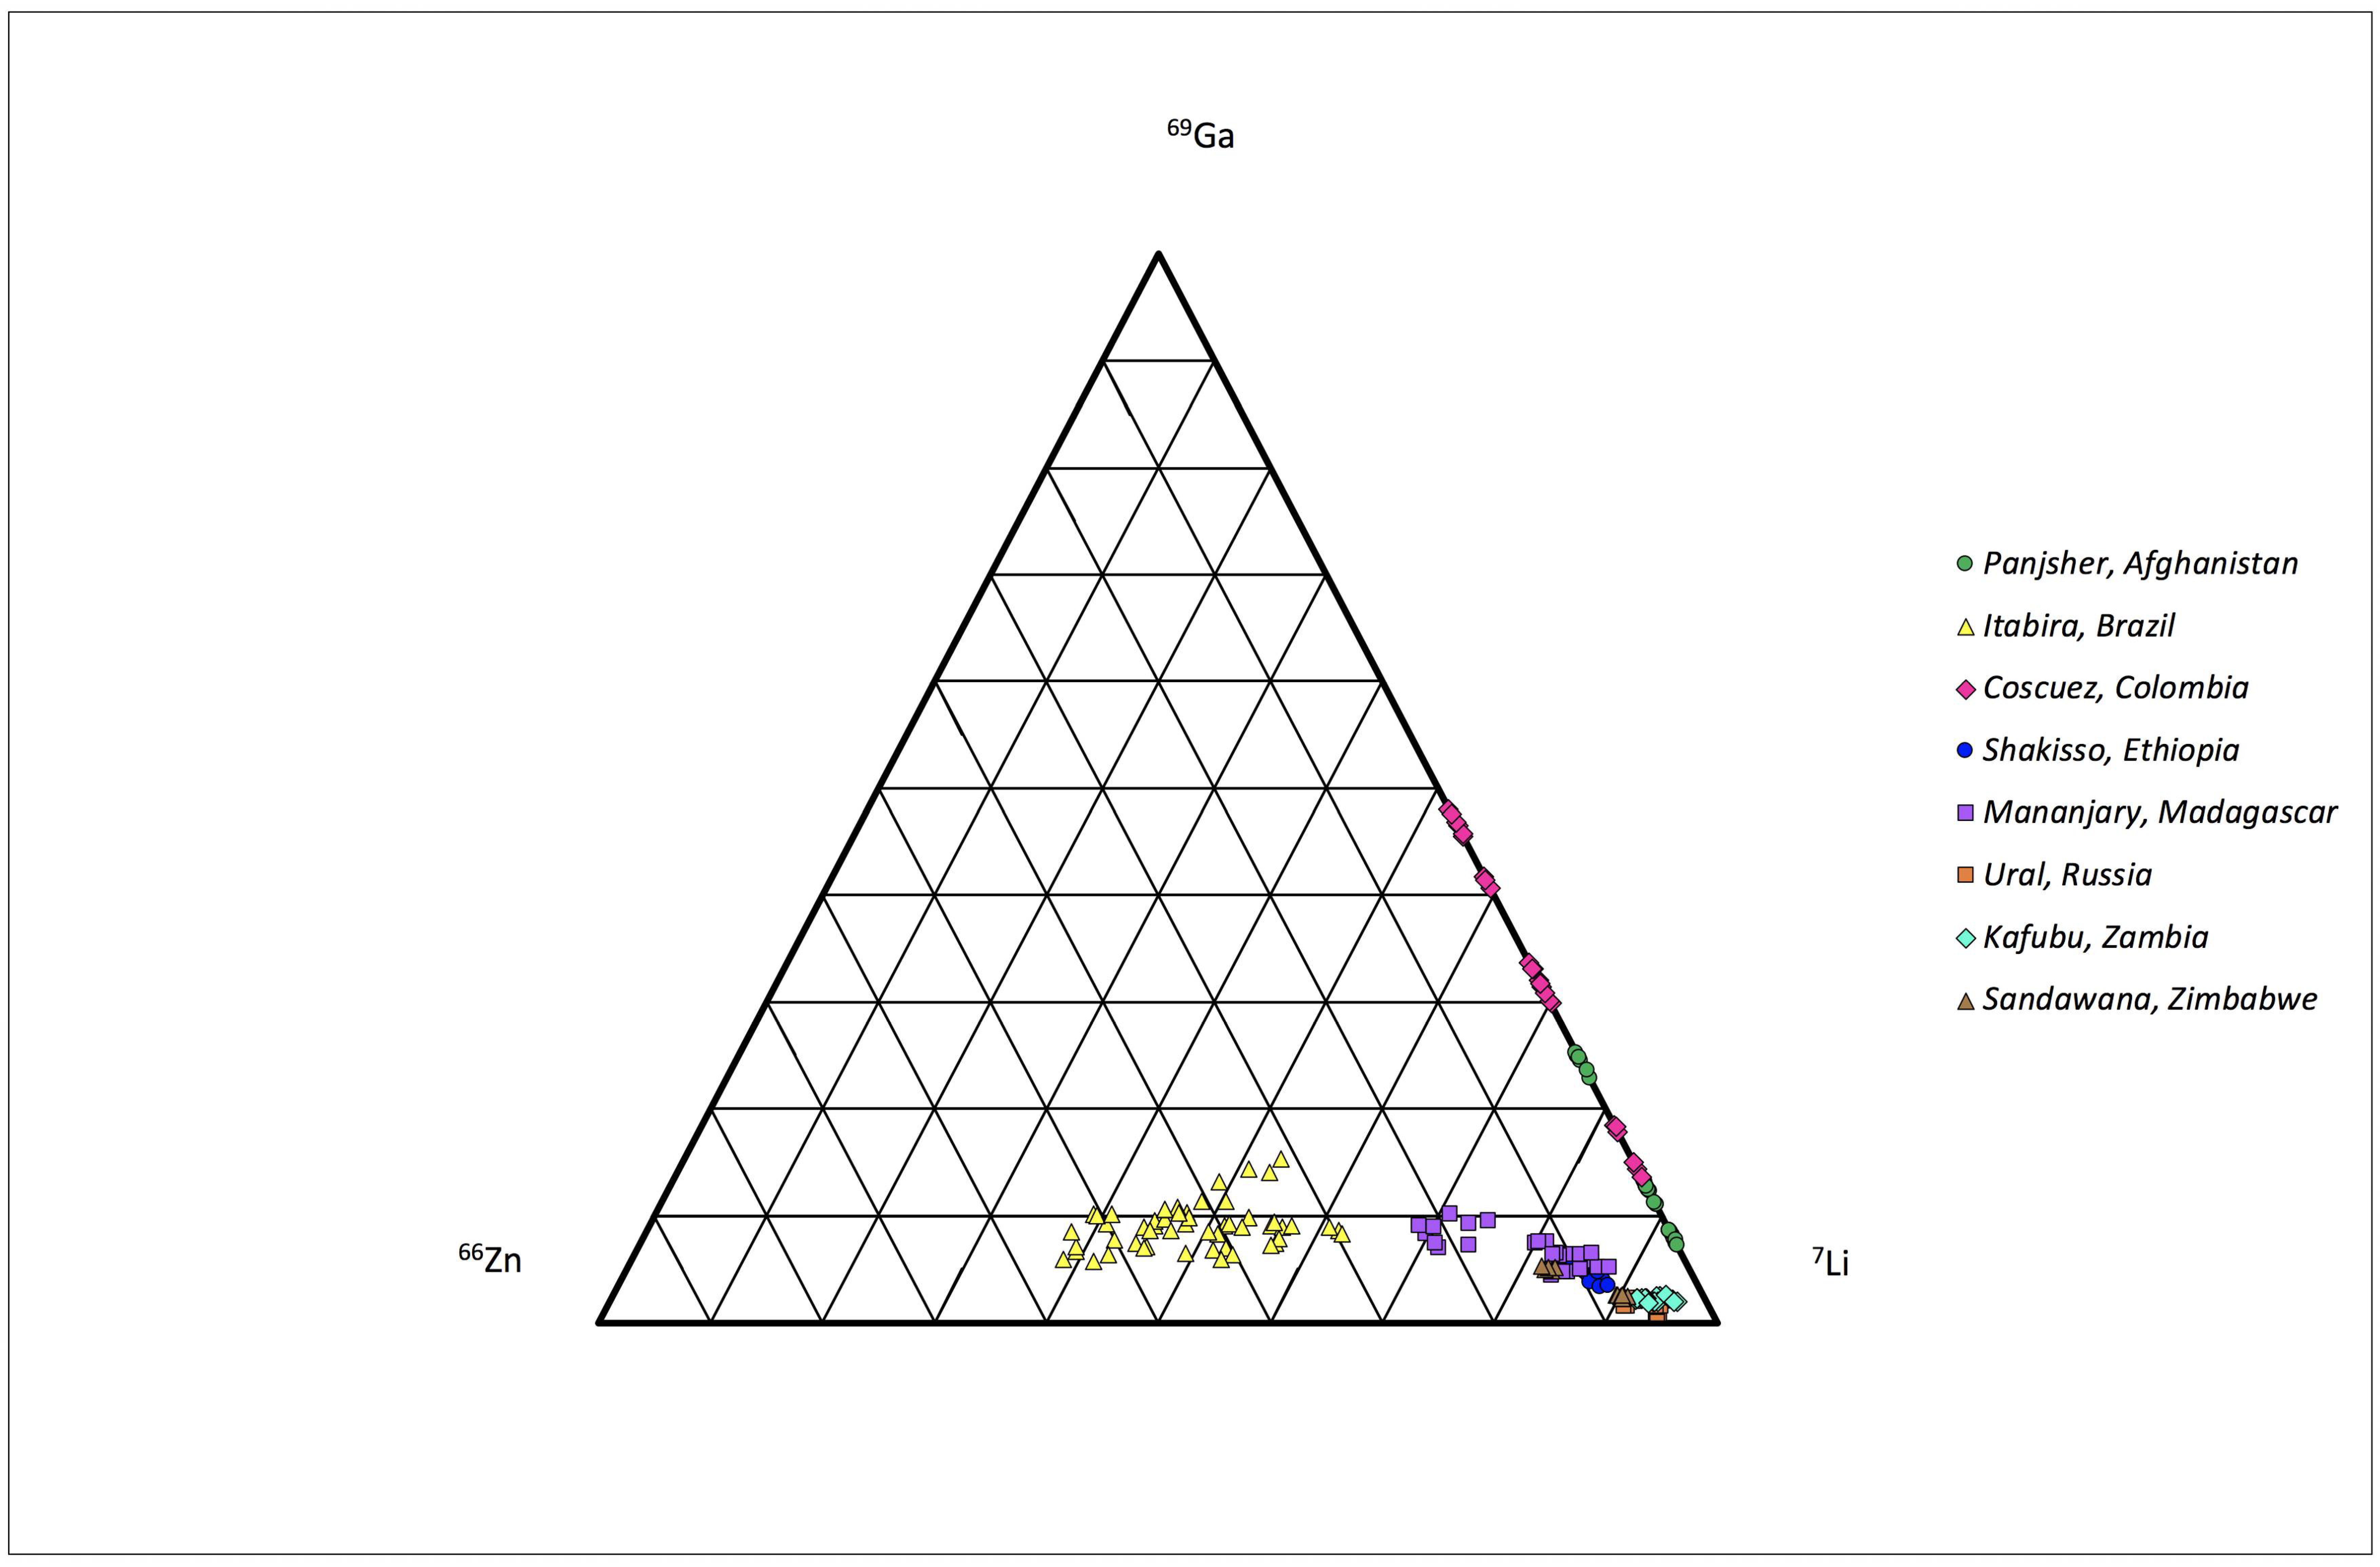
3.1. LA–ICP-MS

LA–ICP-MS data on the studied samples are presented in Table 3 and all acquired individual chemical analysis are presented in Tables S1–S8. 23Na (sodium) and 24Mg (magnesium) are the most abundant of the minor and trace elements measured in the studied samples, with all studied samples from Zimbabwe (Sandawana) having Na2O > 2 wt %. It has been suggested that a Na2O content of emeralds <1 wt % is considered low, 1 wt % < medium < 2 wt % and >2 wt % high [56]. The studied emeralds from Colombia had a relatively low Na2O content. The samples from Afghanistan, Russia and Brazil had relatively low to medium Na2O content, with those from Brazil having a medium sodium content as well as most of the studied samples from Afghanistan. Relatively medium to high, and fairly high, sodium quantities were presented by the samples from Ethiopia, Madagascar, Zambia and Zimbabwe, with the latter exhibiting the highest content amongst the studied samples. The calculated water content of the studied samples is listed in Table 3; the Colombian samples presented the lowest calculated water content (1.69–2.17%), followed by Russian samples (1.99–2.3%), samples from Brazil (2.17–2.47%) and samples from Afghanistan, with calculated water content ranging from low (1.93%) to relatively high (2.54%). The vast majority of the other studied samples presented a water content >2.5%. The plot of MgO vs. Na2O presents a positive correlation (Figure 1), with a Na2O/MgO ratio being below 1 for most of the studied samples; only the studied Russian samples presented a ratio >1, with a 1.33 median and a 1.34 average (see Table 3). Data of samples from Brazil, Russia, Zimbabwe, Zambia and Madagascar are similar to previously published data measured with a microprobe [52,55,56,57,77]; some of the Russian emeralds were found to contain higher MgO with a Na2O/MgO ratio <1 [55].
Chemical elements responsible for the colour of emeralds, such as Cr, V and Fe, can be seen in various amounts (e.g., 56Fe up to 11200 ppmw for a sample from Madagascar). The 52Cr/51V ratio vs. 56Fe is represented in Figure 2. The 52Cr/51V ratio is >3.8 for all studied Type IA samples. All studied samples from Colombia presented 52Cr < 51V, with a 52Cr/51V ratio ranging from 0.12 to 0.45. Only two of the nine studied samples from Afghanistan presented 52Cr/51V < 1, while the other studied samples had ratios reaching up to 2.64 (see Table 3 and Figure 2). The distribution and scattering of the analysed points in Figure 2 might be influenced by the colour of the analysed samples (e.g., all samples from Russia were light green in colour).
Alkali metals, other than 23Na, are also present in emeralds in different concentrations (see 7Li, 39K, 85Rb and 133Cs in Table 3). The sum of the concentrations of all alkali metals (7Li + 23Na + 39K + 85Rb + 133Cs) measured in the studied samples is divided here into low (sum < 1%), medium (1% < sum < 2%) and high (sum > 2%). Samples from Colombia presented a low sum of alkalis, ranging from 0.30% to 0.73% (average: 0.46%, median: 0.43%), from Russia 0.65% to 1.04% (average: 0.80%, median: 0.75%), from Brazil 0.75% to 1.30% (average: 1.02%, median: 1.05%), from Afghanistan 0.49% to 1.60% (average: 1.03%, median: 1.16%) and all the rest of the samples presented a medium to high sum of alkalis (2.29% for a sample from Zimbabwe). Thus, the emeralds studied from Type IA occurrences can be separated into those with a low to medium sum of alkalis <1.30% (from Brazil and Russia) and those with a sum >1.35% (all the other emeralds of the same type; i.e., from Ethiopia, Madagascar, Zambia and Zimbabwe).
The alkali metal concentration of emeralds from different localities can vary and their plots are useful for separating them [14,42,70,81]. The studied samples can be divided into those with relatively low 7Li (<200 ppmw)—Afghanistan, Brazil, Colombia and Madagascar, and those with medium to high 7Li (>250 ppmw)—Ethiopia, Russia, Zambia and Zimbabwe (see Table 3). In parallel, the samples from Colombia did not present a detectable amount of 39K. The samples from Russia contained low amounts of potassium, with some measurements being below quantification limits (BQL). Samples from Madagascar showed the highest concentrations of potassium (up to 3150 ppmw, with 1389 ppmw average and 1090 ppmw median values) and the concentrations of emeralds from Afghanistan varied from low (107 ppmw) to high (1540 ppmw). In Figure 3, a 7Li vs. 39K binary plot of the studied samples is presented. Samples with low lithium (7Li < 200 ppmw) can be separated from those with medium to high lithium (7Li > 250 ppmw). Most of the samples from Russia are clustered separately from the other samples with medium to high lithium (Ethiopia, Zambia, Zimbabwe) as they contain relatively little potassium (39K < 105 ppmw). The samples from Colombia are not plotted as they do not contain measurable potassium with LA-ICP-MS. In comparison with published data obtained with LA-ICP-MS [70,80,82], the studied samples from Brazil, Ethiopia, Madagascar, Zambia and Zimbabwe presented similar trends. Zambian samples presenting higher potassium and a similar content of lithium, as well as low lithium and high potassium, and samples from Zimbabwe, with relatively low lithium content, have also been presented in previous studies [42,81]. It is also mentioned in a previous publication that some samples from Russia could present higher potassium [55].
In Figure 4 a 39K vs. 23Na binary plot is presented. As mentioned previously, the samples from Brazil and Madagascar are the only ones studied that belong to the Type IA occurrence type and contain relatively little lithium (7Li < 200 ppmw). It looks as samples from Madagascar can be further separated from samples from Brazil by using this plot, as the samples from Madagascar contain higher sodium and potassium than the Brazilian samples. Using the same plot, Russian samples can also be further separated from other samples of the Type IA occurrence type by those samples with medium to high lithium content (i.e., from Ethiopia, Zambia and Zimbabwe), as they contain low sodium and potassium.
In Figure 5, Figure 6, Figure 7 and Figure 8, 85Rb vs. 133Cs, 7Li vs. 85Rb, 7Li vs. 133Cs and 133Cs vs. 23Na binary plots are presented, respectively. All measured samples are plotted as they all presented concentrations of lithium, sodium, caesium and rubidium measurable with LA-ICP-MS (see Table 3). Apart for the samples from Brazil and Madagascar, which belong to Type IA occurrences, the samples from Colombia and Afghanistan present low 7Li. Samples from Colombia also presented the lowest rubidium (85Rb < 1.88 ppmw) and caesium (133Cs < 12.1 ppmw), whereas samples from Zimbabwe presented the highest rubidium (167 ppmw < 85Rb < 227 ppmw; 264 ppmw average and 279 ppmw median concentrations). Some of the samples from Madagascar also presented high rubidium (85Rb > 100 ppmw, up to 317 ppmw). Samples from Zambia presented the highest caesium content (from 941 to 1410 ppmw, 1202 ppmw average and 1215 ppmw median values). According to the literature, some samples from Zambia (Kafubu) could have relatively low lithium [42,70], while some have lower caesium and rubidium [40]. Samples from Colombia are plotted separately in the three plots of Figure 5, Figure 6 and Figure 7 as they contain the lowest rubidium, caesium and lithium. Samples from Zimbabwe and most samples from Madagascar contain high rubidium and caesium and so they are also plotted separately (see Figure 5). Samples from Madagascar and Zimbabwe can be separated as the former have a low lithium content and the latter have a high content (Figure 6 and Figure 7). Samples from Ethiopia and Zambia are well separated in a 7Li vs. 133Cs binary plot (Figure 7), as samples from Zambia contain the highest caesium; however, a slight overlap was observed between the two in another publication [81]. Emeralds in close connection with highly evolved pegmatites present high lithium and caesium (see Figure 7; emeralds from Russia, Zambia and Zimbabwe) as most of the extremely fractionated rare-element granitic pegmatites of the complex LCT (lithium, caesium, tantalum) association are enriched in lithium and caesium [70,83]. Possible differences in the alkalis of emeralds of Type IA could be linked to the difference between their granites‒pegmatites [83,84,85,86,87]. In comparison with published data obtained with LA-ICP-MS [42], the samples from Zambia and Zimbabwe presented similar trends; a few Zambian samples presented higher potassium and a similar content of lithium, and a few others presented lower lithium, lower caesium and higher potassium. The lithium and caesium content of the studied samples from Afghanistan did not vary much; however, potassium, sodium and rubidium exhibited a great variation (see Table 3). In Figure 8, in a 133Cs vs. 23Na binary plot, samples from Colombia, Brazil, Ethiopia, Russia and Zambia shows that individual measurements from each of these localities are clustered closely, whereas those obtained from Afghanistan, Madagascar and Zimbabwe present a wide variation.
45Sc, 55Mn, 59Co, 60Ni, 66Zn and 69Ga could also help with the determination of emeralds’ origin. 59Co, 60Ni and 66Zn were BQL for all the samples from Afghanistan and Colombia; all studied samples belonging to Type IA occurrence presented 59Co and 66Zn and, some of them, measurable 60Ni with LA-ICP-MS (see Table 3). Nickel could be used to separate Malagasy from Brazilian samples (both with low lithium); it is detectable in the former (average: 28.94 ppmw) and BQL for the latter. Some samples from Afghanistan as well as most samples of Type IA occurrence presented detectable manganese, and the samples from Zimbabwe presented the highest zinc and manganese contents of the studied samples. Emeralds from Colombia presented the highest gallium content (27.5 to 58.5 ppmw), followed by emeralds from Zimbabwe (24.8 to 33.7 ppmw), while those from Brazil had the lowest (6.68 to 13.8 ppmw). Nevertheless, Colombian samples with low gallium are cited in the literature [42,64]. Scandium is also present in all studied samples, with emeralds from Afghanistan presenting a large variation and the highest content (148 to 2390 ppmw; high scandium in emeralds from Afghanistan was also noted in [40,42,64]). Also, Colombian samples presented a variation from relatively low to high content of scandium (9.17 to 441 ppmw), as well as the Malagasy samples (21 to 309 ppmw). In Figure 9 and Figure 10, 69Ga vs. 45Sc and 7Li vs. 45Sc binary plots are presented, respectively. Samples from Colombia and Zimbabwe are separated from the rest in Figure 9 due to their higher gallium content as well as two out of nine of the studied samples due to their high gallium content. In Figure 10, the samples from Ethiopia are plotted separately in between the samples with low lithium and those with high lithium, as they also contain medium scandium concentrations.
In Figure 11, a binary plot of 133Cs vs. 23Na/7Li ratio is presented; in this, the studied Ethiopian, Russian and Zambian emeralds (all with 7Li > 250 ppmw) are well separated. The plotted points of Ethiopian samples overlap only with those from one sample from Zimbabwe and the plotted points from Zambia with the analysis of two out of the three studied samples from Zimbabwe. As mentioned above, the samples from Zimbabwe contain high rubidium and could be easily separated from the samples from Ethiopia and Zambia (see again Figure 5 and Figure 6). Our results on the Russian emeralds present slightly lower 23Na/7Li ratios compared to those presented in [19].
In Figure 12, a Ga vs. Zn vs. Li triplot is presented, with most samples plotted showing similarity to those presented in [64]; only the samples from Afghanistan differ. Samples belonging to Type II occurrences do not present any measurable zinc with LA-ICP-MS; thus, they are plotted separately from the samples from Type IA occurrences. From the latter, studied samples from Brazil are plotted separately from the studied samples from Madagascar (both present low lithium contents). Some points of the samples from Madagascar overlap with the other samples from Type IA occurrences, but they can be separated as they contain medium to high lithium.

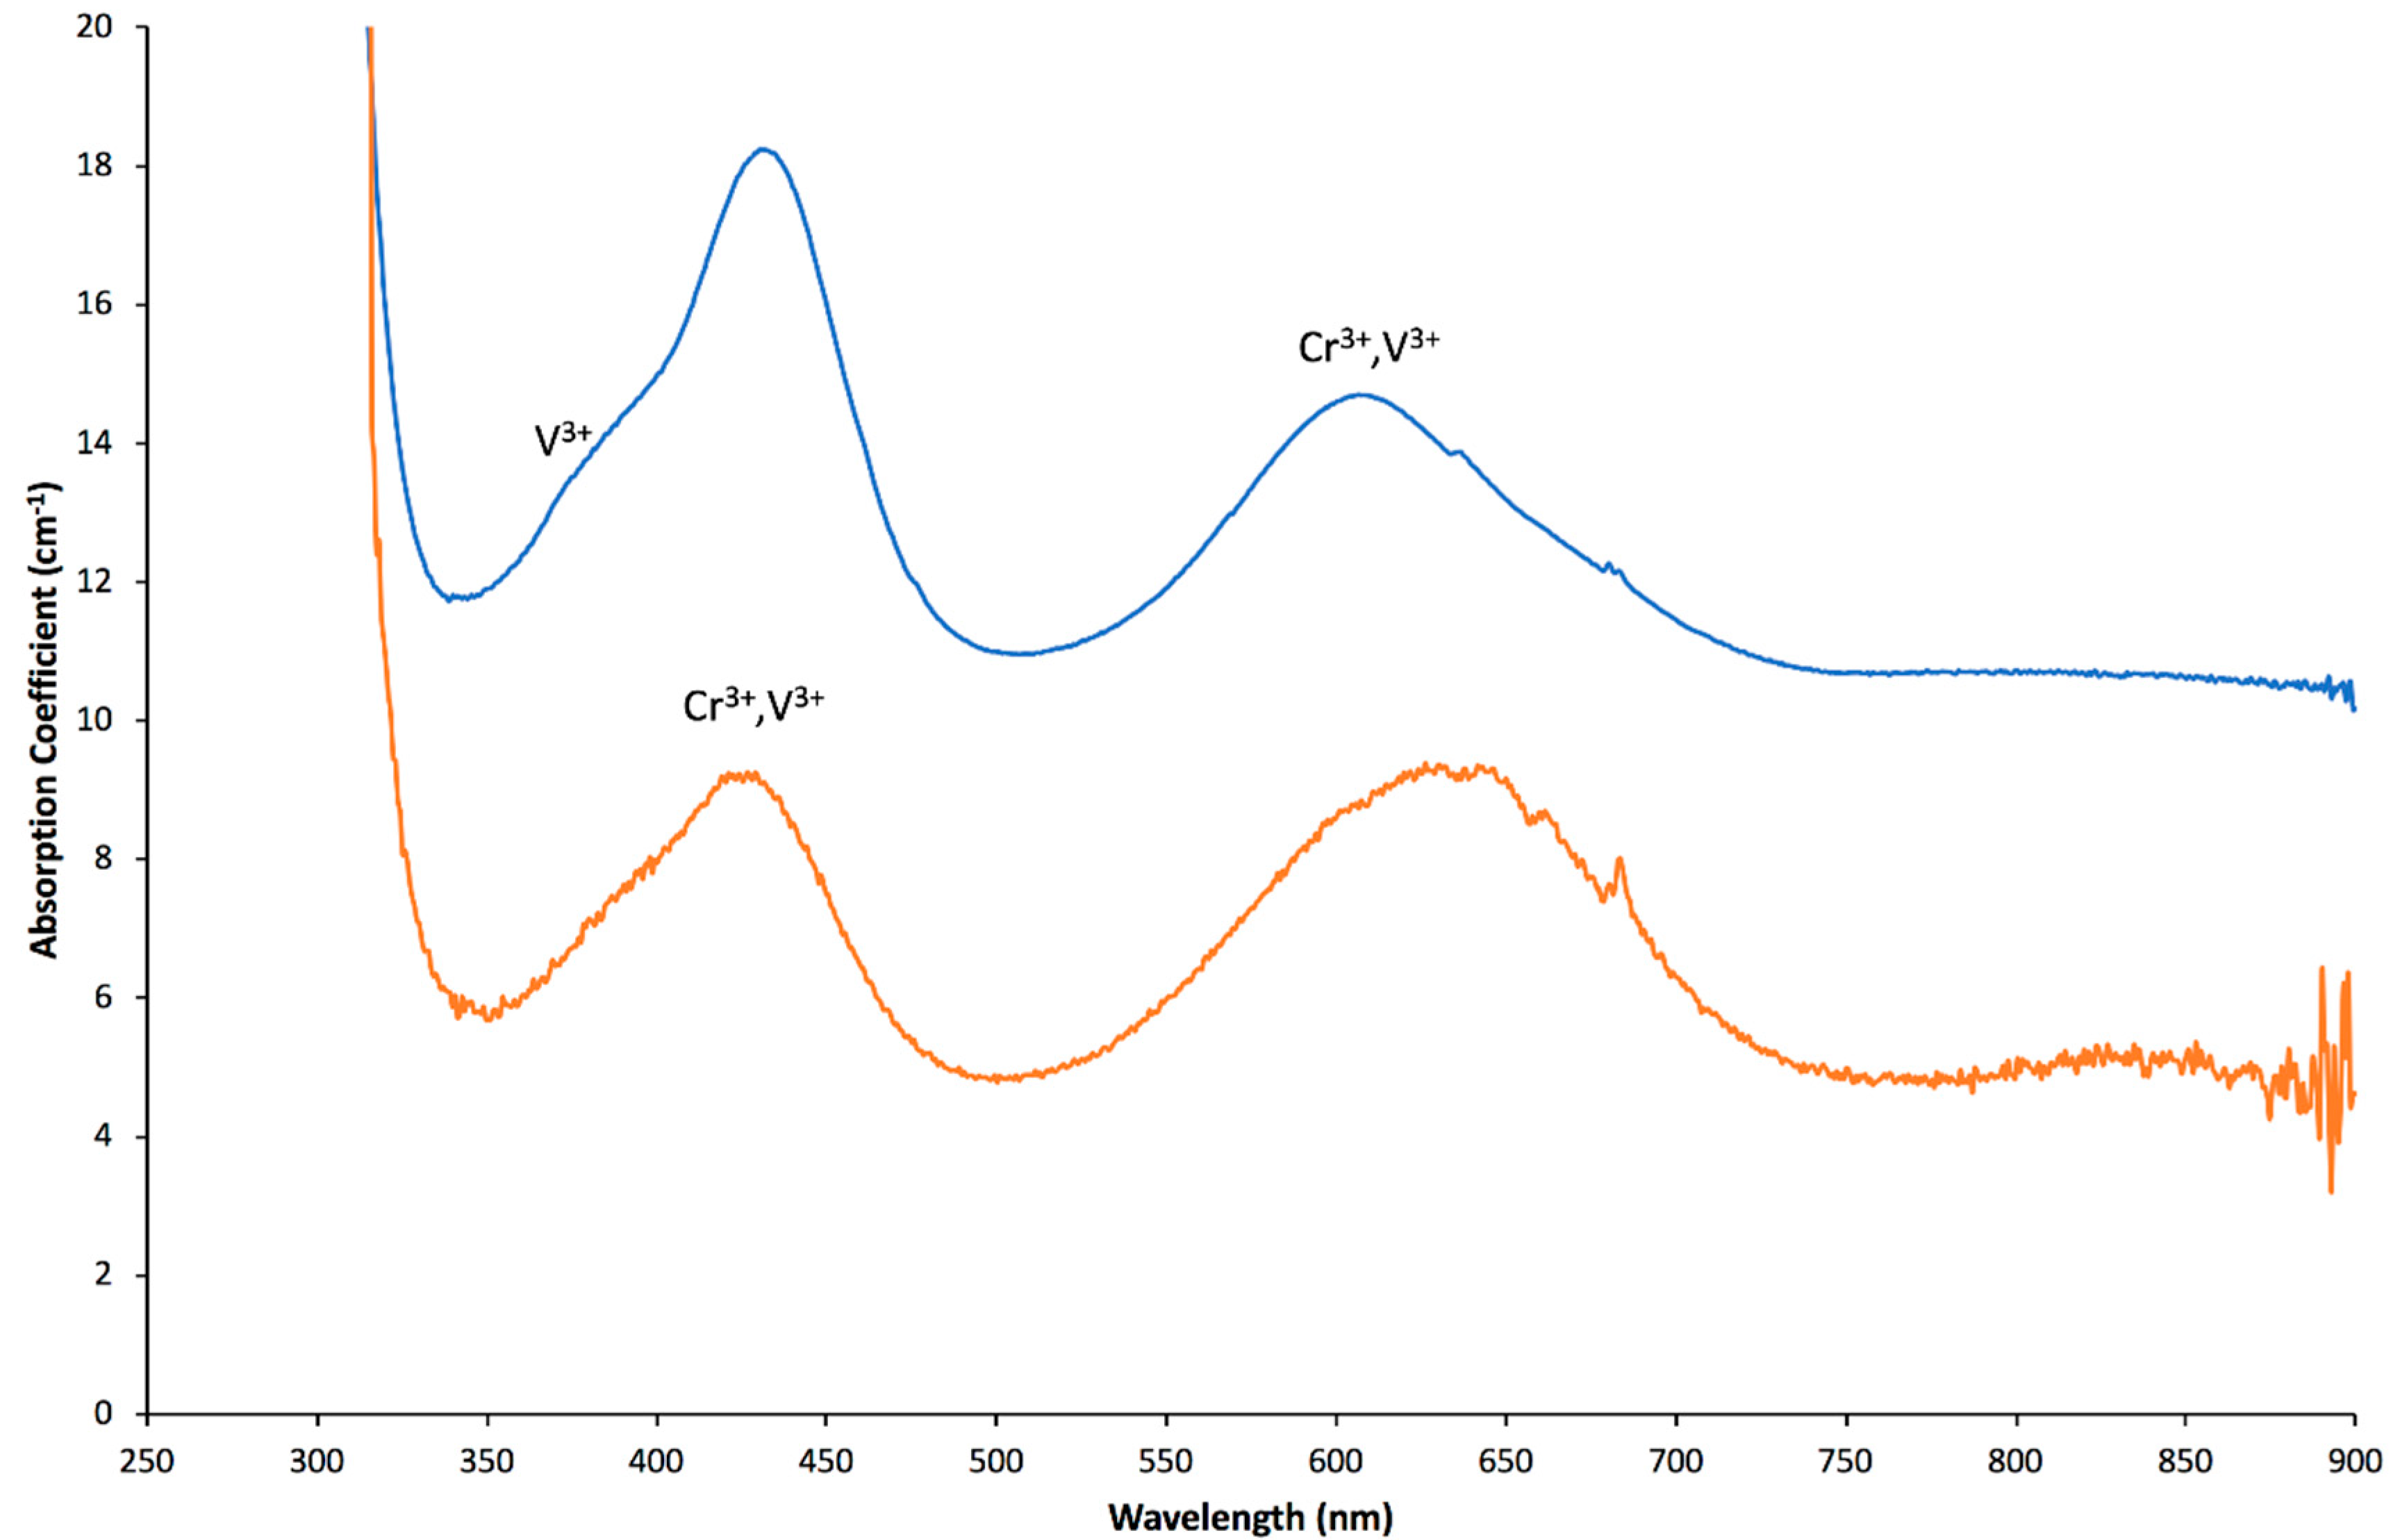
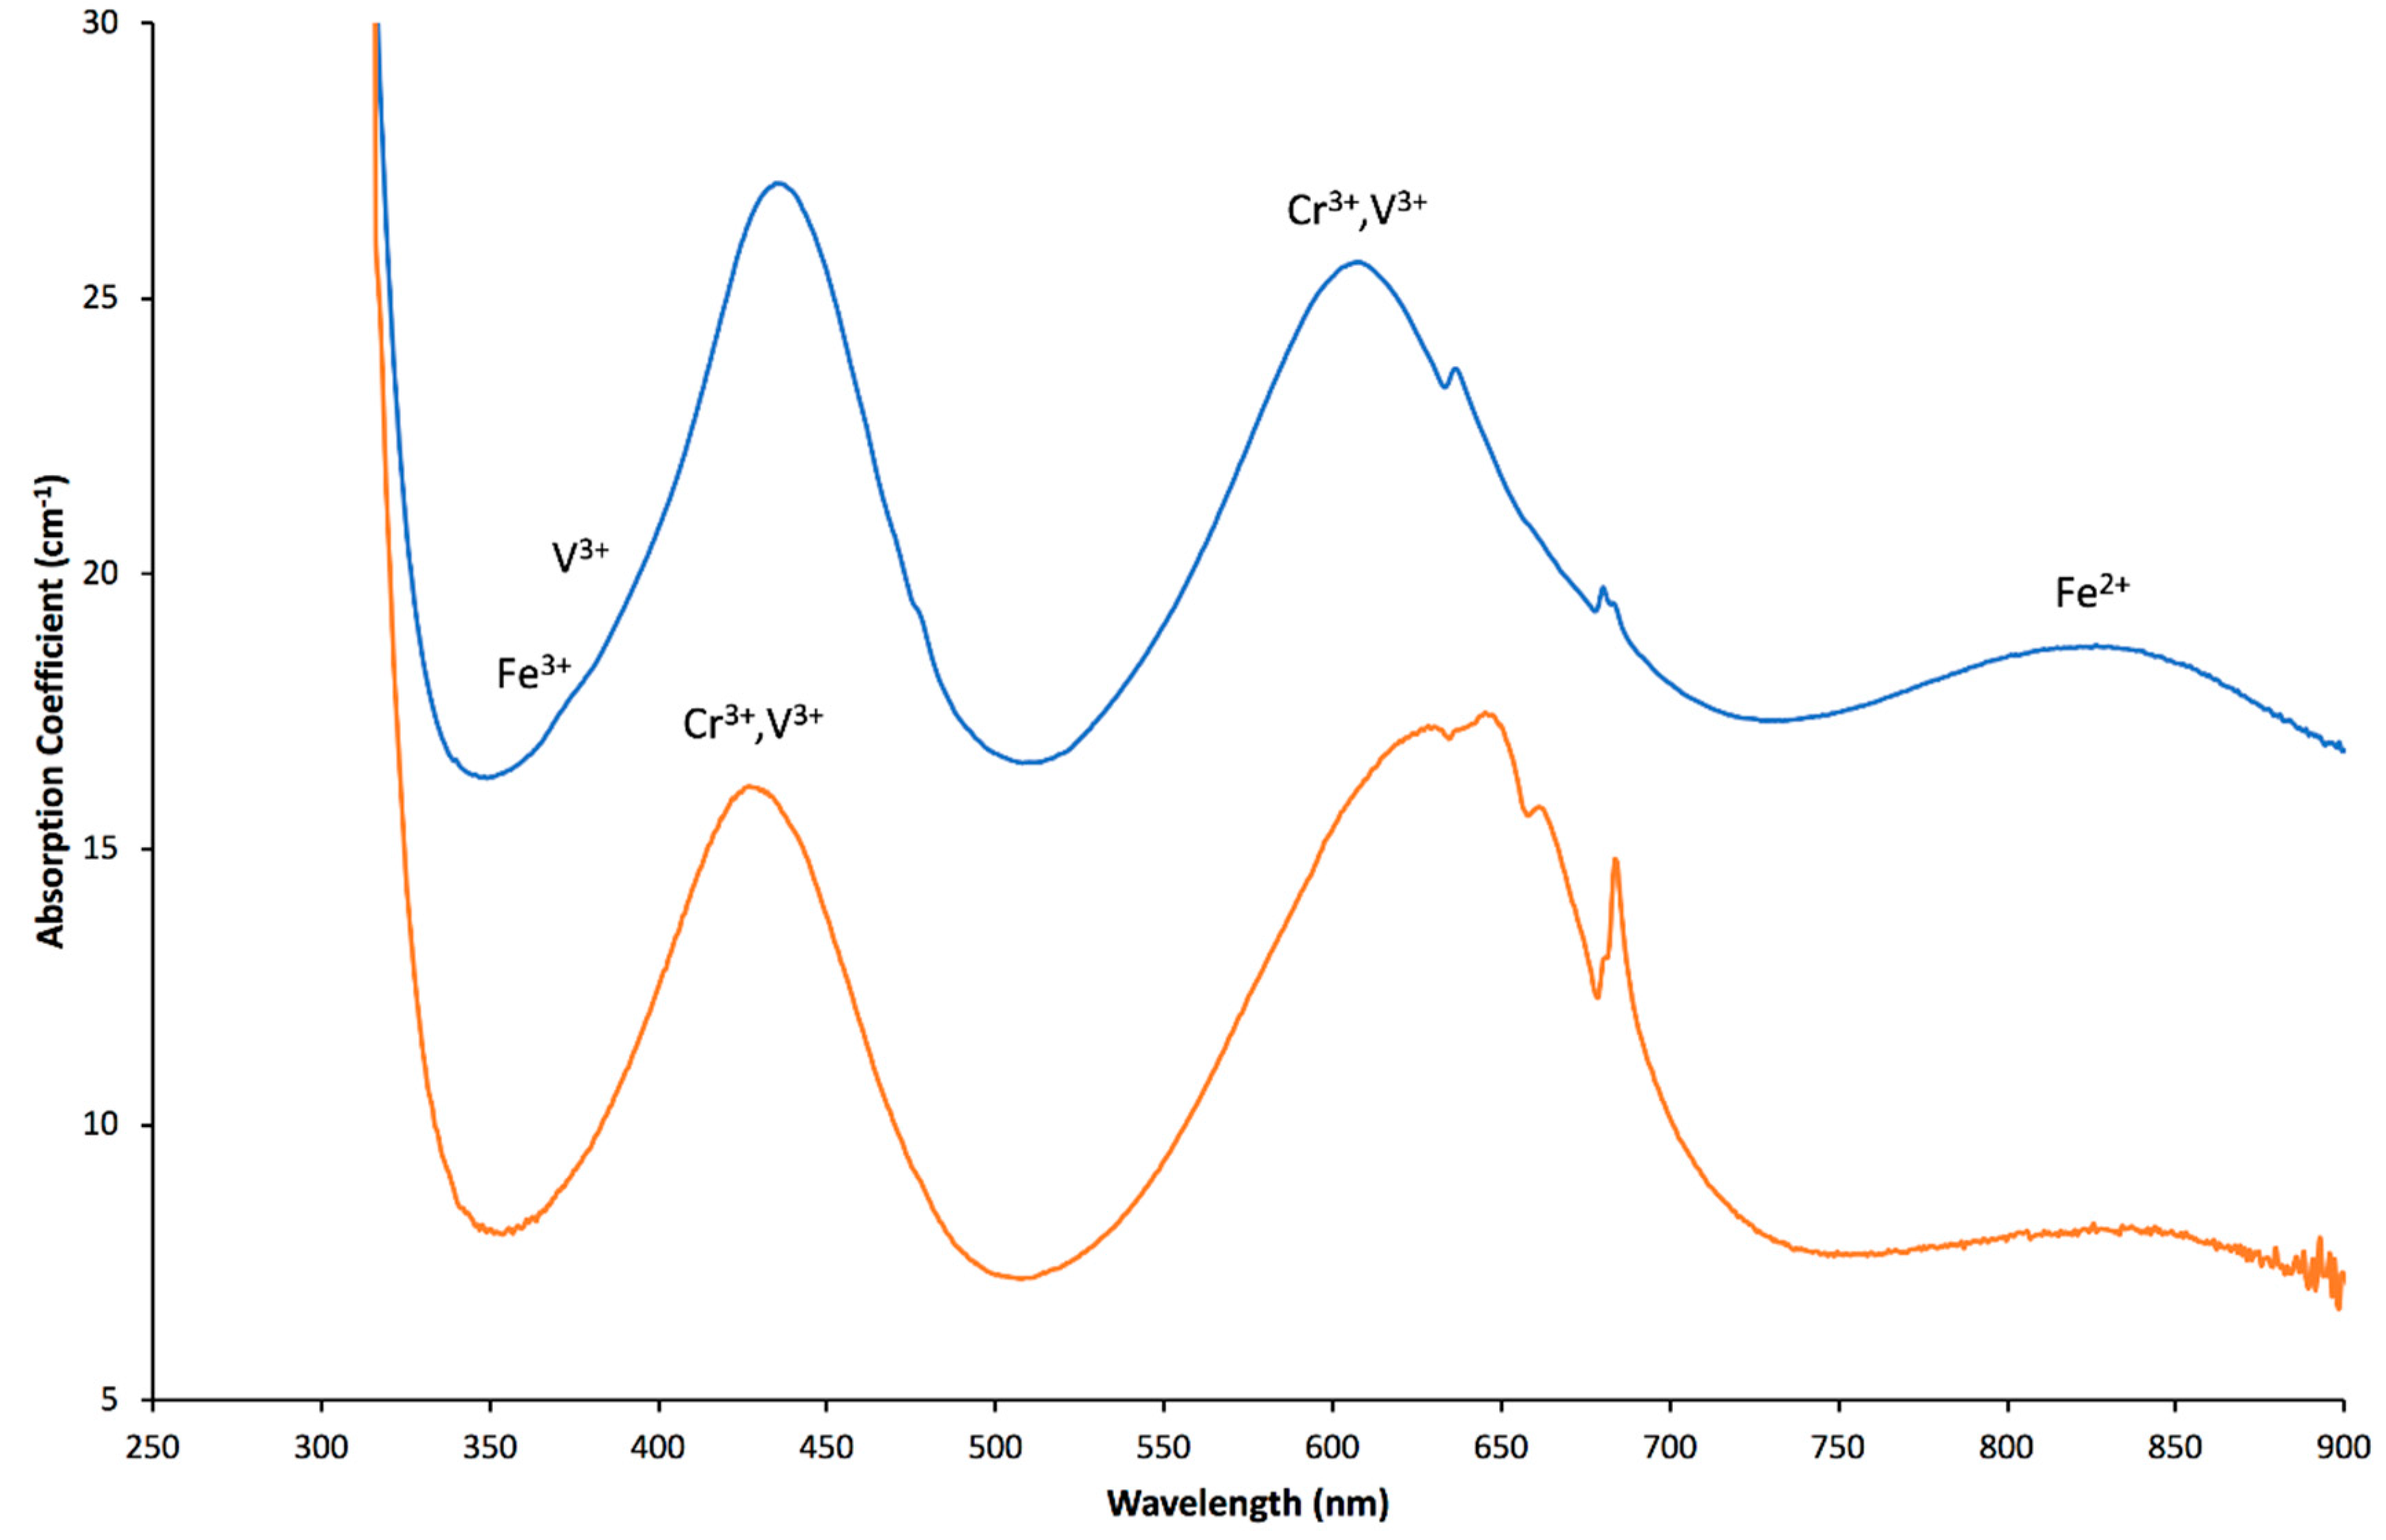
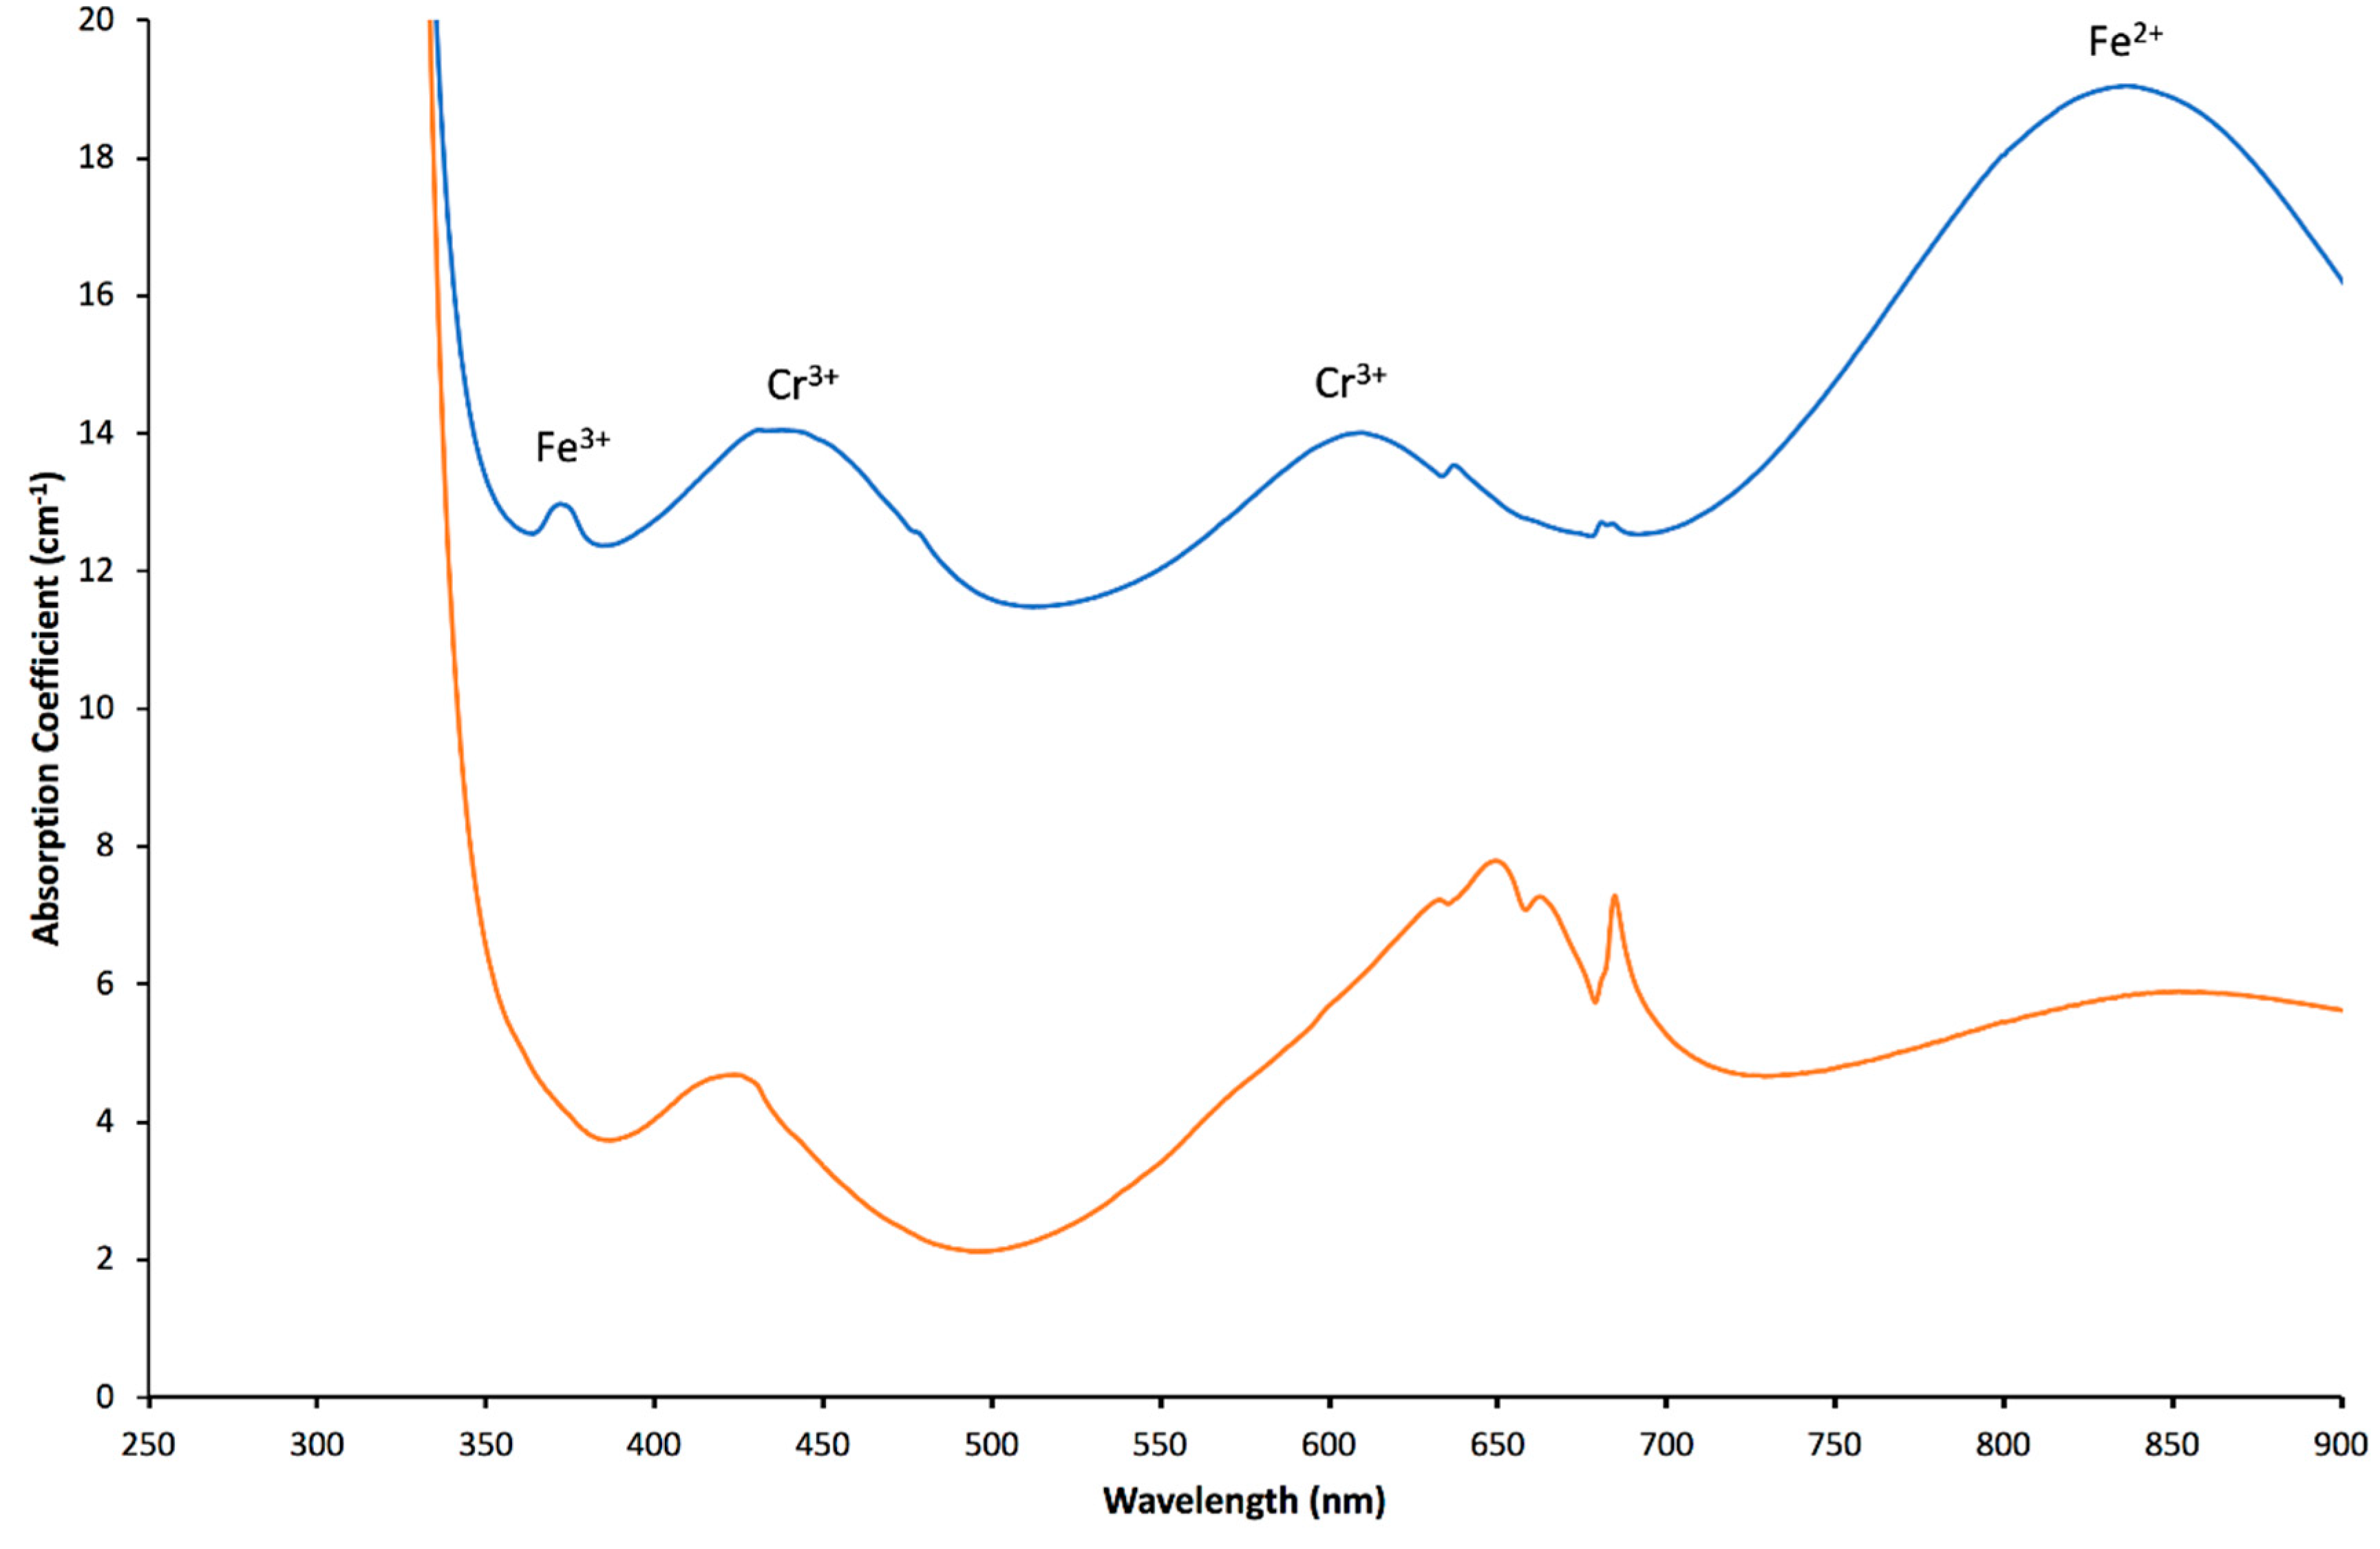
3.2. UV-Vis-NIR Spectroscopy

In Figure 13, Figure 14 and Figure 15, UV-Vis polarised spectra with a spectral range of 250 to 900 nm of three green emeralds from Colombia, Afghanistan and Zambia, respectively, are presented. The light blue lines are for the ordinary-ray (o-ray) spectra and the orange lines are for the extraordinary-ray (e-ray) spectra. All emeralds from Colombia (see an example in Figure 13) presented absorptions due to Cr3+ and V3+ in the violet-blue part (around 430 nm) and absorption in the orange-red part (around 600 nm), with a shoulder at around 395 nm due to vanadium [34,42,53,62,88,89,90,91,92]. All spectra on the emerald from Afghanistan (Figure 14) show absorptions due to Cr3+ (some of the studied samples also presented the bands due to V3+), with relatively low Fe2+-linked absorption at around 830 nm and very weak absorption at around 370 nm (barely observed along the o-ray) due to Fe3+. All studied emeralds classified as Type IA (i.e., from Brazil, Ethiopia, Madagascar, Russia, Zimbabwe and Zambia) presented absorptions linked to Cr3+, Fe3+ and Fe2+ (see an example in Figure 15; Table 4). Some samples also presented additional weak bands in the red part of the electromagnetic spectrum, possibly linked to Fe3+‒Fe2+ charge transfer (e.g., from Zambia and Madagascar) [91].
In Figure 16, Figure 17 and Figure 18, polarised spectra in the near infrared region (NIR) from 1300 to 1500 nm, of the samples shown in Figure 13, Figure 14 and Figure 15, are presented. The bands in those figures are linked to water vibrations (overtone and combination). The more pronounced bands observed along the e-ray (orange line) are linked to Type I water (main band at around 1400 nm –around 7142 cm−1) and those along the o-ray (light blue line) to Type II water (i.e., water linked with alkalis; main band at 1408 nm –around 7102 cm−1) [88,93,94,95]. Consequently, Type II water bands are more intense in samples with a higher content of alkalis; thus, they are weaker in emeralds from Colombia (Figure 16). The bands are of medium intensity in samples from Brazil, Russia and seven out of nine samples from Afghanistan and one sample out of four from Ethiopia (Figure 17), and intense in all samples from Madagascar, Zambia and Zimbabwe, as well as three out of four from Ethiopia and two out of nine from Afghanistan (Figure 18).
Thus, all emeralds from Type IA occurrences presented relatively important absorptions linked to Type II water; only the samples from Brazil, Russia and one (out of four) from Ethiopia showed medium to weak absorptions of Type II water and pronounced absorptions of Type I water. This is probably due to a lower content of alkalis in these samples compared to the other studied samples from Type IA occurrences. The samples from Colombia and most of the studied samples from Afghanistan (seven out of nine) show similar characteristics to those from Brazil, Russia as well as one from Ethiopia; those from Colombia exhibited the lowest intensity of Type II water bands. Two samples from Afghanistan (belonging to Type II occurrences) present relatively important absorptions linked to Type II water.

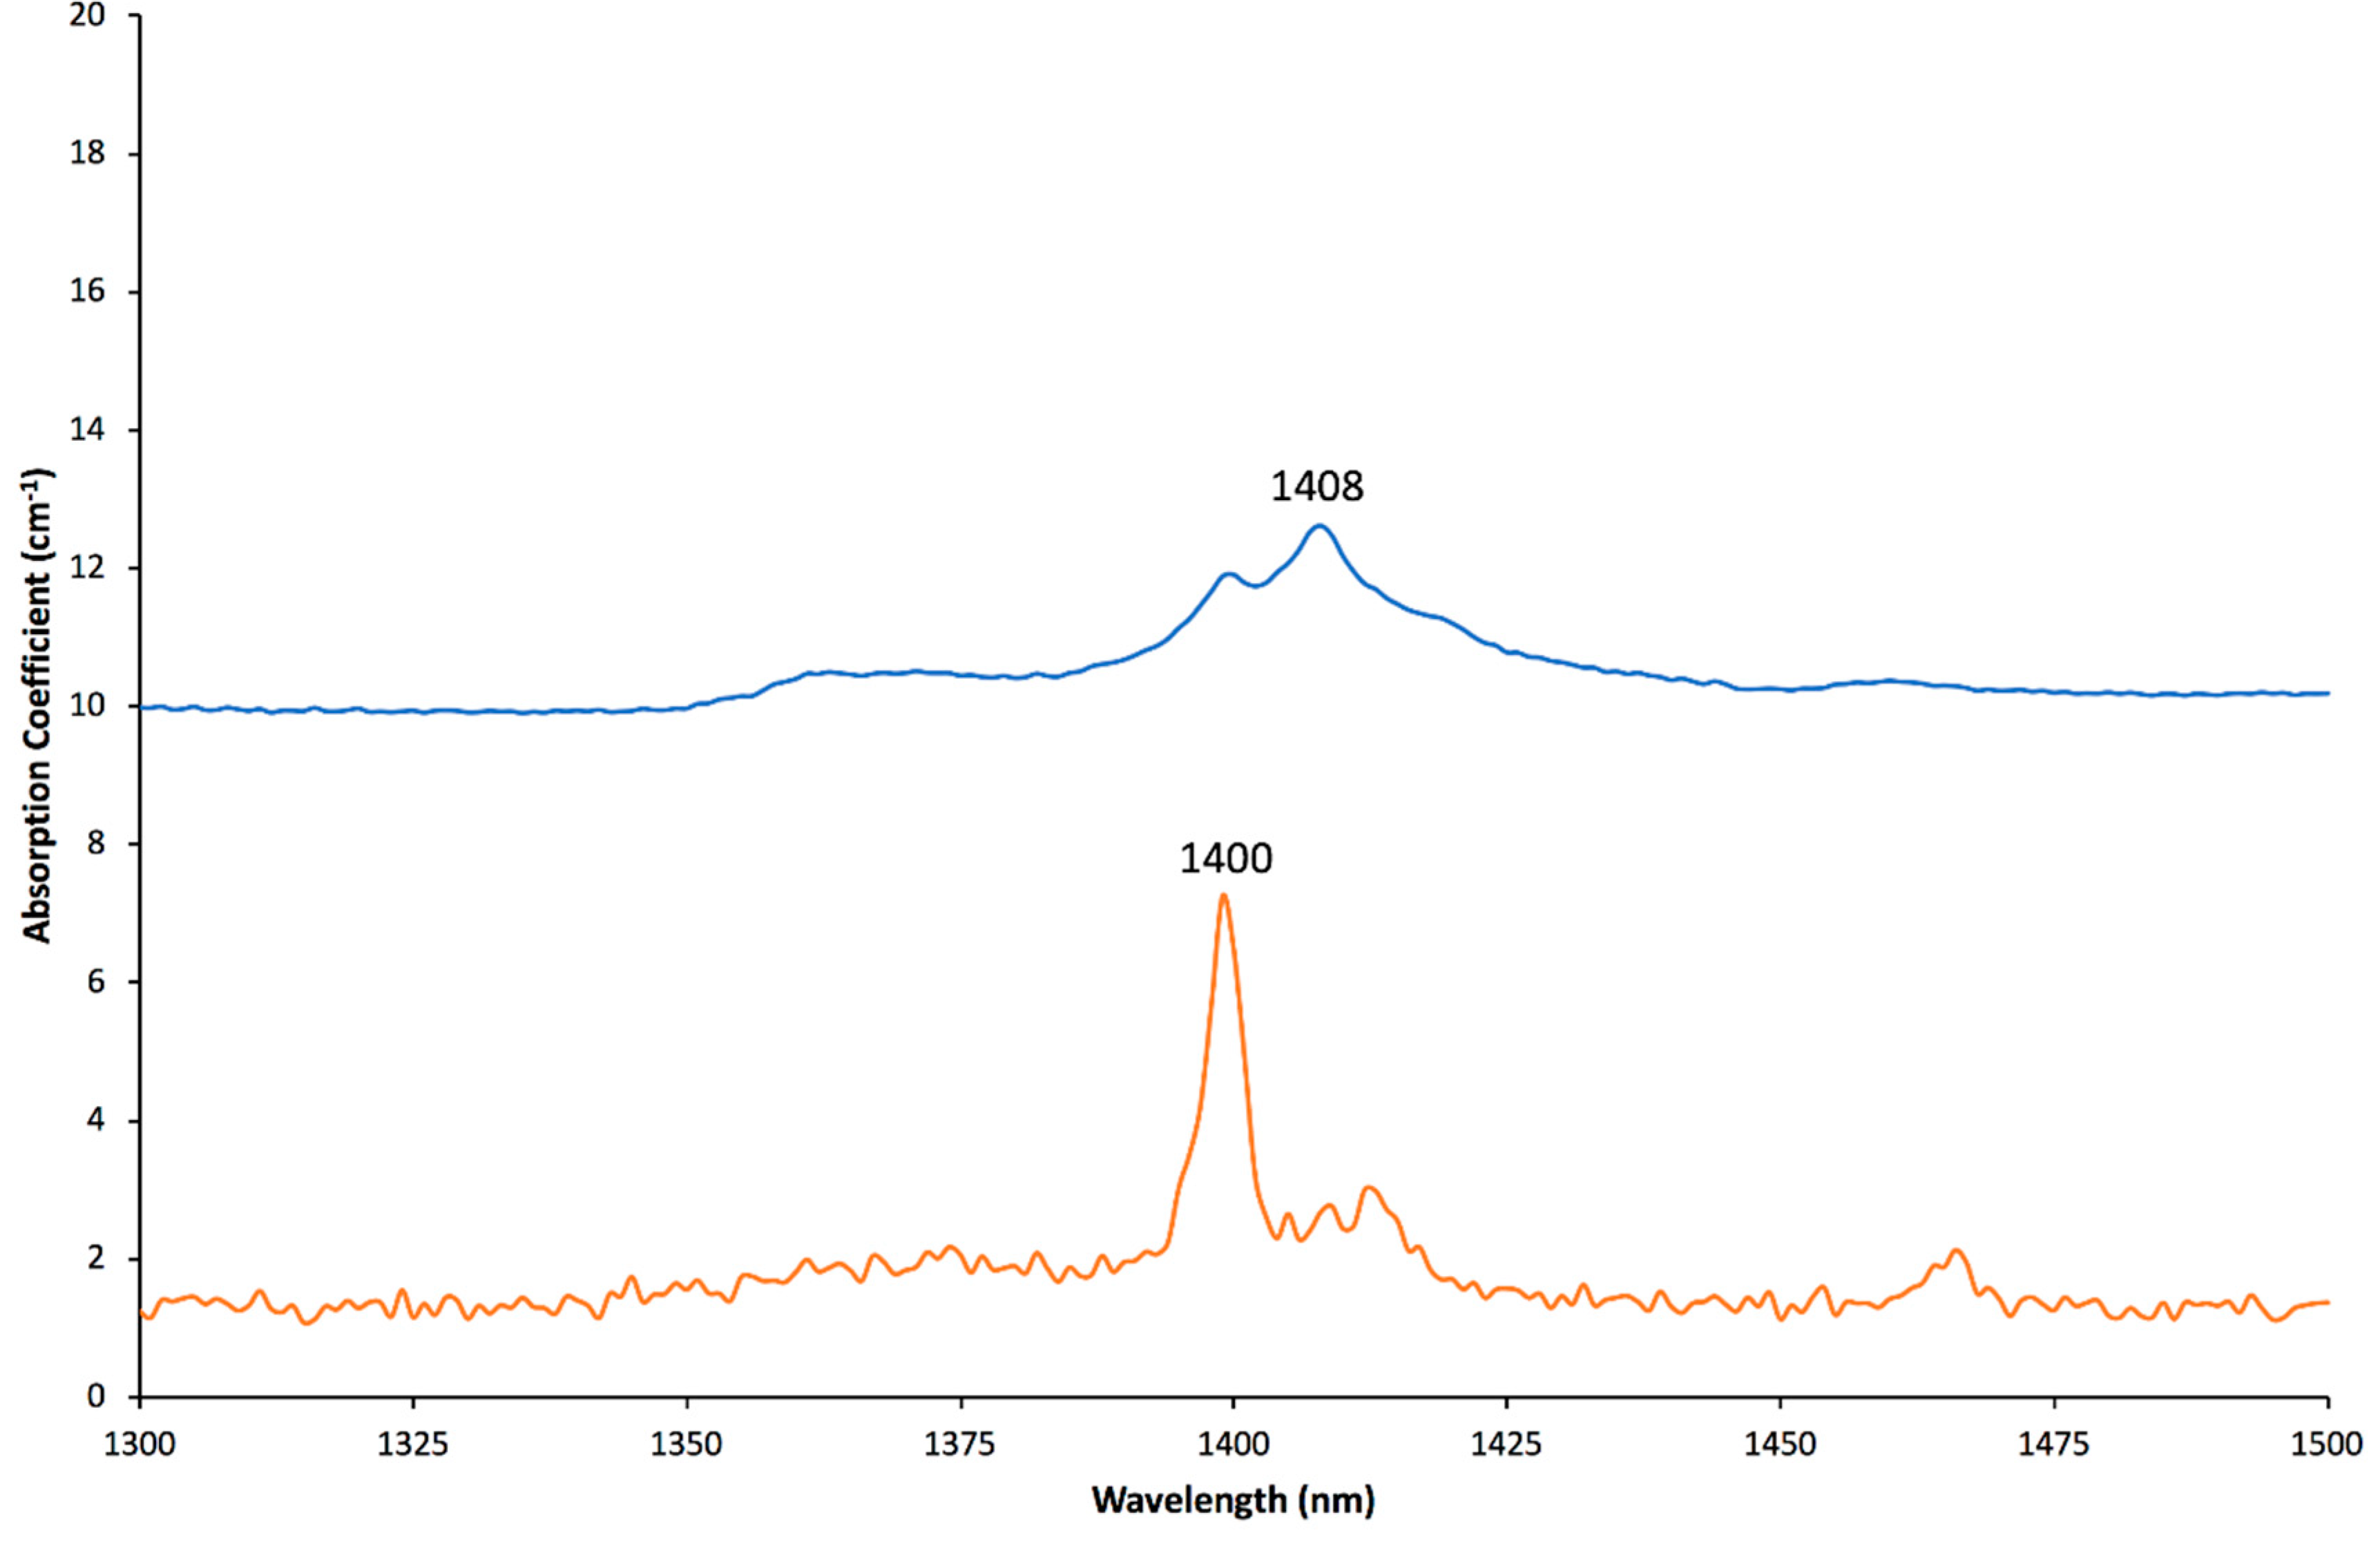
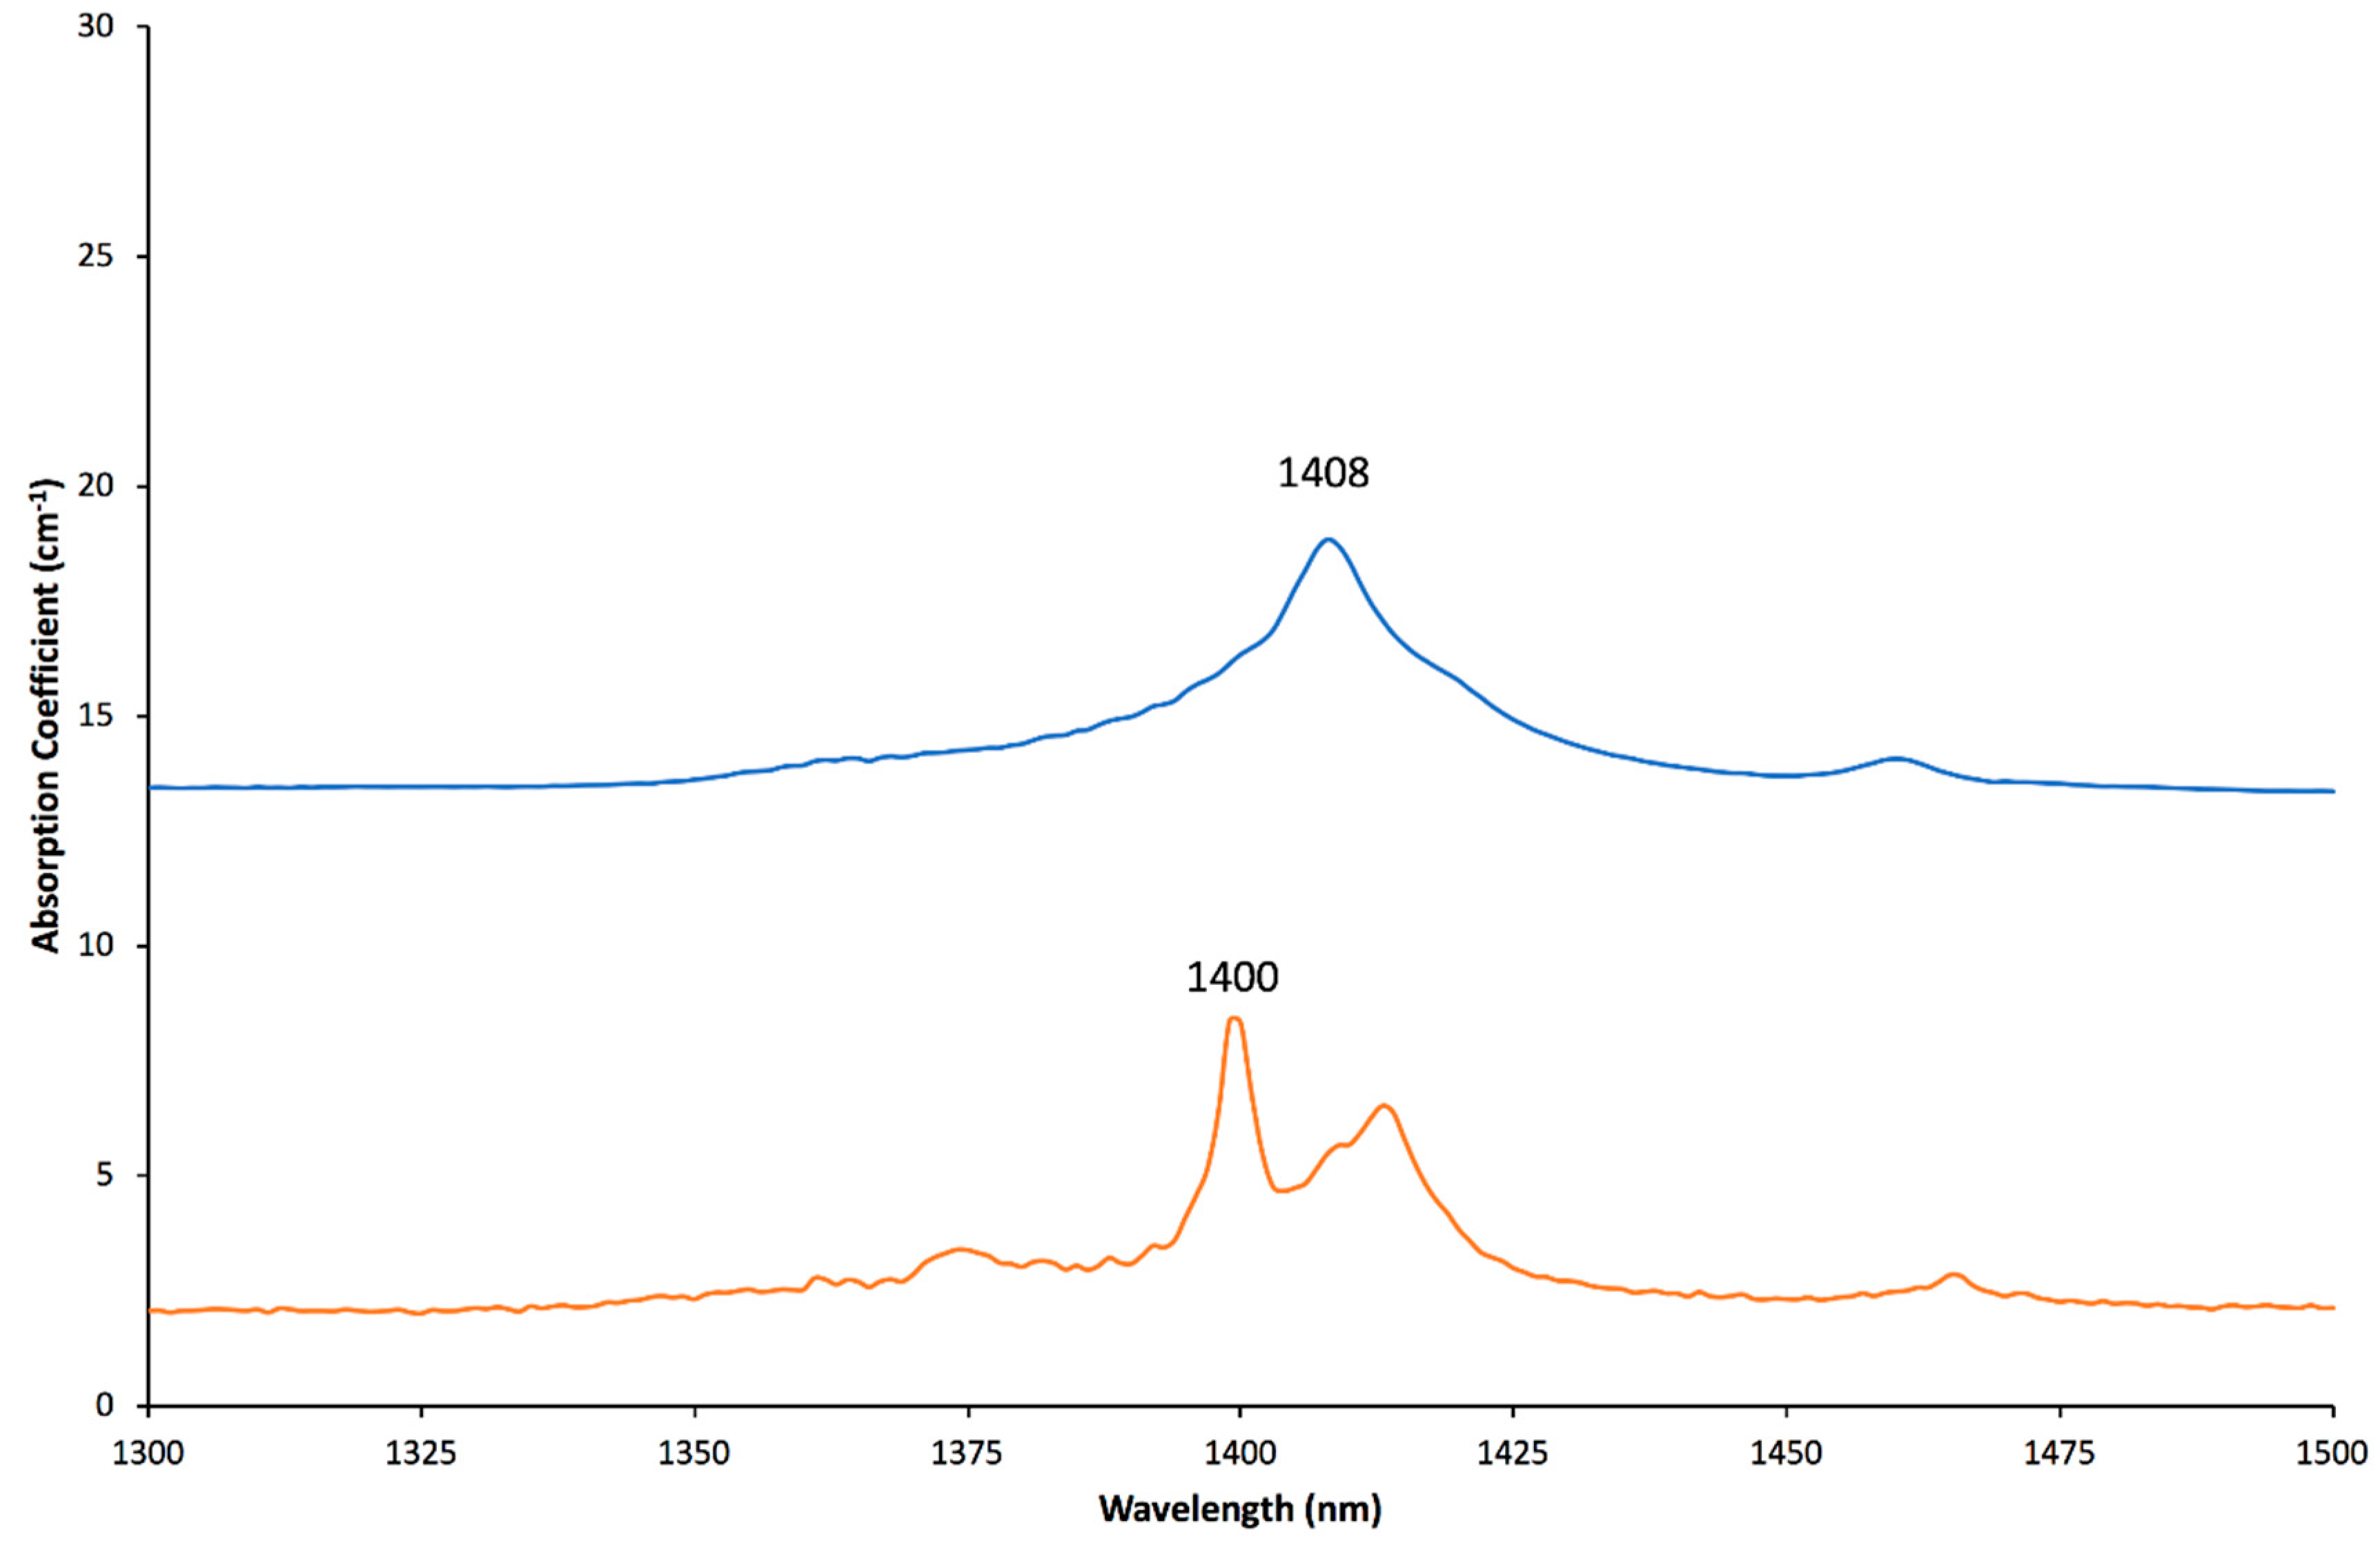
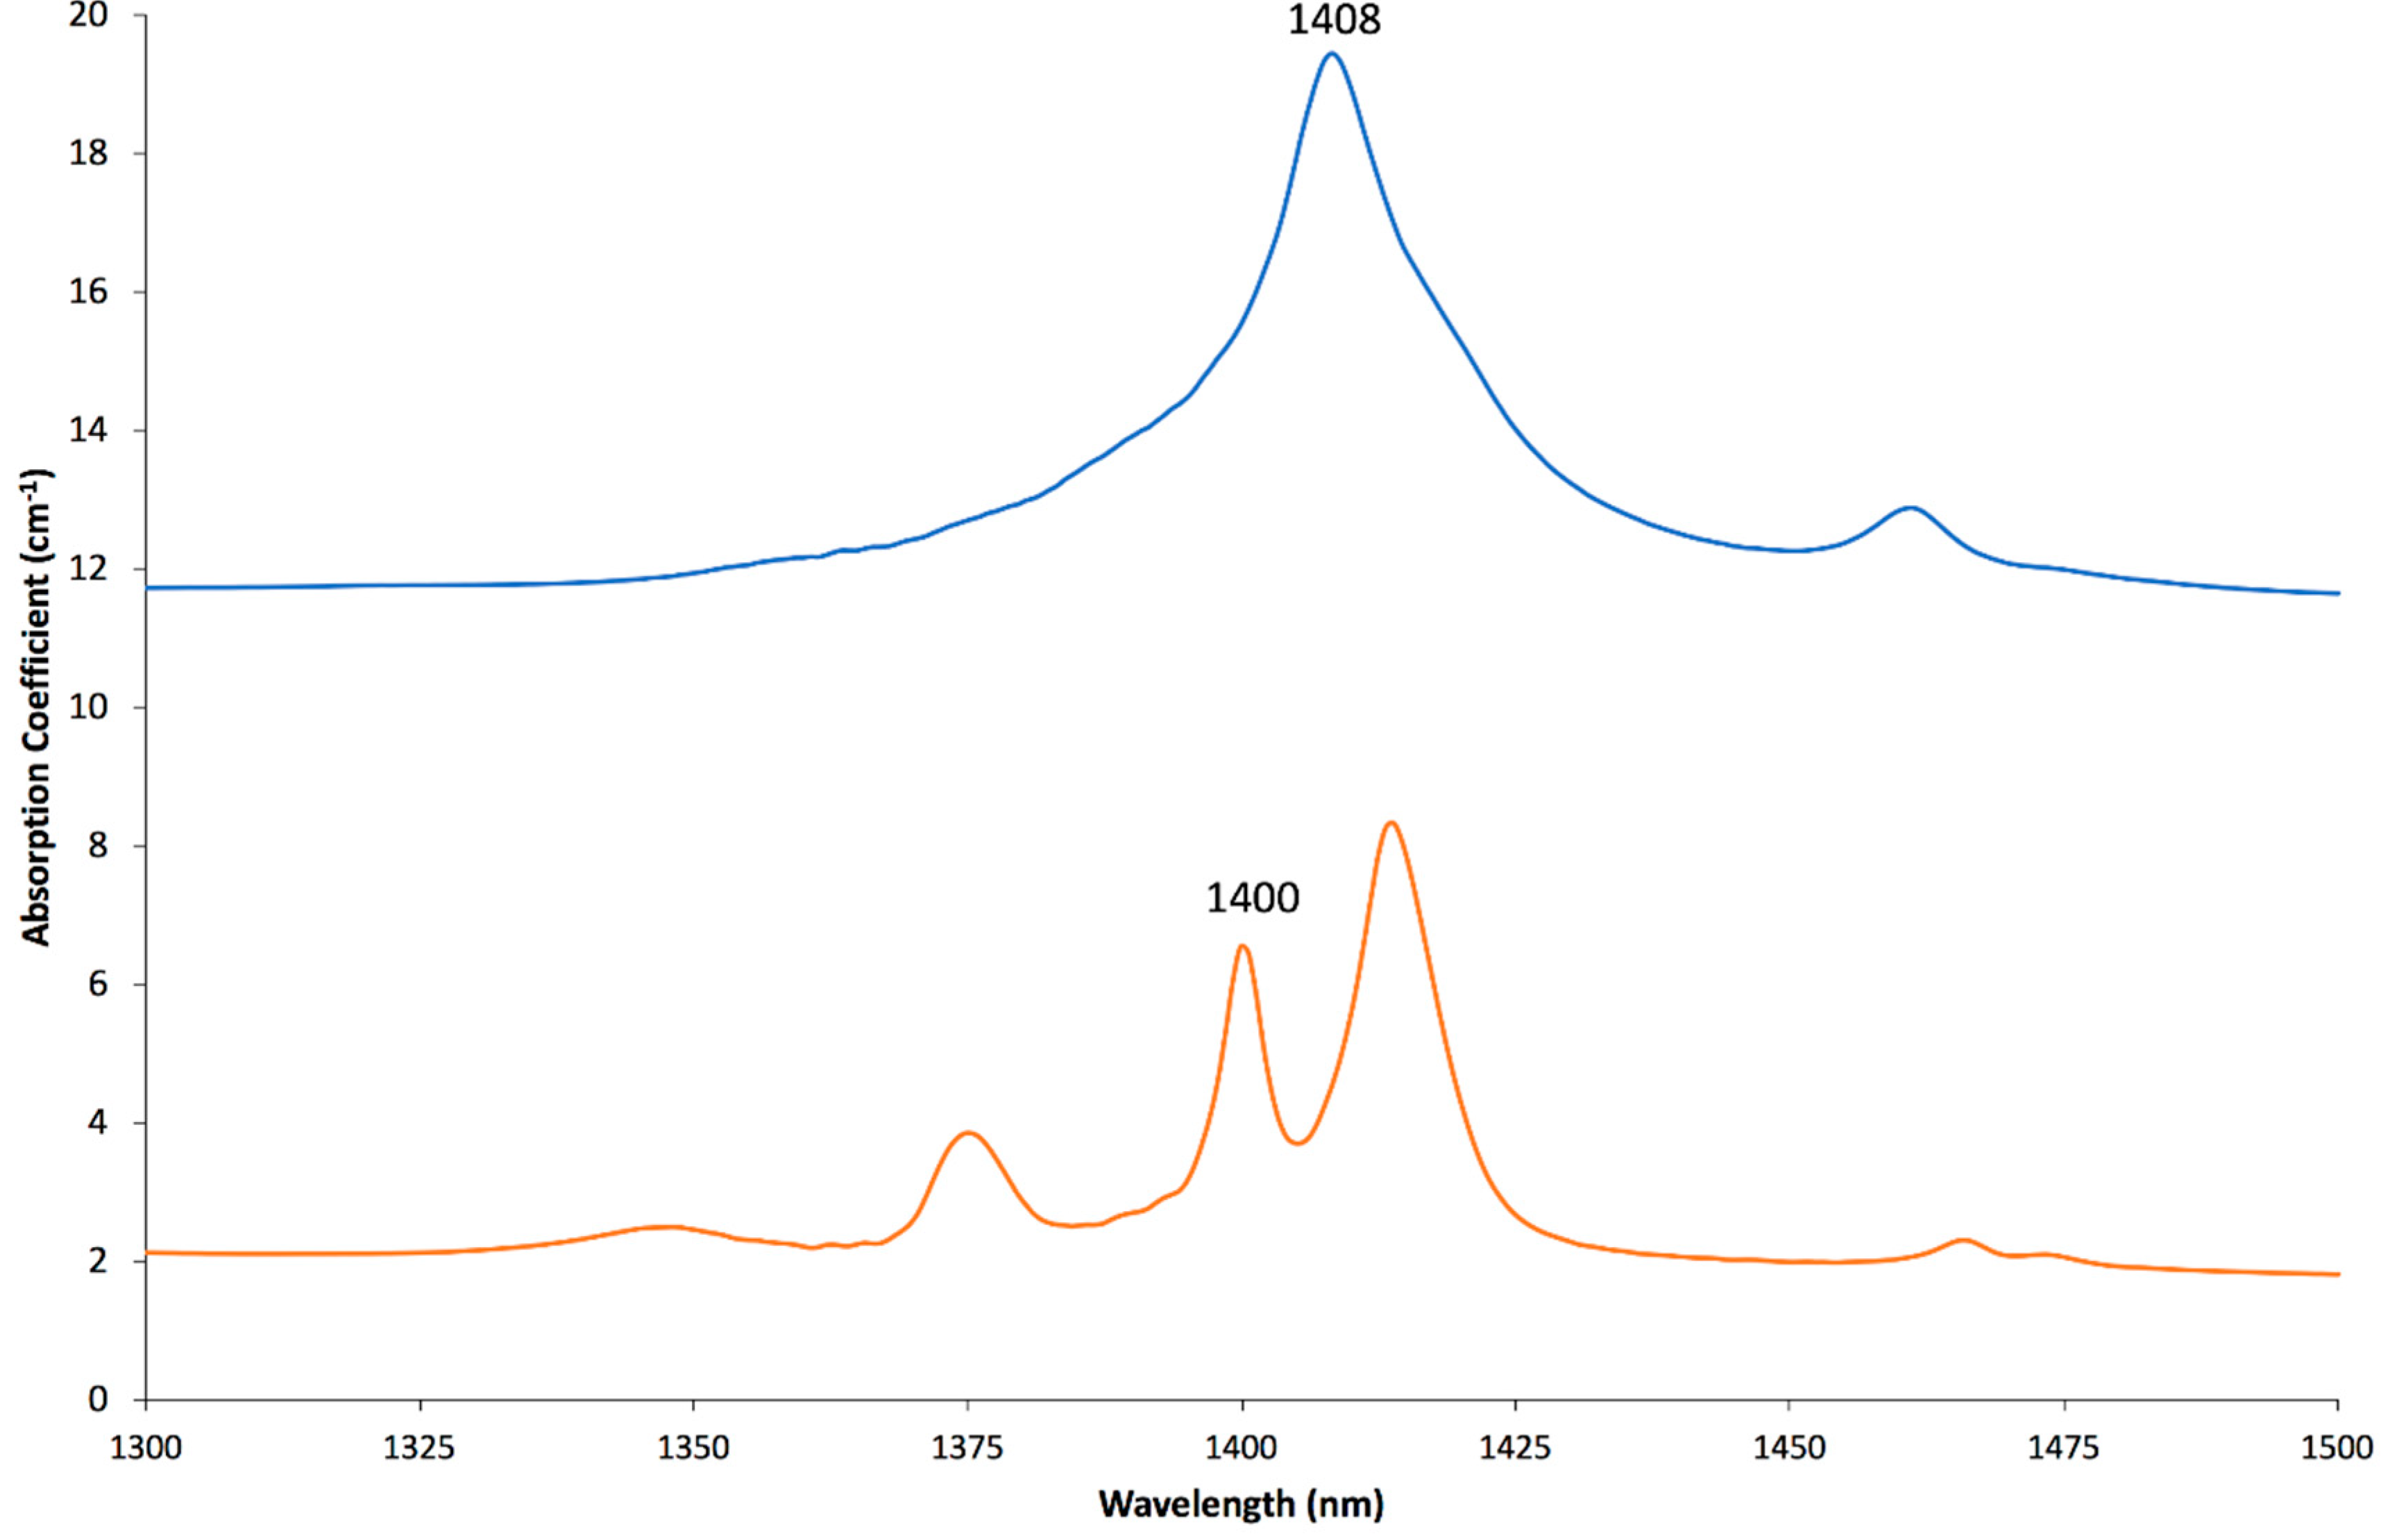
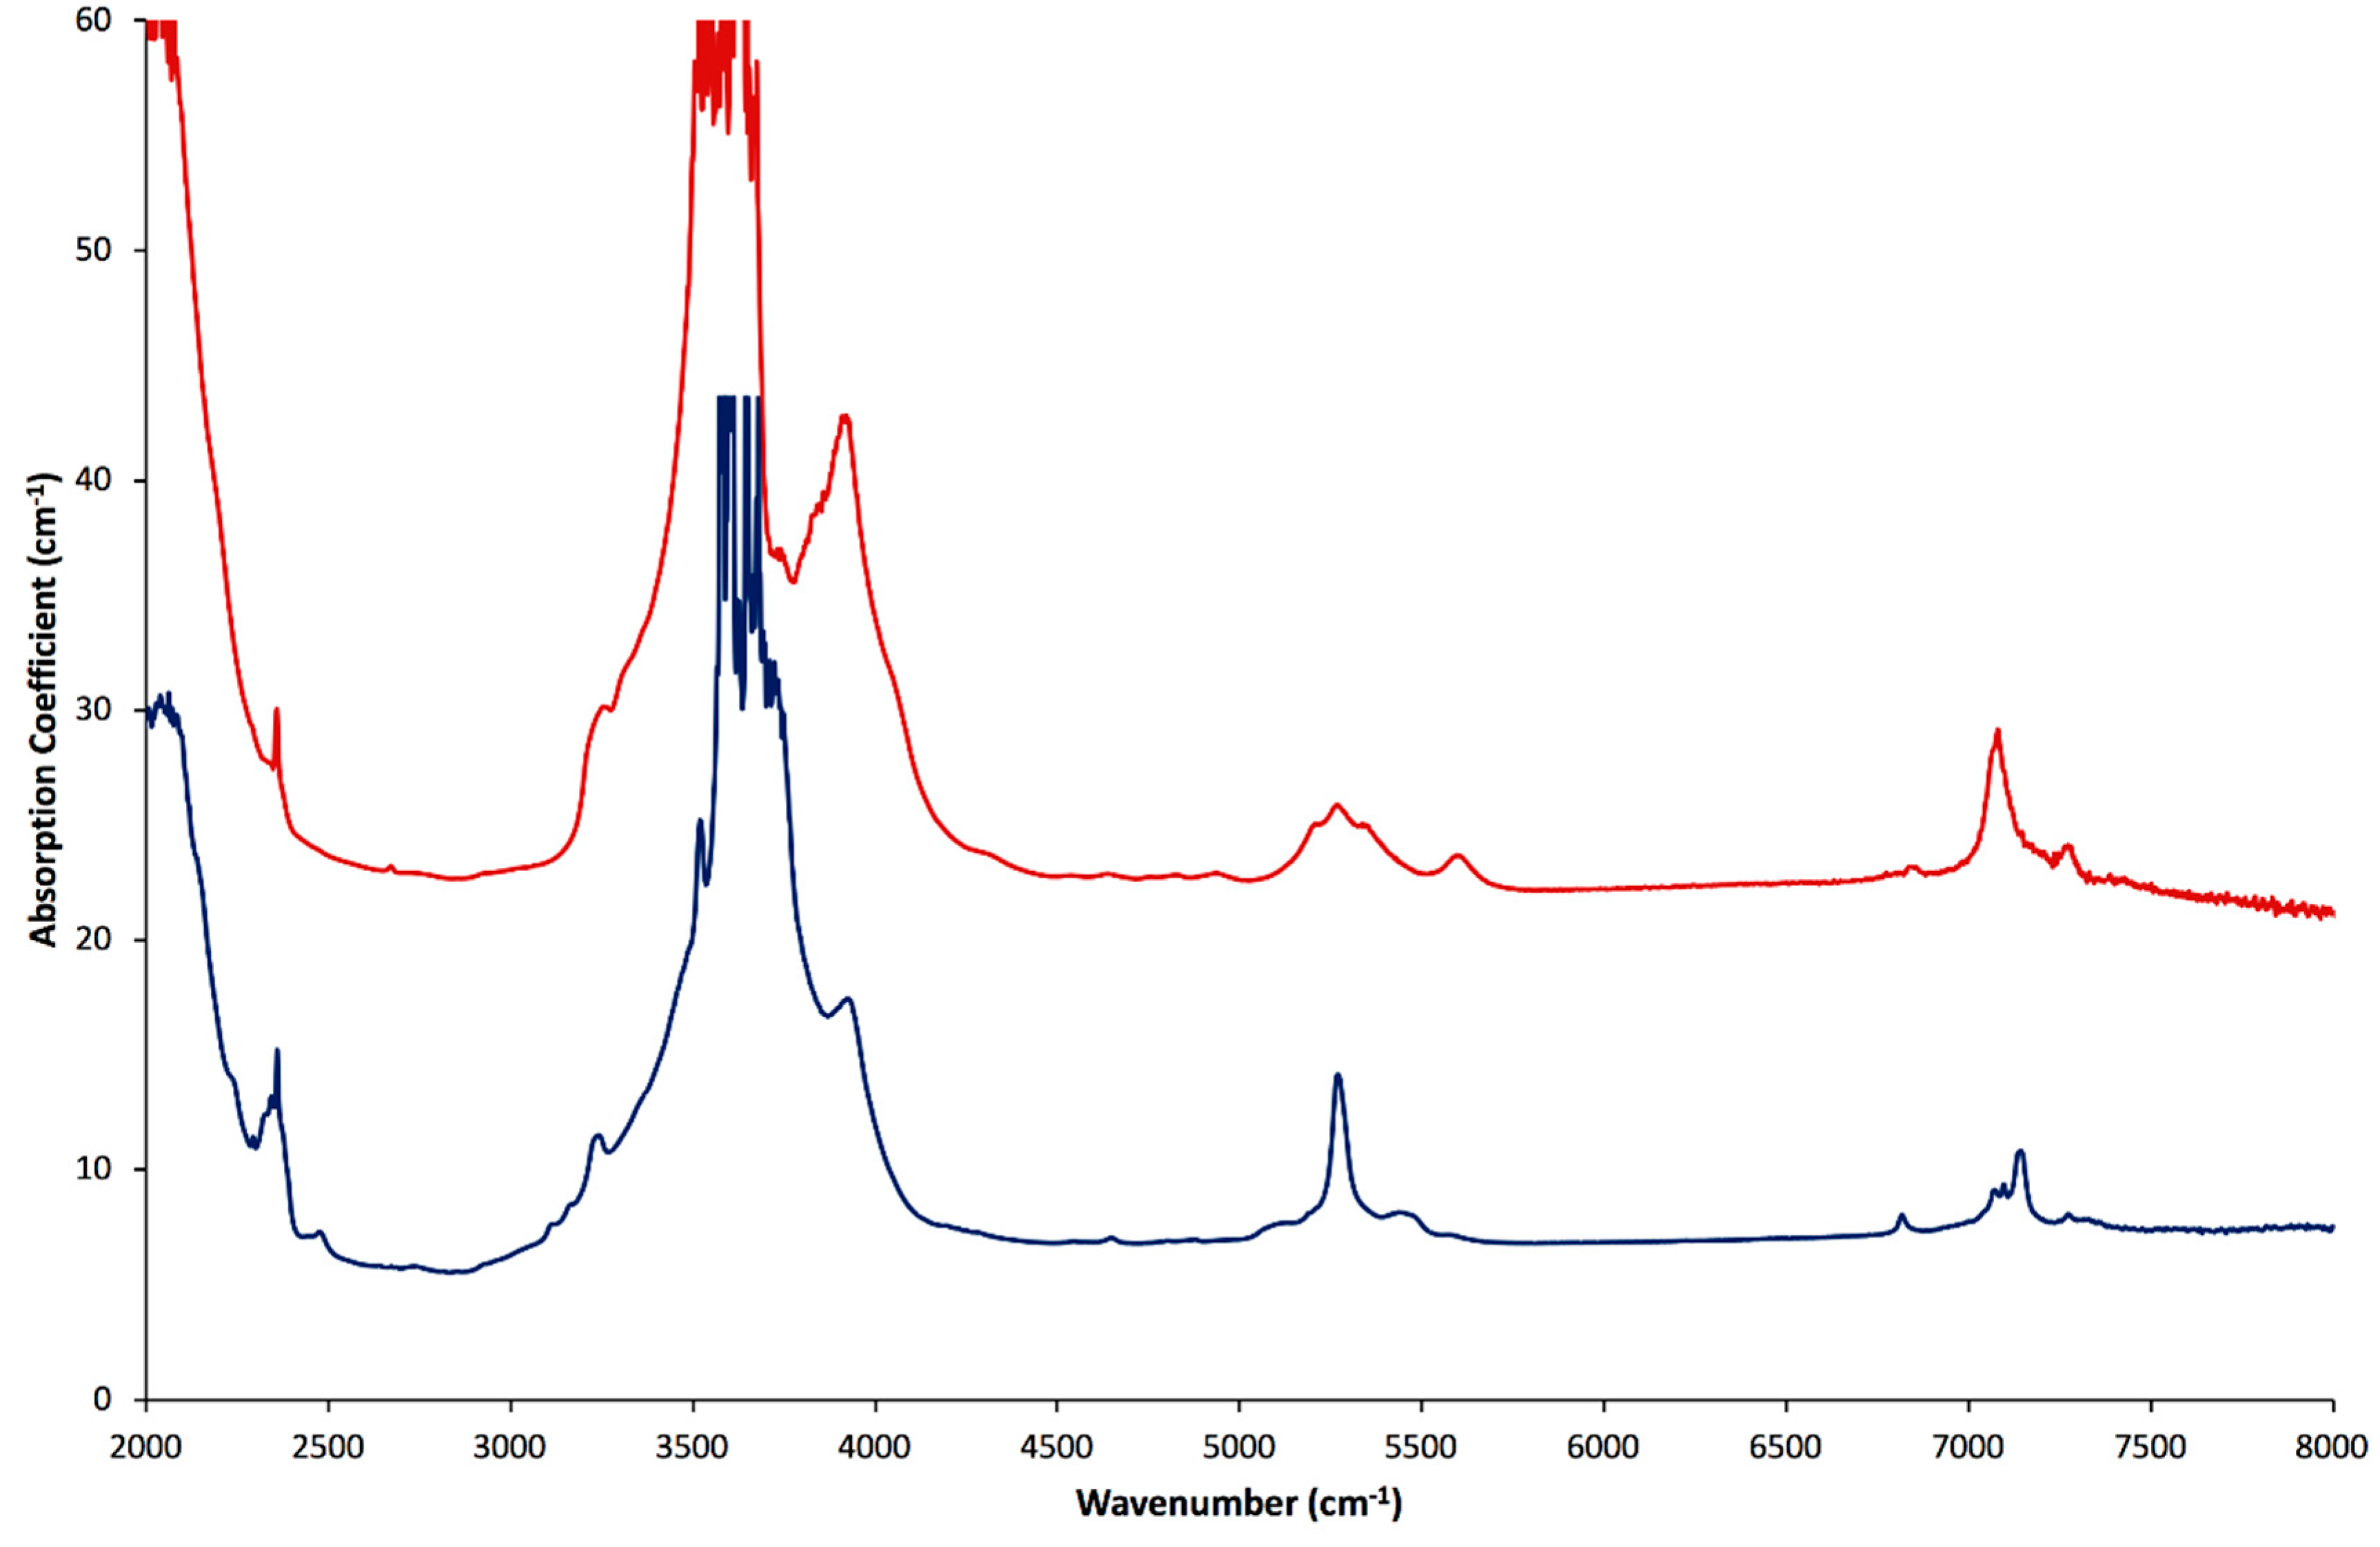
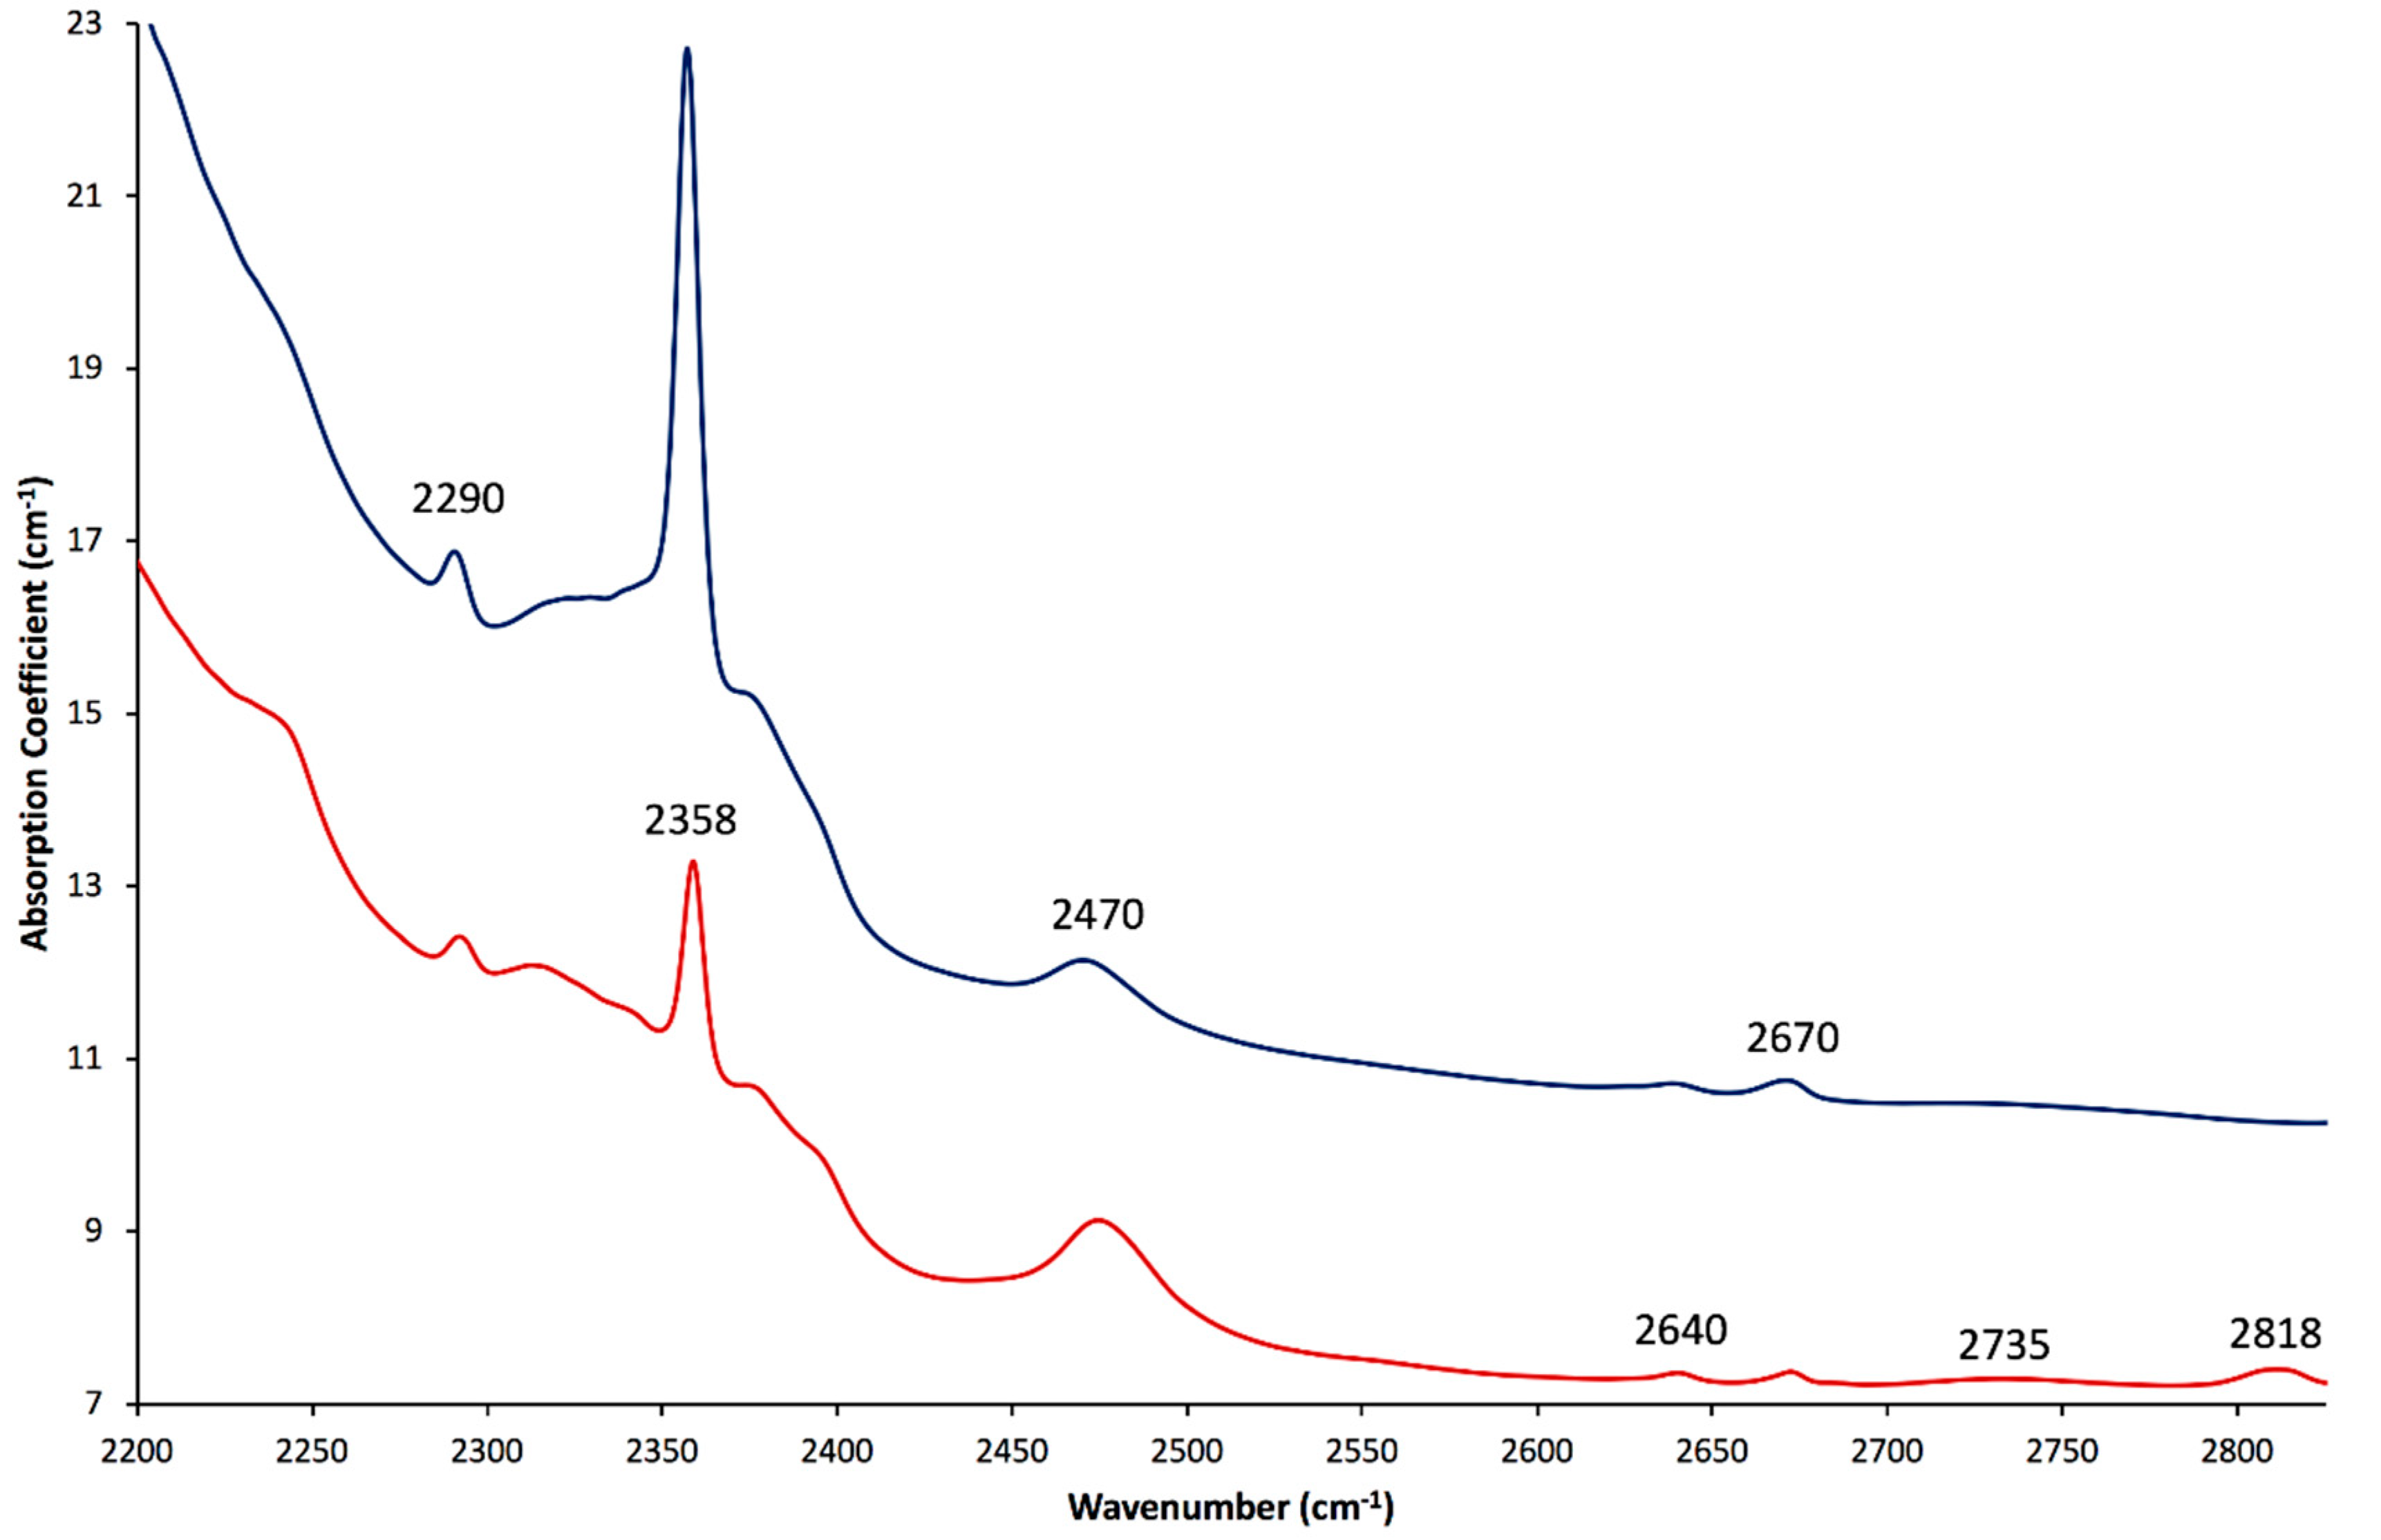
3.3. FTIR Spectroscopy

FTIR spectra were acquired on randomly oriented samples (see an example in Figure 19). At around 3500 cm−1, where the vibrations linked to water molecules’ stretching are situated, all samples presented complete absorption due to their thickness. From 4500 to 6000 cm−1, the combination water bands are situated with a series of bands at around 5270 cm−1 that are linked to Type I and Type II water. From 6500 cm−1 (1538.5 nm) to 7500 cm−1 (1333.3 nm), overtone and combination water bands are also observed, the same as was observed in the NIR region presented above [88,93,95].
At the region from 2200 to 2850 cm−1 (Figure 20), a series of bands linked to H2O, D2O, CO2 and chlorine are present [66,76,95,96]. More precisely, the bands situated at 2470, 2640, 2670 and 2735 cm−1, which are related to the stretching vibration of deuterated water, are observed in all the spectra of all the studied samples, with differing intensities [97]. An additional band at around 2290 cm−1, is linked to water, is also observed in all studied samples; it is also found in some hydrothermal synthetic emeralds [14,98]. The series of bands from 2300 to 2400 cm−1 (with the main band situated around 2358 cm−1) is attributed to CO2 and vibrations linked to the presence of 13C and 18O isotopes [66,95]. The band at around 2818 cm−1 was found only in the samples from Colombia and Afghanistan and none of the others, but it was also observed in emeralds from Norway; this band is possibly linked to chlorine [65,66].
Emerald FTIR spectra display strong polarisation phenomena [95,96]. For example, deuterated water bands are distinctly more pronounced in spectra acquired along the extraordinary-ray, and CO2 bands are more pronounced along the ordinary-ray [95,96].

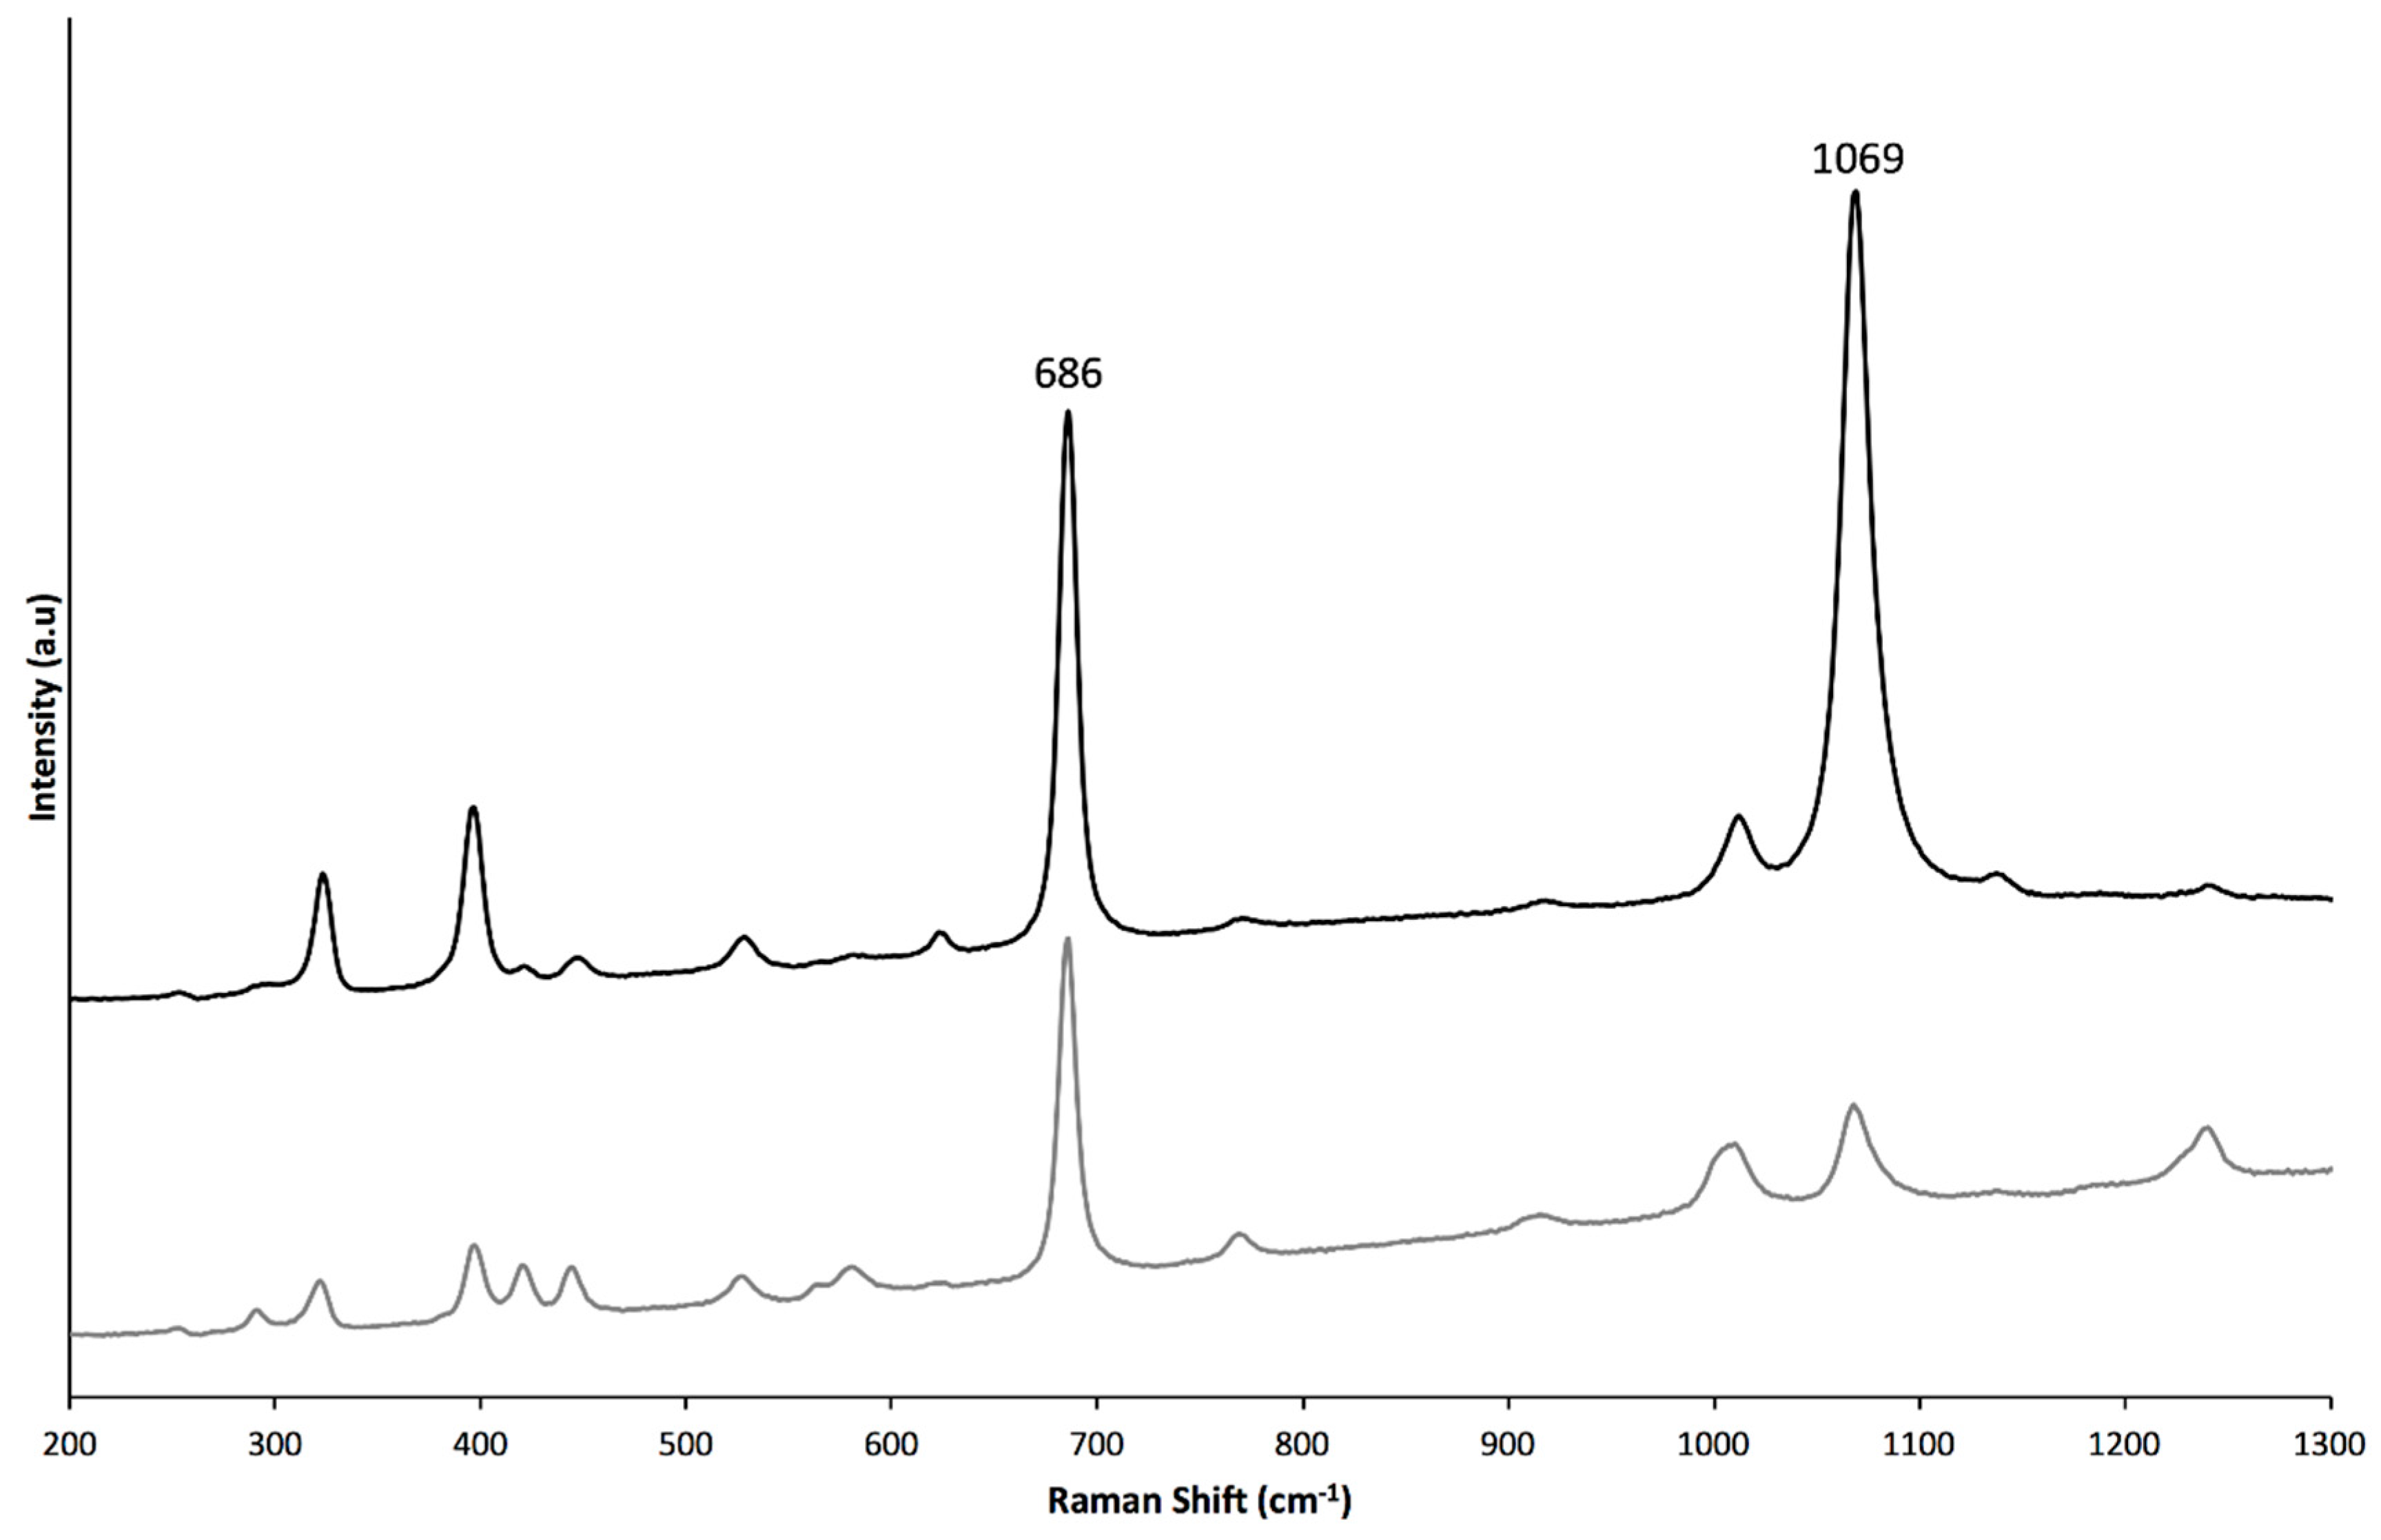
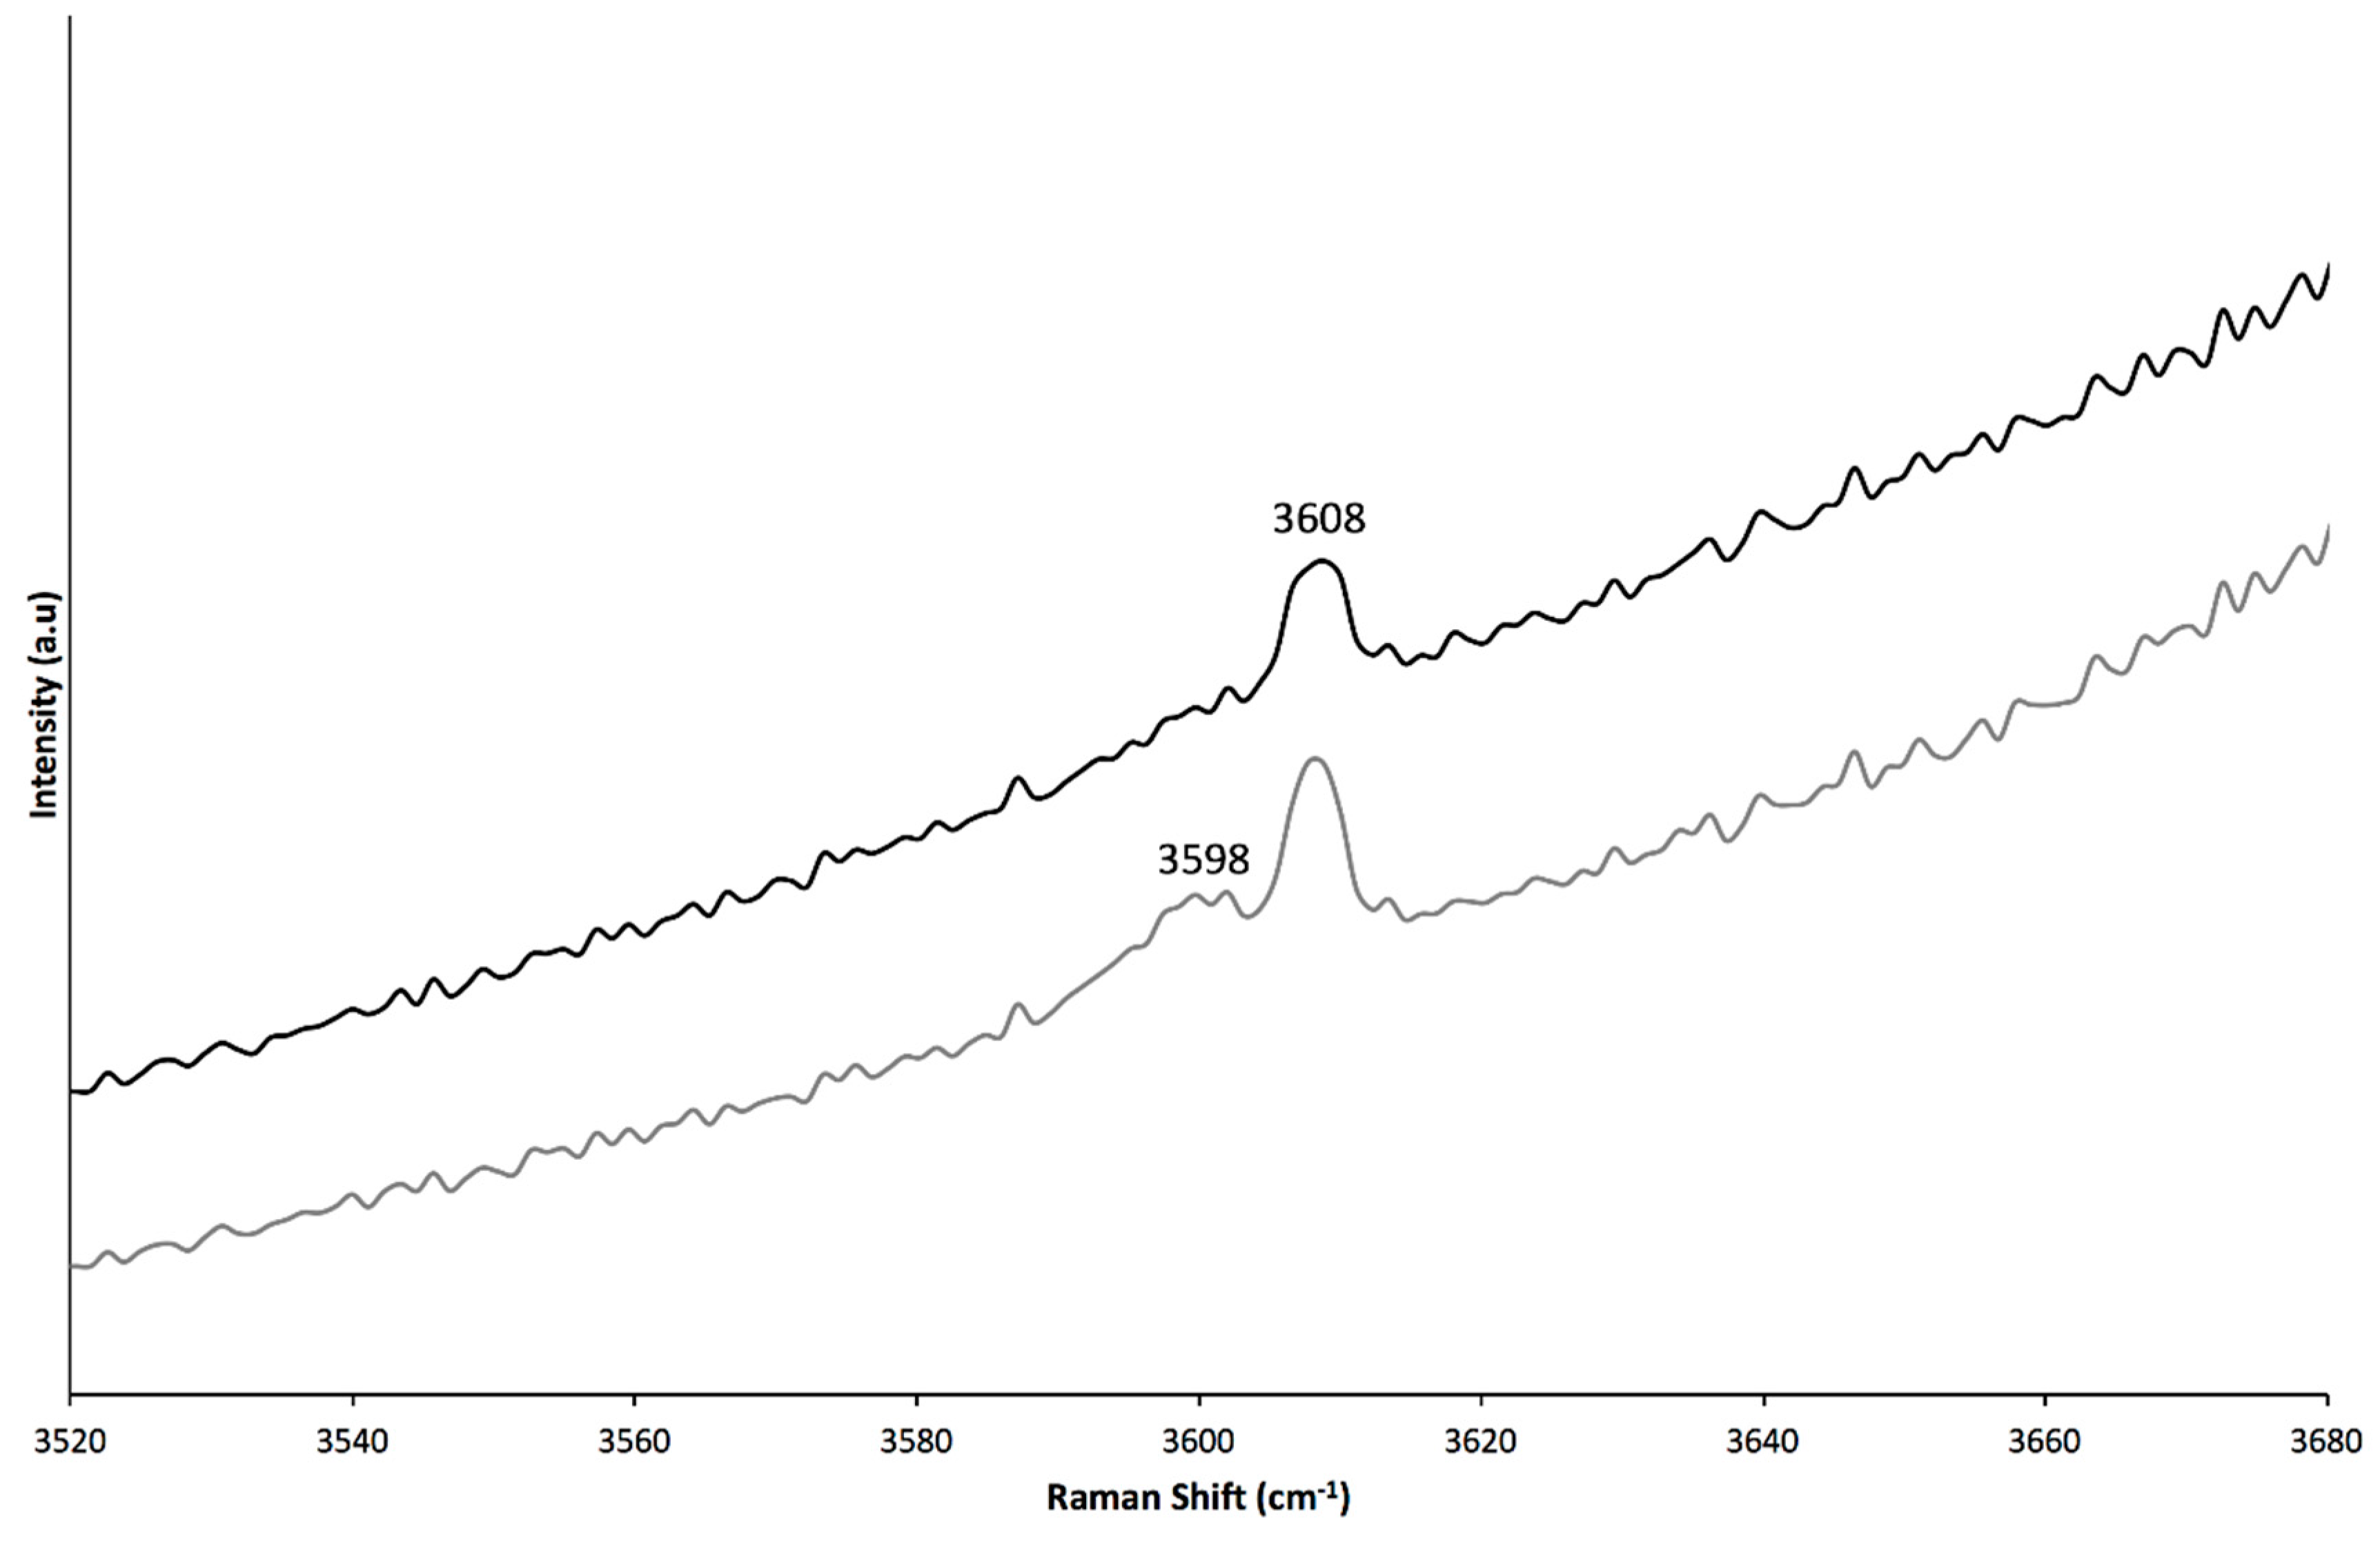
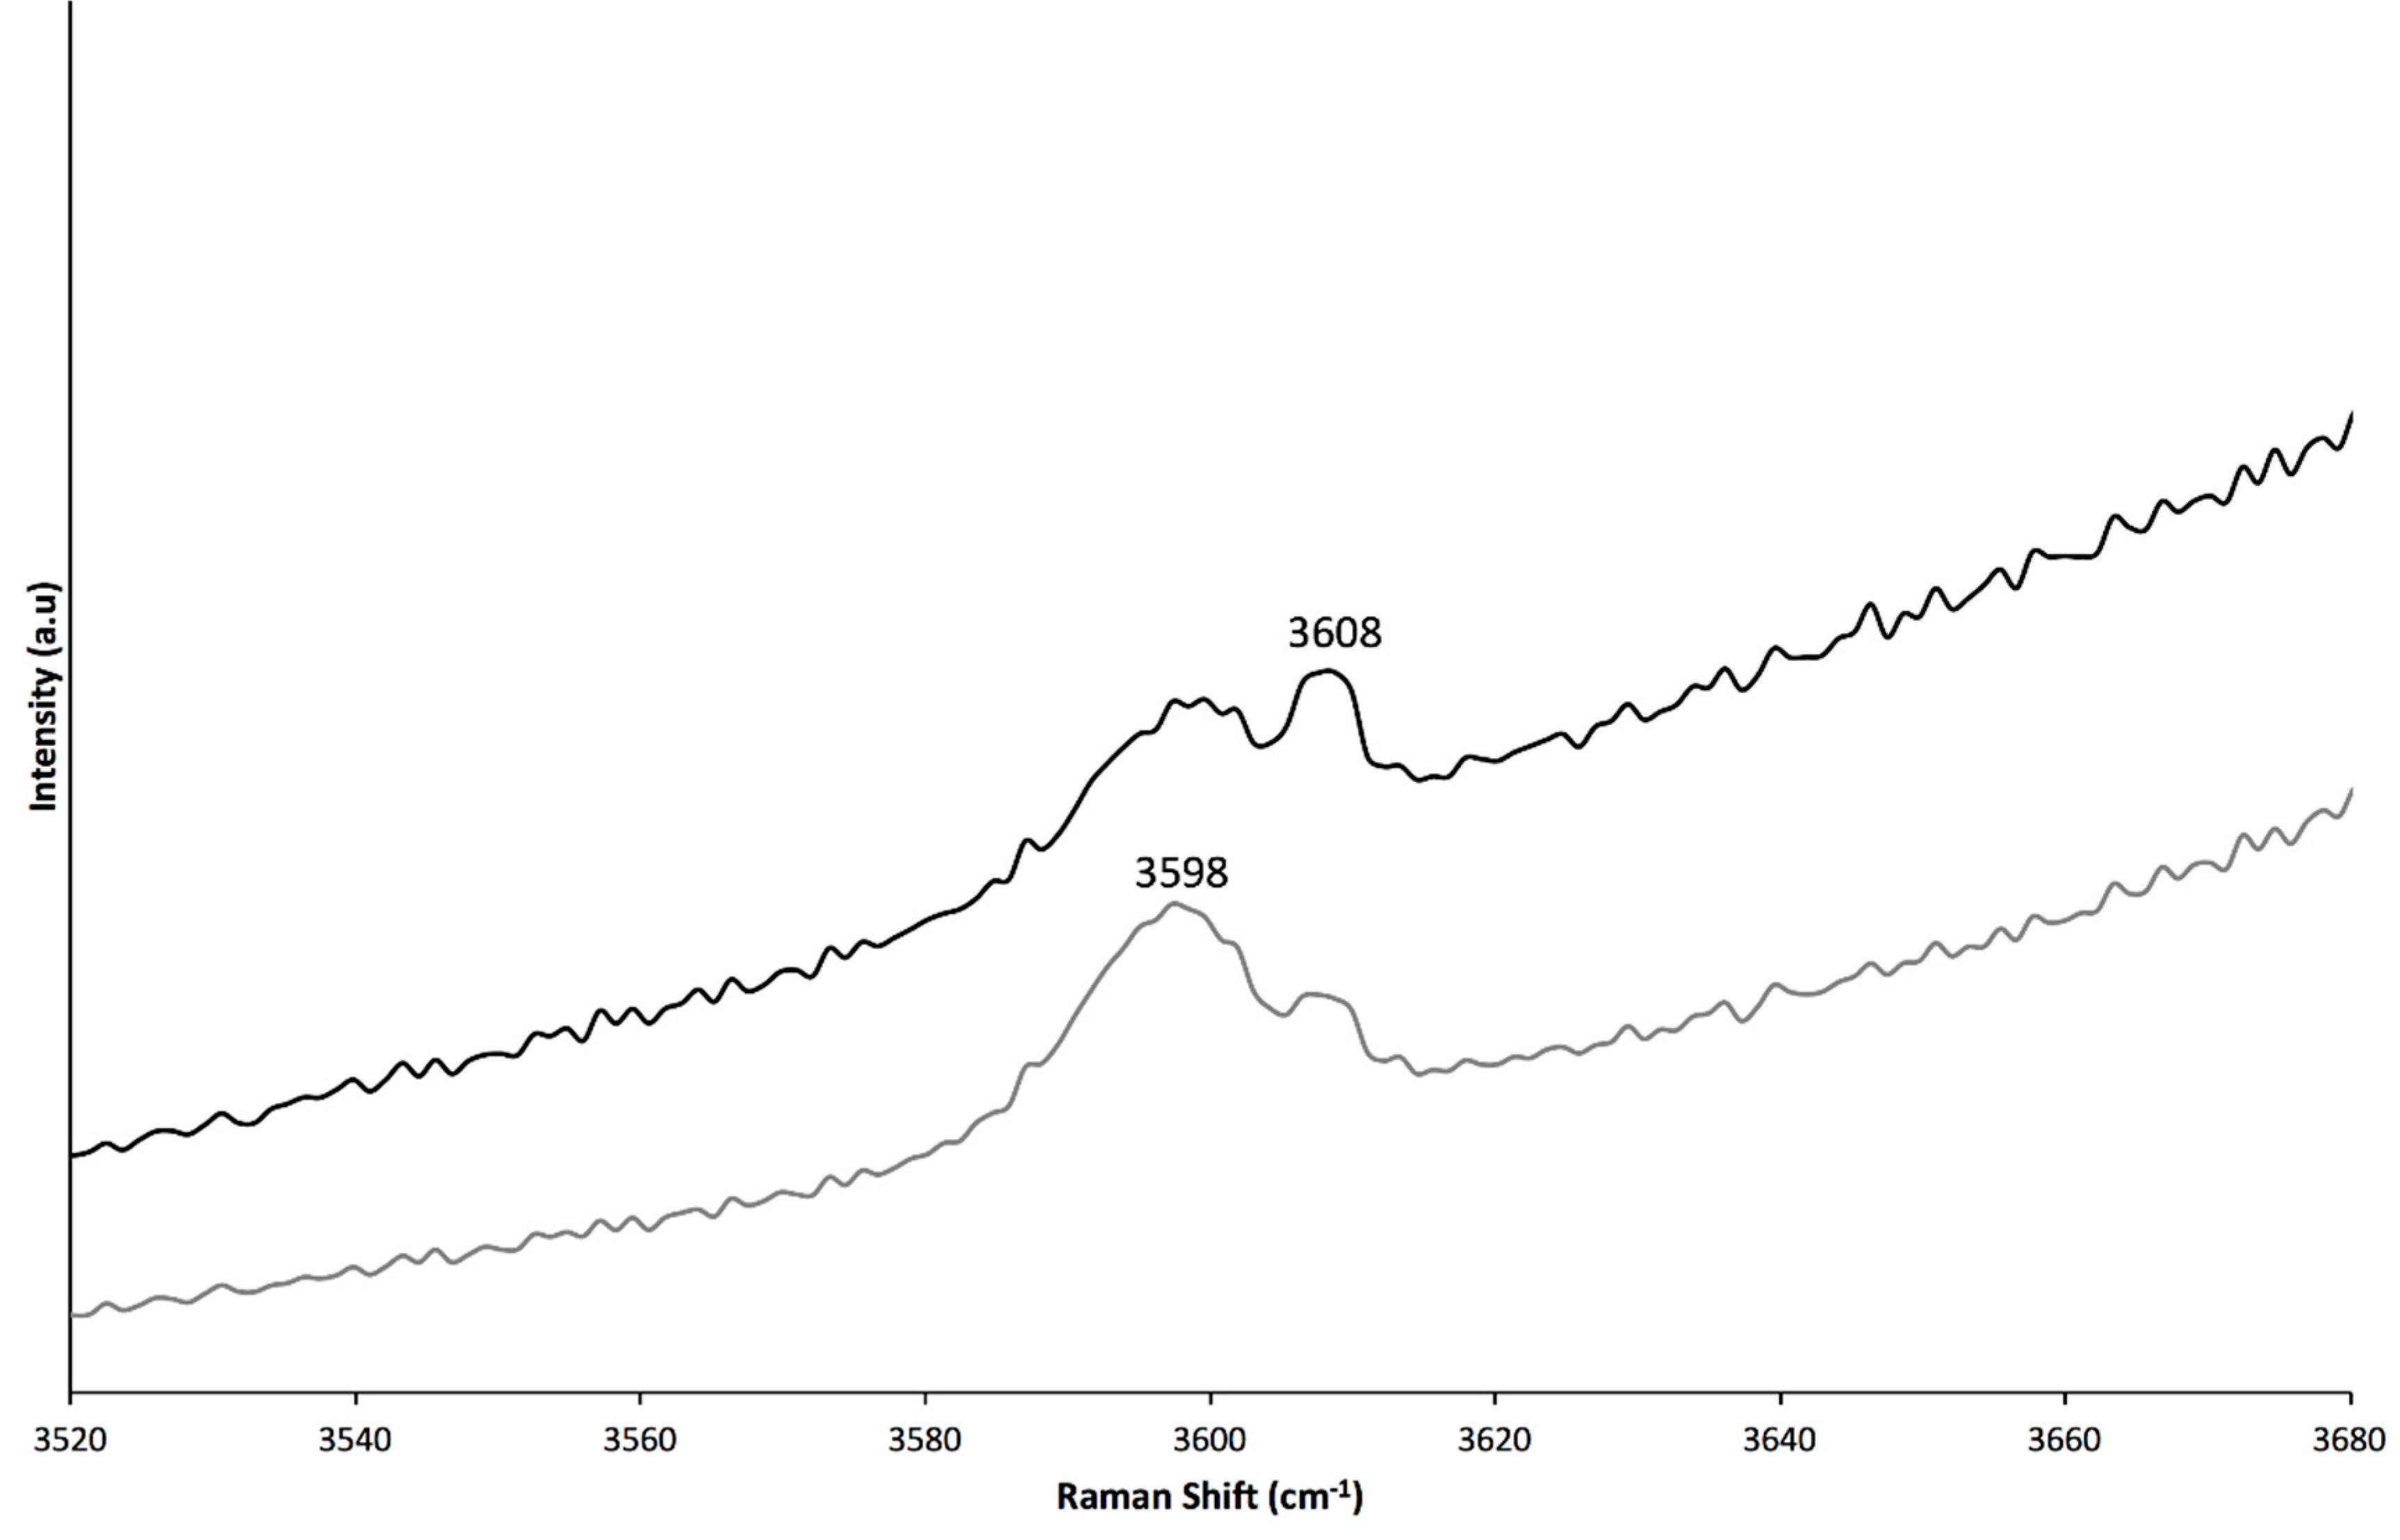
3.4. Raman Spectroscopy

Raman spectra ranging from 200 to 1300 cm−1 and from 3520 to 3680 cm−1 were acquired on different directions, with the laser beam perpendicular to the c-axis (spectra in black colour) and parallel to the c-axis (spectra in grey colour), without the use of a polariser. The results for an emerald from Colombia are shown in Figure 21 and Figure 22, of an emerald from Ethiopia in Figure 23 and of an emerald from Zambia in Figure 24. Sometimes, it was challenging to acquire a proper spectrum with the 514 nm laser due to emeralds’ chromium luminescence. Bands linked to Si6O18 ring vibrations are situated below 600 cm−1; the main band at around 686 cm−1 is due to Be‒O stretching vibrations, and the main band at around 1070 cm−1 is due to Si‒O and/or Be‒O stretching [58,72,95,97,99,100]. The relative intensities of the Raman bands change following the different orientations; the band at around 686 cm−1 is more intense in spectra acquired with the laser parallel to the c-axis and the band at around 1070 cm−1 is more intense in spectra acquired with the laser perpendicular to the c-axis (Figure 21). The exact position and full width half maximum (FWHM) of the band at 1070 cm−1 was found to be useful for separating natural emeralds from their synthetic counterparts, as well as low-alkali from high-alkali emeralds, where the observed differences are due to silicon substitution with aluminium, beryllium and lithium along with sodium, potassium and caesium for charge compensation [72,73]. In the samples studied, the FWHM of the 1070 cm−1 band (measured from the spectra acquired with the laser perpendicular to the c-axis) in samples with higher alkali content is generally higher (FWHM < 22 cm−1 can be considered for those emeralds of low to medium alkali content), but the position of the band is not shifted towards higher Raman shifts as alkalis increase (see Table 5). It is worth noting that some of the samples studied showed different trends compared with [73]; the samples from Russia and Brazil (Itabira) presented a lower content of alkalis. Additionally, the FWHM depends on the spectral resolution; thus, it can be slightly different when using a different resolution.
The bands at around 3608 cm−1 and 3598 cm−1 are due to Type I water and Type II water, respectively, which also present polarisation phenomena (see again Figure 22, Figure 23 and Figure 24) [67,69,99]. In the present study, the ratios of these Raman peaks’ intensities (I3608/I3598) were greater for the spectra acquired with the laser parallel to the c-axis. The described relative intensities presented in Table 5 are for the spectra acquired with the laser perpendicular to the c-axis.
A clear separation between emeralds from Type IA and Type II occurrences cannot be made using Raman spectra (see again Table 5). This is due to the variation of alkali elements’ content in the samples from the various geological environments, which might overlap. The Raman peak intensity of I3608 is higher than I 3598 (I3608 > I3598; see Figure 22) for all studied samples from Colombia, some samples from Afghanistan, some from Brazil and from Russia; it is more or less equal (I3608 = I3598; see Figure 23) for most samples from Afghanistan, Brazil and Russia, as well as some from Ethiopia, and lower (I3608 < I3598; see Figure 24) for all studied samples from Madagascar, Zambia and Zimbabwe as well as most from Ethiopia (see Table 5).

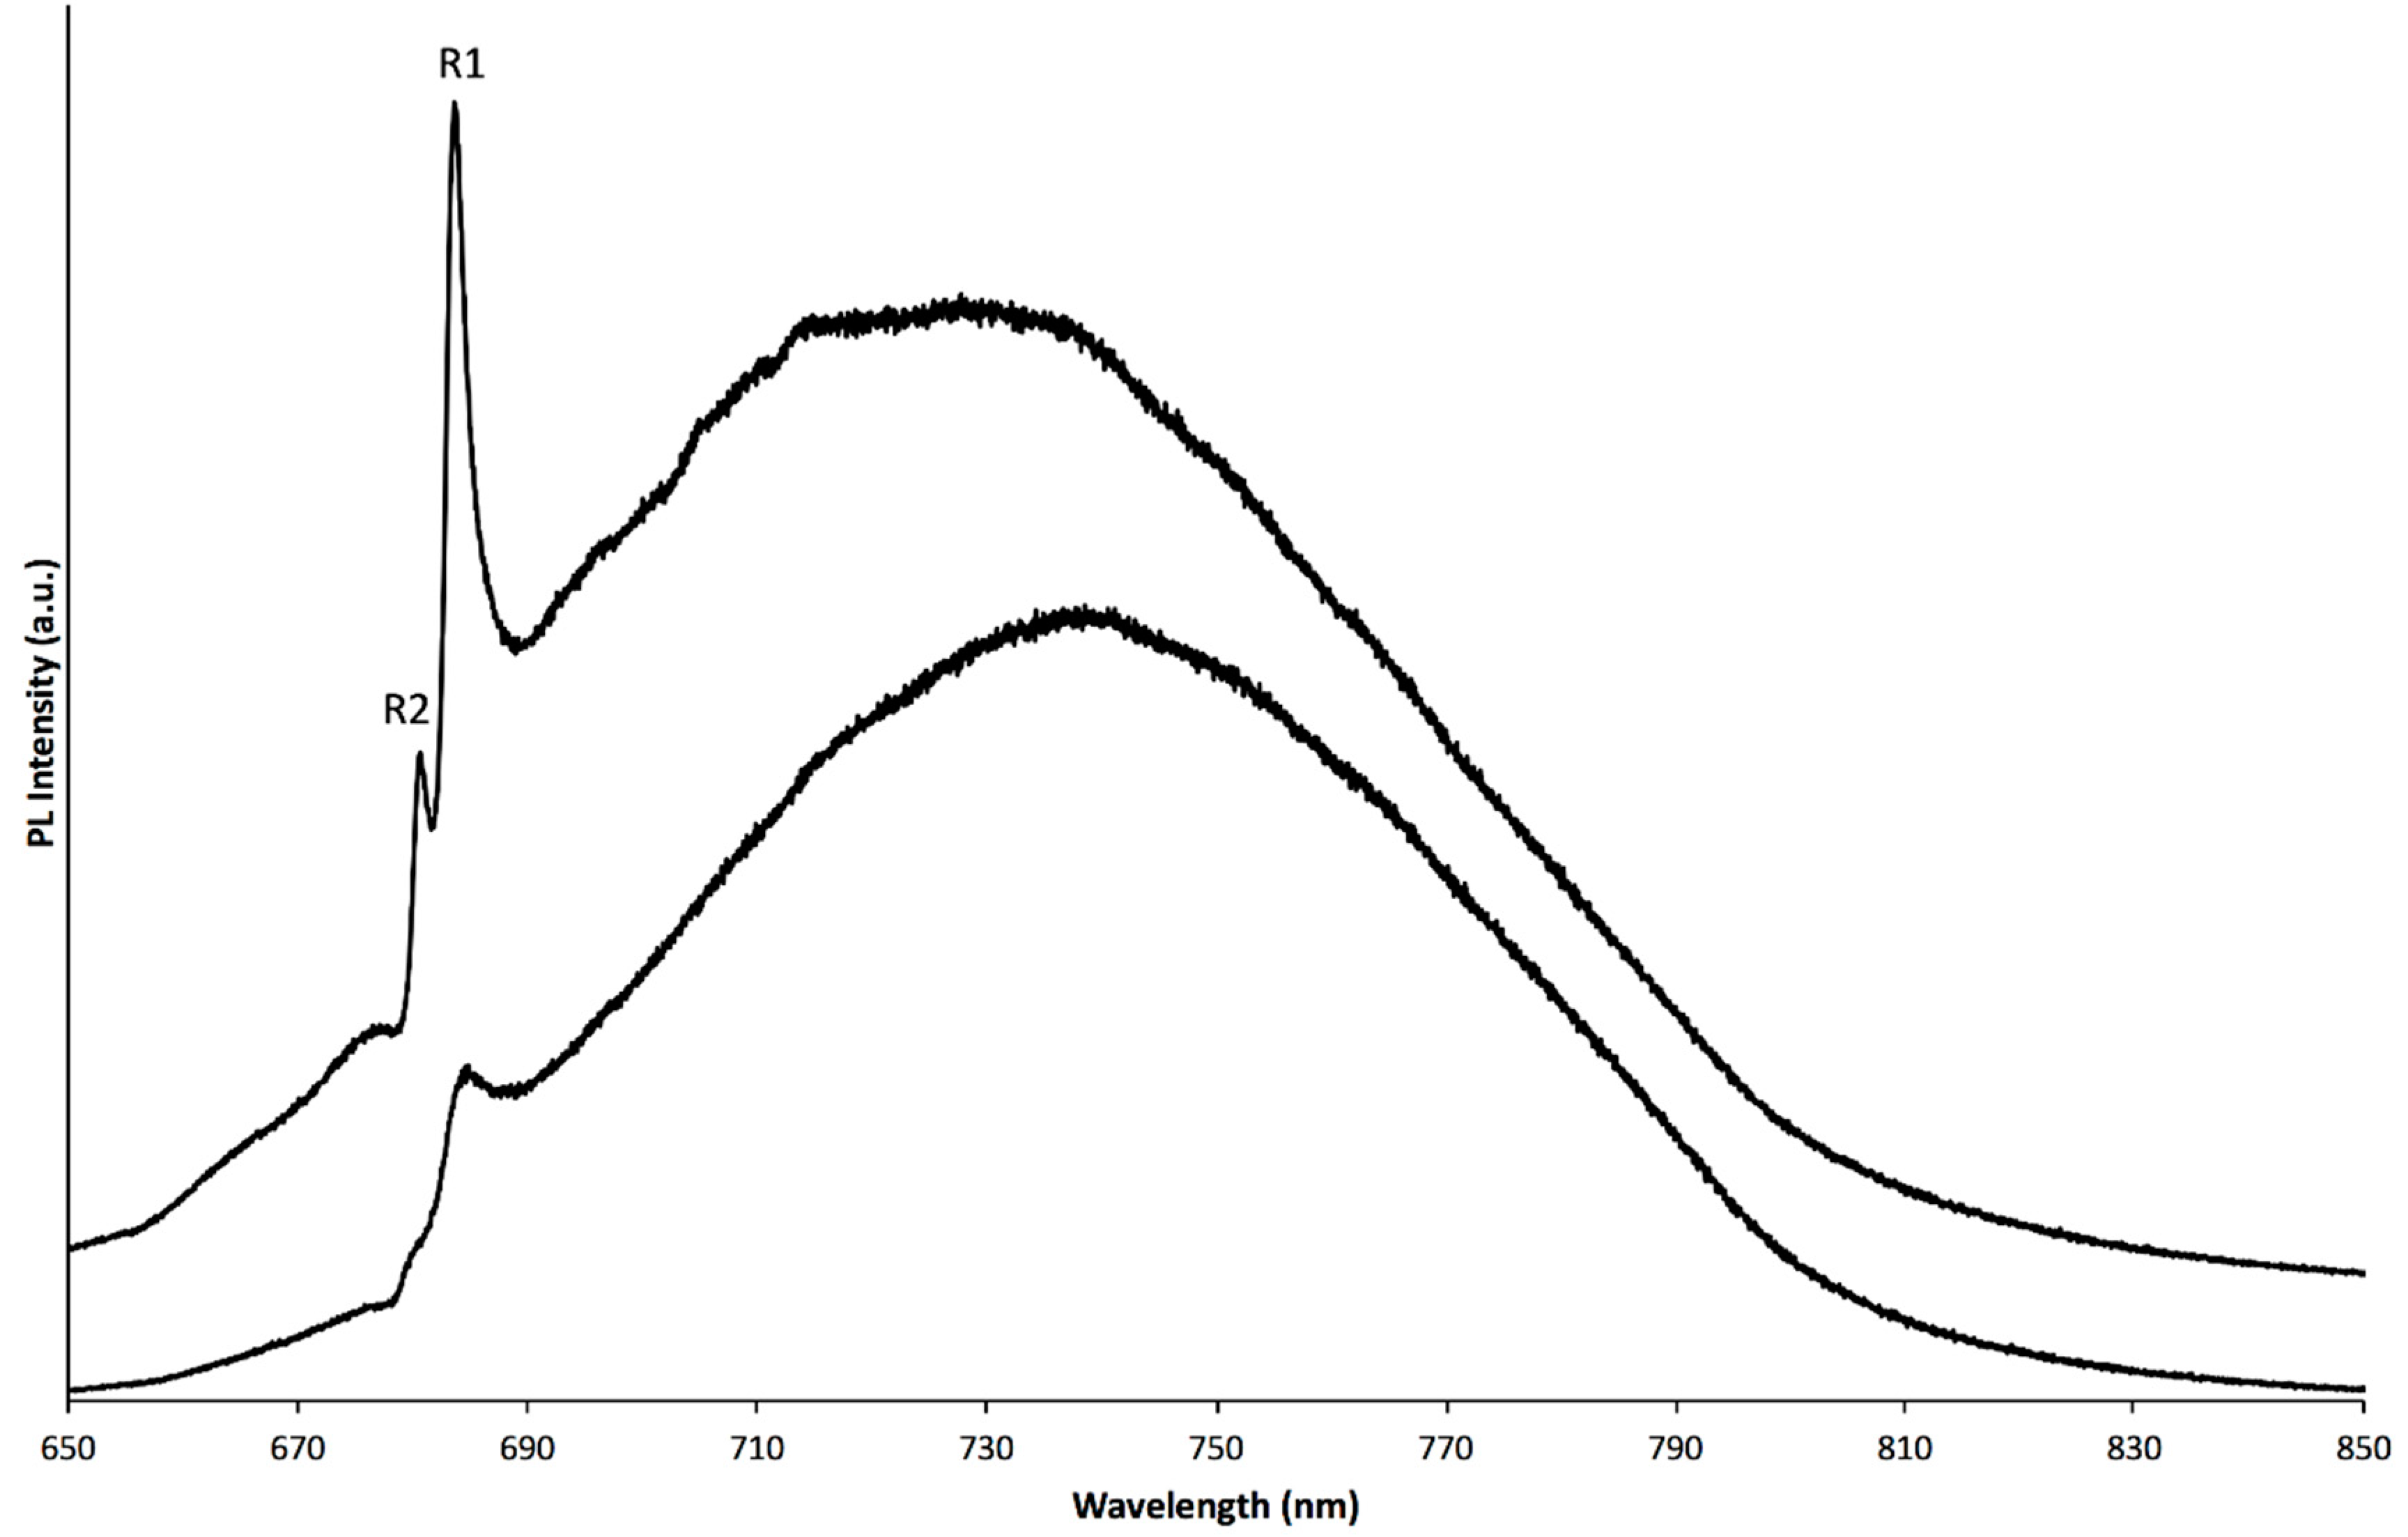
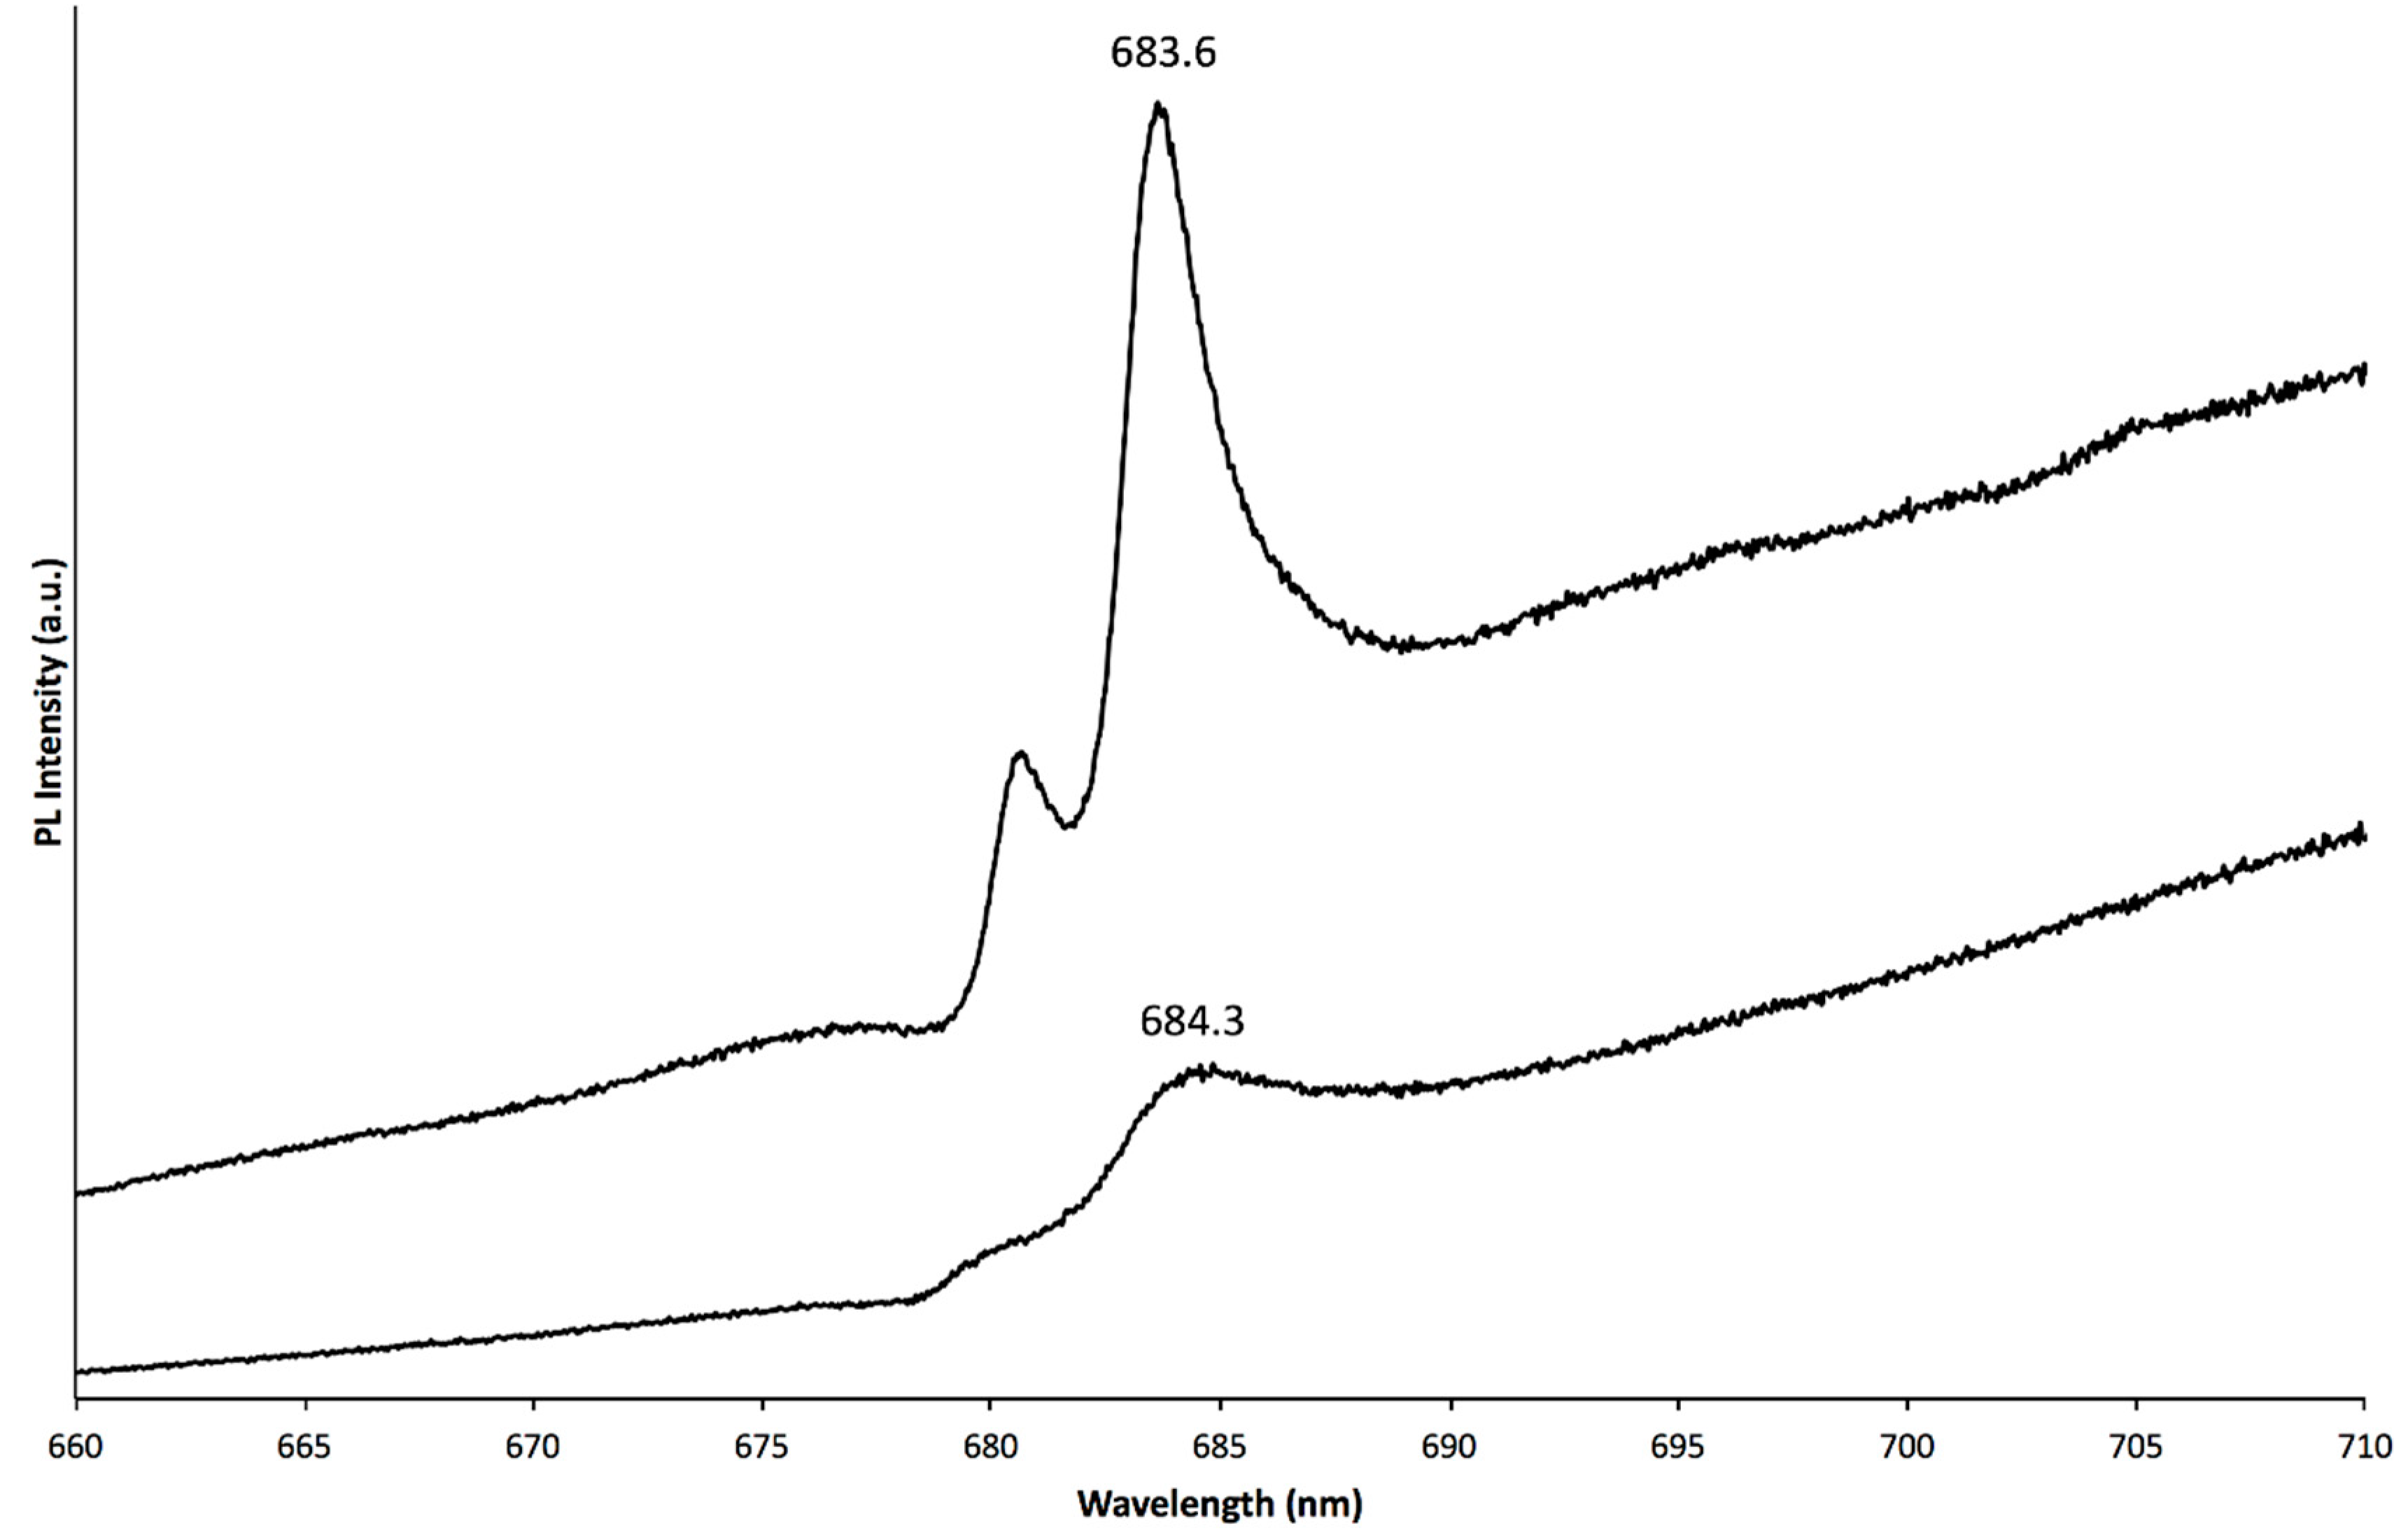
3.5. PL Spectroscopy

PL spectroscopy of emeralds was suggested as a useful tool to separate natural emeralds from synthetic ones, as well as to aid in emerald origin determination [58,61,72,74]. PL bands’ intensities and positions vary slightly in different orientations relative to the c-axis [74]. In Figure 25, the photoluminescence spectra with a spectral range from 650 to 850 nm, acquired with the laser beam perpendicular to the c-axis, of emeralds from Colombia (upper spectrum) and Zimbabwe (bottom spectrum) are presented. Both samples presented two sharp bands at around 680 and 684 nm linked to Cr3+ (also known as R2 and R1 lines, respectively), as well as a broad band centred at around 720–740 nm, also linked with chromium [74,101]. It has been suggested that the exact position of the R1 band can give valuable clues on emeralds’ natural vs. synthetic nature (no synthetics with R1 > 683.7 nm) as well as on their geologic origin (schist-origin emeralds with R1 < 683.9 nm [74]; see also Figure 26). Table 5 lists the exact position ranges of this band in the spectra of the studied samples. The studied samples show similar trends to those previously presented [74]; however, the emeralds from Brazil and Russia presented R1 bands shifted towards lower wavelengths and at 683.9–684 nm and 683.7–683.8 nm, respectively. Additionally, the R1 band of the studied samples from Afghanistan can vary in position, ranging from 683.6 to 684.2 nm.

4. Conclusions

LA-ICP-MS measurements on emerald samples from the eight most important sources reveal a relatively low lithium content (7Li < 200 ppmw) for all studied emeralds from Type II occurrences (Afghanistan and Colombia). Additionally, certain emeralds belonging to Type IA occurrences (all samples from Brazil and Madagascar) can also present low lithium content (7Li < 200 ppmw), whereas the emeralds from other Type IA occurrences (Ethiopia, Russia, Zambia and Zimbabwe) present medium to high lithium contents (7Li > 250 ppmw). Measurements of the concentrations of a combination of alkali elements present in Type IA and Type II occurrences can help with the identification of emeralds from different mining areas. Scandium, manganese, cobalt, nickel, zinc and gallium can further aid with the separation. Origin determination cannot be performed by only studying one element or a single binary plot; it requires a combination of several.
UV-Vis spectra are useful in the separation of Type II emeralds from Type IA emeralds as the former contain iron-related bands of low intensity and the latter are of high intensity. Other spectroscopic data (FTIR, Raman and photoluminescence spectroscopy) on emeralds can further help to separate emeralds with low alkali element contents from those with high alkali element contents. However, there is an overlap between samples from different geological environments; separation using solely these methods should be undertaken with caution.
Apart from the microscopic characteristics, it seems that using the combination of spectroscopic and chemical characteristics (on green zones) presented in this work, a gem-quality emerald of “unknown” location and of relatively large size (>1 ct), similar to client stones submitted to gemmological laboratories, can be identified. First sorting could be done by using UV-Vis spectroscopy and the intensity of iron-related bands, as emeralds from Type IA occurrences (Brazil, Ethiopia, Madagascar, Russia, Zambia and Zimbabwe) contain intense iron-related bands and in emeralds from Type II occurrences (Afghanistan and Colombia) iron-related bands are absent or of low intensity. Emeralds from Type IA occurrences can be separated into those with low lithium (<200 ppmw for emeralds from Brazil and Madagascar) and those with medium to high lithium (>250 ppmw for emeralds from Ethiopia, Russia, Zambia and Zimbabwe). Low-lithium emeralds from Brazil contain less sodium, less potassium and no (BQL) nickel as well as more zinc compared to those from Madagascar, so plots combining these elements could help to separate these two. Medium- to high-lithium emeralds from Russia contain less sodium and potassium and rubidium than those from Ethiopia, Zambia and Zimbabwe. Samples from Zimbabwe present higher rubidium, gallium and manganese compared to those from Ethiopia and Zambia. Samples from Zambia contain more caesium and lithium and less scandium than the samples from Ethiopia, so they can be separated using plots combining these elements as well as a binary plot of the 133Cs vs. 23Na/7Li ratio. Samples from Type II occurrences from Afghanistan and Colombia can be separated as the former contain higher concentrations of potassium, rubidium and caesium than the latter, and the scandium and gallium ratios differ as well.
The abovementioned scheme should be confirmed after studying a larger sample from these areas and taking into account the microscopic features of the samples. Studies on a larger number of gem-quality samples of green to dark green colour from various mining areas in the same region, along with a detailed study of their host rocks (especially of Type IA emeralds), should be performed in order to better understand the link between the trace elements and their geology and to better predict possible variation in the trace elements of emeralds in the same mining region. Statistical analyses (e.g., discriminant analysis) of the chemical data should be performed, as this might provide an additional tool for emeralds’ geographic origin determination. Samples from less productive mining areas that have supplied gem-quality emeralds in the past, and might produce again in the future, should be also studied (e.g., Swat Valley, Pakistan; Mushakashi, Zambia; Bahia, Brazil). Additional measurements with a microprobe might help us to better understand the crystallochemistry of the samples. Standards for LA-ICP-MS made of doped emeralds with various elements might decrease any matrix effect and, in parallel, help with the measurement of trace elements with greater accuracy. Additionally, LA-ICP-MS with improved detection limit or analysis with secondary ion mass spectrometry (SIMS) may help further.
Polarised FTIR spectra on well-oriented samples should also be acquired in order to look for potential differences between samples from different mines. Polarized Raman spectra should also be collected in order to have a more accurate comparison between the vibrational data of different emeralds.

Supplementary Materials

The following are available online at https://www.mdpi.com/2075-163X/9/9/561/s1, Table S1: LA-ICP-MS analysis in ppmw of the studied emerald samples from Panjsher, Afghanistan; Table S2: LA-ICP-MS analysis in ppmw of the studied emerald samples from Itabira, Brazil; Table S3: LA-ICP-MS analysis in ppmw of the studied emerald samples from Coscuez, Colombia; Table S4: LA-ICP-MS analysis in ppmw of the studied emerald samples from Shakisso, Ethiopia; Table S5: LA-ICP-MS analysis in ppmw of the studied emerald samples from Mananjary, Madagascar; Table S6: LA-ICP-MS analysis in ppmw of the studied emerald samples from Ural, Russia; Table S7: LA-ICP-MS analysis in ppmw of the studied emerald samples from Kafubu, Zambia; Table S8: LA-ICP-MS analysis in ppmw of the studied emerald samples from Sandawana, Zimbabwe.

Author Contributions

S.K. formulated the paper, designed the experiments, participated in the data interpretation and wrote the manuscript. B.A.-S and F.M. prepared the experiments, did part of the LA-ICP-MS analysis, performed a data reduction, edited the manuscript and drew the figures and tables. S.S. designed, supervised and evaluated the LA-ICP-MS analysis. A.A.-A. selected the samples, designed the experiments and edited the manuscript.

Funding

This research received no external funding.

Acknowledgments

The authors wish to thank Dietmar Schwarz (ICA Gem Lab, Bangkok, Thailand) for the samples from Brazil and Russia, Christian Dunaigre (C. Dunaigre Consulting GmbH, Le Mont-Sur-Lausanne, Switzerland) for the samples from Brazil, Hanco Zwaan (Naturalis Biodiversity Center, Leiden, Netherlands) for the samples from Zimbabwe, and Vincent Pardieu (VP Consulting, Manama, Bahrain) for collecting the samples for DANAT directly from the mining areas (Madagascar, Zambia, Afghanistan and Colombia) or from trusted sources (Ethiopia).

Conflicts of Interest

The authors declare no conflict of interest.

References

  1. Fritsch, E.; Rossman, G. An update on color in gems Part 3: Colors caused by band gaps and physical phenomena. Gems Gemol. 1988, 24, 81–103. [Google Scholar] [CrossRef]
  2. Johnson, M.L.; Elen, S.; Muhlmeister, S. On the identification of various emerald filling substances. Gems Gemol. 1999, 35, 82–107. [Google Scholar] [CrossRef]
  3. Kiefert, L.; Hänni, H.A.; Chalain, J.-P.; Weber, W. Identification of filler substances in emeralds by infrared and Raman spectroscopy. J. Gemmol. 1999, 26, 501–520. [Google Scholar] [CrossRef]
  4. McClure, S.F.; Moses, T.M.; Tannous, M.; Koivula, J. Classifying emerald clarity at the GIA gem trade laboratory. Gems Gemol. 1999, 35, 176–185. [Google Scholar] [CrossRef]
  5. Information Sheet #5 Standardised Gemmological Report Wording. Available online: http://www.lmhc-gemology.org/pdfs/IS5_20121209.pdf (accessed on 30 July 2019).
  6. Hänni, H.A. Origin determination for gemstones: Possibilities, restrictions and reliability. J. Gemmol. 1994, 24, 139–148. [Google Scholar] [CrossRef]
  7. Dereppe, J.M.; Moreaux, C.; Chauvaux, B.; Schwarz, D. Classification of emeralds by artificial neural networks. J. Gemmol. 2000, 27, 93–105. [Google Scholar] [CrossRef]
  8. Schwarz, D.; Giuliani, G.; Grundmann, G.; Glas, M. The origin of emerald—A controversial topic. Extralapis Engl. 2002, 2, 18–21. [Google Scholar]
  9. Gübelin Gem Lab. The roots of origin determination. Jewel. News Asia 2006, 263, 66–71. [Google Scholar]
  10. Gübelin Gem Lab. The limitation of origin determination. Jewel. News Asia 2006, 264, 56–62. [Google Scholar]
  11. Gübelin Gem Lab. A holistic method to determining gem origin. Jewel. News Asia 2006, 264, 118–126. [Google Scholar]
  12. Krzemnicki, M.S. Determining the origin of gemstones: Challenges and perspectives. InColor 2007, 4, 6–11. [Google Scholar]
  13. Groat, L.A.; Giuliani, G.; Marshall, D.D.; Turner, D. Emerald deposits and occurrences: A review. Ore Geol. Rev. 2008, 34, 87–112. [Google Scholar] [CrossRef]
  14. Rossman, G.R. The geochemistry of gems and its relevance to gemology: Different traces, different prices. Elements 2009, 5, 159–162. [Google Scholar] [CrossRef]
  15. Nguyen Bui, H.A.; Fritsch, E.; Rondeau, B. Geographical origin: Branding or Science? InColor 2012, 19, 30–39. [Google Scholar]
  16. Giuliani, G.; Groat, L.; Ohnenstetter, D.; Fallick, A.E.; Feneyrol, J. The geology of gems and their geographic origin. In Geology of Gem Deposits; Raeside, E.R., Ed.; Mineralogical Association of Canada: Tucson, AZ, USA, 2014; Volume 44, pp. 113–134. [Google Scholar]
  17. Groat, L.; Giuliani, G.; Marshall, D.; Turner, D. Emerald. In Geology of Gem Deposits; Raeside, E.R., Ed.; Mineralogical Association of Canada: Tucson, AZ, USA, 2014; Volume 44, pp. 135–174. [Google Scholar]
  18. Giuliani, G.; Branquet, Y.; Fallick, A.E.; Groat, L.; Marshall, D. Emerald deposits around the world, their similarities and differences. InColor 2015, 56–69. [Google Scholar]
  19. Schwarz, D. The geographic origin determination of emeralds. InColor 2015, 98–105. [Google Scholar]
  20. Hainschwang, T.; Notari, F. Standards and protocols for emerald analysis in gem testing laboratories. InColor 2015, 106–114. [Google Scholar]
  21. Giuliani, G.; Groat, L.A.; Marshall, D.; Fallick, A.E.; Branquet, Y. Emerald Deposits: A Review and Enhanced Classification. Minerals 2019, 9, 105. [Google Scholar] [CrossRef]
  22. Ogden, J.M. Rethinking laboratory reports for the geographical origin of gems. J. Gemmol. 2017, 35, 416–423. [Google Scholar] [CrossRef]
  23. Cartier, L.E.; Ali, S.H.; Krzemnicki, M.S. Blockchain, chain of custody and trace elements: An overview of tracking and traceability opportunities in the gem. J. Gemmol. 2018, 36, 212–227. [Google Scholar] [CrossRef]
  24. Archuleta, J.-L. The color of responsibility: Ethical issues and solutions in colored gemstones. Gems Gemol. 2016, 52, 144–160. [Google Scholar] [CrossRef]
  25. Ali, S.H.; Giurco, D.; Arndt, N.; Nickless, E.; Brown, G.; Demetriades, A.; Durrheim, R.; Enriquez, M.A.; Kinnaird, J.; Littleboy, A.; et al. Mineral supply for sustainable development requires resource governance. Nature 2017, 543, 367–372. [Google Scholar] [CrossRef] [PubMed]
  26. Makki, M.; Ali, S.H. Gemstone supply chains and development in Pakistan: Analyzing the post-Taliban emerald economy in the Swat Valley. Geoforum 2019, 100, 166–175. [Google Scholar] [CrossRef]
  27. Gonthier, E. The symbolic representation of famous emeralds. In L’Émeraude; Giard, D., Giuliani, G., Cheilletz, A., Fritch, E., Gonthier, E., Eds.; AFG-CNRS-ORSTOM Edition: Paris, France, 1998; pp. 27–32. [Google Scholar]
  28. Giuliani, G.; Chaussidon, M.; Schubnel, H.J.; Piat, D.; Rollion-Bard, C.; France-Lanord, C.; Giard, D.; de Narvaez, D.; Rondeau, B. Oxygen isotopes and emerald trade routes since antiquity. Science 2000, 287, 631–633. [Google Scholar] [CrossRef]
  29. Calligaro, T.; Dran, J.-C.; Poirot, J.-P.; Querré, G.; Salomon, J.; Zwaan, J.C. PIXE/PIGE characterization of emeralds using an external micro-beam. Nucl. Instrum. Meth. 2000, 161–163, 769–774. [Google Scholar] [CrossRef]
  30. Giuliani, G.; Chaussidon, M.; France-Lanord, C.; Guerra, H.S.; Chiappero, P.J.; Schubnel, H.J.; Gavrilenko, E.; Schwarz, D. L’exploitation des mines d’émeraude d’Autriche et de la Haute Egypte à l’époque Gallo-Romaine: Mythe ou réalité? Rev. Gemmol 2001, 143, 20–24. (In French) [Google Scholar]
  31. Rondeau, B. Matériaux gemmes de référence du Museum National D’Histoire Naturelle: Exemples de valorisation scientifique d’une collection de minéralogie et gemmologie. Ph.D. Thesis, University of Nantes, Nantes, France, 2003. [Google Scholar]
  32. Harrell, J.A. Archaeological geology of the world’s first emerald mine. Geosci. Can. 2004, 31, 69–76. [Google Scholar]
  33. Aurisicchio, C.; Corami, A.; Ehrman, S.; Graziani, G.; Cezaro, S.N. The emerald and gold necklace from Oplontis, Vesuvian Area, Naples, Italy. J. Archaeol. Sci. 2006, 33, 725–734. [Google Scholar] [CrossRef]
  34. Schwarz, D.; Pardieu, V. Emeralds from the Silk Road countries. A comparison with emeralds from Colombia. InColor 2009, 12, 38–43. [Google Scholar]
  35. Strack, E.; Kostov, R.I. Emeralds, sapphires, pearls and other gemmological materials from the Preslav gold treasure (X century) in Bulgaria. Geochem. Mineral. Petrol. 2010, 48, 103–123. [Google Scholar]
  36. Karampelas, S.; Wörle, W.; Hunger, K.; Hanspeter, L.; Bersani, D.; Gübelin, S. Study of gems of a ciborium from Einsiedeln Abbey. Gems Gemol. 2010, 46, 291–295. [Google Scholar] [CrossRef]
  37. Karampelas, S.; Wörle, W.; Hunger, K.; Hanspeter, L. Micro-Raman spectroscopy on two chalices from the Benedictine Abbey of Einsiedeln: Identification of gemstones. J. Raman Spectrosc. 2012, 43, 1833–1838. [Google Scholar] [CrossRef]
  38. Farges, F.; Panczer, G.; Benbalagh, N.; Riondet, G. The Grand Sapphire of Louis XIV and The Ruspoli Sapphire. Gems Gemol. 2015, 51, 392–409. [Google Scholar]
  39. Panczer, G.; Riondet, G.; Forest, L.; Krzemnicki, M.S.; Carole, D.; Faure, F. The Talisman of Charlemagne: New Historical and Gemological Discoveries. Gems Gemol. 2019, 55, 40–46. [Google Scholar] [CrossRef]
  40. Aurisicchio, C.; Conte, A.M.; Medeghini, L.; Ottolini, L.; De Vito, C. Major and trace element geochemistry of emerald from several deposits: Implications for genetic models and classification schemes. Ore Geol. Rev. 2018, 94, 351–366. [Google Scholar] [CrossRef]
  41. Zwaan, J.C.; Seifert, A.V.; Vrána, S.; Laurs, B.M.; Anckar, B.; Simons, W.B.S.; Falster, A.U.; Lustenhouwer, W.J.; Muhlmeister, S.; Koivula, J.K.; et al. Emeralds from the Kafubu area, Zambia. Gems Gemol. 2005, 41, 116–148. [Google Scholar] [CrossRef]
  42. Saeseasaw, S.; Pardieu, V.; Sangsawong, S. Three-phase inclusions in emerald and their impact on origin determination. Gems Gemol. 2014, 50, 114–132. [Google Scholar]
  43. Groat, L.A.; Laurs, B.M. Gem formation, production, and exploration: Why gem deposits are rare and what is being done to find them. Elements 2009, 5, 153–158. [Google Scholar] [CrossRef]
  44. Fritsch, E.; Rondeau, B.; Devouard, B.; Pinsault, L.; Latouche, C. Why are some crystals gem quality? Crystal growth consideration on the “gem factor”. Can. Mineral. 2017, 55, 521–533. [Google Scholar] [CrossRef]
  45. Gramaccioli, C. Application of mineralogical techniques to gemmology. Eur J Miner. 1991, 3, 703–706. [Google Scholar] [CrossRef]
  46. Fritsch, E.; Rondeau, B. Gemology: The developing science of gems. Elements 2009, 5, 147–152. [Google Scholar] [CrossRef]
  47. Devouard, B.; Notari, F. Gemstones: From the naked eye to laboratory techniques. Elements 2009, 5, 163–168. [Google Scholar] [CrossRef]
  48. Karampelas, S.; Kiefert, L. Gemstones and minerals. In Analytical Archaeometry: Selected Topics, 1st ed.; Edwards, H.G.M., Vandenabeele, P., Eds.; Royal Society of Chemistry: London, UK, 2012; pp. 291–317. [Google Scholar]
  49. Gübelin, E.J.; Koivula, J.I. Photoatlas of Inclusions in Gemstones, 5th ed.; Opinio: Basel, Switzerland, 2004; Volume 1, p. 532. [Google Scholar]
  50. Gübelin, E.J.; Koivula, J.I. Photoatlas of Inclusions in Gemstones; Opinio: Basel, Switzerland, 2005; Volume 2, p. 829. [Google Scholar]
  51. Gübelin, E.J.; Koivula, J.I. Photoatlas of Inclusions in Gemstones; Opinio: Basel, Switzerland, 2008; Volume 3, p. 672. [Google Scholar]
  52. Hänni, H.A.; Schwarz, D.; Fischer, M. The emeralds of the Belmont mine, Minas Gerais, Brazil. J. Gemmol. 1987, 53, 446–456. [Google Scholar] [CrossRef]
  53. Bosshart, G. Emeralds from Colombia (Part 2). J. Gemmol. 1991, 22, 409–425. [Google Scholar] [CrossRef]
  54. Bowersox, G.; Snee, L.W.; Foord, E.E.; Seal II, R.R. Emeralds of the Panjshir Valley, Afghanistan. Gems Gemol. 1991, 27, 26–39. [Google Scholar] [CrossRef]
  55. Schmetzer, K.; Bernhardt, H.; Biehler, R. Emeralds from the Ural Mountains, USSR. Gems Gemol. 1991, 27, 86–99. [Google Scholar] [CrossRef]
  56. Schwarz, D. Emeralds from the Mananjary region, Madagascar: Internal features. Gems Gemol. 1994, 30, 88–101. [Google Scholar] [CrossRef]
  57. Zwaan, J.C.; Kanis, J.; Petsch, J. Update on emeralds from the Sandawana mines, Zimbabwe. Gems Gemol. 1997, 33, 80–101. [Google Scholar] [CrossRef]
  58. Moroz, I.; Panczer, G.; Roth, M. Laser-induced luminescence of emeralds from different sources. J. Gemmol. 1998, 26, 316–320. [Google Scholar] [CrossRef]
  59. Moroz, I.; Eliezri, I.Z. Mineral inclusions in emeralds from different sources. J. Gemmol. 1999, 26, 357–363. [Google Scholar] [CrossRef]
  60. Moroz, I.; Roth, M.L.; Deich, V.B. The visible absorption spectroscopy of emeralds from different deposits. Aust. Gemmol. 1999, 20, 315–320. [Google Scholar]
  61. Moroz, I.; Roth, M.; Boudeulle, M.; Panczer, G. Raman microspectroscopy and fluorescence of emeralds from various deposits. J. Raman Spectrosc. 2000, 31, 485–490. [Google Scholar] [CrossRef]
  62. Fritsch, E.; Rondeau, B.; Notari, F.; Michelou, J.C.; Devouard, B.; Peucat, J.J.; Chalain, J.P.; Lulzac, Y.; de Narvaez, D.; Arboleda, C. Les nouvelles mines d’émeraude de La Pita (Colombie) 2ème partie. Rev. De Gemmol. 2002, 144, 13–21. (In French) [Google Scholar]
  63. Zwaan, J.C. Gemmology, geology and origin of the Sandawana emerald deposits, Zimbabwe. Scr. Geol. 2006, 131, 211. [Google Scholar]
  64. Abduriyim, A.; Kitawaki, H. Applications of laser ablation–inductively coupled plasma-mass spectrometry (LA-ICP-MS) to gemology. Gems Gemol. 2006, 42, 98–118. [Google Scholar] [CrossRef]
  65. Ochoa, C.J.C.; Daza, M.J.H.; Fortaleche, D.; Jiménez, J.F. Progress on the study of parameters related to the origin of Colombian emeralds. InColor 2015, 88–97. [Google Scholar]
  66. Rondeau, B.; Fritsch, E.; Peucat, J.J.; Nordru, F.S.; Groat, L.A. Characterization of emeralds from a historical deposit: Byrud (Eidsvoll), Norway. Gems Gemol. 2008, 44, 108–122. [Google Scholar] [CrossRef]
  67. Huong, L.T.T. Microscopic, Chemical and Spectroscopic Investigations on Emeralds of Various Origins. Ph.D. Thesis, University of Mainz, Mainz, Germany, 2008. [Google Scholar]
  68. Smith, C.P.; Quinn, D.E. Inside emeralds. Rapaport Diam. Rep. 2009, 32, 139–148. [Google Scholar]
  69. Huong, L.T.T.; Hager, T.; Hofmeister, W. Confocal micro-Raman spectroscopy: A powerful tool to identify natural and synthetic emeralds. Gems Gemol. 2010, 46, 139–148. [Google Scholar] [CrossRef]
  70. Zwaan, J.C.; Jacob, D.E.; Häger, T.; Calvacanti Neto, M.T.O.; Kanis, J. Emeralds from the Fazenda Bonfim region, Rio Grande do Norte, Brazil. Gems Gemol. 2012, 48, 2–17. [Google Scholar] [CrossRef]
  71. Cronin, D.P.; Rendle, A.M. Determining the geographical origins of natural emeralds through nondestructive chemical fingerprinting. J. Gemmol 2012, 33, 1–13. [Google Scholar] [CrossRef]
  72. Bersani, D.; Azzi, G.; Lambruschi, E.; Barone, G.; Mazzoleni, P.; Raneri, S.; Longobardo, U.; Lottici, P.P. Characterization of emeralds by micro-Raman spectroscopy. J. Raman Spectrosc. 2014, 45, 1293–1300. [Google Scholar] [CrossRef]
  73. Huong, L.T.T.; Hofmeister, W.; Hager, T.; Karampelas, S.; Kien, N.D.T. Identifying natural and synthetic emeralds by vibrational spectroscopy. Gems Gemol. 2014, 50, 287–292. [Google Scholar]
  74. Thomson, D.B.; Kidd, J.D.; Astrom, M.; Scarani, A.; Smith, C.P. A comparison of R-line photoluminescence of emeralds from different origins. J. Gemmol. 2014, 34, 334–343. [Google Scholar] [CrossRef]
  75. Renfro, N.D.; Koivula, J.I.; Muyal, J.; McClure, S.F.; Schumacher, K.; Shigley, J.E. Chart: Inclusions in Natural, Synthetic, and Treated Emerald. Available online: https://www.gia.edu/gems-gemology/winter-2016-inclusions-natural-synthetic-treated-emerald (accessed on 30 July 2019).
  76. Kievlenko, E.Y. Beryl. In Geology of Gems, 1st ed.; Soregaroli, A., Ed.; Ocean Pictures Ltd.: Littleton, CO, USA, 2013; pp. 73–119. [Google Scholar]
  77. Schwarz, D.; Henn, U. Emeralds from Madagascar. J. Gemmol. 1992, 23, 140–149. [Google Scholar] [CrossRef]
  78. McManus, C.E.; Dowe, J.; McMillan, N.J. Quantagenetics® analysis of laser-induced breakdown spectroscopic data: Rapid and accurate authentication of materials. Spectrochim. Acta B 2018, 145, 79–85. [Google Scholar] [CrossRef]
  79. Giuliani, G.; France-Lanord, C.; Zimmermann, J.-L.; Cheilletz, A.; Arboleda, C.; Charoy, B.; Coget, P.; Fontan, F.; Giard, D. Composition of fluids, δD of channel H2O and δ18O of lattice oxygen in beryls: Genetic implications for Brazilian, Colombian and Afghanistani emerald deposits. Int. Geol. Rev. 1997, 39, 400–424. [Google Scholar] [CrossRef]
  80. Marshall, D.; Downes, P.J.; Ellis, S.; Greene, R.; Loughrey, L.; Jones, P. Pressure–temperature-fluid constraints for the Poona emerald deposits, Western Australia: Fluid inclusion and stable isotope studies. Minerals 2016, 6, 130. [Google Scholar] [CrossRef]
  81. Schollenbruch, K.; Link, K.; Sintayehu, T. Gem quality emeralds from Southern Ethiopia. InColor 2017, 35, 48–54. [Google Scholar]
  82. Vertiriest, W.; Wongrawang, P.A. gemological description of Ethiopian emeralds. InColor 2018, 40, 73–75. [Google Scholar]
  83. Cerny, P.; Meintzer, R.E.; Anderson, A.J. Extreme fractionation in rare-element granitic pegmatites: Selected examples of data and mechanisms. Can. Mineral. 1985, 23, 381–421. [Google Scholar]
  84. London, D.; Morgan VI, G.P. The pegmatite puzzle. Elements 2012, 8, 263–268. [Google Scholar] [CrossRef]
  85. Linnen, R.L.; van Lichterverlde, M.; Cerny, P.H. Granitic pegmatites as sources of strategic metals. Elements 2012, 8, 275–280. [Google Scholar] [CrossRef]
  86. Simmons, W.B.; Pezzotta, F.; Shigley, J.E.; Beurlen, H. Granitic pegmatites as reflections of their sources. Elements 2012, 8, 281–287. [Google Scholar] [CrossRef]
  87. Cerny, P.; London, D.; Novak, M. Granitic pegmatites as reflections of their sources. Elements 2012, 8, 289–294. [Google Scholar] [CrossRef]
  88. Wood, D.L.; Nassau, K. Characterization of beryl and emerald by visible and infrared absorption spectroscopy. Am. Mineral. 1968, 53, 777–800. [Google Scholar]
  89. Platonov, A.N.; Taran, M.N.; Minko, O.E.; Polshyn, E.V. Optical absorption spectra and nature of color of iron-containing beryls. Phys. Chem. Miner. 1978, 3, 87–88. [Google Scholar]
  90. Taran, M.N.T.; Rossman, G.R.R. Optical spectroscopic study and a re-examination of the beryl, cordierite, and osumilite spectra. Am. Mineral. 2001, 86, 973–980. [Google Scholar] [CrossRef]
  91. Schmetzer, L. Letter: Comment on analysis of three-phase inclusions in emerald. Gems Gemol. 2014, 50, 316–319. [Google Scholar]
  92. Spinolo, G.; Fontana, I.; Galli, A. Optical absorption spectra of Fe2+ and Fe3+ in beryl crystals Optical absorption spectra of Fe2+ and Fe3+ in beryl crystals. Phys. Stat. Sol. (b) 2007, 244, 4660–4668. [Google Scholar] [CrossRef]
  93. Wood, D.L.; Nassau, K. Infrared spectra of foreign molecules in beryl. J. Chem Phys. 1967, 47, 2220–2228. [Google Scholar] [CrossRef]
  94. Aurisicchio, C.; Grubessi, O.; Zecchini, P. Infrared spectroscopy and crystal chemistry of the beryl group. Can. Mineral. 1994, 32, 55–68. [Google Scholar]
  95. Charoy, B.; Donato, D.P.; Barres, O.; Pinto-Coelho, C. Channel occupancy in an alkali-poor beryl from Serra Branca (Goias, Brazil): Spectroscopic characterization. Am. Mineral. 1996, 81, 395–403. [Google Scholar] [CrossRef]
  96. Donato, D.P.; Cheilletz, A.; Barres, O.; Yvon, J. Infrared spectroscopy of OD vibrators in minerals at natural dilution: Hydroxyl groups in talc and kaolinite, and structural water in beryl and emerald. Appl. Spectrosc. 2004, 58, 521–527. [Google Scholar] [CrossRef]
  97. Adams, D.M.; Gardner, I.R. Single-crystal vibrational spectra of beryl and dioptase. J. Chem. Soc. 1974, 14, 1502–1505. [Google Scholar] [CrossRef]
  98. Duroc-Danner, J.M. The identification value of the 2293 cm−1 infrared absorption band in natural and hydrothermal synthetic emeralds. J. Gemmol. 2006, 30, 75–82. [Google Scholar] [CrossRef]
  99. Hagemann, H.; Lucken, A.; Bill, H.; Gysler-Sanz, J.; Stalder, H.A. Polarized Raman spectra of beryl and bazzite. Phys. Chem. Miner. 1990, 17, 395–400. [Google Scholar] [CrossRef]
  100. Kim, C.C.; Bell, M.I.; McKeown, D.A. Vibrational analysis of beryl (Be3Al2Si6O18) and its constituent ring (Si6O18). Phys. B. Condens. Matter 1995, 205, 193–208. [Google Scholar] [CrossRef]
  101. Wood, D.L. Absorption, fluorescence, and Zeeman effect in emerald. J. Chem. Phys. 1965, 42, 3404–3410. [Google Scholar] [CrossRef]
Figure 1. Binary plot of MgO (wt %) vs. Na2O (wt %).
Minerals 09 00561 g001
Figure 2. Binary plot of 52Cr/51V vs. 56Fe.
Minerals 09 00561 g002
Figure 3. Binary plot of 7Li vs. 39K.
Minerals 09 00561 g003
Figure 4. Binary plot of 39K vs. 23Na.
Minerals 09 00561 g004
Figure 5. Binary plot of 85Rb vs. 133Cs.
Minerals 09 00561 g005
Figure 6. Binary plot of 7Li vs. 85Rb.
Minerals 09 00561 g006
Figure 7. Binary plot of 7Li vs. 133Cs.
Minerals 09 00561 g007
Figure 8. Binary plot of 133Cs vs. 23Na.
Minerals 09 00561 g008
Figure 9. Binary plot of 69Ga vs. 45Sc.
Minerals 09 00561 g009
Figure 10. Binary plot of 7Li vs. 45Sc.
Minerals 09 00561 g010
Figure 11. Binary plot of ratios 133Cs vs. 23Na/7Li.
Minerals 09 00561 g011
Figure 12. Ternary plot of 66Zn vs. 69Ga vs. 7Li.
Minerals 09 00561 g012
Figure 13. UV-Vis polarized spectra of an emerald from Colombia. The light blue and orange lines are for the o-ray and e-ray spectra, respectively. The upper spectrum has been vertically offset for clarity.
Minerals 09 00561 g013
Figure 14. UV-Vis polarized spectra of an emerald from Afghanistan. The light blue and orange lines are for the o-ray and e-ray spectra, respectively. The upper spectrum has been vertically offset for clarity.
Minerals 09 00561 g014
Figure 15. UV-Vis polarized spectra of an emerald from Zambia. The light blue and orange lines are for the o-ray and e-ray spectra, respectively. The upper spectrum has been vertically offset for clarity.
Minerals 09 00561 g015
Figure 16. NIR polarized spectra of an emerald from Colombia. The light blue and orange lines are for the o-ray and e-ray spectra, respectively. The upper spectrum has been vertically offset for clarity.
Minerals 09 00561 g016
Figure 17. NIR polarized spectra of an emerald from Afghanistan. The light blue and orange lines are for the o-ray and e-ray spectra, respectively. The upper spectrum has been vertically offset for clarity.
Minerals 09 00561 g017
Figure 18. NIR polarized spectra of an emerald from Zambia. The light blue and orange lines are for the o-ray and e-ray spectra, respectively. The upper spectrum has been vertically offset for clarity.
Minerals 09 00561 g018
Figure 19. FTIR spectra of an emerald from Colombia (blue spectrum) and from Zimbabwe (red spectrum). The upper spectrum has been vertically offset for clarity.
Minerals 09 00561 g019
Figure 20. FTIR spectra of an emerald from Colombia (blue spectrum) and from Zimbabwe (red spectrum). The upper spectrum has been vertically offset for clarity.
Minerals 09 00561 g020
Figure 21. Raman spectra from 200 to 1300 cm−1 of an emerald from Colombia. The black and grey spectra are acquired with the laser beam perpendicular to the c-axis and parallel to the c-axis, respectively. The upper spectrum has been vertically offset for clarity.
Minerals 09 00561 g021
Figure 22. Raman spectra from 3520 to 3680 cm−1 of an emerald from Colombia. The black and grey spectra are acquired with the laser beam perpendicular to the c-axis and parallel to the c-axis, respectively. Note that the upper spectrum is shifted higher for clarity.
Minerals 09 00561 g022
Figure 23. Raman spectra from 3520 to 3680 cm−1 of an emerald from Ethiopia. The black and grey spectra are acquired with the laser beam perpendicular to the c-axis and parallel to the c-axis, respectively. Note that the upper spectrum is shifted higher for clarity.
Minerals 09 00561 g023
Figure 24. Raman spectra from 3520 to 3680 cm−1 of an emerald from Zambia. The black and grey spectra are acquired with the laser beam perpendicular to the c-axis and parallel to the c-axis, respectively. Note that the upper spectrum is shifted higher for clarity.
Minerals 09 00561 g024
Figure 25. PL spectra from 650 to 850 nm of an emerald from Colombia (upper spectrum) and an emerald from Zimbabwe (bottom spectrum). Note that the upper spectrum is shifted higher for clarity.
Minerals 09 00561 g025
Figure 26. PL spectra from 660 to 710 nm of an emerald from Colombia (upper spectrum) and an emerald from Zimbabwe (bottom spectrum). Note that the upper spectrum is shifted higher for clarity.
Minerals 09 00561 g026
Table 1. List of studied samples, along with their weight and colour ranges.
LocalityNo. of SamplesWeight Range (ct)Colour Range
Afghanistan (Panjsher Valley from Kherskanda)90.27–0.68Green
Brazil (Itabira)180.17–1.88Light green to green
Colombia (Coscuez)80.11–2.42Light green to green
Ethiopia (Shakisso)40.43–1.69Green
Madagascar (Mananjary from Irondro, Ambodivandrika and Morarano)90.17–2.18Green to dark green
Russia (Malyshevsk, Ural mountains)50.33–0.80Light green
Zambia (Kafubu)60.47–2.50Green
Zimbabwe (Sandawana)30.24–0.56Green
Table 2. LA–ICP-MS detection limits and ranges in ppmw.
Limits7Li23Na24Mg39K45Sc
LOD0.29–0.877.00–49.130.28–1.246.82–17.720.44–1.07
LOQ0.87–2.4221.00–147.380.83–3.7320.45–53.161.32–3.20
Limits51V52Cr55Mn56Fe59Co
LOD0.29–0.851.36–1.990.23–0.674.37–6.510.09–0.42
LOQ0.86–2.544.07–5.960.70–2.0113.12–19.520.28–1.25
Limits60Ni66Zn69Ga85Rb133Cs
LOD2.71–6.110.65–2.280.13–0.450.15–0.280.02–0.07
LOQ8.12–18.331.94–6.850.39–1.360.44–0.830.06–0.21
LOD: Limits of detection; LOQ: Limits of quantification.
Table 3. LA–ICP-MS of the samples in ppmw.
SamplesElementMin–MaxAverage (SD)Median
Afghanistan (Panjsher)
9 samples, 27 analysis
7Li84.9–162115.81 (25.86)108
Na2O (%)0.63–1.911.27 (0.46)1.44
MgO (%)0.71–2.451.51 (0.60)1.69
39K107–1540713.63 (497.38)710
45Sc148–2390669.07 (782.41)256
51V557–31301312.48 (766.18)1100
52Cr500–38401994.26 (1257.28)2160
55MnBQL–3.090.78 (1.02)BQL
56Fe781–25301394.70 (550.92)1270
59CoBQL**BQLBQL
60NiBQLBQLBQL
66ZnBQLBQLBQL
69Ga10.1–28.717.17 (6.04)14.8
85Rb11–97.5048.90 (30.84)46.40
133Cs22.1–75.940.11 (14.98)41.6
52Cr/51V0.83–2.641.47 (0.59)1.20
Na2O/MgO (%)0.77–0.920.85 (0.04)0.85
Alkalis* (%)0.49–1.611.03 (0.40)1.16
H2O (%)1.93–2.542.28 (0.22)2.38
Brazil (Itabira)
18 samples, 54 analysis
7Li45.90–97.3064.11 (14.60)59.90
Na2O (%)0.97–1.701.32 (0.17)1.34
MgO (%)1.13–2.061.53 (0.21)1.53
39K152–385246.83 (65.60)239.50
45Sc17.5–15360.3 (31.47)51.15
51V52.50–177116.52 (32.72)117.50
52Cr997–57002508.46 (1051.82)2360
55Mn4.49–24.1014.10 (5.67)13.40
56Fe4540–87606407.59 (1122.38)6220
59Co1.94–2.962.47 (0.30)2.47
60NiBQLBQLBQL
66Zn28.40–87.4055.31 (12.31)57.20
69Ga6.68–13.8011.42 (1.73)11.90
85Rb19.10–52.6032.73 (8.16)31.25
133Cs35.50–12875.52 (23.10)76.85
52Cr/51V8.30–39.4521.93 (7.03)21.05
Na2O/MgO (%)0.81–0.940.87 (0.03)0.87
Alkalis* (%)0.75–1.301.02 (0.13)1.05
H2O (%)2.17–2.472.33 (0.07)2.35
Colombia (Coscuez)
8 samples, 24 analysis
7Li62–16387.20 (35.04)69.10
Na2O (%)0.40–0.970.60 (0.16)0.56
MgO (%)0.46–1.040.67 (0.16)0.62
39KBQLBQLBQL
45Sc9.17–441120.14 (135.30)56.90
51V879–63402530.92 (1724.94)2175
52Cr240–2820800.71 (788.24)432
55MnBQLBQLBQL
56Fe507–1860902.71 (493.08)683
59CoBQLBQLBQL
60NiBQLBQLBQL
66ZnBQLBQLBQL
69Ga25.7–58.539.30 (11.82)33.95
85Rb0.79–2.521.31 (0.48)1.12
133Cs4.83–12.18.54 (2.47)8.31
52Cr/51V0.12–0.450.31 (0.09)0.31
Na2O/MgO (%)0.81–0.950.89 (0.04)0.89
Alkalis* (%)0.30–0.730.46 (0.12)0.43
H2O (%)1.69–2.171.90 (0.13)1.87
Ethiopia (Shakisso)
4 samples, 20 analysis
7Li271–427345.65 (51.78)334.50
Na2O (%)1.71–2.161.96 (0.14)1.97
MgO (%)2.02–2.552.34 (0.15)2.37
39K290–444374.45 (52.77)371.50
45Sc57–150114.30 (34.50)125.50
51V96.30–123112.70 (8.10)114.50
52Cr2000–50103655 (1060)3795
55Mn9–21.116.51 (4.22)18.30
56Fe3980–53904867 (507.64)5050
59Co1.27–2.201.65 (0.19)1.65
60NiBQL–14.43.32 (5.91)BQL
66Zn32.20–44.8037.10 (3.27)36.40
69Ga16.40–20.5018.77 (1.18)19.15
85Rb50.60–64.7057.47 (4.58)57.95
133Cs270–427347.50 (58.82)341.50
52Cr/51V19.80–43.6632.08 (8.26)32.95
Na2O/MgO (%)0.78–0.920.84 (0.04)0.83
Alkalis* (%)1.38–1.711.57 (0.10)1.59
H2O (%)2.48–2.602.55 (0.04)2.55
Madagascar (Mananjary)
9 samples, 27 analysis
7Li57.50–12898.45 (19.47)104
Na2O (%)1.82–2.412.05 (0.16)2.01
MgO (%)2.07–3.022.58 (0.30)2.59
39K314–31501388.74 (808.89)1090
45Sc21–30975.59 (86.47)34.50
51V102–386224.85 (96.63)229
52Cr1490–37702380.37 (737.41)2410
55Mn8.65–28.5015.22 (5.56)15.30
56Fe7310–112009824.81 (1131.24)10,100
59Co1.69–4.503.17 (0.70)3
60Ni18.10–38.6028.94 (6.30)30.60
66Zn9.06–3216.59 (6.65)15.10
69Ga6.13–13.108.15 (1.98)7.72
85Rb42.70–407167.10 (106.29)175
133Cs105–1050430 (297.51)324
52Cr/51V4.49–22.5412.45 (5.90)10
Na2O/MgO (%)0.71–0.970.80 (0.08)0.80
Alkalis* (%)1.46–1.921.73 (0.13)1.77
H2O (%)2.51–2.662.57 (0.04)2.56
Russia (Ural)
5 samples, 15 analysis
7Li736–911826.93 (60.19)831
Na2O (%)0.70–1.230.91 (0.18)0.85
MgO (%)0.47–1.040.70 (0.20)0.64
39KBQL–10340.87 (41.97)52
45Sc19.50–72.9043.52 (21.93)44.20
51V29.80–12880.64 (37.30)90.90
52Cr318–1700905.27 (446.14)841
55Mn13.50–22.6019.16 (3.24)20.60
56Fe1210–19001600.67 (235.75)1640
59CoBQL–2.091.08 (0.73)1.19
60NiBQL–23.2012.90 (8.35)16
66Zn38.10–62.6048.62 (7.97)45.40
69Ga6.28–19.5013.69 (4.40)13.70
85Rb7.88–27.2017.46 (7.61)16.30
133Cs252–568350.53 (112.54)308
52Cr/51V6.57–16.1311.79 (3.27)11.86
Na2O/MgO (%)1.15–1.581.33 (0.13)1.34
Alkalis* (%)0.65–1.040.80 (0.13)0.75
H2O (%)1.99–2.302.13 (0.10)2.10
Zambia (Kafubu)
6 samples, 18 analysis
7Li492–741639.17 (76.19)661
Na2O (%)1.95–2.322.12 (0.11)2.14
MgO (%)2.02–2.622.32 (0.21)2.35
39K376–716508.50 (121.79)451
45Sc19.80–63.4041.63 (13.94)44.25
51V79.30–147112.82 (24.87)113.15
52Cr349–23601430.94 (760.72)1680
55Mn11–32.3022.52 (7.95)24.70
56Fe6320–95908239.44 (932.06)8440
59Co2.23–3.262.81 (0.31)2.82
60NiBQL–28.4020.02 (6.30)19.95
66Zn17.20–46.6031.75 (10.54)35.40
69Ga11.90–17.1014.84 (1.56)14.90
85Rb41.40–87.3062.99 (16.16)63.90
133Cs941–14101201.72 (148.15)1215
52Cr/51V3.82–25.3813.20 (7.75)13.92
Na2O/MgO (%)0.82–1.000.92 (0.05)0.92
Alkalis* (%)1.67–1.941.81 (0.08)1.83
H2O (%)2.55–2.642.59 (0.03)2.60
Zimbabwe (Sandawana)
3 samples, 15 analysis
7Li512–1050818.20 (214.17)930
Na2O (%)2.10–2.752.48 (0.24)2.62
MgO (%)2.17–2.802.58 (0.23)2.69
39K230–434354.73 (86.32)407
45Sc16.90–26.8020.85 (3.92)18.80
51V185–280219.27 (38.75)198
52Cr1430–20701790 (237.25)1770
55Mn47–9362.85 (17.52)53.40
56Fe4320–70506062.67 (1170.14)6810
59Co1.98–2.552.26 (0.17)2.25
60NiBQL–19.7014.67 (5.36)16.60
66Zn72.90–84.7079.49 (3.49)79.30
69Ga24.80–33.7028.37 (3.28)27
85Rb217–299263.47 (32.29)279
133Cs274–756589.07 (224.06)739
52Cr/51V7.32–10.058.25 (0.85)8.14
Na2O/MgO (%)0.93–1.000.96 (0.02)0.96
Alkalis* (%)1.68–2.292.04 (0.23)2.18
H2O (%)2.59–2.732.67 (0.05)2.71
* Alkalis: 7Li + 23Na + 39K + 85Rb + 133Cs; **BQL: Below Quantification Limits.
Table 4. UV-Vis absorptions linked with colouring elements of the studied samples.
LocalityCr3+V3+Fe3+Fe2+
Afghanistan (✓)(✓)
Brazil
Colombia (✓)
Ethiopia
Madagascar
Russia
Zambia
Zimbabwe
✓: present; (✓): sometimes present with low intensity
Table 5. Position and FWHM of the Raman band at around 1070 cm−1, relative intensities of the Raman bands at 3598 cm−1 and 3608 cm−1 and position of the R1 photoluminescence bands for the samples from different localities. All observations were made using spectra acquired with a laser beam perpendicular to the c-axis.
LocalityPosition & FWHMI3608 & I3598 IntensitiesR1 Position (PL)
Afghanistan 1068.16–1069.92
FWHM = 19.8–24.8
I3608 = I3598
or I3608 > I3598
683.7–684.2
Brazil 1068.38–1069.87
FWHM = 22.6–23.5
I3608 = I3598
or I3608 > I3598
683.9–684
Colombia1069.01–1069.09
FWHM = 19.6–20.7
I3608 > I3598683.6–683.8
Ethiopia1069.24–1070.15
FWHM = 23.6
I3608 < I3598
or I3608 = I3598
684–684.2
Madagascar 1069.44–1069.89
FWHM = 23.3
I3608 < I3598684.2–684.4
Russia 1068.81–1069.97
FWHM = 19.8
I3608 = I3598
or I3608 > I3598
683.7–683.8
Zambia 1069.11–1069.58
FWHM = 23.9
I3608 < I3598684.3‒684.4
Zimbabwe 1069.91–1071.81
FWHM = 24.6–27.4
I3608 < I3598684.3–684.4

