1. Introduction
Shale has become one of the major energy resources fuelling the World’s economy. For example, shale contributes to 46% of the natural gas production in the United States and its production is expected to increase by up to 38% by 2030 [
1]. Shale is normally formed by fine grains (<62.5 µm) with a complex, heterogeneous, and anisotropic microstructure [
2]. It has a porosity between 2% and 15% [
3,
4], and permeability typically below <10
−18 m
2 [
5]. Due to the low porosity and permeability of shale, extraction of hydrocarbons requires the use of hydraulic fracturing (fracking), a technique of fracturing rocks by injecting high-pressure fluids into the formation [
6,
7]. The large amounts of injected fluids disturb the equilibrium between the rock and formation waters, which may trigger mineral precipitation in pores and fractures [
8,
9]. Barite is a common scale mineral due to its low solubility and the high concentrations of barium in the formation waters of organic-rich sedimentary rocks. In addition, radionuclides are common contaminants found in shale that can pose serious environmental hazards when disposing of flow-back water resultant from hydraulic fracturing [
10]. Barite precipitation in shale could; therefore, be a problem or a benefit depending on whether it takes place in the fractures that make the rock permeable, or in small pores where it can retain contaminants from the fluid [
11].
Understanding the complex and dynamic coupling between ion transport, crystal growth, and the evolution of the pore structure requires techniques that can measure mineral precipitation inside rocks in a time-resolved manner, beyond what is studied using surface characterisation techniques [
12]. X-ray computed tomography (CT) is a well-established method to image the inside of materials in 3D [
13], and has been effectively used to study the distribution of minerals, fractures, and pores in shale [
14]. Since CT is non-destructive, a sample could be scanned over time to track the evolution of its structure during different processes, e.g., when coupled with in situ “rig” to apply pressure, temperature, reactive fluid flow, etc. [
13,
15]. Laboratory and synchrotron-based CT have been used to image mineral precipitation in micropores during the flow of supersaturated solutions over periods of time from minutes [
12] to weeks [
16]. In shale; however, the matrix has interconnected nanoporosity, and the width of fractures is typically below 20 µm, thus high resolution is required to image pore-scale processes.
Here, a double diffusion method [
17,
18] of barium vs. sulphate is used to induce precipitation of barite in the pores and fractures of shale over time. The high X-ray attenuation of barite and the high resolution of beamline I13-2 at the Diamond Light Source allow tracking changes in the attenuation contrast of the nanoporous matrix (pores smaller than the voxel size) caused by barite precipitation, as confirmed with electron microscopy after the experiment. The general sequence of events during precipitation in rocks containing microfractures and nanopores is proposed. This contributes to the understanding of mineral precipitation in porous rocks, which is necessary to implement mineral sequestration strategies, to help forecasting scale formation induced by hydraulic fracturing, and in general to interpret fluid-mediated mineral reactions in nature.
2. Materials and Methods
In this experiment, a sample was prepared from a typical shale from the Haynesville–Bossier Shale reservoir, one of the largest hydrocarbon-producing shale reservoirs. The sample was characterized as organic-rich (total organic content (TOC) 3.7 wt.%) and gas-mature (Ro 2.3%). The main minerals as quantified using X-ray diffraction (XRD) are quartz, calcite, ankerite, albite, pyrite, illite, chlorite, and muscovite [
19]. The helium porosity of similar samples is 7.0% at ambient pressure, and the permeability ranges from 1.0 × 10
−17 to 3.7 × 10
−21 m
2 at a constant pore fluid pressure of 23 MPa when the effective pressure increases from 0 MPa to 70 MPa [
19]. This type of shale typically contains 1.2% of the sample’s volume of microfractures with widths from 3–80 μm, which are mostly disconnected from each other and are parallel to the beddings, as measured from 3D image quantification [
19]. Additionally, pores with sizes below 3 μm are mainly formed by pore throats 6–50 nm in diameter, which accounts for 5.8% of the sample’s volume [
20].
Figure 1 shows the typical microstructure of the shale, which presents micron-sized fractures and granular minerals, and nano-sized pores and clay. The sample was cut into a cylinder 3 mm in diameter, and 10 mm long, with the long axis parallel to the bedding plane. Within the natural variability of shale, the composition and microstructure of this sample are considered to be typical of shale reservoir rocks [
20,
21], and the sample size of a few millimetres is representative of this material [
22,
23].
The sample was soaked in 0.2 M NaCl solution for 24 h to remove the air inside the pores and fractures, and to allow any swelling clay mineral undetected by XRD, and the organic matter present to expand, so that sample movement during the experiment was minimised. A tygon tube was attached to each end of the sample and sealed in place using rubber o-rings. The space between the tubes, around the sample, was sealed using a heat shrinking tube to prevent evaporation (
Figure 1). The experiment starts (time = 0) when the top tube is filled with 5 mL Na
2SO
4 solution (0.2 M), and the bottom tube with 5 mL BaCl
2 solution (0.2 M). These concentrations are about one order of magnitude higher than the maximum found in natural formation waters [
24]. However, the high concentration was necessary to induce precipitation within the timeframe of the experiment. The first image was acquired after 30 min and focused on the centre of the sample (the field of view was about 3.5 mm distant from the edge of the sample) where the fluid was expected to be first supersaturated.
The experiment was performed at the Diamond-Manchester imaging branch of beamline I13 in Diamond Light Source. 600 projections were acquired over 180° rotation with an exposure time of 0.1 s per projection. Projections were corrected using the average of 20 dark images and of 20 flat images acquired immediately before each scan. This resulted in a total acquisition time of 80 s per scan. We used a pco.edge 5.5 camera with a total magnification of 4× and a resulting voxel size = (1.6 µm)
3. Reconstruction was performed using the Gridrec algorithm [
25] of the TomoPy software [
26] module within a Savu pipeline [
27] that generates 32 bit grey-scale volumes of 4.2 mm × 3.5 mm × 3 mm. The imaging spectrum was optimised to improve the contrast between phases by using 985 µm graphite, 3.2 mm aluminium, and 35 µm silver filters. This resulted in an X-ray spectrum with a mean energy of 27.6 keV with a standard deviation of 6.4 keV.
A total of 11 scans centred on the vertical midpoint of the sample and enclosing the entire diameter (as shown in the marked box of
Figure 1a) were performed at times: 0.5, 2.4, 3.5, 5.4, 7.4, 14.6, 23.5, 28.5, 33.5, 38.8, 44.3 h after adding the sulphate and barium solutions. Those times were determined by the availability of the synchrotron radiation, by a prolonged failure of the beam between 14.6 and 23.5 h, and the experiment had to be stopped at 44.3 h. Immediately after the last scan, the aqueous solutions in the fluid containers at the edge of the sample were substituted by ethanol and left for two hours. This was expected to stop precipitation due to the significant drop of saturation index in the fractures and pores, and the inhibition of crystal growth due to the presence of ethanol. After 2 h, the fluid containers were emptied and refilled with isopropanol. After 3 d, the setup enclosing the sample was dismounted, the remaining fluid was soaked with absorbing paper, and finally, the sample was left to dry before it was used to prepare a sample suitable for scanning electron microscopy (SEM) analysis.
The 3D datasets were processed using Avizo 9.2.0. The following steps were applied to all datasets: (1) convert from 32 bit to 16 bit; (2) the scans were aligned and resampled using Lanczos interpolation, which preserves the resolution of the image; (3) non-local-means filter with a window = 20, neighbour = 3, and similarity = 0.65. To highlight the zones where crystals grow and the moving growth front, some images are presented after subtracting the image of the initial sample (0.5 h), before any crystals were formed. Subtracting the initial shale matrix facilitates interpreting the results since the matrix is a complex mixture of mineral phases (some with contrast similar to barite), and it helps to detect sub-voxel changes that cause only small variations of the grey-scale. In the resulting images, the intensity of a voxel is proportional to composition variations inside the voxel, i.e., variation from the less X-ray attenuating fluid and the high X-ray attenuation of barite (due to the high atomic number of barium and high density of barite, d = 4.5 g/cm3). In practice, brighter voxels correspond to more crystals and less of the initial pore space. Nevertheless, it is impossible to measure the detection limit of barite and to quantify precise volume fractions of barite from the intensity of a voxel since the porosity and matrix composition can vary within adjacent voxels so that a large amount of variables does not allow for quantitative calibration.
The sample was characterised after the experiment using a FEI quanta 650 scanning electron microscope and a FEI Helios Plasma FIB plasma focused ion beam (PFIB). The sample was mounted on to an SEM stub using silver paint and a carbon coating about 12 nm thick. A cross-section was made perpendicular to the bedding plane using PFIB with an area of 50 µm × 80 µm (see orientation in
Figure S1). Backscatter electron (BSE) and secondary electron (SE) images, and energy dispersive X-ray spectroscopy (EDX) spectrum maps were recorded on both the PFIB cross-section and the surface of fractures to investigate the nano-scale morphology and the chemistry of the minerals. We note that higher resolution images of barite in the smaller nanopores were attempted, but due to the brittleness and local fracturing of the shale it was impossible to polish the sample finely and to make thin sections of the reacted sample required for transmission electron microscopy.
3. Results
Barite is first observed at 14.6 h. At this time barite (white in the 2D section and magenta–blue in the 3D view) is only observed inside or nearby the wider fractures (black in the 2D section and green in the 3D view,
Figure 2 and
Figure 3,
Videos 1 and 2). Note that the colours correlate to the volume fraction of the precipitated barite. Dense bands filled with crystals (magenta) are visible in the fractures across the diameter of the sample, although, few crystals are visible within these fractures along the mixing direction and beyond the band (red arrows point to barite bands,
Figure 2 and
Figure 3). Note that even after 44.3 h, the fractures where a band formed remain essentially precipitate free beyond the band, even though precipitates grew in the surrounding nanoporous matrix, e.g., 3D zoom in
Figure 2. Between 14.6 and 28.3 h, the growth front is observed to advance mainly through the thinner fractures and few precipitates are observed in the matrix. In contrast to the localised precipitation observed in wider fractures, precipitation in thinner fractures is more gradual and takes place over longer distances parallel to the growth direction. Between 28.3 and 44.3 h, precipitation in the thinner fractures has slowed, which suggests progressive clogging and reduced transport. During this period, barite crystals appear within the nanoporous matrix (highlighted by the blue arrow in
Figure 3) and are visible across the entire diameter of the sample as a brighter (higher X-ray attenuation) region. The precipitation front within the nanoporous region moves at an average velocity of 10 ± 3 µm/h parallel to the mixing direction (see
Figure S2). The velocity was measured in six independent zones of the sample unaffected by horizontal fractures and over 200 µm away from the microfractures. The velocity is first measured between 23.5 and 28.3 h and remained approximately constant until the end of the experiment, within the uncertainty of the measurement.
Horizontal fractures (approximately perpendicular to the growth direction) are observed to inhibit or significantly slow the advance of the growth front through nanopores. For example, in
Figure 3, part of the growth front is delayed by a fracture that blocks the growth direction (green arrow), as opposed to the more advanced front that propagated through a non-fractured region of the matrix (blue arrow). Another example is shown in
Figure S3 and Video 3 where pronounced precipitation took place on the barium rich side of the fracture, while fewer crystals are observed on the sulphate rich side.
SEM and EDS confirm the presence of barite crystals inside fractures (
Figure 4). Two types of crystals are distinguishable: large crystals (7–15 µm) on the surface of the fracture and smaller crystals (<1 µm) seemingly protruding from underneath the fracture’s surface. Larger crystals have similar morphology, which suggests a moderate saturation index during growth, e.g., <3 [
28]. In
Figure 4, the smaller crystals are only visible on the surface of fracture 1. Note that the smaller crystals do not appear to grow from the surface of the fracture into the fracture’s open space.
Other geochemical reactions such as dissolution and mineral replacement may be taking place in the porous matrix, which could cause changes in the pore structure and fluid chemistry. Only one reaction is noticeable within the spatial resolution and length of the experiment. This is the replacement of calcite crystals by gypsum (
Figure S5 and Video 4). Since the replacement only takes place on the sulphate-rich side and is confined to zones surrounding calcite grains, it is assumed that our observations at the growth front are mostly due to the precipitation of barite. Crystallisation-induced fracturing in shale is possible [
29]; however, it has not been observed in this study. Movement within the sample due to swelling was not observed, which is confirmed by the ease of subtracting the starting dataset from the datasets at later experiment times. Air bubbles that could have formed due to radiolysis or that may have remained trapped in the sample due to an insufficient soaking time before the experiment were also not visible throughout the experiment. The presence of air trapped within the nanopores cannot be ruled out; however, since a continuous growth front throughout the diameter of the sample is clearly visible, we conclude that if present, the amount of air is minimum and unlikely to affect our interpretation of the results.
The technique described opens new possibilities to image transformations within nanoporous rocks, at a scale below that studied so far due to experimental constraints, whereby other destructive imaging methods do not allow time-lapse studies, and the non-destructive imaging methods, typically, do not have nanoscale resolution required. The strengths of the method rely on the high attenuation contrast of beamline I13-2, high resolution, high coherence, and flux of the parallel beam generated at a synchrotron. Additional contrast could potentially be achieved using dual-energy scans, above and below the K-edge of the element of interest, which would be necessary when looking at minerals with attenuation contrast lower than barite. On the other hand, if the starting nanoporous material has a matrix with a homogeneous intensity, e.g., controlled pore glass or porous carbonate rock, mineral precipitation experiments and perhaps posterior dissolution experiments could also be done in laboratory scanners since not so high contrast would be necessary although the longer time required to image the samples in the laboratory would limit the speed of the processes that can be imaged, for example, suitable for longer-term studies. This would boost the applicability of CT to study nanoscale pore processes.
To summarise, barite precipitation over time is observed to depend on the type of confinement within the shale structure: (1) Barite precipitates first in the wider fractures as dense bands of crystals across the diameter of the sample. These crystals appear to clog the fracture along the growth direction. (2) Further precipitation takes place in thinner fractures and exclusively in the direction towards the high sulphate concentration (referred here as the growth direction). The growth front in thinner fractures generally slows over time. (3) A growth front is last observed to sweep through the nanoporous matrix. Interestingly, this growth front moves through the nanopores at an approximately constant velocity, a proxy to the growth rate. Note that whilst it is not possible to individually resolve nanopores and submicron fractures with a voxel size of 1.6 µm3, the increase in the X-ray attenuation of the matrix is a clear confirmation that barite is precipitating within volumes below the resolution of the scan. This is explained by the significantly higher attenuation coefficient of barite relative to the attenuation coefficient of the fluid.
4. Discussion
Results suggest that the kinetics of mineral precipitation is conditioned by the type and size of the confined structure within the rock, i.e., microfractures (fast and localised precipitation), nanofractures (precipitation along the fracture and progressive decrease of growth rates), and nanoporous matrix (late precipitation at a constant rate). We hypothesise that the structure-specific precipitation kinetics is linked to: (1) Different ion transport rates, which leads to different supersaturation profiles at the growth front; (2) Different mechanisms of precipitation in the confined pores.
Ion diffusion along confined structures is affected by the surface area to volume ratio of the structure. This is because ions interact with surfaces delaying diffusion, which is only significant at the nano-scale. Therefore, it is natural that precipitation is first observed in the microfractures. It is also possible that advection also contributes to enhancing ion transport in the larger fractures due to the movement of the sample, although this is expected to be a small contribution. Slower diffusion in thinner fractures would delay nucleation and could create an ion concentration gradient at the diffusion front. Larger gradients would cause more gradual nucleation and growth, allowing diffusion to continue before clogging of the fracture. Contrarily, in wider fractures, the diffusion front is sharper since diffusion is not significantly delayed by confinement, which could explain the more localised and rapid formation of crystal bands that occlude the fracture. Previous double-diffusion precipitation experiments have also shown clogging of the reaction front within chalk containing pores with a size range similar to the wider fractures in our sample [
17]. This occurred even when using solutions about one order of magnitude more diluted than the solutions used in our experiment. The authors also observed that barite precipitates significantly reduced ion diffusion across the reaction front.
Nucleation has been observed to be inhibited by confinement at scales within the pore size range expected in our sample’s matrix [
30], which may be due to constraints in the size and stability of pre-nucleation clusters that lead to the formation of crystals [
31]. Consequently, nucleation of barite in nanopores requires a greater degree of supersaturation and longer induction times than nucleation on less confined surfaces [
32,
33], e.g., the surface of micron-wide fractures. Therefore, it was anticipated that a growth front formed first in the fractures and only later in the nanopores. Nevertheless, the inhibition of nucleation alone does not explain how the growth front in the nanopores remains permeable, as it would perhaps be unexpected due to the small pore volume available.
Although we cannot conclude about the long-term behaviour and similar experiments would be limited in time by the availability of synchrotron facilities, it is remarkable that the nanoporous matrix does not show signs of clogging. Based on previous work, the mechanism of barite growth in confinement is possibly different from that on open surfaces. For example, the solid phases formed within the nanopores may be different from the phases known to form on open surfaces, e.g., amorphous or hydrated barium and sulphate phases. Previous work showed that in the presence of organic molecules, barite crystals could grow with metastable shapes [
34] and crystals may be nanoporous [
35]. Metastable phases may dissolve and re-precipitate as a transient phase that allows continuous ion transport and the advance of the growth front. Transient nanoporosity has been shown to enable reactive transport through rocks, which results in various natural fluid mediated mineral reactions [
36,
37].
The two distinguishable types of crystals found on the surface of fractures are clear evidence of the different precipitation behaviour within different types of confined structures that possibly caused two separate precipitation events: (1) Larger crystals precipitated on the fracture’s surface (larger crystals in
Figure 3). This event takes place earlier and is induced by a sharp and localised supersaturation profile, which causes fast growth of crystals to the point of clogging the fracture. (2) Smaller crystals possibly grew from within the nanoporous matrix at a later stage, when precipitation in the fractures is slow. Since the smaller crystals do not seem to grow into the fracture, it suggests that as soon as a crystal grows from the nanopores (matrix) into a less confined structure (fracture), the growth mechanism changes so that ion transport from the matrix into the fractures is also blocked. Following the hypothesis presented in the previous paragraph, this would be the interface between a metastable barium sulphate phase and stable barite crystals. Such a mechanism would also explain why horizontal fractures inhibit the advance of the growth front through the nanoporous matrix. Additionally, at the interface between the nanoporous matrix and the horizontal fracture, e.g., fracture 1, if precipitation is to some extent inhibited in the nanopores, then when the growth front reaches the fracture, the fluid will possibly have a saturation index above the value that causes progressive precipitation in a non-confined environment. Consequently, sudden and fast precipitation (small crystals in fracture 1) would take place at the interface nanopore—fracture surface, which may cause the clogging of the nanopores that deliver ions into the fracture. Thereafter, only very limited diffusion would take place across the fracture.
Implications
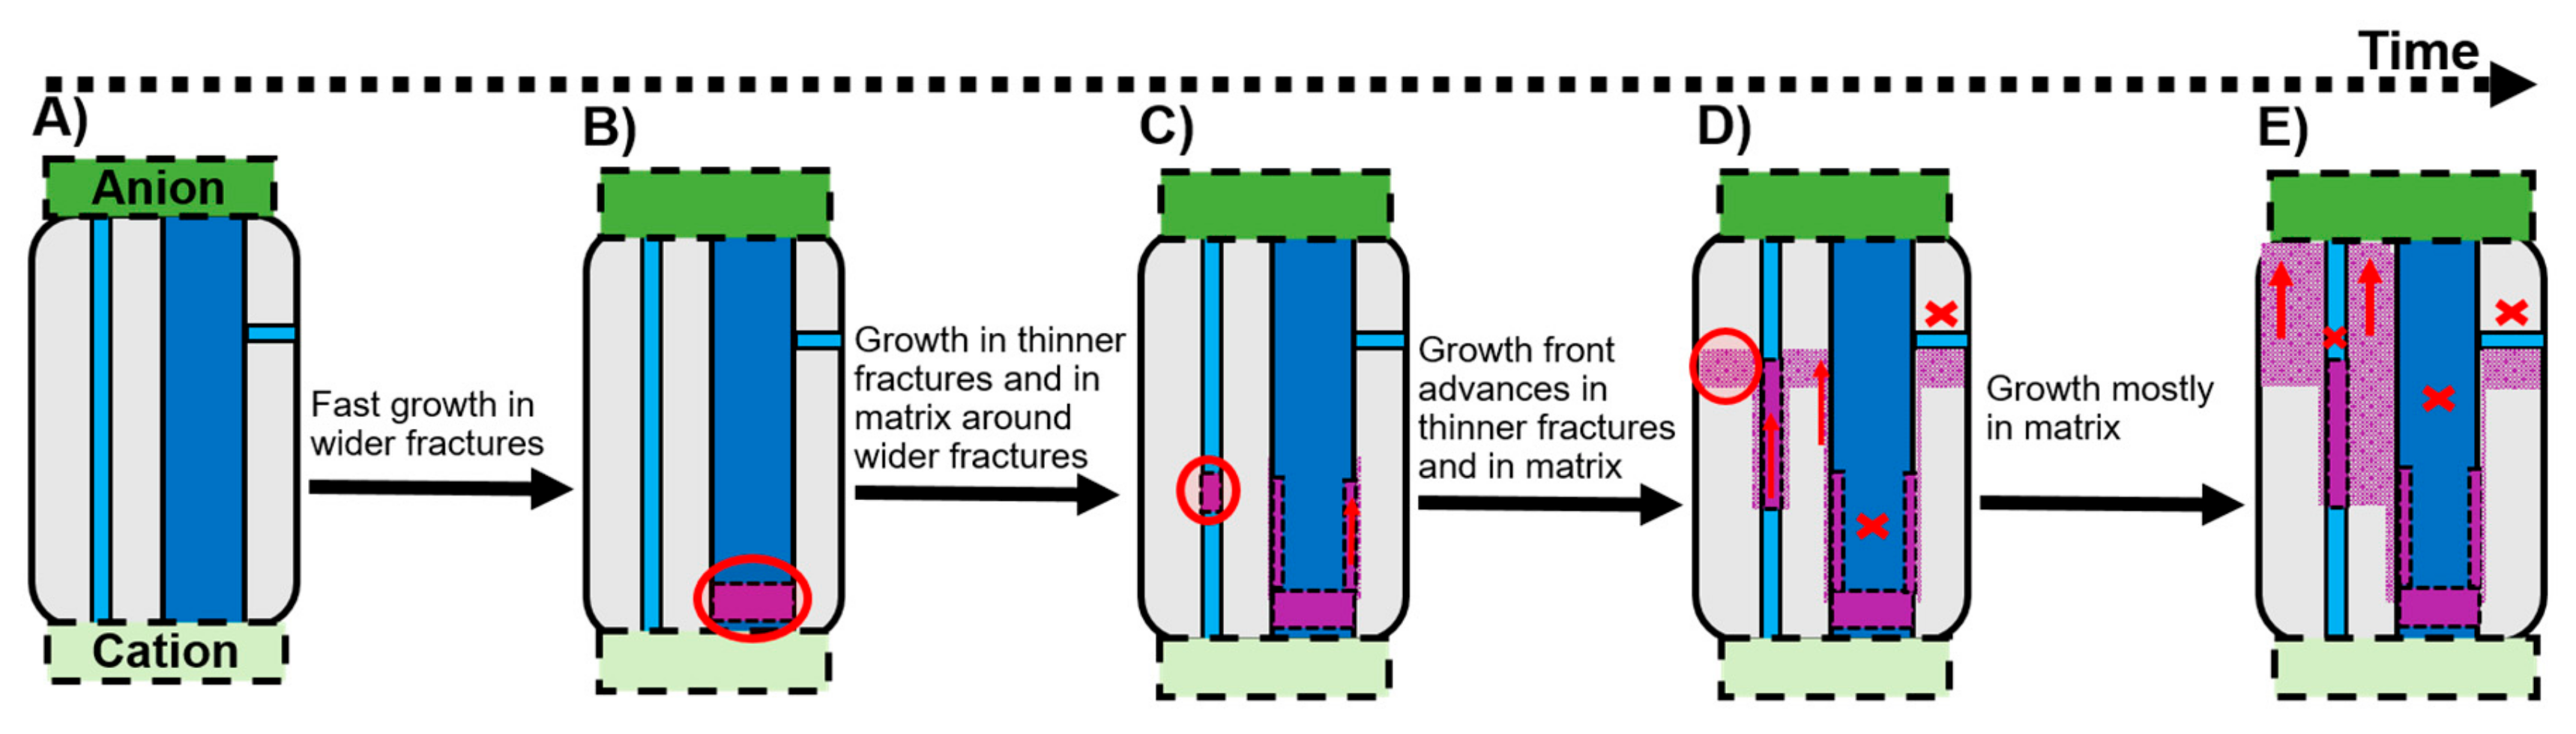
Extrapolation of the results from the laboratory experiments on 3 mm samples to time and space scales useful to interpret natural and engineering processes is always difficult, but this is necessary since nano-scale processes cannot be imaged at the field-scale. Within the limitations common to such upscaling, we propose a timeline that schematises the effect of different types of confined structures (pores and fractures), with diameters ranging from nanometres to micrometres, on diffusion-induced mineral precipitation. The possible implications to subsurface science and engineering of the sequence of events proposed in
Figure 5 are analysed next.
First, precipitation takes place in the larger (micron-wide) fractures within the rock, causing localised clogging, which limits ion transport, and consequently, further growth along these fractures (Stage B,
Figure 5). This is a potential concern to hydrocarbon extraction methods. For example, immediately after hydraulic fracturing, the fluids in the formation are typically in disequilibrium. If ion diffusion triggers mineral precipitation following the proposed sequence of events, the wider fractures where the oil and gas are expected to flow may clog rapidly. Consequently, the permeability of the rock may be significantly reduced, which would hinder the efficiency of the hydrocarbon extraction.
Later, precipitation will take place within progressively thinner fractures (Stage C,
Figure 5). The thinner the fracture’s width, the slower the growth, due to the more extended ion concentration profile caused by slower diffusion rates. Consequently, in thinner fractures, precipitation will take place across long distances (parallel to the diffusion direction) than in wider fractures, until limited ion transport eventually ceases precipitation. This consolidation of thin natural fractures is potentially interesting to seal shale formations that are used as a cap rock at CO
2 sequestration sites [
38,
39]. In this scene and contrary to shale formations under hydrocarbon exploration, the permeability of the rock is desirably low to prevent fluids from moving in and out of the formation where CO
2 is injected. Additionally, the blockage of the growth front at fractures perpendicular to the mixing direction would contribute to the self-sealing of the repository along cross-linked fractures. This is perhaps unexpected, as more efficient ion transport would have been predicted along cross-linked fractures. Instead, our results suggest that such fractures can block diffusion due to localised precipitation. Similar sealing mechanisms could also be interesting at tailings disposal sites and at repositories for spent nuclear fuel, for which barite would offer not only a physical barrier but also a chemical barrier by absorption and co-precipitation of radionuclides [
40,
41].
At last, extrapolating the constant precipitation rate in the nanopores measured in this work to longer time-scales, precipitation could eventually take place in the nanoporous matrix over the entire formation width (Stage D–E,
Figure 5). The distinguishable precipitation kinetics and mechanism in nano-confinement prevent the total occlusion of nanoporous regions, allowing sufficient ion transport to assure continued steady advance of the growth front through these regions. The possibility of precipitating minerals without completely clogging the porous network is potentially interesting in the context of mineral sequestration in the bedrock. In an ideal scenario for such applications, the mixing of reactive fluids would occur over the entire formation. This would maximise the amount of mineral sequestered and at the same time keep the sequestered mineral within low permeability regions of the formation. Since fast dissolution (by advection) can only occur if reactive fluids penetrate through wider fractures, the sequestered minerals would be protected against dissolution. For example, radionuclides commonly found in shale, can co-precipitate with barite [
11,
40]. Therefore, induced barite precipitation in the nanopores that lock up these radionuclides could be the foundation to establish methods to control contamination within the formation. For this purpose, it would be more efficient to induce precipitation (e.g., by injecting sulphate-rich fluids) on the undisturbed shale that has fractures predominately along the bedding plane, as opposed to fracked shale that has fractures perpendicular to the bedding plane, which would delay growth through the nanopores (Stage E,
Figure 5). Subsequent hydraulic fracturing would unclog the main fractures if, as observed here, the precipitates are mostly within localised thin bands.


