Article

Bubble Size Distribution Characteristics of a Jet-Stirring Coupling Flotation Device

School of Materials Science and Engineering, Anhui University of Science and Technology, Huainan 232001, China
*
Author to whom correspondence should be addressed.
Minerals 2019, 9(6), 369; https://doi.org/10.3390/min9060369
Submission received: 6 May 2019 / Revised: 3 June 2019 / Accepted: 17 June 2019 / Published: 20 June 2019

Abstract

:
In this study, a new jet-stirring coupling flotation device that incorporates the advantages of three conventional flotation machines (specifically, Jameson cell, mechanical flotation cell, flotation column) was designed based on jet suction. The suction capacity of a double cosine self-aspirated nozzle utilized by the device was analyzed under different feeding pressures, and the effects of frother concentration, feeding pressure, suction capacity, and height of sampling location on the bubble size distribution (BSD) were investigated using a high-speed video system. It was found that a large amount of air was sucked into the flotation cell by the self-aspirated nozzle arranged in a non-submerged manner, which met the requirements of flotation in terms of the suction amount of air. The suction capacity showed a positive linear correlation with negative pressure inside the nozzle. When the Methyl isobutyl carbinol (MIBC) concentration reached the critical coalescence concentration (CCC), the bubble size stabilized at approximately 0.31 mm, which was smaller than the bubble size produced by the conventional flotation machine. This indicated that bubbles suitable for flotation were generated. D32 linearly decreased with increasing of feeding pressures and conversely increased with increasing suction capacities and sampling location heights, independent of the frother concentration.

Graphical Abstract

1. Introduction

Flotation devices are considered to be effective for fine coal slime separation processes [1,2], and the research and development of flotation equipment are focused on achieving a large-scale, high-efficiency, energy-saving, and environmentally friendly separation [3,4]. To date, three main types of flotation machines have been widely used in different flotation process of minerals: mechanical flotation machine [5], Jameson cell [6], and flotation column [7].
Extensive studies on the suction capacity and bubble size distribution (BSD) of traditional mechanical flotation machines have indicated that these functions are easily influenced by the structural parameters of an “impeller stator” [8], which has higher energy consumption due to mechanical agitation [9] and larger bubbles, compared to nanobubble column flotation [10]. For the Jameson cell, air in the suction mode is continuously pumped and carried by the velocity difference between the high-speed pulp flow and air flow, where air is suctioned at low pressure around the core area of the jet flow [11]; a large portion of the bubbles generated in the jet suction mode have a small size [12], such as nanobubbles, and were two orders of magnitude smaller than conventional sized bubbles [10]. A Venturi type bubble generator can produce a large number of micro bubbles [13] and the Jameson cell has a low energy consumption [14]. It has been found that a rotational flow in the cyclonic-static micro-bubble flotation column is a benefit for the particles colliding with and attaching to the bubbles, and the probability of particle attachment substantially increased [15]. A non-uniform filling method was proposed to optimize the flow field. Filling with a non-uniform sieve in the cyclonic-static micro-bubble flotation column was proved to be more effective on bubble size distribution equalization [16]. In addition, it was found that rotational flow improves the effect of mineralization and increases the recovery of coarse coal particles in the cyclonic-static micro-bubble flotation column [17]. Moreover, a nozzle equipped with a long throat and arranged in a submerged manner was studied [18]. It was observed that the suction capacity of the nozzle increased with the nozzle distance and cross-section ratio. Furthermore, it resulted in a high jet kinetic energy dissipation rate. However, when exposed to air, either the suction capacity decreased significantly, or the nozzle failed to work properly.
As we all know, the processes of collision, detachment, and attachment between the bubbles and the coal particles complete the final coal slime flotation process [19]. The bubble is the main carrier of the flotation process. The bubble size distribution has a significant influence on the selectivity of the bubble and the ability to carry the target mineral [20]. Bubbles of different sizes have different abilities to separate minerals, which directly affects the efficiency of the flotation equipment [21]. Therefore, it is extremely important to measure the BSD of the flotation device. There are many factors that affect the BSD, such as various frothers, frother concentration, impeller speed, aeration quantity, and solution pH, which further affect the generation of mineralized bubbles [22,
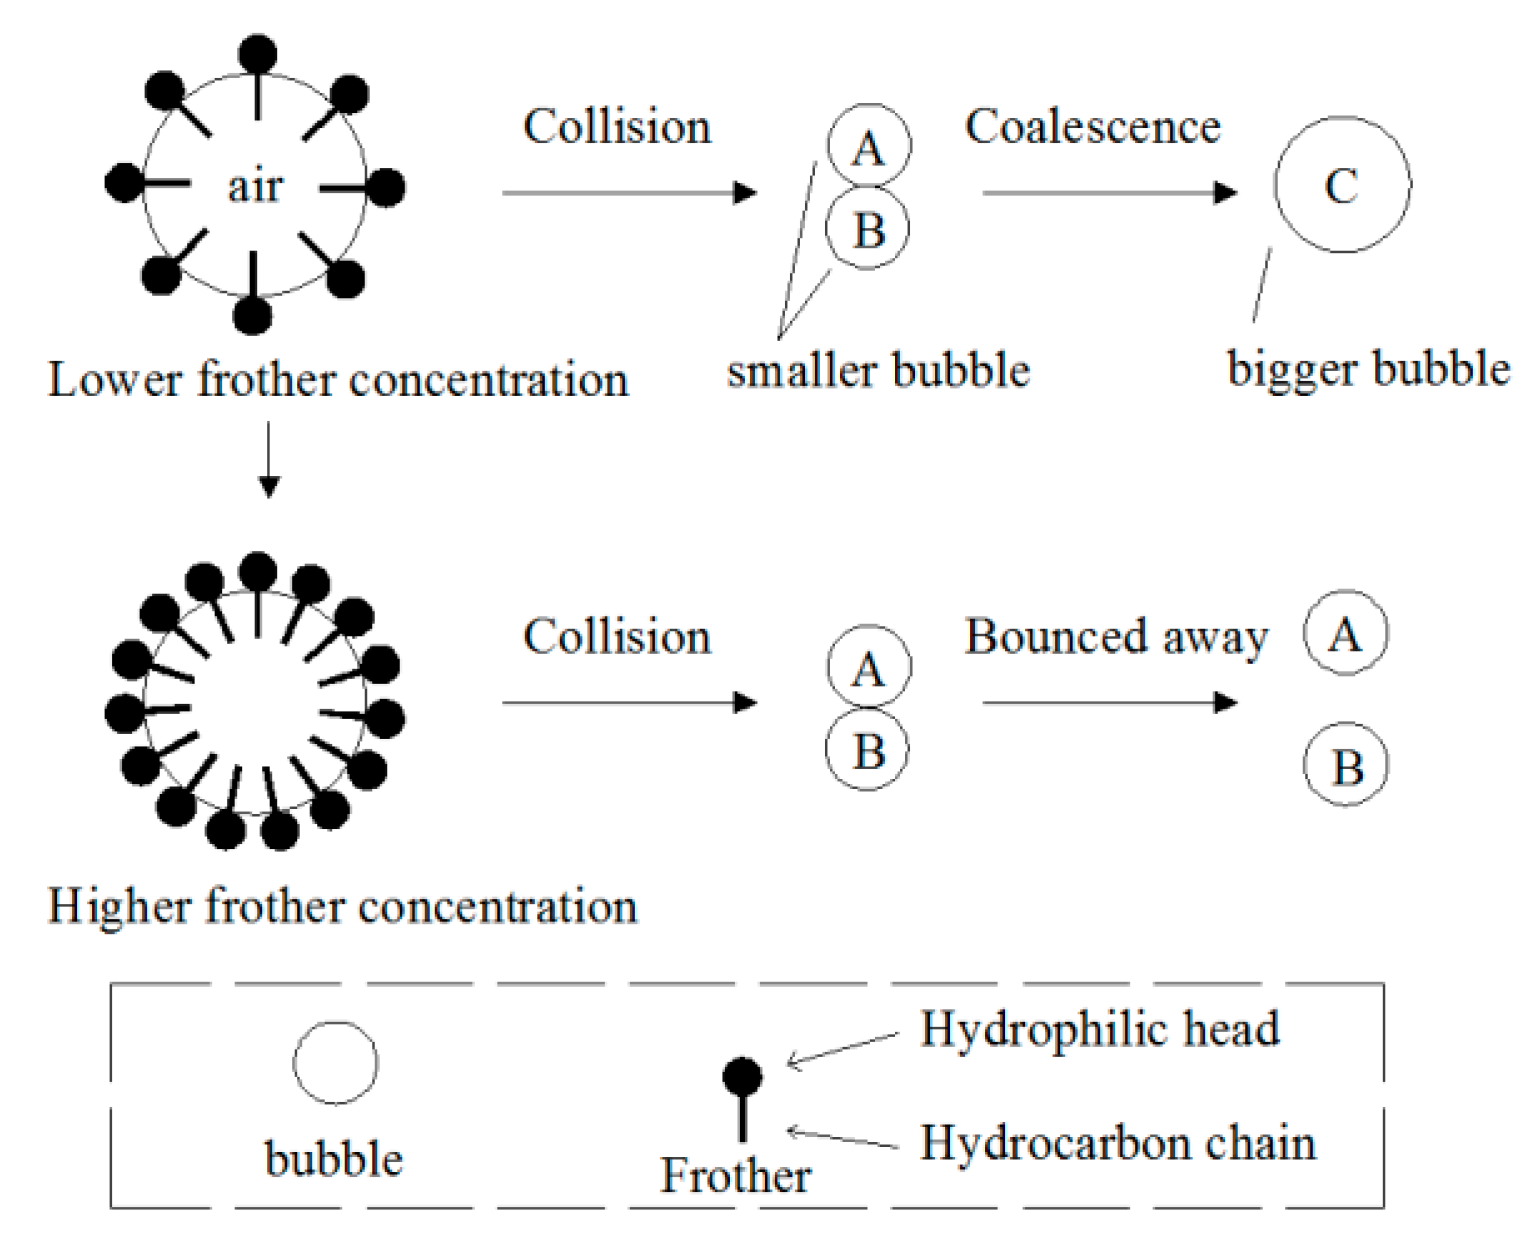
23]. Compared to water alone, the addition of frother produces a narrower distribution and finer bubble size [24]. Various frother types have different critical coalescence concentrations (CCCs). The impeller speed-bubble size tests show that D32 is unaffected by increased impeller tip speed across the range of 4.6 to 9.2 m/s (representing the industrial operating range), although D32 starts to increase below 4.6 m/s. The results suggest that the bubble size and bubble size distribution (BSD) do not change with increasing impeller speed in the quiescent zone of the flotation [25]. The bubble size increases with the increase of gas rate, and, conversely, decreases with the increase in the impeller tip speed in the Denver mechanical flotation cell [26]. As such, it is extremely important to measure the BSD and discuss its distribution regularity to evaluate the gas dispersion capacity of the flotation equipment [
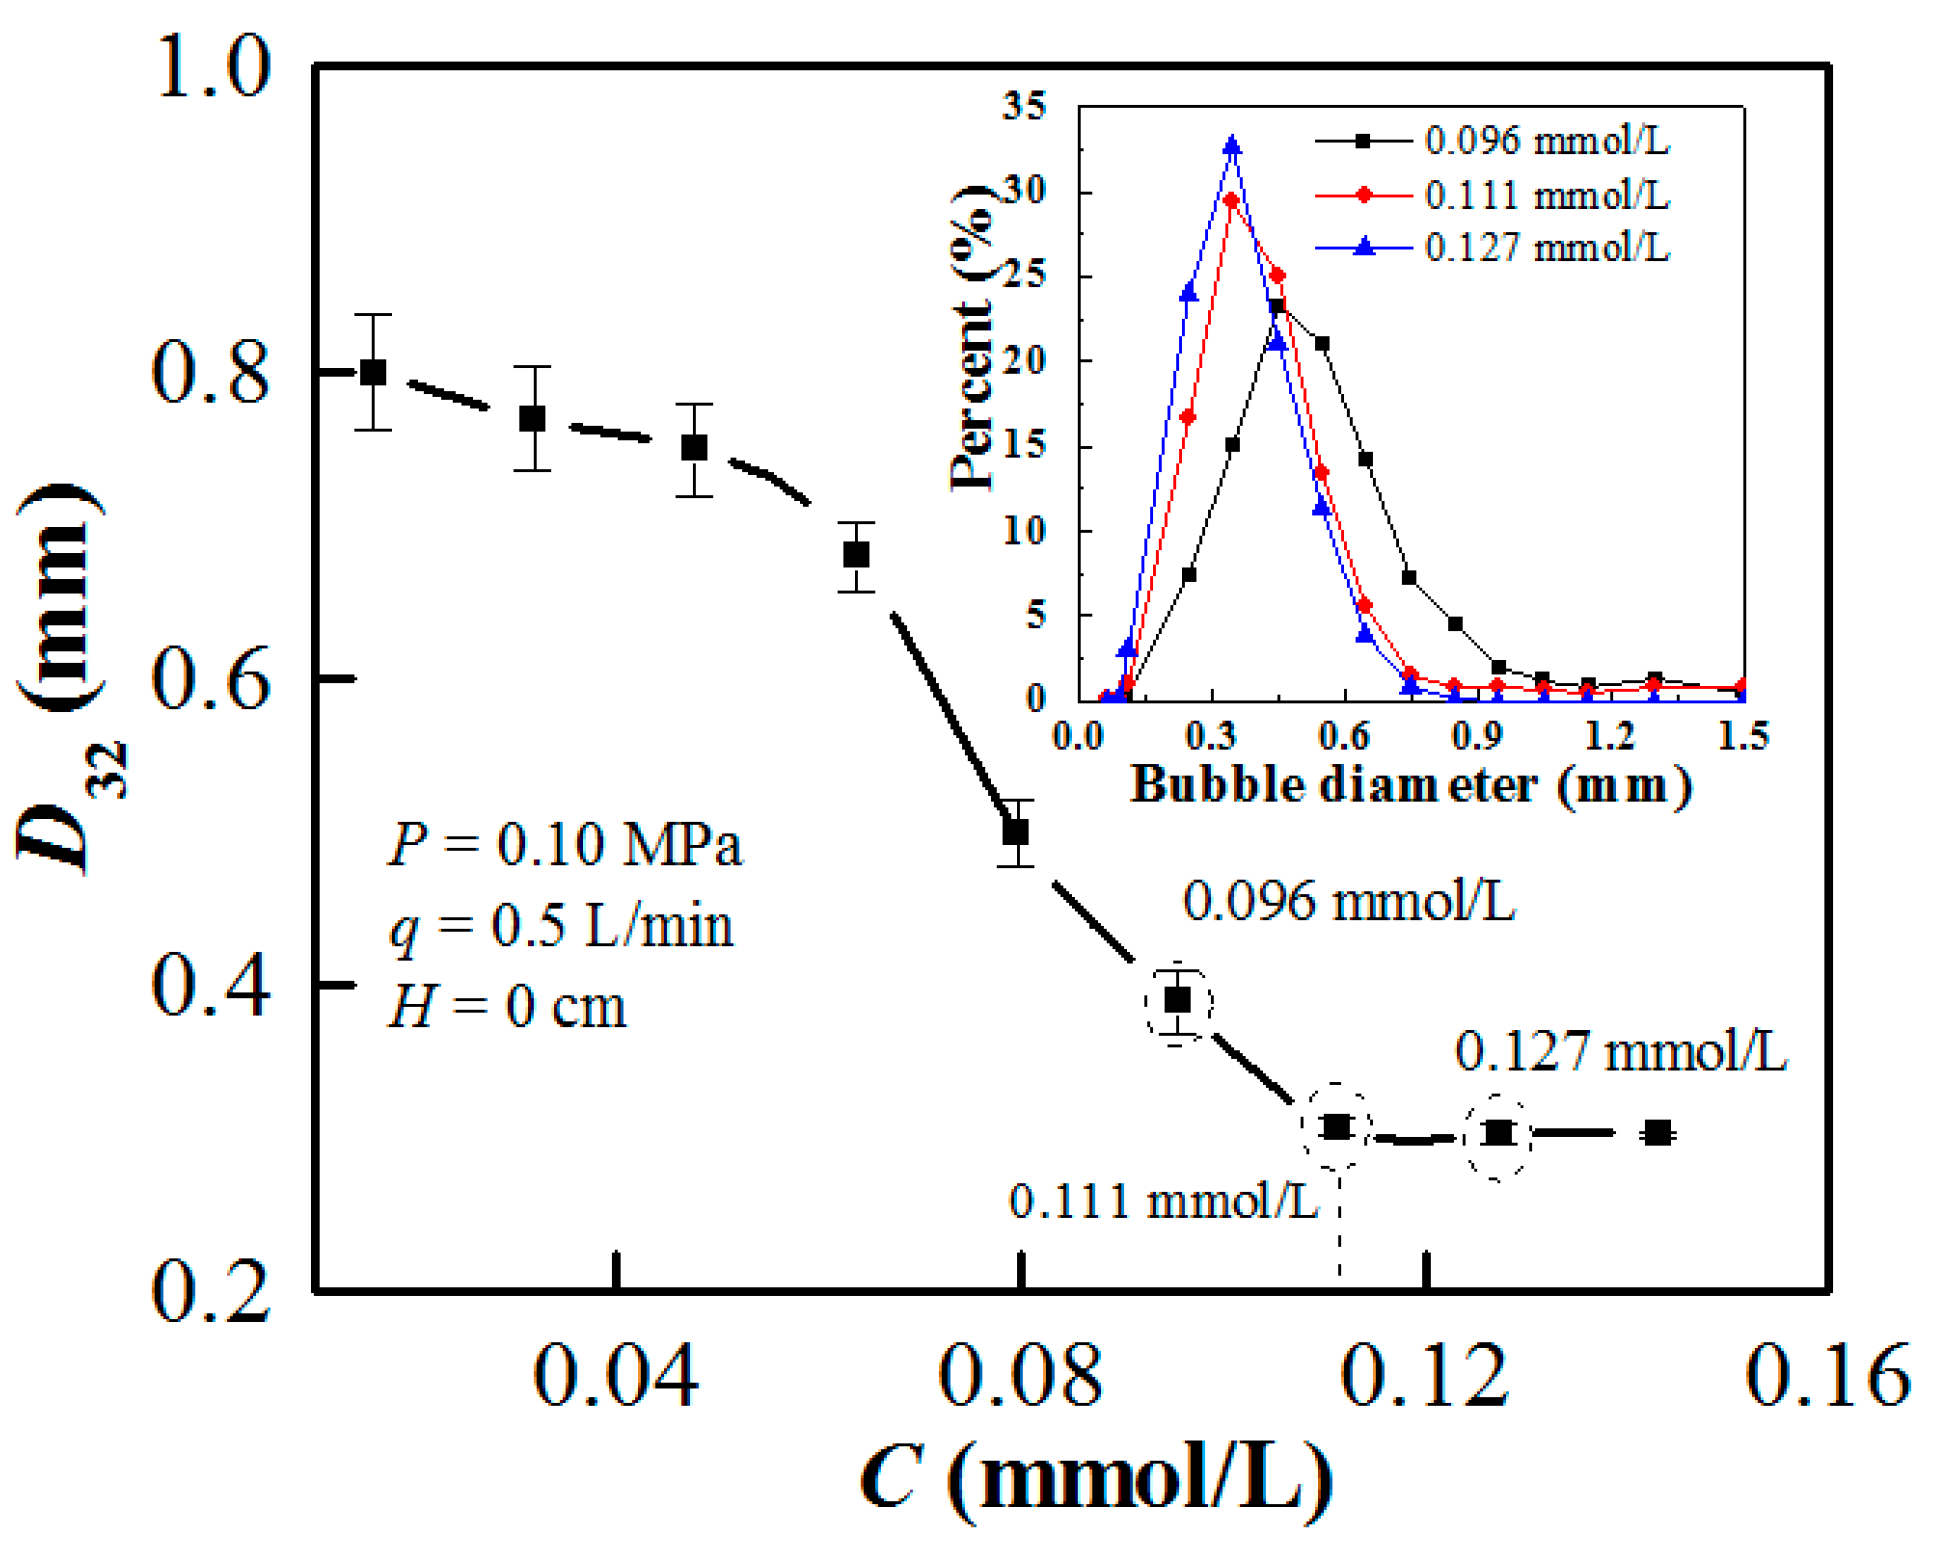
27]. It is noteworthy that bubble coalescence is completely prevented as the frother concentration reaches the CCC [28], and the bubble Sauter mean diameter remains almost constant [24,29].
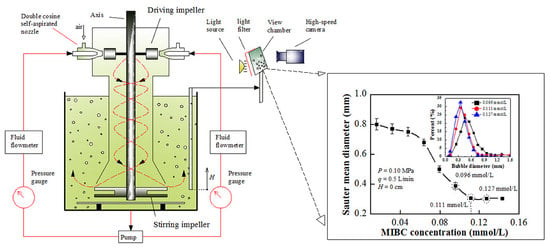
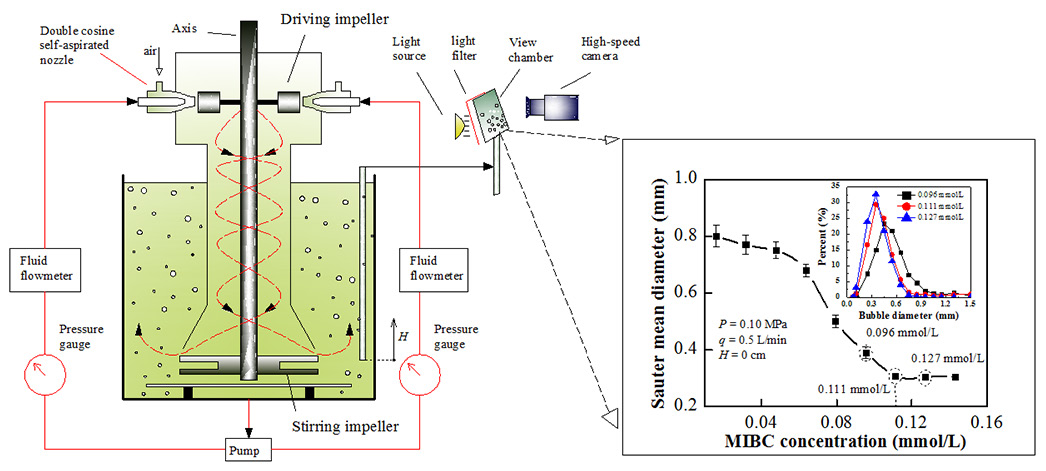
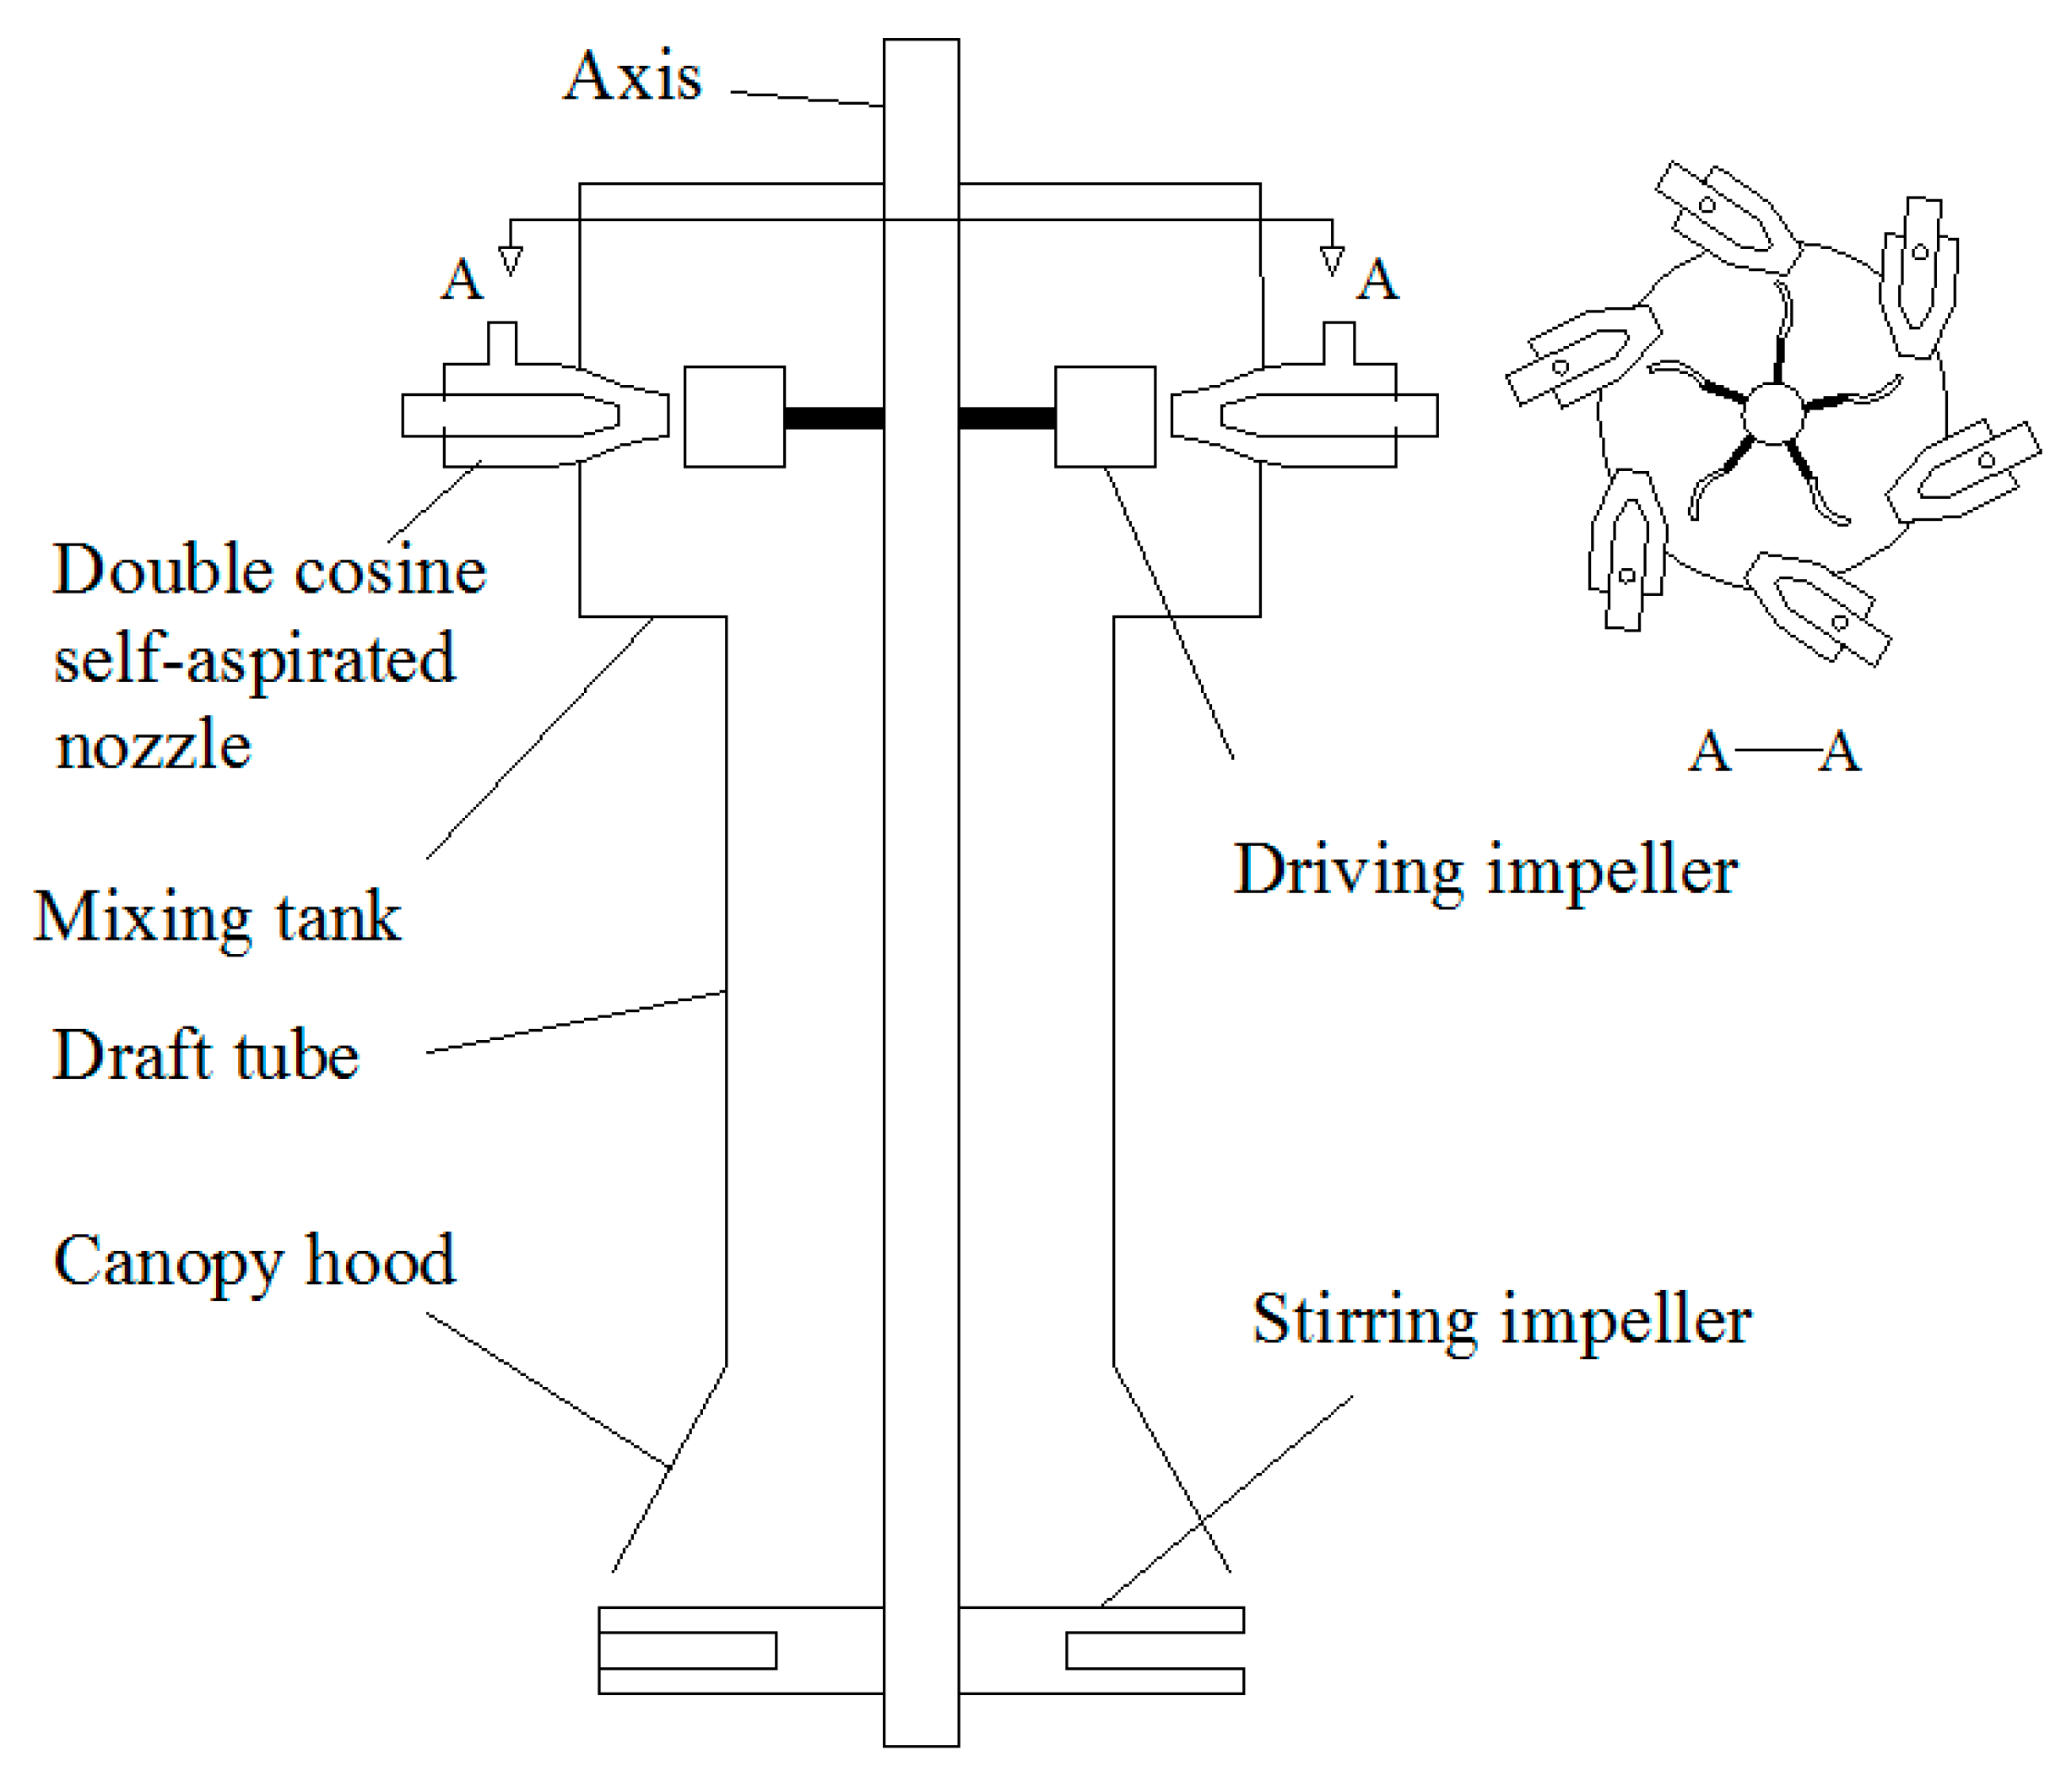
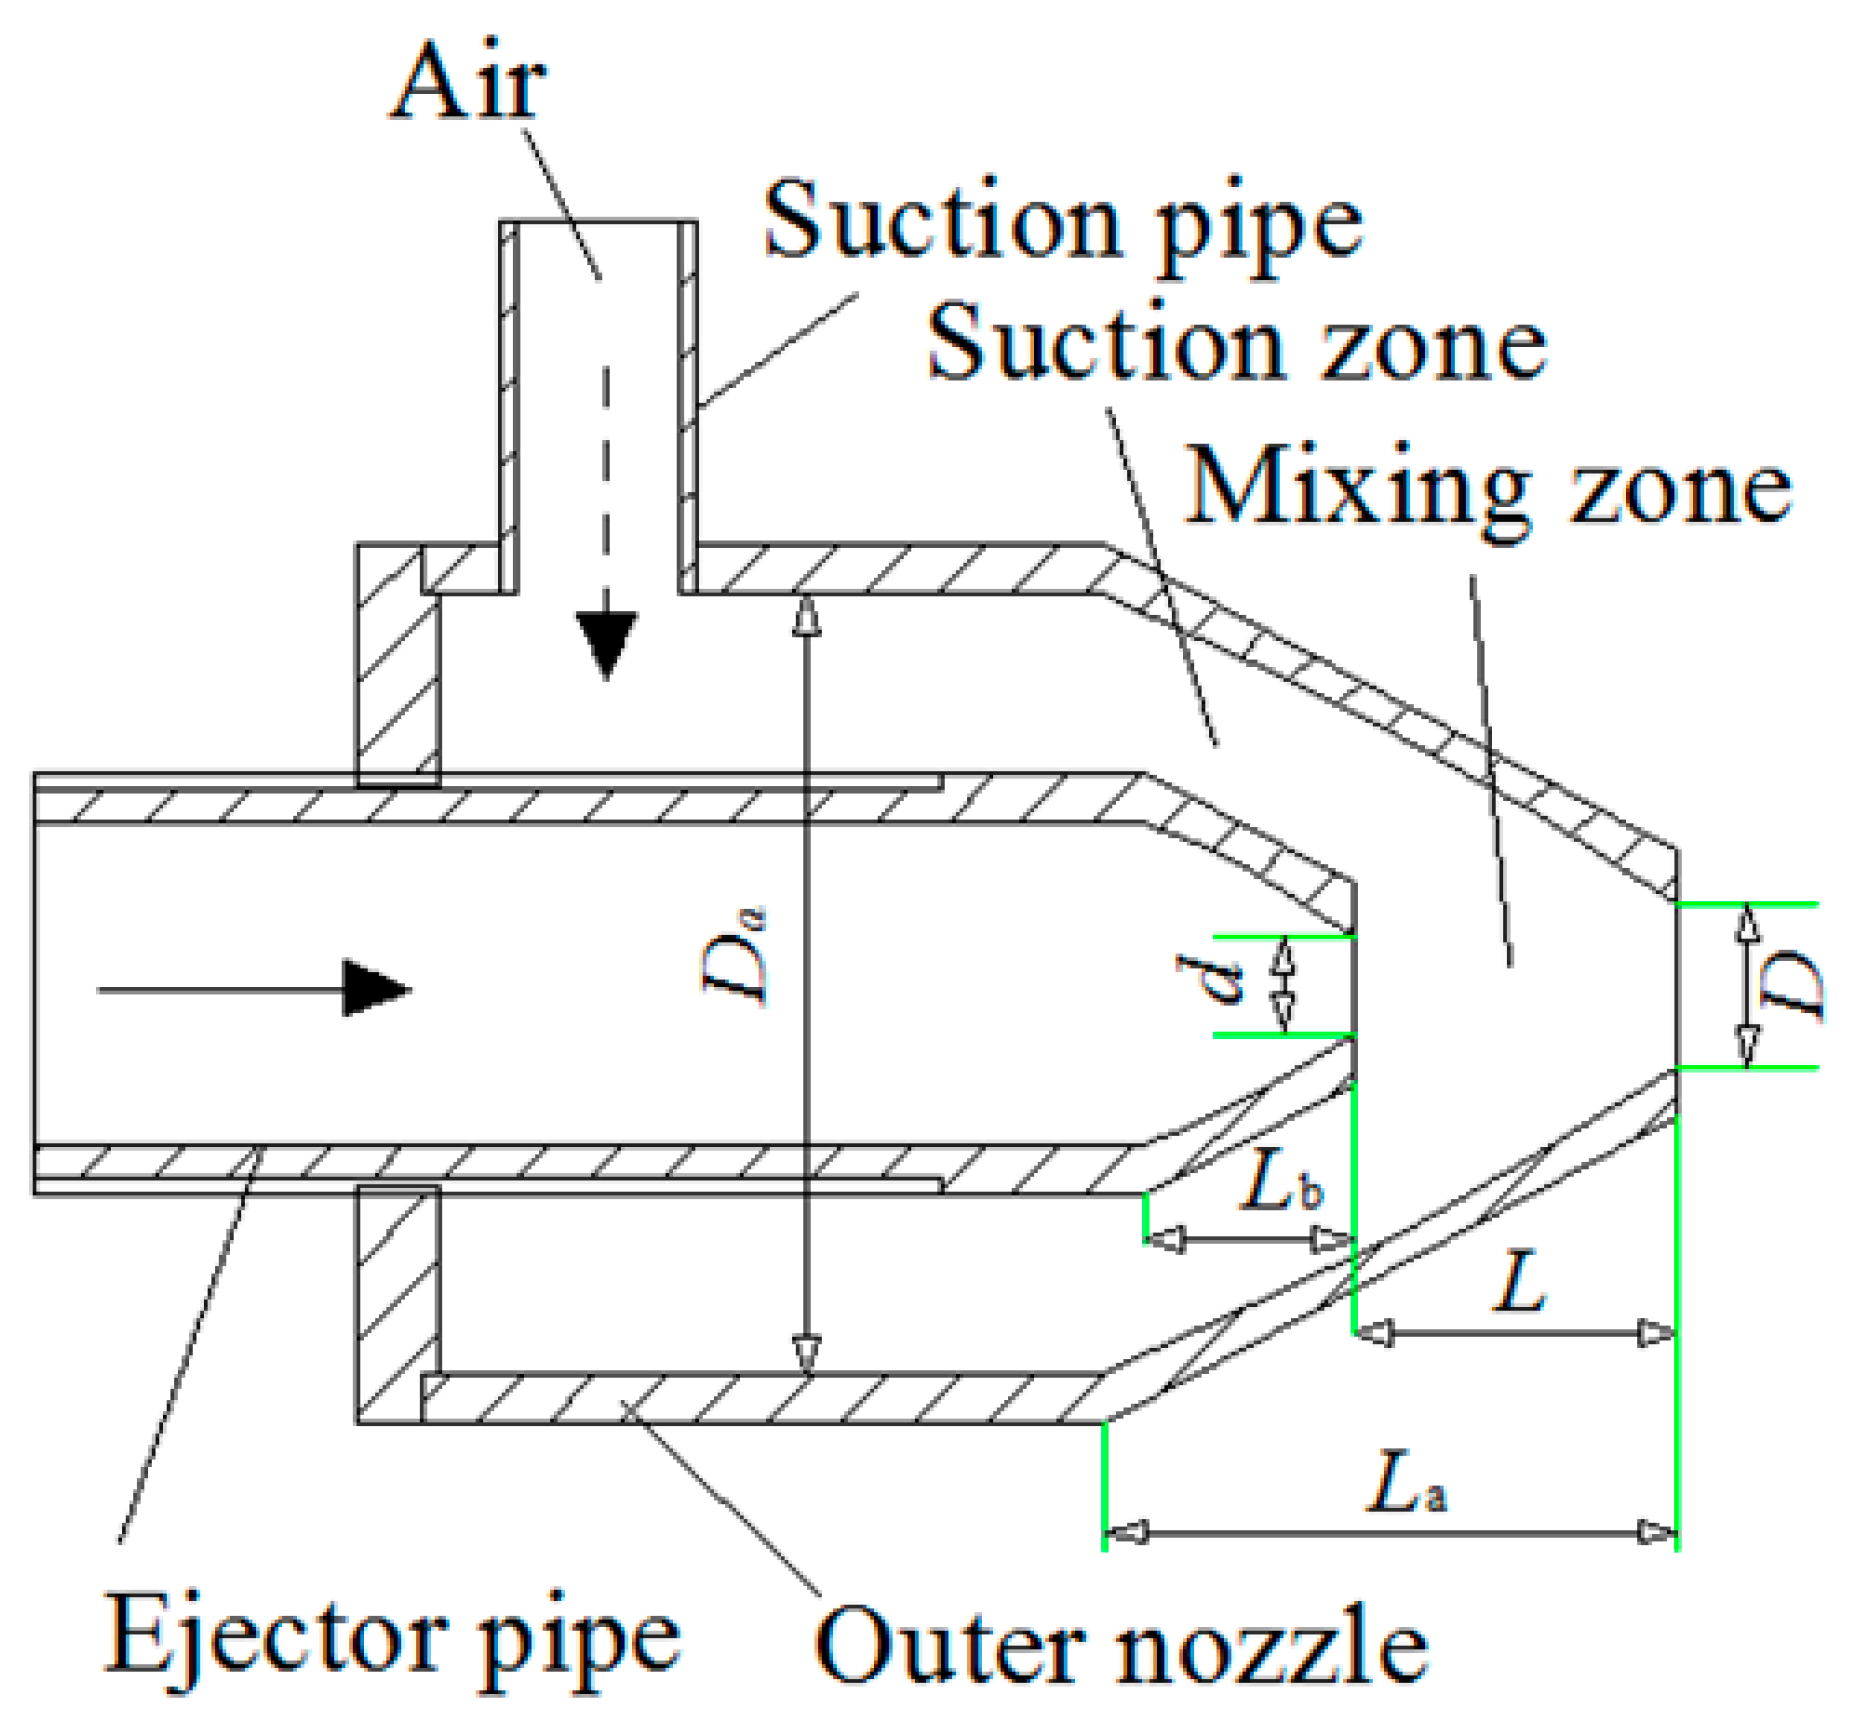
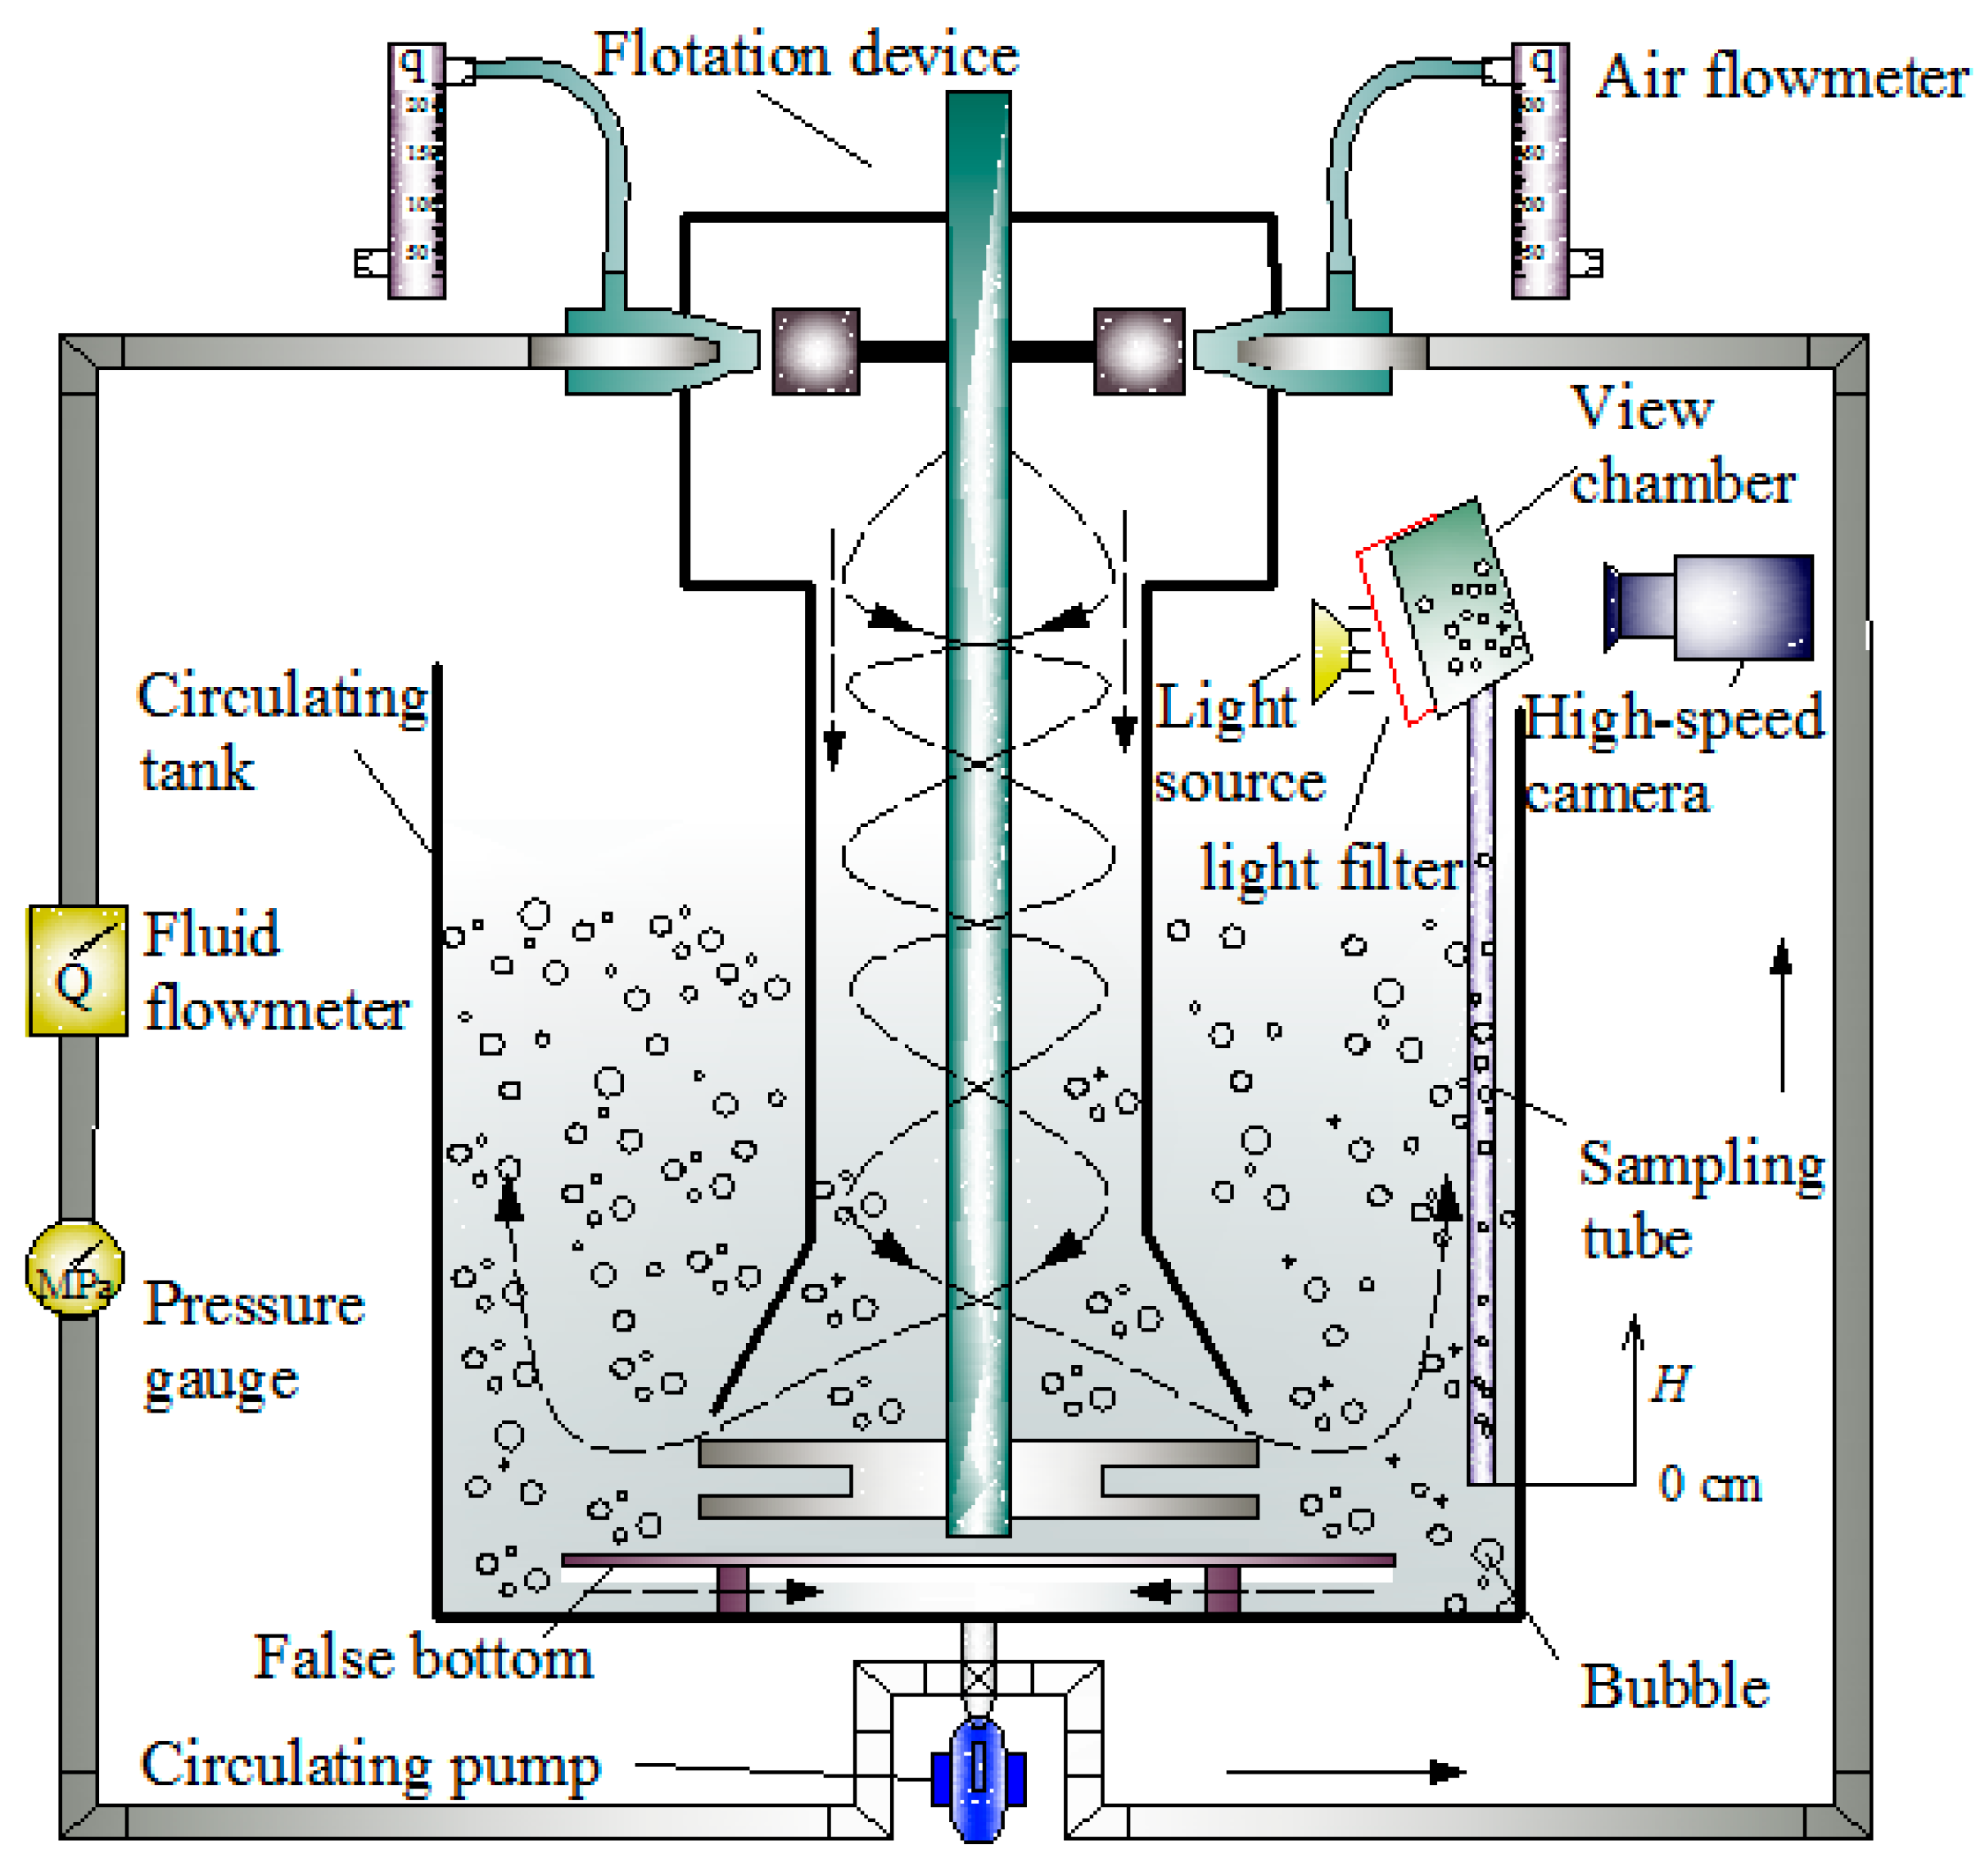
These studies have only focused on various aspects of a single flotation machine; however, they failed to combine the characteristics of two or more flotation machines and conduct performance tests. Therefore, in this study, we developed a new jet-stirring flotation device that combines the advantageous characteristics of the three most common flotation machines. These advantages are that the Jameson cell made full use of jet flow to eject a large amount of air and produce smaller size bubbles; the stirring effect of a mechanical flotation cell made the slurry circulation effect better and the flotation was more sufficient; and the rotational flow of cyclonic-static micro-bubble flotation column improved the effect of mineralization and increased the mineral recovery rate. Further, we investigated the suction performance of its double cosine self-aspirated nozzle under various feeding pressures. The effects of the feeding pressure, frother concentration, suction capacity, and sampling location height on the bubble size in the flotation cell were also investigated via a bubble size measurement system.

2. Jet-Stirring Coupling Flotation Device

2.1. Device Structure

The structural details of the jet-stirring coupling flotation device are shown in Figure 1. It mainly comprises six components: (1) a double cosine self-aspirated nozzle for inhaling air, premixing air and slurry, and a high-speed jet containing gas slurry; (2) a driving impeller fixed at the top of the axis for further dispersing bubbles and generating centrifugal force; in addition, the axis passes through the top of the mixing tank positioned using a sealed bearing; (3) a stirring impeller fixed at the bottom of the axis for adjusting the dispersion of mineral particles, the uniformity of bubbles, and the degree of turbulence of the slurry; (4) a round mixing tank for mixing the slurry; (5) a draft tube for draining the slurry to the stirring impeller; and (6) a canopy hood for dispersing the slurry evenly into the stirring impeller and circulating tank.
The layout of the six double cosine self-aspirated nozzles is shown in the A-A view. The six nozzles are arranged symmetrically along the center of the upper part of the mixing tank, which cuts through the inner wall along the mixing tank. The center line of the nozzles is in the same horizontal plane as that of the driving impeller.
Figure 2 shows the structural schematic of the double cosine self-aspirated nozzle, the most important part of the flotation device, which mainly comprises three components: (1) an ejector pipe for jetting high-speed slurry and injecting air flow, (2) a suction pipe for drawing in air from the atmosphere, and (3) an outer nozzle for forming the suction and mixing zones between the ejector pipe and outer nozzle. The cone angle of the cosine section of the ejector pipe and that of outer nozzle were both designed to be 28° ( β = tan 1 ( 1 2 × D a D L a ) = 28 ° ). The outlet diameter of ejector pipe is 6 mm, and that of the outer nozzle is 7 mm. The distance between the ejector pipe and outer nozzle is 20 mm. The other structural parameters of the double cosine self-aspirated nozzle are given in Table 1. A stable negative pressure environment formed in the suction zone will draw in a large amount of air when a high-speed slurry jet is continuously ejected from the ejector pipe; then the air and slurry are strongly premixed in the mixing zone within the nozzle.

2.2. Working Process of Flotation Device

The driving impeller was driven by a gas-containing high-speed slurry flow jetted from the double cosine self-aspirated nozzle, rotating in real time at the same angular velocity as the stirring impeller and generating centrifugal force in the mixing tank. The slurry sprayed onto the driving impeller was thrown onto the inner wall of the mixing tank to enhance the dispersion between the slurry and bubbles; the slurry was in a spiral motion within the draft tube under the action of its own gravity and centrifugal force and evenly distributed to the stirring impeller through the canopy hood. The large bubbles were again cut into microbubbles by the high-speed rotating driving impeller and the stirring impeller. In this process, the dispersion degree and collision probability of the slurry, agents (frother and collector), and bubbles were enhanced, thereby improving the effect of bubble mineralization.

3. Experimental Evaluation

3.1. Experimental System

Figure 3 shows the overall experimental setup used in this study. The experiments for the determination of the bubble size were conducted in the jet-stirring coupling flotation device, equipped with an approximately 35 L circulating tank, provided with a false bottom in the cell; the distance between the stirring impeller and the false bottom was set to 15 mm, and that between the false bottom and circulating tank bottom was set to 10 mm. Other structural parameters of the flotation device are outlined in Table 2.
The view chamber was set as an inclined (15°) window, and used to disperse the bubbles into a near monolayer [30,31,32]. A light filter was used to improve the uniformity of the light source to provide a sharp contrast between the bubble edges and the background; the bubbles rose through a vertical sampling tube with a 12 mm inner diameter into the viewing chamber filled with the test medium (100 mm length, 150 mm width, and 20 mm depth) to observe bubbles at different points in the circulating tank.
An electromagnetic liquid flowmeter (range: 0.3–7 m3/h) and a diaphragm pressure gauge (range: 0–0.6 MPa) were installed on the pipeline at the outlet of the circulation pump for measuring the working parameters in real time. An LZB-6-type glass rotameter was used to measure the suction capacity (q, L/min) of the double cosine self-aspirated nozzle, and the negative pressure value (p, MPa) of the nozzle was measured by the negative pressure meter. An ACS510-01 frequency converter (ABB (China) Co., Ltd., Beijing, China) was used to control the working frequency of the circulating pump and indirectly control the feeding pressure (P, MPa).
The slurry was cyclically pumped to the double cosine self-aspirated nozzle by the circulation pump. As shown in Figure 3, the flow direction of the slurry in the flotation device and the circulating tank is represented by the black dotted arrow, while that of the slurry outside the circulating tank is represented by the black solid arrow. Since the six nozzles were of the same structure and arranged symmetrically on the upper part of the flotation device, only a single-nozzle BSD test was conducted in this study.

3.2. Experimental Conditions and Methods

Methyl isobutyl carbinol (MIBC, C6H14O, analytical pure, Shanghai Hansi Chemical Co., Ltd., Shanghai, China) was used as a frother, and its concentration is denoted as C (mmol/L). During the whole testing process, the depth of the fluid remained unchanged in the circulating tank. The vertical H coordinate axis was established for showing the sampling location height away from the horizontal center line of the stirring impeller, as shown in Figure 3. The horizontal plane where the center line of the stirring impeller is located is set as the coordinate origin, i.e., (H = 0 cm). The D32 at a different height of the sampling location were studied by moving the inlet of the sampling tube vertically up. All tests were performed at room temperature (20 ± 1 °C) using tap water of pH 6.8 [33,34].
Images of the bubbles sliding up the inclined view chamber were captured using an i-SPEED 3 high-speed camera (CINV Optical Instruments Co., Ltd., Nanjing, China) at a rate of 4000 frames per second and a typical image resolution of 768 × 576 px. To increase the accuracy of the BSD, a minimum of 5000 bubbles were measured for each condition tested. Professional image analysis software, Image-pro-plus, was used for correctly identifying bubble sizes, recording, and analyzing the data.

3.3. Data Processing

The Sauter mean diameter (D32) is commonly used to evaluate the average value of the bubble swarm, which was determined using Equation (1) [13,35].
D 32 = i = 1 n d i 3 i = 1 n d i 2   ,
where n is the total number of bubbles sampled; di represents the diameter of the ith bubble.

4 Results and Discussion

4.1. Effect of Feeding Pressure on Suction Capacity and Negative Pressure in a Double Cosine Self-Aspirated Nozzle

The suction capacity and negative pressure as a function of the feeding pressure in a double cosine self-aspirated nozzle are presented in Figure 4. Within the studied feeding pressure range, the suction capacity and absolute value of the negative pressure generally increased on increasing the feeding pressure; this indicates that increasing the feeding pressure results in an increase in the speed difference between the liquid and gas, as shown in Figure 5. It can be seen from Table 3 that the high-speed liquid carries away a considerable amount of air from the suction pipe and creates a stable negative pressure environment inside the nozzle. It can be seen from Figure 5 that once the feeding pressure rises higher than 0.16 MPa, the velocity difference of liquid-air exceeds 14 m/s, indicating that the ejection ability of liquid is greatly enhanced.
There is a linear positive correlation between the suction capacity and negative pressure, as seen in Figure 6. The curve was fitted using a linear function, and the coefficient of determination is as high as 0.9815. The suction capacity increased with the increase in negative pressure, suggesting that the improvement in the negative pressure environment inside the suction zone caused the nozzle to draw in a large amount of gas required for flotation. This demonstrates the feasibility of arranging the nozzle in a non-submerged manner and the rationality of the nozzle parameter design.

4.2. Effect of Frother Concentration on Bubble Size Distribution

D32 as a function of the MIBC concentration for a constant suction capacity of 0.5 L/min, P = 0.10 MPa, and H = 0 cm is shown in Figure 7. It can been seen from Figure 7 that D32 decreased with the increase in the MIBC concentration until the CCC value of 0.111 mmol/L was reached [36,37]; above this value, D32 was almost constant at approximately 0.31 mm. The comparison of D32 in flotation machines at CCC is shown in Table 4. It can be seen from Table 4 that D32 of this device was smaller than that of the conventional flotation machines.
The BSDs of three representative frother concentrations of 0.096, 0.111, and 0.127 mmol/L are presented in the inset of Figure 7. As observed, the percentage of small bubbles increases with the frother concentration, and the peak position of each curve gradually shifts toward the smaller bubble size with an increasing MIBC concentration.
Figure 8 presents the orientation of the frother molecules at the air/water interface, and effect of different frother concentrations adsorbed on the surface of bubbles during the collision, coalescence, and separation of bubbles. It can be seen from Figure 8 that a lower frother concentration adsorbed on the surface of bubbles easily, causing them to coalesce and generate larger bubbles from smaller bubbles during bubble collision; conversely, a higher frother concentration effectively prevents bubble coalescence during the process of bubble collision. It was demonstrated that MIBC reduced the surface tension of the solution [26]; its molecular structure consists of a hydrophilic polar group and a hydrophobic hydrocarbon chain. When the polar groups are arranged in the liquid phase and non-polar groups are arranged in the gas phase [24], the MIBC molecules are adsorbed on the surface of bubbles as an oriented layer to form a more stable “protective layer” at the air/water interface. The number of molecules adsorbed on the surface of the bubbles increases with the MIBC concentration, resulting in further reduction in the solution surface tension; hence, D32 also further reduced. At lower frother concentrations, the bubbles are easily affected by external forces and merge into larger bubbles. As the concentration reaches the CCC, the number of molecules on the surface of the bubbles remains essentially constant, and the surface tension of the solution can resist the influence of external forces. Bubbles will collide, deform, and then bounce away; therefore, the possibility of bubble coalescence is reduced.

4.3. Effect of Feeding Pressure on Bubble Size

Figure 9 presents the variation of D32 with the feeding pressure for three typical frother concentrations at q = 0.5 L/min and H = 0 cm. Overall, with an increasing feeding pressure, D32 gradually decreased at each frother concentration. Lower frother concentrations caused a higher decrease in D32, and the D32 difference between two adjacent curves also decreased with the feeding pressure increased. From another perspective, for a fixed volumetric input rate of the gas, this decrease in bubble size represents an increase in the number of bubbles, which in turn signifies an increase in the total surface area available for coal particle attachment [41]. The change in the feeding pressure mainly increased the turbulence intensity in the nozzle mixing zone, which led to an increase in the gas–liquid interaction frequency. Moreover, the increase in the feeding pressure also caused an increase in the flow field turbulence intensity in the circulating tank due to an increase in the impeller speed, as shown in Figure 10. The bubble size and feeding pressure were approximately linear, and the data were linearly fitted, as presented in Table 5. It can be seen from Table 5 that the absolute value of the slope of the curve, the intercept, and ΔD32 gradually decreased with the increasing frother concentration. When the concentration of the frother increased from 0.096 to 0.111 mmol/L, the slope changed by 1.98; when the concentration increased from 0.111 to 0.127 mmol/L, the slope changed by 0.18, indicating that the size of the bubbles is significantly affected by the feeding pressure at lower frother concentrations. However, when the concentration reached or exceeded the CCC, the rigidity of the bubble surfaces increased owing to an increase in the amount of frother adsorbed on the surface of the bubble; almost no merger occurred between the bubbles, and the size of the bubble was reduced owing to the influence of the feeding pressure.

4.4. Effect of Suction Capacity on Bubble Size

Figure 11 presents the D32 values as a function of suction capacity at P = 0.10 MPa and H = 0 cm. Within the studied range of the suction capacity, D32 increased for each frother concentration as the suction capacity increased, indicating that the bubble size can be effectively controlled by adjusting the suction capacity. The bubble size was relatively small for a suction capacity of 0.1 to 0.3 L/min at frother concentrations of 0.111 and 0.127 mmol/L; the bubble size at 0.111 mmol/L was larger than that at 0.127 mmol/L when the suction capacity was greater than 0.3 L/min. When the suction capacity increased from 0.1 to 0.9 L/min, the bubble size increased by 0.261 mm (0.096 mmol/L), 0.096 mm (0.111 mmol/L), and 0.047 mm (0.127 mmol/L) respectively; i.e., the difference in D32 between the two random concentration curves appeared to increase with increasing suction capacity. For a fixed energy input (feeding pressure P = 0.10 MPa), the energy allocated to the unit air was reduced as the amount of suction capacity increased; therefore, the ability of energy to disperse the unit air was diminished.

4.5. Effect of Sampling Location on Bubble Size

D32 as a function of sampling location at P = 0.10 MPa and q = 0.5 L/min is shown in Figure 12. D32 almost linearly increased with the height of the sampling location for each MIBC concentration; furthermore, the difference between two adjacent curves also increased. A higher concentration resulted in a smaller slope, which represents smaller variations in bubble size. During the ascending process of the bubble in the flotation cell, the hydrostatic pressure and concentration of frothers play an important role in the BSD; however, the hydrostatic pressure has little effect on the bubble size in the range of sampling height due to the difference in hydrostatic pressure between the top and the bottom of the slurry being very small, the study [34] had found that there was almost no variation on the bubble size during the rising process of single bubble at each concentration, however, the D32 of the bubble group increased with the increase of sampling height, and a higher frother concentration resulted in a smaller increases. Hence, here, the frother concentration played a major role in BSD compared to the height of the sampling location. A coalescence phenomenon between bubbles affected the bubble size when the frother concentration was lower than the critical coalescence concentration; therefore, the bubble size changed significantly. When the concentration reached the critical coalescence concentration, there was almost no coalescence between bubbles due to the increase of the frother concentration on the bubble surface; hence, the bubble size change was not obvious.
Table 6 represents the fitting function of different curves for different frother concentrations. The slopes for each concentration have the following order: 0.02060 (0.096 mmol/L) > 0.0087 (0.111 mmol/L) > 0.00476 (0.127 mmol/L); this implies that the slope of the fitting equation decreases as the concentration increases. The variation in bubble size, where the concentration was larger than 0.111 mmol/L, became less; almost no coalescence happened during the rising of the bubbles in the flotation cell. Hence, the slopes of the fitting equation given in Table 6 indirectly represent the probability of bubble coalescence, i.e., higher concentrations resulted in smaller slopes, indicating a smaller probability of coalescence among bubbles.

5. Conclusions

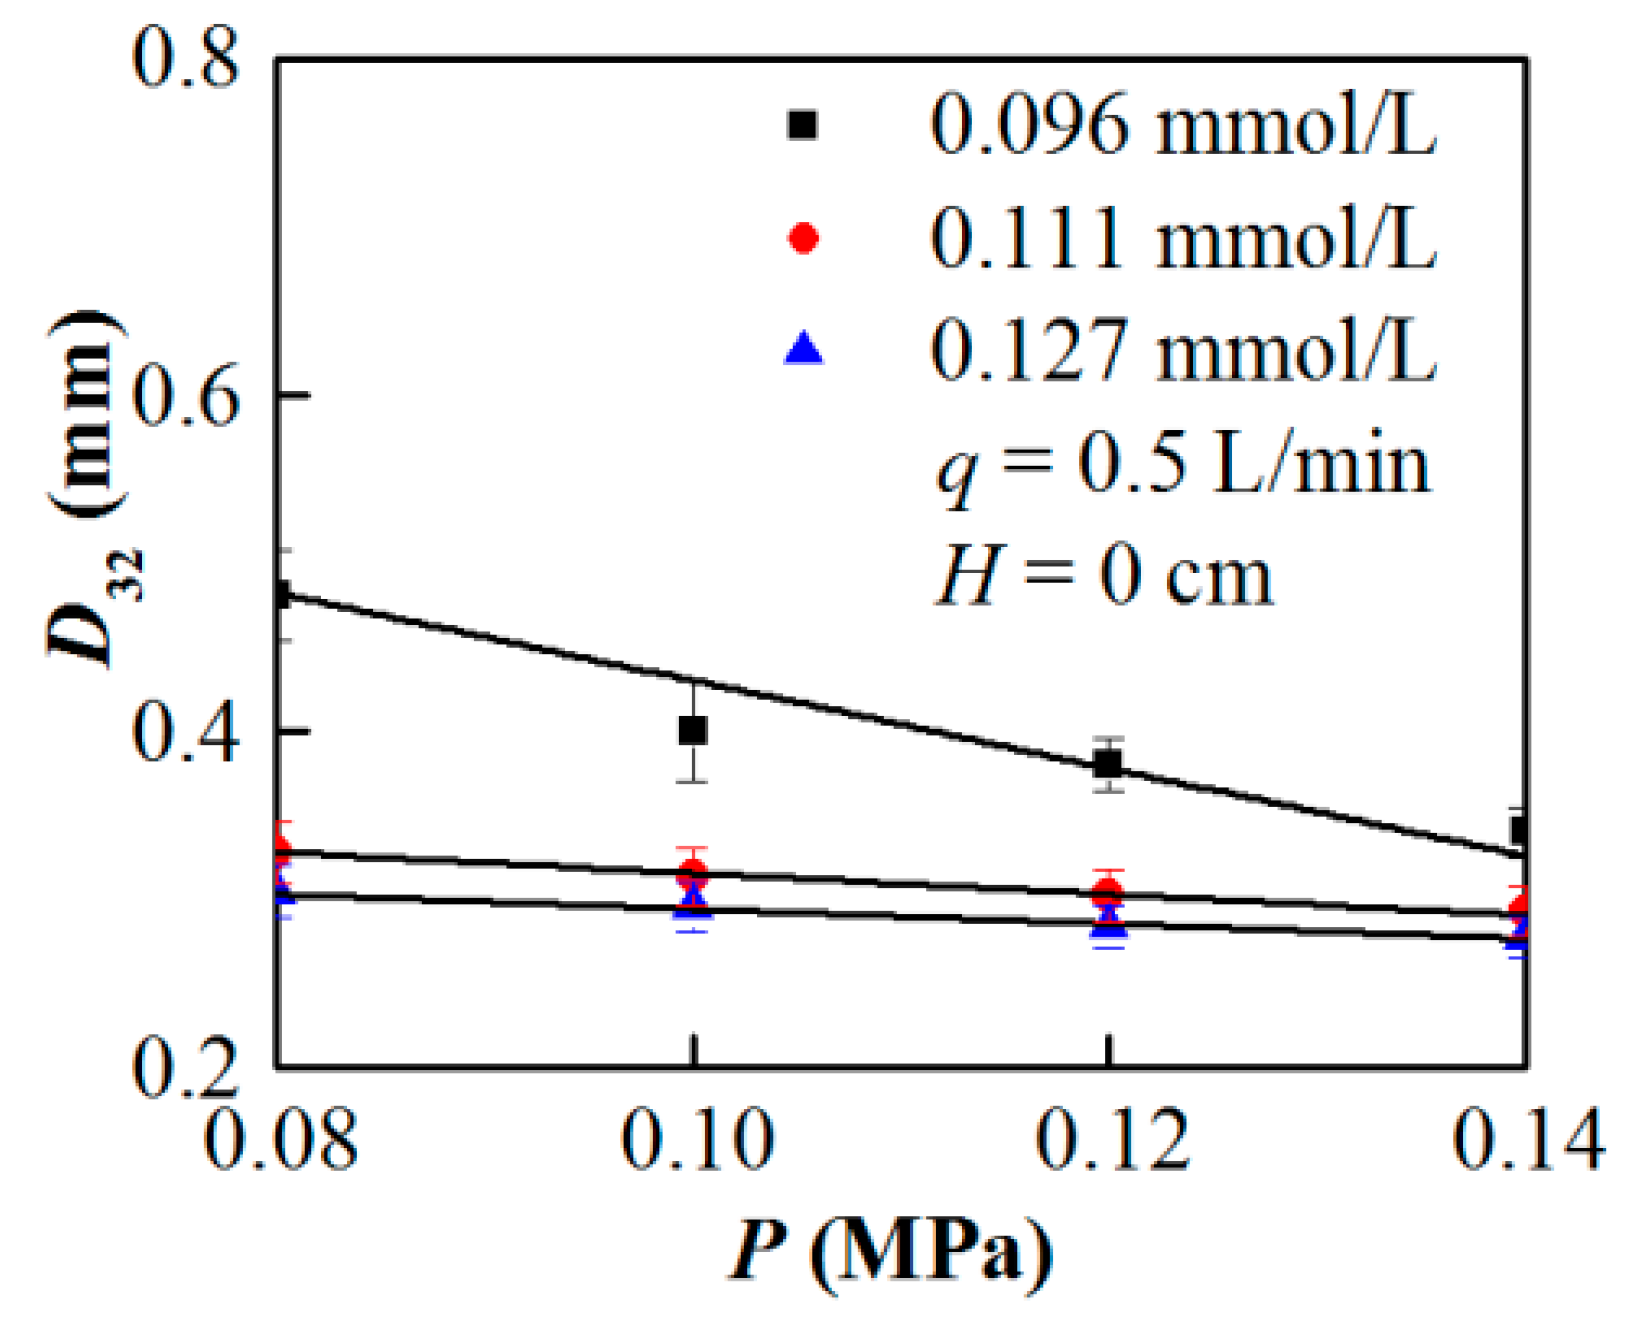
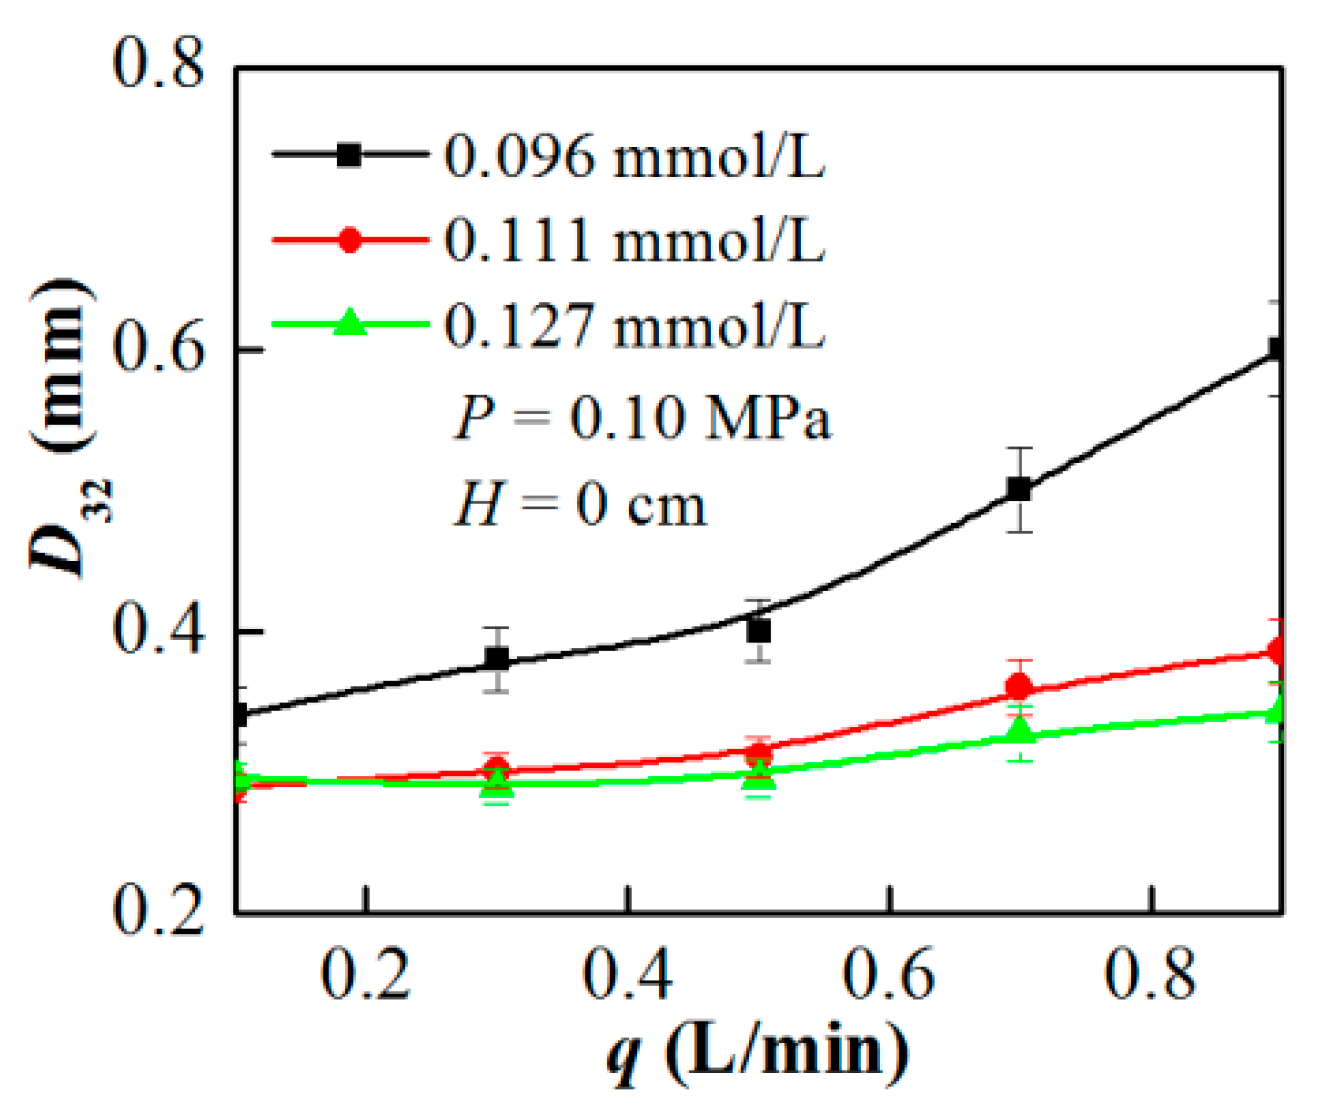
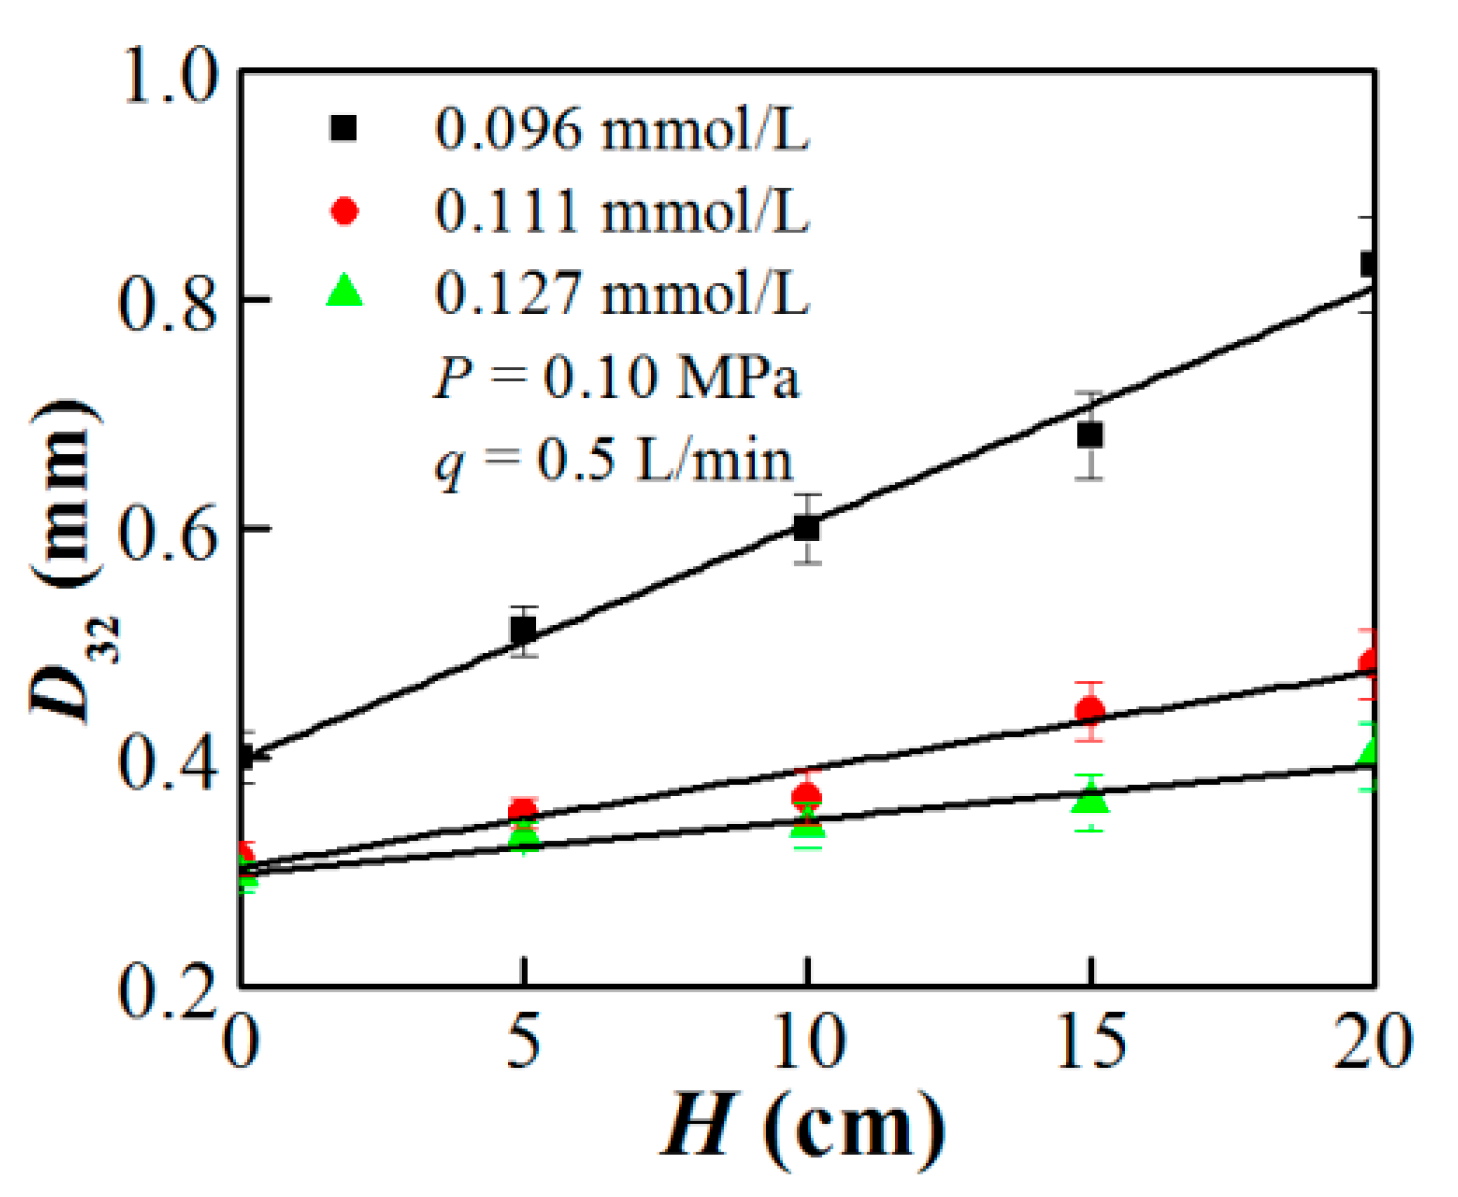
In this study, a new jet-stirring coupling flotation device was designed. It was found that due to the arrangement of double cosine self-aspirated nozzles in a non-submerged manner, a large amount of air was sucked into the flotation cell, which met the requirements of flotation in terms of the suction capacity. D32 decreased with an increasing MIBC concentration until the concentration reached the CCC, above which the bubble size stabilized at approximately 0.31 mm, which was smaller than the bubble size produced by the conventional flotation machine. Higher MIBC concentrations led to the formation of a large number of small-sized bubbles. Moreover, D32 decreased with the increasing feeding pressure; conversely, it increased with suction capacity and sampling location height, independent of the frother concentration. As stated above, bubbles suitable for froth flotation were generated by the jet-stirring coupling flotation device, verifying the efficacy of the overall structural design of the device.
In this study, all the bubble tests of the jet-stirring coupling flotation device were carried out in the presence of the frother. It is well known that the agent used in the froth flotation also includes a collector. However, the BSD tests were not studied under the interaction of the two agents. Therefore, the shape characteristic test of the bubble will be carried out under the action of the collector and frother in future work.

Author Contributions

Conceptualization, Y.H. and J.Z.; Formal analysis, Y.H., L.S. and W.Z.; Investigation, Y.H., J.Z., Y.L., X.Y., S.W. and Q.D.; Writing—original draft, Y.H.

Funding

This work was supported by the National Natural Science Foundation of China (grant number 51374015); the Graduate Innovation Foundation of Anhui University of Science and Technology (grant number 2017CX2040); the Natural Science Foundation of Anhui province (grant numbers 1708085QE128, 1808085QE120); and the Provincial University Natural Science Foundation of Anhui (grant number KJ2017A071).

Conflicts of Interest

The authors declare no conflicts of interest.

References

  1. Mesa, D.; Brito-Parada, P.R. Scale-up in froth flotation: A state-of-the-art review. Sep. Purif. Technol. 2019, 210, 950–962. [Google Scholar] [CrossRef]
  2. Xing, Y.; Xu, M.; Li, M.; Jin, W.; Cao, Y.; Gui, X. Role of DTAB and SDS in bubble-particle attachment: AFM force measurement, attachment behaviour visualization, and contact angle study. Minerals 2018, 8, 349. [Google Scholar] [CrossRef]
  3. Harris, C.C.; Khandrika, S.M. Flotation machine design: Impeller—Stator interaction. Powder Technol. 1985, 43, 273–278. [Google Scholar] [CrossRef]
  4. Jameson, G.J. New directions in flotation machine design. Miner. Eng. 2010, 23, 835–841. [Google Scholar] [CrossRef]
  5. Dey, S.; Paul, G.M.; Pani, S. Flotation behaviour of weathered coal in mechanical and column flotation cell. Powder Technol. 2013, 246, 689–694. [Google Scholar] [CrossRef]
  6. Li, S.; Lu, D.; Chen, X.; Zheng, X.; Li, X.; Chu, H.; Wang, Y. Industrial application of a modified pilot-scale Jameson cell for the flotation of spodumene ore in high altitude area. Powder Technol. 2017, 320, 358–361. [Google Scholar] [CrossRef]
  7. Şahbaz, O.; Uçar, A.; Öteyaka, B.; Taş, O.Ö.; Özdemir, O. Separation of colemanite from tailings using the pilot scale flotation column. Powder Technol. 2017, 309, 31–36. [Google Scholar] [CrossRef]
  8. Shen, Z.; Zhang, M.; Fan, X.; Shi, S.; Han, D. Hydrodynamic and flotation kinetic analysis of a large scale mechanical agitated flotation cell with the typical impeller and the arc impeller. Minerals 2019, 9, 79. [Google Scholar] [CrossRef]
  9. Zhang, W. Evaluation of effect of viscosity changes on bubble size in a mechanical flotation cell. Trans. Nonferrous Met. Soc. China 2014, 24, 2964–2968. [Google Scholar] [CrossRef]
  10. Sobhy, A.; Tao, D. Nanobubble column flotation of fine coal particles and associated fundamentals. Int. J. Miner. Process. 2013, 124, 109–116. [Google Scholar] [CrossRef]
  11. Lin, L.L.; Liu, J.; Wang, L.; Yu, H. Numerical simulation of a self-absorbing microbubble generator for a cyclonic-static microbubble flotation column. Min. Sci. Technol. 2010, 20, 88–92. [Google Scholar]
  12. Karagüzel, C.; Çobanoğlu, G. Stage-wise flotation for the removal of colored minerals from feldspathic slimes using laboratory scale Jameson cell. Sep. Purif. Technol. 2010, 74, 100–107. [Google Scholar] [CrossRef]
  13. Gordiychuk, A.; Svanera, M.; Benini, S.; Poesio, P. Size distribution and Sauter mean diameter of micro bubbles for a Venturi type bubble generator. Exp. Therm. Fluid Sci. 2016, 70, 51–60. [Google Scholar] [CrossRef]
  14. Uçurum, M. Influences of Jameson flotation operation variables on the kinetics and recovery of unburned carbon. Powder Technol. 2009, 191, 240–246. [Google Scholar] [CrossRef]
  15. Zhang, M.; Li, T.; Wang, G. A CFD study of the flow characteristics in a packed flotation column: Implications for flotation recovery improvement. Int. J. Miner. Process. 2017, 159, 60–68. [Google Scholar] [CrossRef]
  16. Yan, X.; Shi, R.; Xu, Y.; Wang, A.; Liu, Y.; Wang, L.; Cao, Y. Bubble behaviors in a lab-scale cyclonic-static micro-bubble flotation column. Asia-Pac. J. Chem. Eng. 2016, 11, 939–948. [Google Scholar] [CrossRef]
  17. Li, Y.; Pan, H.; Li, N.; Jiang, W.; Li, Y.; Zhang, W.; Peng, Z. Design and experimental study of a modified cyclonic microbubble flotation column system. Int. J. Coal Prep. Util. 2017, 37, 1–9. [Google Scholar] [CrossRef]
  18. Wang, C. The Structure Optimization and Bubble Production Mechanism Study of Annular Jet Suction Mixing Device; Anhui University of Science and Technology: Huainan, China, 2016. [Google Scholar]
  19. Xing, Y.; Gui, X.; Pan, L.; Pinchasik, B.-E.; Cao, Y.; Liu, J.; Kappl, M.; Butt, H.-J. Recent experimental advances for understanding bubble-particle attachment in flotation. Adv. Colloid Interface Sci. 2017, 246, 105–132. [Google Scholar] [CrossRef]
  20. Albijanic, B.; Ozdemir, O.; Hampton, M.A.; Nguyen, P.T.; Nguyen, A.V.; Bradshaw, D. Fundamental aspects of bubble–particle attachment mechanism in flotation separation. Miner. Eng. 2014, 65, 187–195. [Google Scholar] [CrossRef]
  21. Zangooi, A.; Gomez, C.O.; Finch, J.A. Mapping frother distribution in industrial flotation circuits. Miner. Eng. 2017, 113, 36–40. [Google Scholar] [CrossRef]
  22. Besagni, G.; Inzoli, F. Bubble size distributions and shapes in annular gap bubble column. Exp. Therm. Fluid Sci. 2016, 74, 27–48. [Google Scholar] [CrossRef] [Green Version]
  23. Alam, R.; Shang, J.Q.; Khan, A.H. Bubble size distribution in a laboratory-scale electroflotation study. Environ. Monit. Assess. 2017, 189, 193. [Google Scholar] [CrossRef] [PubMed]
  24. Finch, J.A.; Nesset, J.E.; Acuña, C. Role of frother on bubble production and behaviour in flotation. Miner. Eng. 2008, 21, 949–957. [Google Scholar] [CrossRef]
  25. Zhang, W.; Nesset, J.E.; Finch, J.A. Effect of some operational variables on bubble size in a pilot-scale mechanical flotation machine. J. Cent. South Univ. 2014, 21, 1077–1084. [Google Scholar] [CrossRef]
  26. Sovechles, J.M.; Lepage, M.R.; Johnson, B.; Waters, K.E. Effect of gas rate and impeller speed on bubble size in frother-electrolyte solutions. Miner. Eng. 2016, 99, 133–141. [Google Scholar] [CrossRef]
  27. Besagni, G.; Brazzale, P.; Fiocca, A.; Inzoli, F. Estimation of bubble size distributions and shapes in two-phase bubble column using image analysis and optical probes. Flow Meas. Instrum. 2016, 52, 190–207. [Google Scholar] [CrossRef]
  28. Szyszka, D. Critical Coalescence Concentration (CCC) for surfactants in aqueous solutions. Minerals 2018, 8, 431. [Google Scholar] [CrossRef]
  29. Grau, R.A.; Laskowski, J.S.; Heiskanen, K. Effect of frothers on bubble size. Int. J. Miner. Process. 2005, 76, 225–233. [Google Scholar] [CrossRef]
  30. Grau, R.A.; Heiskanen, K. Gas dispersion measurements in a flotation cell. Miner. Eng. 2003, 16, 1081–1089. [Google Scholar] [CrossRef]
  31. Gomez, C.O.; Finch, J.A. Gas dispersion measurements in flotation cells. Int. J. Miner. Process. 2007, 84, 51–58. [Google Scholar] [CrossRef]
  32. Acuña, C.A.; Finch, J.A. Tracking velocity of multiple bubbles in a swarm. Int. J. Miner. Process. 2010, 94, 147–158. [Google Scholar] [CrossRef]
  33. Prakash, R.; Majumder, S.K.; Singh, A. Particle-laden bubble size and its distribution in microstructured bubbling bed in the presence and absence of a surface active agent. Ind. Eng. Chem. Res. 2019, 58, 3499–3522. [Google Scholar] [CrossRef]
  34. Zhu, H.; Valdivieso, A.L.; Zhu, J.; Song, S.; Min, F.; Arroyo, M.A.C. A study of bubble size evolution in Jameson flotation cell. Chem. Eng. Res. Des. 2018, 137, 461–466. [Google Scholar] [CrossRef]
  35. Vinnett, L.; Contreras, F.; Yianatos, J. Gas dispersion pattern in mechanical flotation cells. Miner. Eng. 2012, 26, 80–85. [Google Scholar] [CrossRef]
  36. Laskowski, J.S.; Tlhone, T.; Williams, P.; Ding, K. Fundamental properties of the polyoxypropylene alkyl ether flotation frothers. Int. J. Miner. Process. 2003, 72, 289–299. [Google Scholar] [CrossRef]
  37. Quinn, J.J.; Sovechles, J.M.; Finch, J.A.; Waters, K.E. Critical coalescence concentration of inorganic salt solutions. Miner. Eng. 2014, 58, 1–6. [Google Scholar] [CrossRef]
  38. Corona-Arroyo, M.A.; López-Valdivieso, A.; Laskowski, J.S.; Encinas-Oropesa, A. Effect of frothers and dodecylamine on bubble size and gas holdup in a downflow column. Miner. Eng. 2015, 81, 109–115. [Google Scholar] [CrossRef]
  39. Tan, Y.H.; Rafiei, A.A.; Elmahdy, A.; Finch, J.A. Bubble size, gas holdup and bubble velocity profile of some alcohols and commercial frothers. Int. J. Miner. Process. 2013, 119, 1–5. [Google Scholar] [CrossRef]
  40. Azgomi, F.; Gomez, C.O.; Finch, J.A. Correspondence of gas holdup and bubble size in presence of different frothers. Int. J. Miner. Process. 2007, 83, 1–11. [Google Scholar] [CrossRef]
  41. Chu, P.; Waters, K.E.; Finch, J.A. Break-up in formation of small bubbles: Break-up in a confined volume. Colloids Surf. A Physicochem. Eng. Asp. 2016, 503, 88–93. [Google Scholar] [CrossRef]
Figure 1. Schematic of the jet-stirring coupling flotation device.
Minerals 09 00369 g001
Figure 2. Structural schematic of the double cosine self-aspirated nozzle.
Minerals 09 00369 g002
Figure 3. Schematic of the experimental system.
Minerals 09 00369 g003
Figure 4. Suction capacity (q) and negative pressure (p) as functions of feeding pressure (P) in double cosine self-aspirated nozzle.
Minerals 09 00369 g004
Figure 5. The velocity difference of liquid-air as a function of feeding pressure (P).
Minerals 09 00369 g005
Figure 6. Suction capacity (q) as a function of negative pressure (p).
Minerals 09 00369 g006
Figure 7. Effect of the frother concentration (C) on Sauter mean diameter (D32).
Minerals 09 00369 g007
Figure 8. Effect of MIBC molecular concentration adsorbed on the surface of bubbles during collision, coalescence, and bouncing away of bubbles.
Minerals 09 00369 g008
Figure 9. D32 as a function of feeding pressure (P).
Minerals 09 00369 g009
Figure 10. The rotating speed of the impeller (n) as a function of feeding pressure (P)
Minerals 09 00369 g010
Figure 11. D32 as a function of suction capacity (q).
Minerals 09 00369 g011
Figure 12. D32 as a function of sampling location (H).
Minerals 09 00369 g012
Table 1. Structural parameters of the double cosine self-aspirated nozzle.
Length of Outer Nozzle Cosine SectionDiameter of Outer Nozzle Circular Tube SectionDiameter of Outer Nozzle Cosine Section OutletLength of Ejector Pipe Cosine Section
La/mmDa/mmD/mmLb/mm
3548713
Diameter of Ejector Pipe Cosine Section OutletOutlet Distance between Ejector Pipe and Outer NozzleCone Angle of Ejector Pipe Cosine SectionCone Angle of Outer Nozzle Cosine Section
d/mmL/mmβd/mm
620286
Table 2. Structural parameters of the device.
Driving ImpellerStirring ImpellerCirculating TankDiameter of Draft Tube/mmDistance between Stirring Impeller and False Bottom/mmDiameter of Mixing Tank/mm
Length × Width/mmDiameter/mmLength × Width /mmDiameter/mmLength × Width × Height/mm
30 × 3515030 × 75150250 × 250 × 6007025160
Table 3. The velocity difference of liquid-air.
The Feeding PressureThe Volumetric Flow Rate of AirThe Volumetric Flow Rate of LiquidThe Air Flow VelocityThe Liquid Flow VelocityThe Velocity Difference of Liquid-Air
MPam3/hm3/hm/sm/sm/s
0.040.0120.7880.0447.7467.70
0.060.0140.8830.0508.6798.63
0.070.0200.9740.0709.5749.50
0.080.0321.0580.11510.39910.28
0.090.0351.1090.12310.90110.78
0.100.0551.1720.19511.52011.32
0.120.0601.2710.21212.49312.28
0.140.0841.3570.29713.33813.04
0.160.0931.4560.32914.31213.98
0.180.2001.5340.70815.07814.37
0.200.2851.6311.00816.03215.02
0.220.3401.6951.20316.66115.46
0.240.4001.7721.41517.41816.00
0.260.4601.8361.62818.04716.42
Table 4. Comparison of D32 in flotation machines at a critical coalescence concentration (CCC) of methyl isobutyl carbinol (MIBC).
Flotation MachineD32/mmReferences
Mechanical flotation cell0.80–0.90[26,28]
Jameson cell0.65–0.70[34,38]
Column flotation0.75–0.80[39,40]
Table 5. Information from bubble mean diameter–feeding pressure curve.
Frother Concentration/(mmol/L)Slope of FittingInterceptD32 aR2
0.096−2.600.6900.2130.9742
0.111−0.620.3780.0500.9861
0.127−0.440.3380.0330.9787
a It represents the difference value between the maximum and minimum bubble Sauter mean diameter within the studied range of feeding pressure.
Table 6. Fitting function of bubble Sauter mean diameter and sampling location.
Frother Concentration/(mmol/L)Fitting Equations
0.096D32 = 0.02060H + 0.39801
0.111D32 = 0.00857H + 0.30337
0.127D32 = 0.00476H + 0.29760

