Article

Nano-Scale Pore Structure and Fractal Dimension of Longmaxi Shale in the Upper Yangtze Region, South China: A Case Study of the Laifeng–Xianfeng Block Using HIM and N2 Adsorption

Key Laboratory of Computational Geodynamics, College of Earth and Planetary Sciences, University of Chinese Academy of Sciences, Beijing 100049, China
*
Author to whom correspondence should be addressed.
Minerals 2019, 9(6), 356; https://doi.org/10.3390/min9060356
Submission received: 30 April 2019 / Revised: 1 June 2019 / Accepted: 8 June 2019 / Published: 12 June 2019
(This article belongs to the Special Issue Nanomineralogy)

Abstract

:
This paper tries to determine the key evaluation parameters of shale reservoirs in the complex tectonic provinces outside the Sichuan Basin in South China, and also to target the sweet spots of shale reservoirs accurately. The pore-structure characteristics of the Lower Silurian Longmaxi shale gas reservoirs in Well LD1 of the Laifeng–Xianfeng Block, Upper Yangtze region, were evaluated. N2 adsorption and helium ion microscope (HIM) were used to investigate the pore features including pore volume, pore surface area, and pore size distribution. The calculated results show good hydrocarbon storage capacity and development potential of the shale samples. Meanwhile, the reservoir space and migration pathways may be affected by the small pore size. As the main carrier of pores in shale, organic matter contributes significantly to the pore volume and surface area. Samples with higher total organic carbon (TOC) content generally have higher porosity. Based on the Frenkel–Halsey–Hill equation (FHH model), two different fractal dimensions, D1 and D2, were observed through the N2 adsorption experiment. By analyzing the data, we found that large pores usually have large values of fractal dimension, owing to their complex pore structure and rough surface. In addition, there exists a good positive correlation between fractal dimension and pore volume as well as pore surface area. The fractal dimension can be taken as a visual indicator that represents the degree of development of the pore structure in shale.

1. Introduction

According to the trends of the global petroleum industry, hydrocarbon exploration is mainly focused on marine deep water, onshore deep layer, and unconventional oil and gas [1]. Natural gas is well known as the cleanest fossil fuel by global countries, compared with oil and coal. To reduce exploration risk and determine economic feasibility, considerable efforts have been undertaken to improve the knowledge of gas storage and transport mechanisms.
Shale was previously thought to be either impossible or uneconomic in regard to having industrial capacity. However, the combination of horizontal drilling and hydraulic fracturing can extract huge quantities of natural gas from impermeable shale formations, which has made it one of the landmark achievements in the 21st century [2]. A shale gas reservoir is characterized as a self-contained source reservoir system. Abundant gas can be stored as free gas in intergranular porosities and natural fractures, as adsorbed gas in organic matter and clay particle surfaces, or dissolved in kerogen and bitumen [3,4]. Thus, a series of studies have been published over the past decade about the pore-structure characteristics of shale, including its shape, size, porosity, and connectivity [5,6,7,8,9,10].
From the Precambrian to Tertiary periods, organic-rich shale deposited in marine, transitional marine, or lacustrine settings, and is widely distributed in China [11]. Related researches have expounded the depositional environment, geochemical and reservoir characteristics, gas concentration, and prospective resource potential of the three different types of shale in China [12,13,14,15,16]. The Upper Yangtze Platform, where the Sichuan Basin is located, is one of the largest conventional natural gas provinces of China. Beyond that, the reported unconventional reserves, mainly in the lower Silurian and lower Cambrian shale formations, are significantly higher than the total reserves of conventional petroleum [17]. Among them, the Wufeng–Longmaxi formation, especially the bottom of the Longmaxi formation, is the leading target of shale gas development in the Sichuan Basin, with a large amount of natural gas produced from this over-mature marine shale [18,19,20,21]. Many scholars have been making studies on the Longmaxi formation in the Sichuan Basin, focusing on its south and east parts, i.e., southeastern Sichuan province and southeastern Chongqing province. However, there are few researches about Longmaxi shale in the western Hubei Province [22], which is outside the eastern margin of the Sichuan Basin, though a series of shale gas exploration wells were drilled in recent years. The study of this region can provide experience and guidance for the exploration and exploitation of complex tectonic deformation areas of marine shale in south China.
Many high-resolution techniques have been applied to study the pore structures in shale with low porosity and low permeability, large parts of which are nanoscale pores (pore diameter of less than 100 nm). Based on previous studies, all of the following methods have achieved good results: Scanning electron microscope (SEM), Nano-CT, helium ion microscope (HIM), mercury intrusion, gas adsorption, nuclear magnetic resonance (NMR), and small-angle and ultra-small-angle neutron scattering (SANS and USANS) [8,23,24,25,26,27,28,29]. In particular, SEM and N2 adsorption are the most frequently used techniques, and both meet the demands of direct observation and quantitative analysis [30]. However, in this study, we choose HIM and N2 adsorption to characterize the pore structures from several nanometers to a few microns. HIM has better capacity for identifying small pores with higher magnification and depth of field. This is not just for the sake of full-scale characterization, but also for mutual authentication of the results by using the two methods. Moreover, to get more quantitative features and to characterize the pore geometry more intuitively, fractal theory was applied in the data processing of this paper.
Fractal theory, which is used to describe the geometric and structural properties of a solid surface [31], is an important tool for evaluating surface roughness. The fractal behavior is associated with power law behavior for a number of features, as a function of the feature size on the pore–rock interface [32]. It has already been used to investigate either the permeability or surface appearance of coal and shale samples [33,34]. The fractal characteristics of shale and coal collected from China have been calculated and analyzed through some experiments like mercury porosimetry, N2 gas adsorption, NMR, small-angle X-ray scattering (SAXS), and SEM digital images [35,36,37,38,39,40].

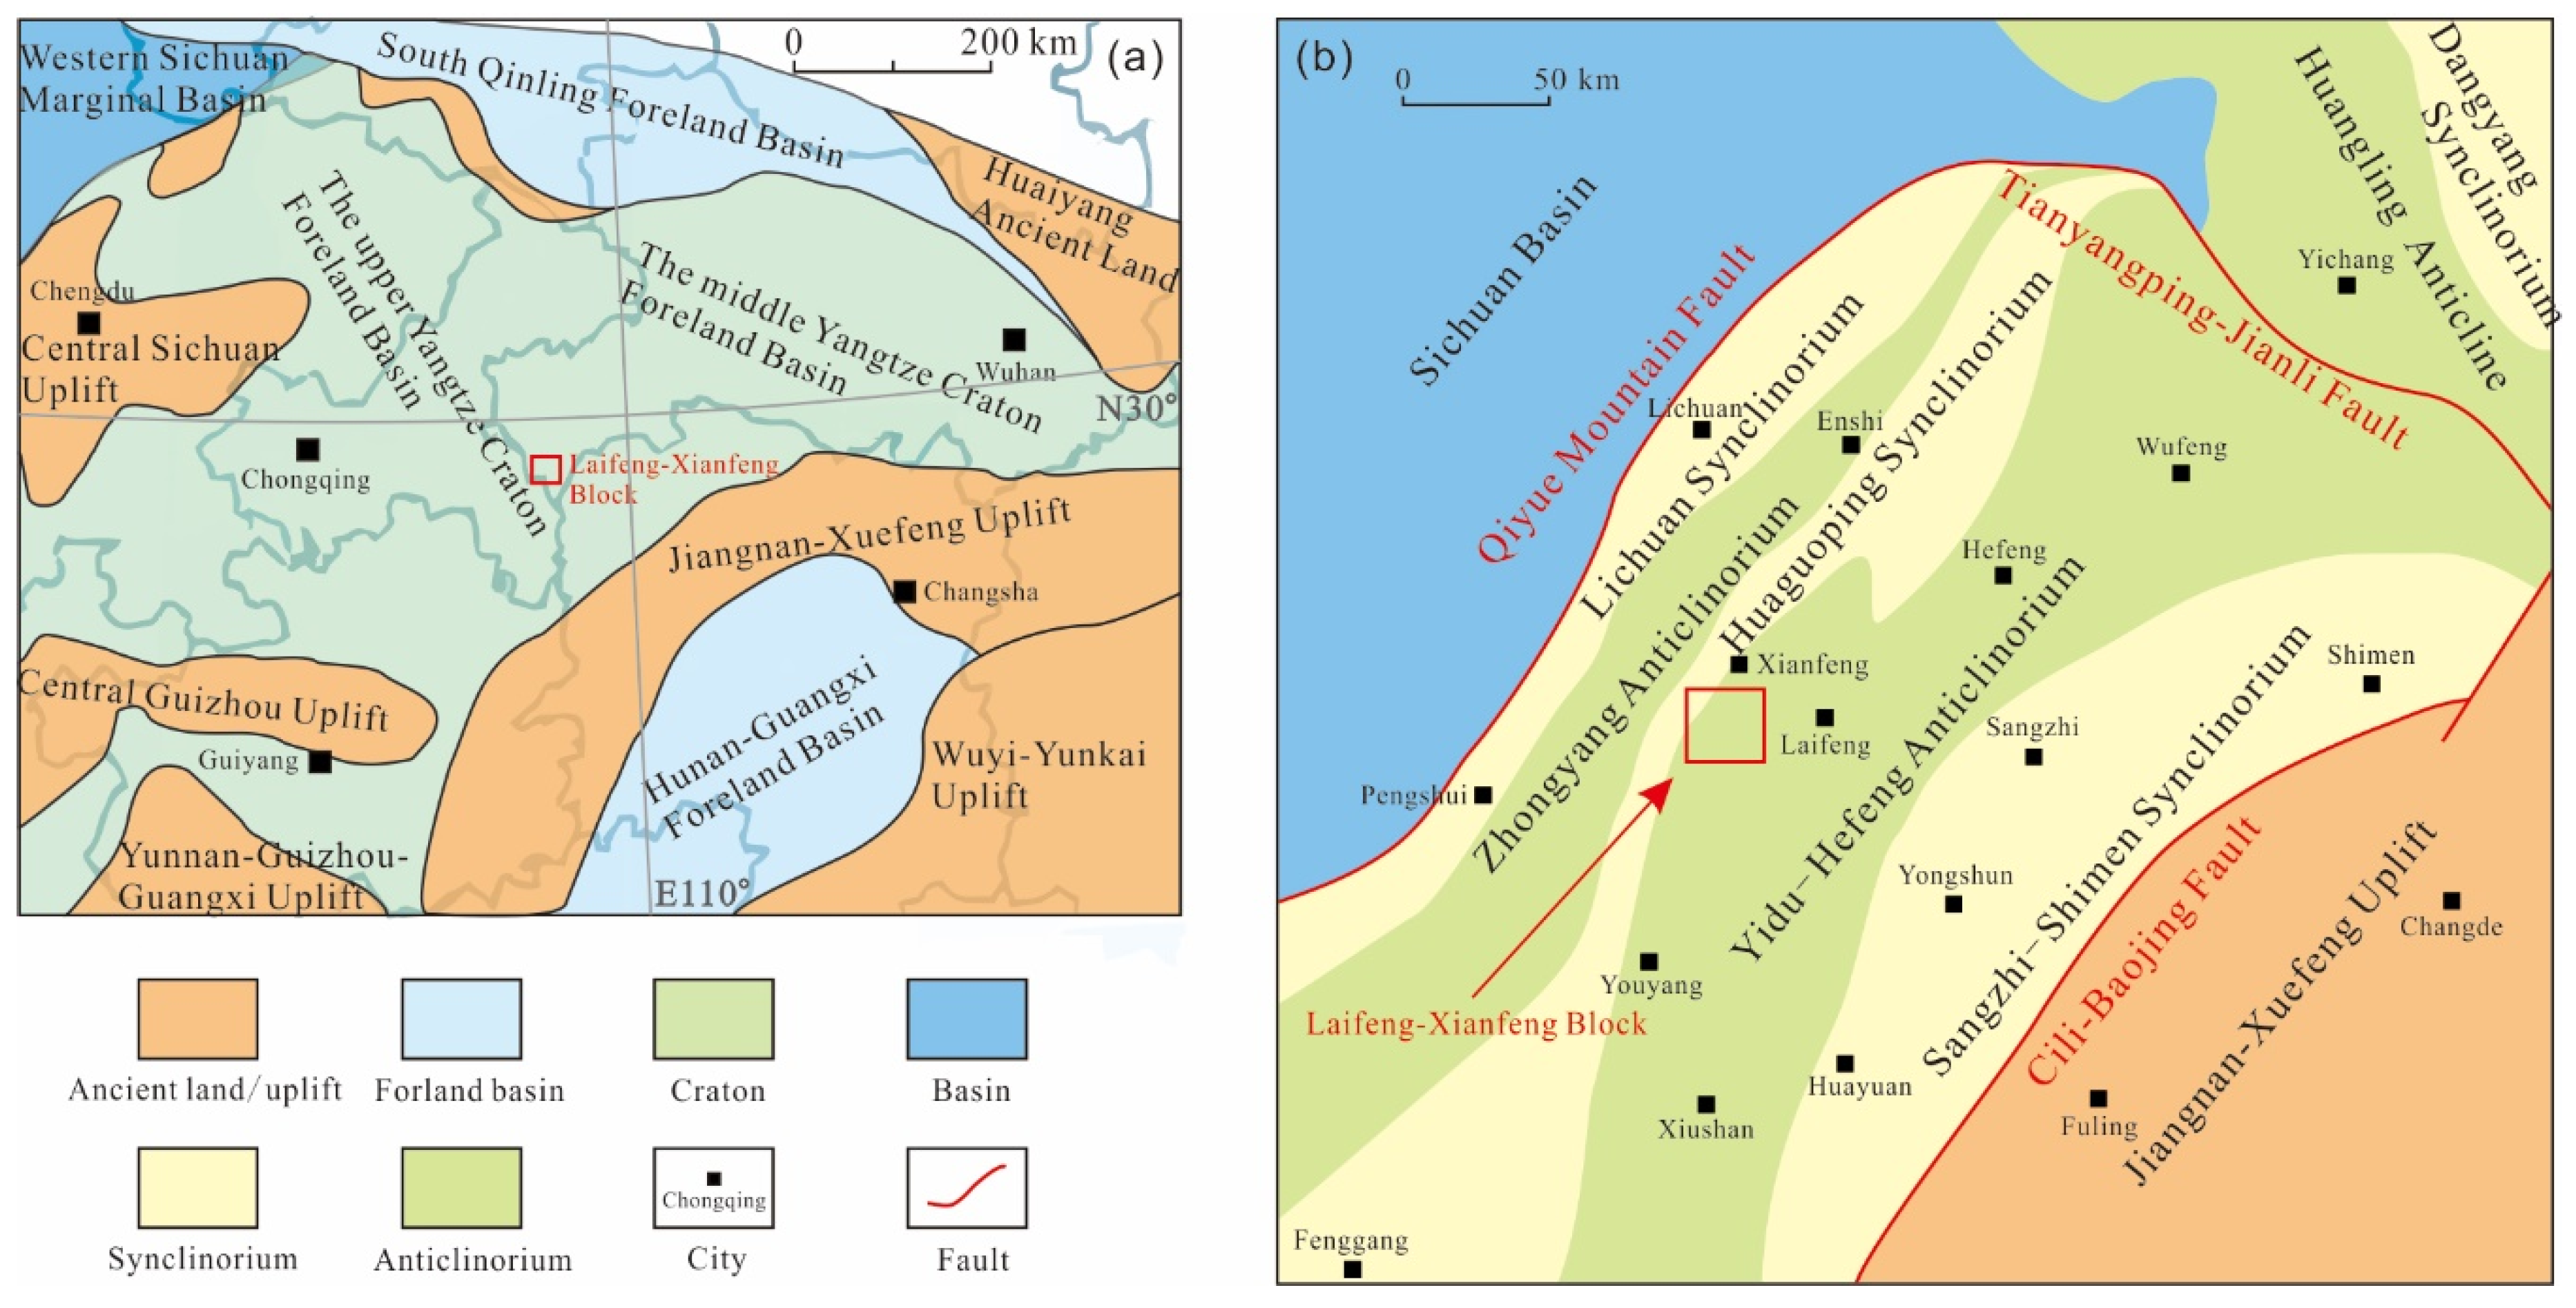
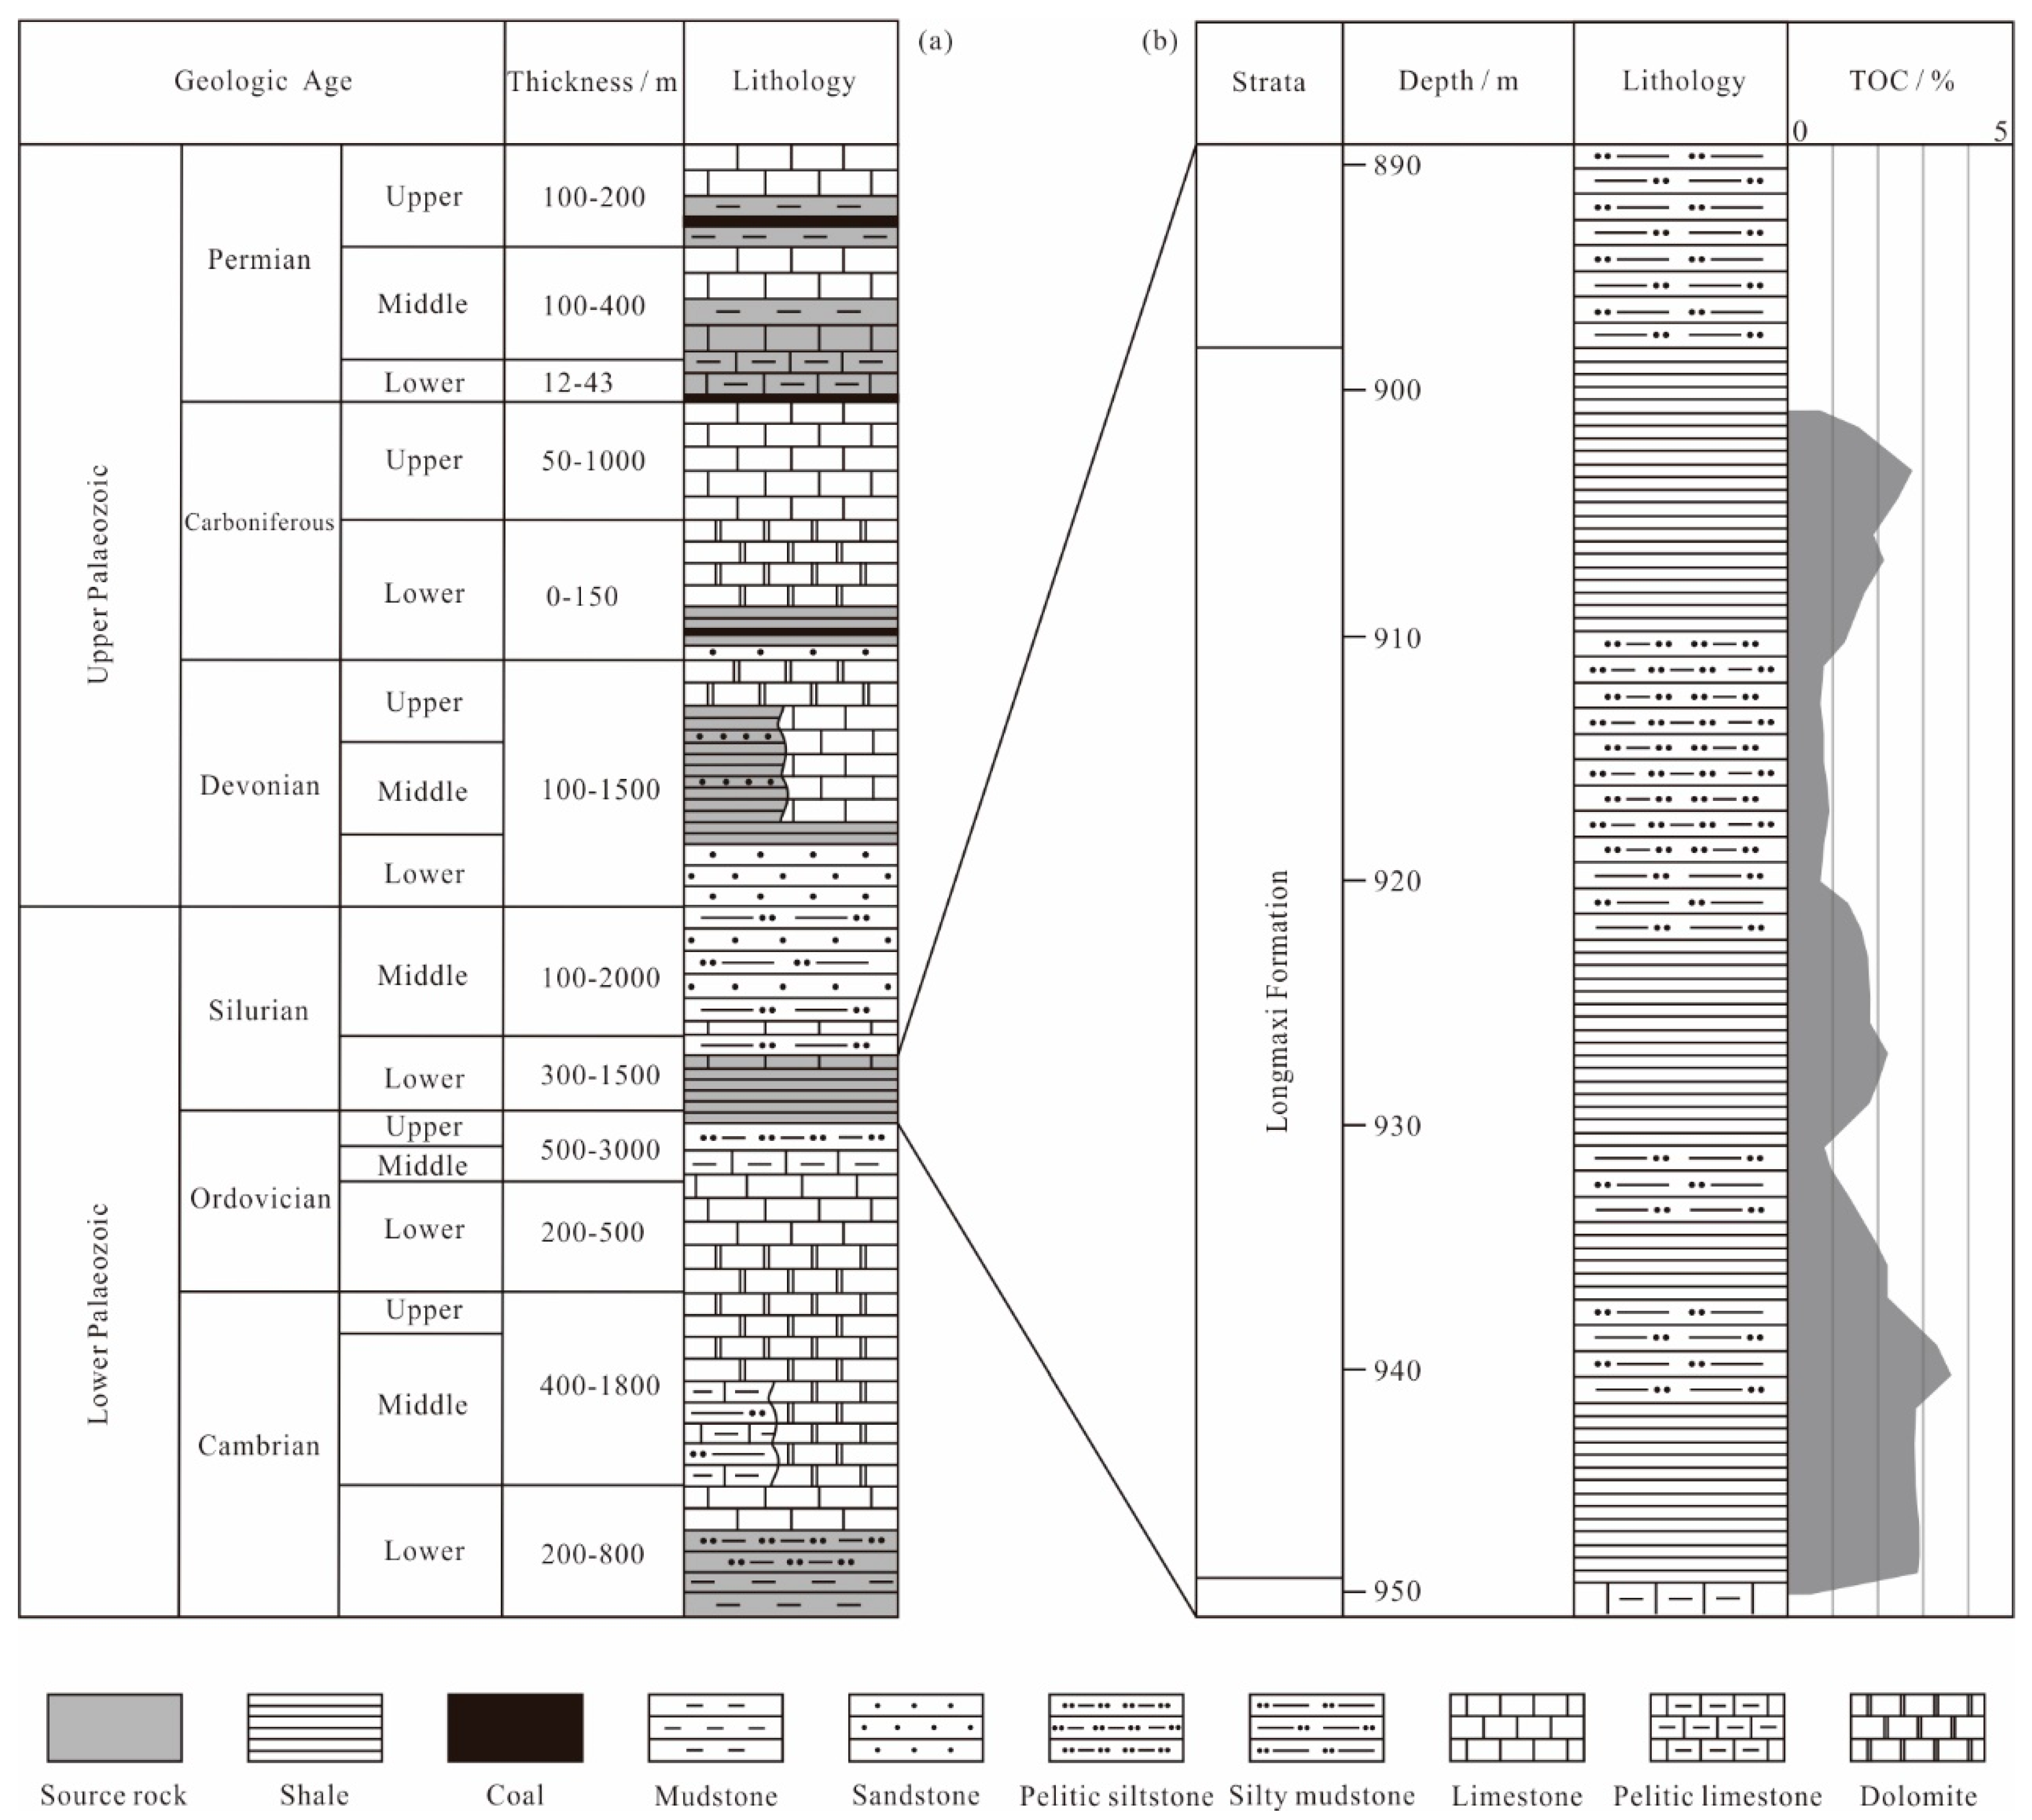
2. Geological Setting

Shale gas resources in China are mainly distributed in the southern Paleozoic marine shale, with significant geologic challenges such as strong structural deformation, high tectonic stress, big burial depth, slow drilling speed in hard formations, and complex surface conditions [41,42,43]. Located in the northwest side of the Yangtze platform, the Sichuan Basin is a typical superimposed basin with multiple periods of geologic structures [44]. Both conventional gas and unconventional gas with huge resource potential have been found within the Sichuan Basin. Most of the hydrocarbon-source rocks are from the Lower Palaeozoic system or of even older strata [44,45]. In recent years, many research results about the macro- and micro-structures of shale have emerged, aiming at the Ordovician Wufeng Formation–Lower Silurian Longmaxi Formation, and the Lower Cambrian Qiongzhusi Formation and Niutitang Formation in the Weiyuan and Fuling shale gas fields [17,45,46,47,48].
Our research area, the Laifeng–Xianfeng Block, is located at the thick fault–fold zone in western Hubei Province, in the Upper Yangtze region (Figure 1). This fault–fold zone borders the Sichuan Basin to the west, Qinling–Dabie Orogen to the north, and the Jiangnan–Xuefeng thrust uplift belt to the east. During the period of Late Ordovician–Early Silurian, this area was a clastic continental shelf sedimentary environment, showing a trend where water gradually became shallower and the depositional thickness got thinner, from the west to the east. After that, mainly because of the Yanshan movement, the fold and fault structure formed along the northeast–southwest direction [49,50].
The Laifeng–Xianfeng Block is the key area of shale gas exploration in the Middle and Upper Yangtze region, classified as the deformation zone outside basin [52]. It mainly shows the tectonic framework of wide-spaced anticlines, due to the influence of later tectonic movement [42,49,53]. The main exploration target strata of this area are the Upper Ordovician Wufeng Formation and the Lower Silurian Longmaxi Formation. Several shale gas production areas with economic value in China are mainly located around the Sichuan Basin. In addition, a large number of high-quality shale gas reservoirs have been discovered in southeast Chongqing province in recent years, just next to our research area. Though not far to the east, the Laifeng–Xianfeng Block has entirely different geological features from the Fuling shale gas field, the most successful commercial gas production area in China. The Longmaxi Formation, which belongs to the marginal area of deep-sea shelf facies of Silurian and with current burial depth of less than 2500 m, was taken as the research object of this paper.
Well LD1 is located in Enshi, in southwestern Hubei province (Figure 1). The drilling stratum of the Longmaxi Formation is 51 m thick, with abundant graptolite fossil and considerable desorption capacity. Horizontal bedding in low-energy environments and thin-plate pyrite in anoxic reductive sedimentary environments are widely developed in this formation. From top to bottom, the Longmaxi Formation can be roughly divided into three sections according to the lithology (Figure 2): Gray-black clay shale, dark gray massive pelitic siltstone, and gray-black carbonaceous clay shale interbedded with black carbonaceous siliceous shale.

3. Samples and Methods

In this study, a total of five core samples were collected from Well LD1. The basic information and mineral composition characteristics of these samples are listed in Table 1. The sets of samples were taken at intervals, with the depth ranging from 904 to 944 m. Each of them was cut into several parts for analyzing the mineral composition, organic matter features, and pore structures.

3.1. Mineral and Organic Composition

All the samples were tested for mineral composition by X-ray diffraction analyses using a Rigaku Smartlab Multifunction X-ray Diffractometer (Rigaku, University of Chinese Academy of Sciences, Beijing). Crushed samples (180–250 μm) were mixed with ethanol, hand ground in a mortar and pestle, and then smear mounted on glass slides for X-ray diffraction analyses. A semi-quantitative estimation of the mineral contents of samples was determined using Reitveld analyses [55], which fits a polynomial curve to the diffractograms [6].
The organic geochemical characteristics were determined by a Rock-Eval II apparatus with a total organic carbon (TOC) module. The value of TOC is calculated from the amount of CO2 evolved during hydrocarbon generation and during oxidation at 650 °C.

3.2. Helium Ion Microscope (HIM)

To obtain more subtle features, and to verify the results of N2 adsorption, two of these samples were tested by a helium ion microscope. This kind of instrument is a good addition to a scanning electron microscope, with its excellent resolution for imaging nanoscale pores [25]. Same as the preparation process for scanning electron microscope (SEM), the small block sample was polished to create a level surface using dry emery paper combined with argon ions. However, it is not necessary to spray carbon or metal on the surface to enhance electrical conductivity. This is to exclude the impact of carbon or metal particles on the observation of pores, since some of the pores are as small as a few nanometers wide and are easily covered by nanoparticles. HIM has higher resolution than SEM, which can make nanopores in shales more clearly observed. However, without the sprayed carbon or metal coating, the samples have extremely poor conductivity. As a result, the gray value in the image generally represents the electrical conductivity of the material. Namely, the bright area means organic matter, pyrite, and most clay minerals, while the dark area in the image usually represents quartz, feldspar, and calcite, which are different from SEM images. The shale samples were analyzed using an Orion NanoFab FIB-HIM produced by Carl Zeiss (Institute of Geology and Geophysics, Beijing). The instrument was operated at an acceleration voltage of 35 kV, a beam current set at 0.4–0.55 pA, and a scan dwell time of 1 μs.

3.3. Ultra-Low N2 Adsorption

We conducted ultra-low N2 adsorption analyses to measure the pore diameters between 0.3 and 200 nm [9]. Before the experiments, crushed samples (180–250 μm) needed to be oven dried and degassed at 110 °C for 24 h. A Quantachrome Autosorb iQ instrument (Quantachrome Ins, Changzhou University, Changzhou) was used to obtain the N2 adsorption/desorption curves at 77.35 K. On the basis of the classification of the International Union of Pure and Applied Chemistry (IUPAC), the pores were split into three categories according to the diameter: Micropores (<2 nm), mesopores (between 2 and 50 nm), and macropores (>50 nm). The adsorption data at ultra-low pressure can provide abundant information about pore characteristics within the range of micropores (<2 nm). Previous studies have proposed combining CO2 adsorption and N2 adsorption experiments to characterize the pore structure on a wide range of pore diameters. CO2 adsorption can be used to investigate micropore volume, and N2 adsorption can be used to investigate pore volume from mesopores to macropores [8,56]. In this study, for a lower detection line, a molecular pump coupled with a diaphragm roughing pump was used for outgassing to make sure that the vacuum degree can reach <1 × 10⁻⁷ Pa [57]. Thus, based on the Barrett–Joyner–Halenda (BJH) and Brunauer–Emmett–Teller (BET) methods, pore volume and pore surface area within a wide range of sizes (from micropores to macropores) were calculated through analysis of N2 adsorption data.

4. Results and Analysis

4.1. Mineral Constituents and TOC Content

The mineral constituents, TOC content, and depth of all the five samples collected from Well LD1 are shown in Table 1. The results suggest that all the shales samples have similar mineral composition that take quartz and clay as the basis. Among them, quartz, K-feldspar, and anorthose, usually classified as the siliceous part, account for about 60%. Although there exist some differences between the samples regarding the percentage of clay minerals (from 17.3% to 38.1%), these still have the second highest content of all the minerals. The TOC contents, calculated by rock pyrolysis, vary from 0.8% to 2.37%, with a mean value of 1.70%. Considering the exploration and development horizon of shale gas, the value means that there is certain potential. Seeing that organic matter is less dense than the whole rock and the aforesaid TOC content is expressed as a mass fraction, the volume percent of organic matter will be larger. The value of Ro is generally greater than 2.0% [49], which indicates that the organic matter of the shale is in the stage of high- to over-maturity. This corresponds to the late diagenetic epoch of Longmaxi shale, which means that most interparticle pores may be pressed or filled to be smaller or even disappear in the long-term subsidence and reservoir diagenesis process.

4.2. Nano-Scale Pore Structure by N2 Adsorption Isotherms

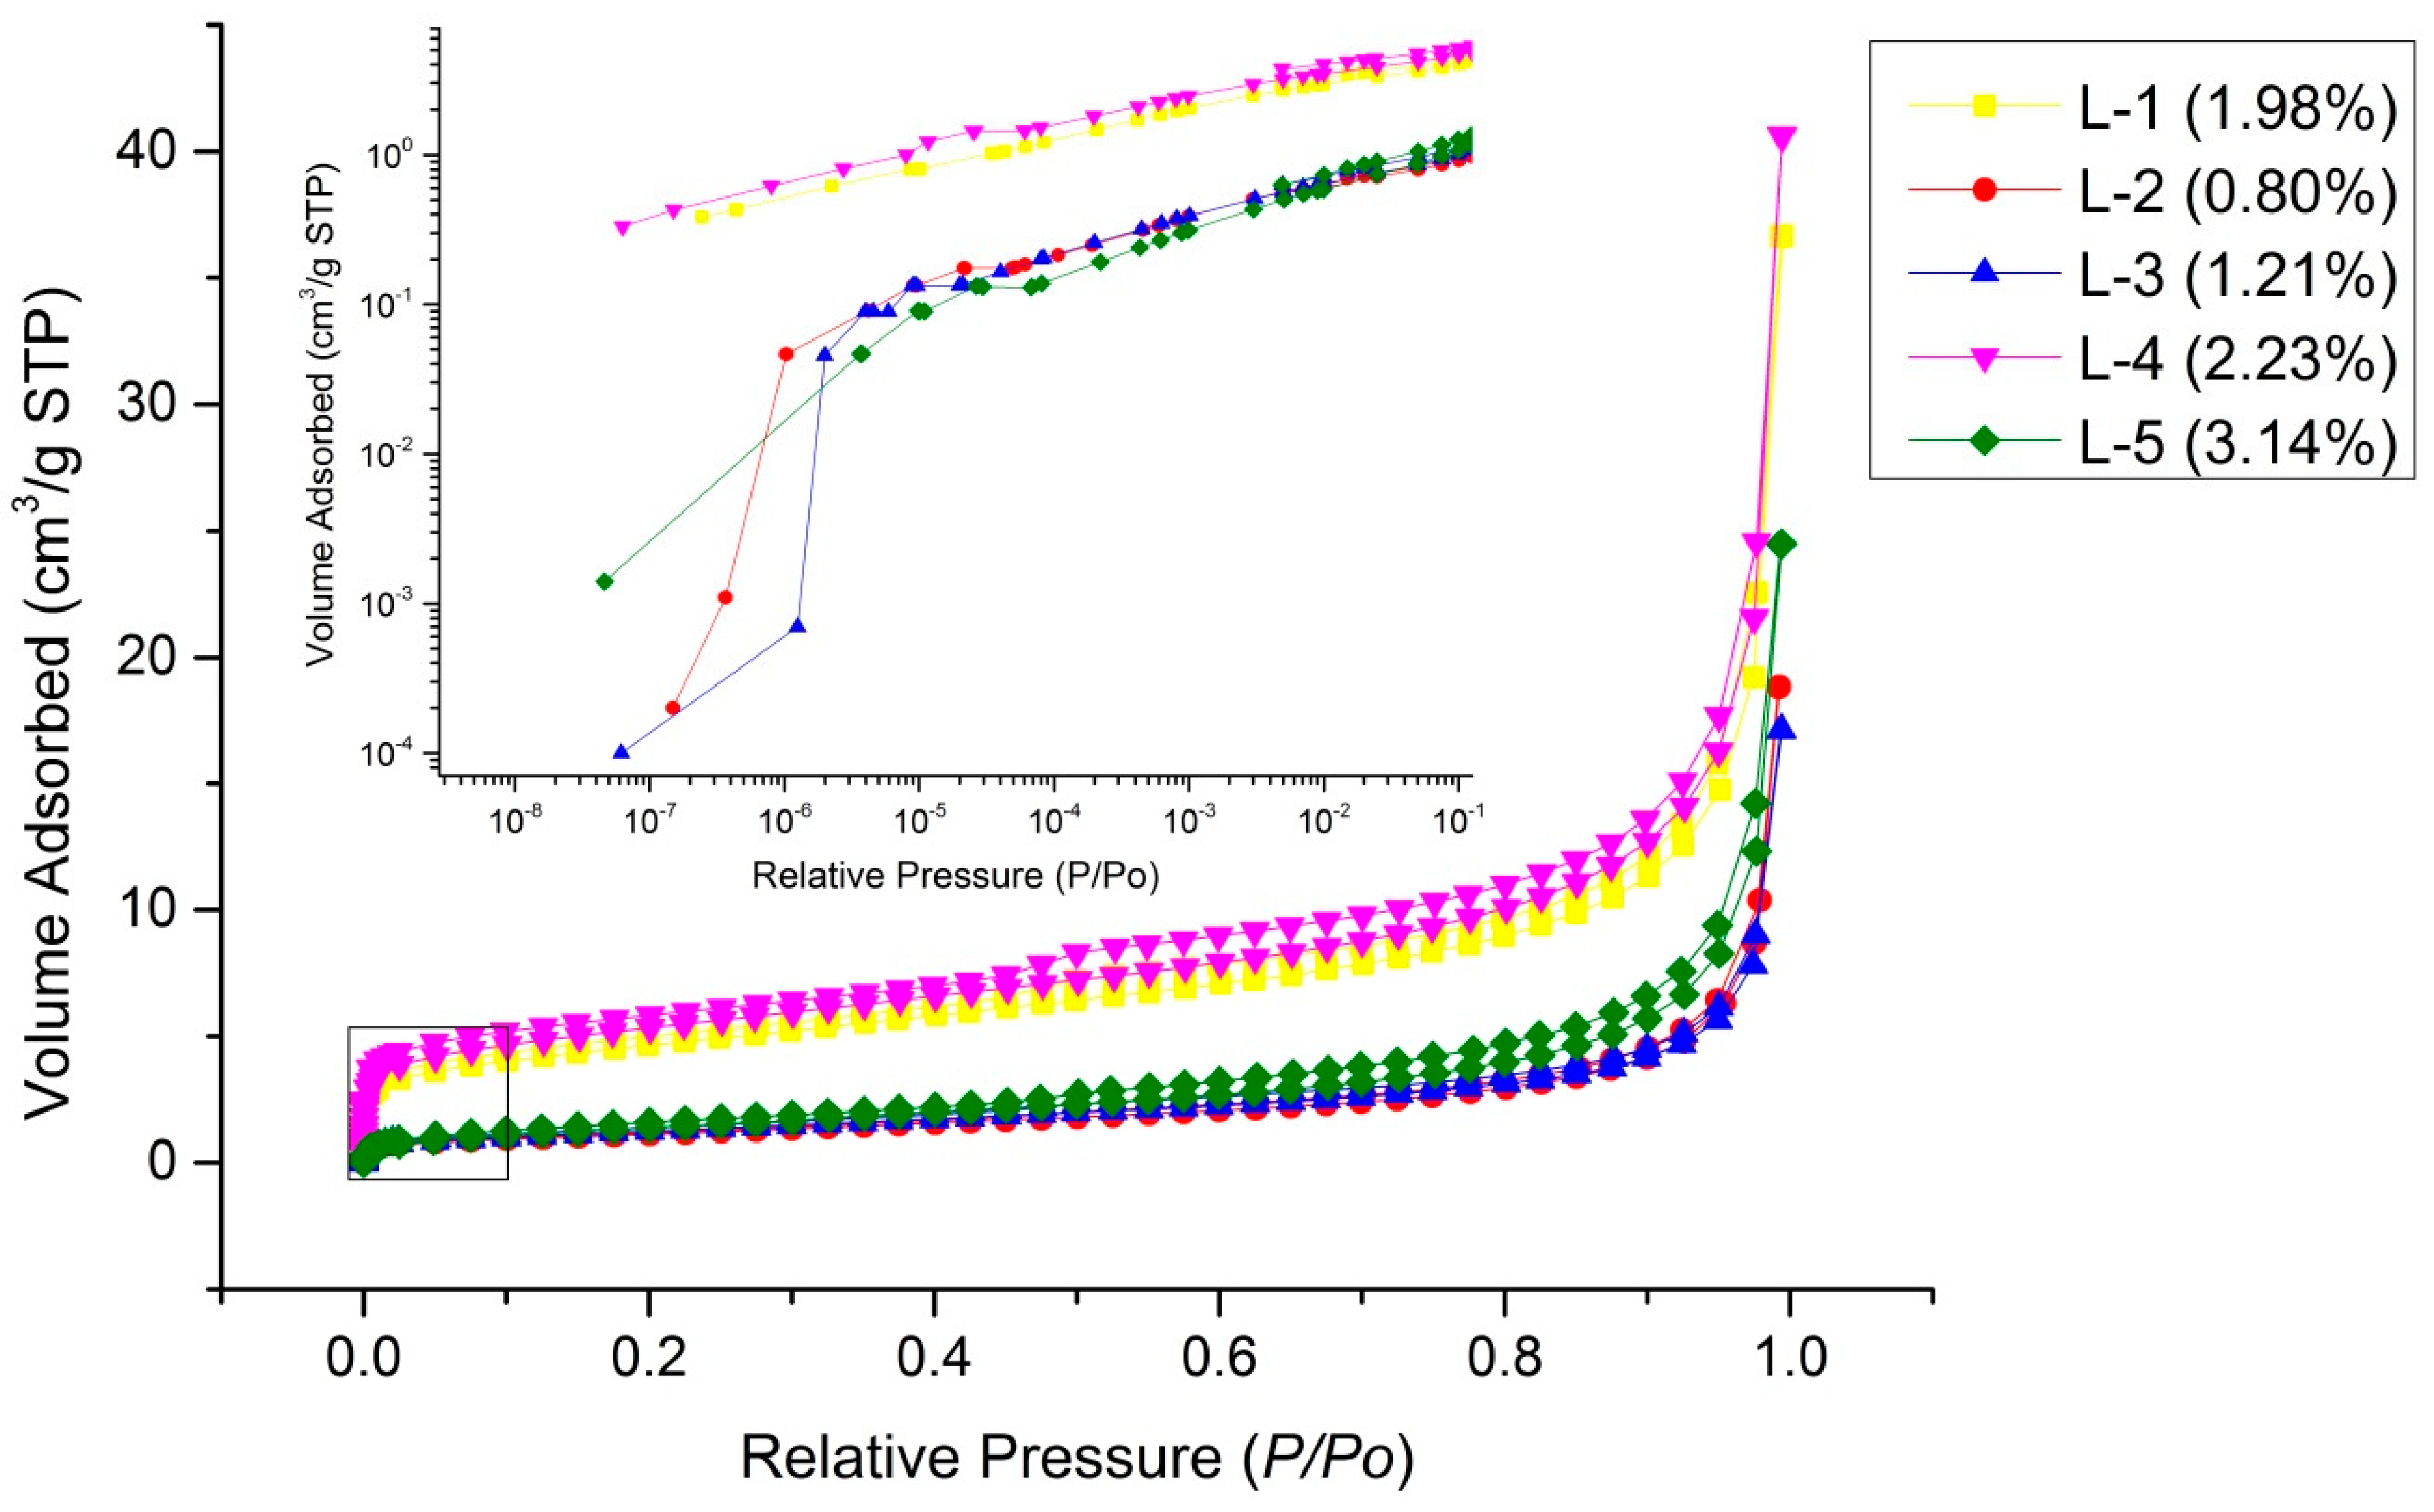
4.2.1. N2 Adsorption/Desorption Curves

Previous researches usually measured the N2 adsorption isotherms for the relative pressure (P/Po), starting from 0.01 [34,35]. Wang and Ju [57] classified this as conventional low-pressure N2 physisorption, and the relative pressure range of 10−7–10−2 was named “ultra-low pressure”. In this study, we used the same experimental procedure as [57]. It can be seen from the local enlarged view of the adsorption curves that the initial relative pressure can achieve the order of 10−7 (Figure 3). Although the part of relative pressure that is less than 10−2 is very narrow in the ordinary coordinate, in fact, the data points are very dense. They account for about one third of the total adsorption data.
All the shale samples have similar adsorption/desorption curves through data analysis (Figure 3). They are more likely to adjust to the isotherms of type H3 and type H4, according to the IUPAC classification, which means that the pores filled with N2 are slit-shaped or ink-bottle-like. In addition, the volume adsorptions of N2 show a clear gap between the five samples. They show no correlation with depth, but correlate with TOC content of the layer. Samples with higher TOC contents (L-1 = 2.14%, L-4 = 2.37%) have larger adsorption capacity. Meanwhile, L-2, L-3, and L-5, with lower TOC contents of 0.8%, 1.21%, and 1.98%, respectively, have relatively small adsorption capacities.

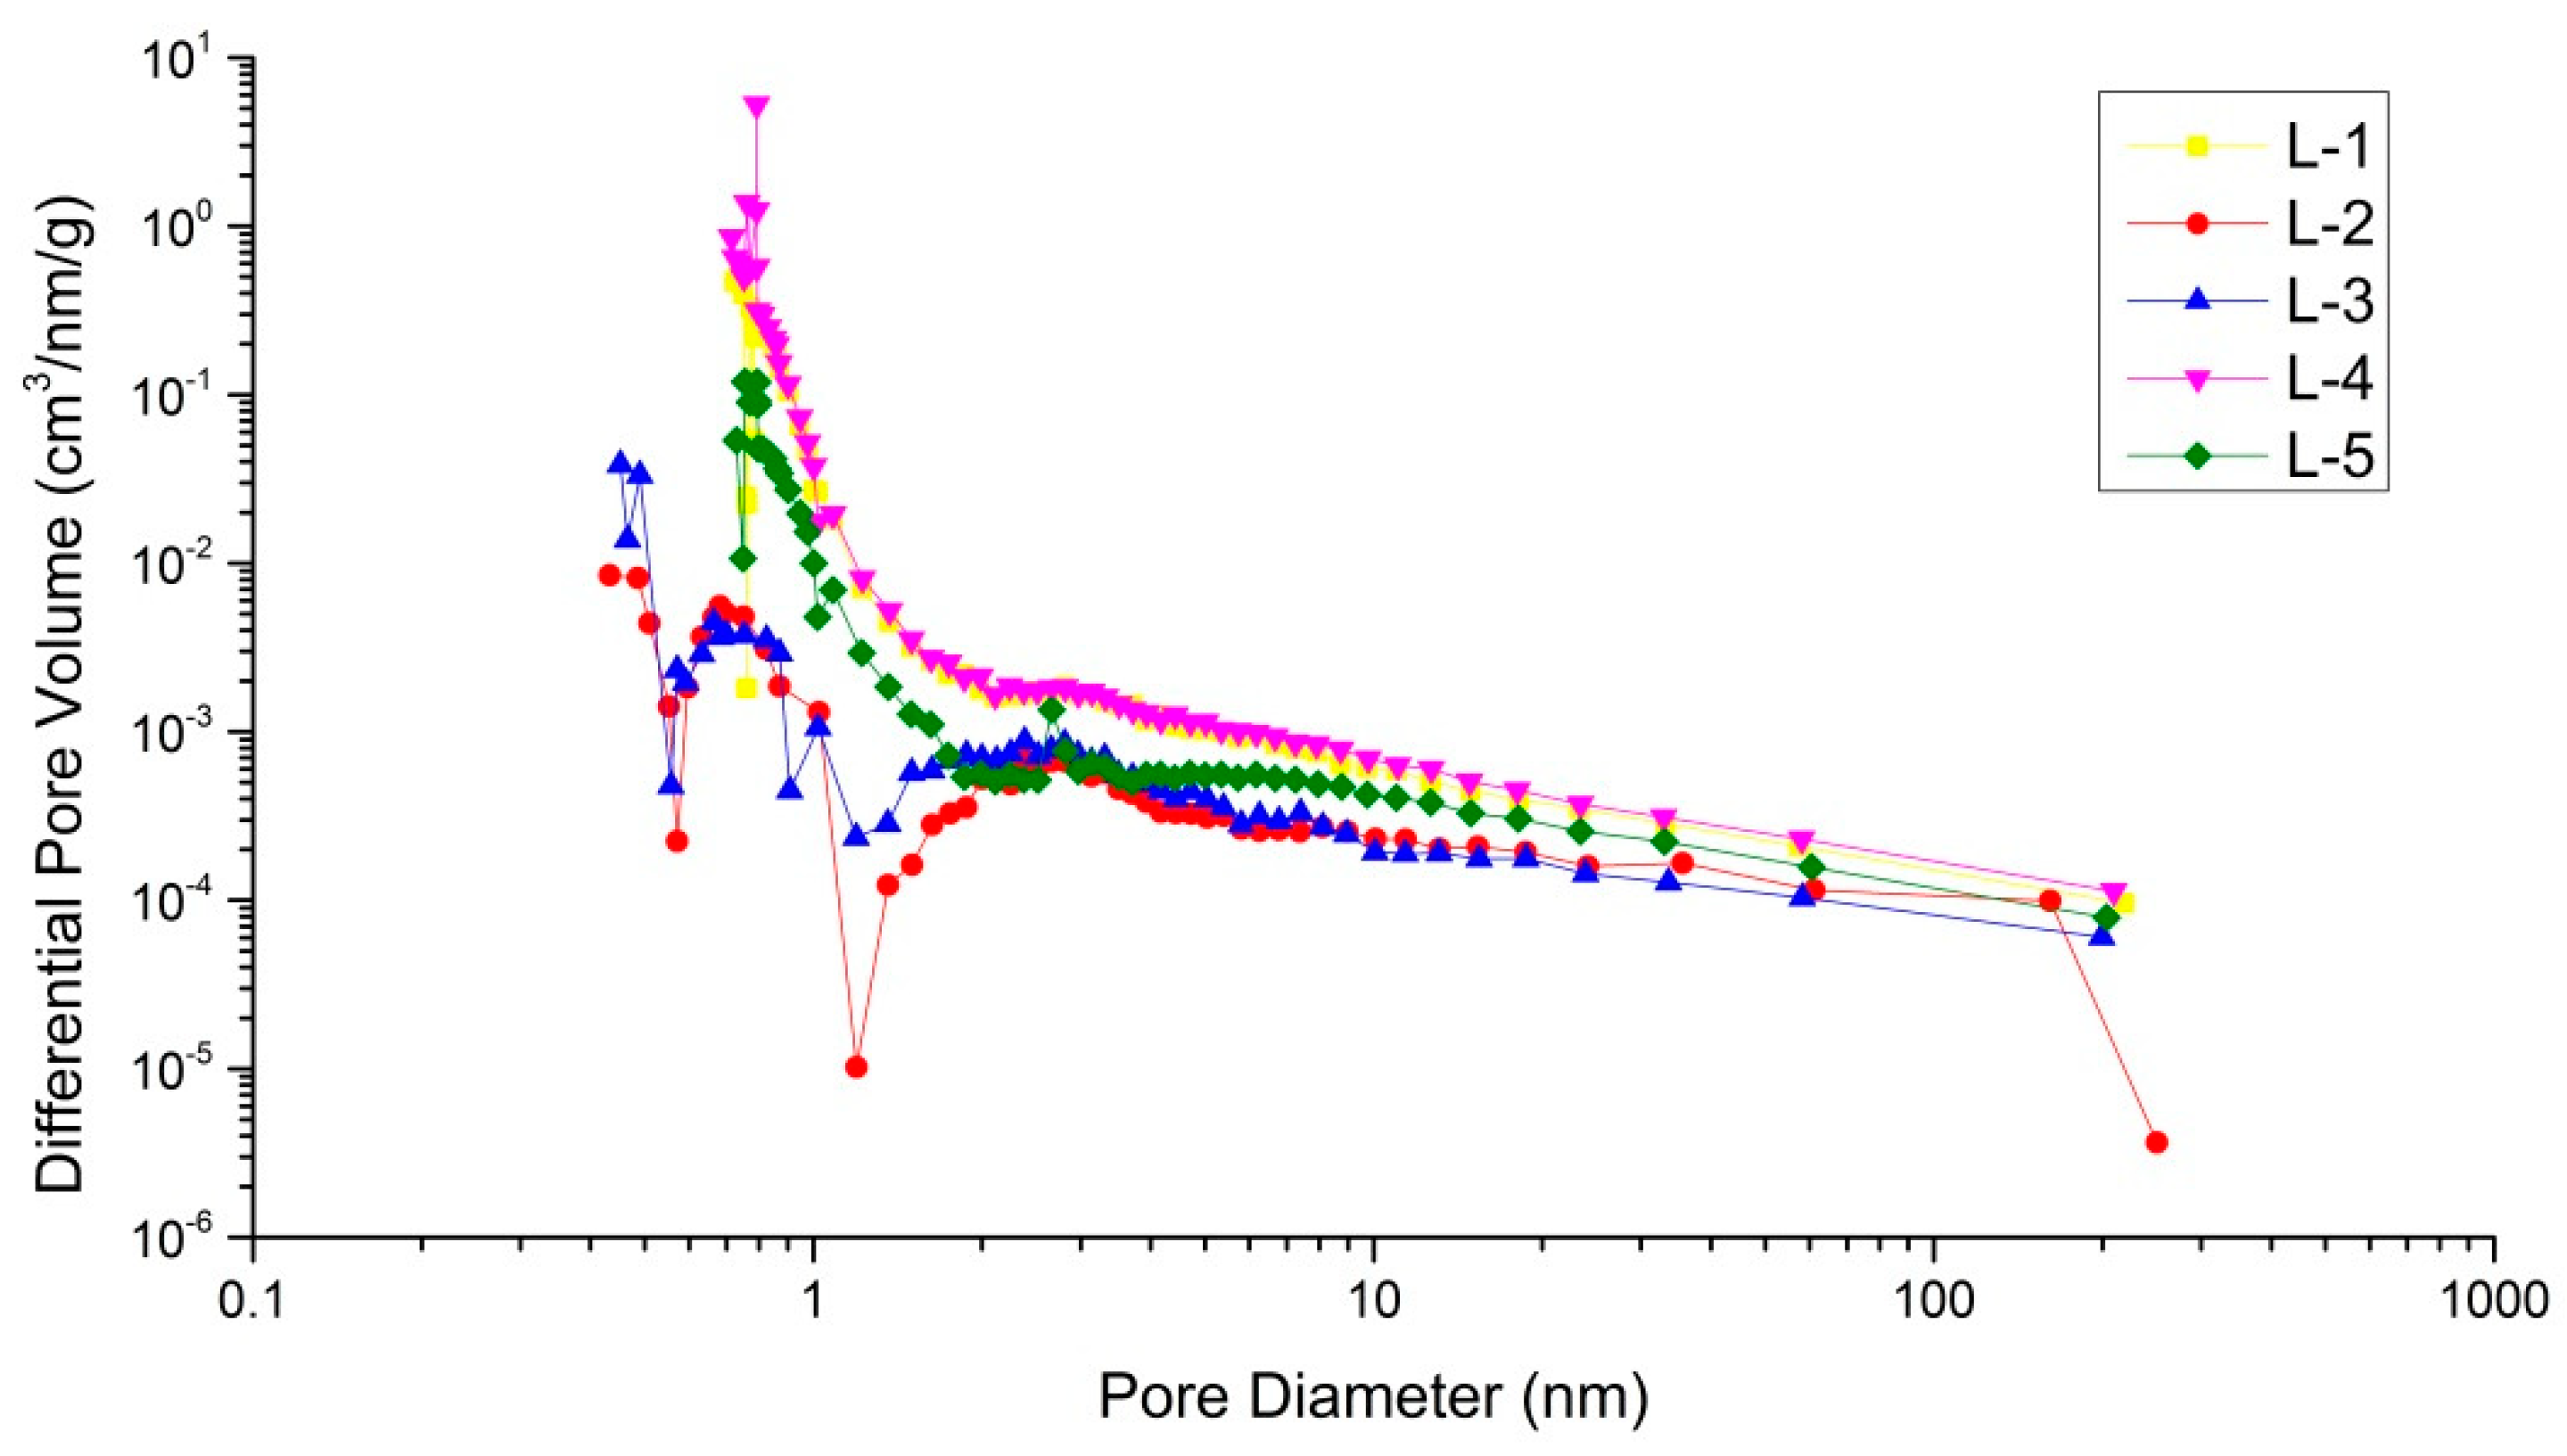
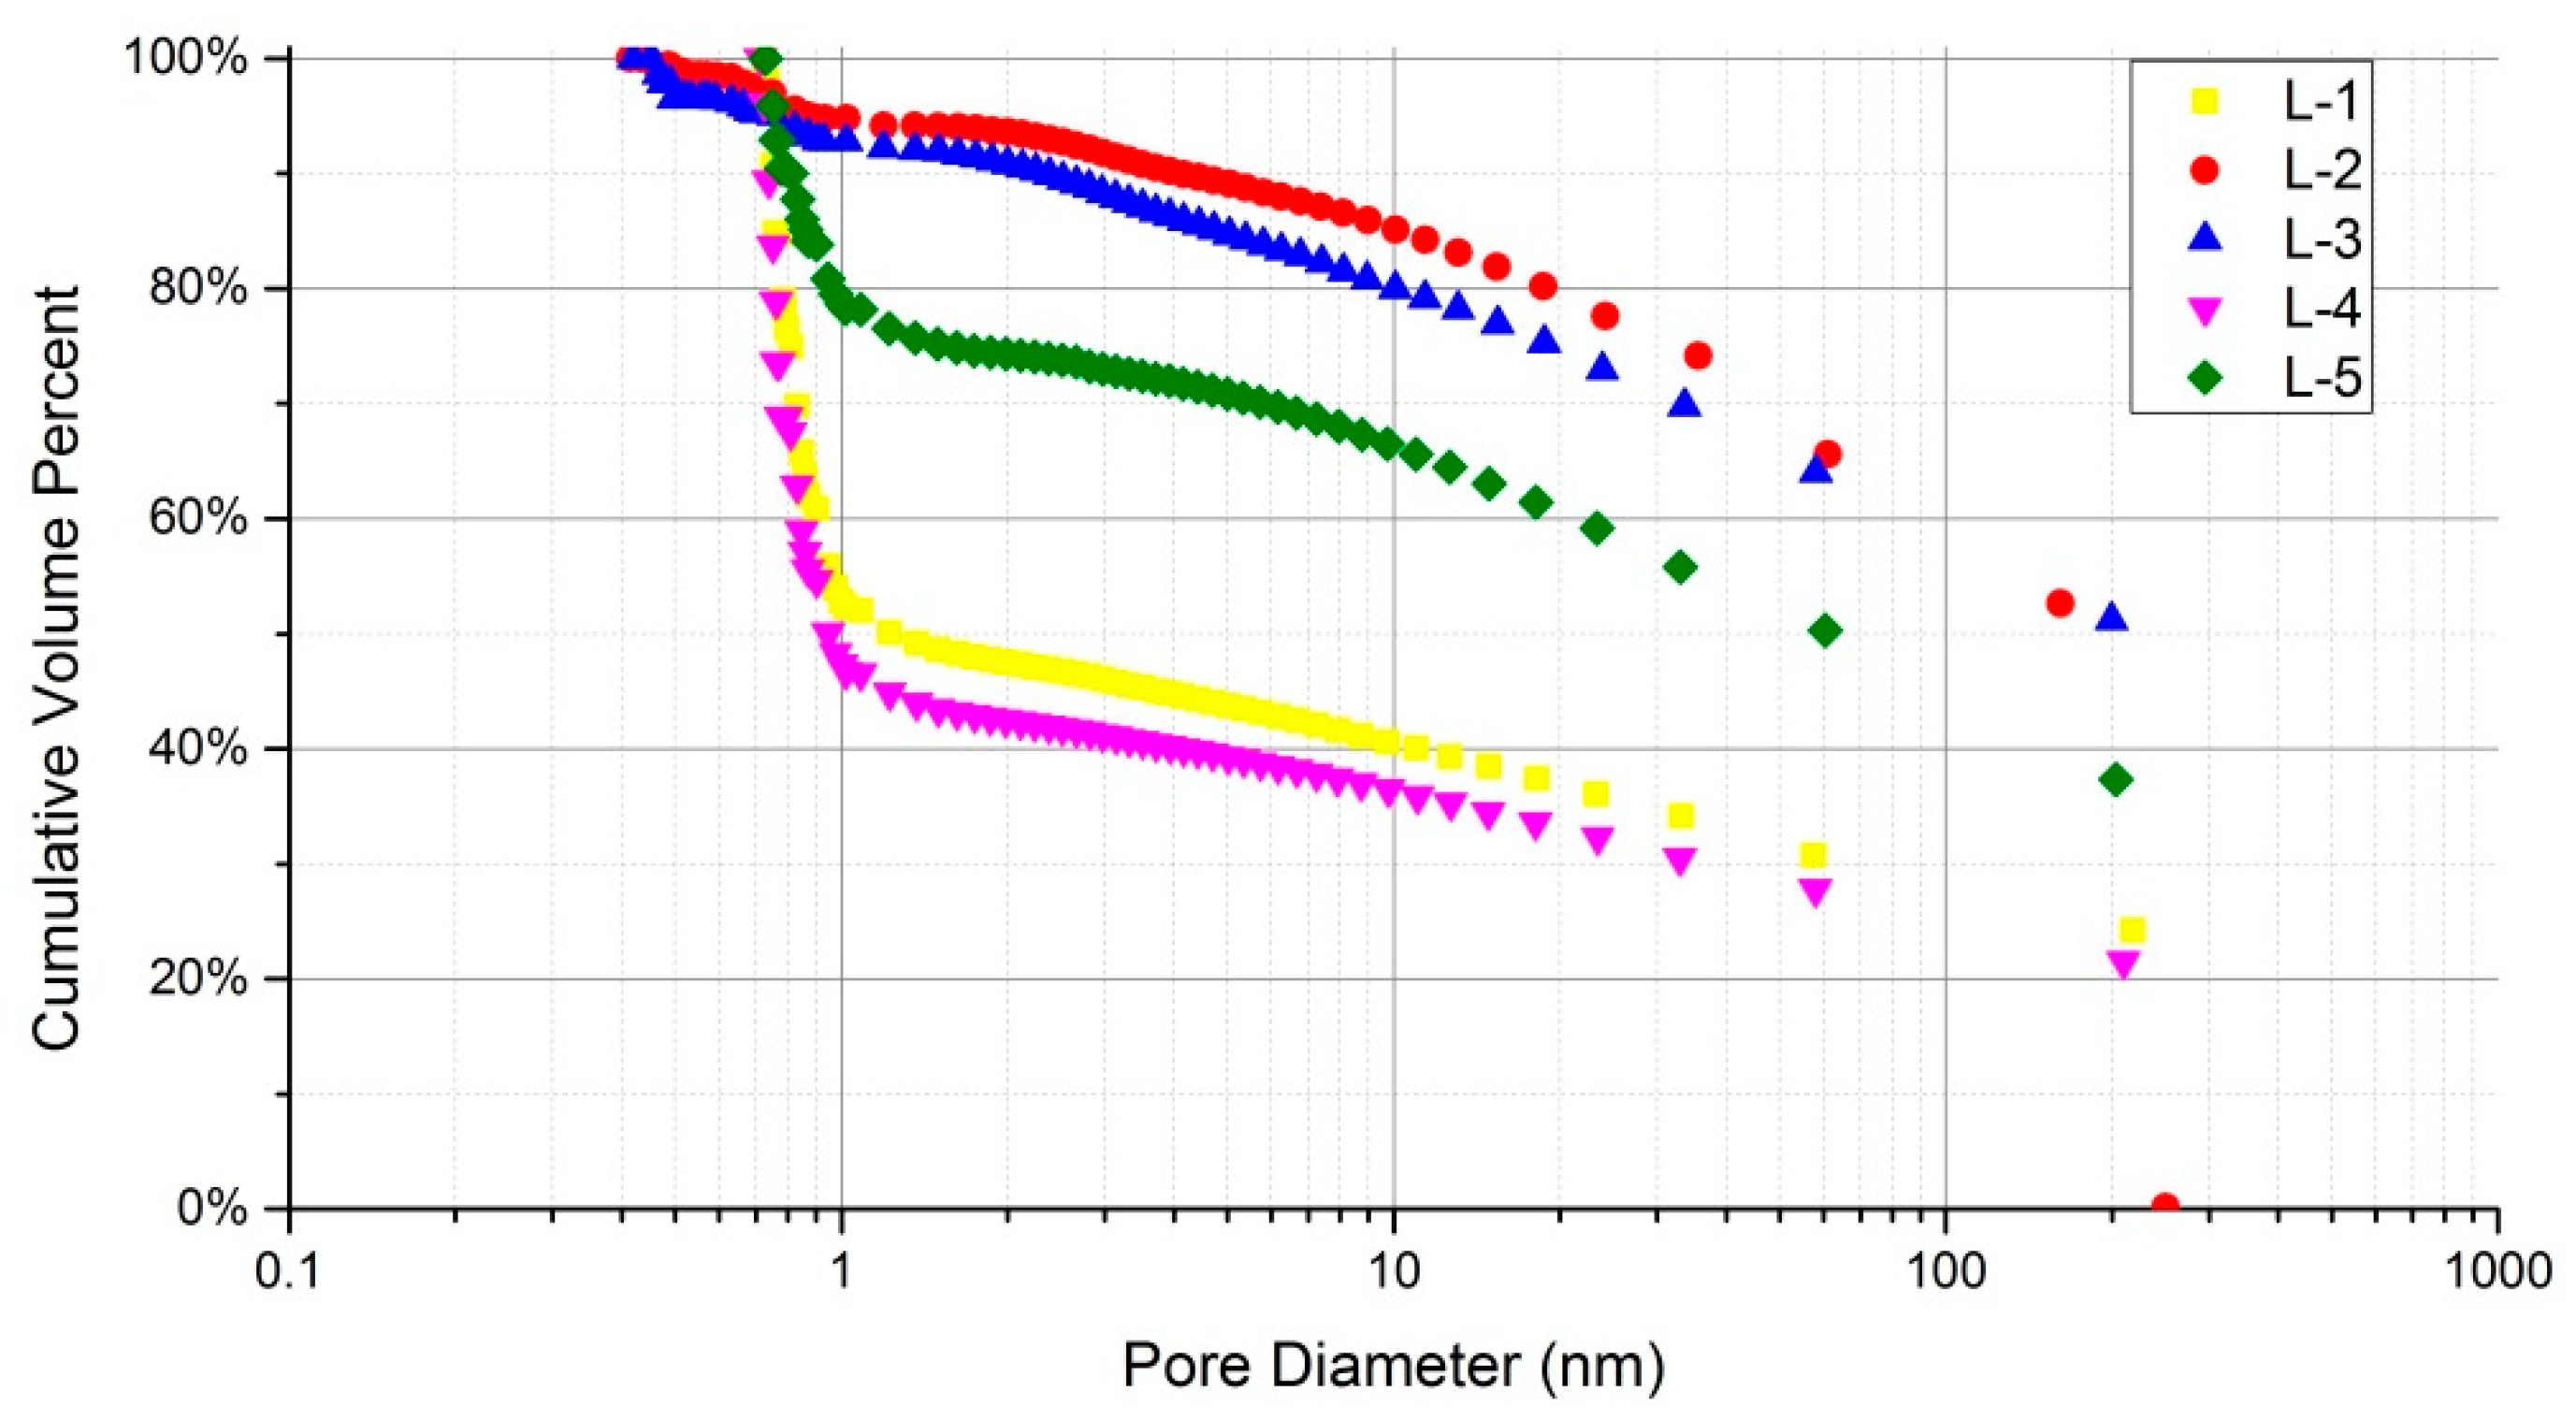
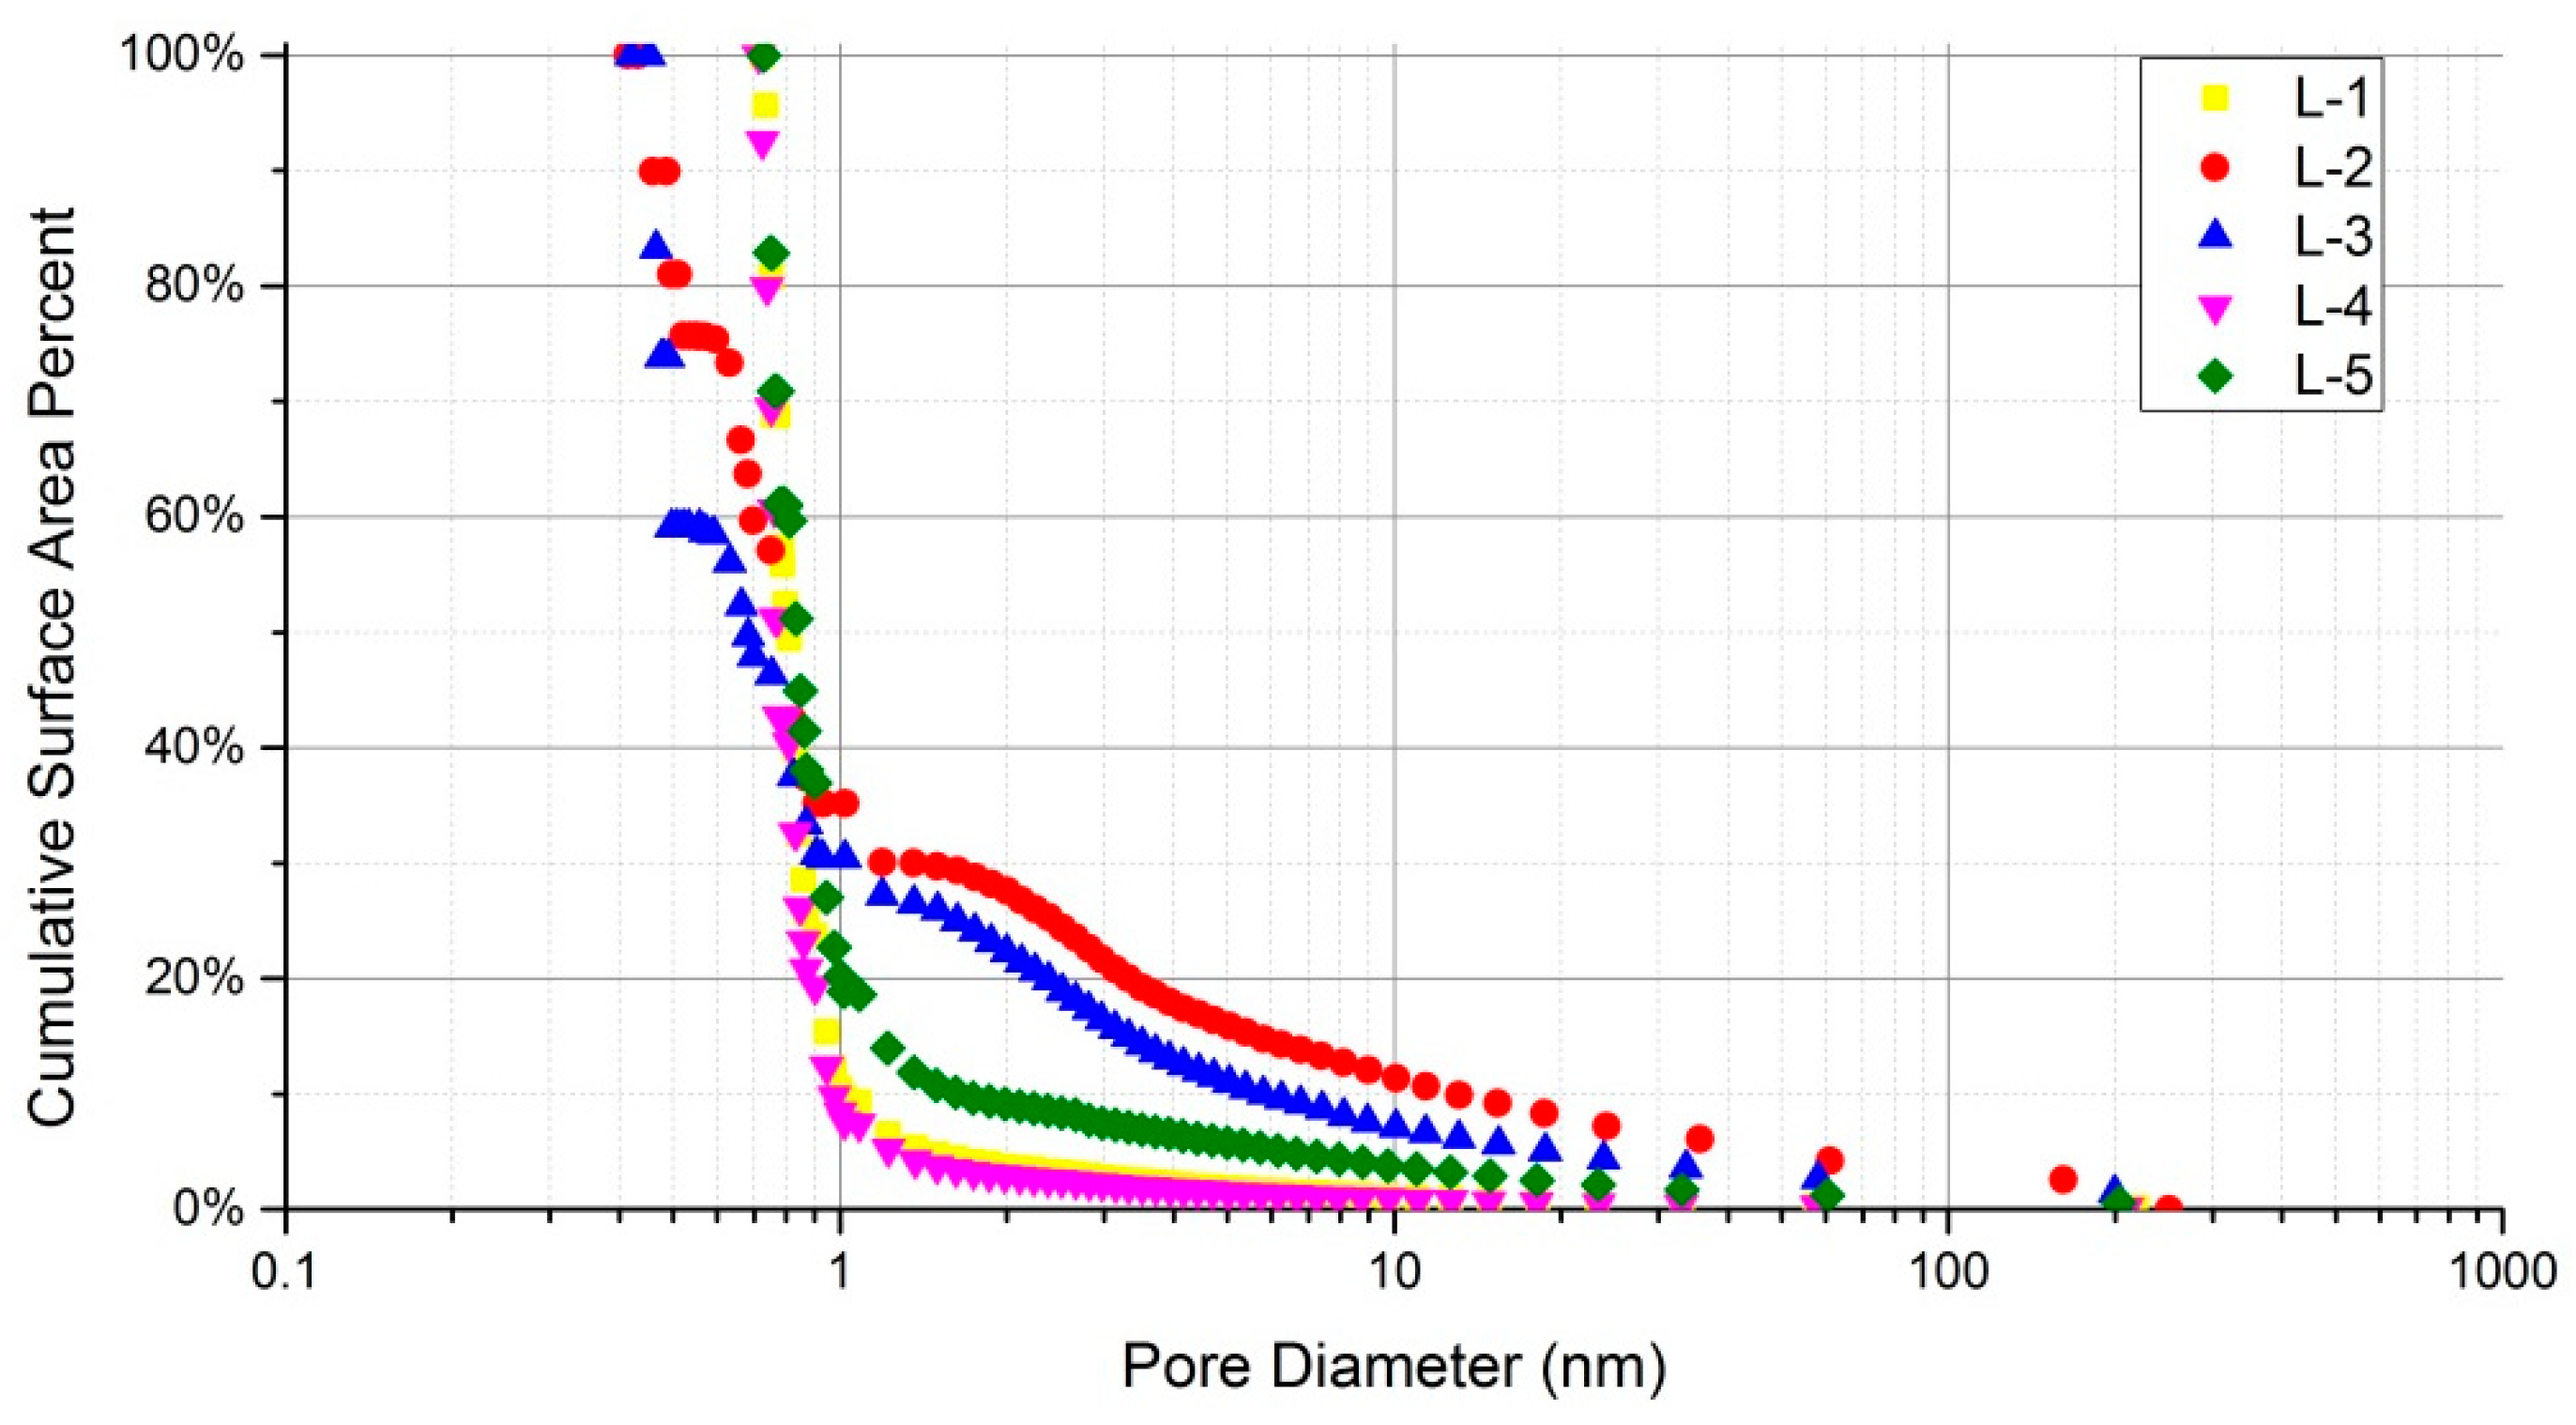
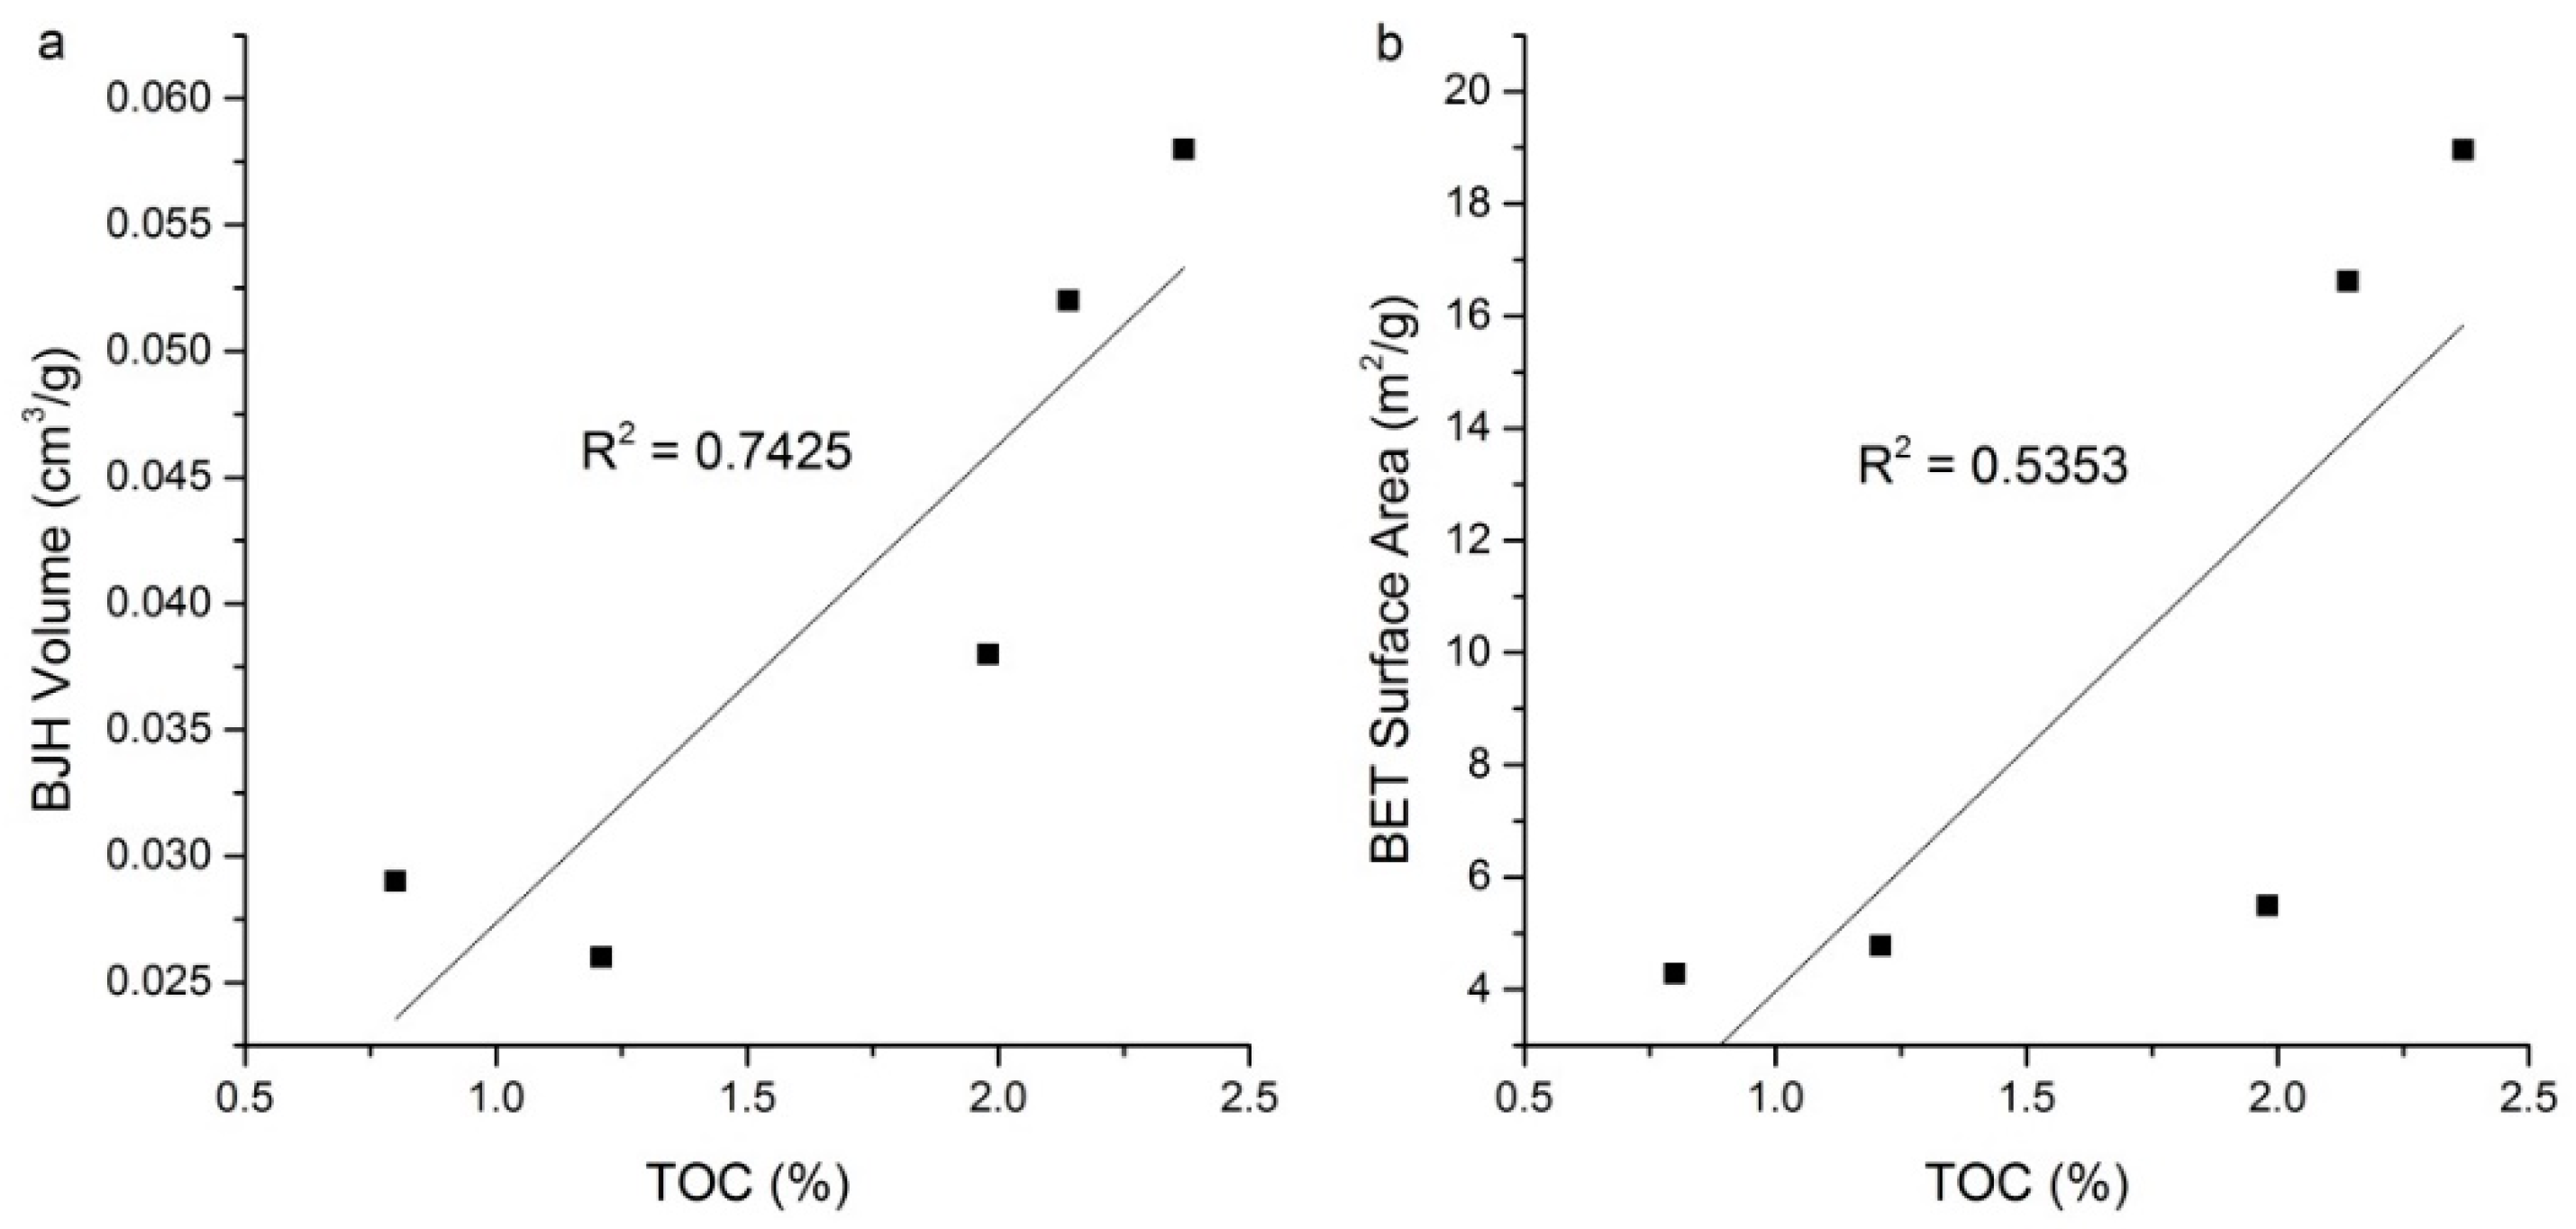
4.2.2. Pore Volume and Surface Area

In general, small pores have large specific surface area. The results listed in Table 2 show that all the samples have huge pore surface area, which means great hydrocarbon adsorption potential. Corresponding to the high adsorption amounts of the adsorption curves, L-1 and L-4 have the largest pore volume and surface area calculated from the Barrett–Joyner–Halenda (BJH) and Brunauer–Emmett–Teller (BET) methods, respectively. In terms of pore volume, these two samples are far ahead of the others, showing good reservoir space. In respect to pore surface area, L-1 and L-4 can have values more than twice those of L-2, which has the smallest specific surface area. In addition, the pore volume and surface area of each sample shows general corresponding relations. That is, a sample with large pore volume also has large surface area. With the same volume, the specific surface areas of micropores and mesopores will be much more than those of macropores. Thus, this kind of corresponding relation illustrates that although they are collected from different depths of the Longmaxi Formation, the series of samples have similar pore size proportions (Figure 4).
The calculated pore volume and surface area clarify the overall pore features of each sample. Meanwhile, the scatter plots of cumulative volume percent and surface area percent can, as shown below, highlight the contributions of pores in different diameter ranges. A sharp increase of the three samples with higher pore volume was observed in the micropore range, especially at pore diameters of less than 1 nm, (Figure 5). The percentage of micropores to pore volume of L-1 and L-4 can even achieve 50–60%. This may also be the reason that the average pore diameter of these two samples is significantly lower than that of the other three samples (Table 2). Furthermore, even in the samples with relatively underdeveloped micropores, L-2 and L-3, micropores can occupy a tenth of the total volume. Considering that their diameters are much smaller than those of the mesopores and macropores, this volume fraction means a huge advantage of number. Another thing to note is that L-2 and L-3 have higher volume proportions of macropores (more than 60% in the diagram). However, this does not mean that they have bigger volumes than the other samples in the range of macropores, due to their limited total pore volume. Undeveloped micropores lead to this result. This, on the other hand, reflects the importance of micropores on pore volume.
The cumulative percentage of pore surface area reveals more about the impact of micropores and mesopores. The scatter plot illustrates that for all the samples, micropores and mesopores provide more than 90% of the surface area (Figure 6). Comparisons between the samples also show the same trend as the pore volume, as mentioned above. That is, the higher the proportion of micropores, the larger surface area samples will have. L-1 and L-4, which can achieve total surface areas of 16 m2/g or more, have the most prominent feature that micropores alone account for more than 95% of the surface area, while the macropores’ surface area is close to zero. Unlike the pore volume features, the surface area fractions of macropores of all the samples are much the same, whereas samples with the smallest surface area (L-2, L-3) have large proportions of mesopores.

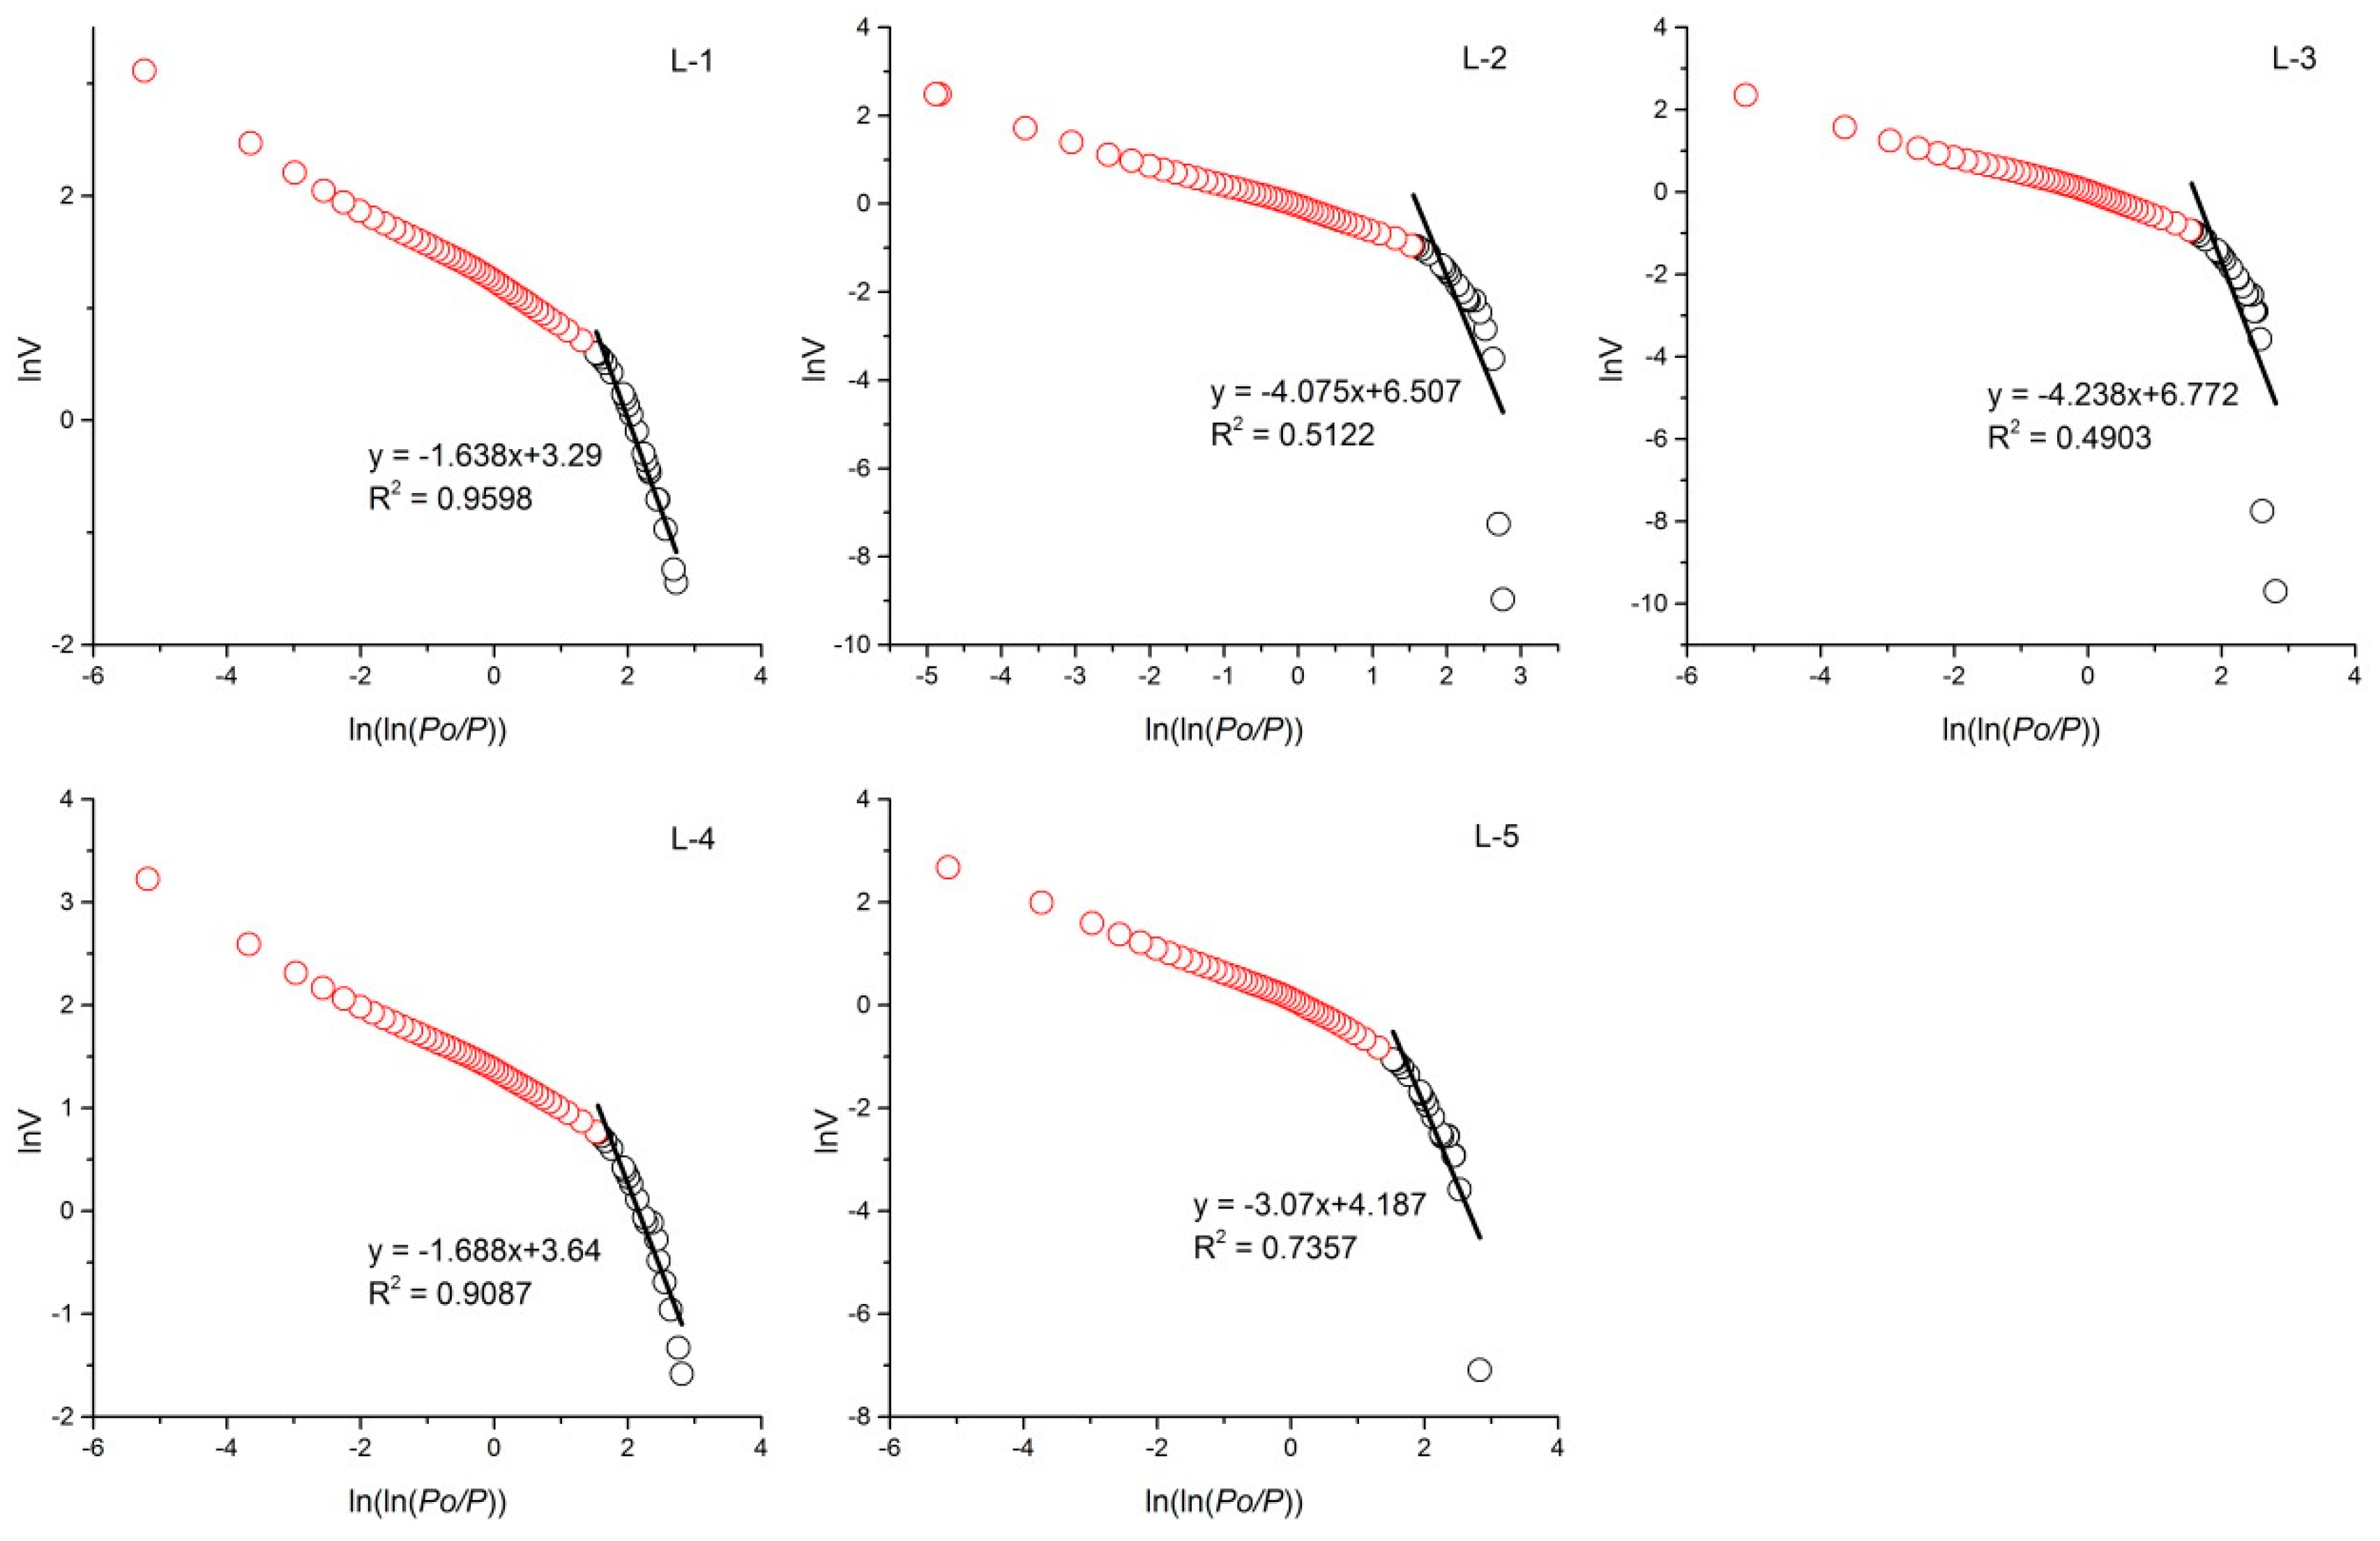
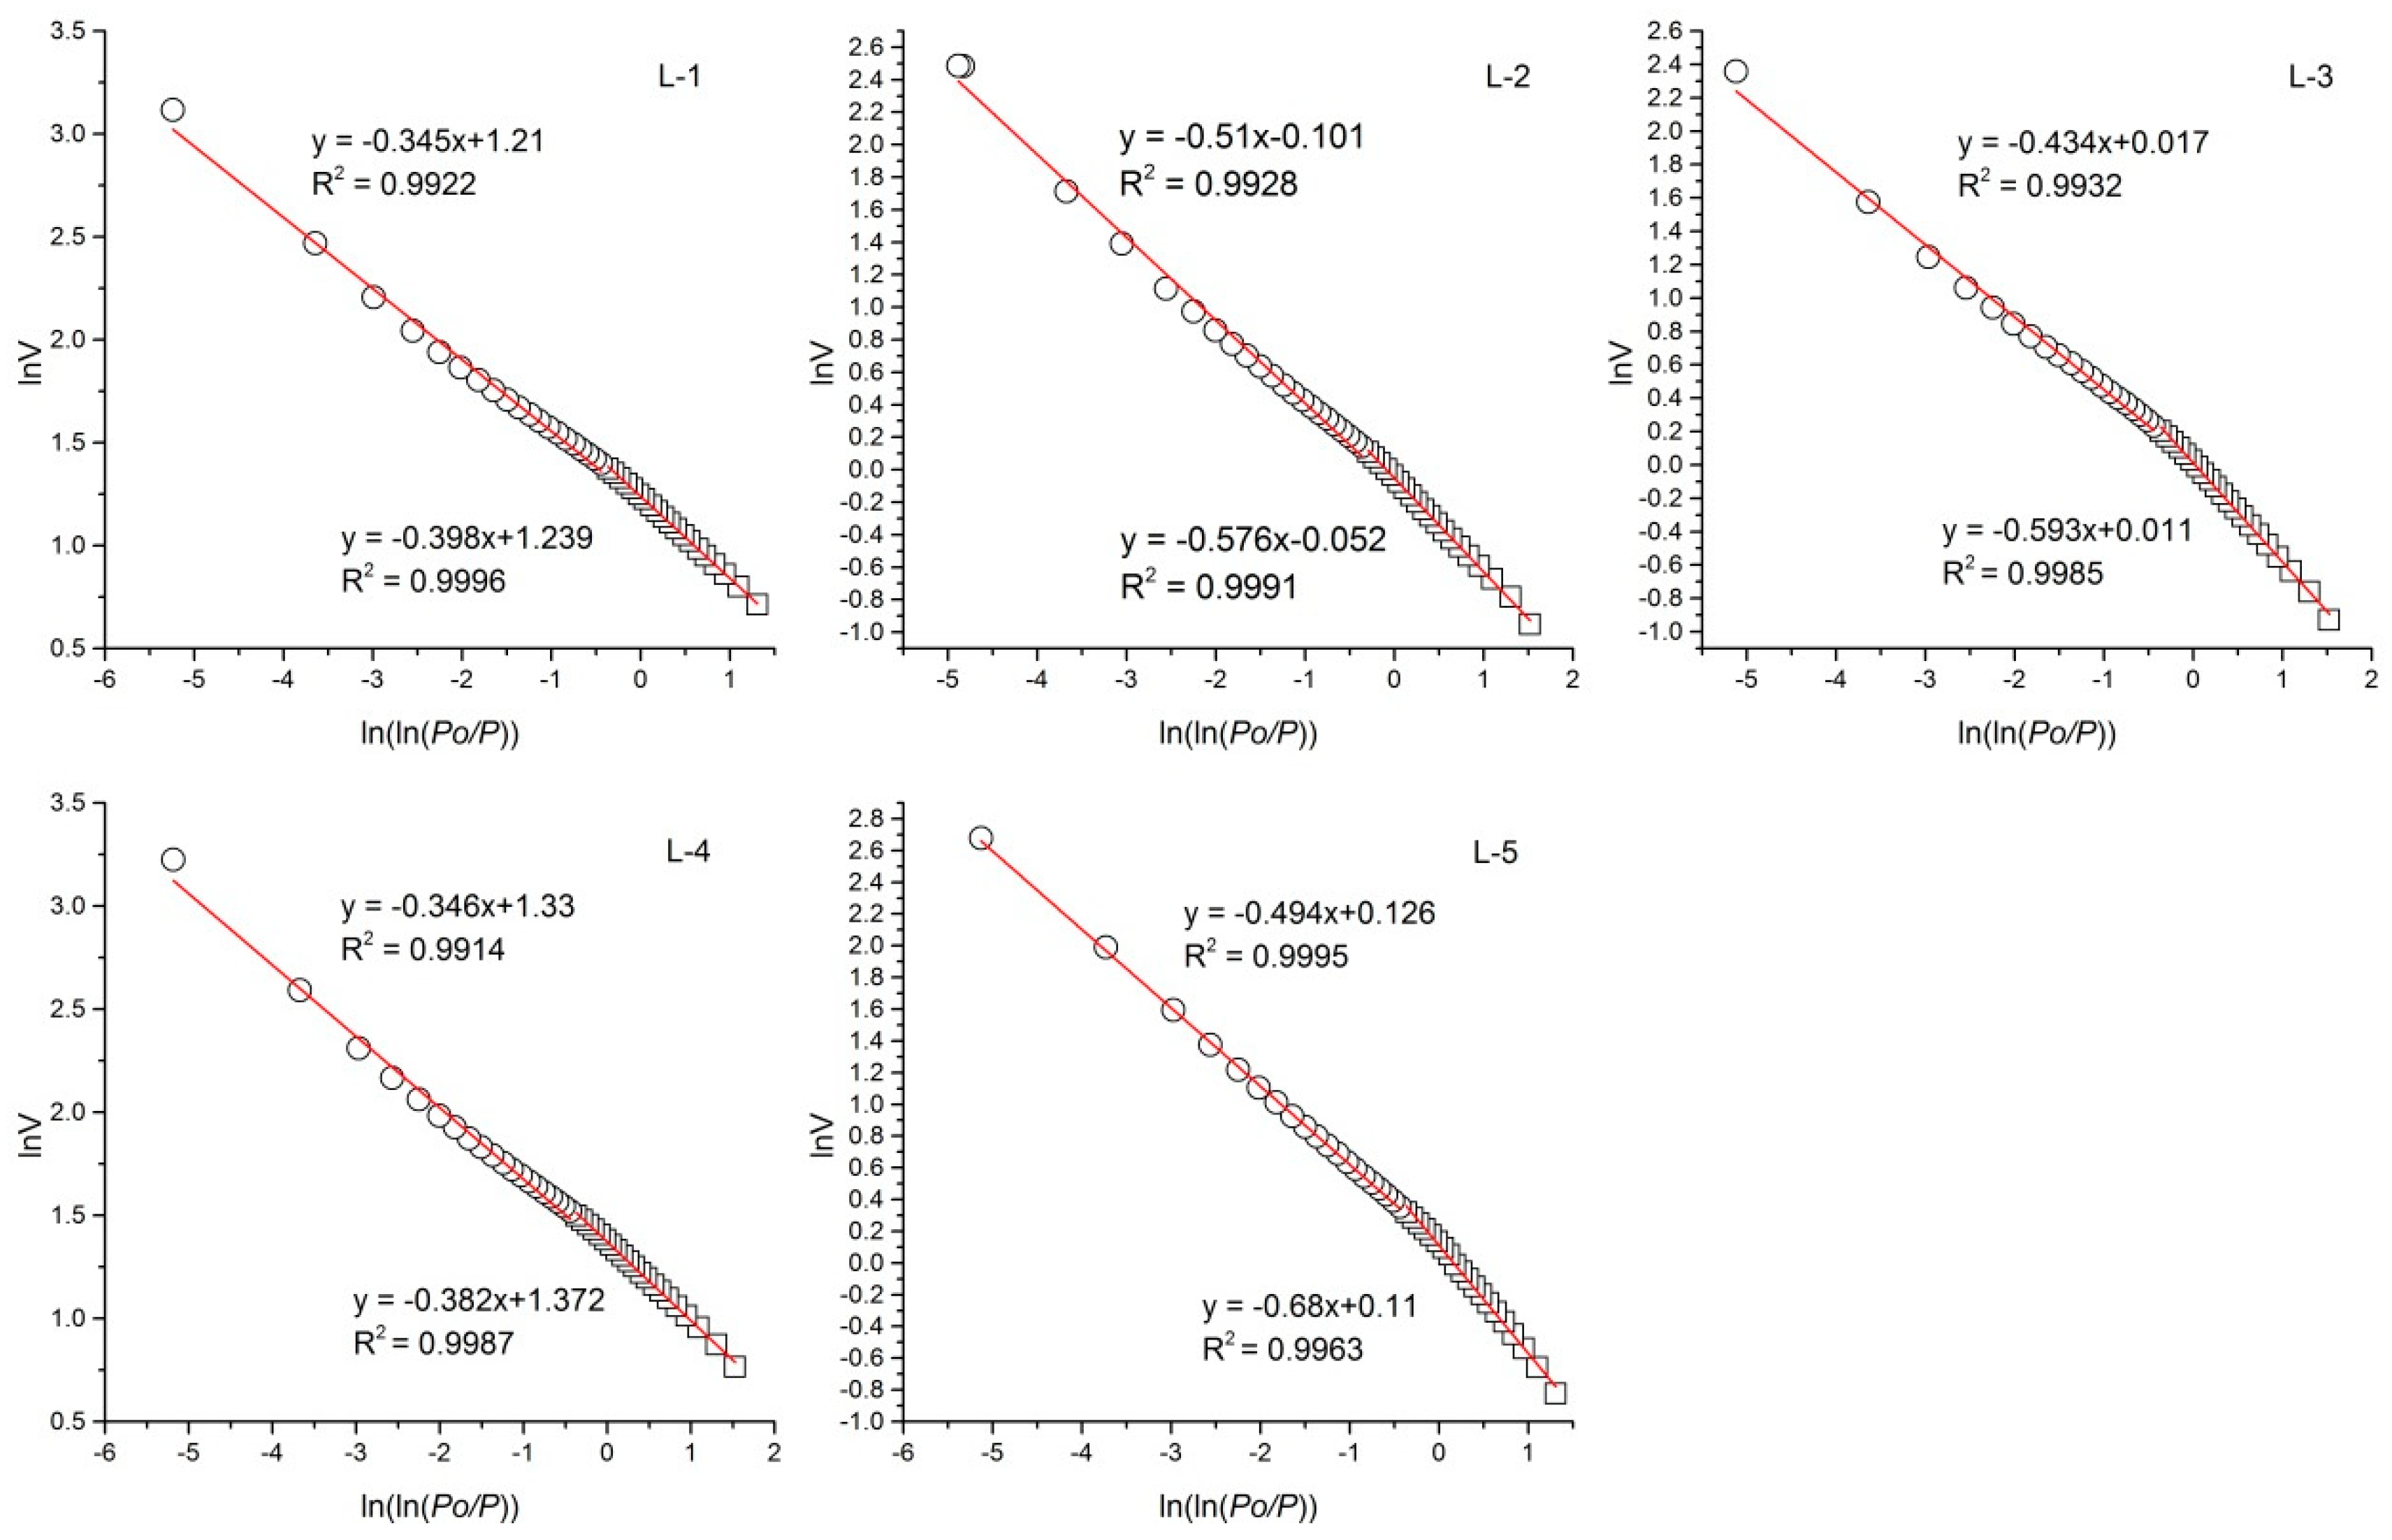
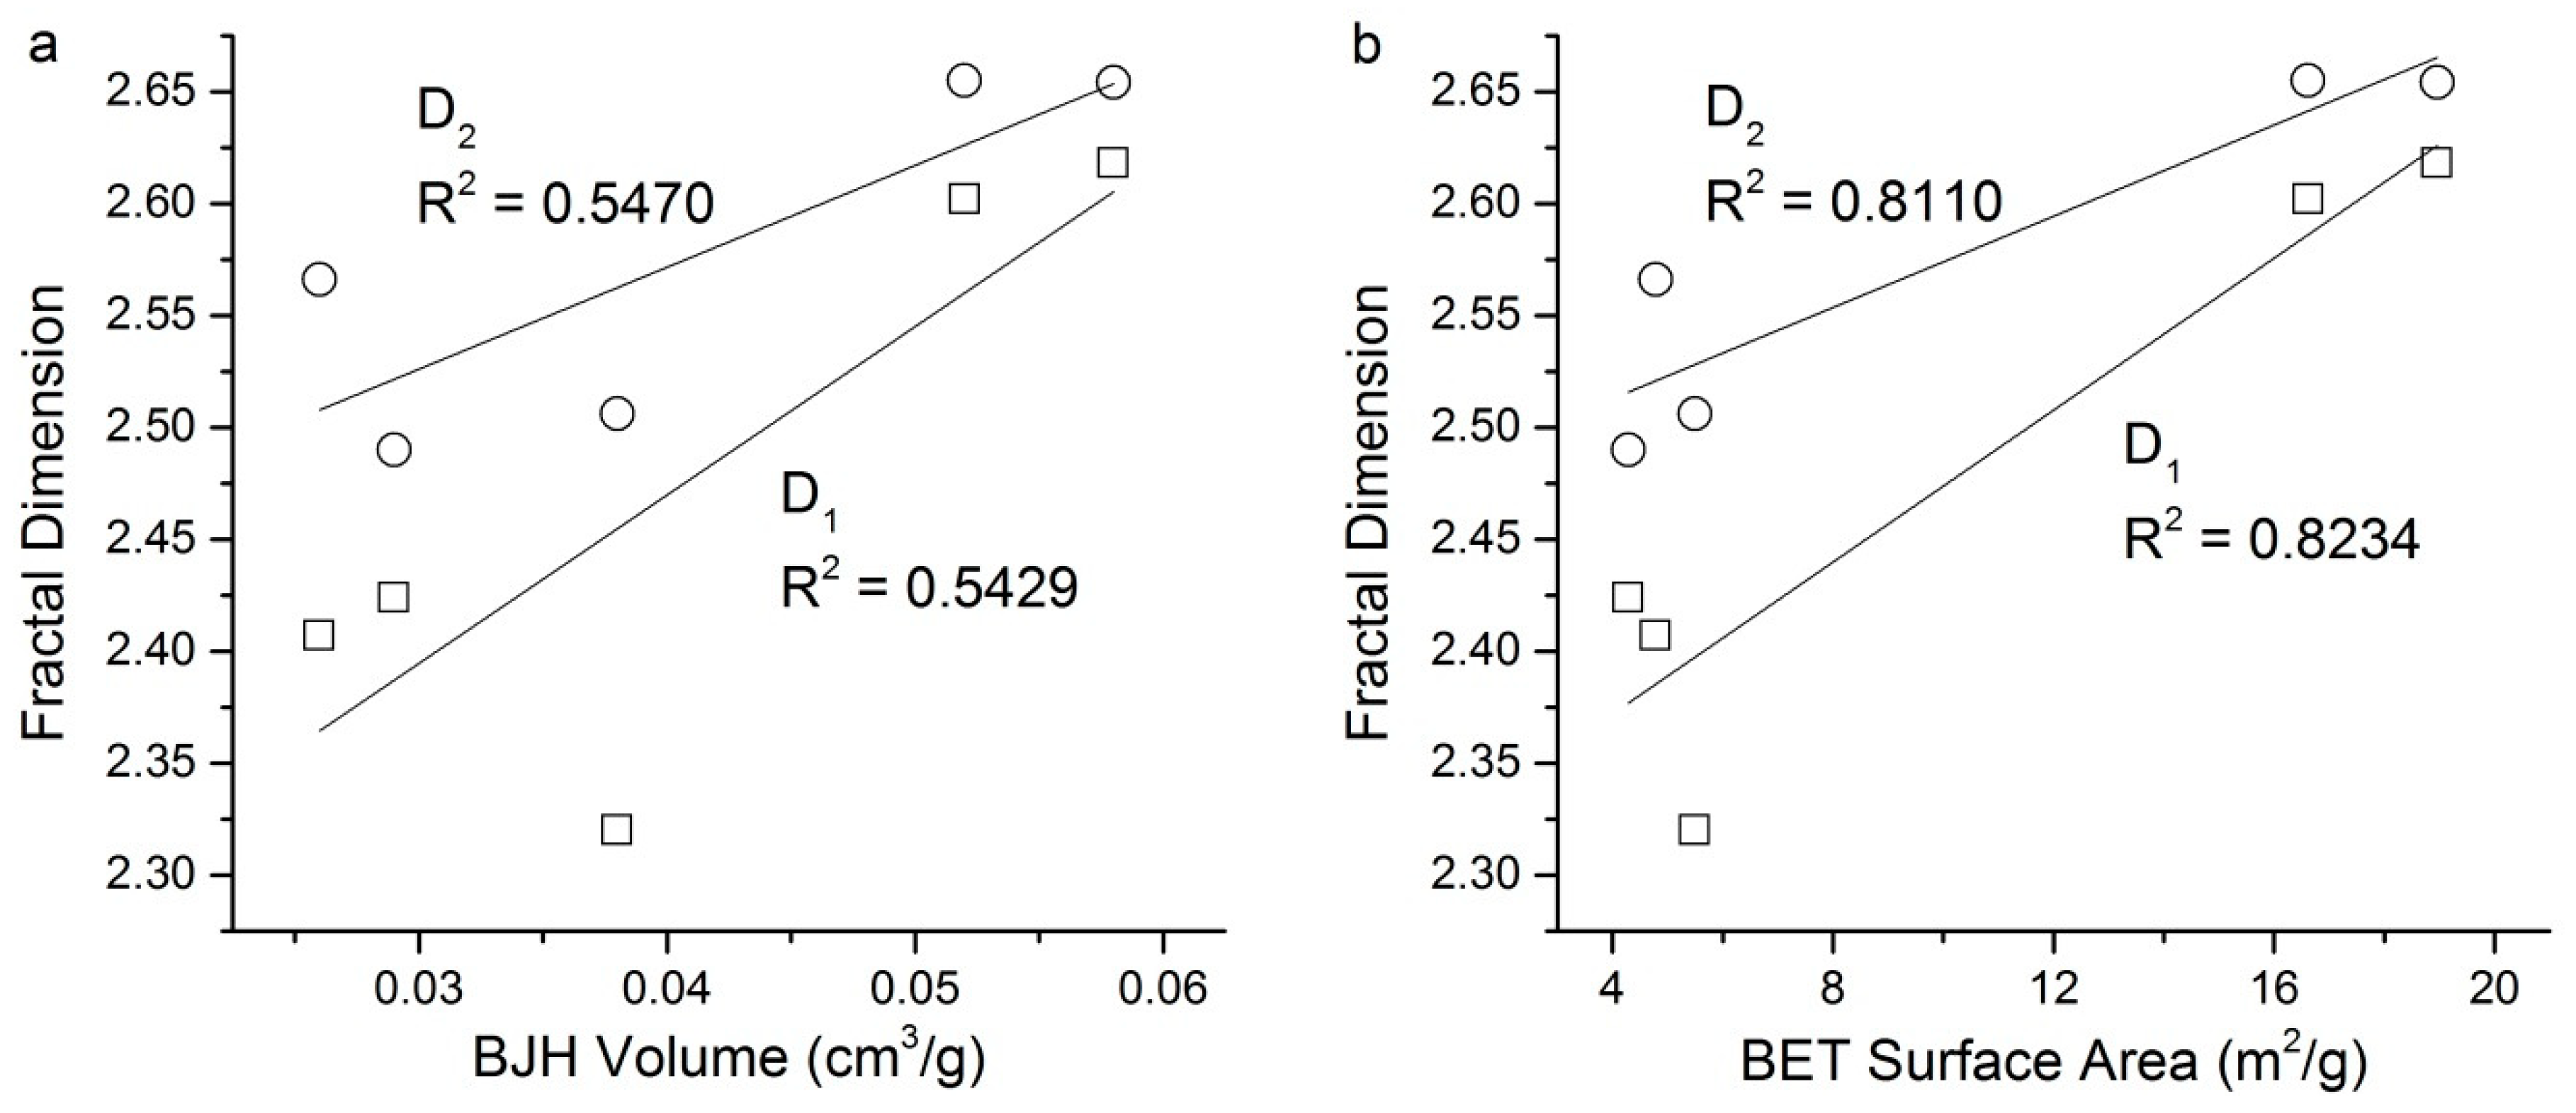
4.3. Fractal Characteristics

Fractal theory has been widely applied to several porous materials. Fractal dimension is a ratio providing a statistical index of complexity, comparing how details in a pattern change with the scale at which it is measured. In the research of shale pore characteristics, several experimental methods can be used to calculate the fractal dimension. Among all the methods, the fractal dimensions estimated by N2 adsorption have proven to be a useful and reliable petrophysical parameter to depict and quantify the irregular surfaces of pores and microstructures [36,58]. Based on the gas adsorption isotherms, the most common and effective method to obtain the fractal dimension is the Frenkel–Halsey–Hill equation (FHH model) [26,31,34,59]. Relevant researches on pores of coal and shale have shown its feasibility [35,37].
In this study, we used the aforementioned N2 adsorption data to calculate the fractal dimension. The FHH equation is simplified as follows:
ln ( V ) = ( D 3 ) ln ( ln ( P o P ) ) + C
where V is the volume of N2 adsorbed at each equilibrium pressure P, Po is the gas saturation pressure, D is the fractal dimension, and C is a constant. Thus, to get the value of the fractal dimension, we need to fit the slope of a straight line onto the plot of ln(V) versus ln(ln(Po/P)), which can be obtained from the N2 adsorption data.
We made the piecewise linear fitting of each scatter plot according to the different slopes of points, and calculated the root mean square error to show the fitting degree. At the segment of low relative pressure of all the samples, i.e., the black points at the far right part of the plot (Figure 7), the slope of fitting to a straight line is less than −1, which means that the calculated value of the fractal dimension will be smaller than 2. However, a valid fractal dimension of shale pores should be between 2 and 3 [31]. In addition, the fitting degrees of several samples in this segment were very low (the correlation coefficient can be as low as 0.49), especially at the points with the lowest relative pressure. Thus, we masked this part of the data, and followed the usual practice with the relative pressure from 0.01 to 1 [34,35]. Referring to previous studies, the two fitting straight lines based on the remaining points were bounded at a relative pressure of 0.5, where the x value is about −0.37 (Figure 8). The final fitting results are good, such that even the worst correlation coefficient is more than 0.99, and the calculated fractal dimensions are all within the range of definition.
We use D1 and D2 to represent the values of the fractal dimension at the P/Po intervals of 0–0.5 and 0.5–1, respectively. The corresponding slope plus three is the value of the fractal dimension. The results of fitted equations, correlation coefficients, and fractal dimensions calculated from the FHH model of all the samples are shown in Table 3. The fractal dimensions in the first segment (D1) vary between 2.32 to 2.618, while the fractal dimensions in the second segment (D2) are slightly larger, changing from 2.49 to 2.655. There is little difference in the fractal dimensions between each sample, which suggests that they have similar fractal pore structures.
As for the fractal dimension, a large value usually indicates a more complex pore structure or rougher surface. The comparison of fractal dimensions of different samples suggests that both L-1 and L-4 have the maximum values of D1 and D2, which means that their pore structures are more complex. The results obtained in the previous section also show that L-1 and L-4 have the largest percentages of pore volume and surface area of micropores and mesopores among all the samples. This suggests that the structures of these small pores are complicated, and as their numbers increase, the complexity of the microstructure will be reflected in the growth of the fractal dimension.

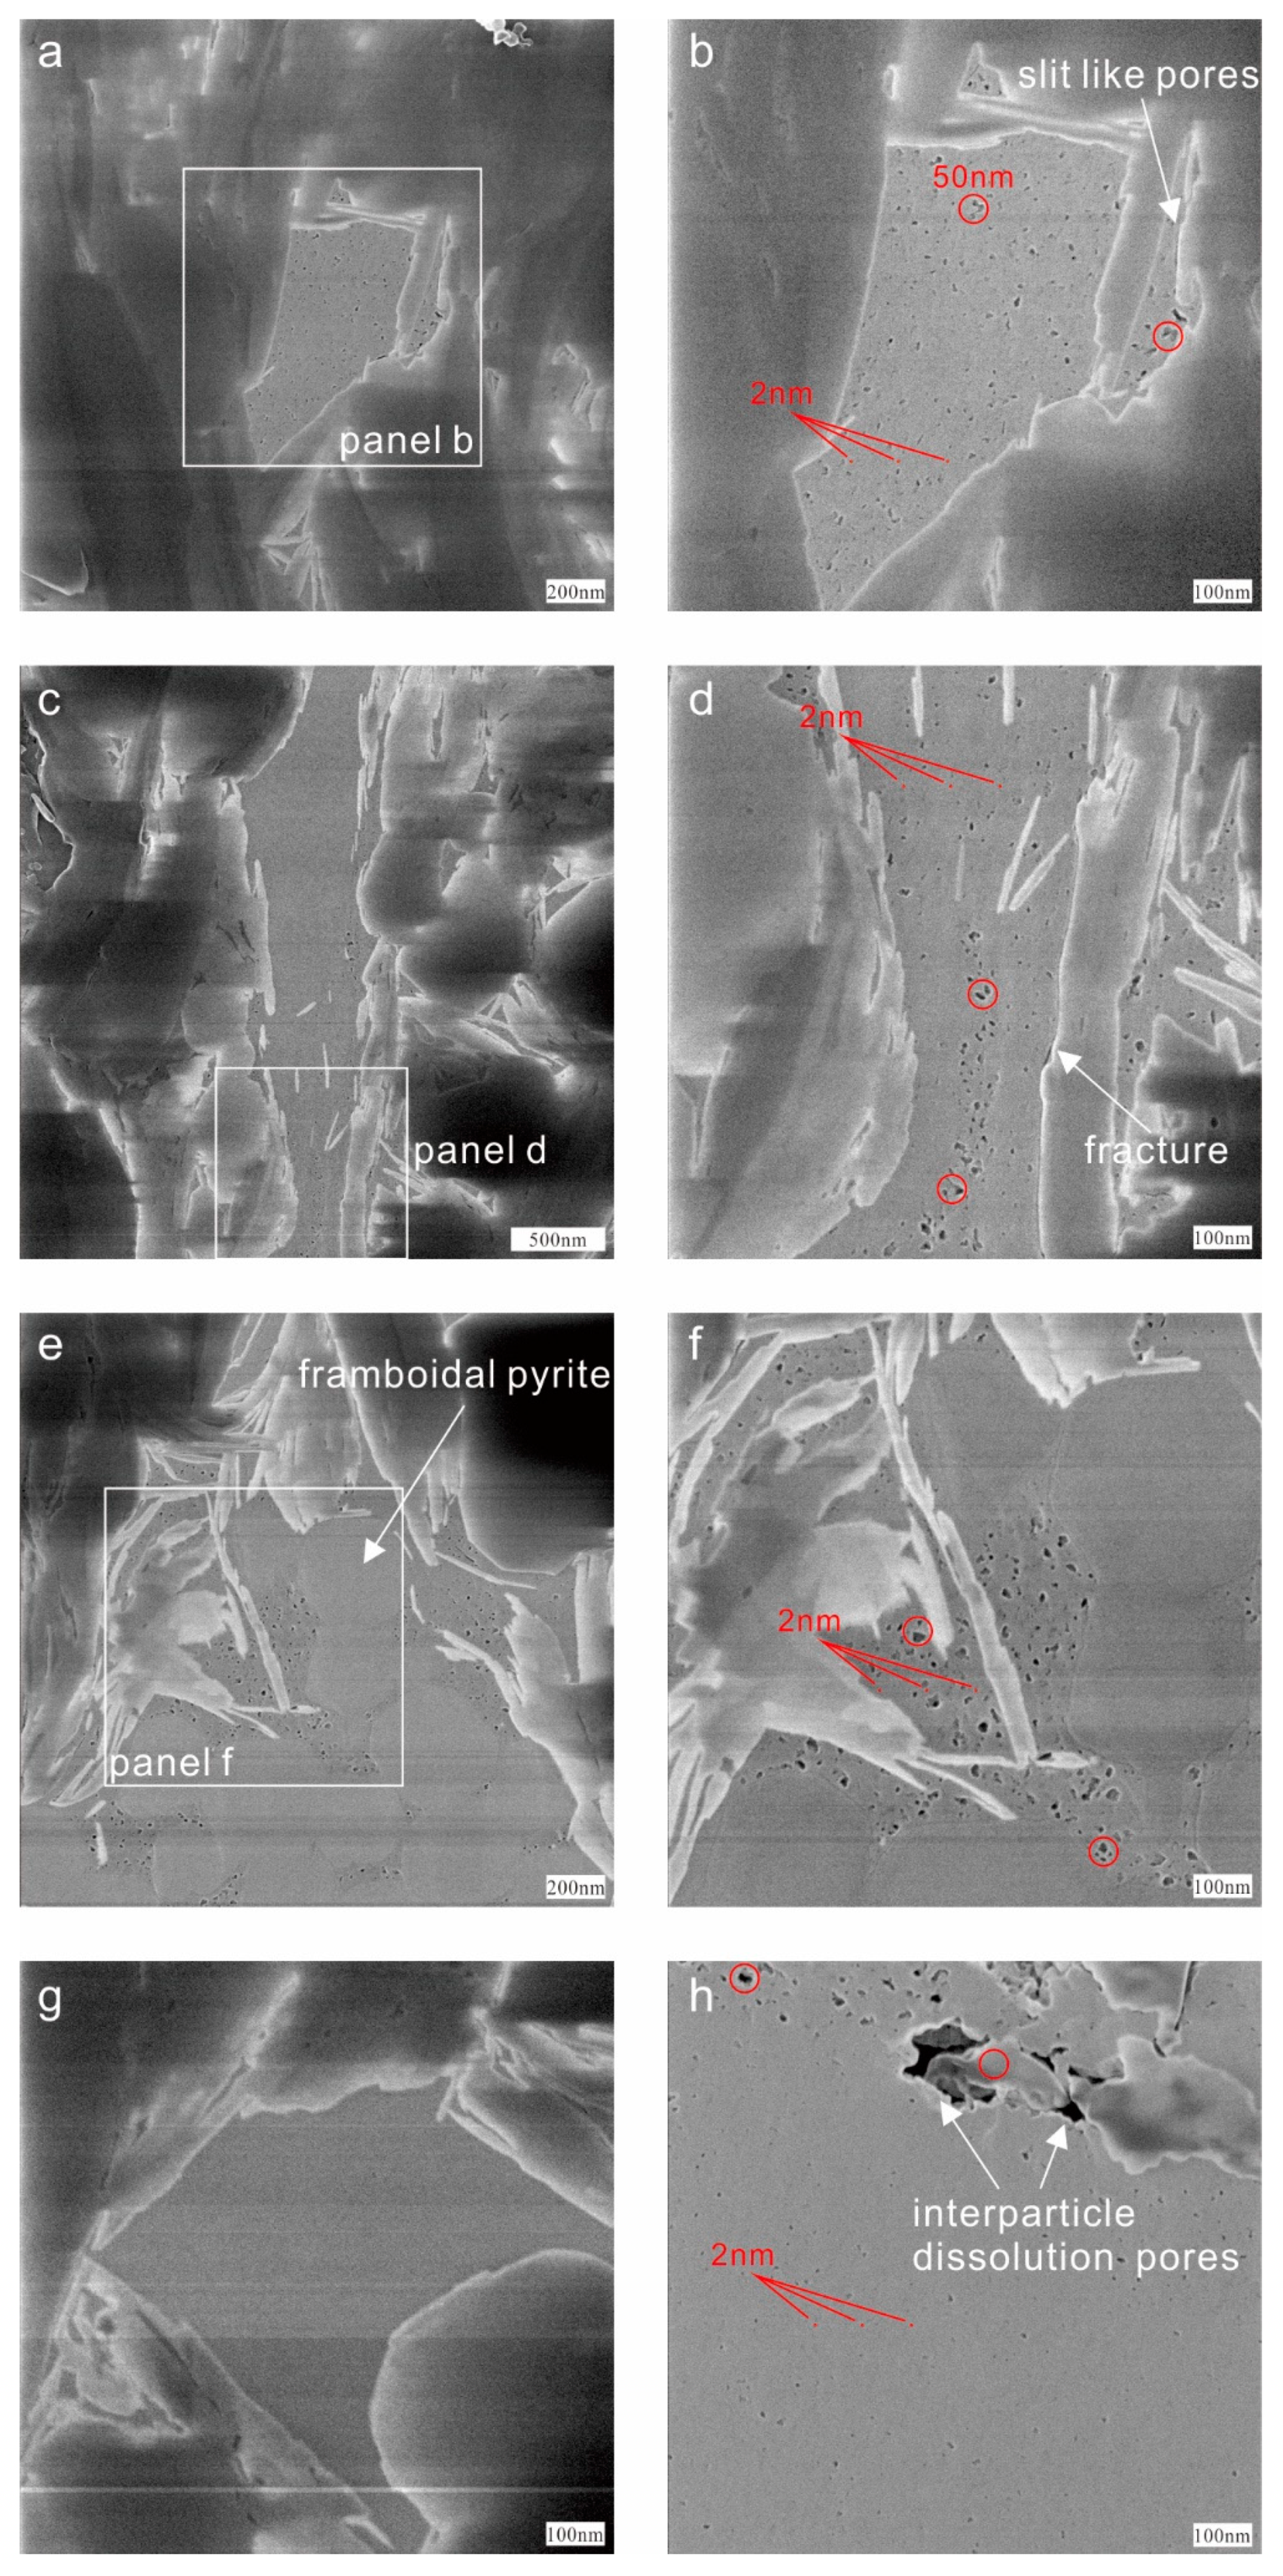
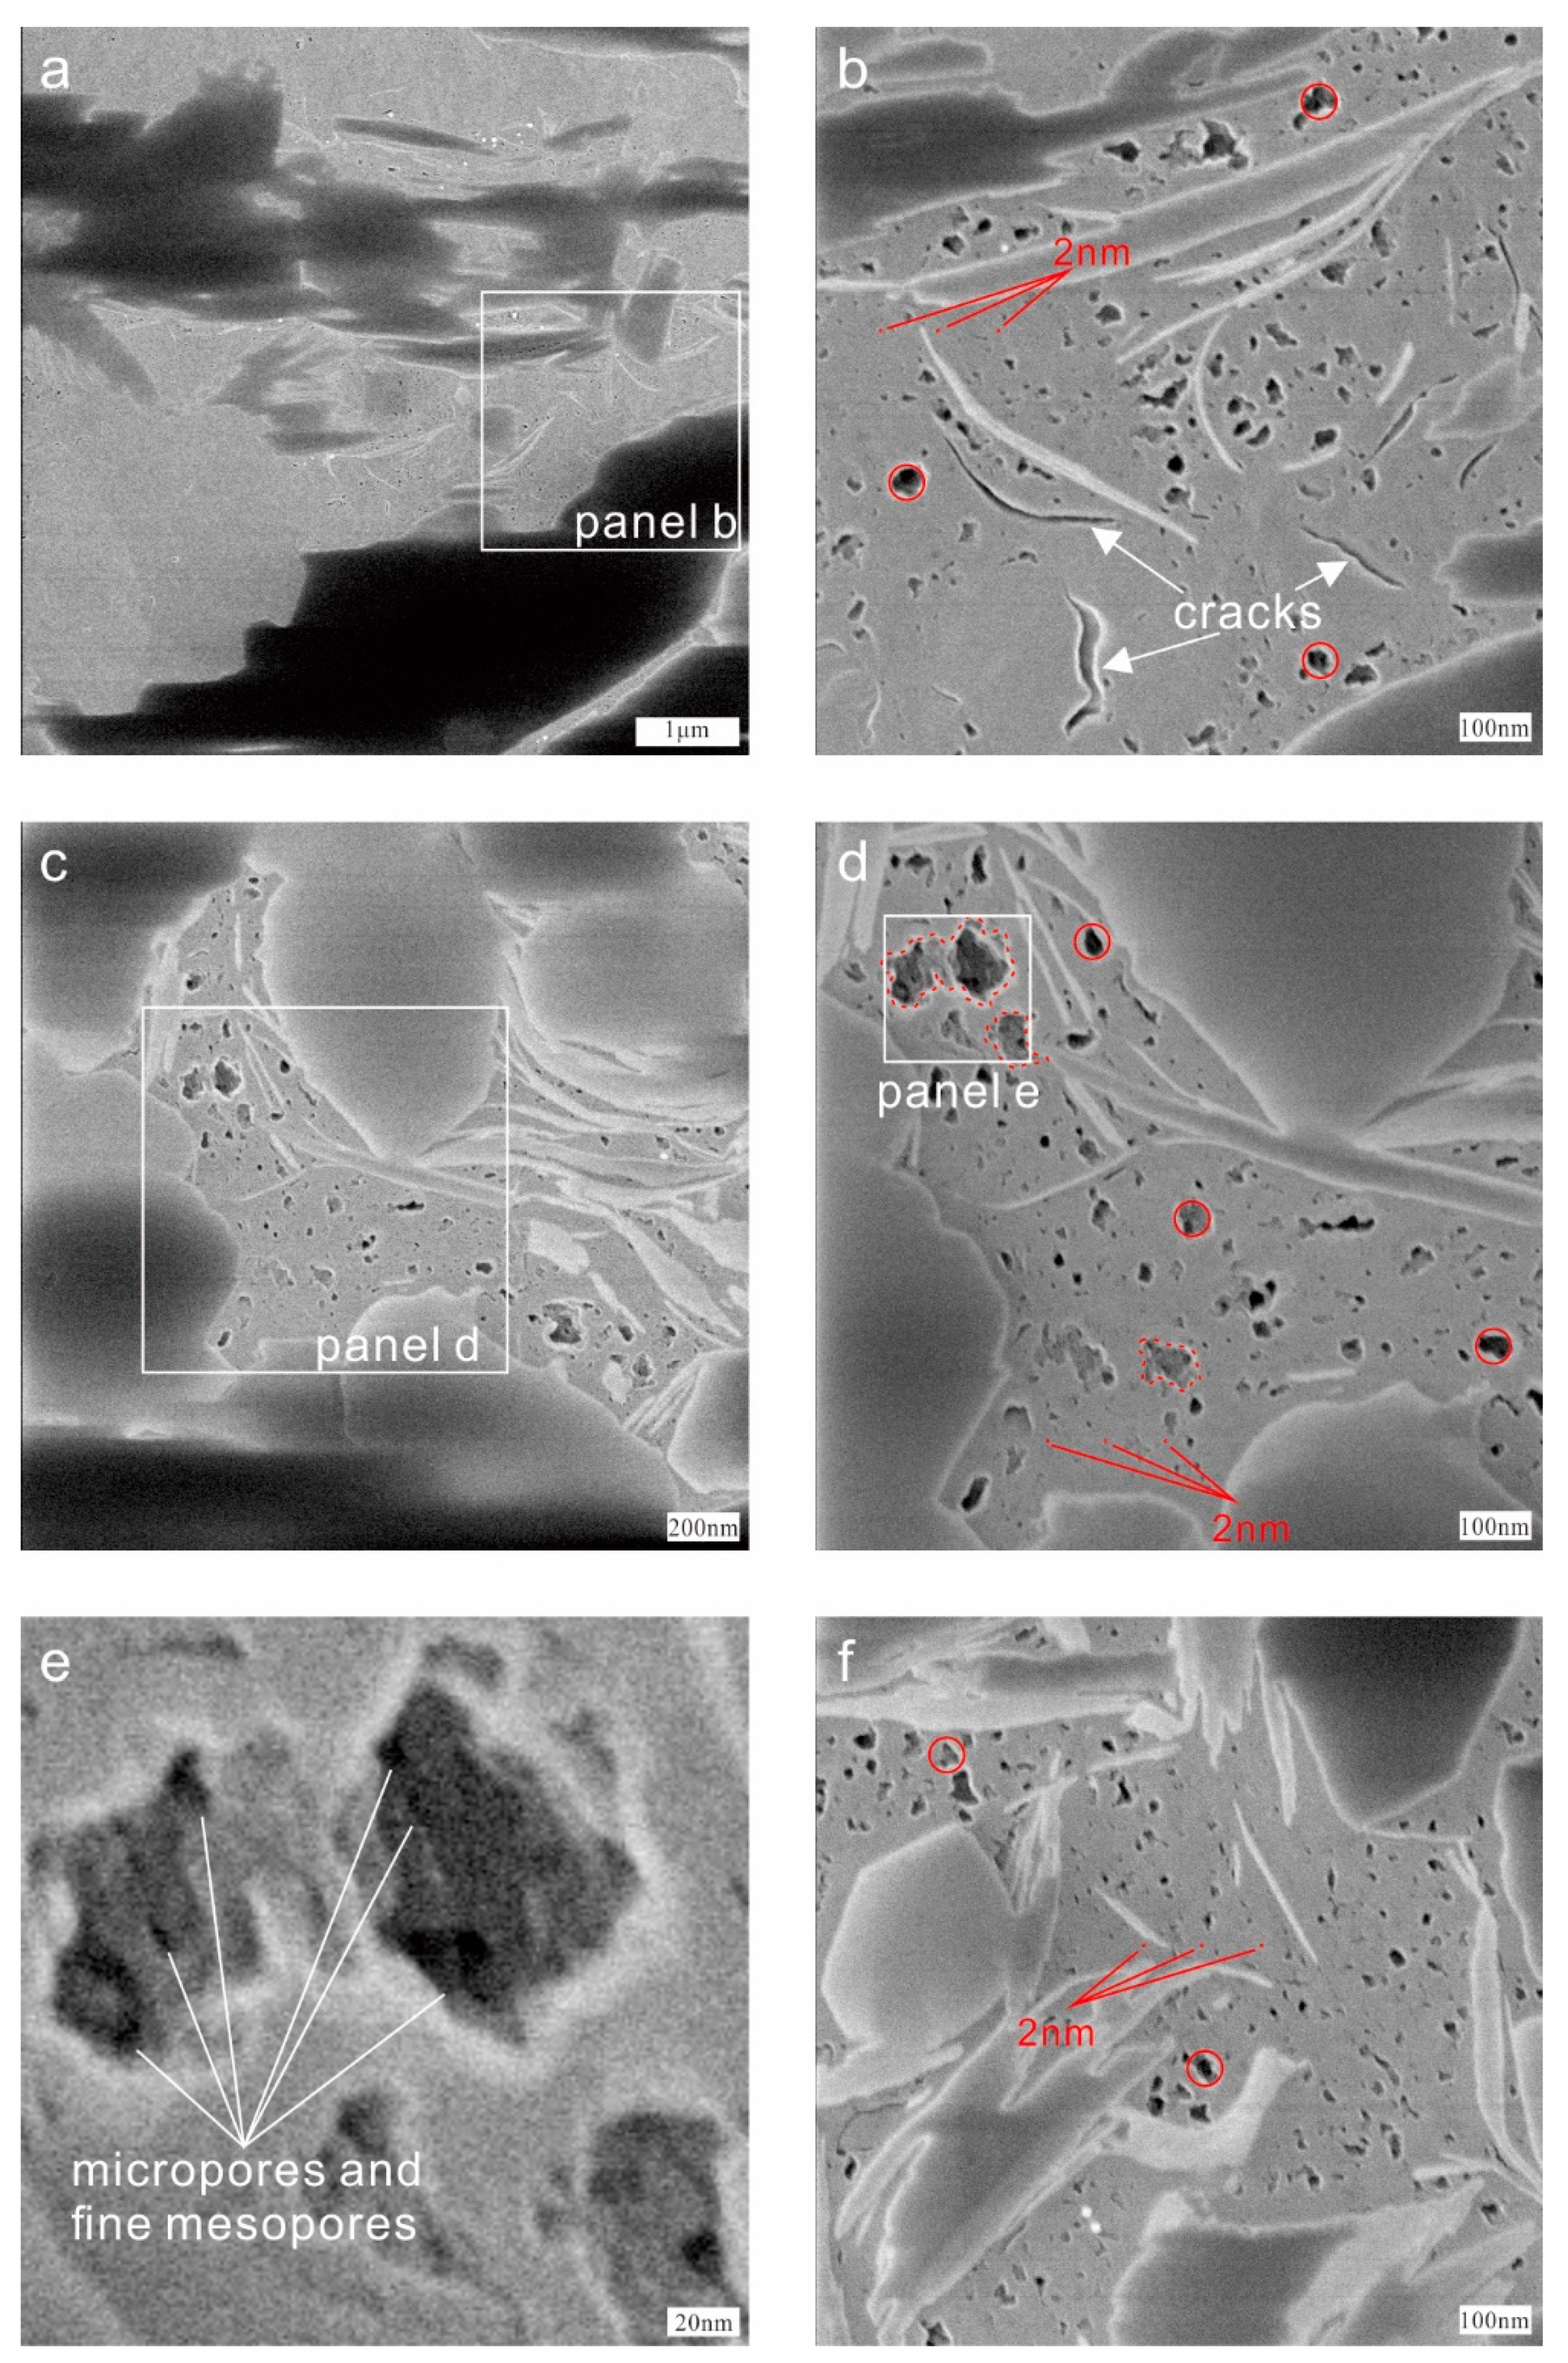
4.4. Pore Structure from HIM

The HIM image processing was performed on the samples of L-1 and L-2, which were selected as the representatives of developed and relatively undeveloped pores, respectively, based on analysis of N2 adsorption. As the reference, the pores with diameter of 2 and 50 nm are shown in Figure 9 and Figure 10. Notice that the red circle has a diameter of 50 nm, while the red dot represents a diameter of 2 nm. These are the two cut-off points for the rule of thirds of pore size by the IUPAC. By this means, we can make direct descriptions of the pore sizes of the two samples. Moreover, the average pore diameters determined by the N2 adsorption experiments in the previous section are directly supported by the HIM images.
The dominant parts under HIM are quartz, clay minerals, and organic matters. However, with relatively low content, the pyrite can be identified easily under HIM due to its framboid shape and high brightness. The gray level of organic matter is close to clay minerals in some images, but it is easy to distinguish them. Dense pores, especially micropores and mesopores, are usually developed in organic matter. There will be bright sides at the edges of organic matters, which make their outlines more clear. Organic matter pores, rather than mineral-hosted pores, are considered to be the dominant contributors to total porosity and hydrocarbon storage in many organic-rich unconventional reservoirs [60,61,62]. Meanwhile, other types of pores are rarely found under HIM, especially those with diameters below those of macropores. Thus, we focused on the development of organic matter pores of the two samples in this section.
The HIM images of L-1 show a large volume of micropores and fine mesopores developing with associated organic matters, which are usually mixed with clay minerals. These pores mainly show round or oval shapes within organic matters. However, very few slit-like pores also appear at the grain boundaries between organic matters and minerals (Figure 9b), possibly because of the shrinkage of organic matter during the hydrocarbon generation process. Sometimes, these kinds of small cracks can extend into a long fracture by connecting with each other (Figure 9d). Except for when they are mixed with clay minerals, organic matters can also fill into the space between the mineral particles, which are usually characterized by their flat boundaries, such as pyrite and quartz (Figure 9f). These organic pores can be considered to be formed after filling, i.e., secondary pores. It is interesting to note that no pore development was observed in a few organic matters (Figure 9g). Some macropores are formed by the dissolution of minerals such as calcite, which may create large pore spaces (Figure 9h). Generally speaking, the shale sample L-1 has a well-developed pore structure, and is dominated by micropores and fine mesopores.
The phenomenon of organic matters mixing with clay minerals or brittle minerals is more obvious in sample L-2. Compared with L-1, the HIM images of L-2 show limited porosity, with most in the range of coarse mesopores and macropores. Not only are there larger pores, but many cracks caused by shrinkage can also be observed (Figure 10b). Similar to the observations in the L-1 sample, the pore shapes of L-2 are mainly round or nearly round. As some micropores and fine mesopores are found from the walls of large pores (Figure 10d) due to the great depth of field of HIM, it can be proven that micropores may cause irregular surfaces in the walls of larger pores [6]. This is interpreted as being because densely small pores produced in a certain area will connect to become larger pores during the process of hydrocarbon generation. To sum up, the pore size of L-2 is larger than that in L-1, which is the same conclusion as in the N2 adsorption experiment.

5. Discussion

The observation of HIM images does not correspond very well to the division of developed and undeveloped pore structures based on analysis of N2 adsorption. For instance, sample L-2 has larger pore size according to the HIM images (Figure 10), while its pore volume and surface area are both the lowest among all the five samples. Furthermore, it was found that between the sample L-1 and L-2, with undeveloped and developed macropores respectively, the gap in the total volume is not as large as the difference in surface area. Considering that there are only slight differences in mineral components between the five samples, we assume that the pore structure is least affected by mineral components. Furthermore, the pores observed in the HIM images are mainly related to organic matter. Thus, the results can be explained by the effect of organic matter content in one way.
The diagram of pore volume and surface area versus TOC content is shown below (Figure 11). There is a moderate-to-good positive correlation between the TOC contents and pore volumes as well as pore surface areas of samples. One problem is that the trend is less obvious, due to limited sample quantity. The figure suggests that, as the main carrier of pores, the amount of organic matter is the major factor affecting pore volume and surface area. Thus, the observed developed large pores may influence the pore size distribution proportions of shales, leading to higher ratios of macropores. However, the contribution of macropores to the surface area is small. On the other hand, macropores can contribute to the total pore volume, but are limited by their quantity. Namely, their effect on pore volume and surface area is not as prominent as that of the TOC content.
Based on the nitrogen adsorption data, the calculated pore volume and surface area versus fractal dimension was drawn as follows (Figure 12). As shown in the diagram, the fractal dimension D2 calculated from the data of the relative pressure range from 0.5 to 1 is greater than D1 for each sample. This means that larger pores have rougher inner surfaces and more complex pore structures. This can be verified by the observation that micropores were found to cause irregular surfaces on the walls of larger pores from HIM images (Figure 10e).
In addition, a good positive correlation between pore structure parameters and fractal dimensions was obtained (Figure 12). The positive relationships are consistent with previous studies and suggest that shale samples with higher values of fractal dimension tend to have a greater surface area and larger pore volume [26,63]. In general, the pore size distribution and HIM images show us the well-developed mesopores or even micropores in the samples. Furthermore, the huge pore surface area means enormous numbers of these small pores, which greatly increase the complexity of the pore structure, leading to high fractal dimensions. Above all, this means good hydrocarbon storage capacity and development potential of the shales. Nevertheless, to test this conclusion, more experimental and analytical works are needed because of the limited sample quantity and the strong anisotropism of shale.
Compared with the important shale blocks in China, especially the Fuling shale gas field not far away, the samples of the Laifeng–Xianfeng Block show lower values of pore volume and pore surface area [48,64]. It was found that the pores are not well developed from both the microscopy and nitrogen adsorption experiment results, though both of the pore features maintain an upward trend with the increase of organic matter content.

6. Conclusions

In this paper, the pore-structure characteristics of Lower Silurian Longmaxi Formation shales collected from Well LD1 of the Laifeng–Xianfeng Block in the Upper Yangtze region were investigated using ultra-low N2 adsorption and helium ion microscope experiments. Colligating the above results and analysis, some conclusions can be drawn as follows:
(1) The pore volume, surface area, and pore size distribution of the samples in Well LD1 were calculated based on N2 adsorption data. The results were verified by HIM images, which can provide a visual appreciation of pores. These two experiments both indicated that mesopores are the main component of the pore structure, although there are some slight differences in pore size between the samples.
(2) The TOC contents of shales contribute significantly to the pore volume and surface area. This demonstrates that organic matter is the main carrier of pores in shale, in other words, organic pores are the principal parts of the pore structures.
(3) Based on the N2 adsorption data, two different fractal dimensions, D1 and D2, were determined. The value of D2, calculated from the data of the relative pressure range from 0.5 to 1, is greater than D1. This suggests that larger pores have larger fractal dimensions, which represent more complex pore structures and rougher surfaces.
(4) There is a positive correlation between fractal dimension and pore structure parameters, including pore volume and surface area. The increase of these two parameters essentially means a greater number of pores, as well as a more complex pore structure. This eventually leads to an increase of the fractal dimension, and also means stronger adsorption capacity of the shale.

Author Contributions

Conceptualization, Y.J. and C.H.; methodology, C.H.; software, K.Y.; validation, H.Z. and Y.Q.; investigation, C.H. and H.Z.; resources, H.Z., K.Y., and Y.S..; data curation, C.H. and Y.Q.; writing—original draft preparation, C.H.; writing—review and editing, Y.J., H.Z., Y.Q., Y.S. and L.J.; visualization, C.H. and K.Y.; supervision, Y.J.; project administration, Y.J.

Funding

This research was financially supported by the National Natural Science Foundation of China (Grant No. 41530315, 41372213, 41872160), the National Science and Technology Major Project of China (Grant No. 2016ZX05066), the “Climate Change: Carbon Budget and Related Issues” Strategic Priority Research Program of the Chinese Academy of Sciences (Grant No. XDA05030100), and the Sichuan Science and Technology Support Program (Grant No. 2016JZ0037).

Conflicts of Interest

The authors declare no conflict of interest.

References

  1. Zou, C.; Zhai, G.; Zhang, G.; Wang, H.; Zhang, G.; Li, J.; Wang, Z.; Wen, Z.; Ma, F.; Liang, Y.; et al. Formation, distribution, potential and prediction of global conventional and unconventional hydrocarbon resources. Pet. Explor. Dev. 2015, 42, 14–28. [Google Scholar] [CrossRef]
  2. Wang, Q.; Chen, X.; Jha, A.N.; Rogers, H. Natural gas from shale formation–the evolution, evidences and challenges of shale gas revolution in United States. Renew. Sustain. Energy Rev. 2014, 30, 1–28. [Google Scholar] [CrossRef]
  3. Chalmers, G.R.; Bustin, R.M. The organic matter distribution and methane capacity of the Lower Cretaceous strata of Northeastern British Columbia, Canada. Int. J. Coal Geol. 2007, 70, 223–239. [Google Scholar] [CrossRef]
  4. Gasparik, M.; Ghanizadeh, A.; Bertier, P.; Gensterblum, Y.; Bouw, S.; Krooss, B.M. High-pressure methane sorption isotherms of black shales from the Netherlands. Energy Fuels 2012, 26, 4995–5004. [Google Scholar] [CrossRef]
  5. Ross, D.J.K.; Bustin, R.M. The importance of shale composition and pore structure upon gas storage potential of shale gas reservoirs. Mar. Pet. Geol. 2009, 26, 916–927. [Google Scholar] [CrossRef]
  6. Chalmers, G.R.; Bustin, R.M.; Power, I.M. Characterization of gas shale pore systems by porosimetry, pycnometry, surface area, and field emission scanning electron microscopy/transmission electron microscopy image analyses: Examples from the Barnett, Woodford, Haynesville, Marcellus, and Doig units. AAPG Bull. 2012, 96, 1099–1119. [Google Scholar]
  7. Curtis, M.E.; Cardott, B.J.; Sondergeld, C.H.; Rai, C.S. Development of organic porosity in the Woodford Shale with increasing thermal maturity. Int. J. Coal Geol. 2012, 103, 26–31. [Google Scholar] [CrossRef]
  8. Clarkson, C.R.; Solano, N.; Bustin, R.M.; Bustin, A.M.M.; Chalmers, G.R.L.; He, L.; Melnichenko, Y.B.; Radliński, A.P.; Blach, T.P. Pore structure characterization of North American shale gas reservoirs using USANS/SANS, gas adsorption, and mercury intrusion. Fuel 2013, 103, 606–616. [Google Scholar] [CrossRef]
  9. Wang, G.; Ju, Y.; Yan, Z.; Li, Q. Pore structure characteristics of coal-bearing shale using fluid invasion methods: A case study in the Huainan-Huaibei Coalfield in China. Mar. Pet. Geol. 2015, 62, 1–13. [Google Scholar] [CrossRef]
  10. Cai, J.; Lin, D.; Singh, H.; Wei, W.; Zhou, S. Shale gas transport model in 3D fractal porous media with variable pore sizes. Mar. Pet. Geol. 2018, 98, 437–447. [Google Scholar] [CrossRef]
  11. Hao, F.; Zou, H.; Lu, Y. Mechanisms of shale gas storage: Implications for shale gas exploration in ChinaMechanisms of Shale Gas Storage. AAPG Bull. 2013, 97, 1325–1346. [Google Scholar] [CrossRef]
  12. Zou, C.; Dong, D.; Wang, S.; Li, J.; Li, X.; Wang, Y.; Li, D.; Cheng, K. Geological characteristics and resource potential of shale gas in China. Pet. Explor. Dev. 2010, 37, 641–653. [Google Scholar] [CrossRef]
  13. Afsharpoor, A.; Javadpour, F.; Wu, J.; Ko, L.T.; Liang, Q. Network modeling of liquid flow in Yanchang shale. Interpretation 2017, 5, SF99–SF107. [Google Scholar] [CrossRef]
  14. Ju, Y.; Sun, Y.; Tan, J.; Bu, H.; Han, K.; Li, X.; Fang, L. The composition, pore structure characterization and deformation mechanism of coal-bearing shales from tectonically altered coalfields in eastern China. Fuel 2018, 234, 626–642. [Google Scholar] [CrossRef]
  15. Zhu, H.; Ju, Y.; Qi, Y.; Huang, C.; Zhang, L. Impact of tectonism on pore type and pore structure evolution in organic-rich shale: Implications for gas storage and migration pathways in naturally deformed rocks. Fuel 2018, 228, 272–289. [Google Scholar] [CrossRef]
  16. Qi, Y.; Ju, Y.; Huang, C.; Zhu, H.; Bao, Y.; Wu, J.; Meng, S.; Chen, W. Influences of organic matter and kaolinite on pore structures of transitional organic-rich mudstone with an emphasis on S2 controlling specific surface area. Fuel 2019, 237, 860–873. [Google Scholar] [CrossRef]
  17. Tan, J.; Horsfield, B.; Mahlstedt, N.; Zhang, J.; Boreham, C.J.; Hippler, D. Natural gas potential of Neoproterozoic and lower Palaeozoic marine shales in the Upper Yangtze Platform, South China: Geological and organic geochemical characterization. Int. Geol. Rev. 2015, 57, 305–326. [Google Scholar] [CrossRef]
  18. Chen, S.; Zhu, Y.; Wang, H.; Liu, H.; Wei, W.; Fang, J. Shale gas reservoir characterisation: A typical case in the southern Sichuan Basin of China. Energy 2011, 36, 6609–6616. [Google Scholar] [CrossRef]
  19. Wang, Y.; Huang, J.; Li, X.; Dong, D.; Wang, S.; Guan, Q. Quantitative characterization of fractures and pores in shale beds of the Lower Silurian, Longmaxi Formation, Sichuan Basin. Nat. Gas Ind. B 2015, 2, 481–488. [Google Scholar] [CrossRef] [Green Version]
  20. Tang, X.; Jiang, Z.; Jiang, S.; Li, Z. Heterogeneous nanoporosity of the Silurian Longmaxi Formation shale gas reservoir in the Sichuan Basin using the QEMSCAN, FIB-SEM, and nano-CT methods. Mar. Pet. Geol. 2016, 78, 99–109. [Google Scholar] [CrossRef]
  21. Yang, R.; He, S.; Hu, Q.; Sun, M.; Hu, D.; Yi, J. Applying SANS technique to characterize nano-scale pore structure of Longmaxi shale, Sichuan Basin (China). Fuel 2017, 197, 91–99. [Google Scholar] [CrossRef]
  22. Hu, J.; Tang, S.; Zhang, S. Investigation of pore structure and fractal characteristics of the Lower Silurian Longmaxi shales in western Hunan and Hubei Provinces in China. J. Nat. Gas Sci. Eng. 2016, 28, 522–535. [Google Scholar] [CrossRef]
  23. Bernard, S.; Horsfield, B.; Schulz, H.M.; Wirth, R.; Schreiber, A.; Sherwood, N. Geochemical evolution of organic-rich shales with increasing maturity: A STXM and TEM study of the Posidonia Shale (Lower Toarcian, Northern Germany). Mar. Pet. Geol. 2012, 31, 70–89. [Google Scholar] [CrossRef]
  24. Lewis, R.; Singer, P.; Jiang, T.; Rylander, E.; Sinclair, S.; Mclin, R.H. NMR T2 distributions in the Eagle Ford shale: Reflections on pore size. In Proceedings of the SPE Unconventional Resources Conference-USA, The Woodlands, TX, USA, 10–12 April 2013; Society of Petroleum Engineers: Richardson, TX, USA, 2013. [Google Scholar]
  25. King, H.E., Jr.; Eberle, A.P.R.; Walters, C.C.; Kliewer, C.E.; Ertas, D.; Huynh, C. Pore architecture and connectivity in gas shale. Energy Fuels 2015, 29, 1375–1390. [Google Scholar] [CrossRef]
  26. Yang, R.; He, S.; Yi, J.; Hu, Q. Nano-scale pore structure and fractal dimension of organic-rich Wufeng-Longmaxi shale from Jiaoshiba area, Sichuan Basin: Investigations using FE-SEM, gas adsorption and helium pycnometry. Mar. Pet. Geol. 2016, 70, 27–45. [Google Scholar] [CrossRef]
  27. Ju, Y.; Huang, C.; Sun, Y.; Wan, Q.; Lu, X.; Lu, S.; He, H.; Wang, X.; Zou, C.; Wu, J.; et al. Nanogeosciences: Research history, current status, and development trends. J. Nanosci. Nanotechnol. 2017, 17, 5930–5965. [Google Scholar] [CrossRef]
  28. Gao, F.; Song, Y.; Li, Z.; Xiong, F.; Chen, L.; Zhang, X.; Chen, Z.; Moortgat, J. Quantitative characterization of pore connectivity using NMR and MIP: A case study of the Wangyinpu and Guanyintang shales in the Xiuwu basin, Southern China. Int. J. Coal Geol. 2018, 197, 53–65. [Google Scholar] [CrossRef]
  29. Yu, K.; Shao, C.; Ju, Y.; Qu, Z. The genesis and controlling factors of micropore volume in transitional coal-bearing shale reservoirs under different sedimentary environments. Mar. Pet. Geol. 2019, 102, 426–438. [Google Scholar] [CrossRef]
  30. Huang, C.; Ju, Y.; Xu, T.; Sun, Y.; Jia, T.; Neupane, B.; Han, K.; Qi, Y.; Zhu, H.; Cai, J. Full-scale and multi-method combined characterization of micro/nano pores in organic shale. J. Nanosci. Nanotechnol. 2017, 17, 6634–6644. [Google Scholar] [CrossRef]
  31. Pfeifer, P.; Avnir, D. Chemistry in noninteger dimensions between two and three. I. Fractal theory of heterogeneous surfaces. J. Chem. Phys. 1983, 79, 3558–3565. [Google Scholar] [CrossRef]
  32. Krohn, C.E. Fractal measurements of sandstones, shales, and carbonates. J. Geophys. Res. Solid Earth 1988, 93, 3297–3305. [Google Scholar] [CrossRef]
  33. Cai, Y.; Liu, D.; Pan, Z.; Yao, Y.; Li, J.; Qiu, Y. Pore structure and its impact on CH4 adsorption capacity and flow capability of bituminous and subbituminous coals from Northeast China. Fuel 2013, 103, 258–268. [Google Scholar] [CrossRef]
  34. Bu, H.; Ju, Y.; Tan, J.; Wang, G.; Li, X. Fractal characteristics of pores in non-marine shales from the Huainan coalfield, eastern China. J. Nat. Gas Sci. Eng. 2015, 24, 166–177. [Google Scholar] [CrossRef]
  35. Yao, Y.; Liu, D.; Tang, D.; Tang, S.; Huang, W. Fractal characterization of adsorption-pores of coals from North China: An investigation on CH4 adsorption capacity of coals. Int. J. Coal Geol. 2008, 73, 27–42. [Google Scholar] [CrossRef]
  36. Mahamud, M.M.; Novo, M.F. The use of fractal analysis in the textural characterization of coals. Fuel 2008, 87, 222–231. [Google Scholar] [CrossRef]
  37. Yang, F.; Ning, Z.; Liu, H. Fractal characteristics of shales from a shale gas reservoir in the Sichuan Basin, China. Fuel 2014, 115, 378–384. [Google Scholar] [CrossRef]
  38. Pan, J.; Niu, Q.; Wang, K.; Shi, X.; Li, M. The closed pores of tectonically deformed coal studied by small-angle X-ray scattering and liquid nitrogen adsorption. Microporous Mesoporous Mater. 2016, 224, 245–252. [Google Scholar] [CrossRef]
  39. Wang, P.; Jiang, Z.; Chen, L.; Yin, L.; Li, Z.; Zhang, C.; Tang, X.; Wang, G. Pore structure characterization for the Longmaxi and Niutitang shales in the Upper Yangtze Platform, South China: Evidence from focused ion beam–He ion microscopy, nano-computerized tomography and gas adsorption analysis. Mar. Pet. Geol. 2016, 77, 1323–1337. [Google Scholar] [CrossRef]
  40. Zhou, L.; Kang, Z. Fractal characterization of pores in shales using NMR: A case study from the Lower Cambrian Niutitang Formation in the Middle Yangtze Platform, Southwest China. J. Nat. Gas Sci. Eng. 2016, 35, 860–872. [Google Scholar] [CrossRef]
  41. Stevens, S.H.; Moodhe, K.D.; Kuuskraa, V.A. China shale gas and shale oil resource evaluation and technical challenges. In Proceedings of the SPE Asia Pacific Oil and Gas Conference and Exhibition, Jakarta, Indonesia, 22–24 October 2013; Society of Petroleum Engineers: Richardson, TX, USA, 2013. [Google Scholar]
  42. Guo, T.; Zhang, H. Formation and enrichment mode of Jiaoshiba shale gas field, Sichuan Basin. Pet. Explor. Dev. 2014, 41, 31–40. [Google Scholar] [CrossRef]
  43. Zhu, H.; Ju, Y.; Huang, C.; Han, K.; Qi, Y.; Shi, M.; Yu, K.; Feng, H.; Li, W.; Ju, L.; et al. Pore structure variations across structural deformation of Silurian Longmaxi Shale: An example from the Chuandong Thrust-Fold Belt. Fuel 2019, 241, 914–932. [Google Scholar] [CrossRef]
  44. Zou, C.; Wei, G.; Xu, C.; Du, J.; Xie, Z.; Wang, Z.; Hou, L.; Yang, C.; Li, J.; Yang, W. Geochemistry of the Sinian–Cambrian gas system in the Sichuan Basin, China. Org. Geochem. 2014, 74, 13–21. [Google Scholar] [CrossRef]
  45. Huang, J.; Zou, C.; Li, J.; Dong, D.; Wang, S.; Wang, S.; Cheng, K. Shale gas generation and potential of the lower Cambrian Qiongzhusi formation in the southern Sichuan Basin, China. Pet. Explor. Dev. 2012, 39, 75–81. [Google Scholar] [CrossRef]
  46. Dai, J.; Zou, C.; Liao, S.; Dong, D.; Ni, Y.; Huang, J.; Wu, W.; Gong, D.; Huang, S.; Hu, G. Geochemistry of the extremely high thermal maturity Longmaxi shale gas, southern Sichuan Basin. Org. Geochem. 2014, 74, 3–12. [Google Scholar] [CrossRef]
  47. Wang, G.; Ju, Y.; Huang, C.; Long, S.; Peng, Y. Longmaxi-Wufeng Shale lithofacies identification and 3-D modeling in the northern Fuling Gas Field, Sichuan Basin. J. Nat. Gas Sci. Eng. 2017, 47, 59–72. [Google Scholar] [CrossRef]
  48. Wang, R.; Hu, Z.; Sun, C.; Liu, Z.; Zhang, C.; Gao, B.; Du, W.; Zhao, J.; Tang, W. Comparative analysis of shale reservoir characteristics in the Wufeng-Longmaxi (O3 w-S1 l) and Niutitang (Є1 n) Formations: A case study of the Wells JY1 and TX1 in southeastern Sichuan Basin and its neighboring areas, southwestern China. Interpretation 2018, 6, 1–46. [Google Scholar] [CrossRef]
  49. Li, B.; Wei, G.; Hong, K.; Peng, C.; Hu, X.; Zhu, L. Evaluation and understanding on the shale gas wells in complex tectonic provinces outside Sichuan Basin, South China: A case study from Well Laiye 1 in Laifeng–Xianfeng Block, Hubei. Nat. Gas Ind. 2016, 36, 29–35, (In Chinese with English Abstract). [Google Scholar]
  50. Jiang, S.; Li, B.; Peng, C.; Peng, C.; Hu, X.; Hong, K.; Zhu, L. Characteristics and gas content of Wufeng-Longmaxi Formation shale in the Well LD2 of the Laifeng-Xianfeng block. Geol. Explor. 2018, 54, 203–210, (In Chinese with English Abstract). [Google Scholar]
  51. Xu, Z.; Yao, G.; Huang, L.; Dong, Y.; Wang, P.; Yu, G. Risk analysis and play evaluation of marine residual basins in South China. Pet. Geol. Exp. 2013, 35, 9–16, 23, (In Chinese with English Abstract). [Google Scholar]
  52. Liu, H.; Wang, H. Ultra-low water saturation characteristics and the identification of over-pressured play fairways of marine shales in South China. Nat. Gas Ind. 2013, 33, 140–144, (In Chinese with English Abstract). [Google Scholar]
  53. Nie, H.; Tang, X.; Bian, R. Controlling factors for shale gas accumulation and prediction of potential development area in shale gas reservoir of South China. Acta Pet. Sin. 2009, 30, 484–491, (In Chinese with English Abstract). [Google Scholar]
  54. Chen, K.; Zhang, J.; Tang, X. Gas Content Logging Evaluation of Lower Silurian Longmaxi Shale in Western Hunan-Hubei. Spec. Oil Gas Reserv. 2016, 23, 16–20, 151–152, (In Chinese with English Abstract). [Google Scholar]
  55. Rietveld, H.M. Line profiles of neutron powder-diffraction peaks for structure refinement. Acta Crystallogr. 1967, 22, 151–152. [Google Scholar] [CrossRef]
  56. Bustin, R.M.; Bustin, A.M.M.; Cui, A.; Ross, D.; Pathi, V.M. Impact of shale properties on pore structure and storage characteristics. In Proceedings of the SPE Shale Gas Production Conference, Fort Worth, TX, USA, 16–18 November 2008; Society of Petroleum Engineers: Richardson, TX, USA, 2008. [Google Scholar]
  57. Wang, G.; Ju, Y. Organic shale micropore and mesopore structure characterization by ultra-low pressure N2 physisorption: Experimental procedure and interpretation model. J. Nat. Gas Sci. Eng. 2015, 27, 452–465. [Google Scholar] [CrossRef]
  58. Han, Y.; Kwak, D.; Choi, S.; Shin, C.; Lee, Y.; Kim, H. Pore structure characterization of shale using gas physisorption: Effect of chemical compositions. Minerals 2017, 7, 66. [Google Scholar] [CrossRef]
  59. Xi, Z.; Tang, S.; Wang, J.; Yi, J.; Guo, Y.; Wang, K. Pore structure and fractal characteristics of Niutitang shale from China. Minerals 2018, 8, 163. [Google Scholar] [CrossRef]
  60. Loucks, R.G.; Reed, R.M.; Ruppel, S.C.; Jarvie, D.M. Morphology, genesis, and distribution of nanometer-scale pores in siliceous mudstones of the Mississippian Barnett Shale. J. Sediment. Res. 2009, 79, 848–861. [Google Scholar] [CrossRef]
  61. Löhr, S.C.; Baruch, E.T.; Hall, P.A.; Kennedy, M.J. Is organic pore development in gas shales influenced by the primary porosity and structure of thermally immature organic matter? Org. Geochem. 2015, 87, 119–132. [Google Scholar] [CrossRef] [Green Version]
  62. Gu, X.; Mildner DF, R.; Cole, D.R.; Rother, G.; Slingerland, R.; Brantley, S.L. Quantification of organic porosity and water accessibility in Marcellus shale using neutron scattering. Energy Fuels 2016, 30, 4438–4449. [Google Scholar] [CrossRef]
  63. Liu, X.; Xiong, J.; Liang, L. Investigation of pore structure and fractal characteristics of organic-rich Yanchang formation shale in central China by nitrogen adsorption/desorption analysis. J. Nat. Gas Sci. Eng. 2015, 22, 62–72. [Google Scholar] [CrossRef]
  64. Hu, H.; Hao, F.; Lin, J.; Lu, Y.; Ma, Y.; Li, Q. Organic matter-hosted pore system in the Wufeng-Longmaxi (O3w-S11) shale, Jiaoshiba area, eastern Sichuan Basin, China. Int. J. Coal Geol. 2017, 173, 40–50. [Google Scholar] [CrossRef]
Figure 1. The geologic aspects around the research area. (a) Palaeogeographic pattern around the Laifeng–Xianfeng Block in the Sinian-Lower Paleozoic system (modified after [51]). (b) Regional tectonic pattern around the Laifeng–Xianfeng Block (modified after [49]).
Minerals 09 00356 g001
Figure 2. Synthetical stratum histogram of the research area. (a) The simplified stratigraphic column and the location of several high-quality source rocks of South China during the Paleozoic period (modified after [12,51]). (b) The lithological column and the change curve of measured total organic carbon (TOC) values of the Longmaxi Formation in Well LD1 (modified after [54]).
Minerals 09 00356 g002
Figure 3. Low-pressure N2 adsorption isotherms of samples, and a partial enlargement of their low relative pressure section (the area enclosed by a box). P and Po means equilibrium pressure and gas saturation pressure, respectively. Notice that the logarithmic X-axis was used to characterize the differences more clearly between each sample.
Minerals 09 00356 g003
Figure 4. Pore size distribution, defined by differential pore volume analyses.
Minerals 09 00356 g004
Figure 5. Pore size distribution by percent cumulative volume for the five selected samples in Table 1. Notice that we use logarithmic coordinates on the X-axis.
Minerals 09 00356 g005
Figure 6. Pore size distribution by percent cumulative surface area for the five selected samples in Table 1. Notice that we use logarithmic coordinates on the X-axis.
Minerals 09 00356 g006
Figure 7. Fractal dimension calculation results with lnV versus ln(ln(Po/P)) from N2 adsorption isotherms. All the data points on the adsorption curve are shown in this figure. The fractal diameter calculated from the slope of the fitting line, which was made from the black data points of each diagram, is invalid and meaningless. The red data points were used to make the fitting line. The relevant results were shown in the next figure. R2 is the correlation coefficient.
Minerals 09 00356 g007
Figure 8. Fractal dimension calculation results with lnV versus ln(ln(Po/P)) from N2 adsorption isotherms (P/Po from 0.01 to 1). Notice that we use different shapes of points to represent the fitting data of two parts. The hollow rectangles denote the fractal dimension D1, and the hollow circles indicate the fractal dimension D2. R2 is the correlation coefficient.
Minerals 09 00356 g008
Figure 9. Helium ion microscope (HIM) images of sample L-1, showing abundant porosity with a wide range in the size of micropores and fine mesopores. (a,b): Densely developed organic pores with a few slit-like pores forming between organic matter and clay minerals; (c,d): Banded organic matter formed by the compaction process. Some directionally distributed pores and fractures are developed in the organic matter; (e,f): The organic matter between the particles of framboidal pyrite, and the pores within it; (g): Organic matter without pore development; (h): Well-developed pores less than ten nanometers in diameter. Some large pores were also formed by dissolution of mineral particles.
Minerals 09 00356 g009
Figure 10. Helium ion microscope (HIM) images of sample L-2, showing abundant porosity with a wide range in the size of coarse mesopores and macropores. (a,b): Many cracks caused by shrinkage can be obtained within the organic matter; (c,d): The organic matter mixed with clay minerals and brittle minerals. There are some small pores developing at the walls of larger pores (circled by a red dashed line); (e): Many micropores and fine mesopores on the inner walls of macropores; (f): Well-developed organic pores, most of which are coarse mesopores.
Minerals 09 00356 g010
Figure 11. Relationships between pore structure parameters and TOC contents (mass fraction). (a) BJH volume; (b) BET surface area. R2 is the correlation coefficient.
Minerals 09 00356 g011
Figure 12. Relationships between pore structure parameters and fractal dimension (mass fraction). (a) BJH volume; (b) BET surface area. The hollow rectangles denote the fractal dimension D1, and the hollow circles indicate the fractal dimension D2. R2 is the correlation coefficient.
Minerals 09 00356 g012
Table 1. The depth, TOC content, and mineral composition (all in wt %) of all the samples in Well LD1.
Sample IDDepth/mTOCQuartzK-FeldsparAnorthoseCalciteDolomitePyriteClay
L-1904.82.1446.61.56.91.2/6.037.8
L-2915.30.8048.93.916.74.76.52.017.3
L-3933.21.2148.54.412.45.24.12.123.3
L-4943.42.3748.93.013.72.72.43.925.4
L-5943.81.9847.50.41.37.42.42.938.1
Table 2. Pore parameters of samples calculated from N2 adsorption data.
Sample IDVBJH (cm3/g)SBET (m2/g)Average Pore Diameter (nm)
L-10.05216.6213.7
L-20.0294.28627.2
L-30.0264.78222.2
L-40.05818.9613.3
L-50.0385.49227.6
VBJH = pore volume; SBET = pore surface area; BJH = Barrett–Joyner–Halenda; BET = Brunauer–Emmett–Teller.
Table 3. Fractal dimensions obtained from Frenkel–Halsey–Hill (FHH) model.
Sample IDRegion 1 (P/Po = 0–0.5)Region 2 (P/Po = 0.5–1)
Equation 1R2D1Equation 2R2D2
L-1y = −0.398x + 1.2390.99962.602y = −0.345x + 1.210.99222.655
L-2y = −0.576x − 0.0520.99912.424y = −0.51x − 0.1010.99282.49
L-3y = −0.593x + 0.0110.99852.407y = −0.434x + 0.0170.99322.566
L-4y = −0.382x + 1.3720.99872.618y = −0.346x + 1.330.99142.654
L-5y = −0.68x + 0.110.99632.32y = −0.494x + 0.1260.99952.506

