Article

Sequential Bioleaching of Phosphorus and Uranium

VTT Technical Research Centre of Finland Ltd, P.O. Box 1000, FI-02044 Espoo, Finland
*
Author to whom correspondence should be addressed.
Minerals 2019, 9(6), 331; https://doi.org/10.3390/min9060331
Submission received: 31 March 2019 / Revised: 18 May 2019 / Accepted: 24 May 2019 / Published: 28 May 2019
(This article belongs to the Special Issue Recent Advances in Hydro- and Biohydrometallurgy)

Abstract

:
Phosphorus and uranium are both vital elements for society. In recent decades, fears have arisen about the future availability of low-cost phosphorus and uranium. This has resulted in pressure to de-centralize production of both elements by utilizing lower-grade or complex deposits. The research presented here focused on phosphorus-containing apatite ores with uranium impurities; in order to separate uranium by selective and sequential bioleaching before phosphorus leaching. This would create an alternative process route for solvent-extraction, used to remove/recover uranium from the phosphorus acid product of apatite H2SO4 wet process. In this work, it was seen that the used fluorapatite ore required 24 h leaching at pH 1 by H2SO4 to result in 100% leaching yield for phosphorus. As this ore did not contain much uranium, an artificial fluorapatite-uranium ore was prepared by mixing standard uranium ore and fluorapatite. The research with this ore showed that 89% of uranium dissolved in 3 days at pH > 2 and leaching was improved by applying Fe3+ oxidant. In these conditions only 4% of phosphorus was leached. By prolonged (28 days) leaching 95% uranium yield was reached. According to the experiments, the iron in the uranium leach solution would be mainly Fe3+, which allows the use of H2O2 for uranium recovery and then direct use of spent leachate for another uranium leaching cycle. After the dissolution of uranium, 90% of phosphorus was dissolved by decreasing the pH to 1.3. This was done by bioleaching, by utilizing biogenic sulfur oxidation to sulfuric acid.

1. Introduction

The critical importance of phosphorus is due to its use as a fertilizer: in agriculture, there are no substitutes to this essential element [1,2,3]. The annual consumption of phosphorus is predicted to increase from approximately 45 kton (2000) to 55–95 kton P2O5 (2050), mainly due to the expected population increase and elevated future usage in Africa, South America and China [2]. At present, phosphorus is mainly obtained from non-renewable phosphate rock deposits [2,3,4]. In 2016, the global mining of phosphate rock reached 255 Mt, while global reserves were estimated as 70,000 Mt [1]. Therefore, with the current mining rate, the phosphate rock reserves would be depleted in 275 years, and with a doubled consumption rate (maximum consumption increase by 2050 [2,3]), in 137 years. However, in 2009 it was estimated that reserves that can be treated with less than 40 US Dollar (USD)/t were only 15,000 Mt [4,5]. Consequently, the highest-grade phosphate rock reserves would be depleted more rapidly, in 59 years with current consumption (or in 29 years with doubled consumption). Estimating the ore reserve volume, quality and processing costs is challenging, due to different methodology and criteria used with global ore deposits [2,4]. While it can be summarized that total phosphorus depletion is unlikely in the near future, depletion of high-grade ores is possible, having impacts on phosphorus price [2].
Major phosphorus rock deposits are unevenly distributed, occurring mainly in Morocco and North Africa, China and the Middle East [1,4,6]. After the depletion of high-grade reserves of major producers, namely United States (but possibly also China), production is likely to concentrate more ton North Africa (especially Morocco) and Middle East [2,4,6]. This may raise the prices, decrease the supply security and generate geopolitical issues [2,6]. This creates pressure to recover phosphorus from low-grade and complex deposits for those countries that do not have high-grade ores. This may cause process challenges, as seen in the historic phosphate rock mines of Florida due to increased Fe and Al concentrations in feed [4]. In addition to Fe and Al, other typical impurities of phosphorus ores are Mg, Na, U, As, Cd and Cr [7].
A vast majority of phosphate rock ores are apatite minerals from which the phosphorus is usually extracted by a wet process [4,7,8]. In this process, apatite is treated with sulfuric acid, resulting in the dissolution of solid mineral phosphorus to soluble phosphoric acid. Simultaneously, insoluble calcium sulfate, called phosphogypsum waste, is generated and stacked in the vicinities of phosphoric acid plants [7,8]. If not properly managed, it can cause negative environmental effects by releasing contaminated run-off and seepage waters [9,10,11]. The fate of impurities in the wet processes vary. For example, a great majority of uranium ends up to phosphoric acid product and further to fertilizer production [7,12]. It is stated that the uranium enrichment ratio to phosphoric acid is 150% compared to its original concentration in the ore [12]. Removal technologies for uranium from phosphoric acid have been studied in detail; research began in the 1950s [7]. In the late 1970s, solvent extraction technology had reached industrial operations for removing, but also recovering uranium from phosphoric acid plants; however many solvent extraction processes have been shut down due to unfavorable economics [7,13].
Uranium concentration in phosphate rocks varies between 11 and 220 mg/kg [7,14]. According to the estimations, over 10,000 t U per annum is included in phosphoric acid streams, originating from phosphate rock processes [7,13]. This is a remarkable amount compared to total uranium production, reaching 55,975 t U in 2015 [15]. Simultaneously, the highest-grade uranium reserves, i.e., deposits with production costs less than 40 USD/kg U, were only 646,900 t [15], signaling availability for less than 12 years. If new high-grade uranium ore bodies are not found, mining has to focus on poor ores, leading to increased uranium prices. The phosphate rocks are already included in uranium reserves as low-grade/complex ores [15], but with remarkably higher production costs: 1300–6300 USD/kg U [14]. By utilizing processes that recover both phosphorus and uranium from phosphate rock, economic savings would be found, as both elements require similar mining and pre-treatment actions [7]. Estimations of recovering uranium as a by-product from phosphate streams have varied between 60–200 USD/kg U, by using solvent extraction technology [14].
The objective of this research was to study sequential (bio)leaching of uranium and phosphorus from apatite ores. By utilizing a selective uranium pre-leaching step and producing uranium leachate prior to the phosphoric acid step, new process routes may be introduced. For this treatment possibility, it is important to understand dissolution chemistry for the respective elements. Uranium occurs in minerals in tetravalent (U4+) and hexavalent (U6+) oxidation states, uraninite being the most important mineral in the mining industry [16,17,18]. Tetravalent uranium, found in uraninite, has low solubility in mild acids and requires an oxidizing agent for an effective process [16,17]. A typical solution for dissolution is utilizing sulfuric acid and ferric iron oxidant, resulting in oxidation of insoluble U4+ to soluble UO22+, as shown in Equation (1) [17]. The produced UO22+ complexes with sulfate in sulfuric acid media, as shown in Equation (2) [17,18]. This complexation is important for the process, as without sulfate, uranium tends to precipitate due to hydrolysis [18]. In the leaching process, ferric iron is reduced to ferrous iron (Equation (1)) and is therefore oxidized prior to next leaching round with sodium chlorate (NaClO3), pyrolusite (MnO2), hydrogen peroxide (H2O2) or other strong oxidants [16,18]. Use of these chemicals is expensive, may have negative environmental impacts and may increase corrosion and abrasion to the used hydrometallurgical equipment [16].
UO2 + 2Fe3+ → UO22+ + 2Fe2+
UO22+ + nSO42− → UO2(SO4)n2n−2
Another industrially applied hydrometallurgical process for uranium is bioleaching [18,19,20,21,22]. An advantage of bioleaching is that iron-oxidizing bacteria can regenerate Fe3+ from Fe2+ using only oxygen (air) and protons (Equation (3)) [19,20,22]. The proton needed for the biogenic ferric iron regeneration can be obtained by adding commercial sulfuric acid to the oxidation process, or by biogenic oxidation of elemental sulfur by sulfur-oxidizing bacteria (Equation (4)) [19,20,22]. Both iron and protons can be obtained also from pyrite (FeS2) by ferric iron attack (Equations (3) and (4)), originating from the activity of iron-oxidizing bacteria (Equation (3)) [19,23,24]. A pyrite content of >1% has been considered suitable for uranium bioleaching [25].
2Fe2+ + 0.5O2 + 2H+ → 2Fe3+ + H2O
S0 + 1.5O2 + H2O → 2H+ + SO42−
FeS2 + 6Fe3+ + 3H2O → S2O32− + 7Fe2+ + 6H+
S2O32− + 8Fe3+ + 5 H2O → 2SO42− + 8Fe2+ + 10H+
According to the literature, the pH for pitchblende/uraninite leaching should take place at pH 1–2, with ferric iron concentrations between 0.5–3.0 g/L; according to the Pourbaix diagrams UO22+ occurs at a pH of 0.5–3.5 and at Eh > 300 mV [18]. For the apatite, leaching conditions differ from uraninite, signaling that selective pre-leaching of uranium is theoretically possible. Apatite is leached by using high sulfuric acid concentrations [8]. From Equation (7) it is seen that apatite leaching is not dependent of the oxidant [26,27].
Ca5(PO4)3F + 5H2SO4 + 10H2O → 3H3PO4 + 5CaSO4·2H2O + HF
In addition to utilizing bioleaching for preliminary leaching of uranium, bioleaching was also applied for later leaching of phosphorus from low-grade fluorapatite ore. This was done by utilizing elemental sulfur for biogenic sulfuric acid production and subsequent fluorapatite dissolution (Equation (4); Equation (7)). Bioleaching of apatite has not been applied on an industrial scale but studied on a laboratory scale [26,27,28,29].

2. Materials and Methods

2.1. Studied Ores

The ore for experiments was <500 µm particle sized low-grade fluorapatite ore (FA) dominated by magnesioriebeckite, fluorapatite and talc, with 3.6 wt% phosphorus content. The uranium content in FA was very low (7 mg/kg). The other studied ores were obtained by mixing reference uranium ore (RGU-1) prepared by the Canadian Certified Reference Materials Project (CCRMP). The RGU-1 has been prepared by mixing BL-5 standard uranium ore with silica sand to reach a final U content of 400 ± 2.1 mg/kg. The BL-5 ore (and therefore RGU-1) contained plagioclase feldspars, hematite, quartz, calcite and dolomite, chlorite and muscovite; the main uranium-bearing mineral was uraninite. The particle size of RGU-1 was <104 µm [30,31]. A mixture ore of uranium and pyrite (RGU-1-PYR) was prepared by using a pyrite concentrate (particle size of <500 µm, pyrite and pyrrhotite content of 97.4 wt% and 2.5 wt%, respectively). RGU-1-PYR was prepared by mixing RGU-1 (97.5 wt%) and pyrite concentrate (2.5 wt%). This pyrite addition was selected according to previous observations of pyrite requirement [18,25]. A mixture ore of fluorapatite and uranium (RGU-1-FA) was prepared by mixing FA (26 wt%) and RGU-1 (74 wt%) to obtain an artificial ore with a reasonable U and P content, approximately 300 and 9500 mg/kg, respectively. This artificial ore of RGU-1-FA was prepared as the original FA ore and had a very low uranium content. The studied ores and their mixtures are presented in Table 1.

2.2. Leaching Experiments

H2SO4 leaching for FA was performed to understand phosphorus leaching in acidic conditions. Experiments were carried in accordance with the European standard leaching method [32]. Separate subsamples were leached at a fixed solid-to-liquid (S/L) ratio of 10. Subsamples (15.0 ± 0.04 g) of FA were suspended in 135 mL ultrapure water and stirred for 30 min to equilibrate prior to testing initiation. H2SO4 was added to each suspension via automatic titration (Radiometer TIM 845 TitraLab titration workstations and Radiometer pHC 2005-8 electrodes). The maximum rate of acid addition was limited to prevent a temperature increase. Leaching experiments were conducted for 12, 24, and 48 h with the pH fixed at 1.0, 2.0 or 3.0. The H2SO4 titrant concentration was 6.0 M (mol/L), 6.0 M and 3.5 M for pH 1.0, 2.0 and 3.0 experiments, respectively. Solution temperatures remained at 22–25 °C, within the required tolerance of 20 ± 5 °C. After leaching, leachates were vacuum-filtrated (0.45 µm) and analyzed for phosphorus and uranium with ICP-OES (by accredited analytical laboratory Labtium Ltd., Espoo, Finland).
Bioleaching and chemical control tests were executed for RGU-1, RGU-1-PYR and RGU-1-FA ores. The used mixed acidophilic and mesophilic bacterial culture, originally enriched from a sulphide ore mine site [33], contained At. ferrooxidans, At. thiooxidans, At. caldus, L. ferrooxidans and Sulfobacillus thermotolerans. All experiments were conducted in 250 mL shake flasks with 100 mL working volume. The used nutrient media contained 3 g/L (NH4)2SO4, 0.5 g/L K2HPO4, 0.5 g/L MgSO4·7H2O, 0.1 g/L KCl, 0.014 g/L Ca(NO3)2·4H2O [34]. For bioleaching experiments, 10 vol% of inoculum was added to the flasks, while for chemical controls inoculum was replaced by media. Then, iron and sulfur sources were supplemented, where applied. The RGU-1 test was supplemented with 14.9 g/L FeSO4·7H2O; no sulfur source was introduced. The RGU-1-PYR test was not supplemented with any iron or sulfur source (except the pyrite from the sample itself). The RGU-1-FA test was supplemented with 14.9 g/L FeSO4·7H2O and 10 g/L elemental sulfur. Finally, artificial ores, 100 g/L (RGU-1 and RGU-1-FA) and 102.5 g/L (RGU-1-PYR), were added, followed by a pH adjustment to the pH 2.0 with 95% H2SO4. The pH adjustment was continued manually throughout the experiments. The summary of bioleaching (BL) and chemical control (CC) experiments is given in Table 2. During the tests, shake flasks were incubated in a rotary shaker (150 rpm, 30 °C) for 28 days. Sampling was conducted from shake flasks on days 0, 3, 7, 14, 21, and 28, by pipetting 4 mL of leach solution (removed leach solution was compensated by adding 4 mL media), followed by filtration with a syringe and 0.45 µm filter unit (Whatman FP30/0.45 CA-S). The pH and Eh were measured, and phosphate, sulphate and Fe2+ were analyzed spectrophotometrically with Hach-Lange LCK349, LCK353 and LCK320 kits, respectively. Elemental analyses were performed from diluted sample solutions with a High-Resolution Sector Field Inductively Coupled Plasma-Mass Spectrometer (HR ICP-MS, Element 2, Thermo Fisher Scientific, Waltham, MA, USA). Calibration curve and control samples were diluted from ICP-MS Multi-Element Solutions 2 and 4 by SPEX and the control sample was diluted from AccuTraceTM Semi-qualitative Standard (SQS-01-1) and from SPEX Laboratory performance check (LPC-1) standard solutions. Indium was used as an internal standard in all samples, background, calibration and control samples.

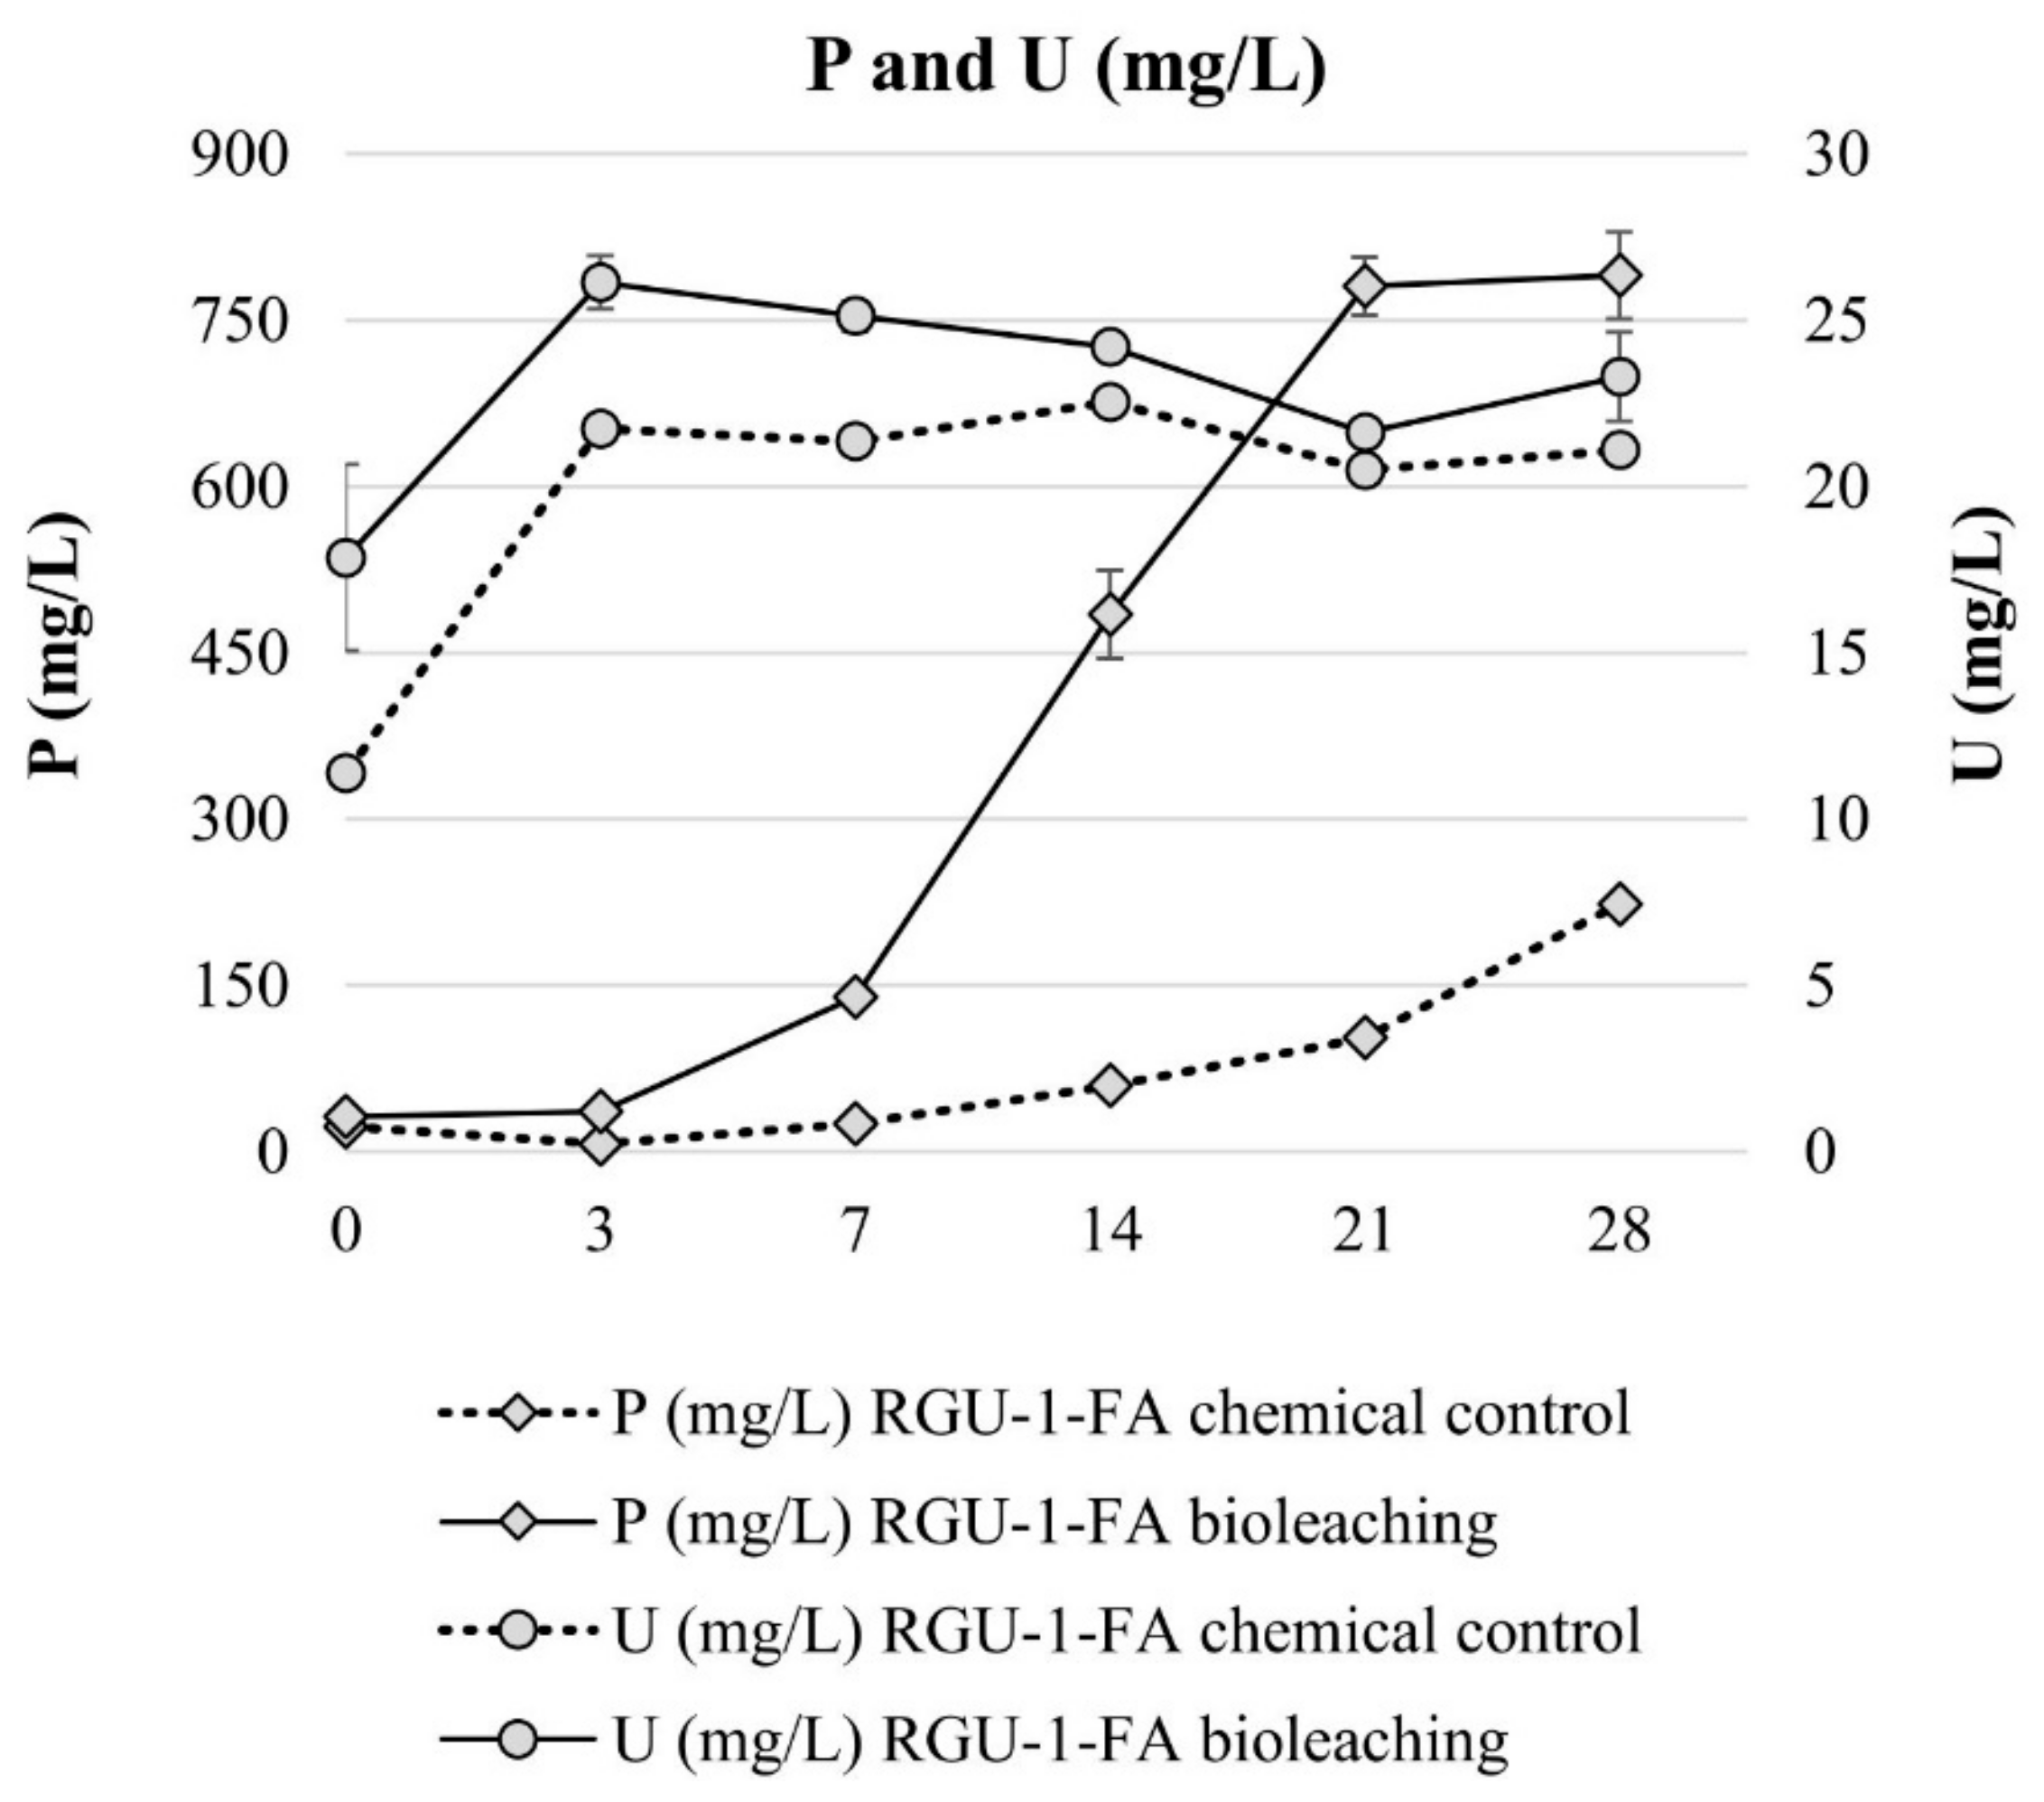
3. Results and Discussion

H2SO4 leaching of FA in different pH values and leaching durations are shown in Figure 1. Complete phosphorus leaching was observed at pH 1.0 when leaching duration was 24 h or longer. Uranium leaching yield varied from 66% to 80% at pH 1.0, depending on the leaching duration. At higher pH 2, leaching yields for phosphorus and uranium were approximately 20%, however, phosphorus required at least 24 h leaching duration to reach this level, while for uranium leaching yields were dramatically decreased when leaching duration prolonged to 48 h. The reason for this was not understood. At the highest tested pH (pH 3), phosphorus leaching yield was only 3%–5%, and for uranium 0%. The acid consumption expressed as kg 95% H2SO4 per one ton of ore, was 490, 133 and 24 kg/t for pH 1, 2 and 3, respectively (24 h test). Therefore, the FA leaching was considered as an acid intensive method, as discussed, in more detailed examinations of the sulfuric acid wet process for apatite [8,35]. The sulfuric acid leaching of FA had no selectivity between phosphorus and uranium.
Bioleaching experiments were started with RGU-1 to understand the effect of ferric iron in uranium leaching, and with RGU-1-PYR to understand if pyrite can serve as iron and sulfur source in the bioleaching system. The bioleaching and chemical control test results are shown in Figure 2. In the inoculated bioleaching experiments an increase in Eh was observed, reaching over the +800 mV level on day 14, while for the chemical control tests Eh remained lower at +500–600 mV. The chemical control experiments resulted in solutions without Fe3+, while in bioleaching experiments with pyrite (RGU-1-PYR) and added FeSO4·7H2O (RGU-1), Fe3+ concentrations rose to 0.5 g/L and 3.0 g/L, respectively. The uranium leaching yield was increasing by the increase of Fe3+ concentration, being 79%–87%, 92% and 98% with chemical control experiments, RGU-1-PYR bioleaching and RGU-1 bioleaching, respectively. In the literature, an Fe3+ concentration of 0.5 g/L has been considered as a minimum for the process [18] and leaching with only sulfuric acid is considered ineffective in the literature [16,17,18]. Controversially, in the experiments conducted here, uranium extraction was considered effective with chemical control experiments without the presence of Fe3+ ions. It has been reported that in uraninite ores U4+ can oxidize to U6+, which is an acid soluble form [17,18]. U6+ can reach up to 60% concentration [18], which would explain the majority of the dissolution in RGU-1 chemical control experiment. The acid consumption expressed as kg 95% H2SO4 per one ton of ore, was 22.1 and 12.9 kg/t for RGU-1 bioleaching and chemical leaching, respectively. It is emphasized that the bioleaching experiment resulted in higher acid consumption due to biogenic oxidation of Fe2+ (supplemented with FeSO4·7H2O) to Fe3+, according to Equation (3) [19,20]. This reaction consumed protons and did not occur in the abiotic chemical control experiment. The acid consumption for RGU-1-PYR bioleaching and chemical leaching was 7.2 and 12.6 kg/t, respectively. In this case, bioleaching resulted in a lower acid consumption, as biological pyrite oxidation produces acidity, as explained in Equations (5) and (6) [19,23]. In this research, it was shown that pyrite can be used in the bioleaching process as a source for iron and sulfur. However, pyrite dissolution in the reported bioleaching experiment was incomplete. This may be due to large particle size (<500 µm) or possible surface passivation of pyrite, as the used concentrate was not re-ground.
Bioleaching experiments with RGU-1-FA were done to understand sequential bioleaching possibility and the efficiency of uranium and phosphorus leaching from the ore. With bioleaching, pH 1.2 was reached by biogenic production of sulfuric acid, while in the chemical control the pH decreased to pH 1.7 (Figure 3). In the bioleaching experiment, the Eh rose to +800 mV after 7 days, and all iron was present as Fe3+ (Figure 3 and Figure 4). However, later the Eh and Fe3+/Fetot ratio started to decrease. This occurred when the pH decreased from 1.9 to 1.4, possibly signaling that on later days the pH was lower than the optimal range for iron-oxidizing bacteria [21]. In the chemical control experiment, Eh remained rather stable at +500–+600 mV (Figure 3) and Fe3+/Fetot ratio remained extremely small, indicating that Fe2+ was the dominating iron species (Figure 4). Major uranium leaching was observed already during the first three days, in both bioleaching and chemical control experiment; in bioleaching, uranium extraction was 10% higher than in chemical control experiment (Figure 5). Phosphorus started to dissolve much later than uranium, in bioleaching test on day 7 (at pH 1.9), reaching a plateau on day 21 (at pH 1.3) (Figure 4). In the chemical control test, phosphorus extraction was very slow. After three days, 89% of uranium was leached (pH 2.2, Eh +650 mV, Fe3+ 1.3 g/L), while the simultaneous phosphorus leaching yield was only 4%, illustrating that the selective leaching of uranium is possible. The final phosphorus leaching yields on day 28 were 90% and 24% for bioleaching and chemical leaching, respectively. The phosphorus bioleaching yield was in accordance with other studies: P yields of 97% from low-grade fluorapatite [28] and 70% from phosphate rock were achieved [27]. However, also lower P yields have been reported, like 28% for P concentrate [28], 20–30% [29] and 12% for phosphate rock [36]. The studies presenting lower phosphorus yields utilized pH ≥ 2.0, which may be the reason for lower dissolution rates. However, mineralogy is also expected to play an important role. In this study, the acid consumption, expressed as kg 95% H2SO4 per one ton of ore, was 14.7 and 36.8 kg/t for RGU-1-FA bioleaching and chemical leaching, respectively. Therefore, it can be considered that supplemented elemental sulfur resulted in biogenic sulfuric acid production and decreased the total acid consumption remarkably.
The results shown here illustrate that uranium and phosphorus can be selectively bioleached from ores that contain both uraninite and fluorapatite. A suitable reagent for precipitation/recovery of uranium to concentrate would be hydrogen peroxide, as it can be applied in sulfate-rich solutions at low pH [37]. We consider that the process does not require iron removal after bioleaching since Fe3+ was the predominant form of iron in leachate, and therefore excess H2O2 is not consumed to oxidize iron. Therefore, after uranium recovery, no regeneration of oxidant (iron) would be needed but spent leachate can be used directly for new uranium leach cycle. Moreover, uranium precipitation would regenerate sulfuric acid as explained in Equation (8) [37].
UO2SO4 + H2O2 + 2H2O → UO4·2H2O + H2SO4
A schematic process flowsheet has been prepared for the sequential bioleaching of phosphorus and uranium (Figure 6). It is highly noteworthy that the proposed process has been tested only with an artificial ore, by combining fluorapatite ore and standard reference uranium ore. For native ores of various types, the amenability and process parameters must be validated separately.

4. Conclusions

In this research, phosphorus and uranium leaching was studied with bioleaching and chemical leaching, with the final objective to separate current leaching process with two-step sequential leaching. The first leaching step aimed to remove uranium to its own pregnant leach solution for recovery and considered to operate at pH ≥2, Eh +650 mV and Fe3+ concentration of ≥1.0 g/L. After uranium extraction and solid-liquid separation, the second leaching step aimed to recover phosphorus from the solid leach residue and was considered to operate at pH ≤ 1.5. Despite not tested here in practice, we consider H2O2 precipitation for uranium recovery from the pregnant leach solution as it allows direct reuse of spent leach solution for uranium extraction. It is noteworthy, that phosphorus bioleaching has not been applied on an industrial scale, and therefore the viability of the process has not been tested. In these experiments, despite the high leaching yield for phosphorus, the duration of the process was rather long.

Author Contributions

Conceptualization, J.M., L.W. and P.K.; methodology, J.M., L.W. and P.K.; validation, formal analysis, investigation, resources, data curation and writing the article, J.M., L.W., T.L. and P.K.; visualization, J.M.

Funding

The authors greatly acknowledge the Academy of Finland, Key project funding Forging ahead with research (Decision number 306079, EcoTail project) for funding the research.

Conflicts of Interest

The authors declare no conflict of interest.

References

  1. U.S. Geological Survey. Mineral Commodity Summaries; U.S. Geological Survey: Reston, VA, USA, 2018; pp. 122–123.
  2. Van Vuuren, D.P.; Bouwman, A.F.; Beusen, A.H.W. Phosphorus demand for the 1970–2100 period: A scenario analysis of resource depletion. Glob. Environ. Chang. 2010, 20, 428–439. [Google Scholar] [CrossRef]
  3. Cordell, D.; Drangert, J.-O.; White, S. The story of phosphorus: Global food security and food for thought. Glob. Environ. Chang. 2009, 19, 292–305. [Google Scholar] [CrossRef]
  4. Van Kauwenbergh, S.J. World Phosphate Rock Reserves and Resources; International Fertilizer Development Center (IFDC): Muscle Shoals, AL, USA, 2010; 50p.
  5. U.S. Geological Survey. Mineral Commodity Summaries; U.S. Geological Survey: Washington, DC, USA, 2009; 2195p.
  6. Cooper, J.; Lombardi, R.; Boardman, D.; Carliell-Marquet, C. The distribution and production of global phosphate rock reserves. Resour. Conserv. Recy. 2011, 57, 78–86. [Google Scholar] [CrossRef]
  7. Beltrami, D.; Cote, G.; Mokhtari, H.; Courtaud, B.; Moyer, B.A.; Chagnes, A. Recovery of Uranium from Wet Phosphoric Acid by Solvent Extraction Processes. Chem. Rev. 2014, 114, 12002–12023. [Google Scholar] [CrossRef] [PubMed]
  8. Abu-Eishah, S.I.; Abu-Jabal, N.M. Parametric study on the production of phosphoric acid by the dehydrate process. Chem. Eng. J. 2001, 81, 231–250. [Google Scholar] [CrossRef]
  9. Komnitsas, K.; Kontopoulus, A.; Lazar, I.; Cambridge, M. Risk Assessment and Proposed Remedial Actions in Coastal Tailings Disposal Sites in Romania. Miner. Eng. 1998, 11, 1179–1190. [Google Scholar] [CrossRef]
  10. Komnitsas, K.; Lazar, I.; Petrisor, I.G. Application of a Vegetative Cover on Phosphogypsum Stacks. Miner. Eng. 1999, 12, 175–185. [Google Scholar] [CrossRef]
  11. Salo, M.; Mäkinen, J.; Yang, J.; Kurhila, M.; Koukkari, P. Continuous biological sulfate reduction from phosphogypsum waste leachate. Hydrometallurgy 2018, 180, 1–6. [Google Scholar] [CrossRef]
  12. International Atomic Energy Agency. Extent of Environmental Contamination by Naturally Occurring Radioactive Material (NORM) and Technological Options for Mitigation; International Atomic Energy Agency: Vienna, Austria, 2003; 198p. [Google Scholar]
  13. International Atomic Energy Agency (IAEA). The Recovery of Uranium from Phosphoric Acid. Report of An Advisory Group Meeting Organized by the International Atomic Energy Agency and Held in Vienna, 16–19 March 1987. Available online: https://www-pub.iaea.org/MTCD/Publications/PDF/te_0533.pdf (accessed on 24 January 2019).
  14. Gabriel, S.; Baschwitz, A.; Mathonnière, G.; Eleouet, T.; Fizaine, F. A critical assessment of global uranium resources, including uranium in phosphate rocks, and the possible impact of uranium shortages on nuclear power fleets. Ann. Nucl. Energy 2013, 58, 213–220. [Google Scholar] [CrossRef]
  15. Nuclear Energy Agency. Uranium 2016: Resources, Production and Demand; Nuclear Energy Agency: Boulogne-Billancourt, France, 2016; 548p. [Google Scholar]
  16. Venter, R.; Boylett, M. The Evaluation of Various Oxidants Used in Acid Leaching of Uranium. Hydrometallurgy Conference 2009, The Southern African Institute of Mining and Metallurgy, 2009. Available online: https://www.saimm.co.za/Conferences/Hydro2009/445-456_Venter.pdf (accessed on 22 March 2019).
  17. Ram, R.; Charalambous, F.A.; McMaster, S.; Pownceby, M.I.; Tardio, J.; Bhargava, S.K. An investigation on the dissolution of natural uraninite ores. Miner. Eng. 2013, 50–51, 83–92. [Google Scholar] [CrossRef]
  18. Muñoz, J.A.; Gonzáles, F.; Blázquez, M.L.; Ballester, A. A study of the bioleaching of Spanish uranium ore. Part I: A review of the bacterial leaching in the treatment of uranium ores. Hydrometallurgy 1995, 38, 39–57. [Google Scholar] [CrossRef]
  19. Bosecker, K. Bioleaching: Metal solubilisation by microorganisms. FEMS Microbiol. Rev. 1997, 20, 591–604. [Google Scholar] [CrossRef]
  20. Rawlings, D.E.; Silver, S. Mining with Microbes. Biotechnology 1995, 13, 773–778. [Google Scholar] [CrossRef]
  21. Rawlings, D.E. Heavy Metal Mining Using Microbes. Annu. Rev. Microbiol. 2002, 56, 65–91. [Google Scholar] [CrossRef]
  22. Abhilash, S.S.; Mehta, K.D.; Kumar, V.; Pandey, B.D.; Pandey, V.M. Dissolution of uranium from silicate-apatite ore by Acidithiobacillus ferrooxidans. Hydrometallurgy 2009, 95, 70–75. [Google Scholar] [CrossRef]
  23. Schippers, A.; Sand, W. Bacterial leaching of metal sulfides proceeds by two indirect mechanisms via thiosulfate or via polysulfides and sulfur. Appl. Environ. Microbiol. 1999, 65, 319–321. [Google Scholar]
  24. Tuovinen, O.H.; Hiltunen, P.; Vuorinen, A. Solubilization of phosphorus, uranium and iron from apatite- and uranium-containing rock samples in synthetic and microbiologically produced acid leach solutions. Eur. J. Appl. Microbiol. Biotechnol. 1983, 17, 327–333. [Google Scholar] [CrossRef]
  25. Umanskii, A.B.; Klyushnikov, A.M. Bioleaching of low grade uranium ore containing pyrite using A. ferrooxidans and A. thiooxidans. J. Radioanal. Nucl. Chem. 2013, 295, 151–156. [Google Scholar] [CrossRef]
  26. Mäkinen, J.; Kinnunen, P.; Arnold, M.; Priha, O.; Sarlin, T. Fluoride Toxicity in Bioleaching of Fluorapatite. Adv. Mater. Res. 2015, 1130, 406–409. [Google Scholar] [CrossRef]
  27. Bhatti, T.M.; Yawar, W. Bacterial solubilisation of phosphorus from phosphate rock containing sulfur-mud. Hydrometallurgy 2010, 103, 54–59. [Google Scholar] [CrossRef]
  28. Priha, O.; Sarlin, T.; Blomberg, P.; Wendling, L.; Mäkinen, J.; Arnold, M.; Kinnunen, P. Bioleaching phosphorus from fluorapatites with acidophilic bacteria. Hydrometallurgy 2014, 150, 269–275. [Google Scholar] [CrossRef]
  29. Xiao, C.Q.; Chi, R.A.; Li, W.S.; Zheng, Y. Biosolubilization of phosphorus from rock phosphate by moderately thermophilic and mesophilic bacteria. Miner. Eng. 2011, 24, 956–958. [Google Scholar] [CrossRef]
  30. Faye, G.H.; Bowman, W.S.; Sutarno, R. Uranium ore BL-5—A Certified Reference Material; CANMET report 1979, 79–4; CANMET, Energy, Mines and Resources Canada: Ottawa, ON, Canada, 1979. [Google Scholar]
  31. IAEA. Preparation of Gamma-ray Spectrometry Reference Materials RGU-1 RGTh-1 and RGK-1 Report; International Atomic Energy Agency: Vienna, Austria, 1987. [Google Scholar]
  32. CEN. Characterization of Waste—Leaching Behaviour Tests—Influence of pH on Leaching with Continuous pH-Control; CEN/TS 14997; CEN: Brussels, Belgium, 2006. [Google Scholar]
  33. Halinen, A.-K.; Rahunen, N.; Kaksonen, A.H.; Puhakka, J.A. Heap bioleaching of a complex sulfide ore Part I: Effect of pH on metal extraction and microbial composition in pH controlled columns. Hydrometallurgy 2009, 98, 92–100. [Google Scholar] [CrossRef]
  34. Silverman, M.P.; Lundgren, D.G. Studies on the chemoautotrophic iron bacterium Ferrobacillus ferrooxidans. I. An improved medium and a harvesting procedure for securing high cell yields. J. Bacteriol. 1959, 77, 642–647. [Google Scholar]
  35. Anwar-ul-Haq, M.; Ahmad, I.; Niazi, M.T.; Arif, M.; Mahmood, K. Evaluation of problematic indigenous phosphate deposits for phosphoric acid manufacture. Fert. Res. 1990, 24, 53–56. [Google Scholar] [CrossRef]
  36. Chi, R.; Xiao, C.; Gao, H. Bioleaching of phosphorus from rock phosphate containing pyrites by Acidithiobacillus ferrooxidans. Miner. Eng. 2006, 19, 979–981. [Google Scholar] [CrossRef]
  37. Gupta, R.; Pandey, V.M.; Pranesh, A.B.; Chakravarty, A.B. Study of an improved technique for precipitation of uranium from eluated solution. Hydrometallurgy 2004, 71, 429–434. [Google Scholar] [CrossRef]
Figure 1. P and U leaching yields during H2SO4 leaching of FA in different pH values for 12, 24 and 48 h, at 22 °C temperature.
Minerals 09 00331 g001
Figure 2. Evolution of pH, Eh and Fe and U concentrations during bioleaching and chemical leaching of RGU-1 and RGU-1-PYR ores. The x-axis represents the leaching duration (days).
Minerals 09 00331 g002
Figure 3. Evolution of pH and Eg during bioleaching and chemical leaching of RGU-1-FA ore; pH and Eh (mV). The x-axis represents the leaching duration (days).
Minerals 09 00331 g003
Figure 4. Evolution of Fe3+ and total Fe concentrations during bioleaching and chemical leaching of RGU-1-FA ore; iron concentrations (mg/L). The x-axis represents the leaching duration (days).
Minerals 09 00331 g004
Figure 5. Evolution of P and U concentrations during bioleaching and chemical leaching of RGU-1-FA ore; phosphorus and uranium concentrations (mg/L). The x-axis represents the leaching duration (days).
Minerals 09 00331 g005
Figure 6. Proposed flowsheet of the sequential bioleaching of phosphorus and uranium.
Minerals 09 00331 g006
Table 1. Used samples and content of their main elements (wt%). FA: fluorapatite ore, RGU-1: reference uranium ore, RGU-1-PYR: mixed pyrite and reference uranium ore, RGU-1-FA: mixed fluorapatite and reference uranium ore.
Element (wt%)FARGU-1RGU-1-PYRRGU-1-FA
P3.6--0.95
U0.00070.0400.0390.029
Fe14.00.0301.23.7
S-0.00201.30.0015
Si14.046.445.337.9
Ca8.70.0300.0292.3
Mg7.00.0100.00981.8
Al4.40.100.101.2
K1.10.00200.00200.29
F0.71--0.19
Table 2. Summary of bioleaching (BL) and chemical control (CC) experiments.
Ore and TestNutrient MediaInoculumIron SourceSulfur SourcepH Control
RGU-1 (CC)YesNoYesNoYes
RGU-1 (BL)YesYesYesNoYes
RGU-1-PYR (CC)YesNoNoNoYes
RGU-1-PYR (BL)YesYesNoNoYes
RGU-1-FA (CC)YesNoYesYesYes
RGU-1-FA (BL)YesYesYesYesYes

