Article

Micrometric Inclusions in Platinum-Group Minerals from Gornaya Shoria, Southern Siberia, Russia: Problems and Genetic Significance

by
Gleb V. Nesterenko
1,
Sergey M. Zhmodik
1,2,*,
Dmitriy K. Belyanin
1,2,
Evgeniya V. Airiyants
1 and
Nikolay S. Karmanov
1
1
Sobolev Institute of Geology and Mineralogy, Siberian Branch of the Russian Academy of Sciences, pr. Akademika Koptyuga 3, 630090 Novosibirsk, Russia
2
Faculty of Geology and Geophysics, Novosibirsk State University, 630090 Novosibirsk, Russia
*
Author to whom correspondence should be addressed.
Minerals 2019, 9(5), 327; https://doi.org/10.3390/min9050327
Submission received: 11 March 2019 / Revised: 16 May 2019 / Accepted: 22 May 2019 / Published: 27 May 2019

Abstract

:
Micrometric inclusions in platinum-group minerals (PGMs) from alluvial placers carry considerable information about types of primary rocks and ores, as well as conditions of their formation and alteration. In the present contribution, we attempt to show, with concrete examples, the significance of the data on the composition and morphology of micrometric inclusions to genetic interpretations. The PGM grains from alluvial placers of the Gornaya Shoria region (Siberia, Russia) were used as the subject of our investigation. In order to determine the chemical composition of such ultrafine inclusions, high-resolution analytical methods are needed. We compare the results acquired by wavelength-dispersive spectrometry (WDS; electron microprobe) and energy-dispersive spectrometry (EDS) and scanning electron microscopy (SEM) methods. The results obtained have good convergence. The EDS method is multi-elemental and more effective for mineral diagnostics in comparison with WDS, which is its certain advantage. The possible conditions for the formation of inclusions and layers of gold, sulfoarsenides and arsenides in Pt3Fe grains, which have an original sub-graphic and layered texture pattern, are discussed. They are the result of solid solution and eutectic decompositions and are associated with the magmatic stages of grain transformation, including the result of the interaction of Pt3Fe with a sulfide melt enriched with Te and As.

1. Introduction

The majority of investigations of the mineralogical and geochemical peculiarities of the platinum-group elements (PGEs) are faced with the problem of determining the composition of micrometric inclusions [1,2,3,4]. In the present contribution, we attempt to show, with concrete examples, the significance of the data on the chemical composition and morphology of micrometric and close to nanometric inclusions to elucidate conditions of the formation of the platinum-group minerals (PGMs) and mineral associations related to them. Determination of the chemical composition of such ultrafine inclusions requires application of high-resolution analytical methods. Scanning electron microscopy with energy-dispersive spectrometry (SEM-EDS) satisfies these requirements fully. When determining the composition of micro-inclusions whose size is smaller than the area of X-ray radiation generation, the composition of the surrounding mineral (“host mineral”) exerts an influence. The impact of this effect may vary significantly. The accounting, appraisal, and removal of this impact constitute separate problems in extracting a “useful” signal against a background of an "interfering" one, or, in other words, ascertainment of the most realistic (“separated”) composition of the mineral inclusions. In some cases, this problem is simple and can be solved with the help of modern tools. In other cases, it is difficult due to the superposition of analytical signals from elements of included and including mineral phases. We demonstrate present-day possibilities for analysis of micro-inclusions in PGM grains, and interpret the results of such analysis. Grains composed of platinum-group minerals were used as the subject of our investigation. The PGM grains originate in alluvial gold placers of Gornaya Shoria (Western Siberia) (Figure 1a–c). Previously, these objects were not investigated using high-spot resolution of the SEM-EDS analysis.
With the development of local methods of analysis (electron-microprobe (EMP), SEM, Secondary-Ion Mass Spectrometry (SIMS)), the number of papers in which great attention is paid to the study of micro- and nano-inclusions in platinum-group minerals has increased significantly. In many cases, data on the composition and morphology of inclusions and on metasomatic changes allow us to draw conclusions about the sources of PGEs and the processes of their transformation [2,5,6,7,8,9,10,11].

2. Geological Setting

The study area, in the Kuznetsk Alatau Ridge, Gornaya Shoria, and Salair Ridge, represent the western part of the Altai-Sayan folded area (ASFA) (
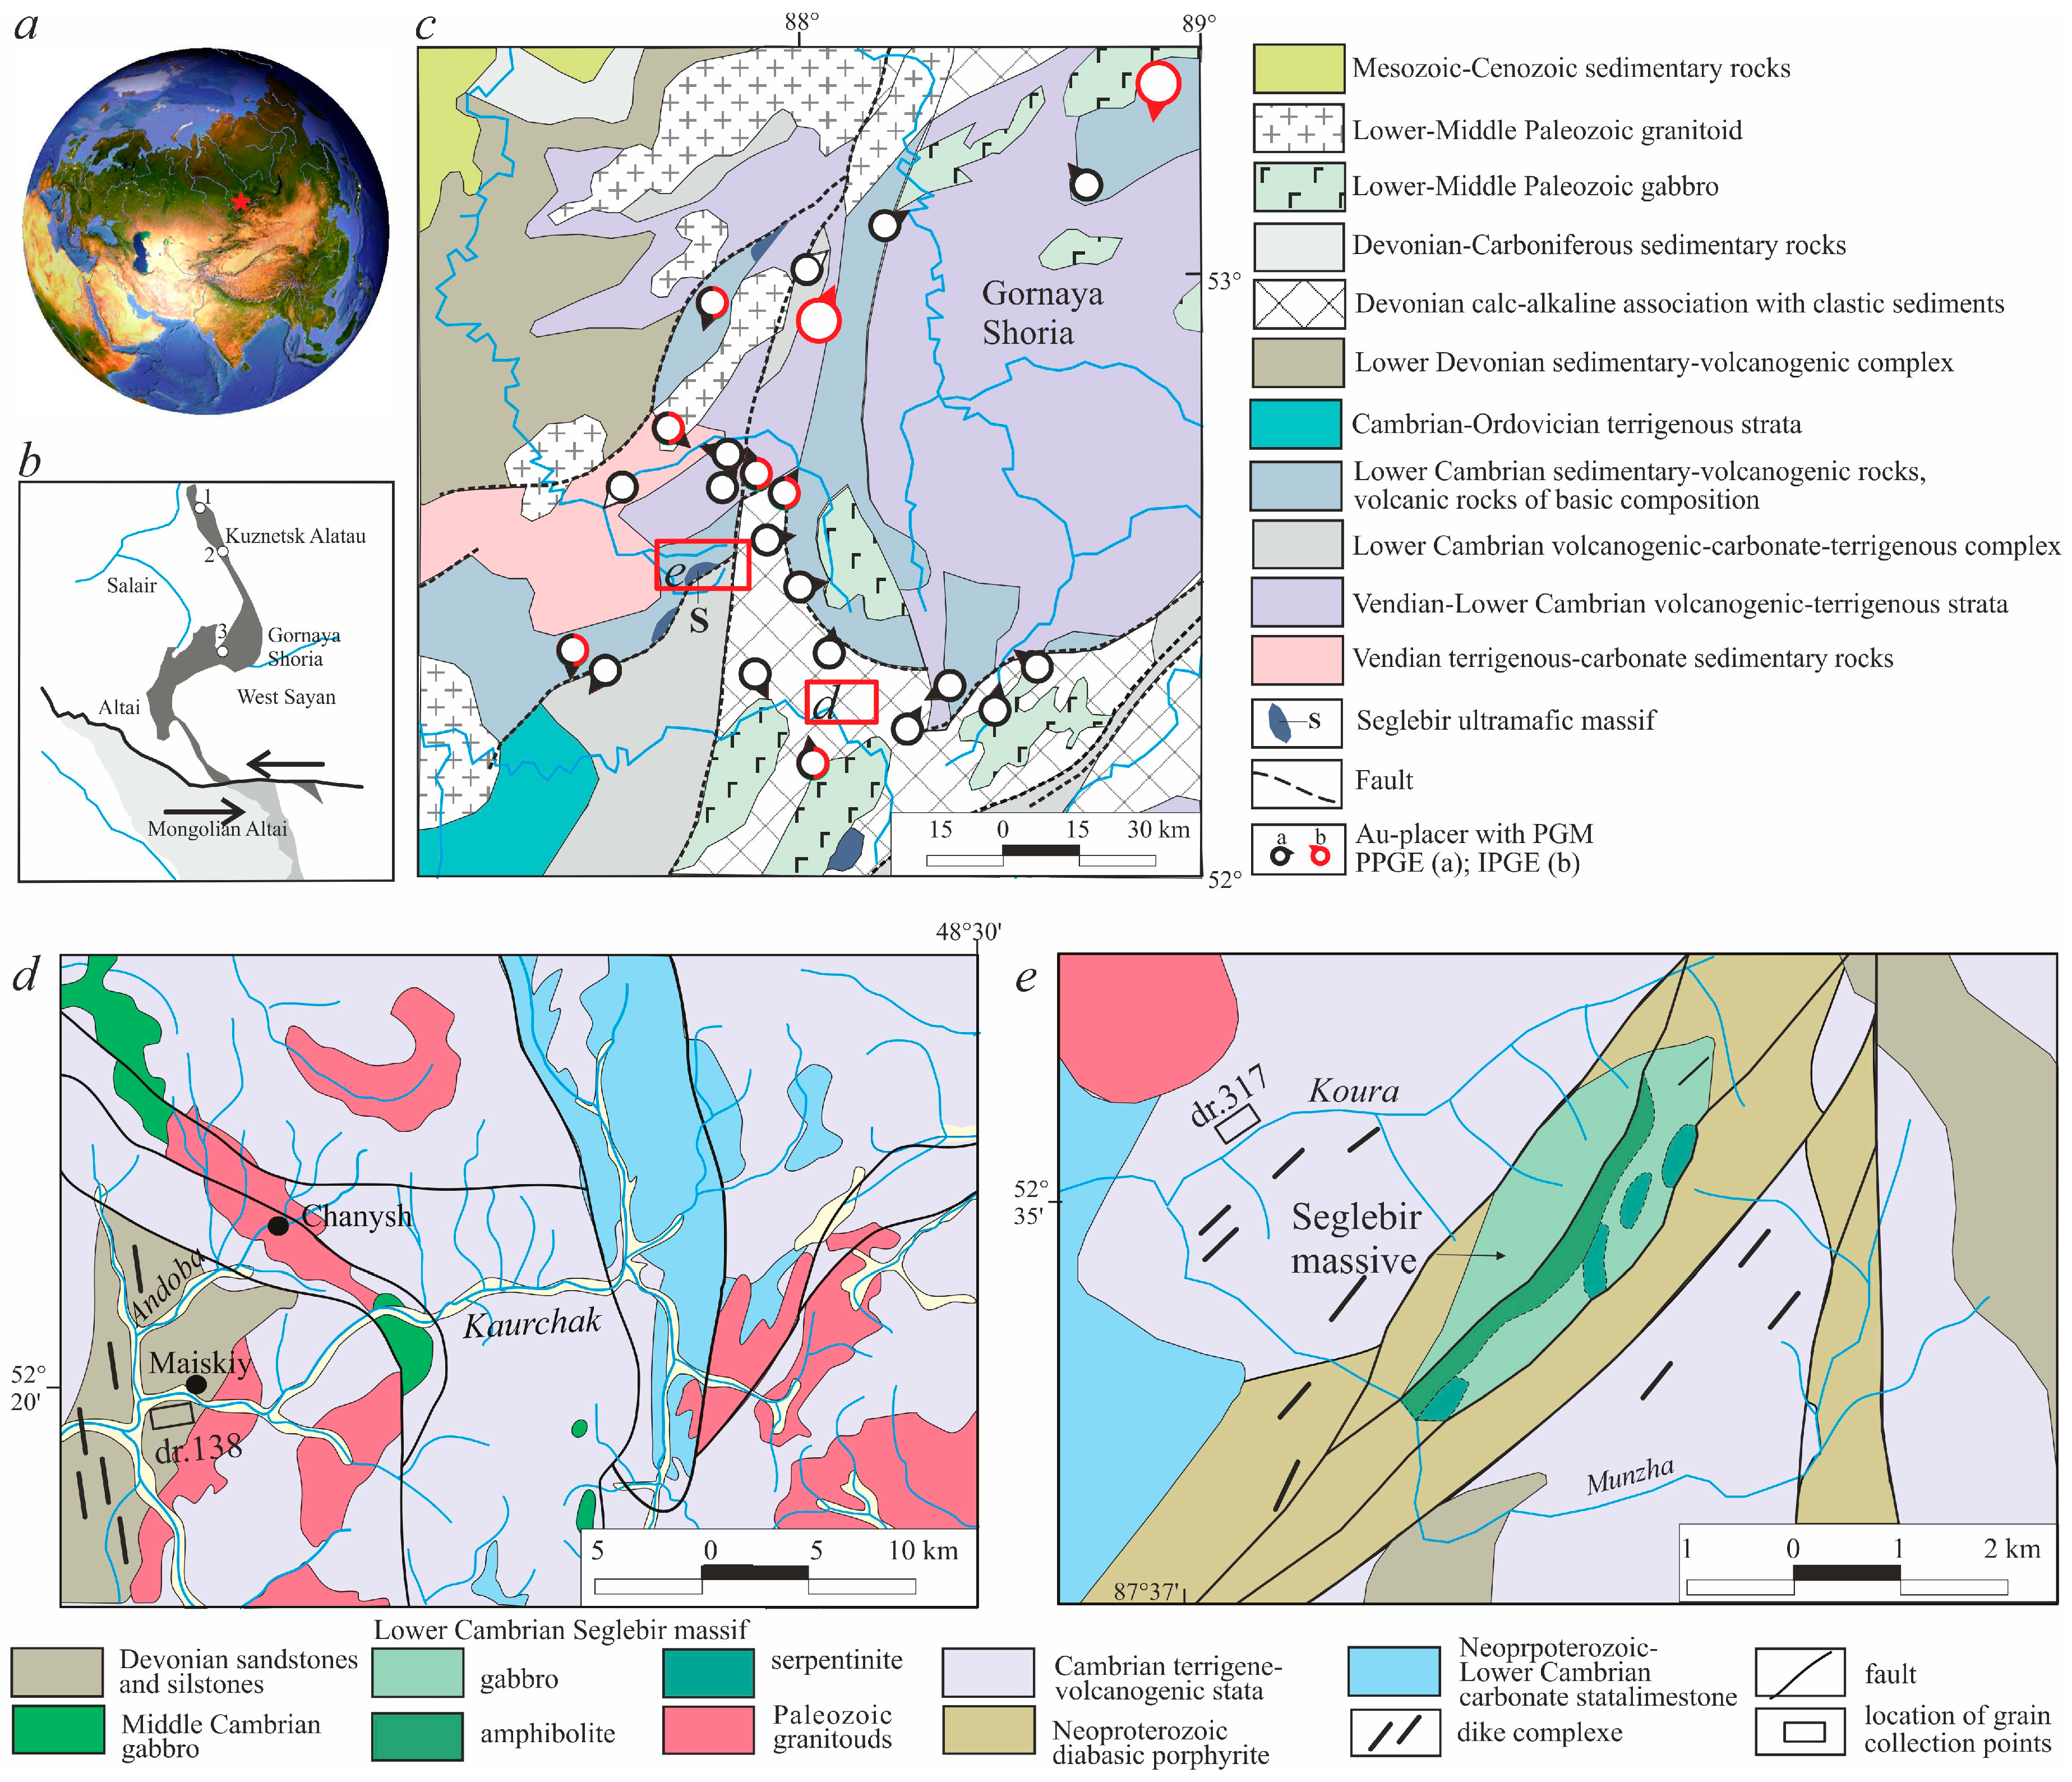
Figure 1) formed during the Caledonian and Hercynian orogenies. Gornaya Shoria is represent a mountain region where the ranges of the North-Eastern Altai, Kuznetsk Alatau Ridges and Salair mountain range converge into a complex knot. Variations in the structure and lithology were controlled by geodynamic processes that led to the formation of oceanic and island-arc complexes, subsequent collision during accretion of the Siberian craton, and protracted plume-related magmatism over the Neoproterozoic–Mesozoic interval [12,13,14,15,16].
Little published information on the primary PGE mineralization in the region is available, and its potential bedrock source is still unknown. The geology of the region is dominated by complexes considered to have potential for PGE mineralization (e.g., Neoproterozoic–Lower Cambrian ophiolite complexes that have variably originated in mid-ocean ridge, back-arc, oceanic island, and island arc settings, or Lower-Middle Paleozoic bimodal volcanic complexes) [17,18,19,20,21,22,23]. The compositions of the placer PGM grains from this region were used to recognize a series of Uralian-Alaskan-type mafic–ultramafic complexes [24]. The Kaigadat massif, in the northwestern part of Kuznetsk Alatau (Figure 1b), was classified as a Uralian-Alaskan-type zoned mafic–ultramafic intrusion on the basis of its bulk composition and the widespread occurrence of Pt–Fe minerals as the dominant PGMs in the alluvium of nearby rivers and streams [25]. Although the ophiolitic nature of the Srednyaya Ters’ massif (Figure 1b) has long been recognized [21,26,27], this has been disputed by some investigators, who argue that this massif represents a layered intrusion. The data of A.E. Izokh [28] show that dunites of the Srednyaya Ters’ massif have high contents of Pd (up to 1 ppm) and Pt (up to 0.6 ppm) (atomic absorption spectrometry). The dunites are relatively enriched in disseminated sulfides and PGMs, represented by a wide variety of Pt and Pd compounds with Sb, As, and Te. Low-grade PGE mineralization (Ru-Ir-Os alloys) was found in serpentinites from the Seglebir massif of Gornaya Shoria [29] and rodingites from the Togul-Sungai massif of the Central Salair Ridge [30,31]. In addition, high Pt and Pd values were identified in early Cambrian chromite-rich ultramafic rocks, several layered peridotite–gabbro massifs, and carbonaceous schists of some Late Riphean, Late Vendian and Early Cambrian complexes of the Kuznetsk Alatau Ridge, Gornaya Shoria, and Salair Ridge [19]. Small mafic intrusions and dikes were also regarded by some investigators as the most probable source of the PGEs in placer deposits. Gold mineralization has long been considered to be genetically related to the dikes of the Middle-Upper Cambrian gabbro–diorite–diabase complex [32].
Most alluvial gold–PGM placer occurrences are related to Quaternary sediments [33,34]. Some of these occurrences were re-explored and revived for exploitation. The irregular distribution of placers within the study area is largely controlled by bedrock sources and geomorphology. Most placers are typically found at medium altitudes in river valleys, formed by erosional and depositional processes. A few placers occur at lower elevations, and they are virtually absent in high-altitude areas. No published information on the PGM content of most gold placer occurrences is available, but PGMs are generally present in low-grade placers, ranging from 0.03%–0.05% to a few percent of native gold (from 0.5–10.0 mg/m3 to 500–800 mg/m3 of rock). At some localities; however, the proportion of PGM makes up as much as 10–30 vol.% of the particles of gold [35,36,37,38].
One of the sources of the platinum-group minerals (PGMs) in the alluvial placers of Gornaya Shoria are the basic–ultrabasic massifs of the Seglebir complex, which belong to the Moskovkinsk group of lower Cambrian stratiform intrusions of peridotite–pyroxenite–gabbro [19]. The largest basic–ultrabasic Seglebir massif measures from 0.5 × 1.5 to 3 × 12 km, and extends in a northeasterly direction along the fault zone (Figure 1c).
The main source of PGM in the alluvial sediments of the River Koura and its tributaries, at the sampling site, should be considered rocks of the Seglebir massif (Figure 1e). The massif is composed of massive fine- to medium-grained gabbros, clinopyroxenites, diorites, and antigorite- and chrysotile-bearing serpentinites. Gabbro are characterized by average TiO2 contents (0.75–1.07 wt.%). Dikes of the basic composition are common within the massif and in the enclosing strata. Nickel and copper mineralization are localized in serpentinized rocks of the Seglebir massif. Several models/interpretations are accepted in the literature about the formation of the Seglebir massif.
The source of the platinum-group minerals in the alluvial placers of the River Kaurchak and its tributaries can be considered rocks of the basic composition, which are attributed to the Middle Cambrian gabbro–diorite complex [19,39,40] (Figure 1d). The gabbro–diorite massifs are located upstream from the sampling site. The areas of intrusions do not exceed a few square kilometers. The arrays are composed of gabbros, olivine gabbros, gabbro-norites, hornblendites, and clinopyroxenites. Moderate to very high levels of TiO2 and high P2O5 characterizes clinopyroxenites and gabbros. Portions of the complex are promising for ilmenite – Ti-magnetite mineralization.

3. Samples and Methods

All samples were taken using gold dredgers. The material was washed at the gravity contents plant using sluice boxes and wash pans to obtain concentrates. The PGMs were extracted from the concentrates after they were panned to recover gold grains. The final volume of the concentrate was 5–10 dm3. The concentrate consisted of a heavy black sand. Substantial quantities of native gold and PGMs (the degree of enrichment ranging from 5 to 100,000 times) were present in the concentrate sample. Large-scale bulk sampling was employed to obtain an initial sand volume ranging from hundreds to a few thousand cubic meters. The sampling of the heavy-mineral concentrate was conducted at several placer deposits. The initial sand volume was 50–400 dm3. The final treatment of all samples comprised hand-panning using a stepwise procedure [41] to minimize loss of precious metals. The PGM grains were hand-picked from the final concentrates under a binocular microscope and then examined for grain size, morphology, and surface texture. Selected PGM grains were mounted in epoxy blocks and polished with a diamond paste for further analysis. Microtextural observations of PGM were performed by means of reflected-light microscopy with a Zeiss AxioScope A1 microscope (Carl Zeiss Microlmaging GmbH, Germany, www.zeiss.de).
The composition and morphology of the PGM grains were investigated using a MIRA 3 LMU (Tescan Orsay Holding, Brno, Czech Republic) scanning electron microscope with an attached INCA Energy 450 XMax 80 (Oxford Instruments Nanoanalysis, Wycombe, UK) microanalysis energy-dispersive system at the X-ray Laboratory of the Institute of Geology and Mineralogy, Siberian Branch, Russian Academy of Sciences (analysts N.S. Karmanov, M.V. Khlestov). We employed an accelerating voltage of 20 kV, a beam current of 1600 pA, an energy resolution (MIRA) of 126–127 eV at the Mn Kα line, and a region (3–5 μm), depending on the average atomic number of the sample and the wavelength of the analytical line.
The live time of spectrum acquisition was 30 s; in some cases, it reached 150 s. The standards used were FeS2 (S), PtAs2 (As), HgTe (Hg), PbTe (Pb and Te), and pure metals (Fe, Co, Ni, Cu, Ru, Rh, Pd, Ag, Sb, Os, Ir, Pt, and Au). For the analytical signal of S, Fe, Co, Ni, and Cu, the K-family of radiation was used, and for the remaining elements, the L family. The use of the L family for Os, Ir, Pt, Au, Hg, and Bi avoids the mutual overlaps of M families of these elements. Minimum detection limits (3σ criterion) of the elements (wt.%) were found to be 0.1–0.2 for S, Fe, Co, Ni, Cu; 0.2–0.4 for As, Ru, Rh, Pd, Ag, Sb, Te; 0.4–0.7 for Os, Ir, Pt, Au, Hg, Bi. The analytical error for the main components did not exceed 1–2 relative % and satisfied the requirements for quantitative analysis. Energy-dispersion spectrometry at the elementary conditions of the analysis is a quantitative method, as shown by Newbury et al. [42,43].
Lavrent´ev and co-workers [44] showed, on the same suite of rocks as in the present work, good reproducibility between EDS and wavelength-dispersive spectrometry (WDS) analyses of a large number of garnet, pyroxene, olivine, spinel, and ilmenite grains. We performed an additional test by analyzing some PGM grains on a Camebax Micro microanalyzer using WDS. The analytical conditions were accelerating voltage 20 kV, 20–30 nA beam current, beam size <2 μm, and 10 s counting time. The following X-ray lines and standards were used: PtLα, IrLα, OsMα, PdLα, RhLα, RuLα, AgLα, AuLα (pure metals), AsLα (synthetic InAs), SbLα (synthetic CuSbS2), SKα, FeKα, CuKα (synthetic CuFeS2), NiKα, CoKα (synthetic FeNiCo), BiMα (synthetic Bi2Se3). Element interference was corrected using experimentally measured coefficients [45]. Detection limits of the elements (wt.%) were 0.17 for Pt, 0.15 for Ir; 0.04 for Os, 0.04 for Pd, 0.04 for Rh, 0.04 for Ru, 0.03 for Fe, 0.06 for Cu, 0.07 for Ni, 0.05 for Co, 0.02 for S, 0.05 for As, and 0.06 for Sb.
Analysis by WDS (EMP) and EDS (SEM) methods was performed on grains from the same sites (Table 1). The coincidence of the results obtained is quite satisfactory (Table 1), especially if we take into account the possible heterogeneity of the grains under study, as well as the incomplete coincidence of the position of the analyzed points. Our findings suggest that the SEM-EDS method provides quantitative data in the study of the composition of the PGMs. It should be noted that identification of sample heterogeneity and high-spot resolution of the EDS analysis make it preferable over WDS for analysis of assemblages and aggregates (e.g., PGM exsolutions) in the nanometer-size range. In these cases, the microprobe data can be used to characterize bulk compositions of these nanoscale polymetallic aggregates.

4. Results and Discussion

Several hundred grains of platinum-group minerals derived from placers of the rivers Koura and Kourchak in the Gornaya Shoria territory (Figure 1) were examined. For the purpose of this investigation, we selected three grains for a detailed description.

4.1. Grain No. 1

4.1.1. Results

Multiphase grain No. 1, less than diameter of 1 mm (Figure 2a), was derived from the Koura River placer, dredge 317. The grain consisted of cuprous isoferroplatinum Pt3(Fe,Cu), copper-bearing platinum Pt1.4Cu0.6, hongshiite Pt1.1Cu0.9, and rhodarsenide (RhPdPt)2As. The last two minerals had sizes close to the nanoscale. Their sizes were a few hundredths (from 0.03 to 0.07 µm), and at most copper platinum a few tenths of a micrometer (from 0.3 to 0.7 µm) (Figure 2c). Lamellae in cuprous isoferroplatinum and in copper-bearing platinum was abundant. They were determined in more than 50% of analyses (Table 2). Such Os-Ir-Ru lamellae were recognized in hongshiite much less commonly.
The contents of Os, Ir, and Ru in many analyses of the Pt-Cu-Fe and Pt-Cu solid solutions were below the detection limit. In general, the contents of Ru, Os, and Ir is directly related to the thickness of lamellae. The proportion of Os/Ir/Ru remained more-or-less constant; in terms of a sum equal to 100% it was close to: Os0.4Ir0.4Ru0.2 (Table 3). As a rule, slight deviations from the constant proportion of these elements were detected where the content of Ru, Os, and Ir is low (Table 3). Such discrepancy with respect to the average contents reflects the insufficiency of the method employed for analysis of contents close to the detection limit [45]. In grain No. 1, in addition to the lamellae of Os, Ir, and Ru, we discovered an isometric roundish nodule of osmium (Os80Ir15Ru5), with a diameter of about 6 μm (see Figure 2a).

4.1.2. Discussion

In copper isoferroplatinum, in copper-containing platinum and hongshiite there are lamellae (Os0.4Ir0.4Ru0.2), which have a constant composition (Os0.4Ir0.4Ru0.2). It is an indication that all lamellae were formed as a result of decomposition of a single original solid solution. They could be close to Pt3Fe or Pt3(Fe,Cu) (with minor elements Os, Ru, Ir, and others), which is more consistent with the data presented in Figure 2. It is completely replaced by minerals in the following succession: isoferroplatinum (?) ―> cuprous isoferroplatinum ―> copper-rich platinum ―> hongshiite. The process of metasomatic replacement itself, judging from preservation of all three phases and the excess platinum in hongshiite Pt1.1Cu0.9, was relatively brief and incomplete.
The existence of Os, Ir, and Ru alloys in the form of small lamellae and relatively large isometric inclusions substantially different in composition indicates that they formed at different times under different conditions.
Figure 2. Back-scattered electron (BSE) image showing multiphase Grain No. 1 (a) A placer grain of Pt3(Fe,Cu) consists of a rim of Cu-enriched alloy phase (hongshiite PtCu) with inclusions of rhodarsenide (Rh,Pd)2As. (b,c) The exsolution micro-lamellae of rutheniridosmine (the decomposition of a solid solution) in isoferroplatinum and platarsite (PtAsS). The composition of measurement points is listed in Table 4. White—isoferroplatinum (Pt,Fe) and osmium (Os); light gray and gray—platarsite (PtAsS), cooperite (PtS), and sperrylite (PtAs); rectangular contours—the position of the microsites “b” and “c”. Explanation in the text.
Minerals 09 00327 g002
The conditions were as follows: A multicomponent melt of platinum-group metals changed its composition as the high-temperature phases crystallized. The presence of nodules differing in composition (Os0.8Ir0.15Ru0.05) and lamellae (Os0.4Ir0.4Ru0.2) in the same PGM grain bears witness to a discontinuity of their formation in time and conditions and about the complex long history of its formation. This corresponds to the position that the Seglebir basic–ultrabasic massif served as the most probable source of PGMs for placers. Micro-emulsion rhodarsenide impregnation is present on micro-areas composed of cuprous isoferroplatinum (Figure 2b). The sizes of these micro-areas are mainly less than 0.5 µm, more rarely these increase to 1 µm. The micro-emulsion impregnations are randomly distributed (Figure 2b). The determination of the precise composition of distinct inclusions causes difficulties. The reason for this is their very small size and superposition of elements of the cuprous isoferroplatinum and rhodarsenide (Table 4).
The elements of cuprous isoferroplatinum (Fe,Cu,Pt) and Ir-Os-Ru alloys (Fe,Cu,Pt) affect the analyzes. The "separated" composition measured for the inclusions of (Rh1.4Pd0.3Pt0.2)As and (Rh1.1Pd0.8Pt0.1)As is close to the composition of rhodarsenide from the grain, which was represented by two varieties: (Rh1.4Pd0.3Pt0.2)1.9As1.1 and (RhPd0.8Pt0.2)2As [46]. This similarity of compositions of micro-emulsion rhodarsenide impregnation and rhodarsenide from the grain confirms their genetic proximity. The emulsion impregnation has a metasomatic origin and it was formed contemporaneously with the main rhodarsenide inclusions. Thus, in this case, a relatively rare metasomatic structure is observed, which differs from the widely-developed emulsion structure of the solid solution decomposition [47].

4.2. Grain No. 2

4.2.1. Results

The diameter of the grain No. 2 is 0.3 mm. It also was derived from dredge 317 on the Koura River. The grain consisted of isoferroplatinum with the unclear zonation replaced by platarsite (PtAsS), cooperite (PtS), sperrylite (PtAs2), and osmium laths (Os0.7Ir0.2Ru0.1) (Figure 3). Micro-lamellae of Os-Ir-Ru are developed in isoferroplatinum and platarsite. Lamellae form a common lattice for both minerals (Figure 3c). The thickness of the lamellae of Os-Ir-Ru was about 0.1 µm (i.e., it was much less than the thickness of osmium laths (up to 2–6 µm) developed in the same grain). The lattice represents a structure decomposition of solid solution isoferroplatinum. Lamellae affected the composition of isoferroplatinum and platarsite enclosing them. In the latter, there was a high content of chemical elements forming (Os, Ir, Ru) lamellae (Table 5). The cooperite and sperrylite in the peripheral micro-zones contained no Ru, Os, and Ir, and Os-Ir-Ru lamellae were absent in these minerals (Figure 3b,c). The boundary of cooperite and sperrylite with platarsite is clear. Cooperite and sperrylite were formed at the later stage of replacement. The compositions of individual lamellae included into isoferroplatinum and platarsite, and separated by the technique described earlier, were quite close to each other. The scatter of either of the three elements (Os, Ir, Ru) contents did not exceed 20%, and more often 10%, and it varied within the range Os0.7–0.5Ir0.2–0.3Ru0.1–0.2 (Table 6).

4.2.2. Discussion

Weak variations in the composition of lamellae indicate that Os-Ir-Ru lamellae in platarsite are relict ones (as opposed to those in isoferroplatinum). This fact confirms the great stability of Os-Ir-Ru alloys in the process of alteration compared to isoferroplatinum. The composition of lamellae outlined above is quite close to the composition of “osmium” laths (Os0.7Ir0.2Ru0.1) present in the grain. Probably it indicates an insignificant difference in time of formation of the osmium laths and the inclusions of isoferroplatinum and, as a consequence, the relatively rapid cooling of the ore-forming body and its small size. Such ore-forming body could be one of the numerous dikes of the Seglebir complex. Detection of grains of native isoferroplatinum in one of the samples of dyke gabbro on the adjacent territory [30] indirectly confirms this probability.

4.3. Grain No. 3

4.3.1. Results

Grain No. 3 was derived from the placer of Kaurchak River (dredge 138). The grain of PGM (200 × 500 µm) was of interest in view of detection of micro-inclusions of native gold in it, as well as sulfides, sulfoarsenides, and arsenides of platinum group elements. Three types of gold were distinguished (Au-I–Au-III). In the grain section (Figure 4), three zones were distinguished I — core, II — Rim-I, and III — Rim-II.
The core occupies the large inner part of the grain. This zone has a homogeneous texture and it was comprised of a Pt-Fe solid solution. Its average composition, according to six analyses, was as follows (Table 7): 75 at.% Pt and 18 at.% Fe, which corresponds to platinum Pt4Fe. Fe-Pt compounds with an iron content of 18 to 41 at.% correspond to isoferroplatinum, according to the Fe-Pt phase diagram [48,49]. The alloy in zone 1 (core) with 18 at.% Fe could be attributed to both isoferroplatinum and platinum. We used the term platinum. Minor elements (average grade) were as follows: 1.3 at.% Cu, 3.2 at.% Rh, 2.1 at.% Pd, and 1.3 at.% Ru. The scatter of values of each of them was insignificant (Table 7). The uniformity of the elements distribution in the core is shown in Figure 5. In the homogeneous mass of platinum, two rare micro-inclusions of two types observed, micro-lamellae of osmium and PGE-sulfide micro-nodules. The thickness of the micro-lamellae varies from 0.5 µm (data points No. 48–51 in Figure 4e) to 2 µm (data point No. 37 in Figure 4c). The composition of micro-lamellae was as follows: 92–95 at.% Os, 6–1 at.% Ru, 0–4 at.% Ir (Table 7, data points No. 37–50). The sizes of the micro-nodules were few µm. They were comprised of Rh and Pd sulfides: bowieite and unnamed varieties (data points No. 43–46 in Figure 4b, Figure 5, and in Table 7). PGE-sulfide micro-nodules were formed during liquation. Cavities in micronodules appeared as a result of the subsequent dissolution of sulfide minerals (Figure 4a,b,f).
The Rim-I of grain No. 3 covered the edge part of the core composed of platinum (see Figure 4b). From the edge of the nucleus inward to 10 microns, micro-areas of unusual structure and composition were developed. Among them are two types of micro-areas. The first variety was the zone of alteration represented by platarsite-cooperite (data point No. 8 in Figure 4b). This has not been reviewed by us in detail. The second variety was investigated in detail (data point No. 6 in Figure 4b, data points No. 14–17 and 22 in Figure 4d, data points No. 61, 62, 65, 69 in Figure 4g).
These micro-areas had a peculiar dendrite-like microstructure, sub-graphic (eutectoid), represented by curved nanosized gold lamellae (from 100–150 nm up to 700–750 nm) (Figure 5 and Figure 6). These nanoscale areas consisted of native gold (Au-I), rhodium, and platinum sulfoarsenides, with minor elements Os, Ru, and Ir (Table 8). The inclusions of native gold had the following composition: 83.8 at.% (84.7–82.6 at.%) Au; 15.9 at.% (15.3–17.4 at.%) Ag, and the average formula corresponded to Au4Ag. The fineness of Au-I corresponded to 900–910 ‰. Gold in Rim-I also formed a micron layer, sharply bounded by Rim-II on the one hand and uneven on the other. Its power ranged from less than 1 micron to 3 microns.
The Rim-II was the outer rim. The rim had an irregular thickness up to 20 µm and covered more than half of the grain contour. The Rim-II consisted of sulfide, sulfoarsenide, and arsenide layers (Figure 4 and Figure 7). The sulfide layer Rim-II texture was homogeneous. The sulfoarsenide layer and the adjacent part of the arsenide layer had a spotty texture due to the inclusions of gold Au-II. The sulfide layer consisted of cooperite and sulfides Rh, Os, Ru, and Ir (Table 9). The sulfoarsenide layer represented by platarsite with minor elements of Rh, Fe, Os, Te, and small inclusions of gold (Au-II) (less than 1 micron). The composition of this gold Au-II determined by the relationship between Au and Ag was relatively consistent: 84.1 at.% (84.7–83.5 at.%) Au and 15.9 at.% (15.3–16.5 at.%) Ag. The gold fineness corresponded to 900–910 ‰. The arsenide layer was the most powerful. It consisted of sperrylite. On the border with the sulfoarsenide layer were larger (up to 5 microns) inclusions of gold (Au-II). Inclusions had an elongated shape along the border with the sulfoarsenide layer. The composition of gold was the same as the composition of gold in the sulfoarsenide layer.
Inclusions of Au-III 5–10 µm in size were on the outer surface of grain No. 3. Forms of Au-III aggregates were as follows: Pads and smooth isometric microcrystals or their intergrowths (Figure 4b,c; data points No. 3, 30, and 31). The peculiarity of their compositions were the low Ag content: 3 at.%, 3 at.%, and 3 at.% Ag and the presence of Hg: 12at.%, 3.6 at.%, and 6 at.% (Table 10).

4.3.2. Discussion

Grain No. 3 has a complex structure, which reflects the crystallization history of PGM and the distribution of PGE and other elements among the mineral phases. Grain No. 3 consists of Core, Rim-I, and Rim-II. The Rim-II consists of sulfide, sulfoarsenide and arsenide layers. The core has a composition of 75 at.% Pt and 18 at.% Fe. Minor elements (Rh, Pd, Cu) are distributed uniformly in the bulk of the core. This indicates their isomorphic occurrence. Alloys of this composition are rare for Western Siberia varieties [48], but not rare for the World [1]. According to the Rt-Fe state diagram, the temperature of formation of such an alloy is below 1110 °C [49,50]. Various crystallization mechanisms of the Pt-Fe alloy are described in the literature. One of them is associated with the crystallization of Pt-Fe alloys from MSS (monosulfide solid solution) [51]. Another mechanism of crystallization of Pt-Fe alloys is not associated with the decomposition of sulfide liquid. Crystallization of the Pt-Fe alloy occurred before immiscible sulfide formed [52,53]. The core contains inclusions of Rh and Pd sulfides in the central part. On the periphery of the core in rim-I, we observe areas with a complex dendrite structure with inclusions of Au-I and sulfoarsenides (Rh, Pt, ± Os, Ru, Ir). They correspond to the structure of the eutectic-decomposition multi-principle component alloys (MPCAs) [54]. The presence of sulfide globules and areas with a multicomponent eutectic melt indicates the possible crystallization of the Pt-Fe alloy from a multicomponent melt containing Pt-Fe-Pd-Rh-Au-Ag-As-S. The presence of sulfide globules and areas with a multicomponent eutectic melt indicates the possible crystallization of the Pt-Fe alloy at a temperature below 1100 °C from a multicomponent melt containing Pt-Fe-Pd-Rh-Au-Ag-As-S. The eutectic temperature of the multicomponent melt was below 1050 °C, which is indicated to us by the Au-Ag state diagram [55]. Another possible formation of Rim-I is the substitution mechanism of the core (Pt-Fe) by the Au-Ag-Rh-Ru-As-S melt. During the cooling of the system, the solid solution disintegrated with the formation of this sub-graphic structure.
We observed mineral zonality in Rim-II, which reflects a sequential change of crystallization conditions from residual melt (containing Pt, Rh, Pd, S, As, Te). The residual melt is separated from the MMS according to the model proposed by Dare et al. [51]. Initially, the melt had a high fS2 (fugacity of sulfur), which gradually decreased. The content of As and Te in the residual melt, on the contrary, increased. This is confirmed by the successive change in sulfide layers of sulfoarsenide and arsenide layers in the grain. The residual melt interacted with the platinum grain. The Pt-Fe alloy was replaced n the interaction zone with the enlargement of Au-I and the formation of Au-II. Formation of Au-III is associated with low-temperature processes of hydrothermal or supergene processes. The formation of Au-III occurred later and was associated with low-temperature hydrothermal processes or supergenic alteration.

5. Conclusions

The article shows, with specific examples, the importance of data on the composition of microscopic, close to nanoscale, mineral inclusions in order to ascertain conditions for the formation of associations of platinum-group minerals. In turn, the determination of the composition, close to the true one, of such inclusions and the host mineral, causes certain difficulties, even when using local methods of analysis (EMP, SEM). The reason is that the region of X-ray generation captures both the matrix and an inclusion. There is a mutual influence of the compositions (overlapping spectra). The complexity of the task is governed by a number of factors, and first of all by the ratio of elemental compositions of included and including minerals and the degree of overlap of spectral lines involved in the SEM-EDS analysis. The EDS method can be used on a par with WDS to study the chemical composition of minerals, including micro-inclusions in PGMs. This method is multi-elemental and more effective for mineral diagnostics in comparison with WDS, which is its certain advantage. With the EDS approach, it is possible to obtain quantitative data on the composition of micro-inclusions with a size of 3–5 µm. An EDS analysis of PGM grains ranging in size from less than 3 to 1 µm provides semiquantitative data. The EDS analysis of grains with a size of less than 1 µm gives, at best, a qualitative composition of PGMs or suggests the presence of PGM nanoparticles.
The main results of the study are as follows:
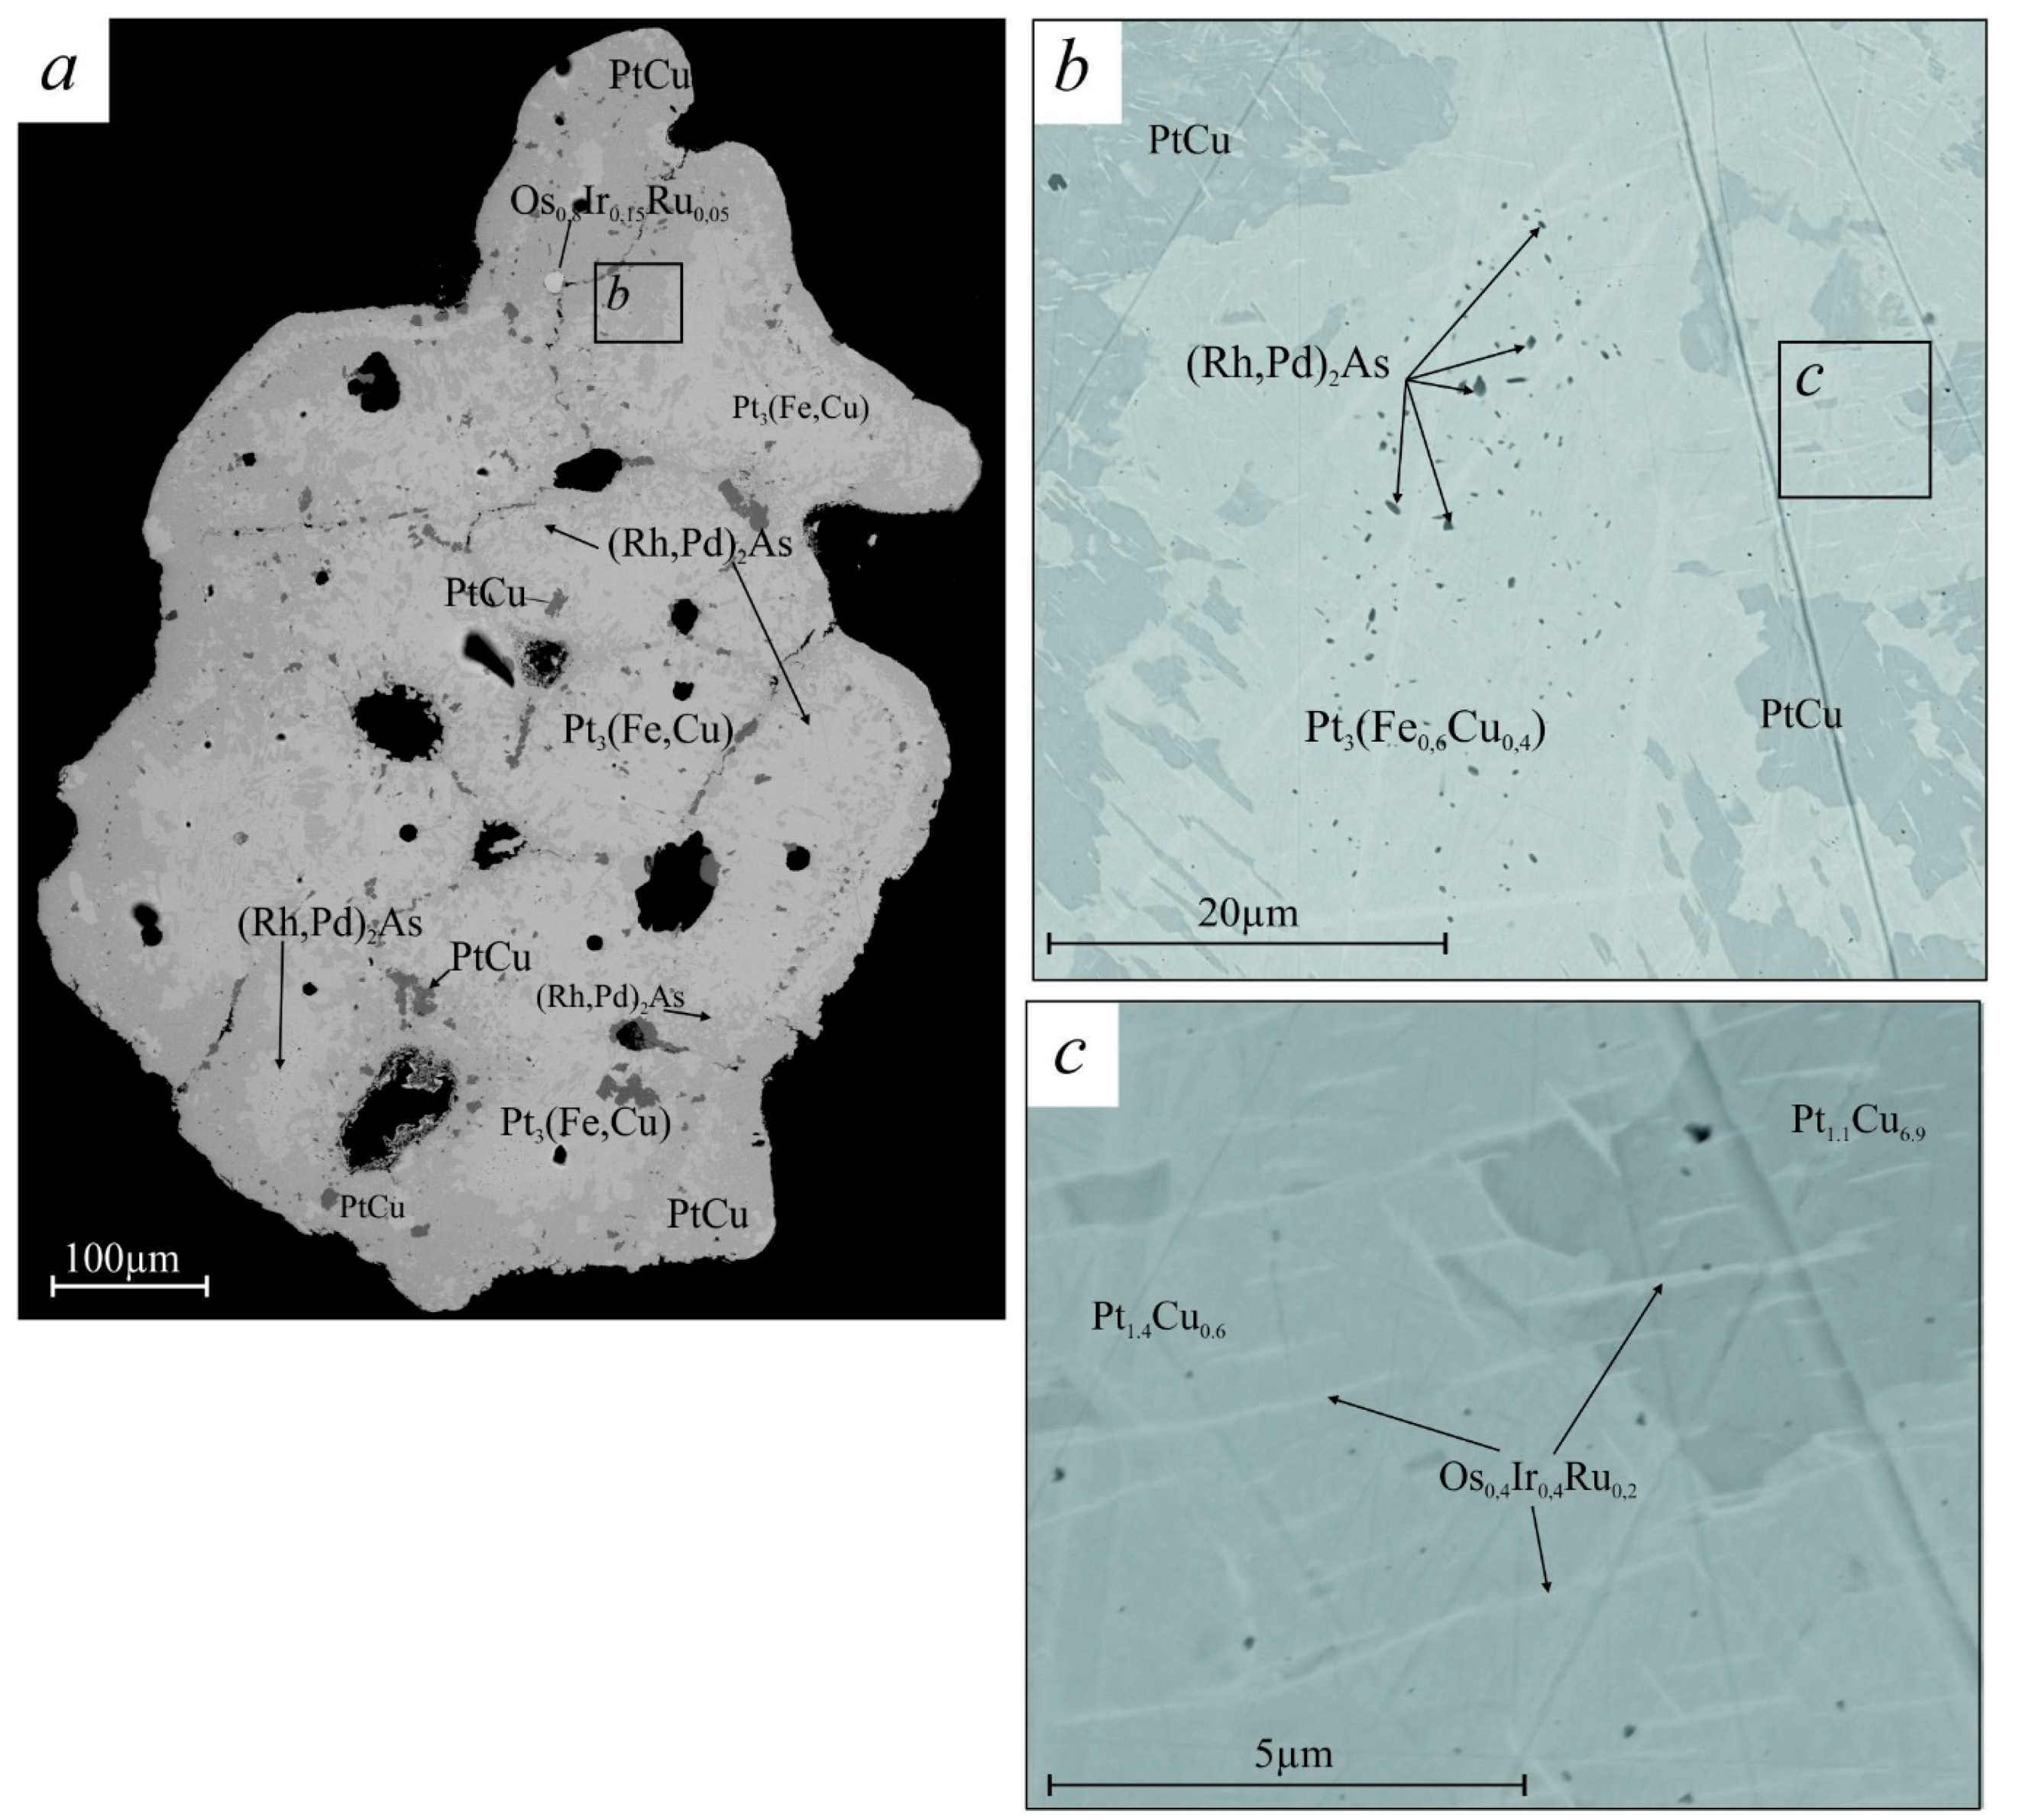
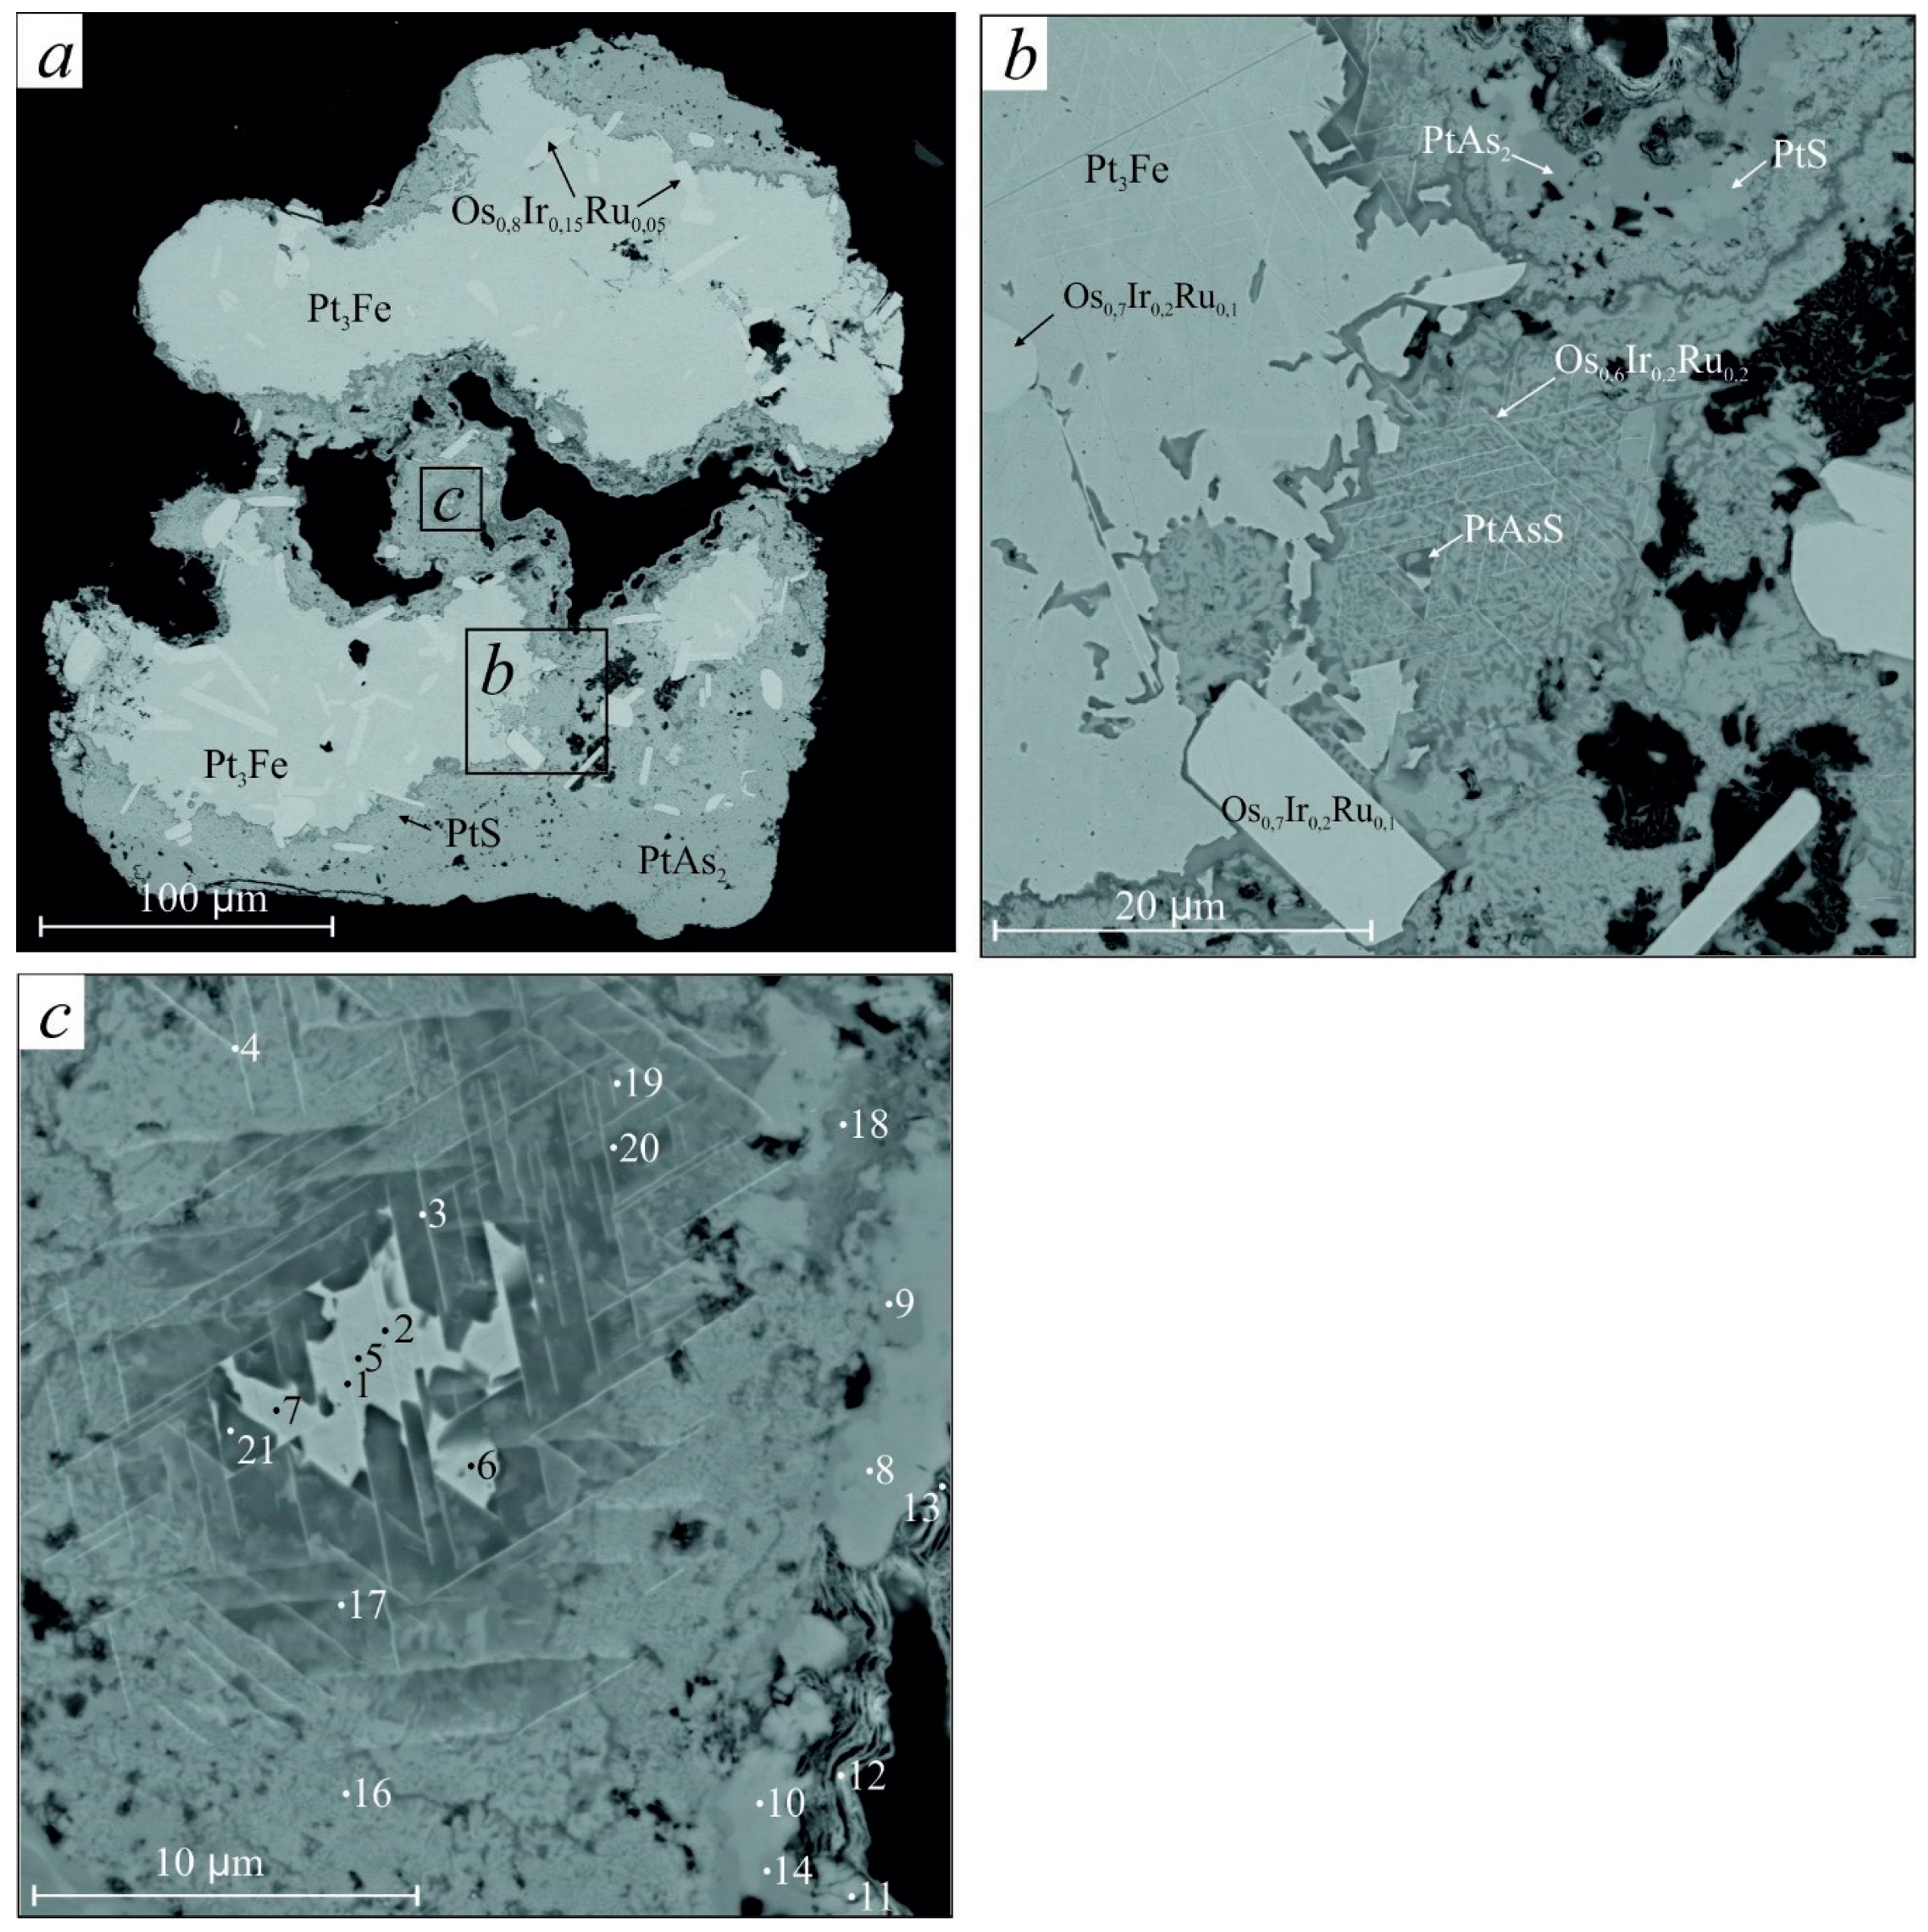
In the processes of metasomatic transformations of PGMs, the stability of the Os-Ir-Ru lamellae substantially exceeds that of isoferroplatinum, and the products of its alteration. This fact is confirmed by the identical composition of the lamellae included in cuprous isoferroplatinum, as well as in copper-bearing platinum and hongshiite in the first case (grain No. 1), and in isoferroplatinum and platarsite in the second case (grain No. 2).
Based on the significant difference in the Os-Ir-Ru compositions of the lamellae in isoferroplatinum and nodules, a conclusion is drawn about the great hiatus in time and the difference in conditions of formation of the indicated phases of grain No. 1. This corresponds to the position that the Seglebir basic–ultrabasic massif served as the most probable driving force.
On the contrary, it has been established that grain No. 2 solidified relatively swiftly. It was formed in one of the numerous small magmatic bodies of basic composition, which are widely distributed in the area. The role of such a body is very suitable for one of the numerous dikes of the Seglebir complex. Detection of grains of native isoferroplatinum in one of the samples of a dyke of gabbro on the adjacent territory [30] indirectly confirms this probability. The deposition of sperrylite and native gold from the basalt melt in layered basic–ultrabasic complexes are an established fact [56,57].
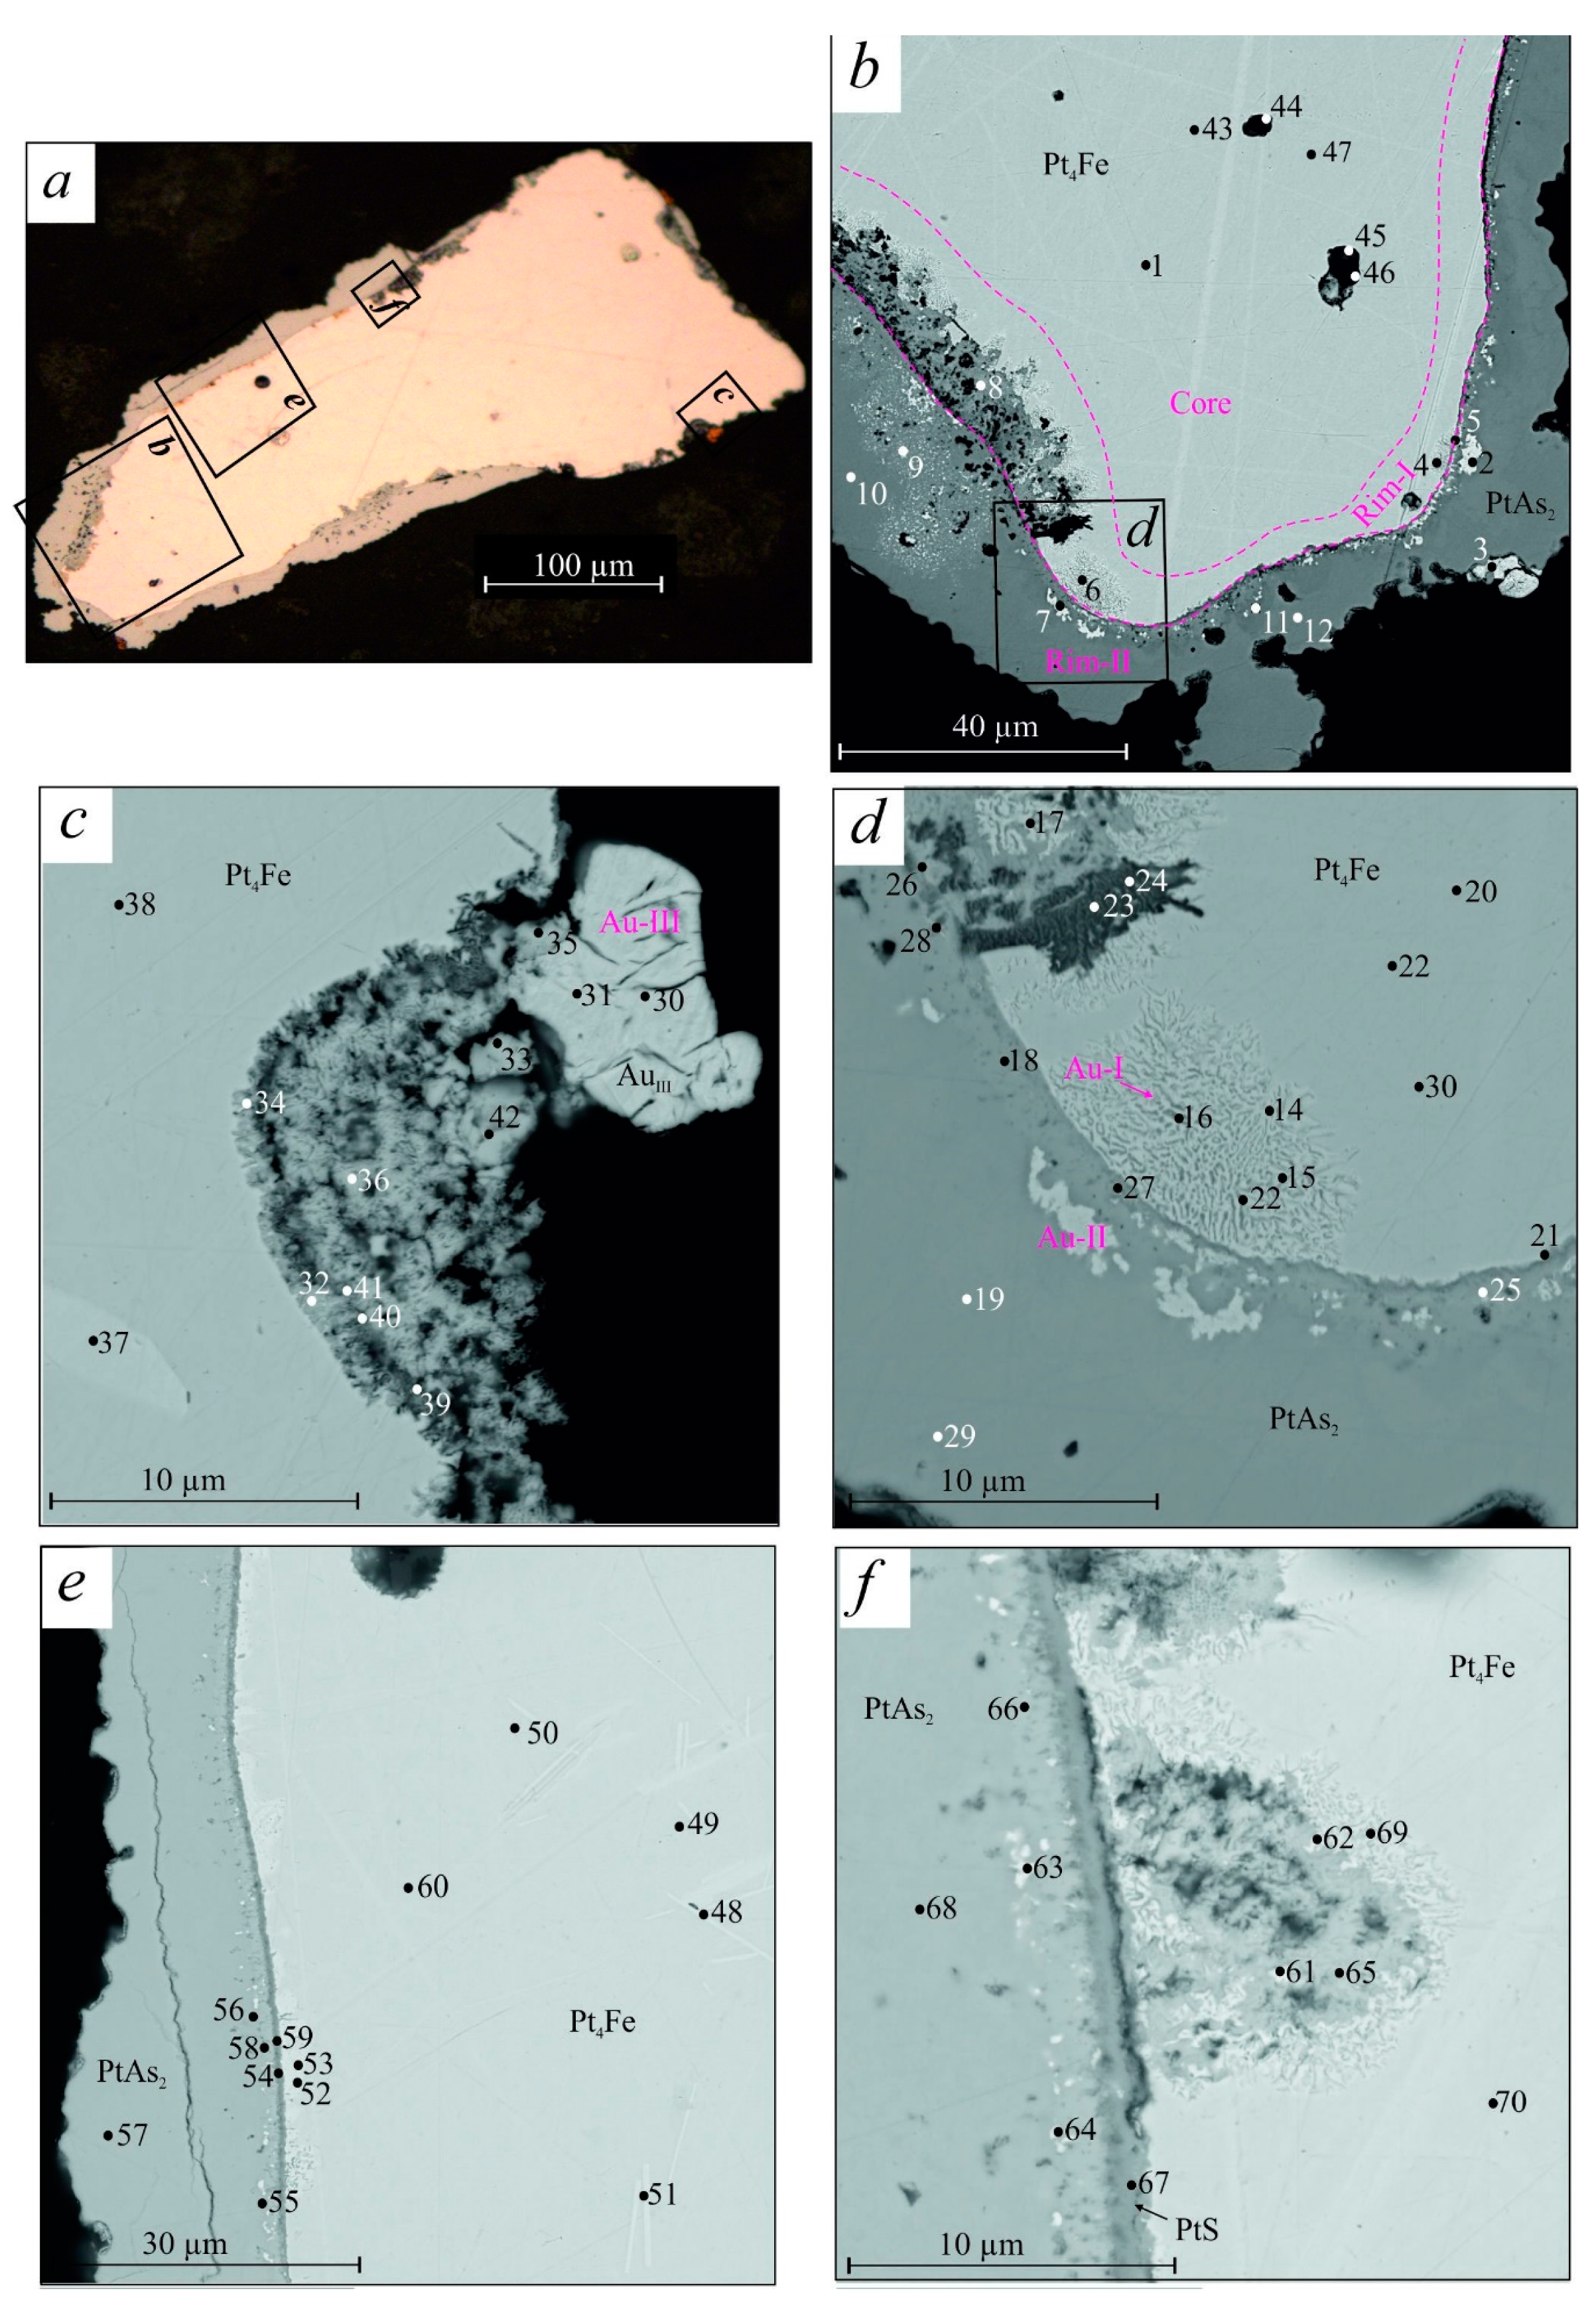
The source of grain No. 3 was intrusive massifs of the middle Cambrian gabbro. It is very difficult to restore the history of crystallization on a single grain. However, by the structural relationships of minerals, we can confidently speak of a complex sequence of the formation of the PGMs.
1. The formation of platinum with melt sulfide inclusions occurred from the primary monosulfide solid solution (MSS) [51,53] or sulfide liquids [52]. There was a liquation department of the Pt-Fe alloy with a small amount of Au, Ag, Rh, Ir, Os, S, and As. Os microcrystals crystallized first from the Pt-rich melt. As the system cooled down and platinum crystallized, a lower-temperature melt enriched in Au, Ag, S, As, and Rh (with minor elements of Ru, Os, Ir) accumulated and separated. The separated multicomponent melt during cooling formed a eutectic/eutectoid multi-principle component alloy.
2. The formation of layered Rim-II is associated with the interaction of platinum grains with the residual melt.
The formation of eutectoid structures and a border on the surface of the grains occurred in the magmatic stage. This is consistent with the findings of Badanina et al. [58] (according to the 187Os/188Os and 187Re/188Os systematics) about a single source of PGEs in the Pt-Fe alloy and arsenide rims, as well as experimental data [59]. Previously, the formation of arsenide, sulfoarsenide, and sulfide rims on Pt-Fe alloy grains was associated with post-magmatic hydrothermal processes ([24], etc.).
Variations in the content of basic chemical elements reflect the processes and conditions for the formation of PGMs. Sharp fluctuations in the local areas of the contents of elements that are not part of the mineral structure may indicate that nano-inclusions of a different composition fall into the region of X-ray generation. Such cases require detailed study using local methods of analysis with a resolution of several nanometers (HR-SEM, HR-TEM).

Author Contributions

Conceptualization, G.V.N. and S.M.Z.; methodology, N.S.K. and D.K.B.; software, D.K.B. and E.V.A.; validation, G.V.N., S.M.Z. and E.V.A.; formal analysis, E.V.A.; investigation, G.V.N. and S.M.Z.; resources, G.V.N. and N.S.K.; data curation, D.K.B. and E.V.A.; writing—original draft preparation, G.V.N. and S.M.Z.; writing—review and editing, G.V.N., S.M.Z. and E.V.A.; visualization, E.V.A. and N.S.K.; supervision, S.M.Z.; project administration, S.M.Z.; funding acquisition, S.M.Z.

Funding

This research was funded by Russian Fond Basic Research Grant No. 19-04-00464 and Ministry of Science and Higher Education of the Russian Federation (Project No. 0330-2016-0011).

Acknowledgments

The authors are grateful to the Guest Editors of the Special Issue and to the anonymous reviewer Canadian geologist for the benevolent attitude and significant improvement in the English language of this article. The authors express their sincere thanks to L.P. Boboshko for substantial assistance in processing the factual material and preparing the article for publication. The work was carried out at the Analytical Center for multi-elemental and isotope research SB RAS.

Conflicts of Interest

The authors declare no conflicts of interest.

References

  1. Cabri, L.J.; Harris, D.C.; Weiser, T.W. Mineralogy and distribution of Platinum group mineral (PGM) in placer deposits. Explor. Min. Geol. 1996, 5, 73–167. [Google Scholar]
  2. Barkov, A.Y.; Shvedov, G.I.; Silyanov, S.A.; Martin, R.F. Mineralogy of Platinum-Group Elements and Gold in the Ophiolite-Related Placer of the River Bolshoy Khailyk, Western Sayans, Russia. Minerals 2018, 8, 247. [Google Scholar] [CrossRef]
  3. Oberthür, T.; Weiser, W.; Melcher, F. Alluvial and eluvial platinum-group minerals from the Bushveld complex, South Africa. S. Afr. J. Geol. 2014, 117, 255–274. [Google Scholar] [CrossRef]
  4. Zaccarini, F.; Garuti, G.; Pushkarev, E.; Thalhammer, O. Origin of Platinum Group Minerals (PGM) Inclusions in Chromite Deposits of the Urals. Minerals 2018, 8, 379. [Google Scholar] [CrossRef]
  5. Barkov, A.Y.; Shvedov, G.I.; Martin, R.F. PGE–(REE–Ti)-rich micrometer-sized inclusions, mineral associations, compositional variations, and a potential lode source of platinum-group minerals in the Sisim Placer Zone, Eastern Sayans, Russia. Minerals 2018, 8, 181. [Google Scholar] [CrossRef]
  6. Melcher, F.; Oberthur, T.; Lodziak, J. Modification of detrital platinum-group minerals from the Eastern Bushveld complex, South Africa. Can. Mineral. 2005, 43, 1711–1734. [Google Scholar] [CrossRef]
  7. McClenaghan, M.B.; Cabri, L.J. Review of gold and platinum group element (PGE) indicator minerals methods for surficial sediment sampling. Geochem. Explor. Environ. Anal. 2011, 11, 251–263. [Google Scholar] [CrossRef]
  8. Oberthür, T.; Melcher, F.; Weiser, T. Detrital platinum-group minerals and gold in placers of south-eastern Samar Island, Philippines. Can. Mineral. 2017, 54, 45–62. [Google Scholar] [CrossRef]
  9. Oberthür, T. The Fate of Platinum-Group Minerals in the Exogenic Environment—From Sulfide Ores via Oxidized Ores into Placers: Case Studies Bushveld Complex, South Africa, and Great Dyke, Zimbabwe. Minerals 2018, 8, 581. [Google Scholar] [CrossRef]
  10. Garuti, G.; Fershtater, G.B.; Bea, F.; Montero, P.; Pushkarev, E.; Zaccarini, F. Platinum-group elements as petrological indicators in mafic-ultramafic complexes of the central and southern Urals. Tectonophysics 1997, 276, 181–194. [Google Scholar] [CrossRef]
  11. González-Jiménez, J.M.; Proenza, J.A.; Martini, M.; Camprubí, A.; Griffin, W.L.; O’Reilly, S.Y.; Pearson, N.J. Deposits associated with ultramafic–mafic complexes in Mexico: The Loma Baya case. Ore Geol. Rev. 2017, 81, 1053–1065. [Google Scholar] [CrossRef]
  12. Buslov, M.M.; Geng, H.; Travin, A.V.; Otgonbaatar, D.; Kulikova, A.V.; Ming, C.; Stijn, G.; Semakov, N.N.; Rubanova, E.S.; Abildaeva, M.A.; et al. Tectonics and geodynamics of Gorny Altai and adjacent structures of the Altai-Sayan folded area. Russ. Geol. Geophys. 2013, 54, 1250–1271. [Google Scholar] [CrossRef]
  13. Dobretsov, N.L. Evolution of structures of the Urals, Kazakhstan, Tien Shan, and Altai-Sayan region within the Ural-Mongolian fold belt (Paleoasian Ocean). Russ. Geol. Geophys. 2003, 44, 5–27. [Google Scholar]
  14. Dobretsov, N.L.; Buslov, M.M.; De Grave, J.; Sklyarov, E.V. Interplay of magmatism, sedimentation, and collision processes in the Siberian craton and the flanking orogens. Russ. Geol. Geophys. 2013, 54, 1135–1149. [Google Scholar] [CrossRef]
  15. Kuzmin, M.I.; Yarmolyuk, V.V. Mantle plumes of Central Asia (Northeast Asia) and their role in forming endogenous deposits. Russ. Geol. Geophys. 2014, 55, 120–143. [Google Scholar] [CrossRef]
  16. Rudnev, S.N.; Babin, G.A.; Kovach, V.P.; Kiseleva, V.Y.; Serov, P.A. The early stages of island-arc plagiogranitoid magmatism in Gornaya Shoriya and West Sayan. Russ. Geol. Geophys. 2013, 54, 20–33. [Google Scholar] [CrossRef]
  17. Alabin, L.V.; Kalinin, Y.A. Gold Metallogeny of Kuznetsk Alatau; Izd. SO RAN: Novosibirsk, Russia, 1999. (In Russian) [Google Scholar]
  18. Buslov, M.M. Tectonics and geodynamics of the Central Asian Foldbelt: The role of Late Paleozoic large-amplitude strike-slip faults. Russ. Geol. Geophys. 2011, 52, 52–71. [Google Scholar] [CrossRef]
  19. Babin, G.A.; Gusev, N.I.; Yur’ev, A.A.; Uvarov, A.N.; Dubskii, V.S.; Chernykh, A.I.; Shchigrev, A.F.; Chusovitina, G.D.; Korableva, T.V.; Kosyakova, L.N.; et al. Explanatory Note to the State Geological Map of the Russian Federation, Scale 1:1,000,000, 3rd ed.; Sheet N-45, Novokuznetsk; Izd. Kartfabriki VSEGEI: St. Petersburg, Russia, 2007. (In Russian) [Google Scholar]
  20. Izokh, A.E. Layered Mafic–Ultramafic Associations as Indicators of Geodynamic Settings (on the Example of the Central Asian foldbelt). Ph.D. Thesis, UIGGM SB RAS, Novosibirsk, Russian, 1999. (In Russian). [Google Scholar]
  21. Kurenkov, S.A.; Didenko, A.N.; Simonov, V.A. Geodynamics of Paleospreading; GEOS: Moscow, Russia, 2002. (In Russian) [Google Scholar]
  22. Pinus, G.V.; Kuznetsov, V.A.; Volokhov, I.M. Hyperbasites of the Altai-Sayan Folded Area; Izd. AN SSSR: Moscow, Russia, 1958. (In Russian) [Google Scholar]
  23. Plotnikov, A.V.; Stupakov, S.I.; Babin, G.A.; Vladimirov, A.G.; Simonov, V.A. Age and geodynamic setting of the Kuznetsk Alatau ophiolites. Dokl. Earth Sci. 2000, 372, 608–612. [Google Scholar]
  24. Tolstykh, N.D. Mineral Assemblages from Pt-Bearing Placers and Genetic Correlations with Their Bedrock Sources. Ph.D. Thesis, UIGGM SB RAS, Novosibirsk, Russia, 2004. (In Russian). [Google Scholar]
  25. Podlipsky, M.Y.; Krivenko, A.P. New data on geological structure, lithology, and formational type of the Kaigadat massif as a primary source of Pt- and Fe-bearing PGM in placers. In Topical Problems of Geology and Minerageny of Southern Siberia, 31 October–2 November 2001; Elan’, Kemerovo District: Novosibirsk, Russian, 2001; pp. 126–132. (In Russian) [Google Scholar]
  26. Gertner, I.F.; Krasnova, T.S. Geochemistry of ophiolitic rock paragenesis from Mts. Severnaya, Zelenaya, and Barkhatnaya (Kuznetsk Alatau). In Petrology of Magmatic and Metamorphic Complexes; TsNTI: Tomsk, Russian, 2000; Volume 4, pp. 35–41. (In Russian) [Google Scholar]
  27. Krasnova, T.S.; Gertner, I.F. Ophiolite association of Mts. Severnaya–Zelenaya–Barkhatnaya (Kuznetsk Alatau). In Petrology of Magmatic and Metamorphic Complexes; TsNTI: Tomsk, Russian, 2000; pp. 28–34. (In Russian) [Google Scholar]
  28. Polyakov, G.V.; Bognibov, V.I. Platinum Potential of Ultramafic-Mafic Complexes of Southern Siberia; Izd. SO RAN, NITS UIGGM SB RAS: Novosibirsk, Russia, 1995. (In Russian) [Google Scholar]
  29. Gusev, A.I.; Grinev, R.O.; Chernyshev, A.I. Petrology and ore potential of the Seglebir ophiolite association (northeastern Gorny Altai and southern Gornaya Shoria). In Petrology of Magmatic and Metamorphic Complexes; TsNTI: Tomsk, Russian, 2004; Volume 4, pp. 130–133. (In Russian) [Google Scholar]
  30. Agafonov, L.V.; Velinskii, V.V.; Loskutov, I.Y. Unusual Mineral Assemblage of the Noble Metals in the Dikes within Togul-Sungai Ultramafic Massif, Salair Ridge. Dokl. Akad. Nauk 1996, 351, 505–508. (In Russian) [Google Scholar]
  31. Agafonov, L.V.; Borisenko, A.S.; Bedarev, N.V.; Loskutov, I.Y.; Akimtsev, V.A. PGE and other native element minerals in primary and placer deposits of Central Salair. In Petrology of Magmatic and Metamorphic Complexes, 300th Anniversary of Mining and Geological Survey of Russia, Tomsk, 29–30 March 2000; TsNTI: Tomsk, Russian, 2000; pp. 105–110. (In Russian) [Google Scholar]
  32. Bulynnikov, A.Y. Gold Ore Formations and Gold-Bearing Provinces of the Altai-Sayan Mountain System; Tomsk. Gos. Univ.: Tomsk, Russia, 1948. (In Russian) [Google Scholar]
  33. Butvilovskii, V.V.; Avakumov, A.E.; Gutak, O.Y. The Gold Placer Potential of southern West Siberia. Overview of the History and Geology and Potential Assessment; Kuzbass State Pedagogical Academy: Novokuznetsk, Russian, 2011. (In Russian) [Google Scholar]
  34. Nesterenko, G.V. Prediction of Gold Mineralization by Placers (on the Example of Southern Siberia); Nauka: Novosibirsk, Russia, 1991. (In Russian) [Google Scholar]
  35. Kyuz, A.K. Platinum potential of Kuznetsk Alatau. Sov. Gold Ind. 1935, 5, 23–25. (In Russian) [Google Scholar]
  36. Syrovatskii, V.V. Perspective Lines of PGE Studies; Zapsibgeologiya: Novokuznetsk, Russia, 1991. (In Russian) [Google Scholar]
  37. Vysotskiy, N.K. Platinum and Areas of Its Mining; Academy of Sciences of the USSR: Moscow, Russia, 1933. (In Russian) [Google Scholar]
  38. Zhmodik, G.V.; Nesterenko, E.V.; Airiyants, E.V.; Belyanin, D.K.; Kolpakov, V.V.; Podlipsky, M.Y.; Karmanov, N.S. Alluvial platinum-group minerals as indicators of primary PGE mineralization (placers of southern Siberia). Russ. Geol. Geophys. 2016, 57, 1437–1464. [Google Scholar] [CrossRef]
  39. Studenikin, V.P.; Smirnova, A.I. Geological Map of 1: 200 000 Scale, Gorno-Altai Series. Sheet N-45-XXXIV. Explanatory Note; Gosgeoltehizdat: Moscow, Russia, 1963. (In Russian) [Google Scholar]
  40. Fominsky, V.I. Geological Map of 1: 200 000 Scale, Altai Series. Sheet N-45-XXXV. Explanatory Note; Gosgeoltehizdat: Moscow, Russia, 1961; 95p. (In Russian) [Google Scholar]
  41. Boitsov, V.E.; Surkov, A.V.; Akhapkin, A.A. Methodology for studying native gold from waste rock stockpiles. Izv. Vuzov. Geol. Razved. 2005, 2, 42–45. (In Russian) [Google Scholar]
  42. Newbury, D.E.; Ritchie, N.W.M. Is Scanning Electron Microscopy/Energy Dispersive X-ray Spectrometry (SEM/EDS) Quantitative? Scanning 2013, 35, 141–168. [Google Scholar] [CrossRef] [PubMed]
  43. Newbury, D.E.; Ritchie, N.W.M. Performing elemental microanalysis with high accuracy and high precision by scanning electron microscopy/silicon drift detector energy-dispersive X-ray spectrometry (SEM/SDD-EDS). J. Mater. Sci. 2015, 50, 492–518. [Google Scholar] [CrossRef] [PubMed]
  44. Lavrent’ev, Y.G.; Usova, L.V. RMA89 Software Suit for Use with a CAMABAX Microprobe. J. Anal. Chem. USSR 1991, 46, 49–54. [Google Scholar]
  45. Lavrent’ev, Y.G.; Karmanov, N.S.; Usova, L.V. Electron probe microanalysis of minerals: Microanalyzer or scanning electron microscope? Russ. Geol. Geophys. 2015, 56, 1154–1161. [Google Scholar] [CrossRef]
  46. Nesterenko, G.V.; Zhmodik, S.M.; Airiyants, E.V.; Belyanin, D.K.; Kolpakov, V.V.; Bogush, A.A. Colloform high-purity platinum from placer deposit of Koura River (Gornaya Shoria, Russia). Ore Geol. Rev. 2017, 91, 236–245. [Google Scholar] [CrossRef]
  47. Isaenko, M.P. The Determinant of Textures and Structures of Ores; Nedra: Moscow, Russia, 1983. (In Russian) [Google Scholar]
  48. Krivenko, A.P.; Tolstykh, N.D.; Nesterenko, G.V.; Lazareva, E.V. Types of mineral associations of platinum metals in auriferous placers of the Altai-Sayan folded region. Russ. Geol. Geophys. 1994, 35, 70–78. [Google Scholar]
  49. Kubaschewski, O. Iron-Binary Phase Diagrams; Springer: New York, NY, USA, 1982. [Google Scholar]
  50. Okamoto, H. Fe-Pt (Iron-Platinum). J. Phase Equilibria Diffus. 2004, 25, 395. [Google Scholar] [CrossRef]
  51. Dare, S.A.S.; Barnes, S.-J.; Prichard, H.M.; Fisher, P.C. Mineralogy and Geochemistry of Cu-Rich Ores from the McCreedy East Ni-Cu-PGE Deposit (Sudbury, Canada): Implications for the Behavior of Platinum Group and Chalcophile Elements at the End of Crystallization of a Sulfide Liquid. Econ. Geol. 2014, 109, 343–366. [Google Scholar] [CrossRef]
  52. Godel, B.; Barnes, S.-J.; Maier, W.D. Platinum-Group Elements in Sulphide Minerals, Platinum-Group Minerals, andWhole-Rocks of the Merensky Reef (Bushveld Complex, South Africa): Implications for the Formation of the Reef. J. Petrol. 2007, 48, 1569–1604. [Google Scholar] [CrossRef]
  53. Mungall, J.; Brenan, J. Partitioning of platinum-group elements and Au between sulfide liquid and basalt and the origins of mantle-crust fractionation of the chalcophile elements. Geochim. Cosmochim. Acta 2014, 125, 265–289. [Google Scholar] [CrossRef]
  54. Baker, I.; Wu, M.; Wang, Z. Eutectic/eutectoid multi-principle component alloys: A review. Mater. Charact. 2019, 147, 545–557. [Google Scholar] [CrossRef]
  55. Hansen, M.; Anderko, K. Constitution of Binary Alloys; McGraw-Hill: New York, NY, USA, 1958. [Google Scholar]
  56. Maier, W.D.; Rasmussen, B.; Fetcher, I.R.; Godel, B.; Barnes, S.J.; Fisher, L.A.; Huhma, Y.S.H.; Lahaye, Y. Petrogenesis of the ~2·77 Ga Monts de Cristal Complex, Gabon: Evidence for Direct Pecipitation of Pt-arsenides from Basaltic Magma. J. Petrol. 2015, 56, 1285–1308. [Google Scholar] [CrossRef]
  57. Sluzhenikin, S.F.; Mokhov, A.V. Gold and silver in PGE-Cu-Ni and PGE ores of the Noril’sk deposis, Russia. Min. Depos. 2015, 50, 465–492. [Google Scholar] [CrossRef]
  58. Badanina, I.Y.; Malitch, K.N.; Lord, R.A.; Belousova, E.A.; Meisel, T.C. Closed-system behaviour of the Re–Os isotope system recorded in primary and secondary platinum-group mineral assemblages: Evidence from a mantle chromitite at Harold’s Grave (Shetland Ophiolite Complex, Scotland). Ore Geol. Rev. 2016, 75, 174–185. [Google Scholar] [CrossRef]
  59. Sinyakova, E.F.; Kosyakov, V.I. The behaviour of noble-metal admixtures during fractional crystallization of As- and Co-containing Cu-Fe-Ni sulfide melts. Russ. Geol. Geophys. 2012, 53, 1055–1076. [Google Scholar] [CrossRef]
Figure 1. (a) Location of the study area; (b) the Kuznetsk Alatau–Gornaya Ghoria–Altai platinum-bearing belt is indicated by black color in the inset (modified from [20]): 1, Kaigadat massif; 2, Srednyaya Ters’ massif; 3, Seglebir massif and placers of Gornaya Shoria; (c) geological map showing the location of PGM and gold placers in the western Altai-Sayan folded area (Gornaya Shoria); (d,e) geological maps of catchment areas r. Kaurchak (d) and r. Koura (e).
Minerals 09 00327 g001
Figure 3. BSE image showing multiphase Grain No. 2. (a) A placer grain of Pt3(Fe,Cu) consists of a rim of Cu-enriched alloy phase (hongshiite PtCu) with inclusions of rhodarsenide (Rh,Pd)2As. (b,c) The exsolution micro-lamellae of rutheniridosmine (the decomposition of a solid solution) in isoferroplatinum and platarsite (PtAsS). For the composition of measurement points see Table 5. White—isoferroplatinum (Pt3Fe) and osmium (Os); light gray and gray—platarsite (PtAsS), cooperite (PtS), and sperrylite (PtAs); rectangular contours—the position of the microsites “b” and “c”.
Minerals 09 00327 g003
Figure 4. Grain No. 3 was derived from the placer of Kaurchak River (dredge 138). (a) Reflected light micrograph of grain No. 3 of the Pt-Fe alloy with alteration sperrylite composition rim (gray) and inclusions and overgrowths of native gold (reddish). (b–f) BSE images showing the structure and morphology of the local areas. Light gray background—matrix Pt4Fe; gray and dark gray rim—sperrylite and platarsite; white inclusions and overgrowths—native gold; the compositions of the Pt-Fe alloy and inclusions at these points are given in Table 7 and Table 8.
Minerals 09 00327 g004
Figure 5. Backscattered-electron image (BSE) (a) and element distribution maps (b—polyelement; c—Pt; d—Fe; e—Ru; f— Au; g—S; h—As) in the grain No. 3 (see Figure 4) platinum nugget.
Minerals 09 00327 g005
Figure 6. The areas of detail 4d of grain No. 3. Distribution patterns obtained in the mapping mode: Au, Ag, Rh, Ru, As, S, Pt.
Minerals 09 00327 g006
Figure 7. Backscattered-electron (BSE) image (top) and the graphs of changes of the main elements content (at.%) in the Core, Rim-I, Rim-II, with micro-layers in grain No. 3 (see also Figure 4e).
Minerals 09 00327 g007
Table 1. Comparison of sample results of WDS (microprobe) and EDS (SEM) of PGM analyzes of rivers Koura and Kaurchak (Gornaya Shoria, southern Siberia, Russia) (wt.%).
PlacerGrainAnalysPtIrOsPdRhRuCuNiFeTotal
Koura82-44WDS11.4816.6145.090.00.7525.420.130.00.4899.97
Koura82-44EDS10.319.243.80.01.025.60.00.00.5100.4
Koura82-44EDS9.118.245.20.01.326.20.00.00.3100.3
Kaurchak66-12WDS87.013.920.910.441.00.430.320.166.29100.39
Kaurchak66-12EDS85.83.81.20.00.80.00.30.06.398.2
Kaurchak66-12EDS88.23.90.00.51.00.50.30.06.2100.6
Koura82-16WDS90.770.200.93 0.040.270.920.16.94100.18
Koura82-16EDS87.0 1.0 0.9 6.498.2
Koura82-16EDS89.7 0.8 0.8 6.497.7
Koura82-32WDS83.461.080.250.211.30.190.590.111.6998.89
Koura82-32EDS83.11.4 1.2 11.697.4
Koura82-32EDS82.30.8 1.7 10.795.5
Koura82-32EDS82.40.6 1.3 11.195.1
Kaurchak66-4WDS89.73 0.680.370.070.250.160.19.05100.48
Kaurchak66-4EDS89.7 0.5 9.198.8
Kaurchak66-4EDS91.6 8.6100.3
Koura82-23WDS88.13 0.741.08 7.8397.83
Koura82-23EDS88.6 0.51.2 7.297.5
Koura82-23EDS90.5 0.31.0 7.499.2
Koura82-23EDS89.6 0.61.1 7.198.4
Koura82-35WDS87.651.390.93 0.193.74 5.4599.35
Koura82-35EDS87.91.9 3.7 5.398.8
Koura82-35WDS74.952.12.7 0.6217.95 0.2798.64
Koura82-35EDS76.91.71.3 20.0 0.2100.1
Koura82-86WDS71.3014.483.74 0.150.360.49 6.997.44
Koura82-86EDS71.119.13.4 0.50.5 6.2100.8
Koura82-86EDS72.914.92.5 0.6 7.198.0
Kaurchak66-20WDS89.210.060.911.271.480.580.54 5.5199.61
Kaurchak66-20WDS88.63 1.011.132.000.520.3 5.9199.54
Kaurchak66-20EDS86.4 0.91.31.90.70.5 6.097.6
Kaurchak66-20EDS85.9 1.21.31.90.60.4 5.596.7
Notes: Zero = under detection limit; blank = not analyzed.
Table 2. The frequency of occurrence of PGMs containing Ru-Os-Ir lamellae in grain No. 1.
PGMNumber of AnalysesAll LamellaeLamellae Thickness 0.1–0.2 μm *
Cuprous isoferroplatinum20 (100%)13 (65%)9 (45%)
Cuprous platinum15 (100%)11 (73%)9 (60%)
Hongshiite42 (100%)5 (12%)1 (2.4%)
* Correspond to analyses in which the content of the sum (Ru + Os + Ir) exceeds 4 at.%.
Table 3. Composition of copper platinum and copper isoferroplatinum of grain No. 1, “pure”, with micro-inclusions of Ru-Os-Ir lamellae and “separated” composition of lamellae, according to SEM-EDS analysis, at.%.
Measured CompositionSum Ru + Os + Ir“Separated” Lamella Composition
FeCuRuOsIrPtRuOsIr
Copper Platinum0.0 *27.21.12.22.166.65.4214039
0.025.23.07.16.857.817.0184240
0.028.31.31.71.367.54.2304030
0.023.94.613.39.249.027.1174934
0.030.00.00.00.070.00.0---
0.030.10.00.00.069.90.0---
0.031.32.54.84.956.512.3203940
0.028.30.51.61.768.03.8---
0.029.80.00.00.070.20.0---
0.022.14.811.510.651.126.9184339
0.022.25.111.99.351.626.3194535
0.030.00.00.00.071.10.0---
0.028.51.22.52.265.65.9214237
0.028.40.81.52.167.24.4183448
Copper Isoferroplatinum0.029.90.00.00.070.10.0---
16.29.10.00.00.074.70.0---
15.18.91.21.42.271.34.7252946
15.510.90.00.00.073.60.0---
14.89.71.32.52.269.56.0224137
13.59.52.56.85.961.815.2164539
11.910.94.59.68.354.822.4204337
15.111.40.00.00.073.50.0---
15.411.10.00.00.073.50.0---
12.79.04.28.08.657.620.7203841
15.312.00.00.00.072.80.0---
15.09.91.01.30.072.82.3---
15.511.30.00.00.073.20.0---
16.19.80.00.00.073.30.0---
15.610.90.00.00.073.50.0---
14.69.20.91.62.271.54.7193546
14.79.70.81.92.071.14.6174043
14.110.30.91.31.372.23.5---
14.59.40.91.62.371.34.8193447
13.411.70.61.71.571.23.8---
15.010.00.80.71.272.32.7---
* bold highlights analyses with the sum of Ru + Os + Ir > 4.0%. Zero = not detected.
Table 4. The result of determining the composition of emulsion inclusions of rhodarsenide in grain No. 1, according to SEM-EDS analysis.
NoFeCuAsRuRhPdOsIrPtTotal%
12.82.011.00.522.05.31.01.353.899.7wt.
23.12.39.10.714.210.80.01.657.098.7wt.
16.34.018.70.727.26.30.70.935.2100.0at.
27.34.815.90.918.213.40.01.138.5100.0at.
Table 5. The composition of isoferroplatinum (1–10) and platarsite (11–22) of grain No. 2, “clean” and with inclusions of Ru-Os-Ir lamellae, according to SEM-EDS analysis, at.%.
No 1SFeCuAsRuRhSbOsIrPtTotal 2, wt.%
10.0 319.83.30.01.61.80.03.62.267.797.2
20.018.20.00.03.10.01.912.25.758.995.7
30.013.40.00.07.81.10.028.710.138.993.6
40.022.60.00.00.00.01.80.00.075.696.9
50.020.40.00.01.50.02.50.02.872.899.6
60.021.60.00.01.20.02.11.21.672.496.3
70.020.90.01.10.01.11.61.92.570.998.4
80.021.81.00.01.10.01.60.02.272.497.6
90.019.50.00.02.30.01.510.52.563.896.4
100.019.50.00.02.50.00.09.82.465.994.3
1137.70.00.011.51.94.00.010.43.730.896.3
1233.20.00.017.02.55.70.010.55.226.095.3
1340.60.00.016.51.45.50.00.02.633.5100.2
1439.60.00.010.21.02.90.05.13.038.196.6
1528.72.90.029.11.418.50.00.72.716.1101.5
1633.00.00.026.61.811.10.02.35.419.898.4
1720.40.50.037.51.413.10.09.63.713.8102.8
1817.50.00.046.81.18.30.52.02.521.497.0
1926.60.00.034.92.65.30.01.87.221.6100.5
2012.30.00.050.60.84.40.72.22.926.398.4
2124.40.40.039.51.015.60.01.93.413.8100.1
2223.60.60.039.71.215.30.02.02.914.797.4
1 The binding of points is given in Figure 3c. 2 Total atom = 100%. 3 Analyses with the sum Ru + Os + Ir > 4.0% are highlighted in bold. Zero = not detected.
Table 6. A "separated" composition (at.%) of Ru-Os-Ir lamellae of grain No. 2.
No 1RuOsIrΣPGM 2
1214930100Isoferroplatinum
2155827100Isoferroplatinum
3176222100Isoferroplatinum
9156916100Isoferroplatinum
10176716100Isoferroplatinum
11126523100Platarsite
12145829100Platarsite
17106525100Platarsite
1 The binding of points is given in Figure 3c. 2 PGM is a mineral containing Ru-Os-Ir lamellae.
Table 7. The composition of the core in grain No. 3 (Figure 4) and its inclusions and micro lamellae (at.%), determined by the SEM-EDS method.
Site 1No 2SFeCoCuRuRhPdOsIrPtFormulaMineral
4b10.016.80.01.11.03.12.10.00.075.8(Pt,Fe)Pt-Fe alloy
4b470.317.30.31.31.13.32.11.00.074.5(Pt,Fe)Pt-Fe alloy
4c380.017.50.01.31.13.320.00.074.5(Pt,Fe)Pt-Fe alloy
4d200.018.00.01.21.23.120.00.074.6(Pt,Fe)Pt-Fe alloy
4e600.016.60.41.11.33.32.31.30.873(Pt,Fe)Pt-Fe alloy
4f700.017.40.01.61.13.21.91.10.073.8(Pt,Fe)Pt-Fe alloy
4b 34337.02.02.0 34.40.621.824.30.00.07.7(Rh,Pd)3S2Untitled
4b4462.00.00.00.00.333.51.00.60.51.5RhS2Untitled
4b4530.00.00.011.30.50.055.60.30.01.6Pd2SUntitled
4b4657.80.00.00.03.636.10.00.40.31.2Rh2S3Bowieite
4c370.00.00.00.01.33.50.087.53.44.3Os0.95Ir0.04Ru0.01Osmium
4e480.04.30.00.05.01.90.069.00.918.9Os0.92Ru0.07Ir0.01Osmium
4e490.06.10.00.06.62.60.957.40.026.4Os0.90Ru0.10Osmium
4e500.04.90.00.04.22.40.565.31.321.4Os0.92Ru0.06Ir0.02Osmium
1 Site in Figure 4; 2 The binding of points is given in Figure 4; 3 At point 43 (Figure 4b). Zero = not detected.
Table 8. Full and “separated” chemical composition (at.%) (SEM-EDS method) Rim-I in areas with eutectic microstructure.
Site 1No 2SFeAsRuRhPdAgOsIrPtAu
Full composition in areas with eutectic microstructure
4b60.00.014.60.06.20.011.31.60.05.261.1
4d1411.01.06.90.52.10.011.31.60.56.158.1
4d1515.60.412.51.04.90.08.81.40.75.548.6
4d1617.30.415.90.97.20.08.01.30.76.041.7
4d1716.51.79.60.53.10.09.71.40.66.349.9
4d2215.81.113.10.96.30.08.41.40.58.143.5
4f6915.20.612.40.94.90.09.71.40.78.146.1
Separated composition of the sulfoarsenides in areas with eutectic microstructure
4b60.00.052.90.022.50.0 5.80.018.8
4d1437.03.423.21.77.10.0 5.41.720.5
4d1537.11.029.82.411.70.0 3.31.713.1
4d1634.80.832.01.814.50.0 2.61.412.1
4d1741.64.324.21.37.80.0 3.51.515.9
4d2233.52.327.81.913.30.0 3.01.117.2
4f6934.41.428.12.011.10.0 3.21.618.3
Separated composition of inclusions of native gold (Au-I) in areas with eutectic microstructure
4b6 9.0 91.0
4d14 10.0 90.0
4d15 9.0 91.0
4d16 9.0 91.0
4d17 9.0 91.0
4d22 10.0 90.0
4f69 10.0 90.0
1 Site in Figure 4; 2 The binding of points is given in Figure 4.
Table 9. Full and “separated” chemical composition Rim-II.
SFeCoCuAsRuRhPdAgTeOsIrPtAuHg
Full composition of the sulfide layer
Mean40.62.20.00.213.53.37.60.11.10.34.81.819.65.10.0
Min33.70.20.00.07.71.45.30.00.00.21.00.52.80.00.0
Max46.84.50.00.418.26.811.40.33.40.49.24.231.017.00.0
Separated composition of the sulfide layer
Mean43.22.30.00.214.43.58.10.1 0.35.11.920.9
Min33.70.20.00.07.71.45.30.0 0.21.00.59.2
Max43.54.50.00.418.25.810.20.3 0.39.23.231.0
Full composition of the sulfoarsenide layer
Mean15.70.20.30.050.30.03.70.10.00.50.10.028.40.50.0
Min10.30.00.00.037.40.01.10.00.00.30.00.026.10.00.0
Max26.40.91.70.056.80.06.000.60.00.70.70.031.43.30.0
Separated composition of the sulfoarsenide layer
Mean15.80.20.10.050.90.03.80.0 0.50.10.028.7
Min10.60.00.00.037.50.01.10.0 0.30.00.026.2
Max26.71.00.10.055.90.06.00.2 0.70.50.031.5
Full composition of the arsenide layer
Mean7.30.71.40.157.50.10.50.90.31.00.00.029.11.00.0
Min4.10.00.00.054.80.00.00.00.00.00.00.028.60.00.0
Max11.81.41.90.658.70.52.51.71.41.60.00.030.26.10.0
Separated composition of the arsenide layer
Mean7.41.41.40.158.30.10.50.9 1.00.00.029.5
Min4.10.60.00.054.80.00.00.0 0.00.00.028.5
Max11.82.21.90.661.90.52.51.7 1.70.00.030.9
Separated composition of inclusions of native gold (Au-II)
Mean 9.9 90.30.0
Min 9.0 90.00.0
Max 10.0 91.00.0
Separated composition of inclusions of native gold (Au-III)
Mean 1.7 91.76.5
Min 1.0 87.04.0
Max 2.0 94.012.0
Table 10. “Separated” composition of inclusions of native gold (wt.%) in PGM grain No. 3 (Figure 4).
Site 1No 2AuAgHgFormulaAu Generation
4b490100Au0.83Ag0.17Au-I
4b69190Au0.84Ag0.16Au-I
4d1490100Au0.84Ag0.14Au-I
4d159190Au0.85Ag0.15Au-I
4d169190Au0.84Ag0.16Au-I
4d179190Au0.84Ag0.16Au-I
4d2290100Au0.84Ag0.16Au-I
4e5290100Au0.83Ag0.17Au-I
4e5390100Au0.82Ag0.18Au-I
4f619190Au0.85Ag0.15Au-I
4f6290100Au0.84Ag0.16Au-I
4f6990100Au0.83Ag0.17Au-I
4b290100Au0.84Ag0.16Au-II
4b590100Au0.83Ag0.17Au-II
4b790100Au0.84Ag0.16Au-II
4b129190Au0.85Ag0.15Au-II
4e5490100Au0.83Ag0.17Au-II
4f639190Au0.84Ag0.6Au-II
4b387112Au0.86Ag0.03 Hg0.12Au-III
4c309424Au0.93Ag0.03Hg0.04Au-III
4c319226Au0.91Ag0.03Hg0.06Au-III
4c329424Au0.92Ag0.03Hg0.04Au-III
1 Site in Figure 4, from 4b to 4f; 2 The binding of points is given in Figure 4. Zero = not detected.

