Silician Magnetite: Si–Fe-Nanoprecipitates and Other Mineral Inclusions in Magnetite from the Olympic Dam Deposit, South Australia

 , , , and
Abstract
:1. Introduction
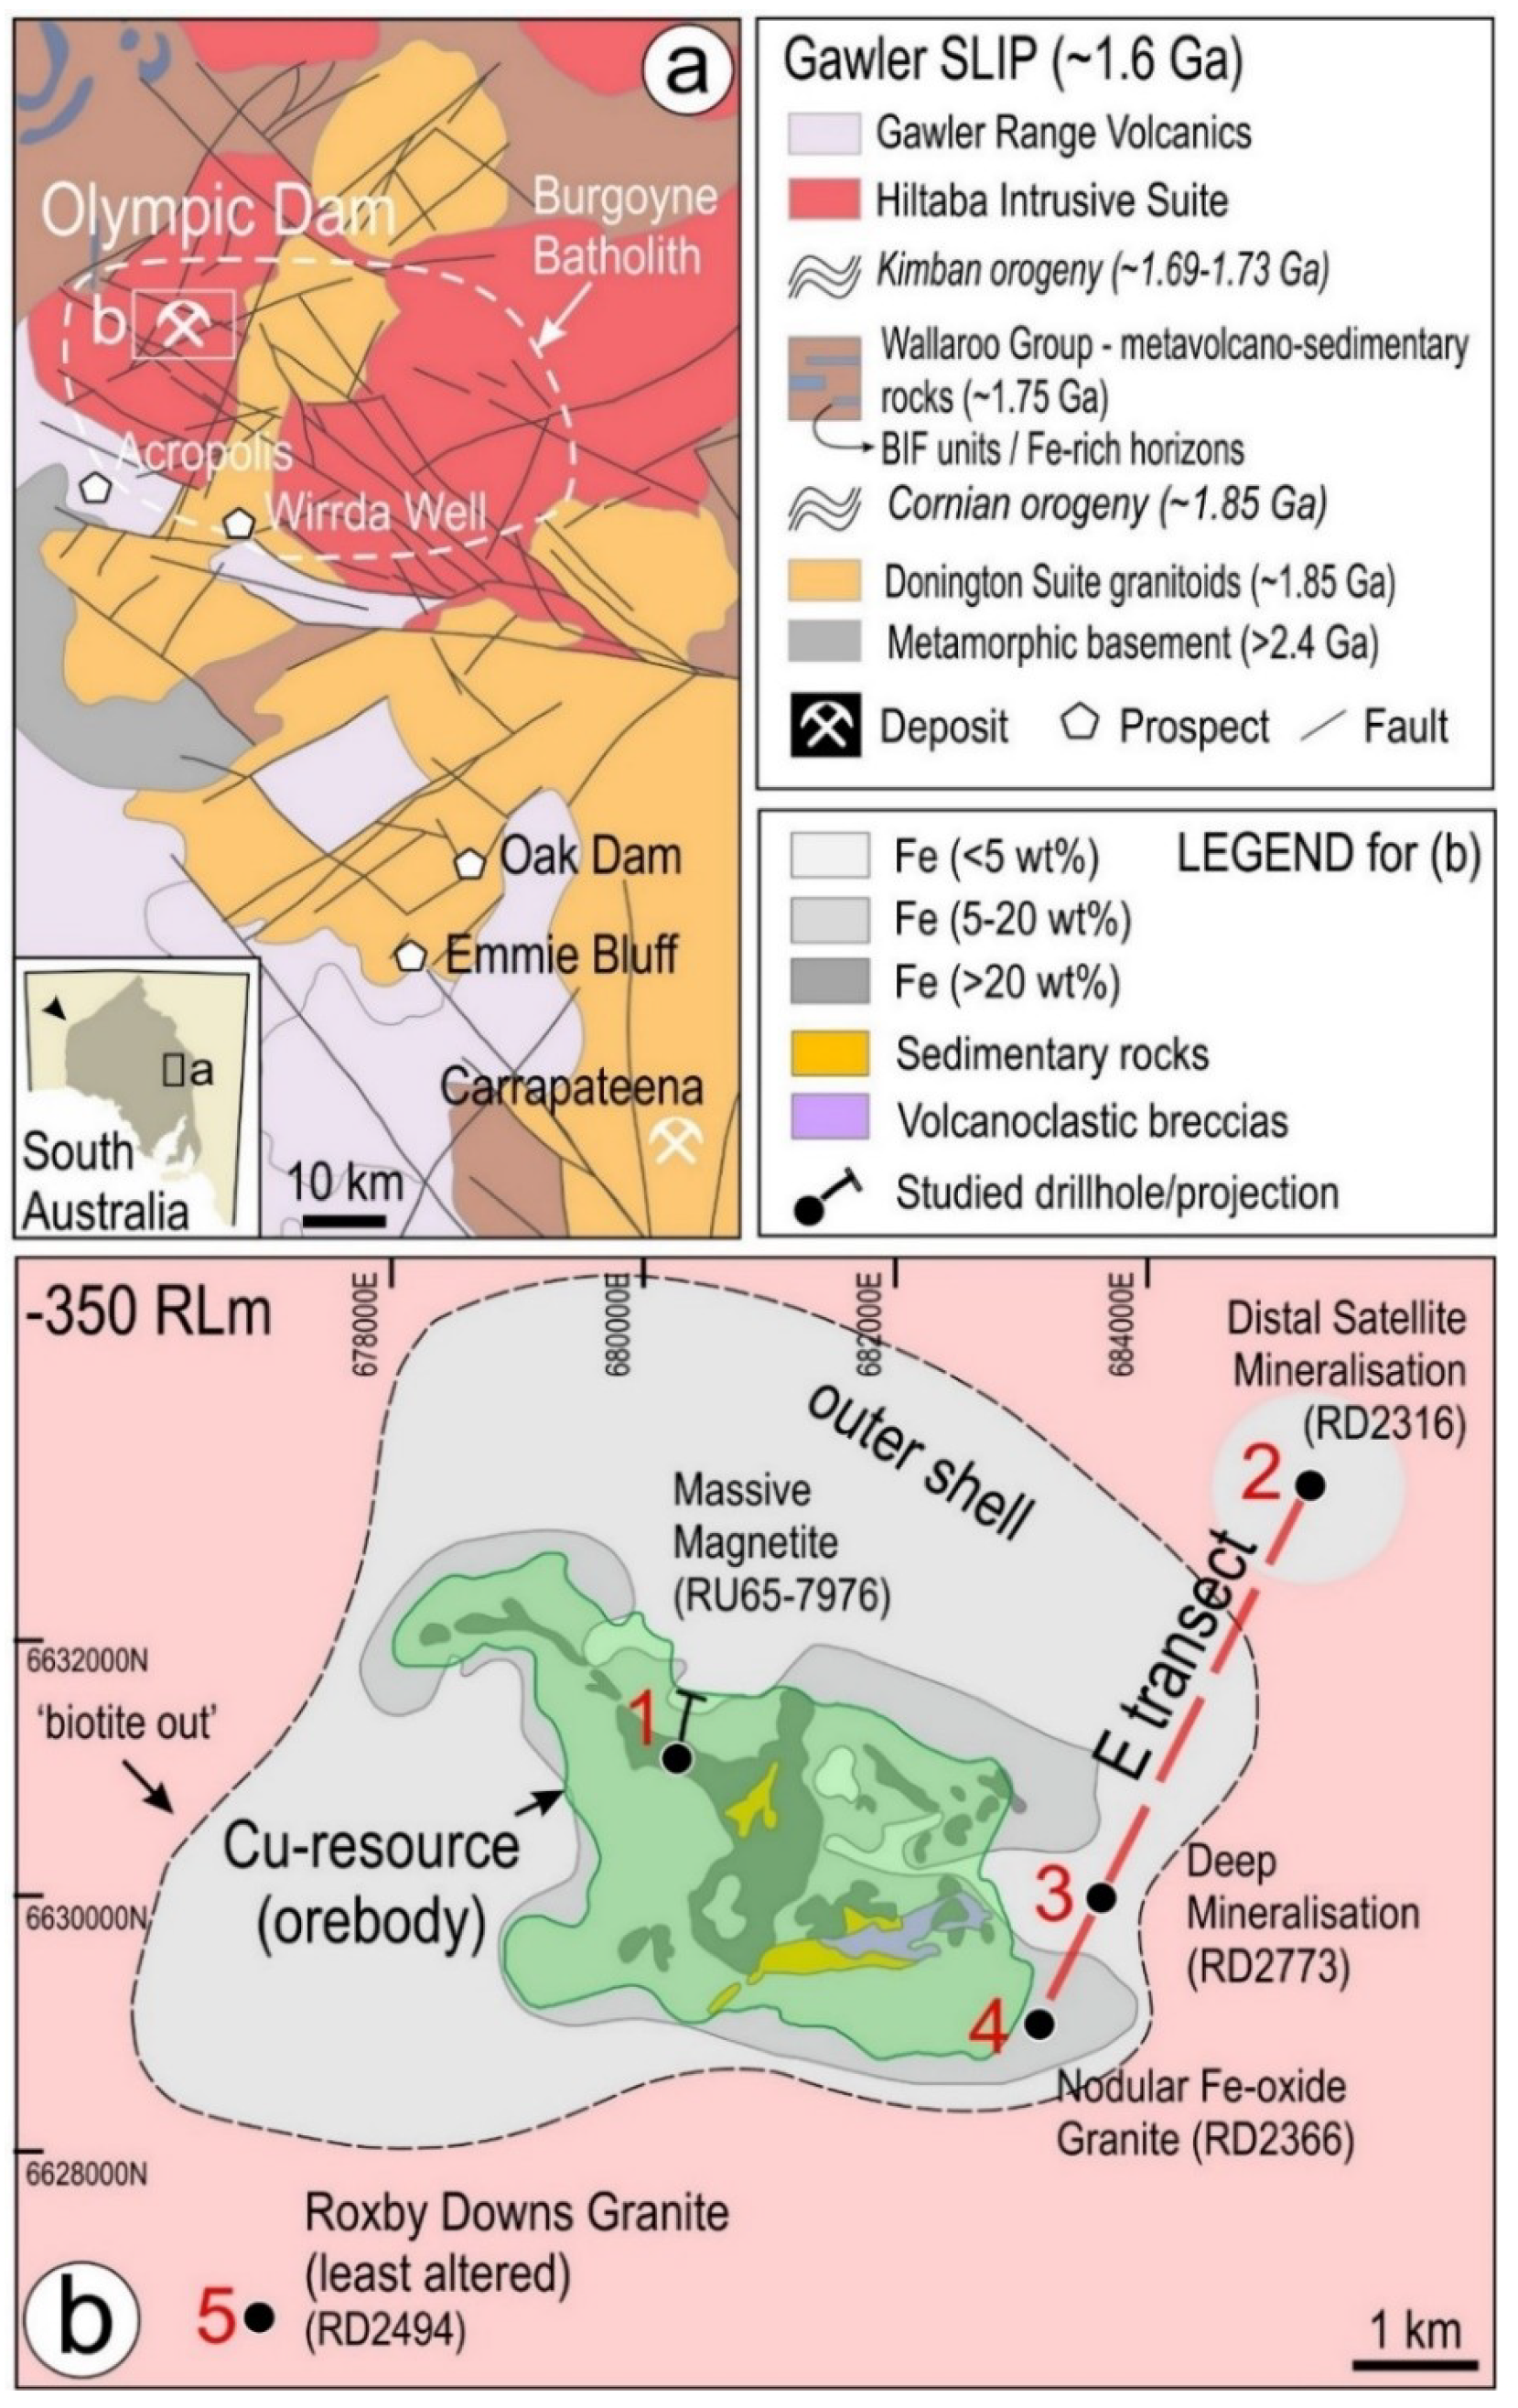
2. Geological Background and Sample Selection
3. Methodology
4. Results
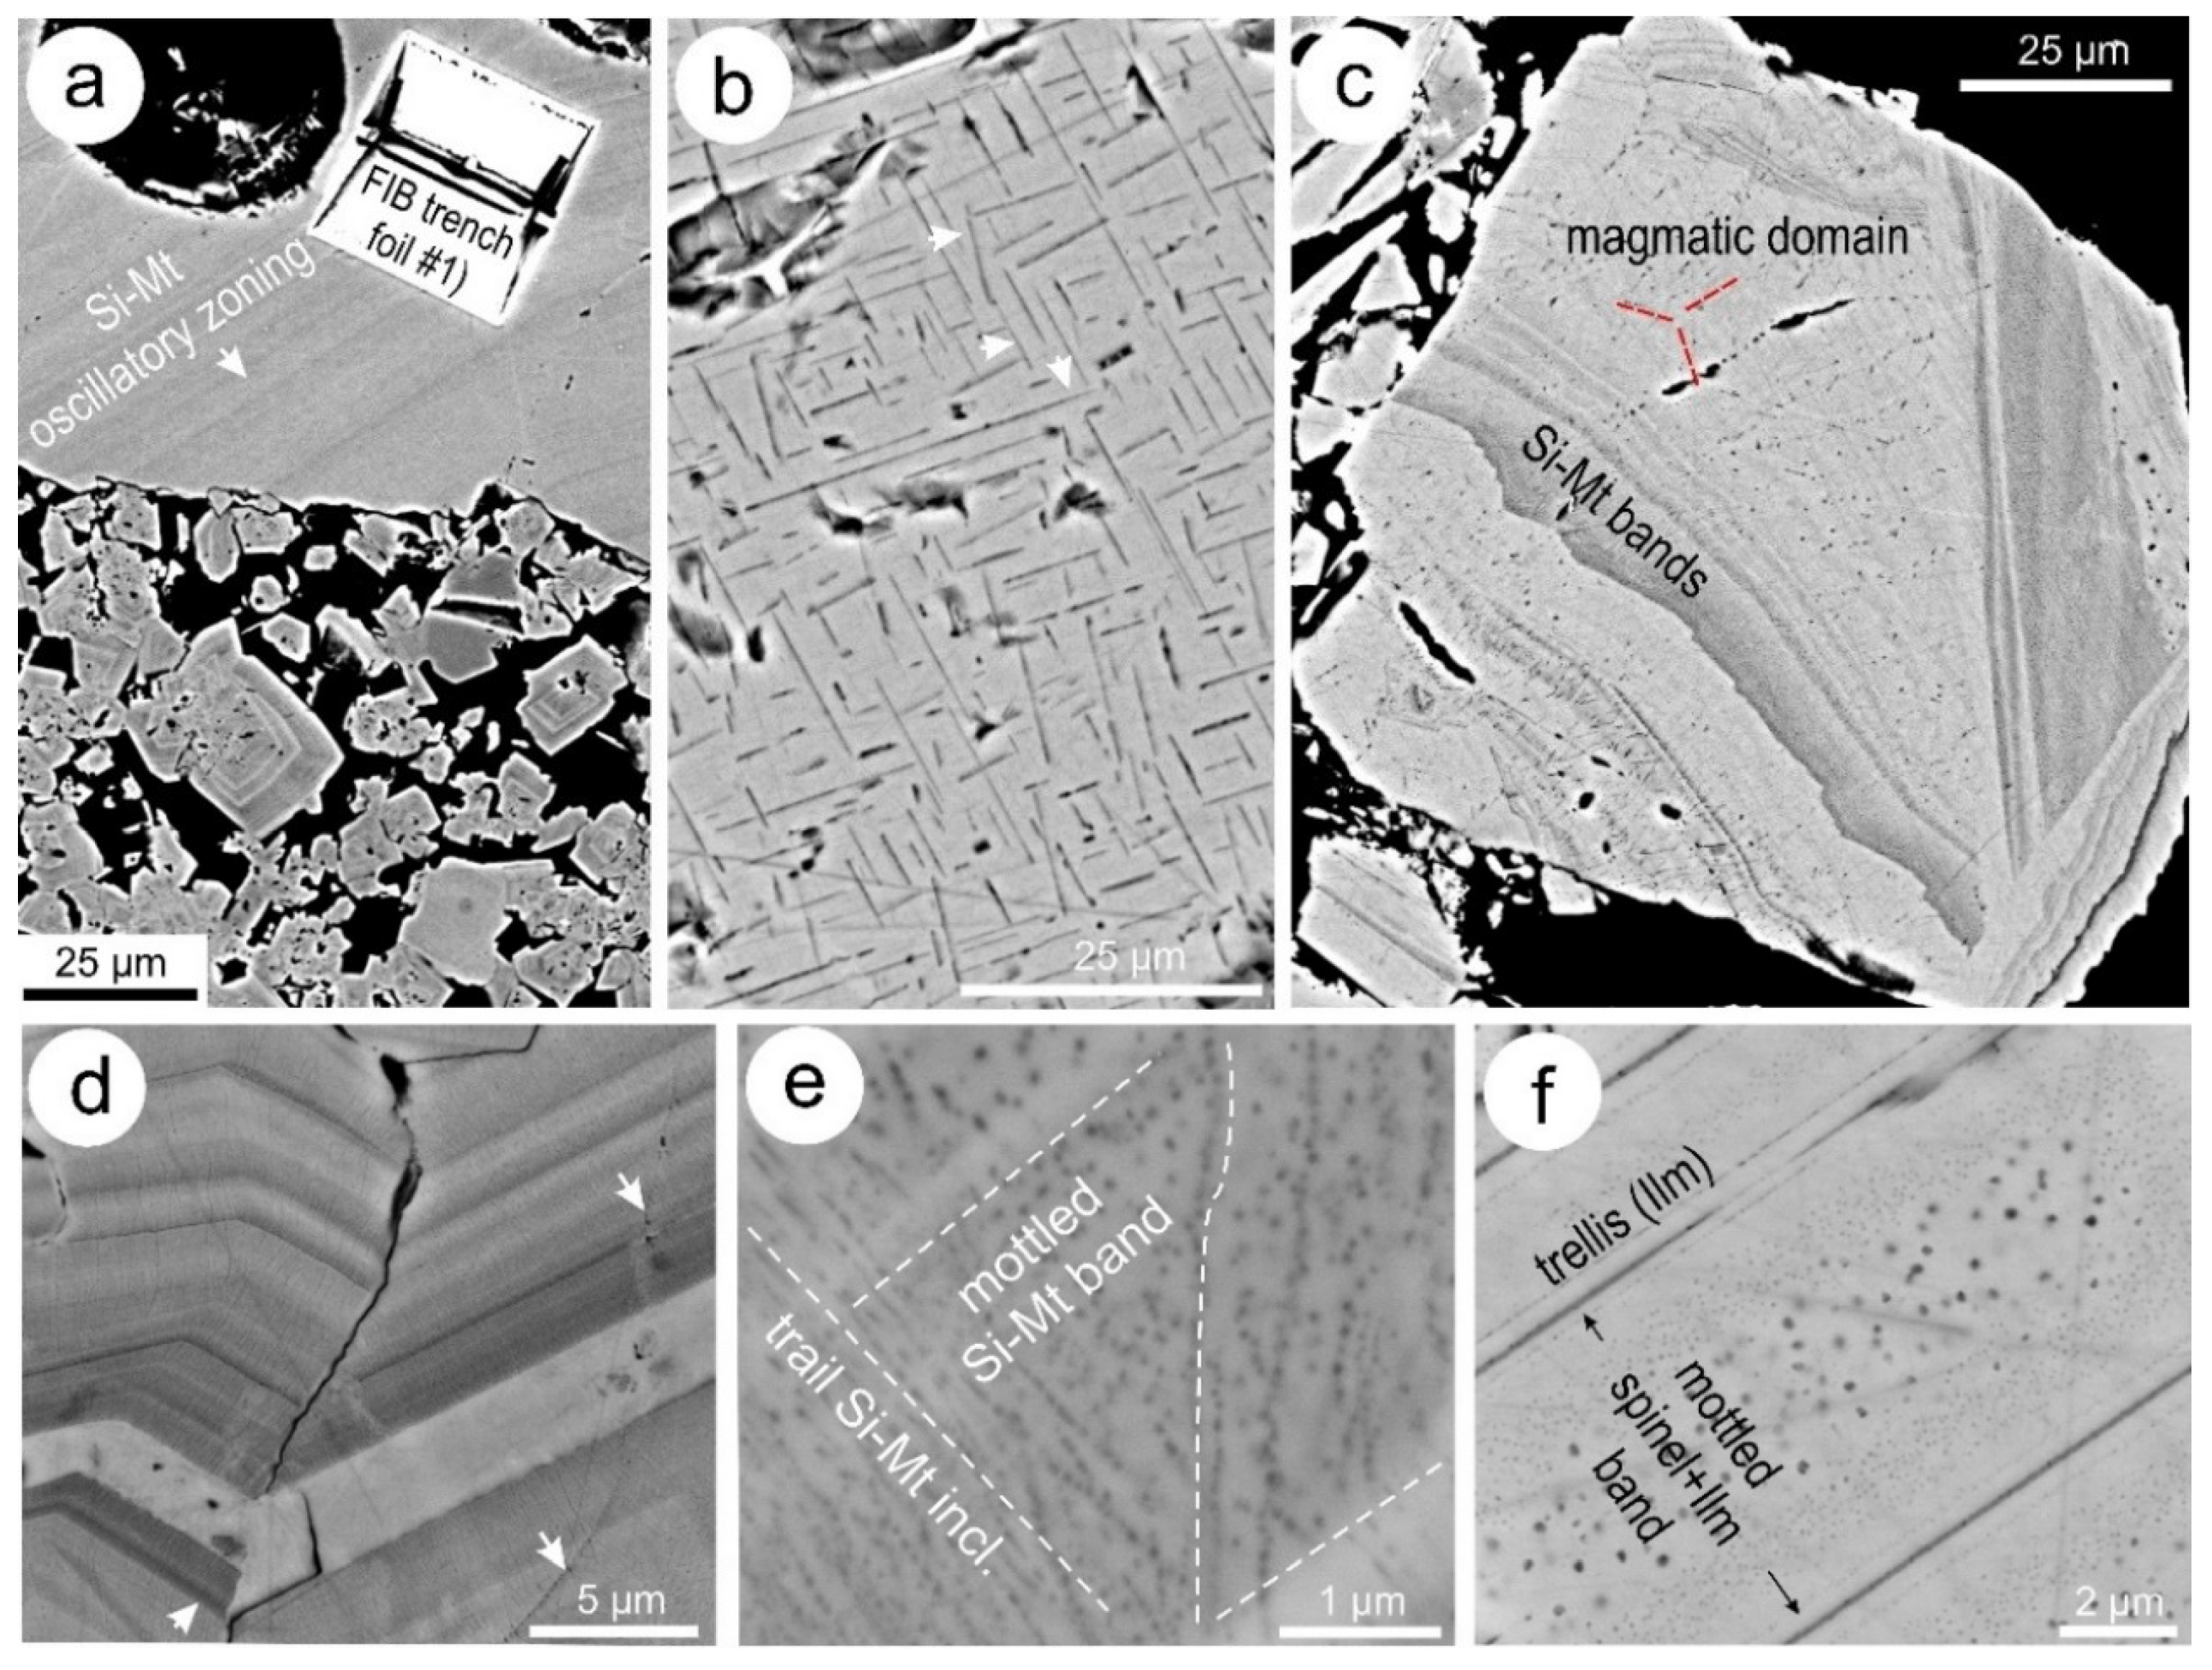
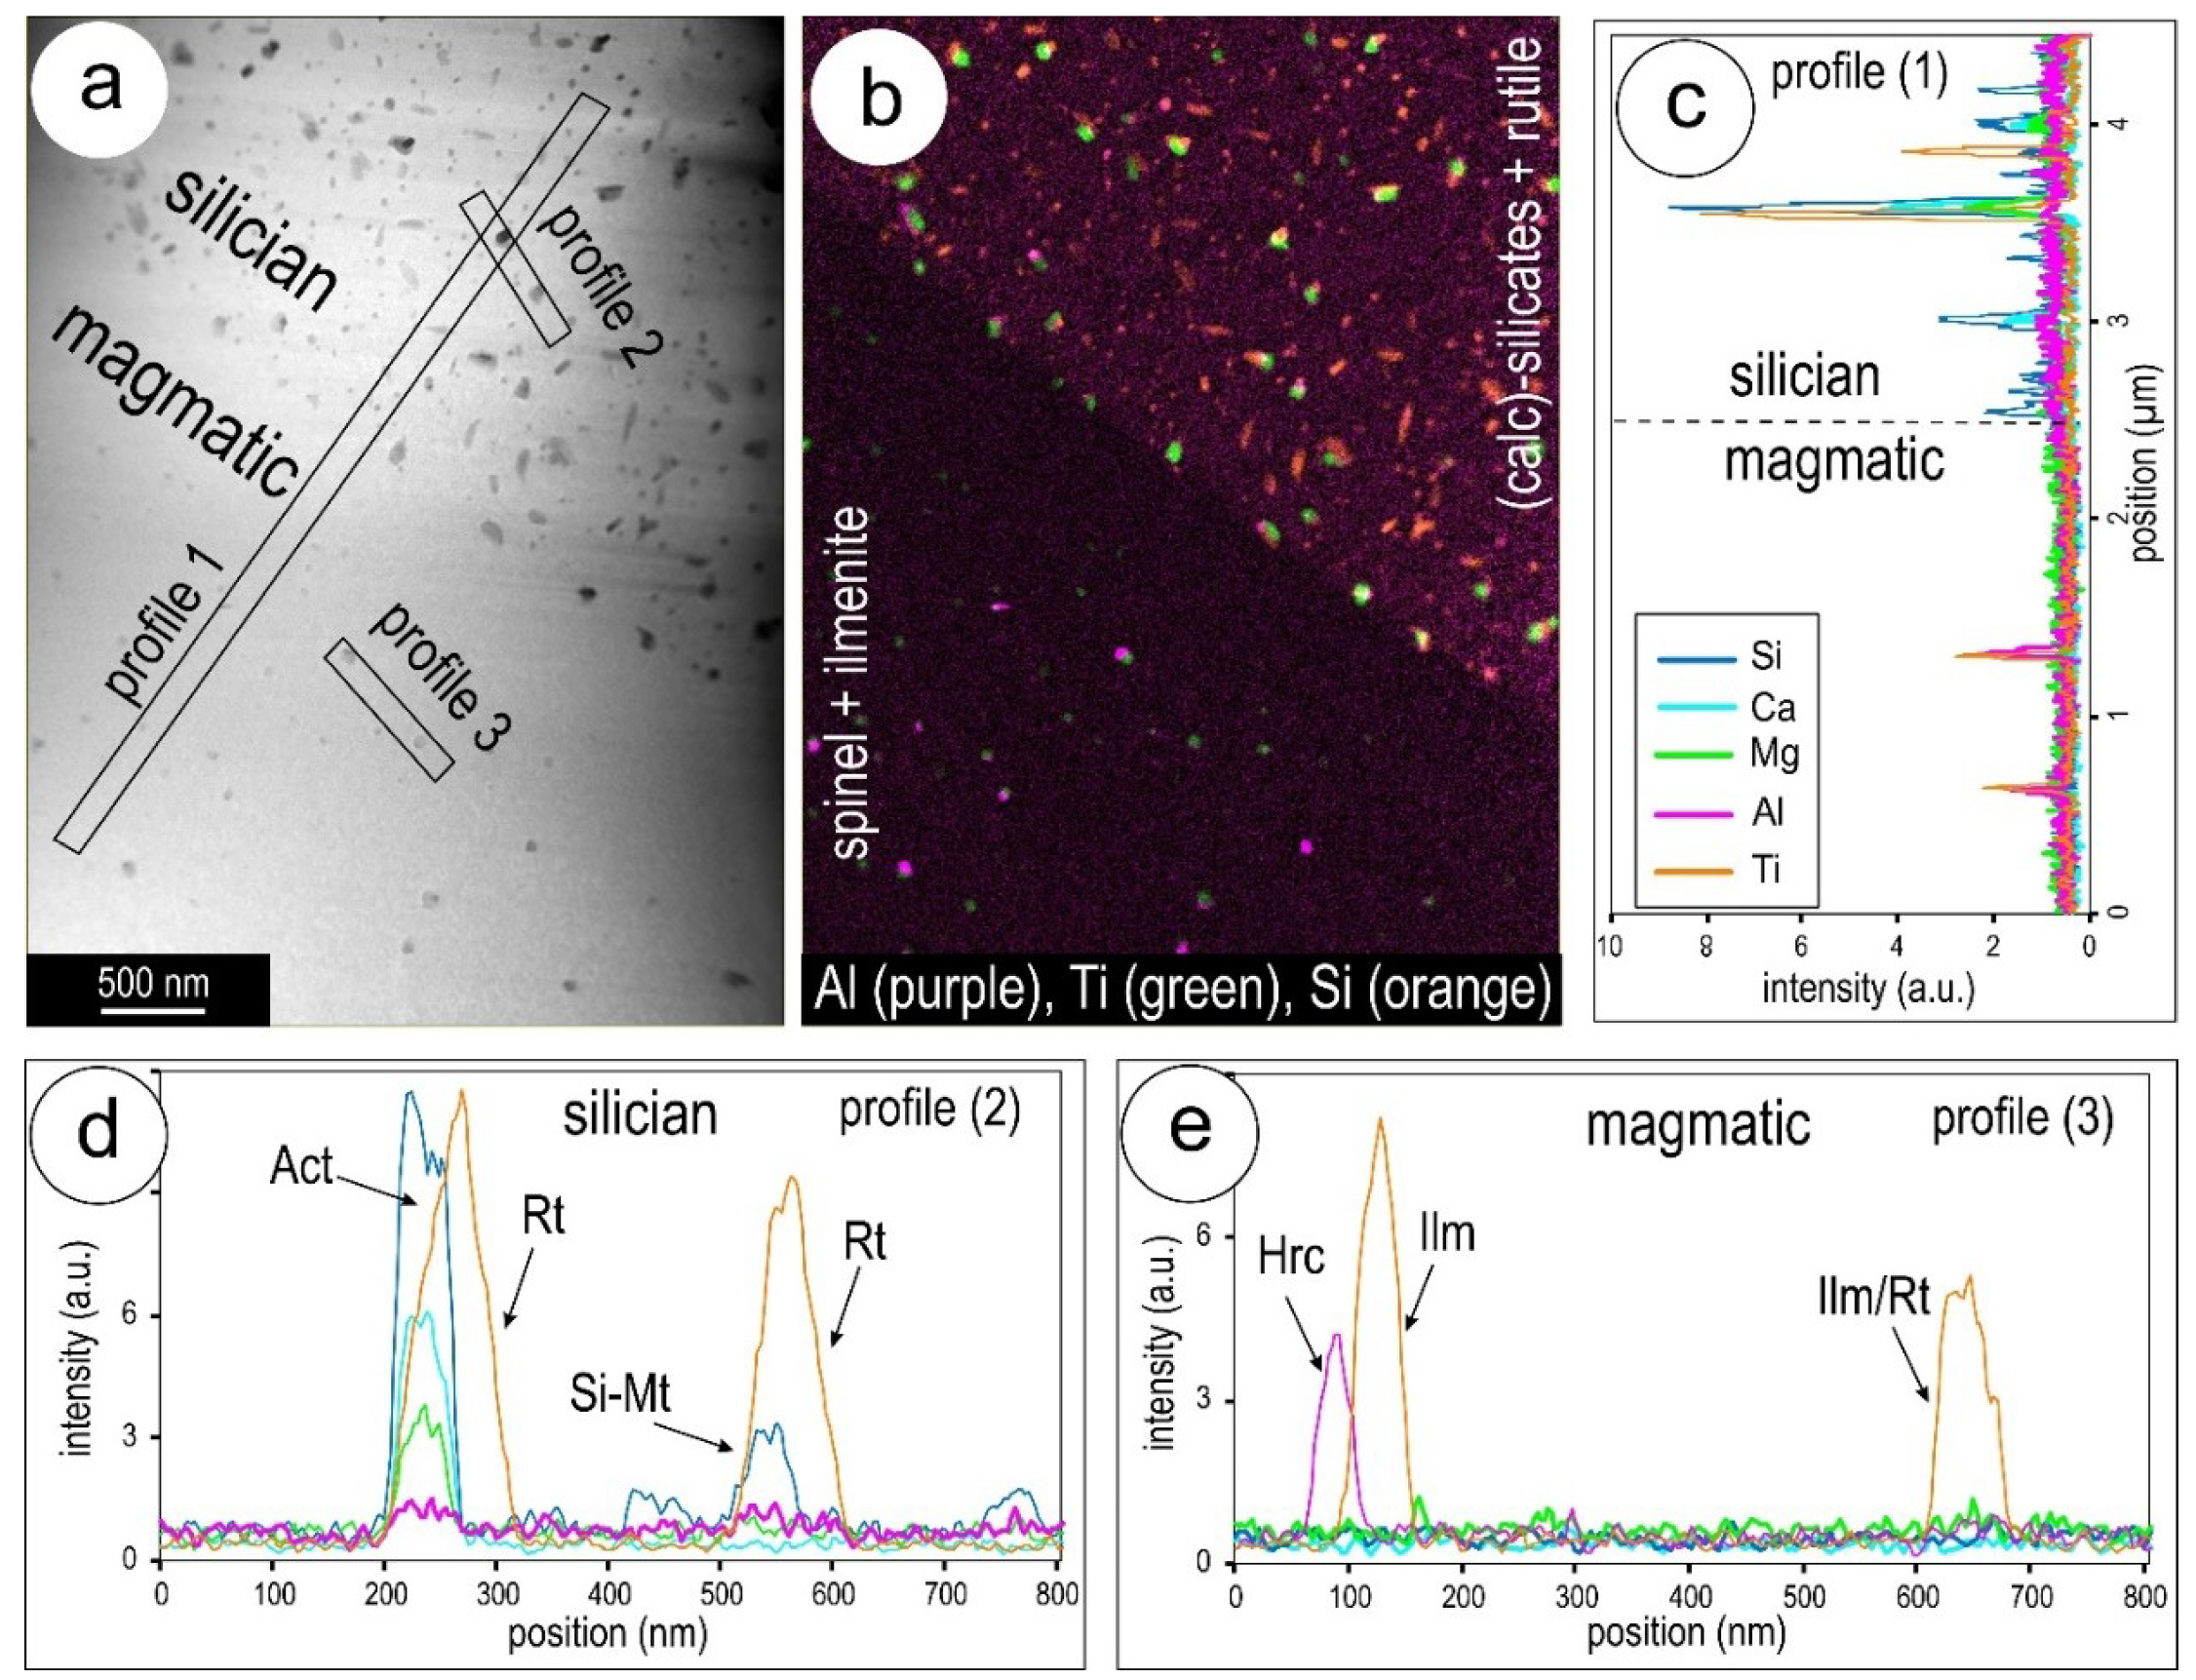
4.1. Petrography
4.2. Trace Element Distributions from Micron to Nanoscale
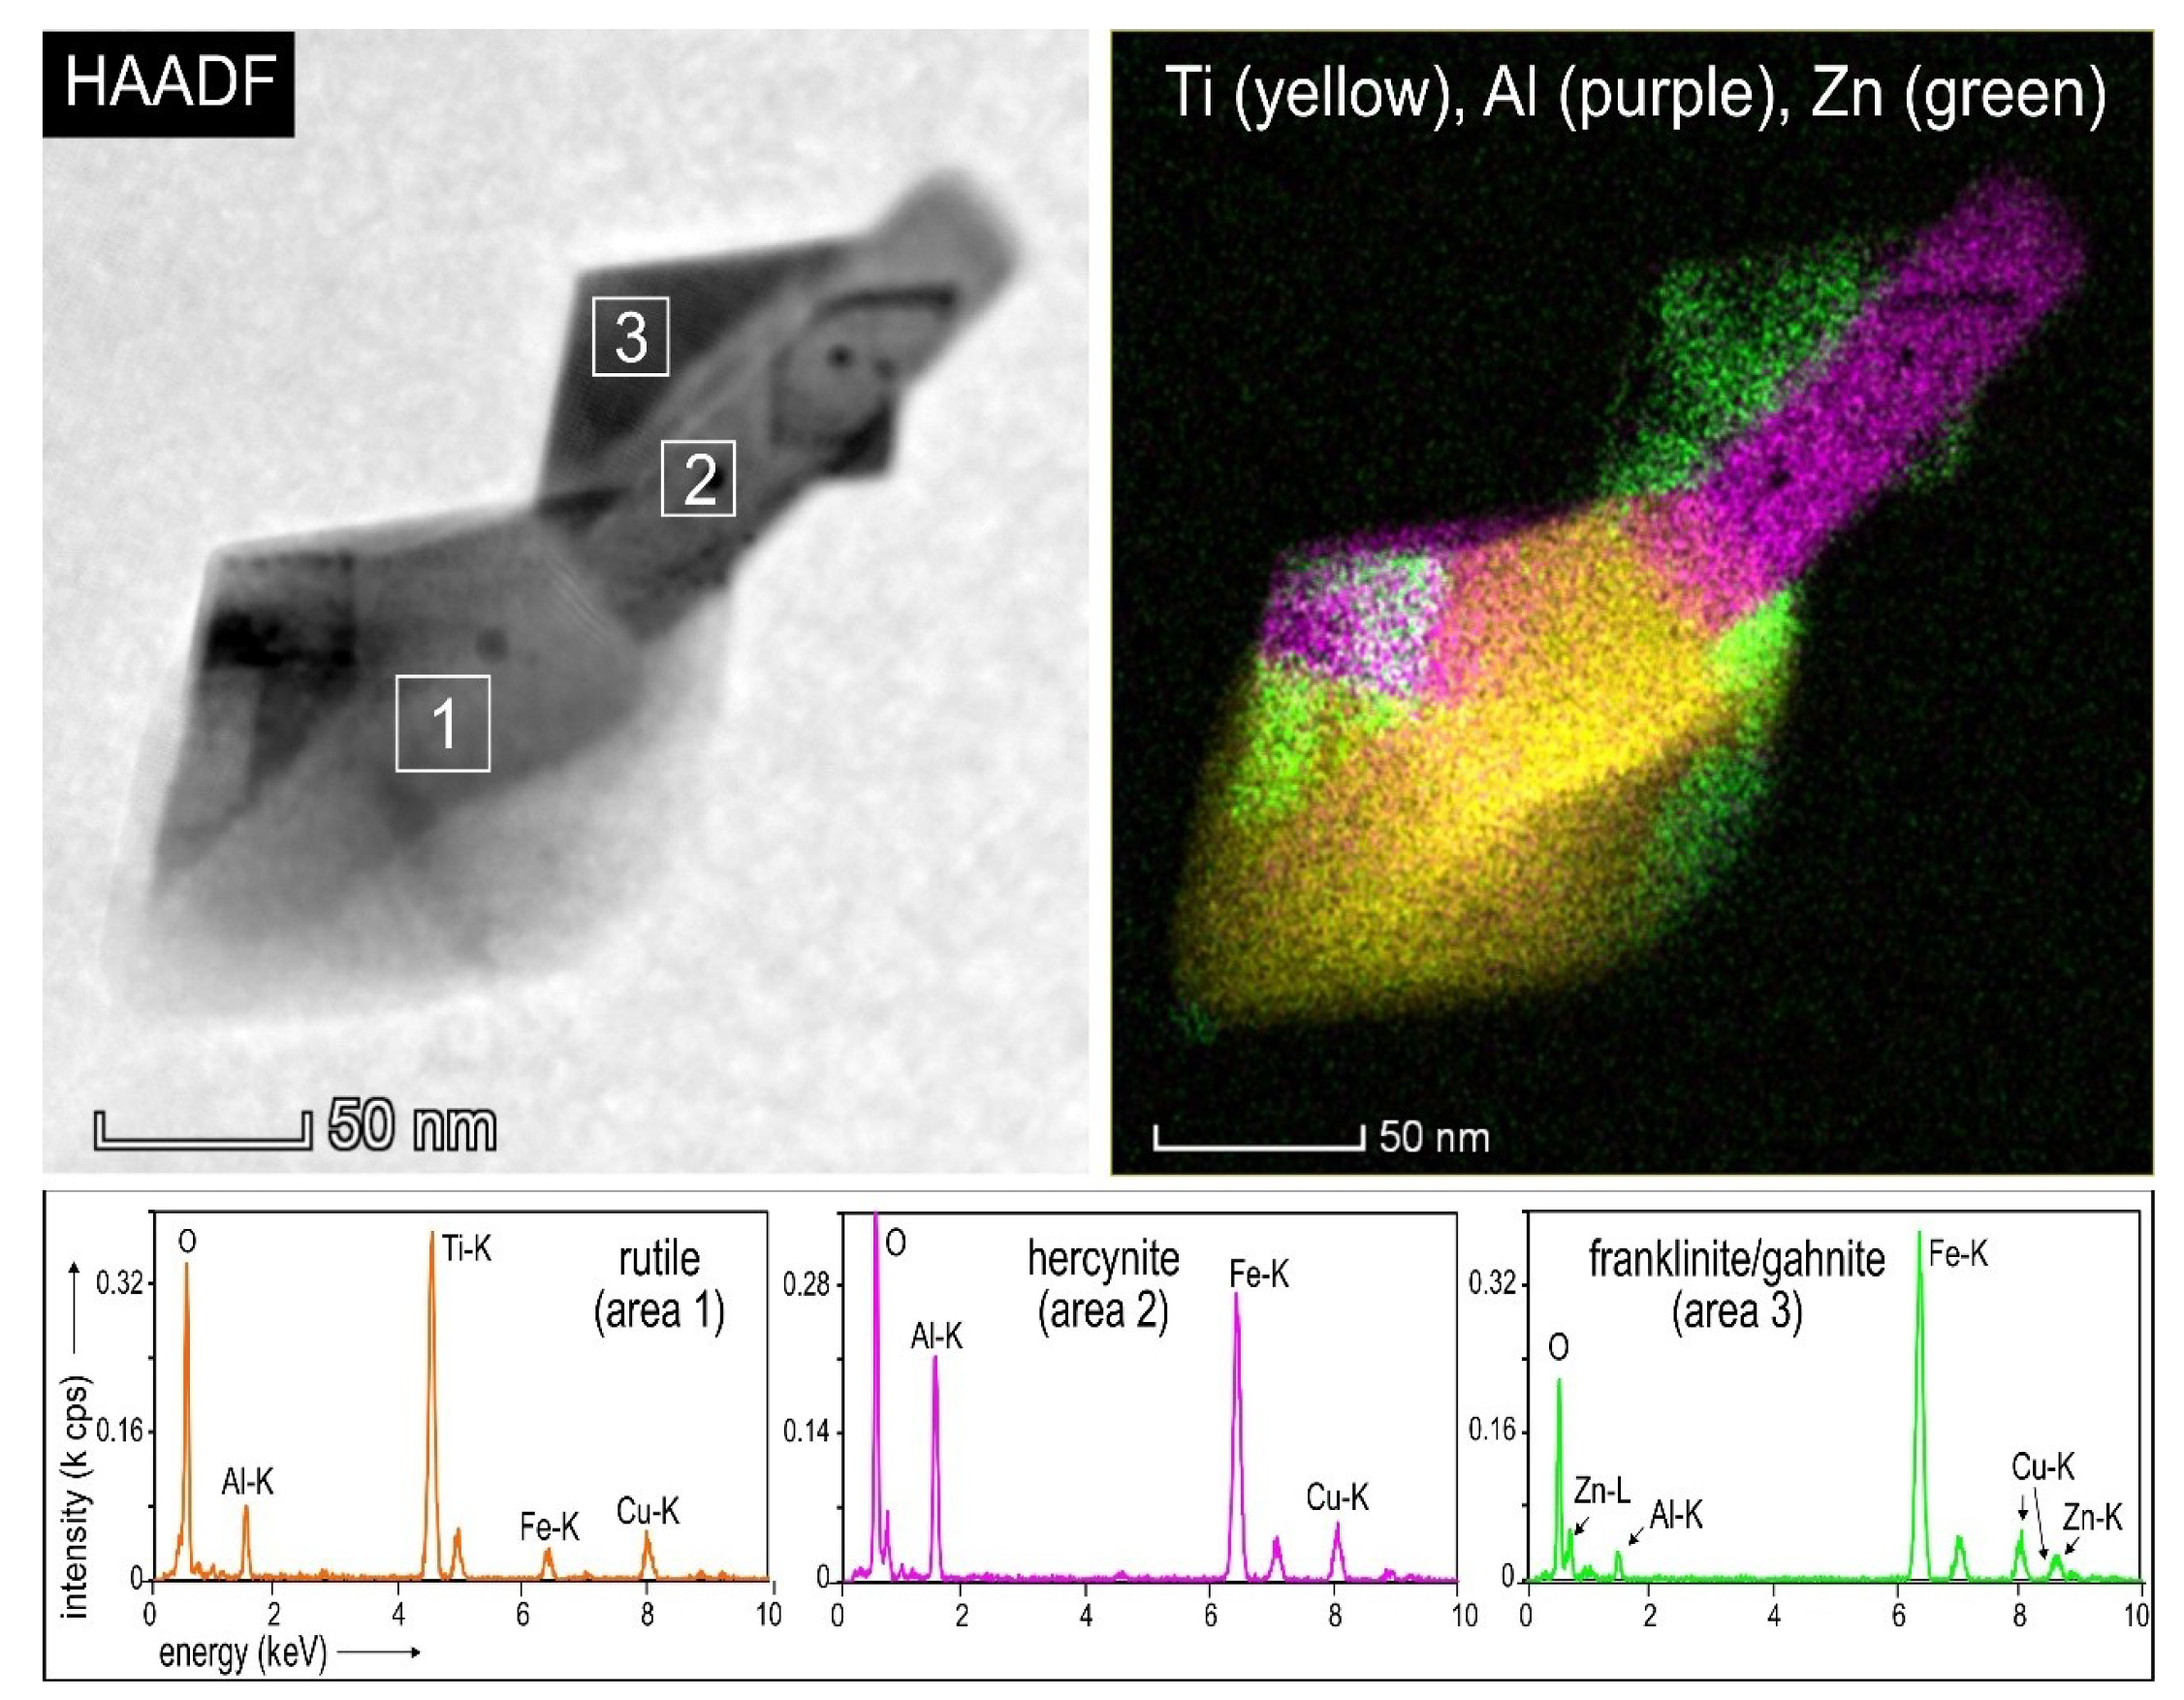
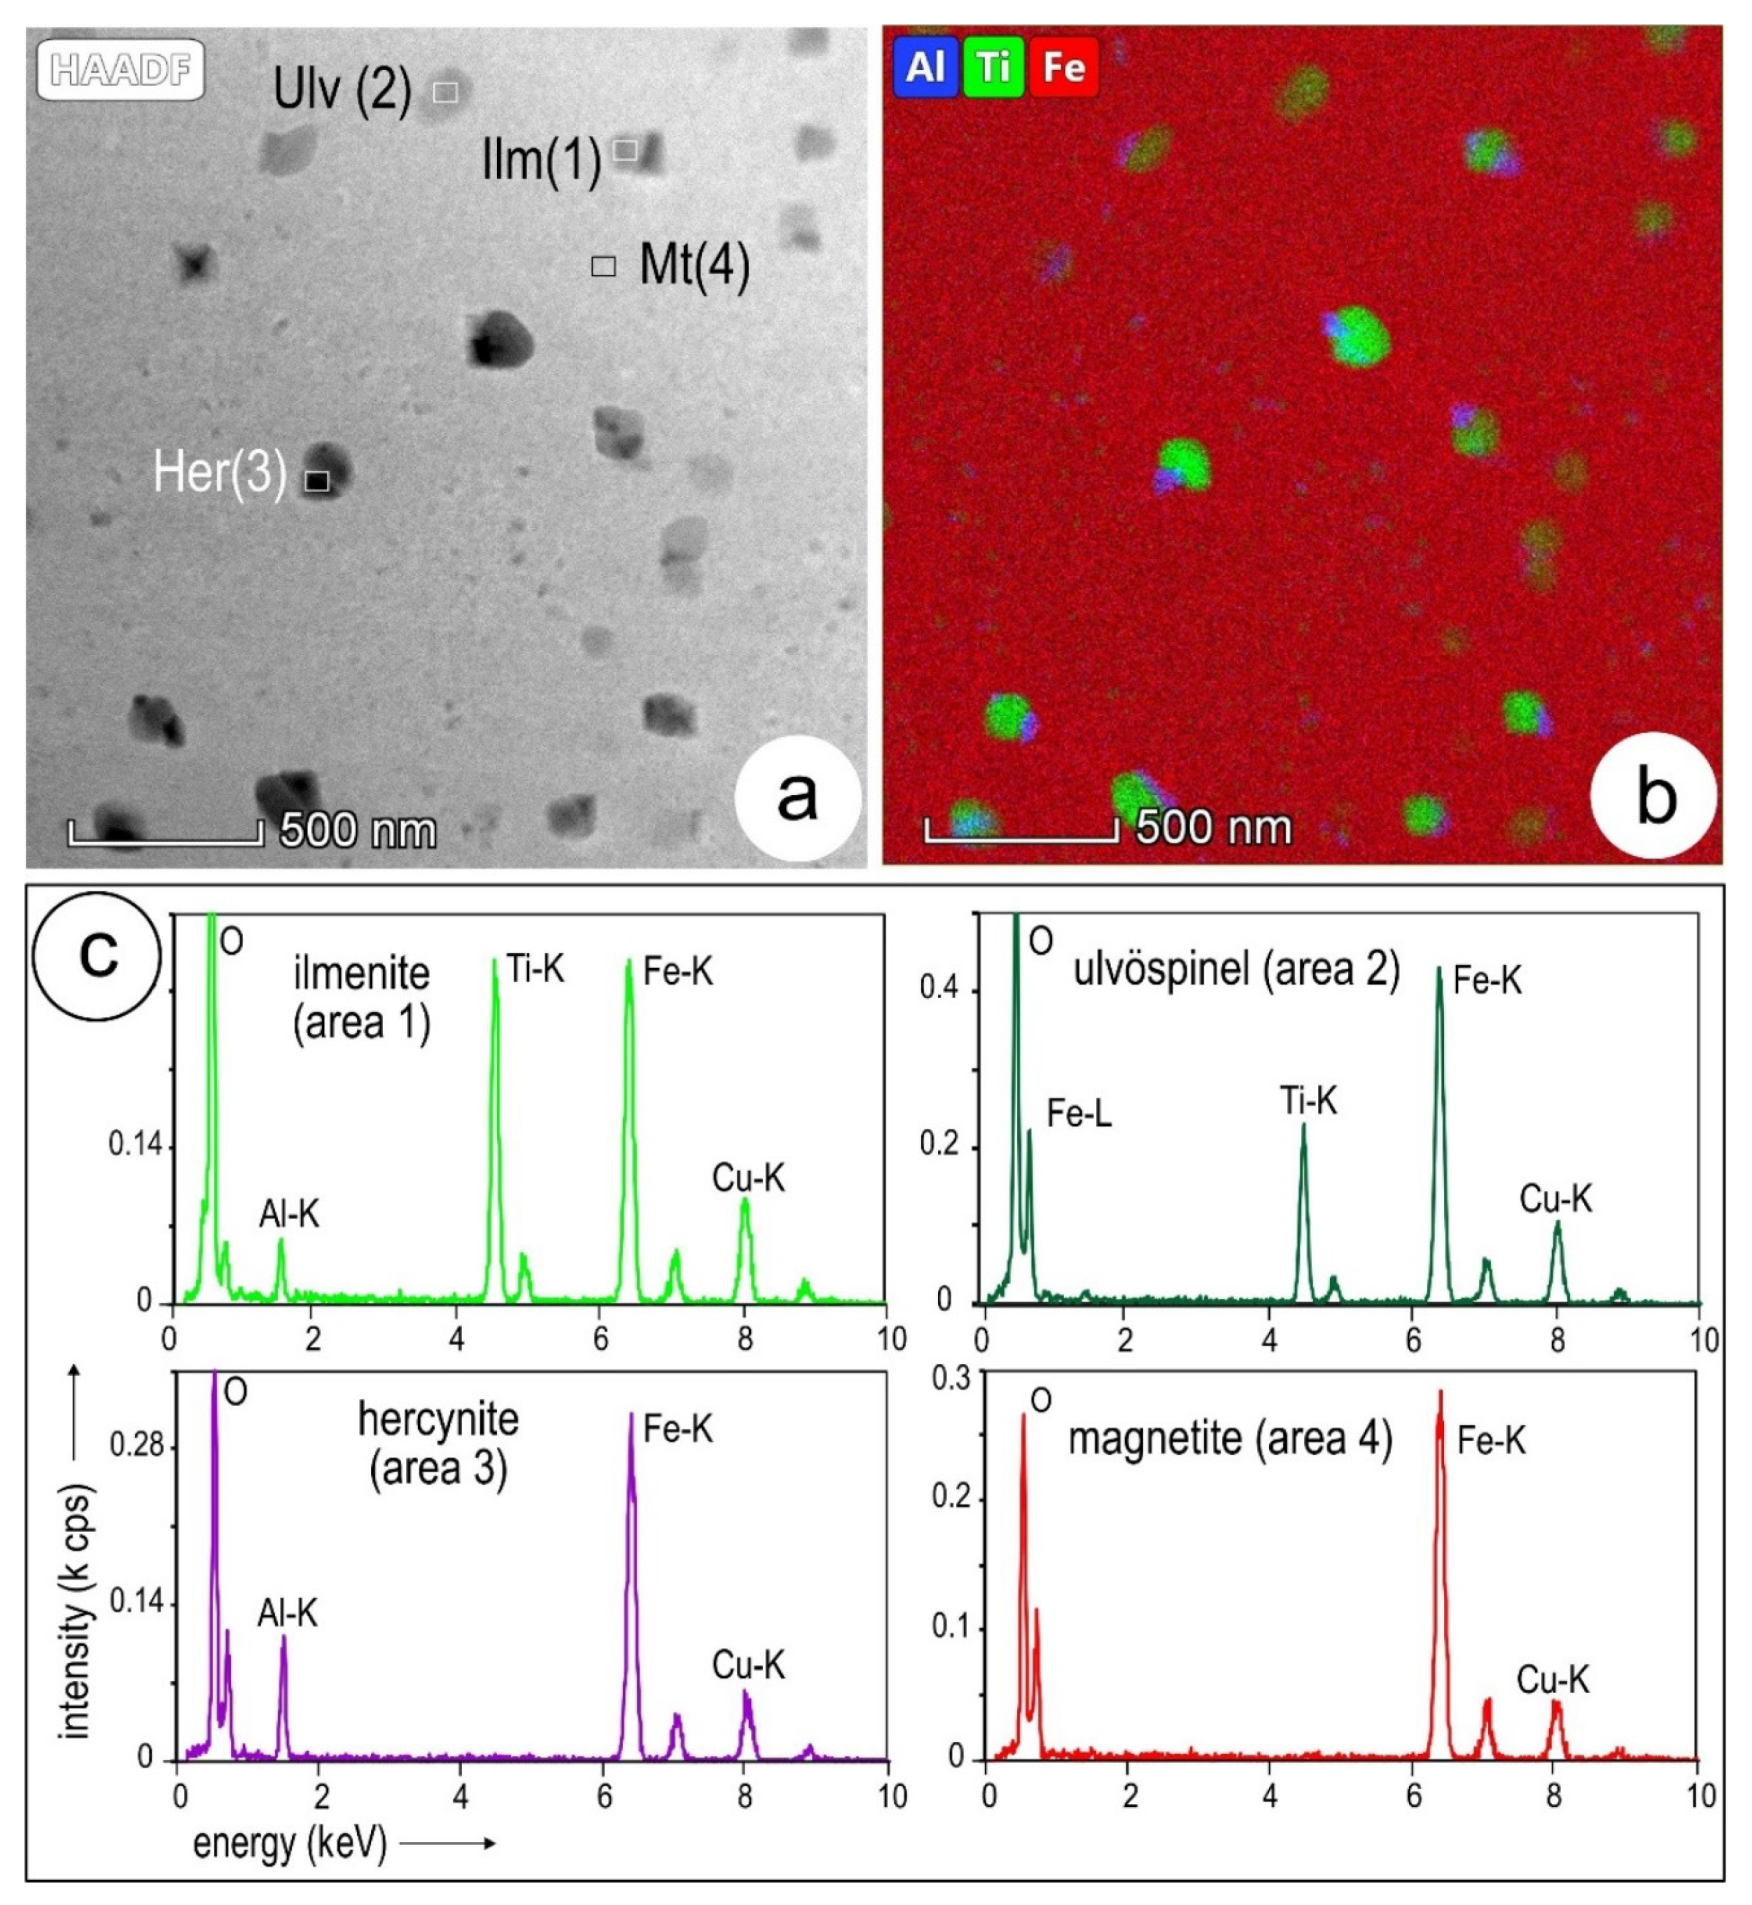
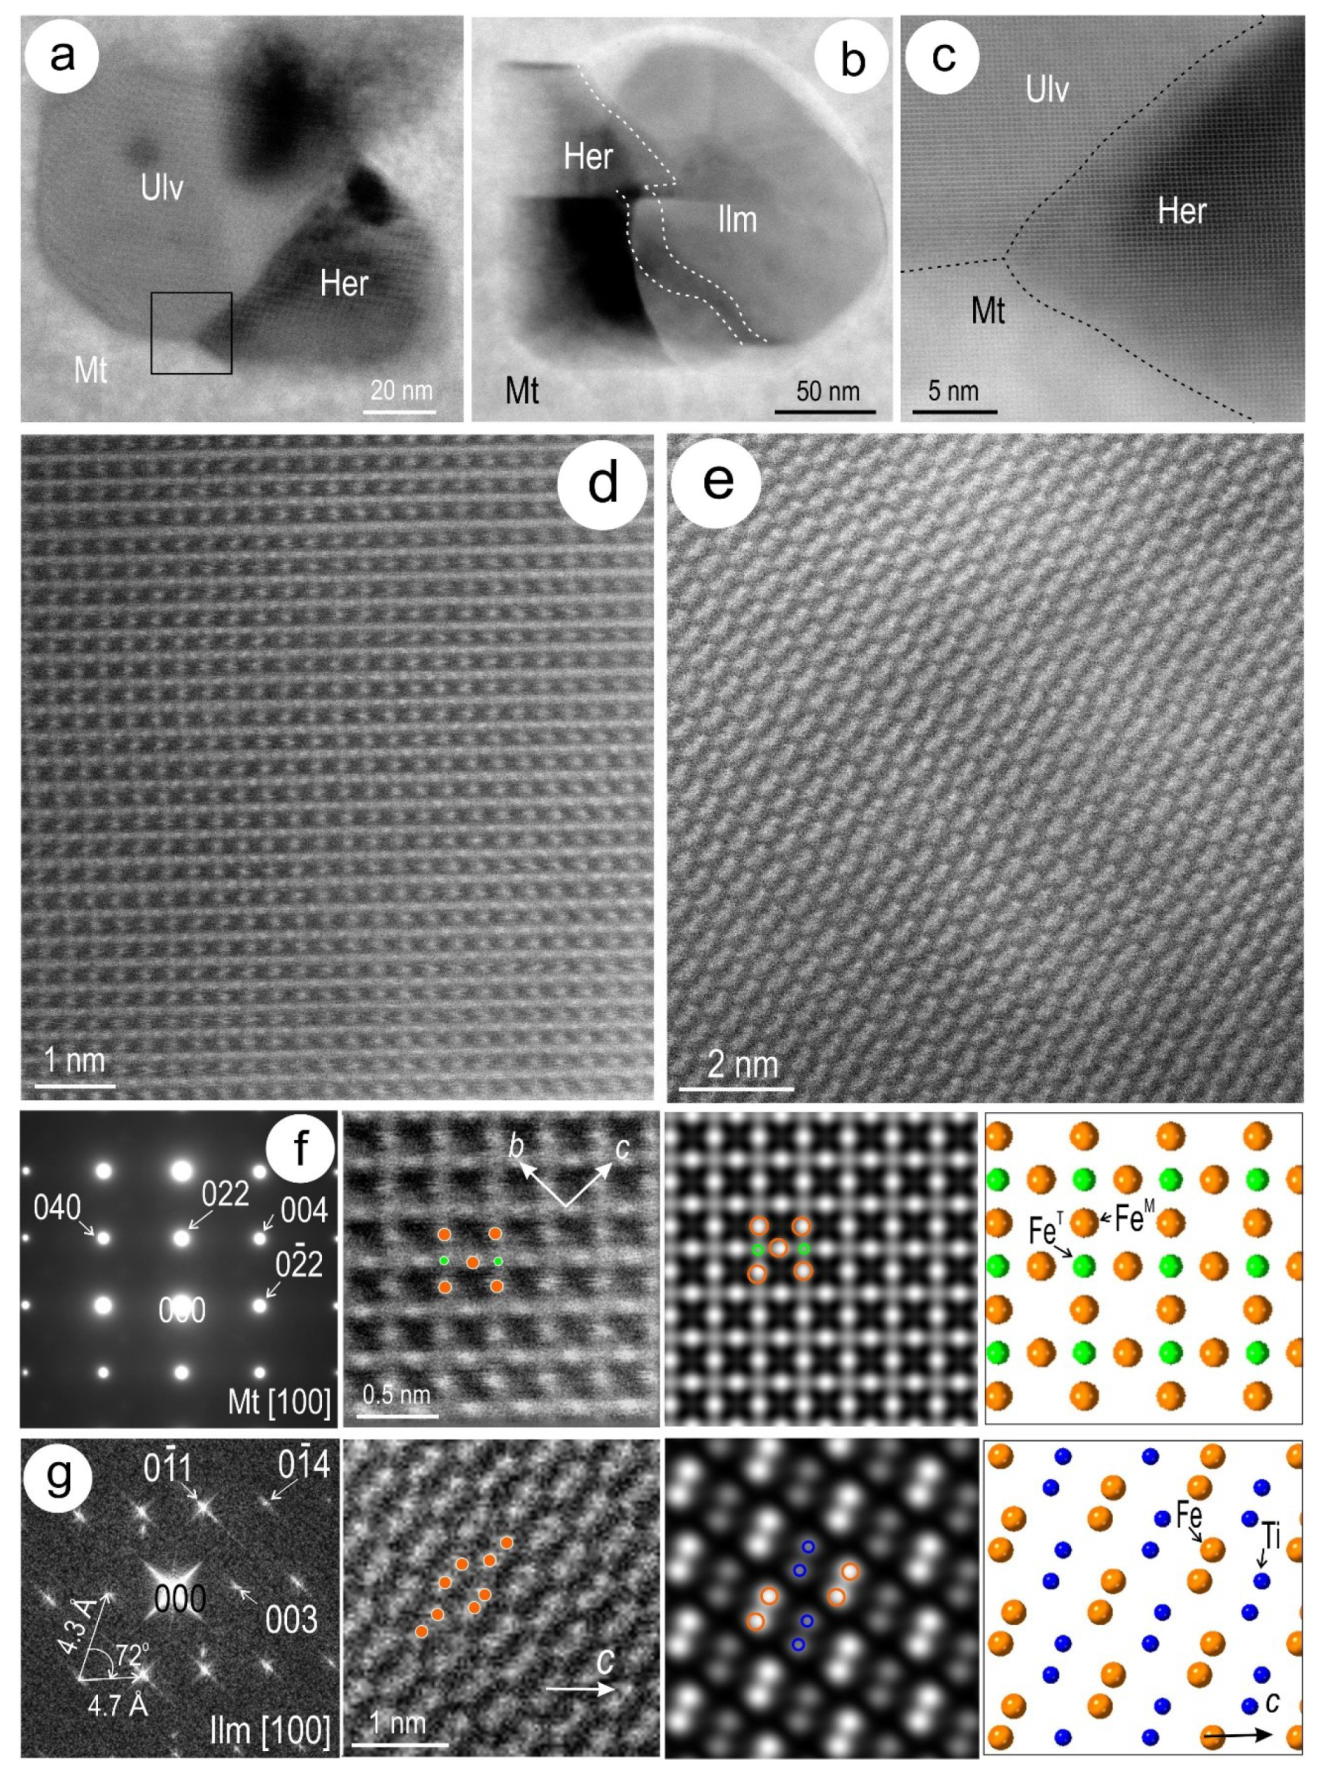
4.3. Ilmenite and Spinel Inclusions in Magmatic Magnetite
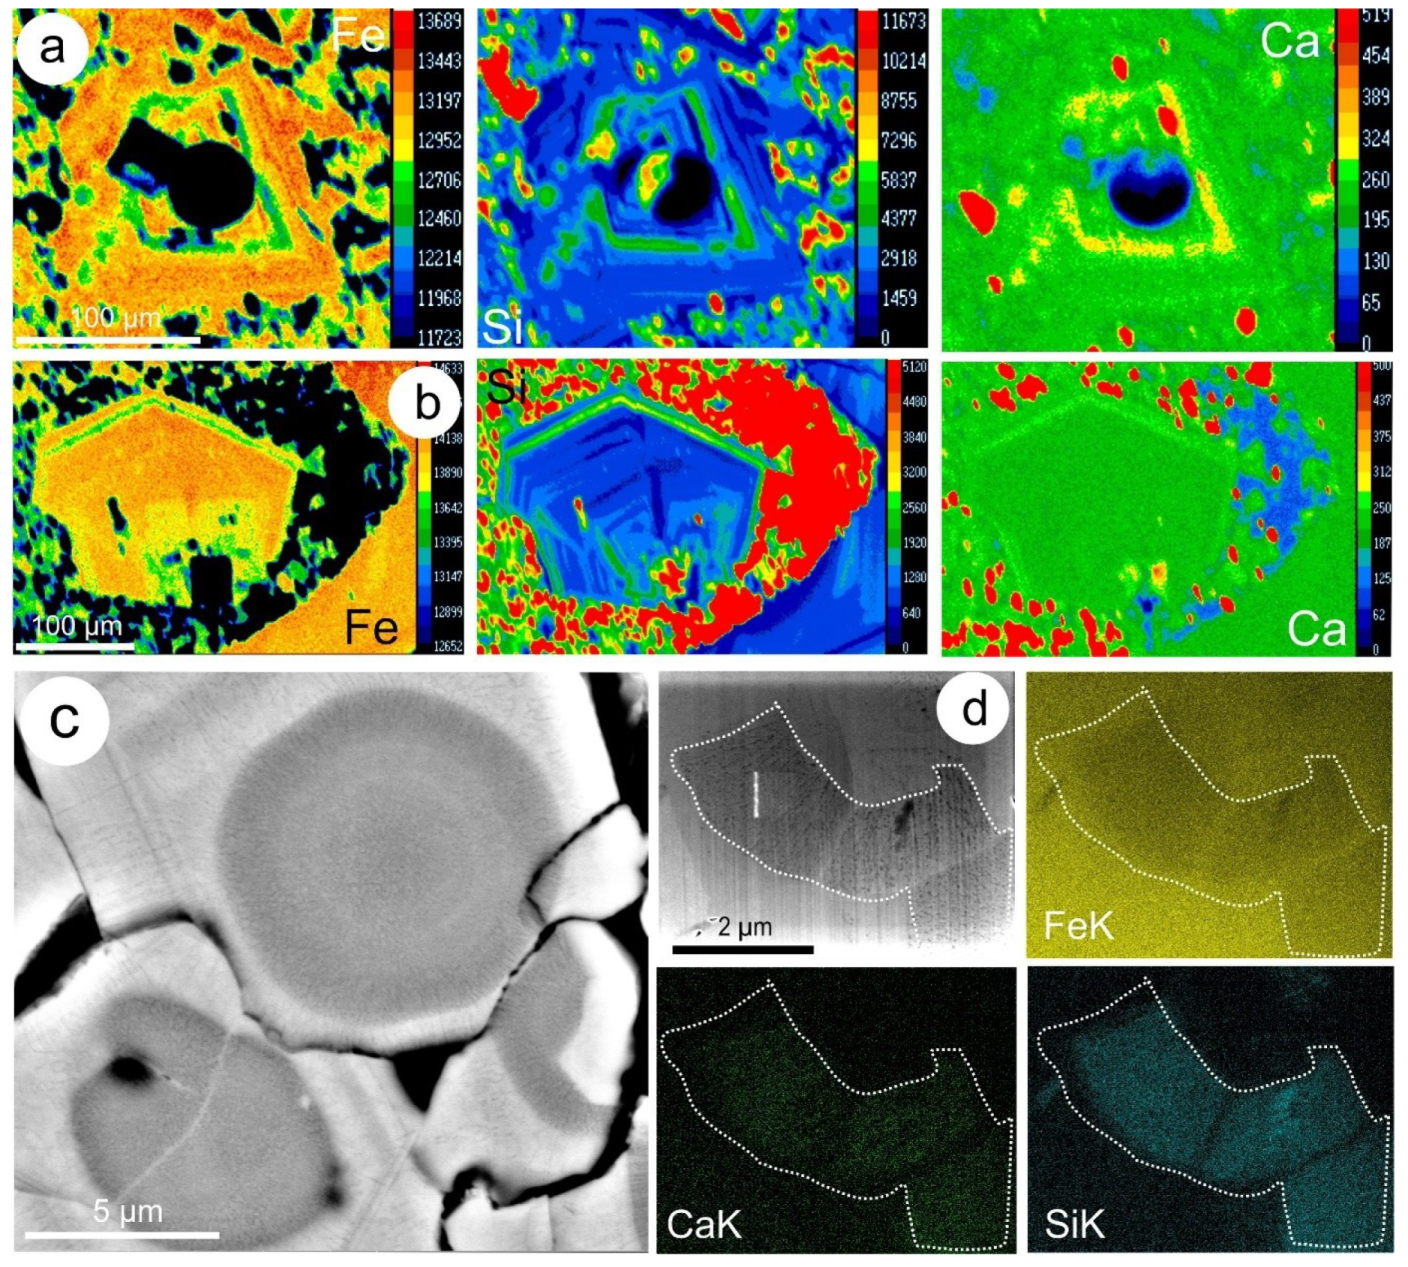
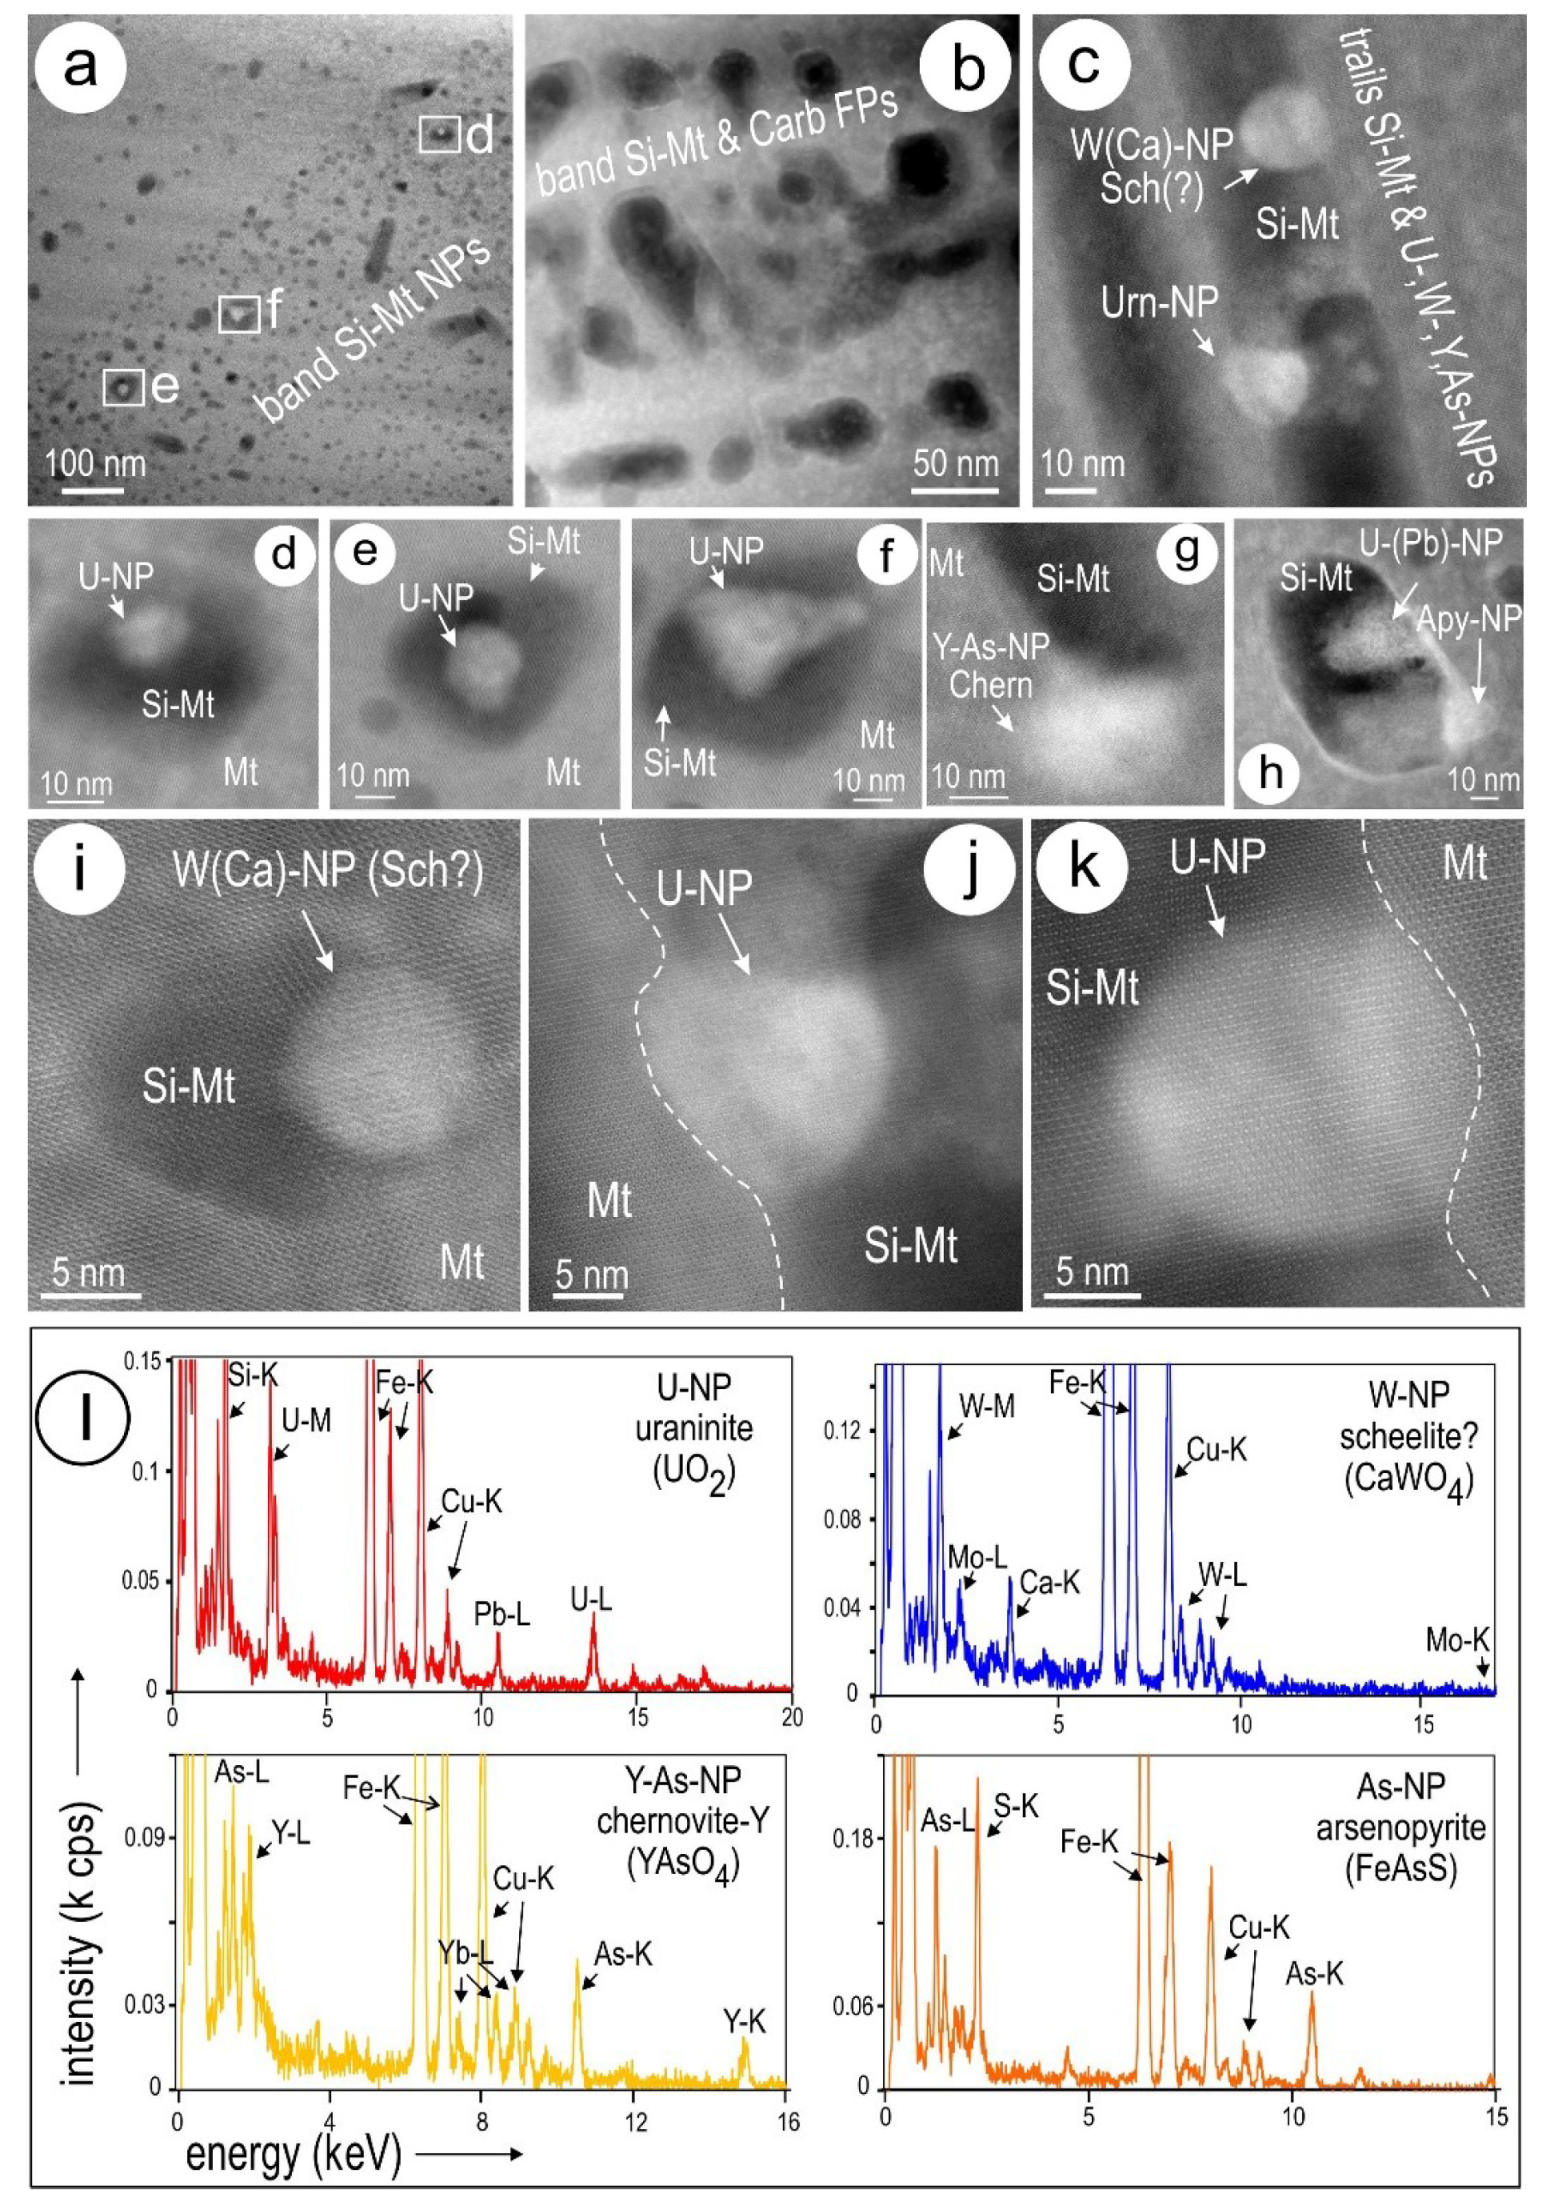
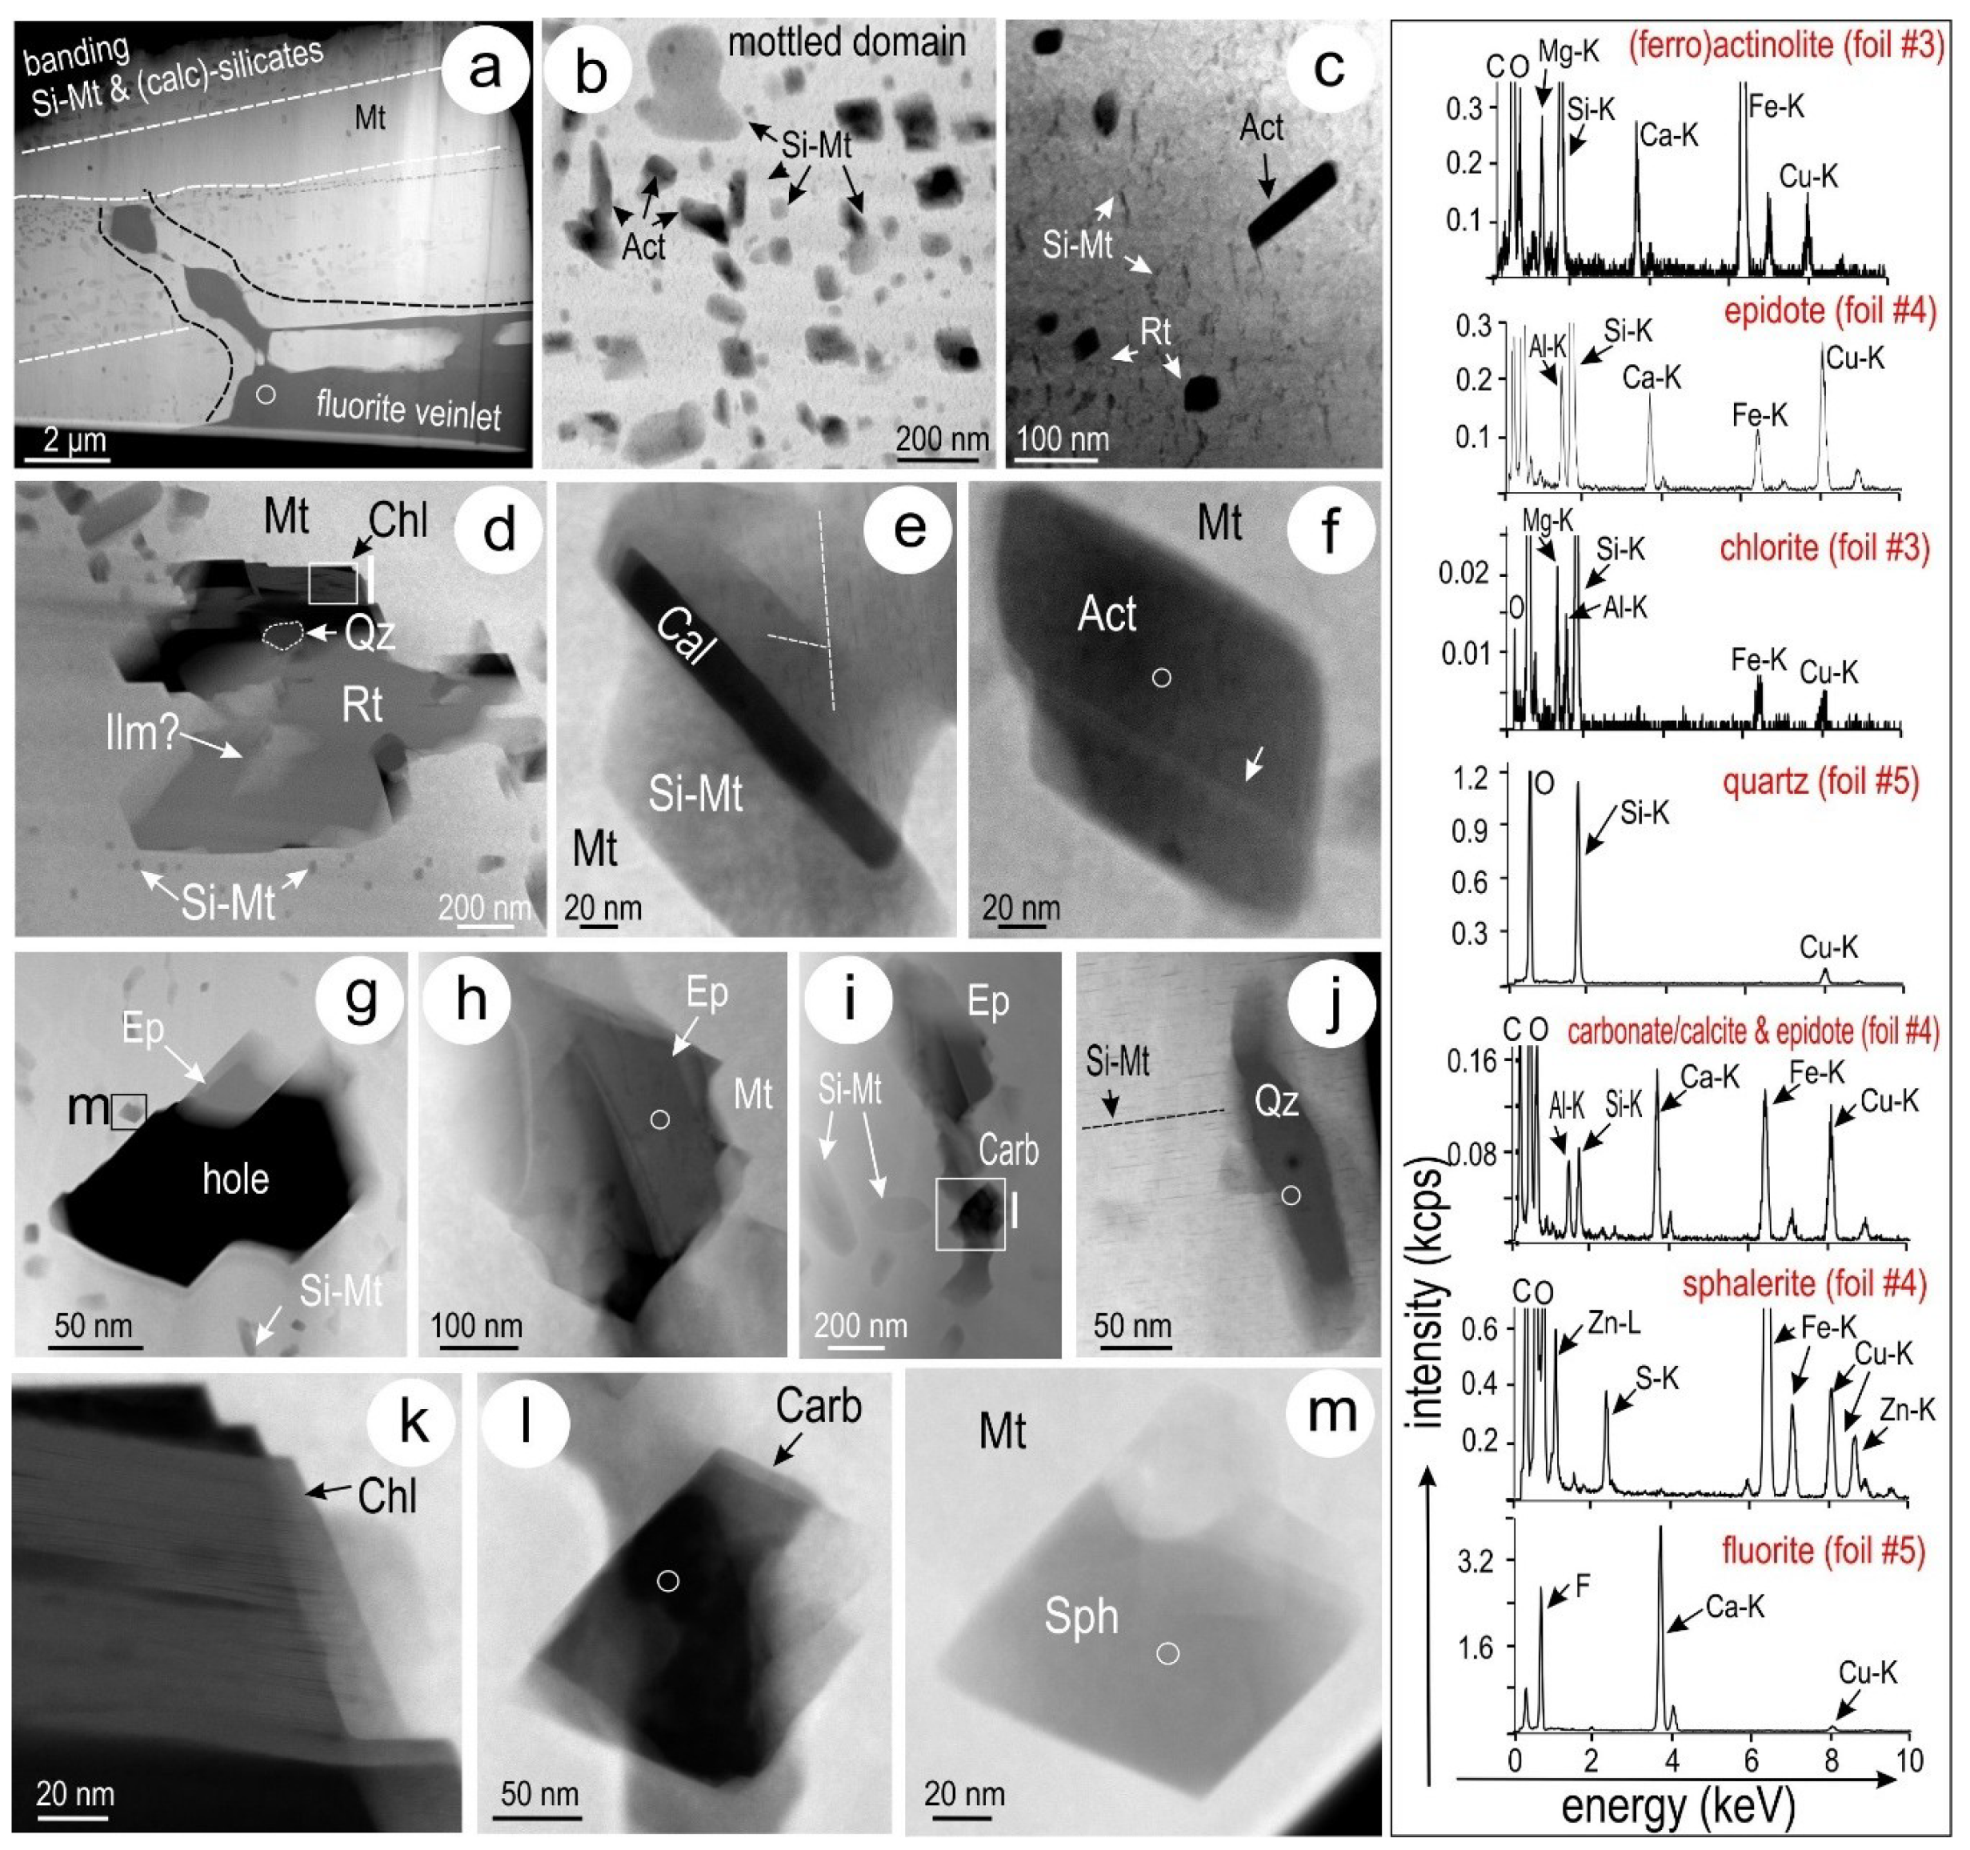
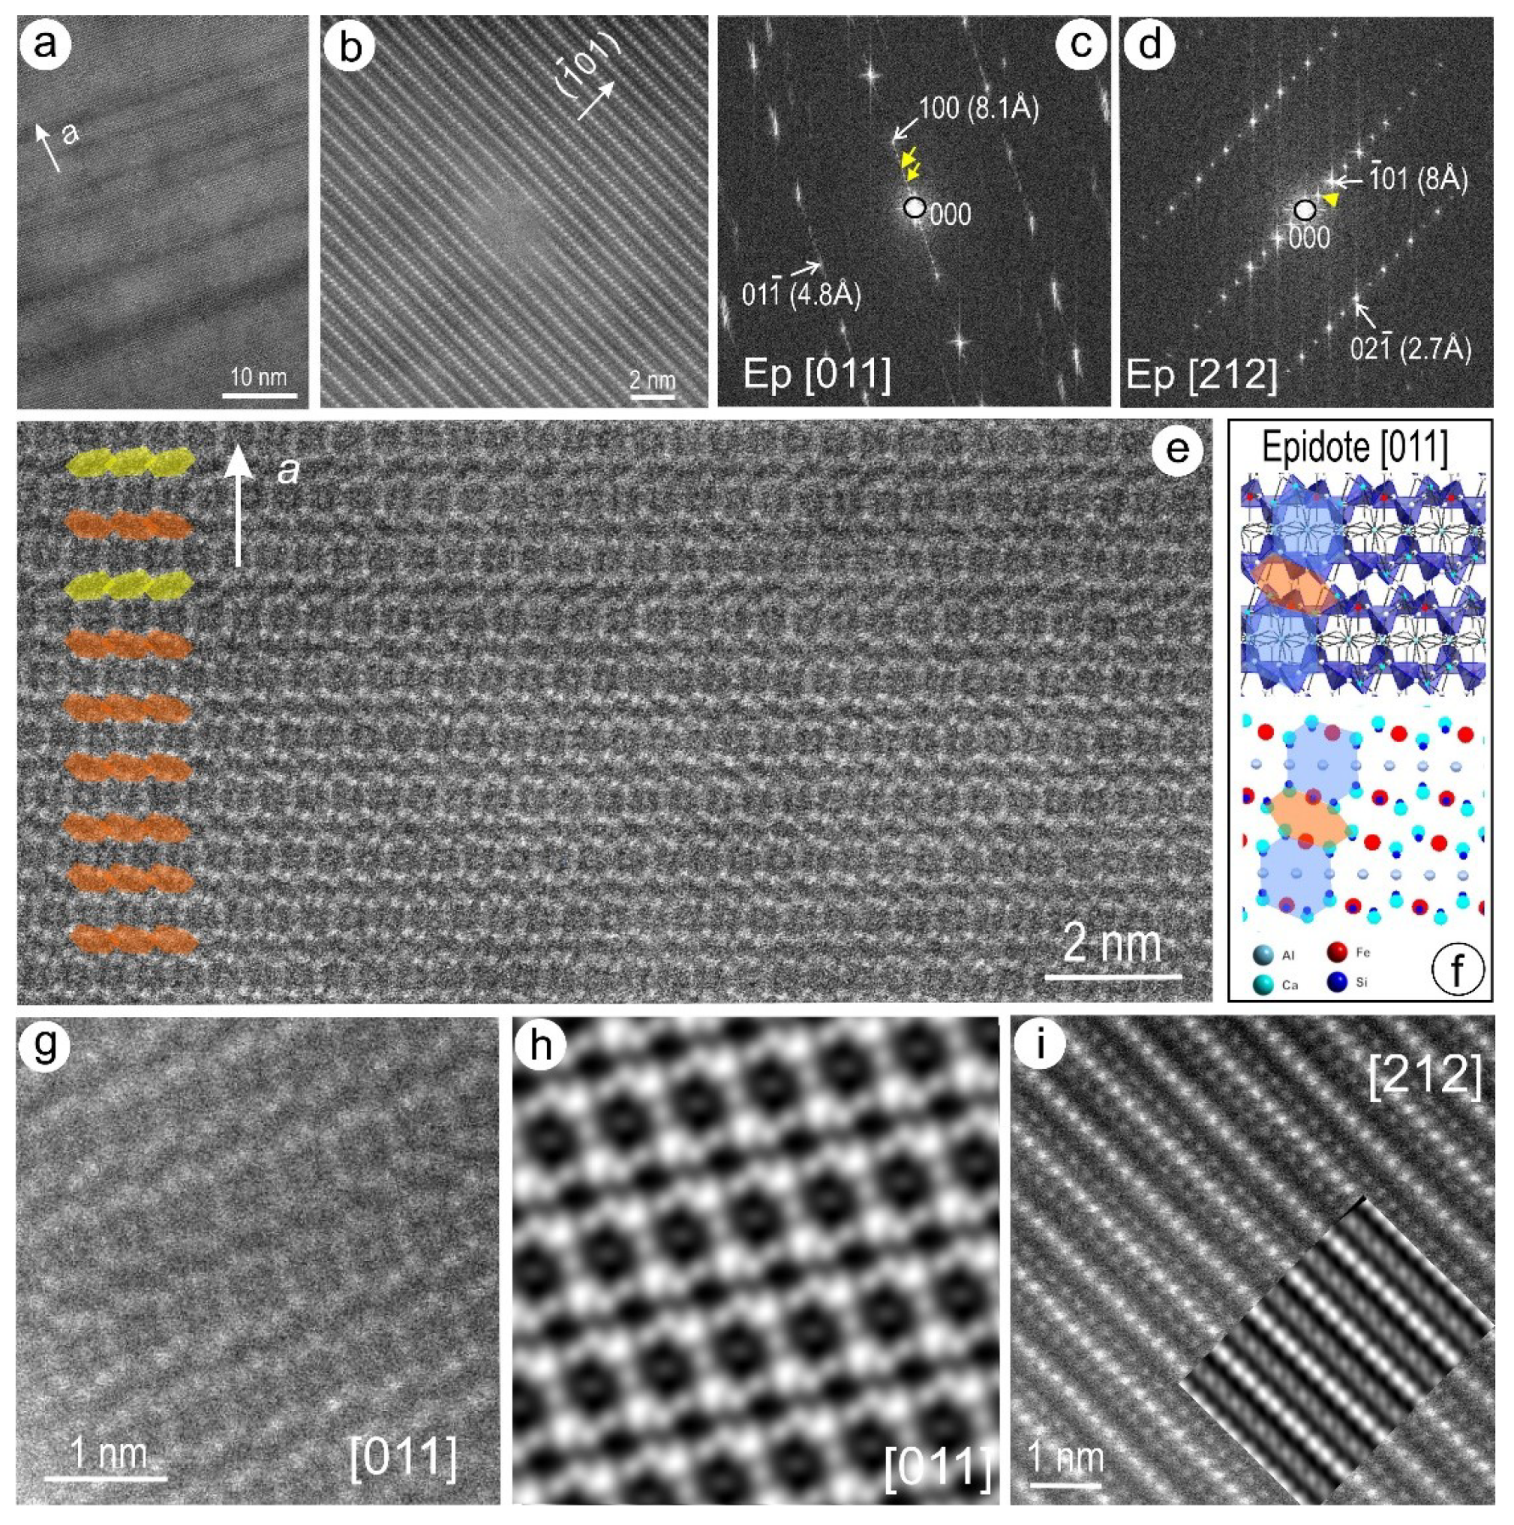
4.4. Calc-Silicates and other Mineral Inclusions in Silician Magnetite
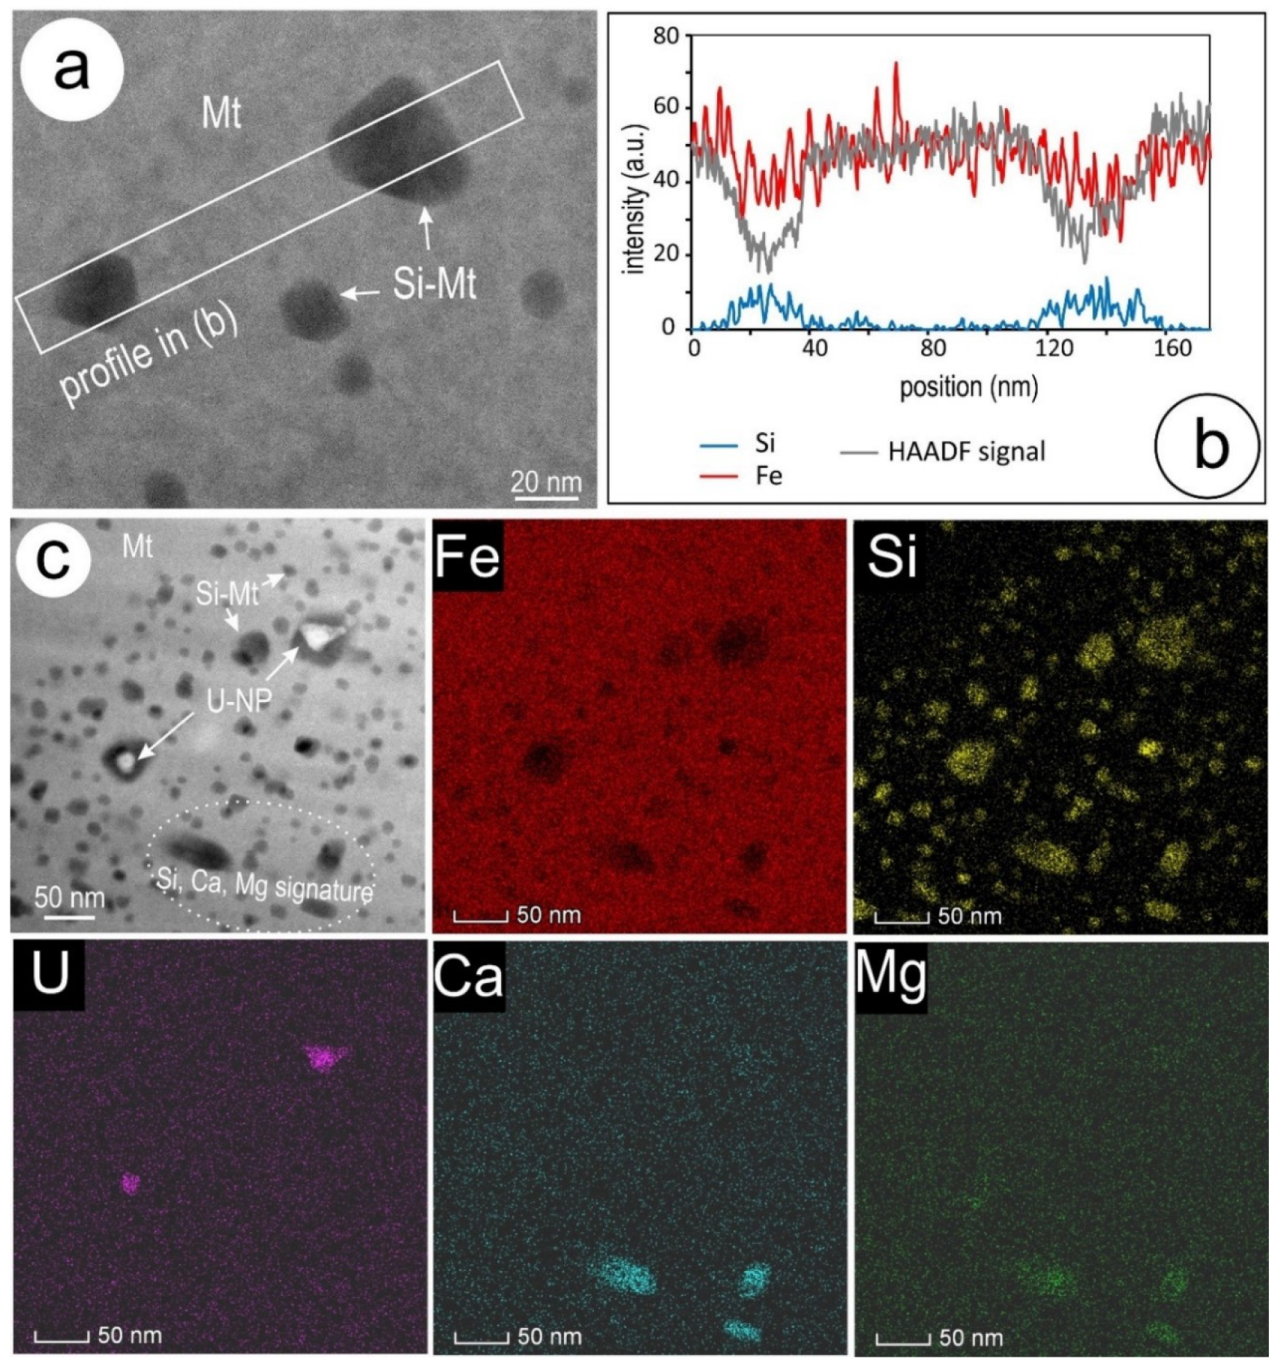
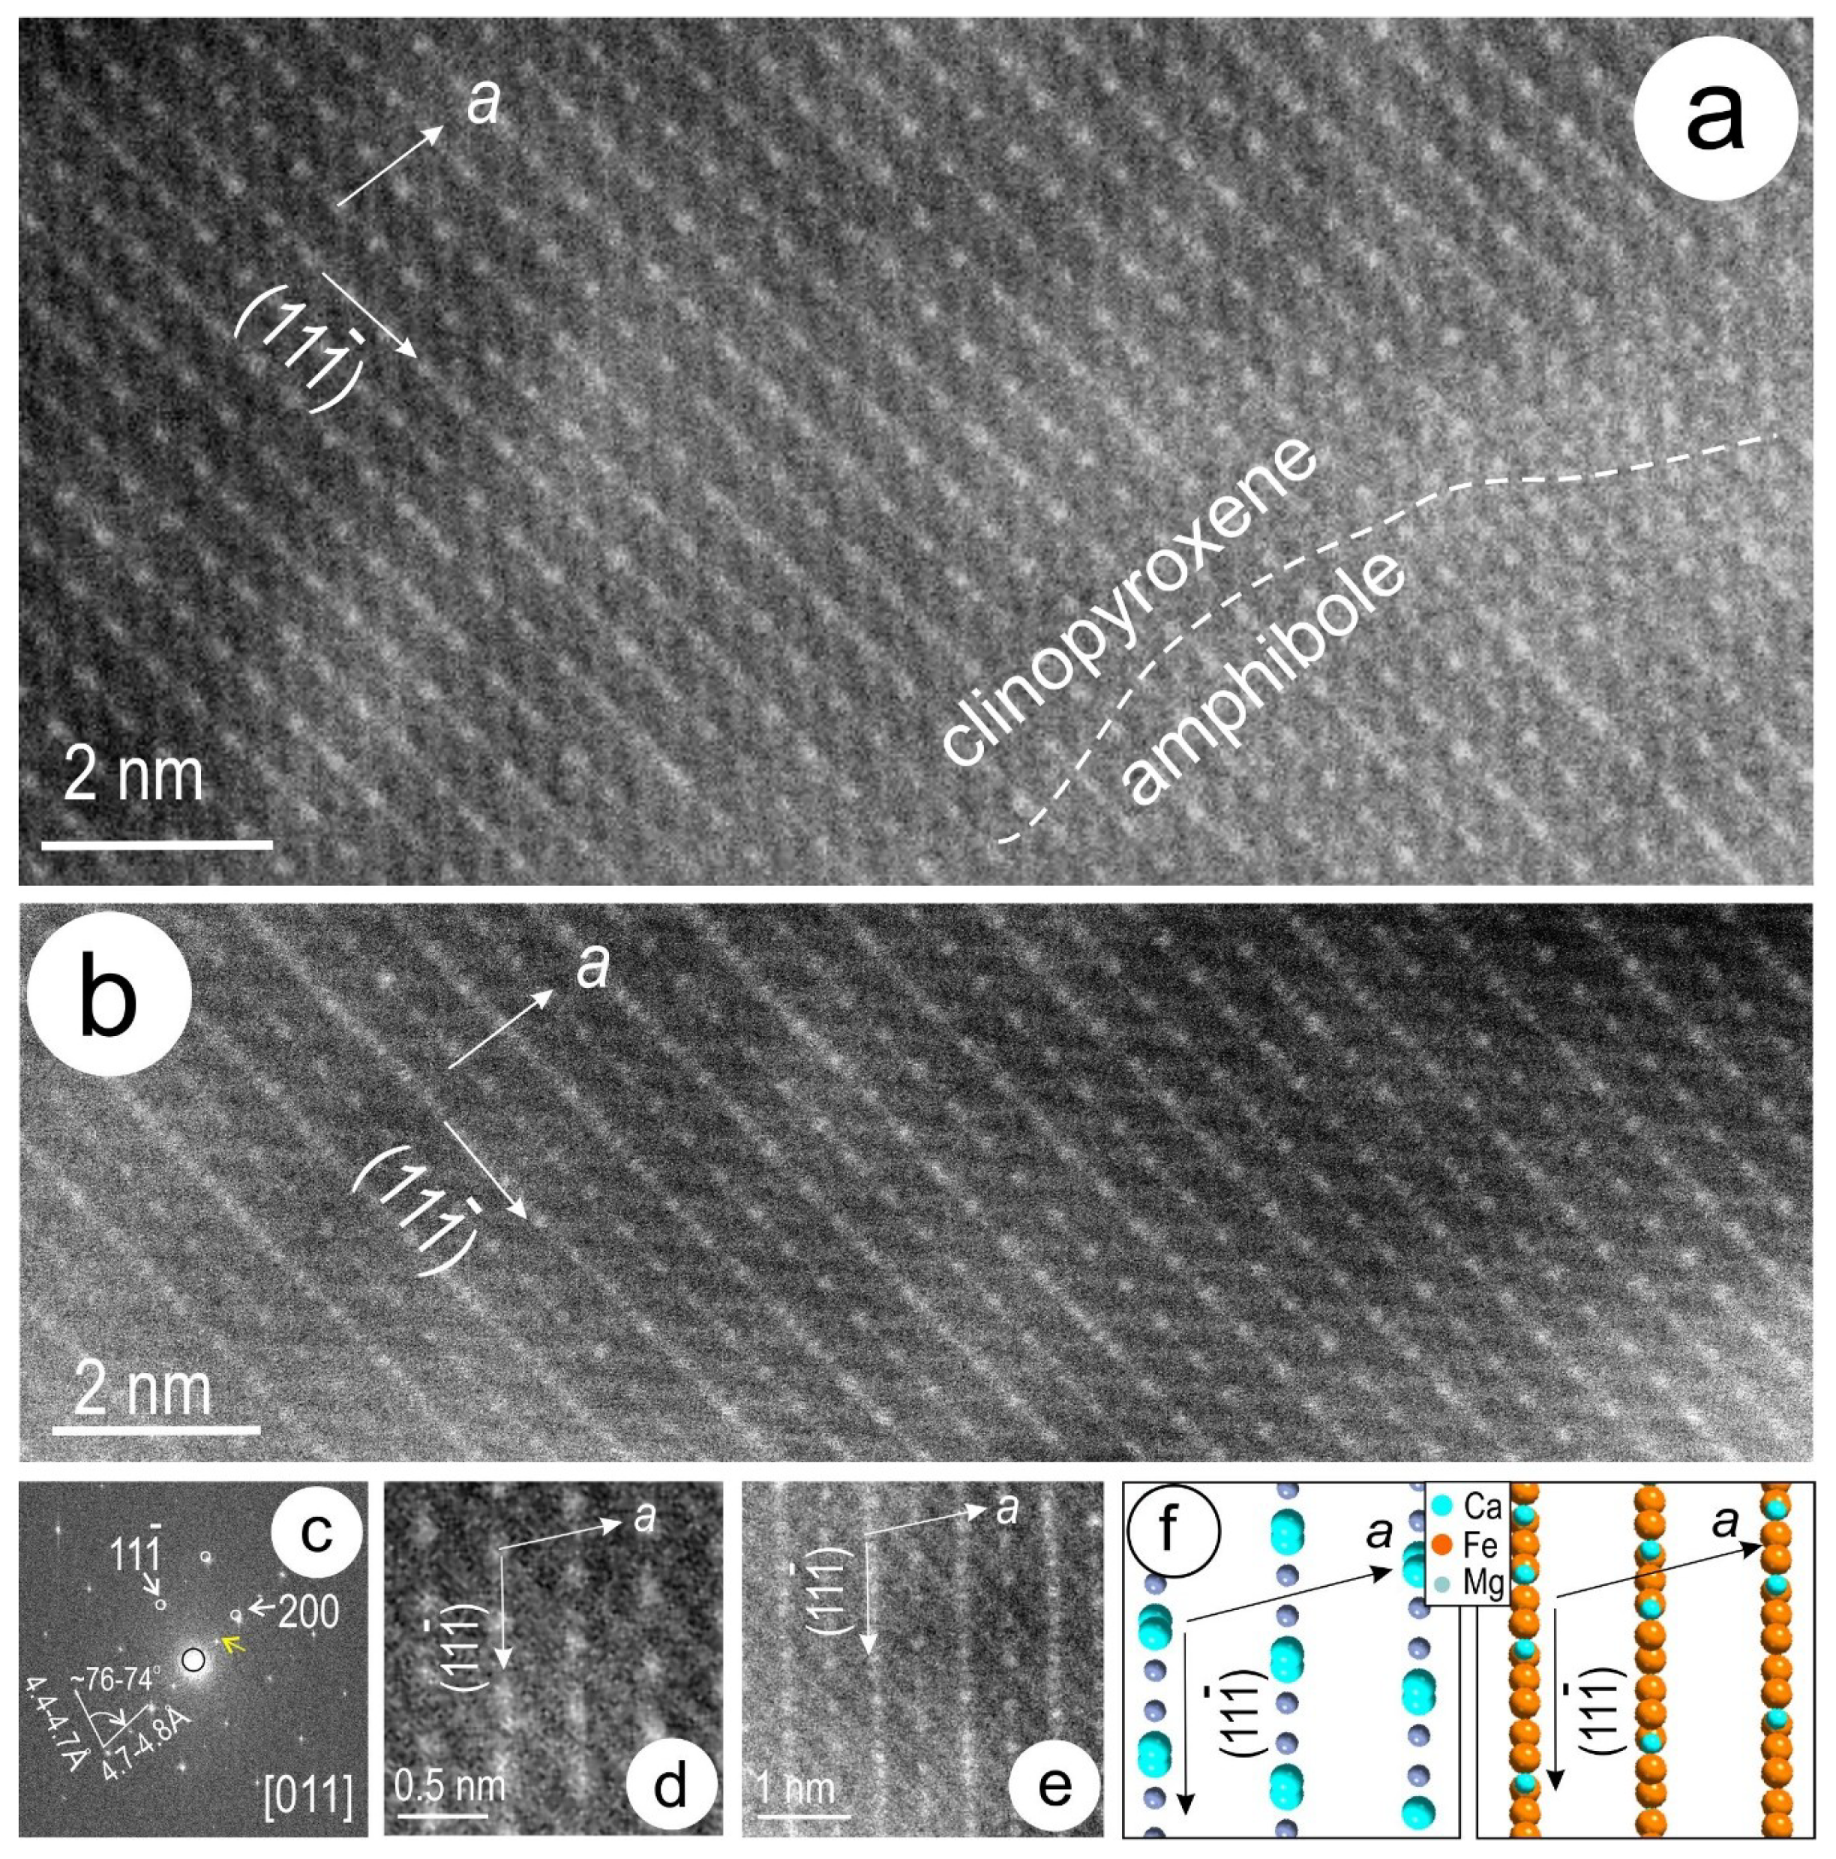
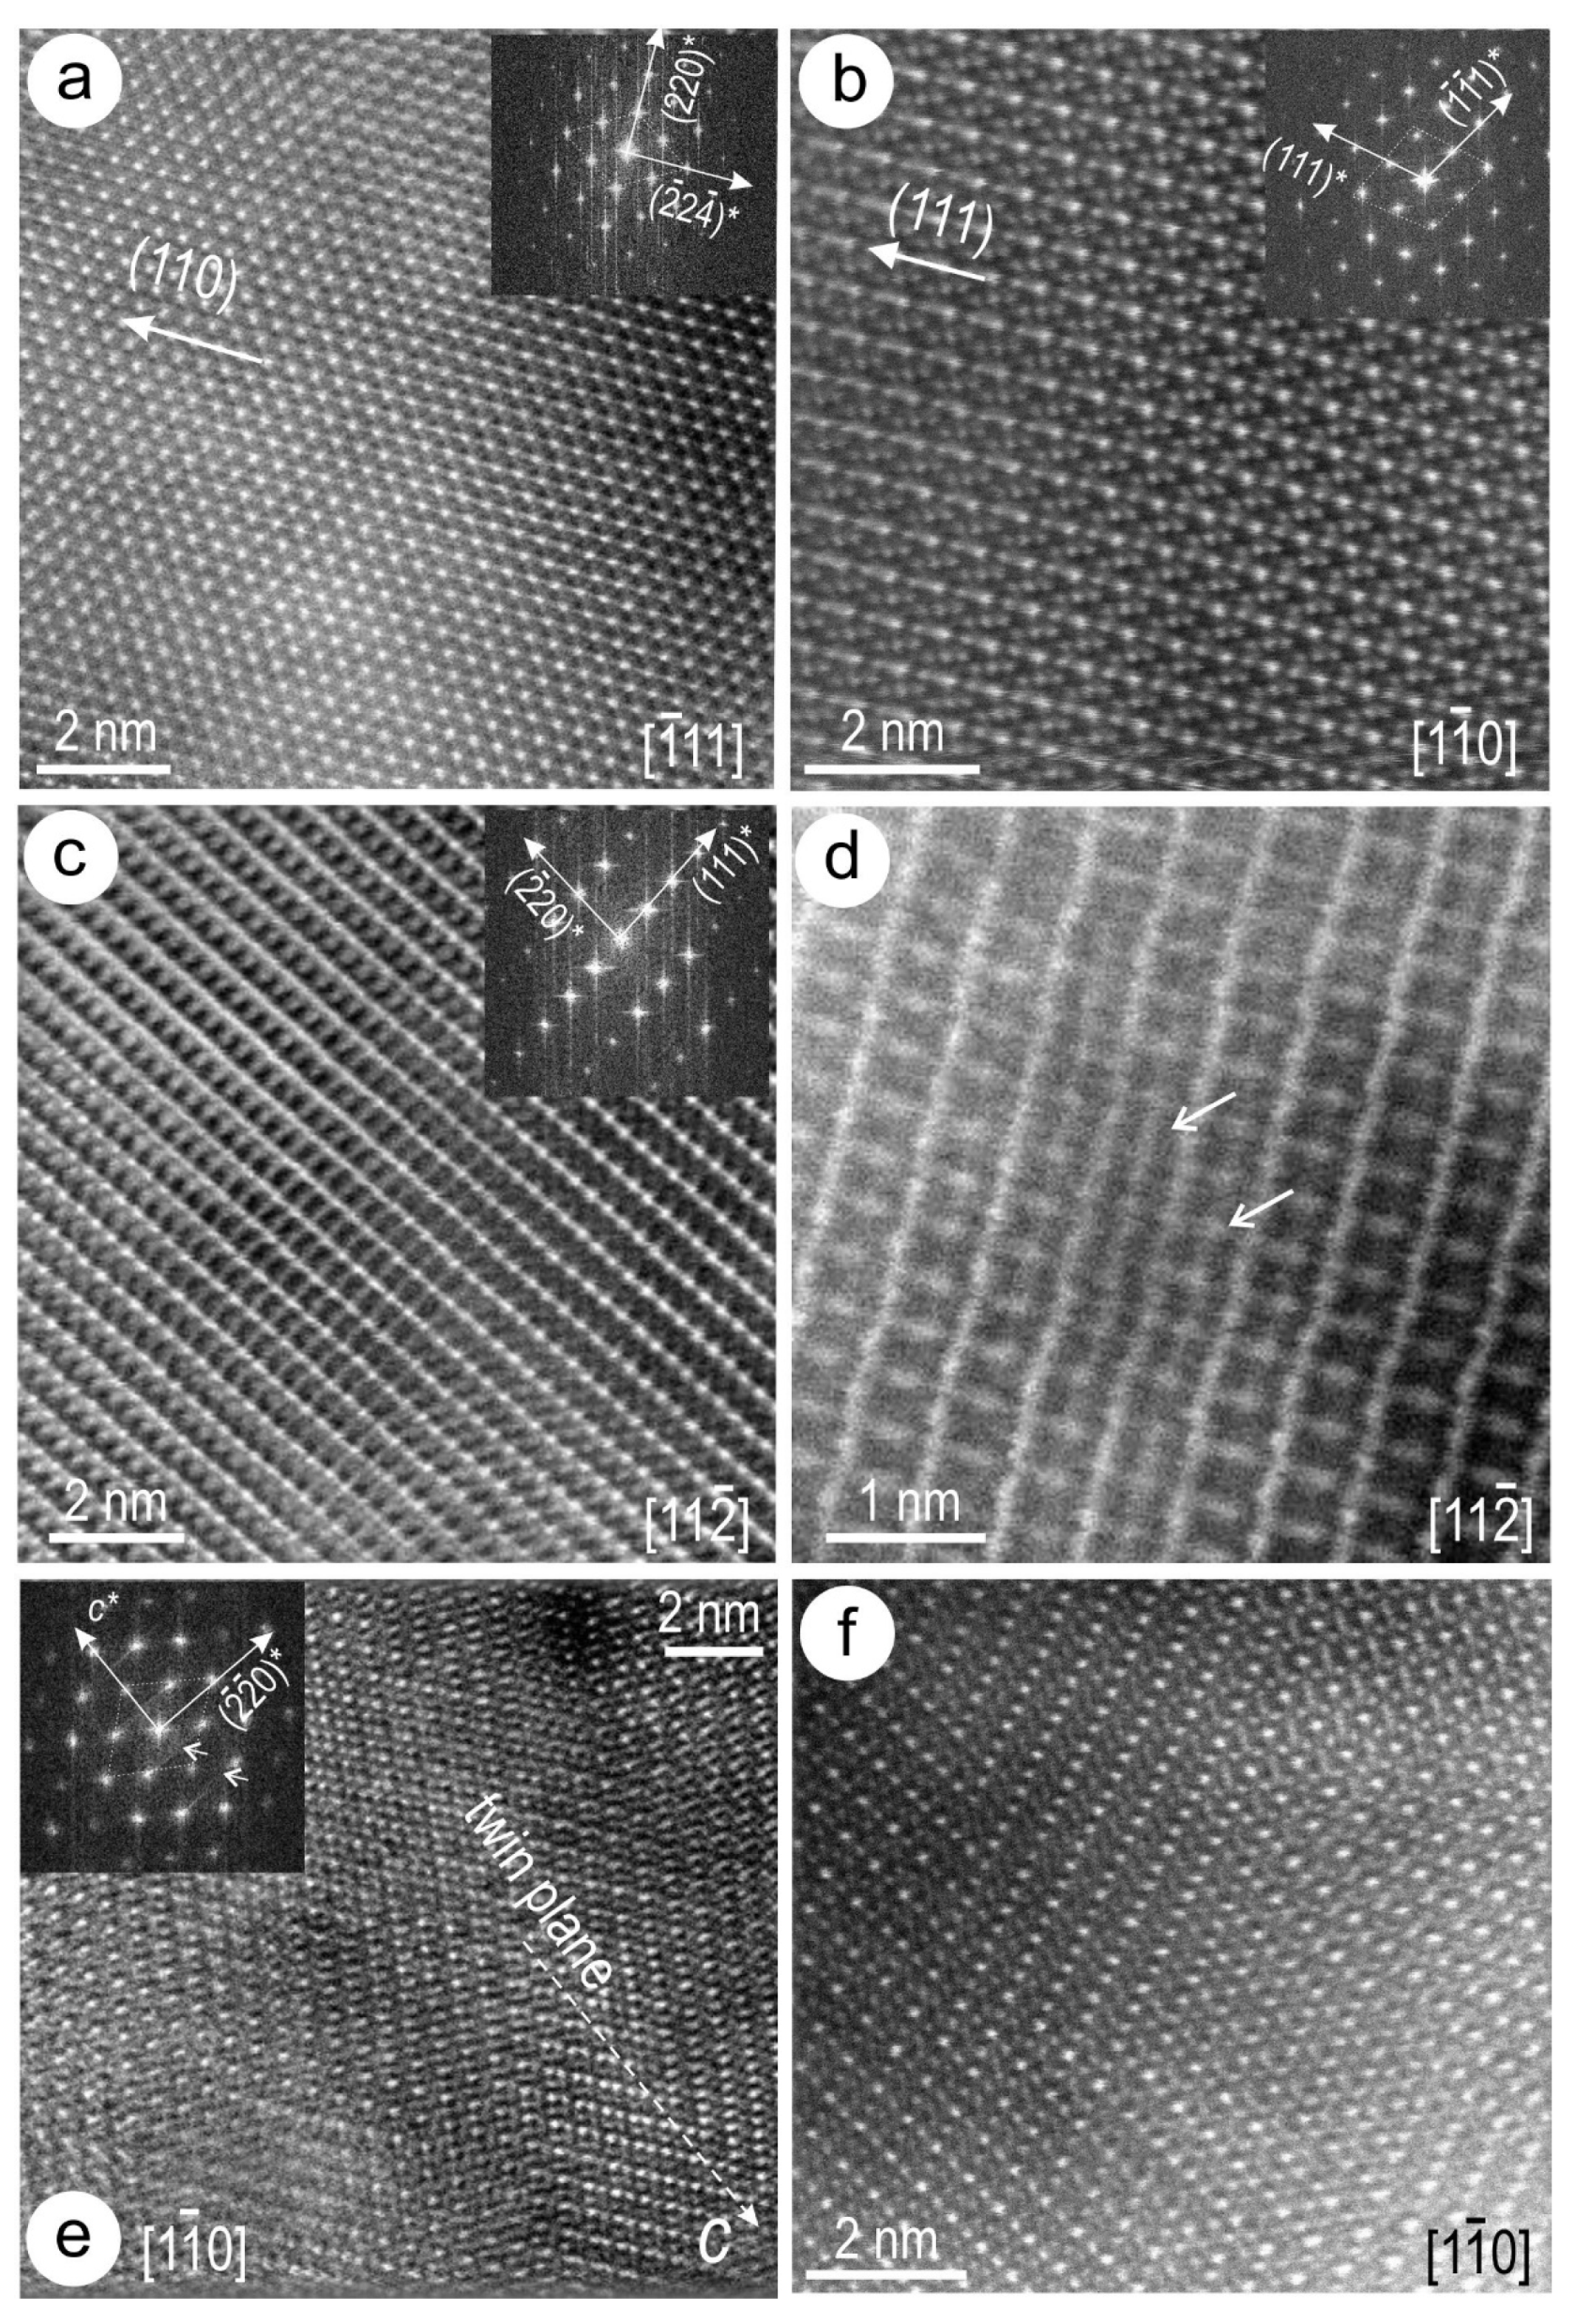
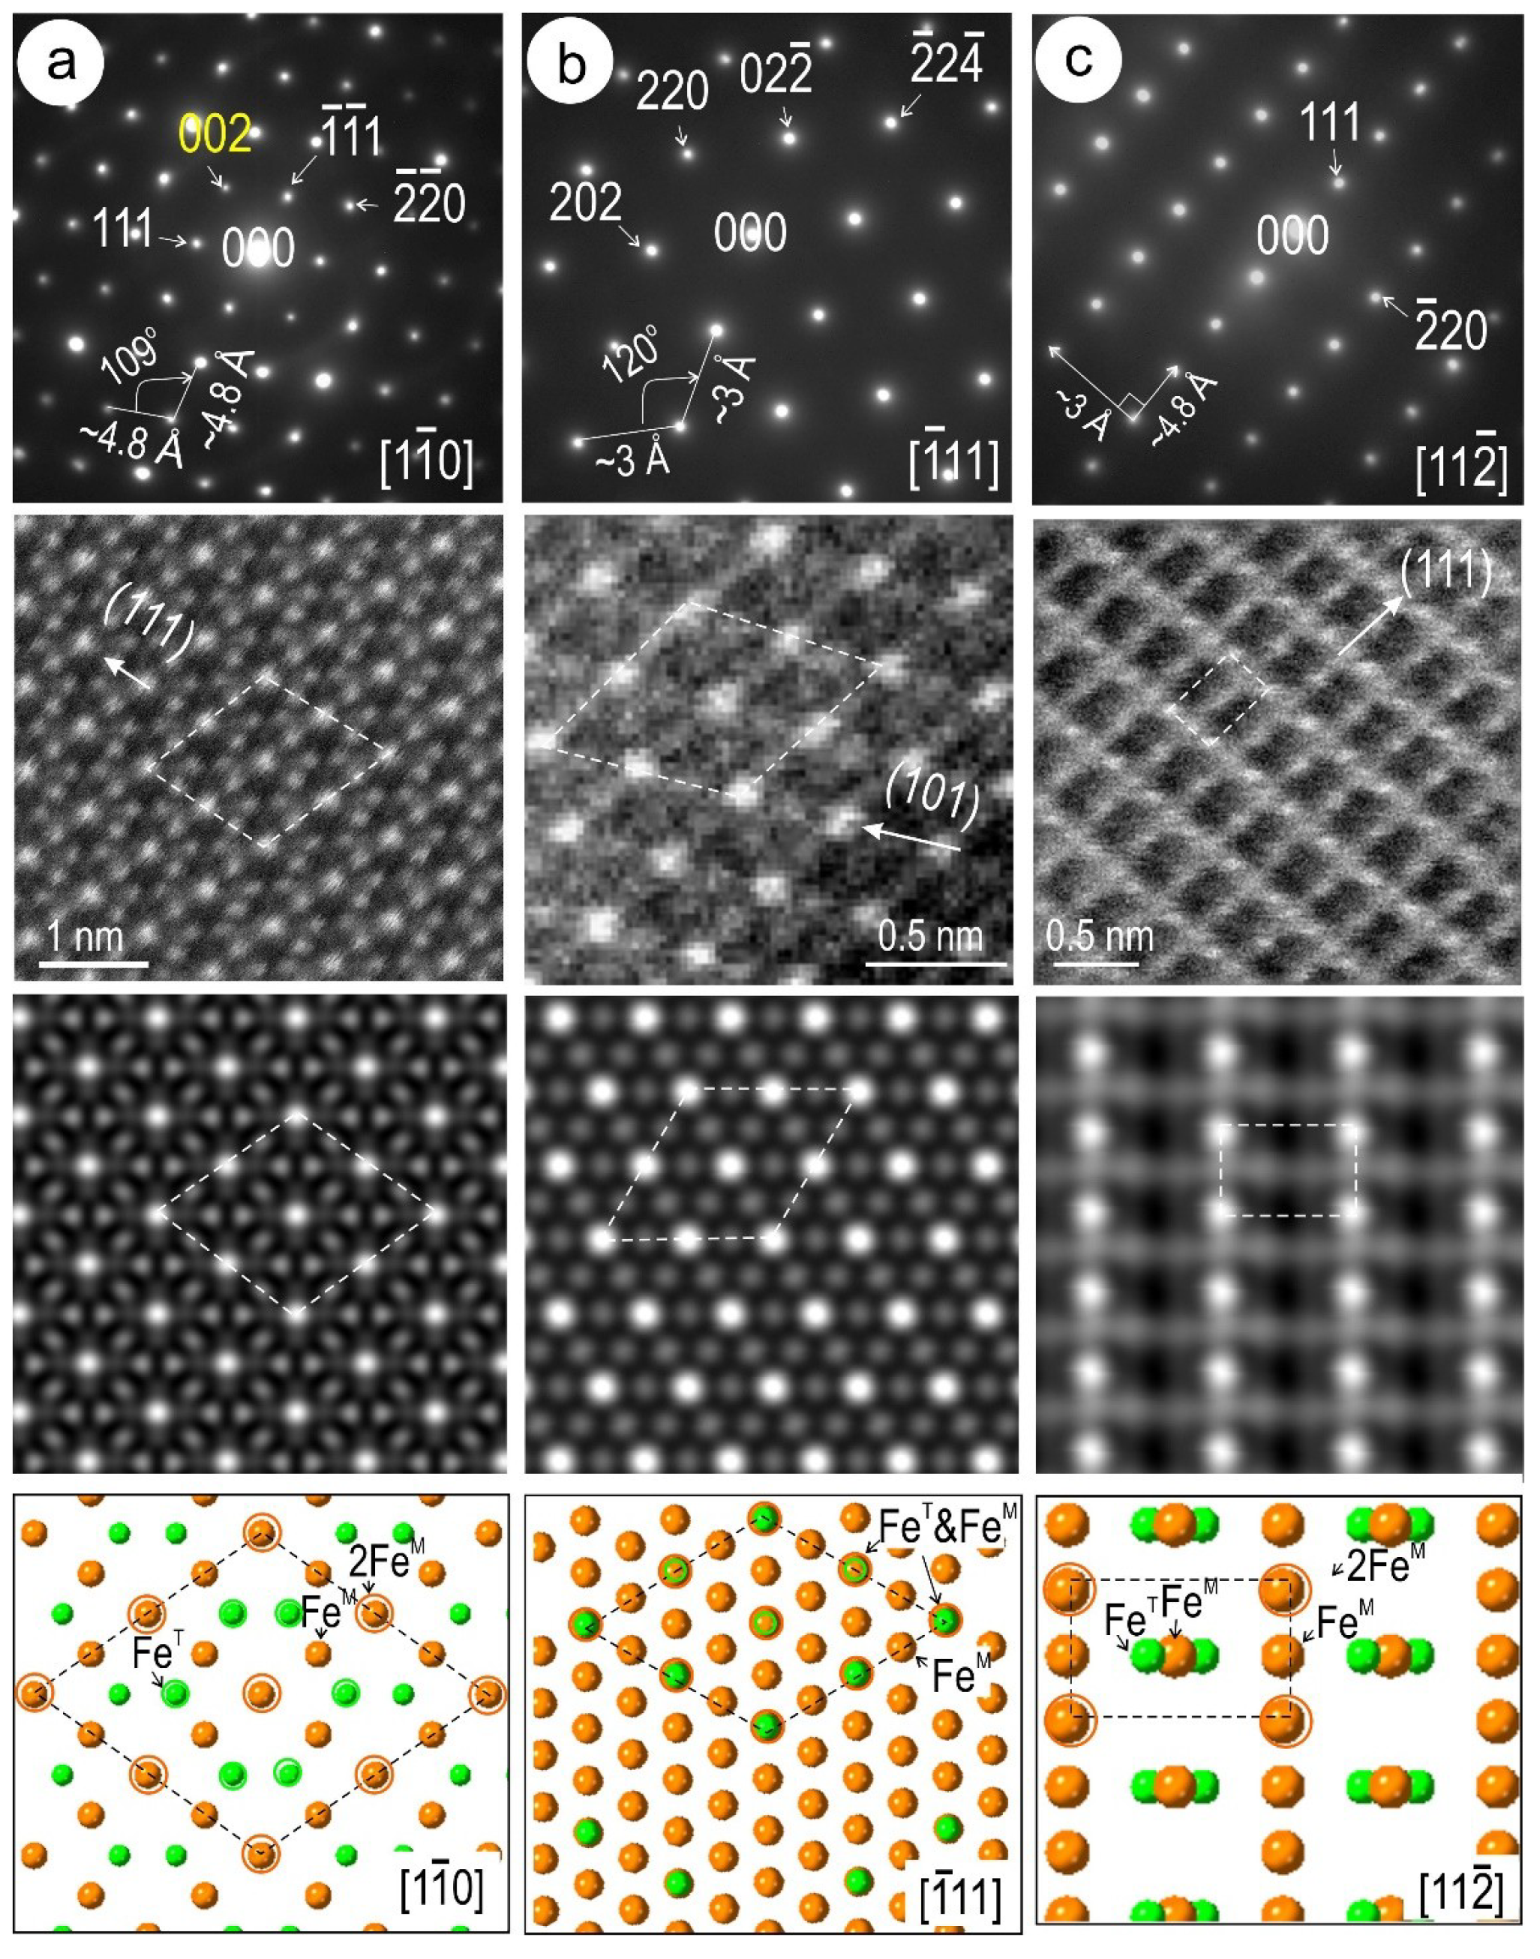
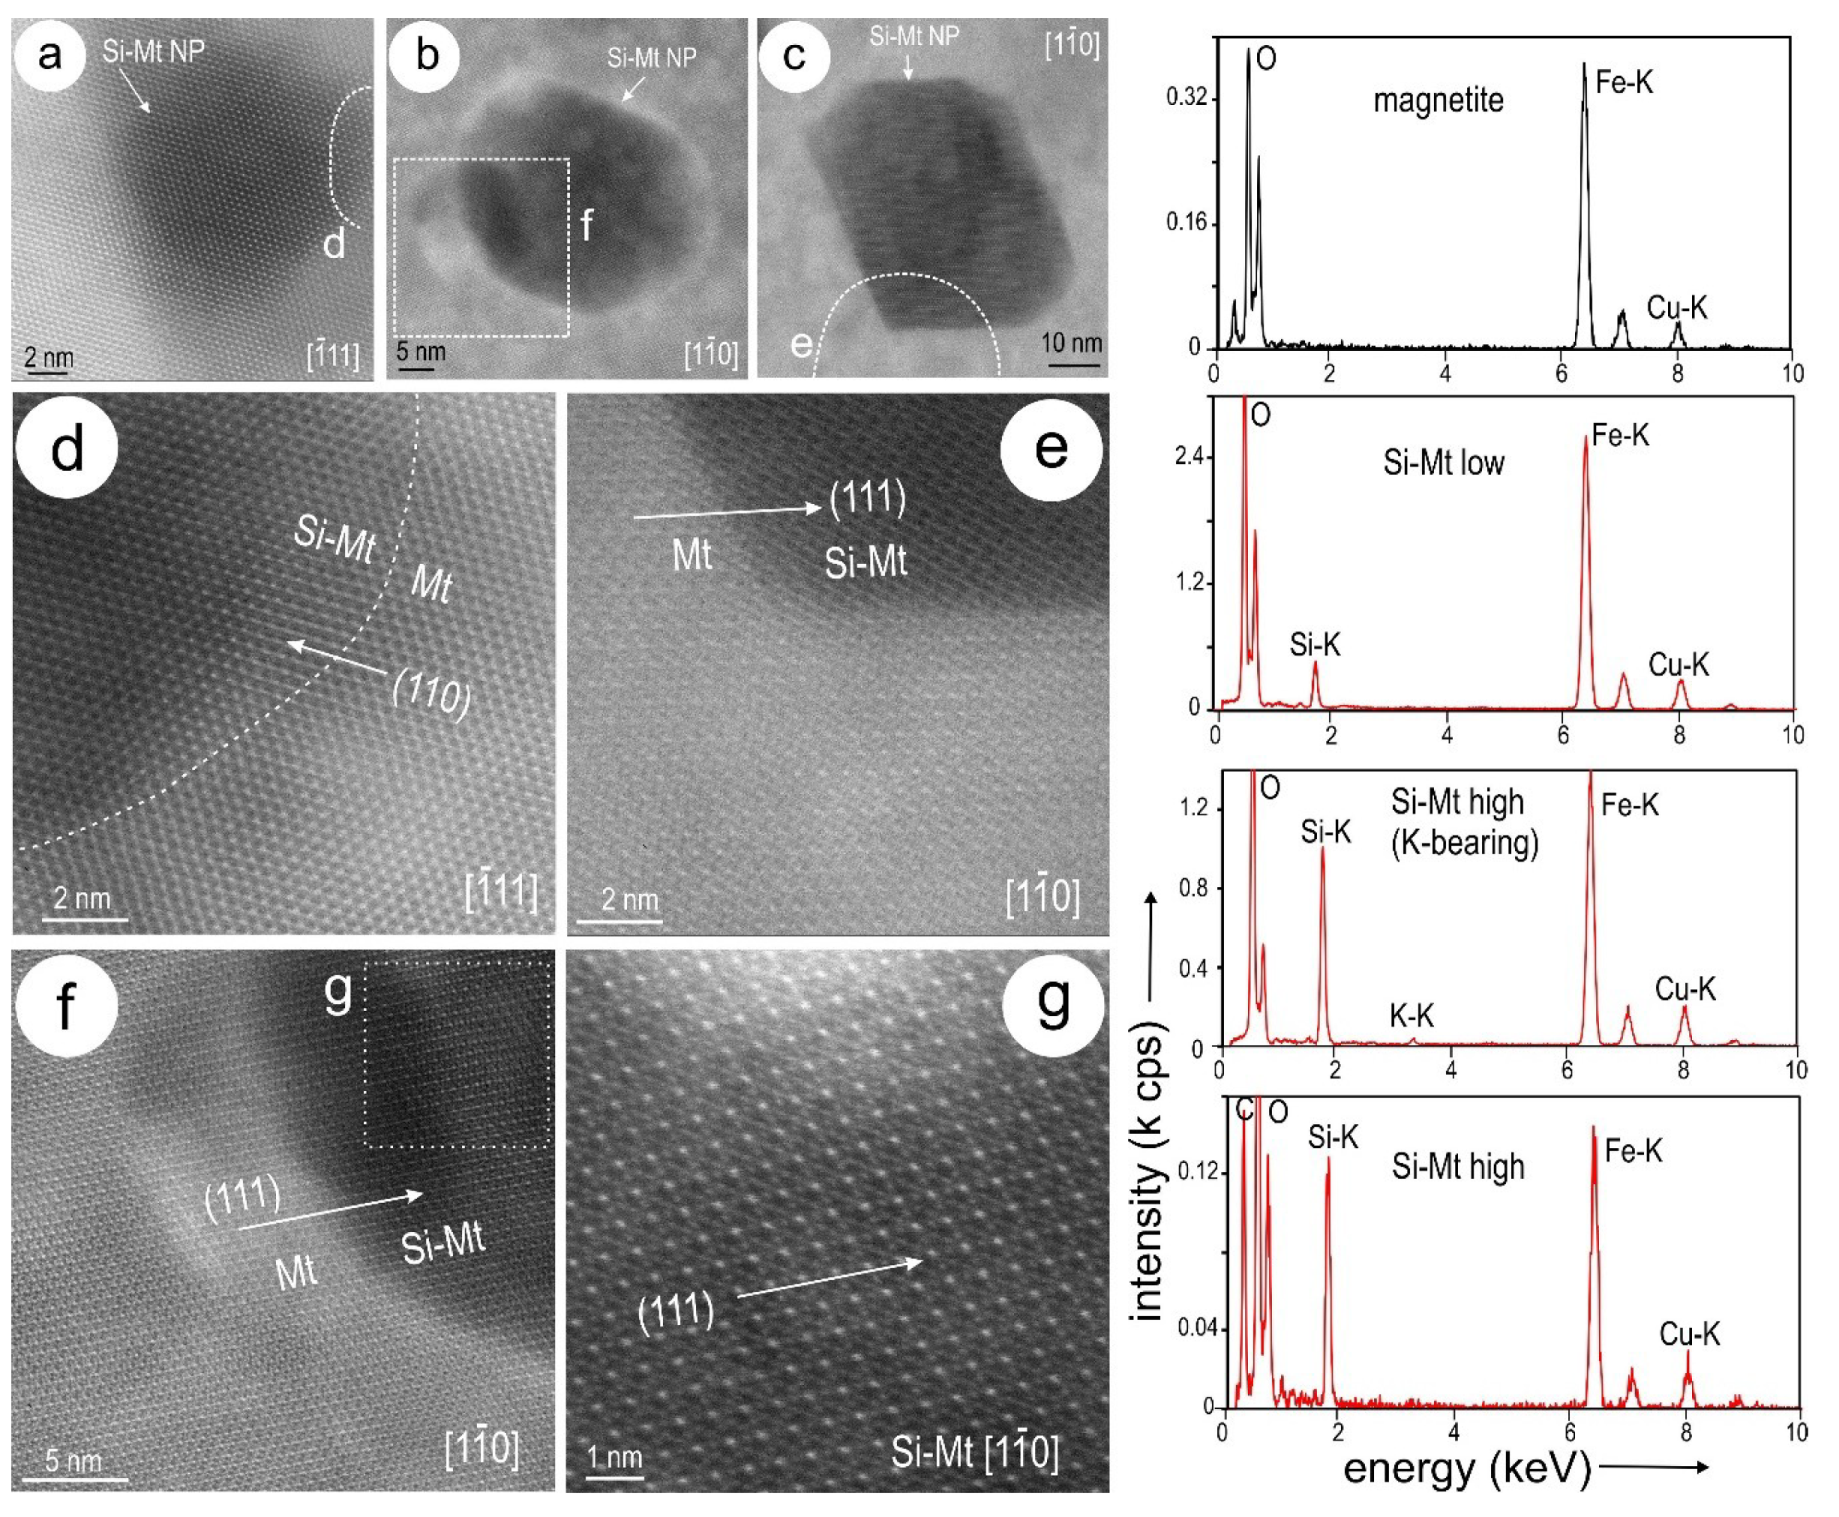
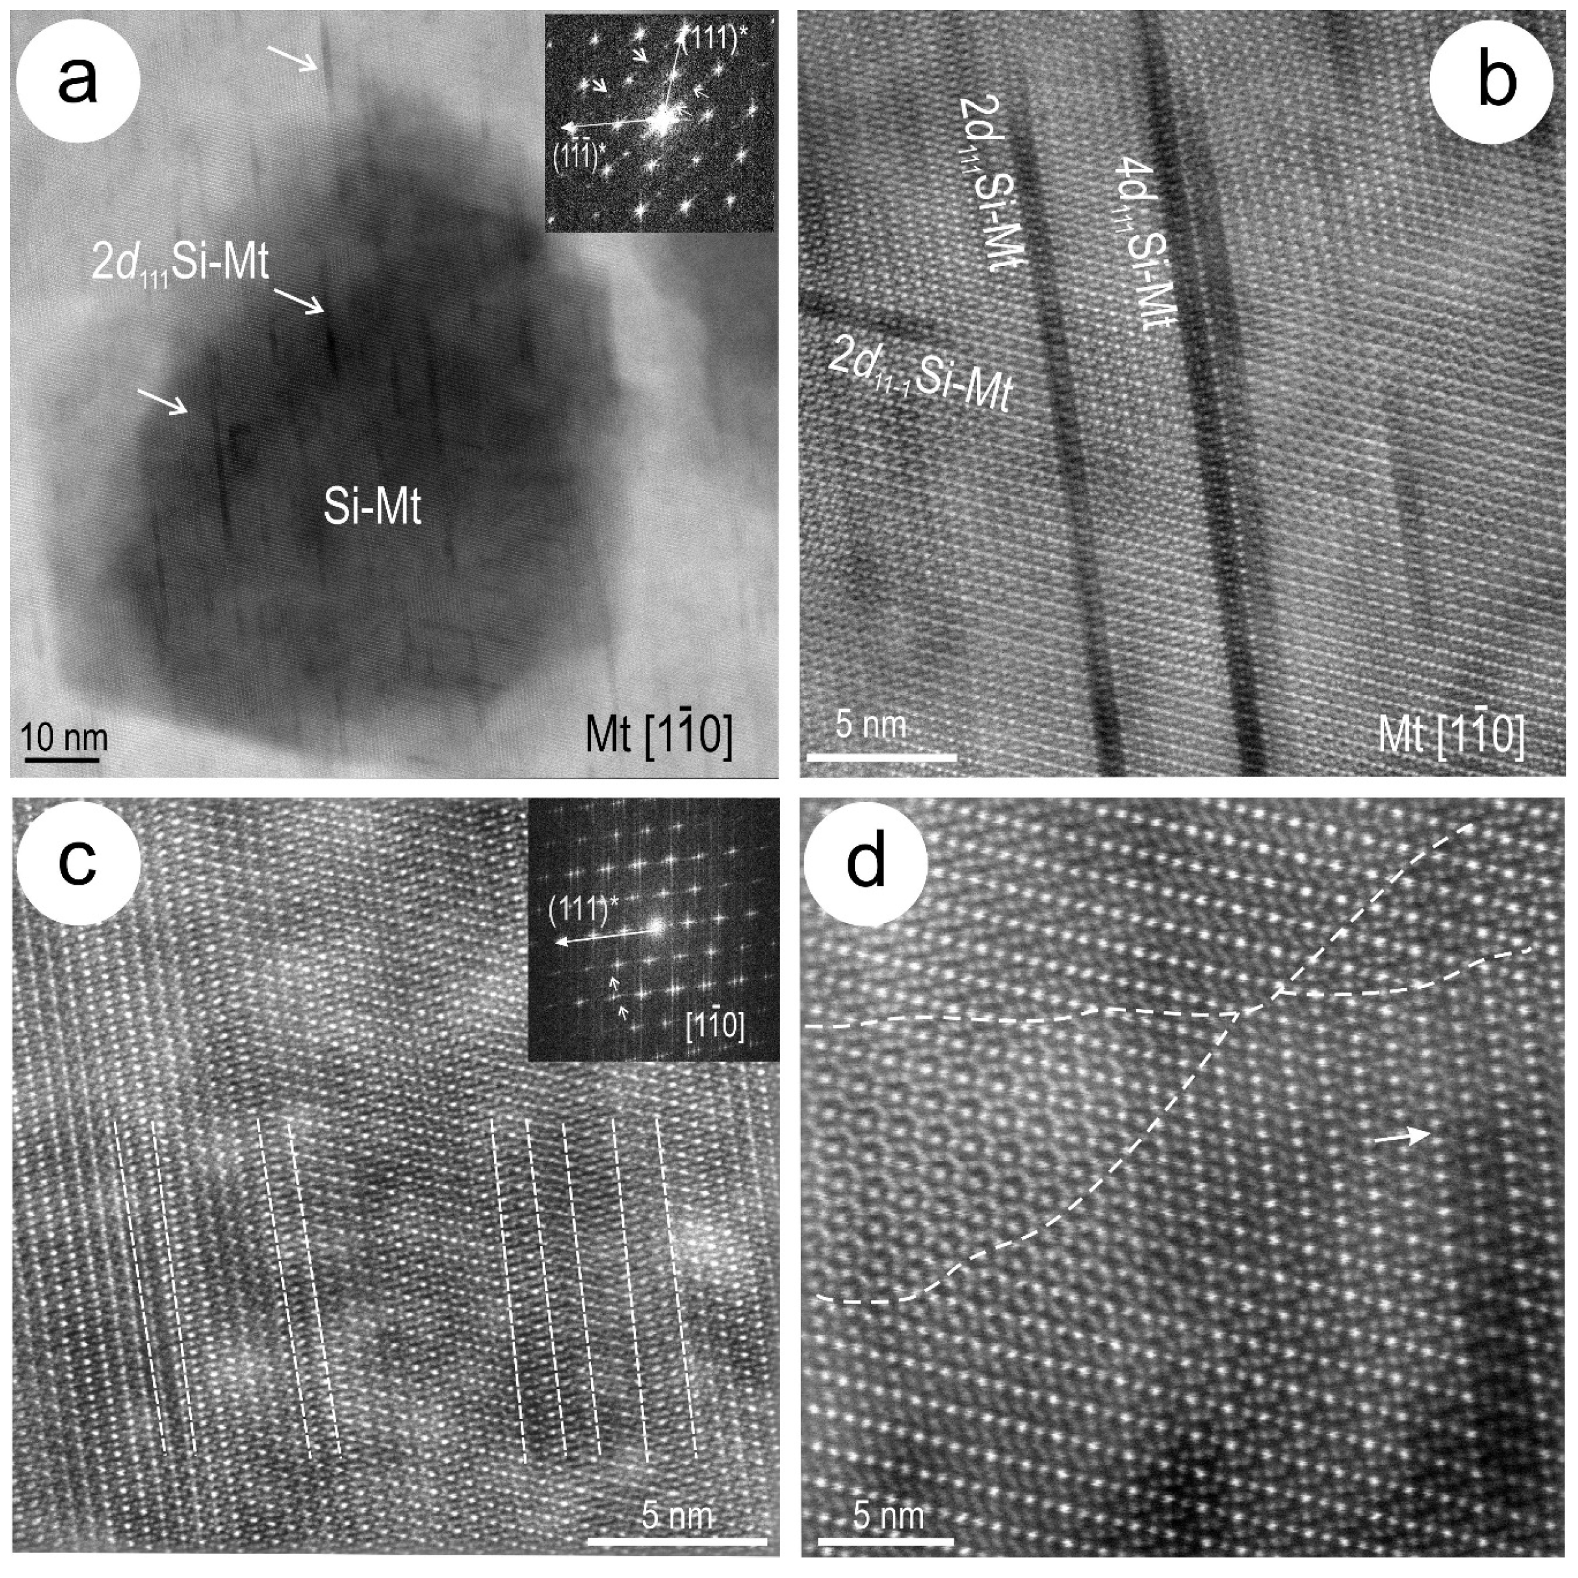
4.5. Magnetite and Si–Fe-Nanoprecipitates
5. Discussion
5.1. What Is “Silician Magnetite”?
5.2. Petrogenetic Significance of Silician Magnetite: Si–Fe-Nanoprecipitates and other Mineral Inclusions
6. Conclusions and Implications
Supplementary Materials
Author Contributions
Funding
Acknowledgments
Conflicts of Interest
References
- Biagioni, C.; Pasero, M. The systematics of the spinel-type minerals: An overview. Am. Mineral. 2014, 99, 1254–1264. [Google Scholar] [CrossRef]
- Hill, R.J.; Craig, J.R.; Gibbs, G.V. Systematics of the spinel structure type. Phys. Chem. Miner. 1979, 4, 317–339. [Google Scholar] [CrossRef]
- Fleet, M.E. The structure of magnetite: Symmetry of cubic spinels. J. Solid State Chem. 1986, 62, 75–82. [Google Scholar] [CrossRef]
- Verwey, E.J.W.; de Boer, J.H. Cation arrangement in a few oxides with crystal structures of the spinel type. Recueil des Travaux Chimiques des Pays Bas 1936, 55, 531–540. [Google Scholar] [CrossRef]
- Fleet, M.E. The structure of magnetite. Acta Cryst. B 1981, 37, 917–920. [Google Scholar] [CrossRef] [Green Version]
- Ramdohr, P. The Ore Minerals and Their Intergrowths; English Translation of the 3rd Edition; Pergamon Press: Oxford, UK, 1969; 1174p. [Google Scholar]
- Bowles, J.F.W.; Howie, R.A.; Vaughan, D.J.; Zussman, J. Rock-forming Minerals: Non-Silicates: Oxides, Hydroxides and Sulphides; The Geological Society of London: London, UK, 2011; 920p. [Google Scholar]
- Buddington, A.F.; Lindsley, D.H. Iron-titanium oxide minerals and synthetic equivalents. J. Petrol. 1964, 5, 310–357. [Google Scholar] [CrossRef]
- Haggerty, S.E. Apollo 14: Subsolidus reduction and compositional variations of spinels. In Proceedings of the 3rd Lunar Science Conference; MIT Press: Cambridge, MA, USA, 1972; Volume 1, pp. 305–332. [Google Scholar]
- Haselton, J.C.; Nash, W.P. Ilmenite-orthopyroxene intergrowths from the moon and the Skaergaard intrusion. Earth Plan. Sci. Lett. 1975, 26, 287–291. [Google Scholar] [CrossRef]
- Mücke, A. Magnetite, ilmenite and ulvite in rocks and ore deposits: Petrography, microprobe analyses and genetic implications. Mineral. Petrol. 2003, 77, 215–234. [Google Scholar] [CrossRef]
- Gao, W.; Ciobanu, C.L.; Cook, N.J.; Slattery, A.; Huang, F.; Wang, D. Nanoscale study of lamellar exsolutions in clinopyroxene from olivine gabbro: Recording crystallization sequences in iron-rich layered intrusions. Am. Mineral. 2019, 104, 244–261. [Google Scholar]
- Ma, C.; Tschauner, O.; Beckett, J.R.; Liu, Y.; Rossman, G.R.; Sinogeikin, S.V.; Smith, J.S.; Taylor, L.A. Ahrensite, γ-Fe2SiO4, a new shock-metamorphic mineral from the Tissint meteorite: Implications for the Tissint shock event on Mars. Geochim. Cosmochim. Acta 2016, 184, 240–256. [Google Scholar] [CrossRef]
- Newberry, N.G.; Peacor, D.R.; Essene, E.J.; Geissman, J.W. Silicon in Magnetite: High-resolution microanalysis of magnetite-ilmenite intergrowths. Contrib. Mineral. Petrol. 1982, 80, 334–340. [Google Scholar] [CrossRef]
- Ohtaka, O.; Tobe, H.; Yamanaka, T. Phase equilibria for the Fe2SiO4-Fe3O4 system under high pressure. Phys. Chem. Miner. 1997, 24, 555–560. [Google Scholar] [CrossRef]
- Yamanaka, T.; Shimazu, H.; Ota, K. Electric conductivity of Fe2SiO4-Fe3O4 spinel solid solutions. Phys. Chem. Miner. 2001, 28, 110–118. [Google Scholar] [CrossRef]
- Shcheka, S.A.; Romanenko, I.M.; Chubarov, V.M.; Kurentsova, N.A. Silica-bearing magnetites. Contrib. Mineral. Petrol. 1977, 63, 103–111. [Google Scholar] [CrossRef]
- Shiga, Y. Silician magnetite from the Kamaishi Mine, Japan. Min. Geol. 1988, 38, 437–440. [Google Scholar]
- Huberty, J.M.; Konishi, H.; Heck, P.R.; Fournelle, J.H.; Valley, J.W.; Xu, H. Silician magnetite from the Dales Gorge member of the Brockman iron formation, Hamersley Group, Western Australia. Am. Mineral. 2012, 97, 26–37. [Google Scholar] [CrossRef]
- Shimazaki, H. On the occurrence of silician magnetites. Resour. Geol. 1998, 48, 23–29. [Google Scholar] [CrossRef]
- Grau-Crespo, R.; Al-Baitai, A.Y.; Saadoune, I.; De Leeuw, N.H. Vacancy ordering and electronic structure of γ-Fe2O3 (maghemite): A theoretical investigation. J. Phys. Condens. Matter 2010, 22, 255401. [Google Scholar] [CrossRef]
- Fleet, M.E. The structure of magnetite: Two annealed natural magnetites, Fe3.005O4 and Fe2.96Mg0.04O4. Acta Cryst. 1984, C40, 1491–1493. [Google Scholar] [CrossRef]
- Lenaz, D.; Skogby, H. Structural changes in the FeAl2O4–FeCr2O4 solid solution series and their consequences on natural Cr-bearing spinels. Phys. Chem. Miner. 2013, 40, 587–595. [Google Scholar] [CrossRef]
- Ardit, M.; Cruciani, G.; Dondi, M. Structural relaxation in tetrahedrally coordinated Co2+ along the gahnite-Co-aluminate spinel solid solution. Am. Mineral. 2012, 97, 1394–1401. [Google Scholar] [CrossRef]
- Pavese, A.; Levy, D.; Hoser, A. Cation distribution in synthetic zinc ferrite (Zn0.97Fe2.02O4) from in situ high temperature neutron powder diffraction Sample at T = 300 K. Am. Mineral. 2000, 85, 1497–1502. [Google Scholar] [CrossRef]
- Yagi, T.; Marumo, F.; Akimoto, S.I. Crystal structures of spinel polymorphs of Fe2SiO4 and Ni2SiO4. Am. Mineral. 1974, 59, 486–490. [Google Scholar]
- Hazen, R.M.; Downs, R.T.; Finger, L.W. Crystal chemistry of ferromagnesian silicate spinels: Evidence for Mg-Si disorder. Am. Mineral. 1993, 78, 1320–1323. [Google Scholar]
- Bosi, F.; Halenius, U.; Skogby, H. Crystal chemistry of the magnetite-ulvöspinel series. Am. Mineral. 2009, 94, 181–189. [Google Scholar] [CrossRef]
- Xu, H.-F.; Shen, Z.-Z.; Konishi, H. Si-magnetite nano-precipitates in silician magnetite from banded iron formation: Z-contrast imaging and ab initio study. Am. Mineral. 2014, 99, 2196–2202. [Google Scholar] [CrossRef]
- Bosi, F.; Biagioni, C.; Pasero, M. Nomenclature and classification of the spinel supergroup. Eur. J. Mineral. 2019, 31, 183–192. [Google Scholar] [CrossRef]
- Pecharromán, C.; González-Carreño, T.; Iglesias, J.E. The infrared dielectric properties of maghemite, γ-Fe2O3, from reflectance measurement on pressed powders. Phys. Chem. Miner. 1995, 22, 21–29. [Google Scholar] [CrossRef]
- Fujino, K.; Sasaki, S.; Takéuchi, Y.; Sadanaga, R. X-ray determination of electron distributions in forsterite, fayalite and tephroite. Acta Cryst. B 1981, 37, 513–518. [Google Scholar] [CrossRef] [Green Version]
- Xu, H.F.; Shen, Z.Z.; Konishi, H.; Fu, P.; Szlufarska, I. Crystal structures of laihunite and intermediate phases between laihunite-1M and fayalite; Z-contrast imaging and ab initio study. Am. Mineral. 2014, 99, 881–889. [Google Scholar] [CrossRef]
- Westendorp, R.W.; Watkinson, D.H. Silicon-bearing zoned magnetite crystals and the evolution of hydrothermal fluids at the Ansil Cu-Zn mine, Rouyn-Noranda, Quebec. Econ. Geol. 1991, 86, 1110–1114. [Google Scholar] [CrossRef]
- Deditius, A.P.; Reich, M.; Simon, A.C.; Suvorova, A.; Knipping, J.; Roberts, M.P.; Rubanov, S.; Dodd, A.; Saunders, M. Nanogeochemistry of hydrothermal magnetite. Contrib. Mineral. Petrol. 2018, 173, 46. [Google Scholar] [CrossRef]
- Ciobanu, C.L.; Cook, N.J.; Ehrig, K.; Wade, B.P.; Kamenetsky, V.S. Trace element signatures in iron oxides from the Olympic Dam IOCG deposit, South Australia. In Proceedings of the Mineral Resources in a Sustainable World, 13th Biennial SGA Meeting, Nancy, France, 24–27 August 2015; Volume 3, pp. 1071–1074. [Google Scholar]
- Verdugo-Ihl, M.R.; Ciobanu, C.L.; Cook, N.J.; Ehrig, K.; Courtney-Davies, L. Defining early stages of IOCG systems: Evidence from iron-oxides in the outer shell of the Olympic Dam deposit, South Australia. Mineral. Deposita 2019. [Google Scholar] [CrossRef]
- Ciobanu, C.L.; Verdugo-Ihl, M.R.; Slattery, A.; Cook, N.J.; Ehrig, K.J.; Courtney-Davies, L. Nanoscale study of silician magnetite from IOCG systems: Examples from the Olympic Dam District (South Australia). In Proceedings of the Quadrennial IAGOD Symposium, Salta, Argentina, 28–31 August 2018; pp. 89–90. [Google Scholar]
- Otake, T.; Wesolowski, D.J.; Anovitz, L.M.; Allard, L.F.; Ohmoto, H. Experimental evidence for non-redox transformations between magnetite and hematite under H2O-rich hydrothermal conditions. Earth Plan. Sci. Lett. 2007, 257, 60–70. [Google Scholar] [CrossRef]
- Otake, T.; Wesolowski, D.J.; Anovitz, L.M.; Allard, L.F.; Ohmoto, H. Mechanisms of iron oxide transformations in hydrothermal systems. Geochim. Cosmochim. Acta 2010, 74, 6141–6156. [Google Scholar] [CrossRef]
- Barton, M.D. Iron oxide (-Cu-Au-REE-P-Ag-U-Co) systems. In Treatise on Geochemistry, 2nd ed.; Elsevier: Amsterdam, The Netherlands, 2014; Volume 13, pp. 515–541. [Google Scholar]
- Ehrig, K.; McPhie, J.; Kamenetsky, V.S. Geology and mineralogical zonation of the Olympic Dam iron oxide Cu–U–Au–Ag deposit, South Australia. In Geology and Genesis of Major Copper Deposits and Districts of the World, a Tribute to Richard Sillitoe; Hedenquist, J.W., Harris, M., Camus, F., Eds.; Society of Economic Geologists: Littleton, CO, USA, 2012; Volume 16, pp. 237–268. [Google Scholar]
- Allen, S.R.; McPhie, J.; Ferris, G.; Simpson, C. Evolution and architecture of a large felsic Igneous Province in western Laurentia: The 1.6 Ga Gawler Range Volcanics, South Australia. J. Volcanol. Geotherm. Res. 2008, 172, 132–147. [Google Scholar] [CrossRef]
- Groves, D.I.; Bierlein, F.P.; Meinert, L.D.; Hitzman, M.W. Iron oxide copper-gold (IOCG) deposits through earth history: Implications for origin, lithospheric setting, and distinction from other epigenetic iron oxide deposits. Econ. Geol. 2010, 105, 641–654. [Google Scholar] [CrossRef]
- Cherry, A.R.; Ehrig, K.; Kamenetsky, V.S.; McPhie, J.; Crowley, J.L.; Kamenetsky, M.B. Precise geochronological constraints on the origin, setting and incorporation of ca. 1.59 Ga surficial facies into the Olympic Dam Breccia Complex, South Australia. Precambr. Res. 2018, 315, 162–178. [Google Scholar] [CrossRef]
- Courtney-Davies, L.; Tapster, S.R.; Ciobanu, C.L.; Cook, N.J.; Verdugo-Ihl, M.R.; Ehrig, K.J.; Kennedy, A.K.; Gilbert, S.E.; Condon, D.J.; Wade, B.P. A multi-technique evaluation of hydrothermal hematite UePb isotope systematics: Implications for ore deposit geochronology. Chem. Geol. 2019, 513, 54–72. [Google Scholar] [CrossRef]
- Creaser, R.A. Petrogenesis of a Mesoproterozoic quartz latite-granitoid suite from the Roxby Downs area, South Australia. Precambr. Res. 1996, 79, 371–394. [Google Scholar] [CrossRef]
- Kontonikas-Charos, A.; Ciobanu, C.L.; Cook, N.J.; Ehrig, K.; Krneta, S.; Kamenetsky, V.S. Feldspar evolution in the Roxby Downs Granite, host to Fe-oxide Cu-Au-(U) mineralisation at Olympic Dam, South Australia. Ore Geol. Rev. 2017, 80, 838–859. [Google Scholar] [CrossRef]
- South Australian Resources Information Gateway (SARIG) Database. Available online: https://map.sarig.sa.gov.au/ (accessed on 17 February 2019).
- Kontonikas-Charos, A.; Ciobanu, C.L.; Cook, N.J.; Ehrig, K.; Ismail, R.; Krneta, S.; Basak, A. Feldspar mineralogy and rare-earth element (re)mobilization in iron-oxide copper gold systems from South Australia: A nanoscale study. Mineral. Mag. 2018, 82, S173–S197. [Google Scholar] [CrossRef]
- Kontonikas-Charos, A.; Ciobanu, C.L.; Cook, N.J.; Ehrig, K.; Krneta, S.; Kamenetsky, V.S. Rare earth element geochemistry of feldspars: Examples from Fe-oxide Cu-Au systems in the Olympic Cu-Au Province, South Australia. Mineral. Petrol. 2017, 112, 145–172. [Google Scholar] [CrossRef]
- Cook, N.J.; Ciobanu, C.L.; Ehrig, K.; Slattery, A.; Verdugo-Ihl, M.R.; Courtney-Davies, L.; Gao, W. Advances and Opportunities in Ore Mineralogy. Minerals 2017, 7, 233. [Google Scholar] [CrossRef]
- Mauger, A.J.; Ehrig, K.; Kontonikas-Charos, A.; Ciobanu, C.L.; Cook, N.J.; Kamenetsky, V.S. Alteration at the Olympic Dam IOCG–U deposit: Insights into distal to proximal feldspar and phyllosilicate chemistry from infrared reflectance spectroscopy. Aust. J. Earth Sci. 2016, 63, 959–972. [Google Scholar]
- Verdugo-Ihl, M.R.; Ciobanu, C.L.; Cook, N.J.; Ehrig, K.; Courtney-Davies, L.; Gilbert, S. Textures and U-W-Sn-Mo signatures in hematite from the Cu-U-Au-Ag orebody at Olympic Dam, South Australia: Defining the archetype for IOCG deposits. Ore Geol. Rev. 2017, 91, 173–195. [Google Scholar] [CrossRef]
- Dmitrijeva, M.; Ehrig, K.; Ciobanu, C.L.; Cook, N.J.; Verdugo-Ihl, M.R.; Metcalfe, A. Defining IOCG signatures through compositional data analysis: A case study of lithogeochemical zoning from the Olympic Dam deposit, South Australia. Ore Geol. Rev. 2019, 105, 86–101. [Google Scholar] [CrossRef]
- Ciobanu, C.L.; Cook, N.J.; Wade, B.P.; Ehrig, K. Ore Minerals Down to Nanoscale: Petrogenetic Implications. Acta Geol. Sin. Engl. Ed. 2014, 88, 1441–1443. [Google Scholar] [CrossRef]
- Meinert, L.D.; Dipple, G.M.; Nicolescu, S. World Skarn Deposits. Econ. Geol. 2005, 100, 299–336. [Google Scholar]
- Jenkins, D.M.; Bozhilov, K.N. Stability and thermodynamic properties of ferro-actinolite: A re-investigation. Am. J. Sci. 2003, 303, 723–752. [Google Scholar] [CrossRef] [Green Version]
- Lledo, H.L.; Jenkins, D.M. Experimental investigation of the upper thermal stability of Mg-rich actinolite; Implications for Kiruna-type iron deposits. J. Petrol. 2008, 49, 225–238. [Google Scholar] [CrossRef]
- Tornos, F.; Velasco, F.; Hanchar, J.M. Iron-rich melts, magmatic magnetite, and superheated hydrothermal systems: The El Laco deposit, Chile. Geology 2016, 44, 427–430. [Google Scholar] [CrossRef]
- Ciobanu, C.L.; Cook, N.J.; Maunders, C.; Wade, B.P.; Ehrig, K. Focused Ion Beam and Advanced Electron Microscopy for Minerals: Insights and Outlook from Bismuth Sulphosalts. Minerals 2016, 6, 112. [Google Scholar] [CrossRef]


| Mineral | Formula | SG | a (Å) | <T–O> (Å) | <M–O> (Å) | Reference(s) | |
|---|---|---|---|---|---|---|---|
| Oxide spinels “2-3”: A2+B3+2O4 | |||||||
| Magnetite | FeFe2O4 | 8.397 | 1.886 | 2.061 | Fleet (1984) [22] | ||
| 8.394 | Fleet (1986) [3] | ||||||
| Hercynite | FeAl2O4 | 8.154 | 1.968 | 1.928 | Lenaz & Skogby (2013) [23] | ||
| Gahnite | ZnAl2O4 | 8.085 | 1.953 | 1.912 | Ardit et al. (2012) [24] | ||
| Franklinite | ZnFe2O4 | 8.442 | 1.978 | 2.027 | Pavese et al. (2000) [25] | ||
| Oxide spinels “4-2”: A4+B2+2O4 | |||||||
| Ahrensite | γ-SiFe2O4 | 8.234 | 1.652 | 2.137 | Yagi et al. (1974) [26] | ||
| Ringwoodite | γ-SiMg2O4 | 8.071 | 1.665 | 2.066 | Hazen et al. (1993) [27] | ||
| Ulvöspinel | TiFe2O4 | 8.532 | 2.006 | 2.046 | Bosi et al. (2009) [28] | ||
| SG | a (Å) | b (Å) | c (Å) | α(ᵒ) | |||
| “Silician magnetite” | |||||||
| Spinel solid solution Fe2SiO4-Fe3O4 | Fe(3−x)SixO4 | Yamanaka et al. (2001) [16] | |||||
| *Magnetite | x = 0 | Fd3m | 8.394 | ||||
| Cubic, partial Fe vacancy disorder | x = 0.09 | Fd3m | 8.392 | ||||
| x = 0.288 | Fd3m | 8.374 | |||||
| Cubic, full-site Fe vacancy ordering maghemite type | γ-□0.5Fe1.5SiO4 | P4332 | 8.125 | Xu et al. (2014) [29] (DFT) | |||
| Maghemite | γ-Fe2O3, redefined as spinel with formula: (Fe3+0:67□0:33) Fe3+2O4 | Bosi et al. (2019) [30] | |||||
| Cubic, partial Fe vacancy disorder | Fd3m | 8.33 | Pecharroman et al. (1995) [31] | ||||
| P4332 | 8.33 | ||||||
| Tetragonal, full site ordering c/a~3 | P43212 | 8.33 | 8.33 | 24.99 | Grau-Crespo et al. (2010) [21] (DFT) | ||
| P41212 | 8.347 | 8.347 | 25.042 | ||||
| Olivine group | |||||||
| Fayalite | SiFe2O4 | Pbnm | 4.82 | 10.48 | 6.09 | Fujino et al. (1981) [32] | |
| Laihunite-1M | α-SiFe2O4 | P21/b | 4.8 | 10.2 | 1 x 5.8 | 91.39 | Xu et al. (2014) [33] (DFT) |
| Laihunite-2M | P21/b | 4.82 | 10.3 | 2 x 5.93 | 90.79 | ||
| Laihunite-3Or | Pbnm | 4.81 | 10.25 | 3 x 5.85 | |||
| Sample | Foil No. # | Si–Mt Nanoprecipitates | U-, Y-As-NPs | Calc-Silicates | Rt | Others | Ilm | Spinels | |
|---|---|---|---|---|---|---|---|---|---|
| FP Blebs/Euhedral | NP Strips/Rods | ||||||||
| Northern side of Olympic Dam | |||||||||
| 1. Massive magnetite interval (~10 m) within altered granite; K-feldspar absent (RU65-7976) | |||||||||
| OD11 (869 m) >70% magnetite. Gangue: siderite, quartz, minor apatite | |||||||||
| Coarse grains (>500 µm), O-Z | 1 | X | <<Urn | ||||||
| Medium-sized grains (<500 µm) O-Z, X-cut trails | 2 | X | X | x | Carb | ||||
| Eastern transect | |||||||||
| 2. Distal Satellite Mineralization (RD2316) Fe-oxide pockets in altered granite; K Feldspar present | |||||||||
| MV059 (561 m) | 3 | X | Act | x | Chl, Qz | x | |||
| 3. Deep Mineralization (RD2773; E683668, N6630034)—sample from Fe-oxide pocket at contact between Roxby Downs Granite and felsic volcanics; K-feldspar absent | |||||||||
| 2773-5 (1890 m) | 4 | X | Di, Act, Ep | x | Cal, Sp, Qz | ||||
| 4. Nodular Fe-oxide granite (RD2366); pockets Fe-oxides in altered granite; K-feldspar present | |||||||||
| MV005b (916 m) | 5 | X | X | X | x | Qz; K-, Al-zoning | |||
| MV004 (942 m) | 6 | X | X | X | X | X | Her; Frk/Gah, | ||
| 7 | X | X | X | X | Ser? | X | Her | ||
| Southwestern side | |||||||||
| 5. Roxby Downs Granite (RD2494)—Fresh, magmatic feldspars and mafic minerals preserved. Magmatic accessories comprise magnetite, ilmenite, apatite zircon; titanite also present | |||||||||
| RX7860 (482 m) | 8 | x | X | Hec, Ulv | |||||
© 2019 by the authors. Licensee MDPI, Basel, Switzerland. This article is an open access article distributed under the terms and conditions of the Creative Commons Attribution (CC BY) license (http://creativecommons.org/licenses/by/4.0/).
Share and Cite
Ciobanu, C.L.; Verdugo-Ihl, M.R.; Slattery, A.; Cook, N.J.; Ehrig, K.; Courtney-Davies, L.; Wade, B.P. Silician Magnetite: Si–Fe-Nanoprecipitates and Other Mineral Inclusions in Magnetite from the Olympic Dam Deposit, South Australia. Minerals 2019, 9, 311. https://doi.org/10.3390/min9050311
Ciobanu CL, Verdugo-Ihl MR, Slattery A, Cook NJ, Ehrig K, Courtney-Davies L, Wade BP. Silician Magnetite: Si–Fe-Nanoprecipitates and Other Mineral Inclusions in Magnetite from the Olympic Dam Deposit, South Australia. Minerals. 2019; 9(5):311. https://doi.org/10.3390/min9050311
Chicago/Turabian StyleCiobanu, Cristiana L., Max R. Verdugo-Ihl, Ashley Slattery, Nigel J. Cook, Kathy Ehrig, Liam Courtney-Davies, and Benjamin P. Wade. 2019. "Silician Magnetite: Si–Fe-Nanoprecipitates and Other Mineral Inclusions in Magnetite from the Olympic Dam Deposit, South Australia" Minerals 9, no. 5: 311. https://doi.org/10.3390/min9050311