A Review of the Classification of Opal with Reference to Recent New Localities


Abstract
:1. Introduction
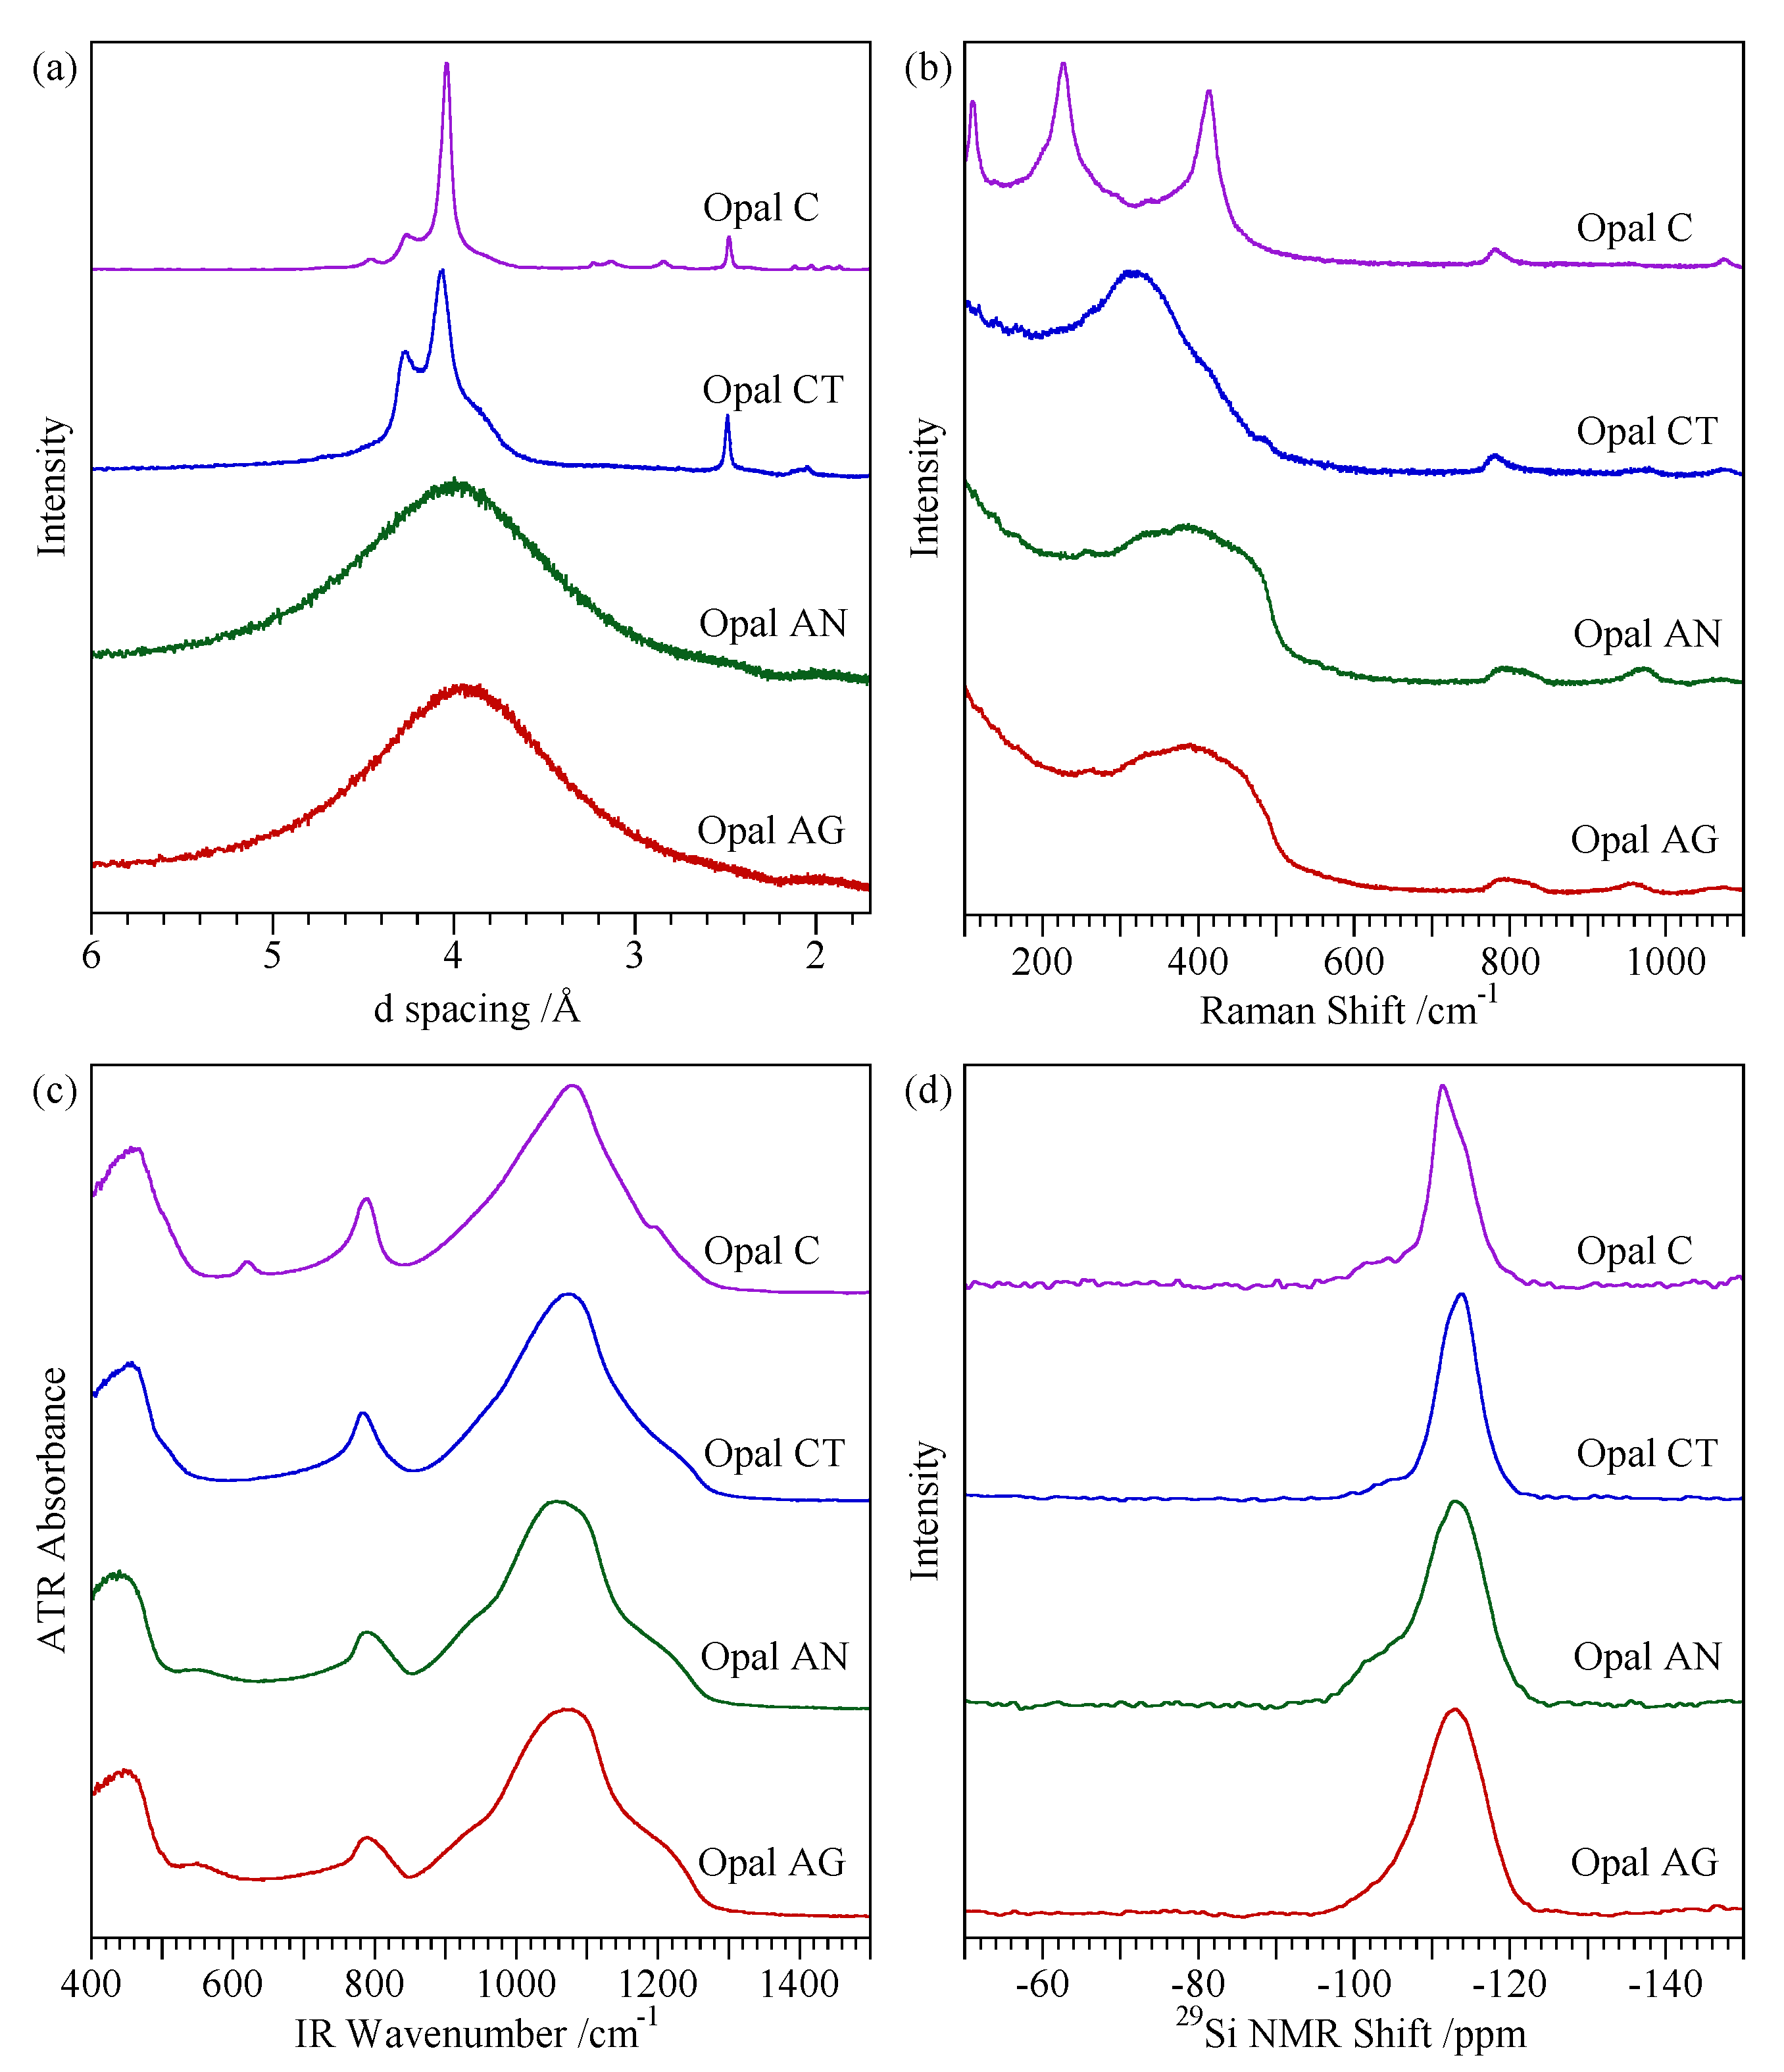
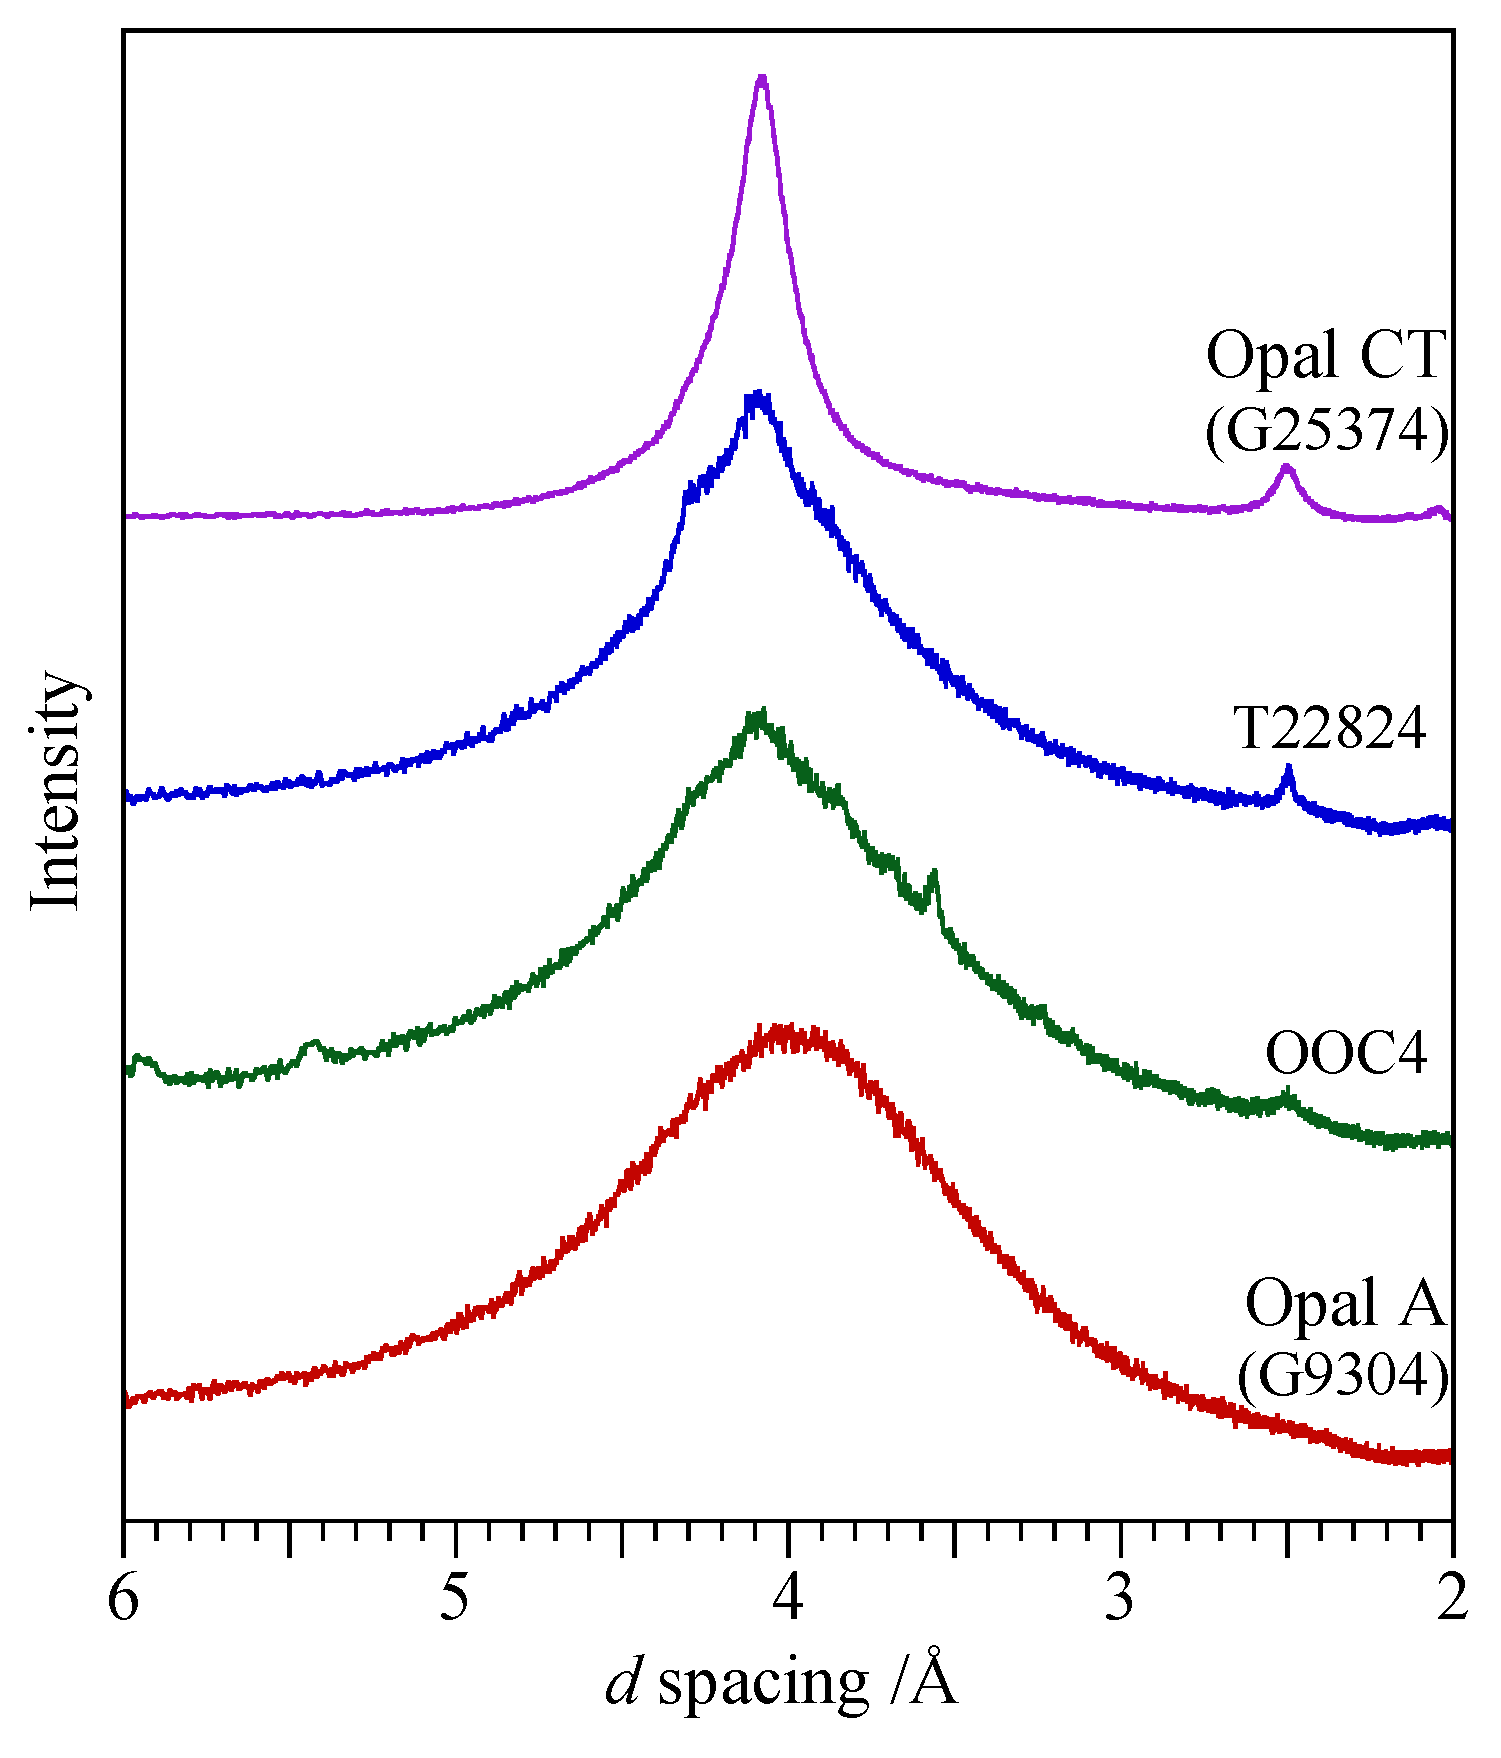
- Opal-A (both AG and AN): broad absorption only, centred on 4.0 Å.
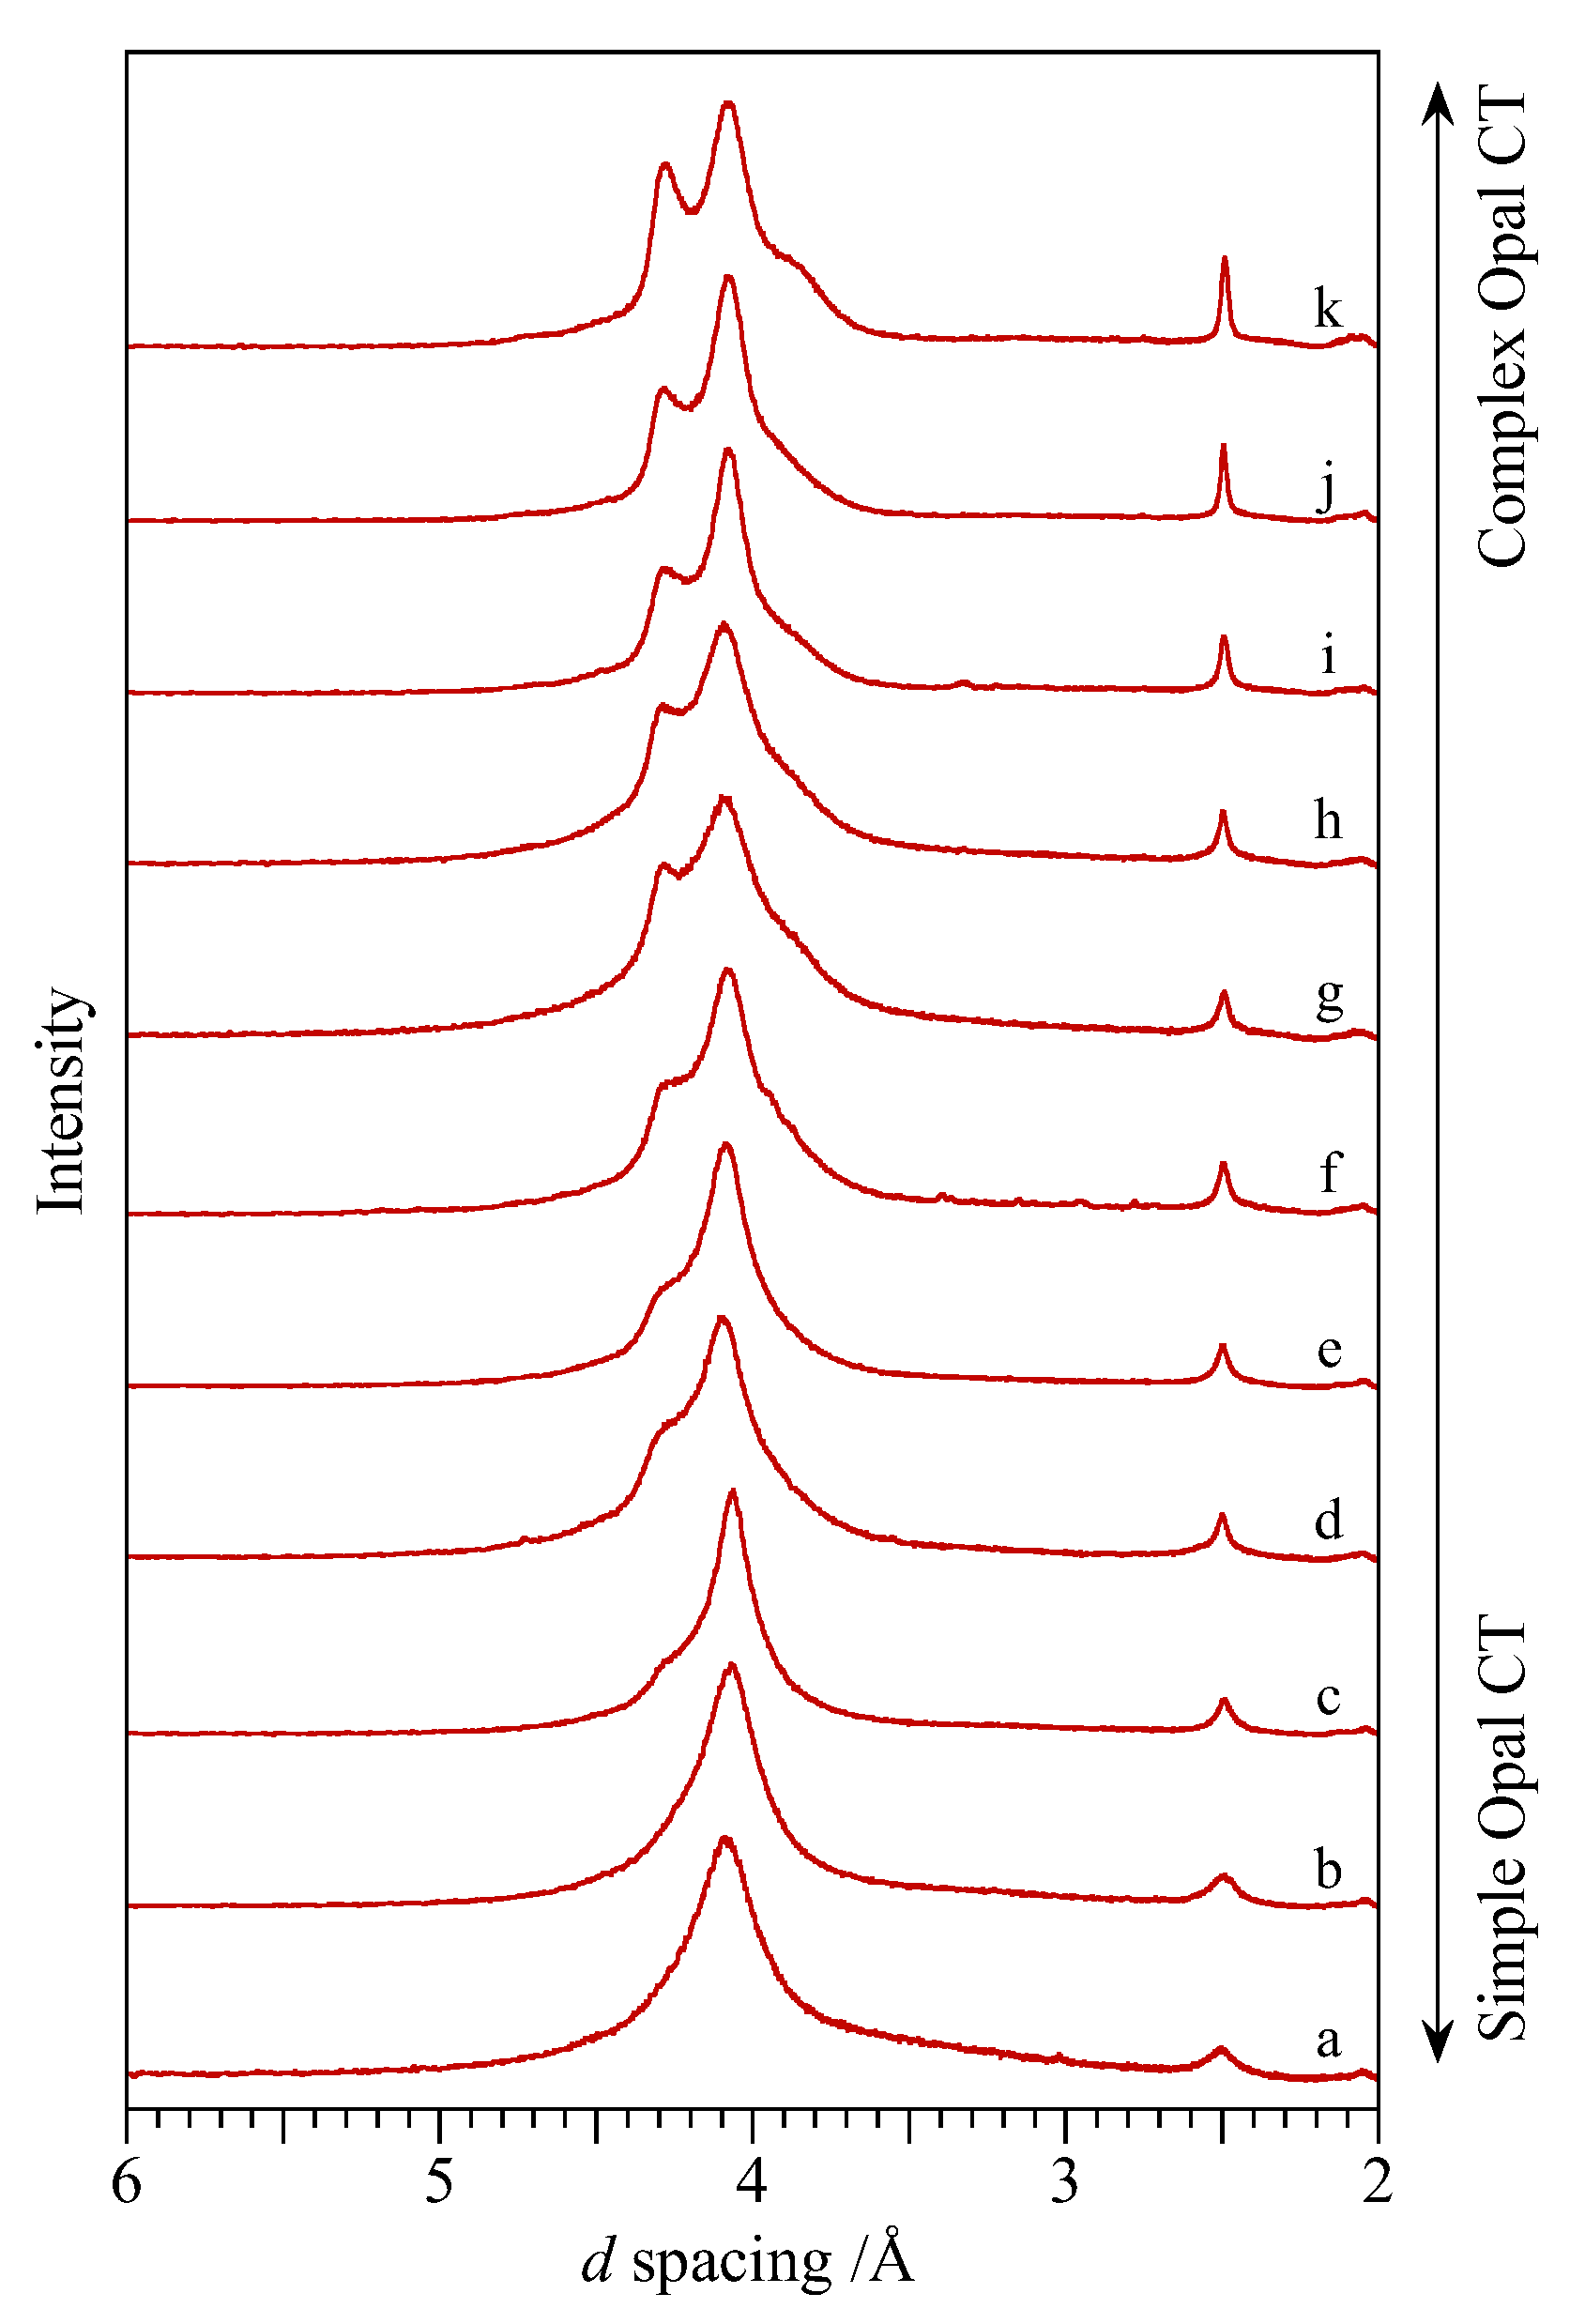
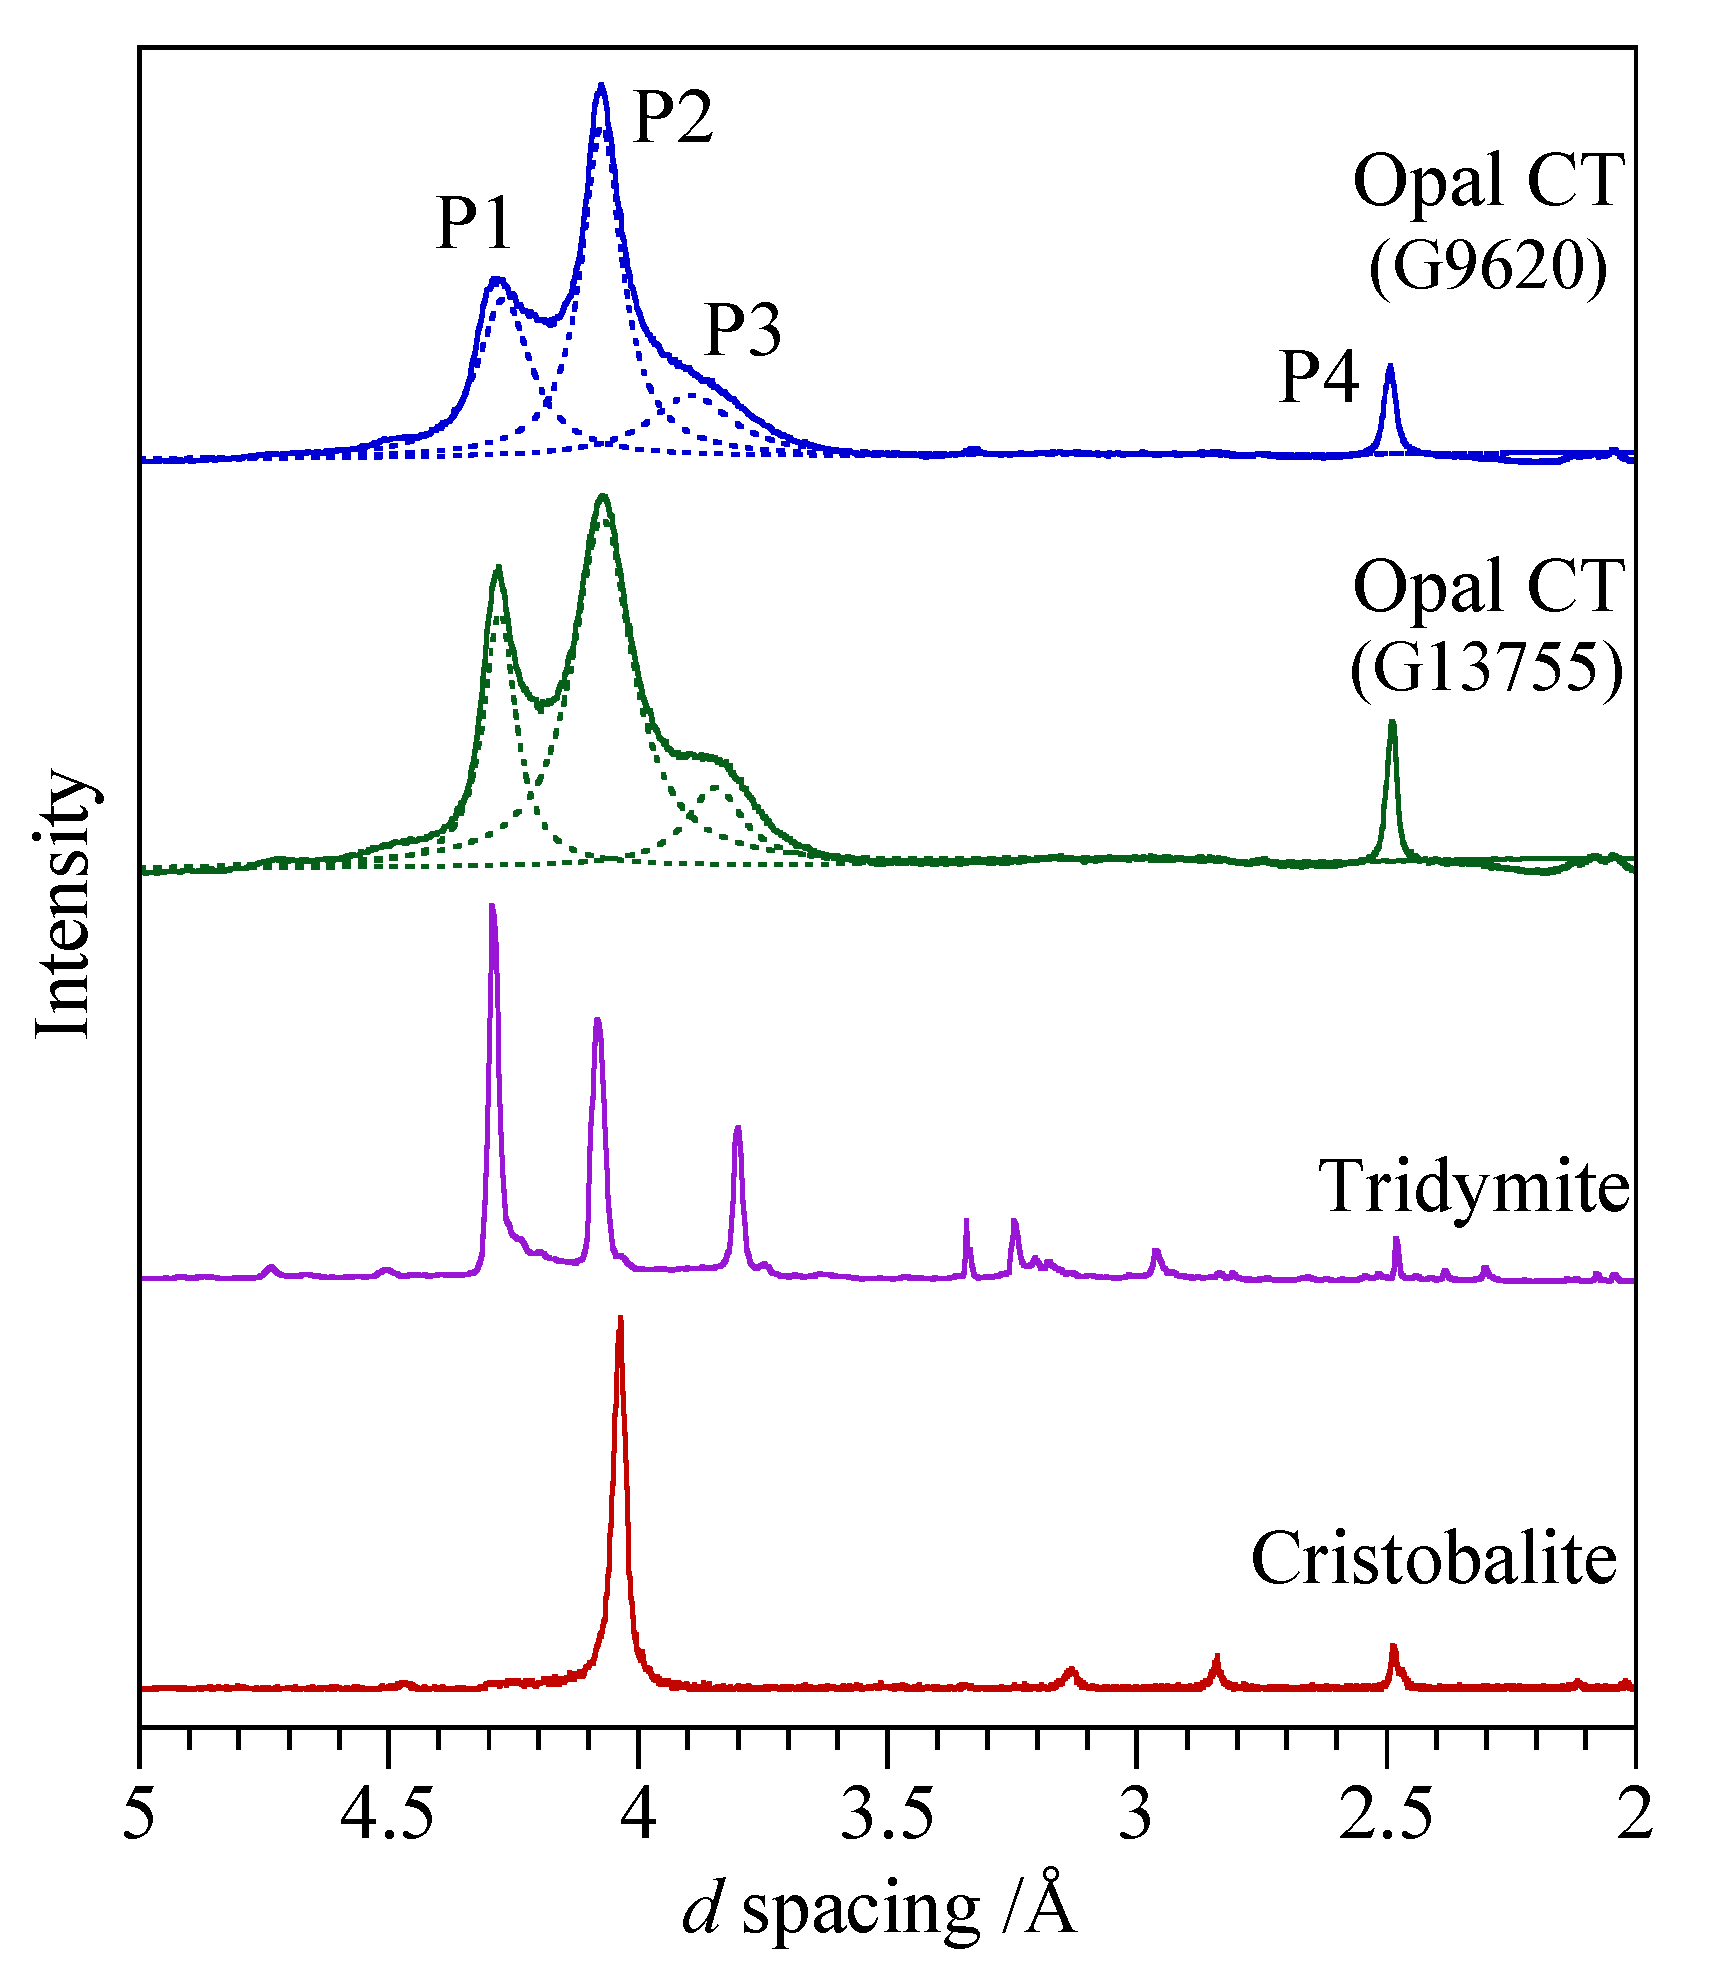
- Opal-CT: two prominent peaks at ~4.1 Å and 2.5 Å with a further peak showing variable degrees of separation at ~4.27 Å.
- Opal-C: prominent peaks at 4.04 Å and 2.5 Å.
2. Materials and Methods
3. Results
3.1. Overview
3.2. Opal-A
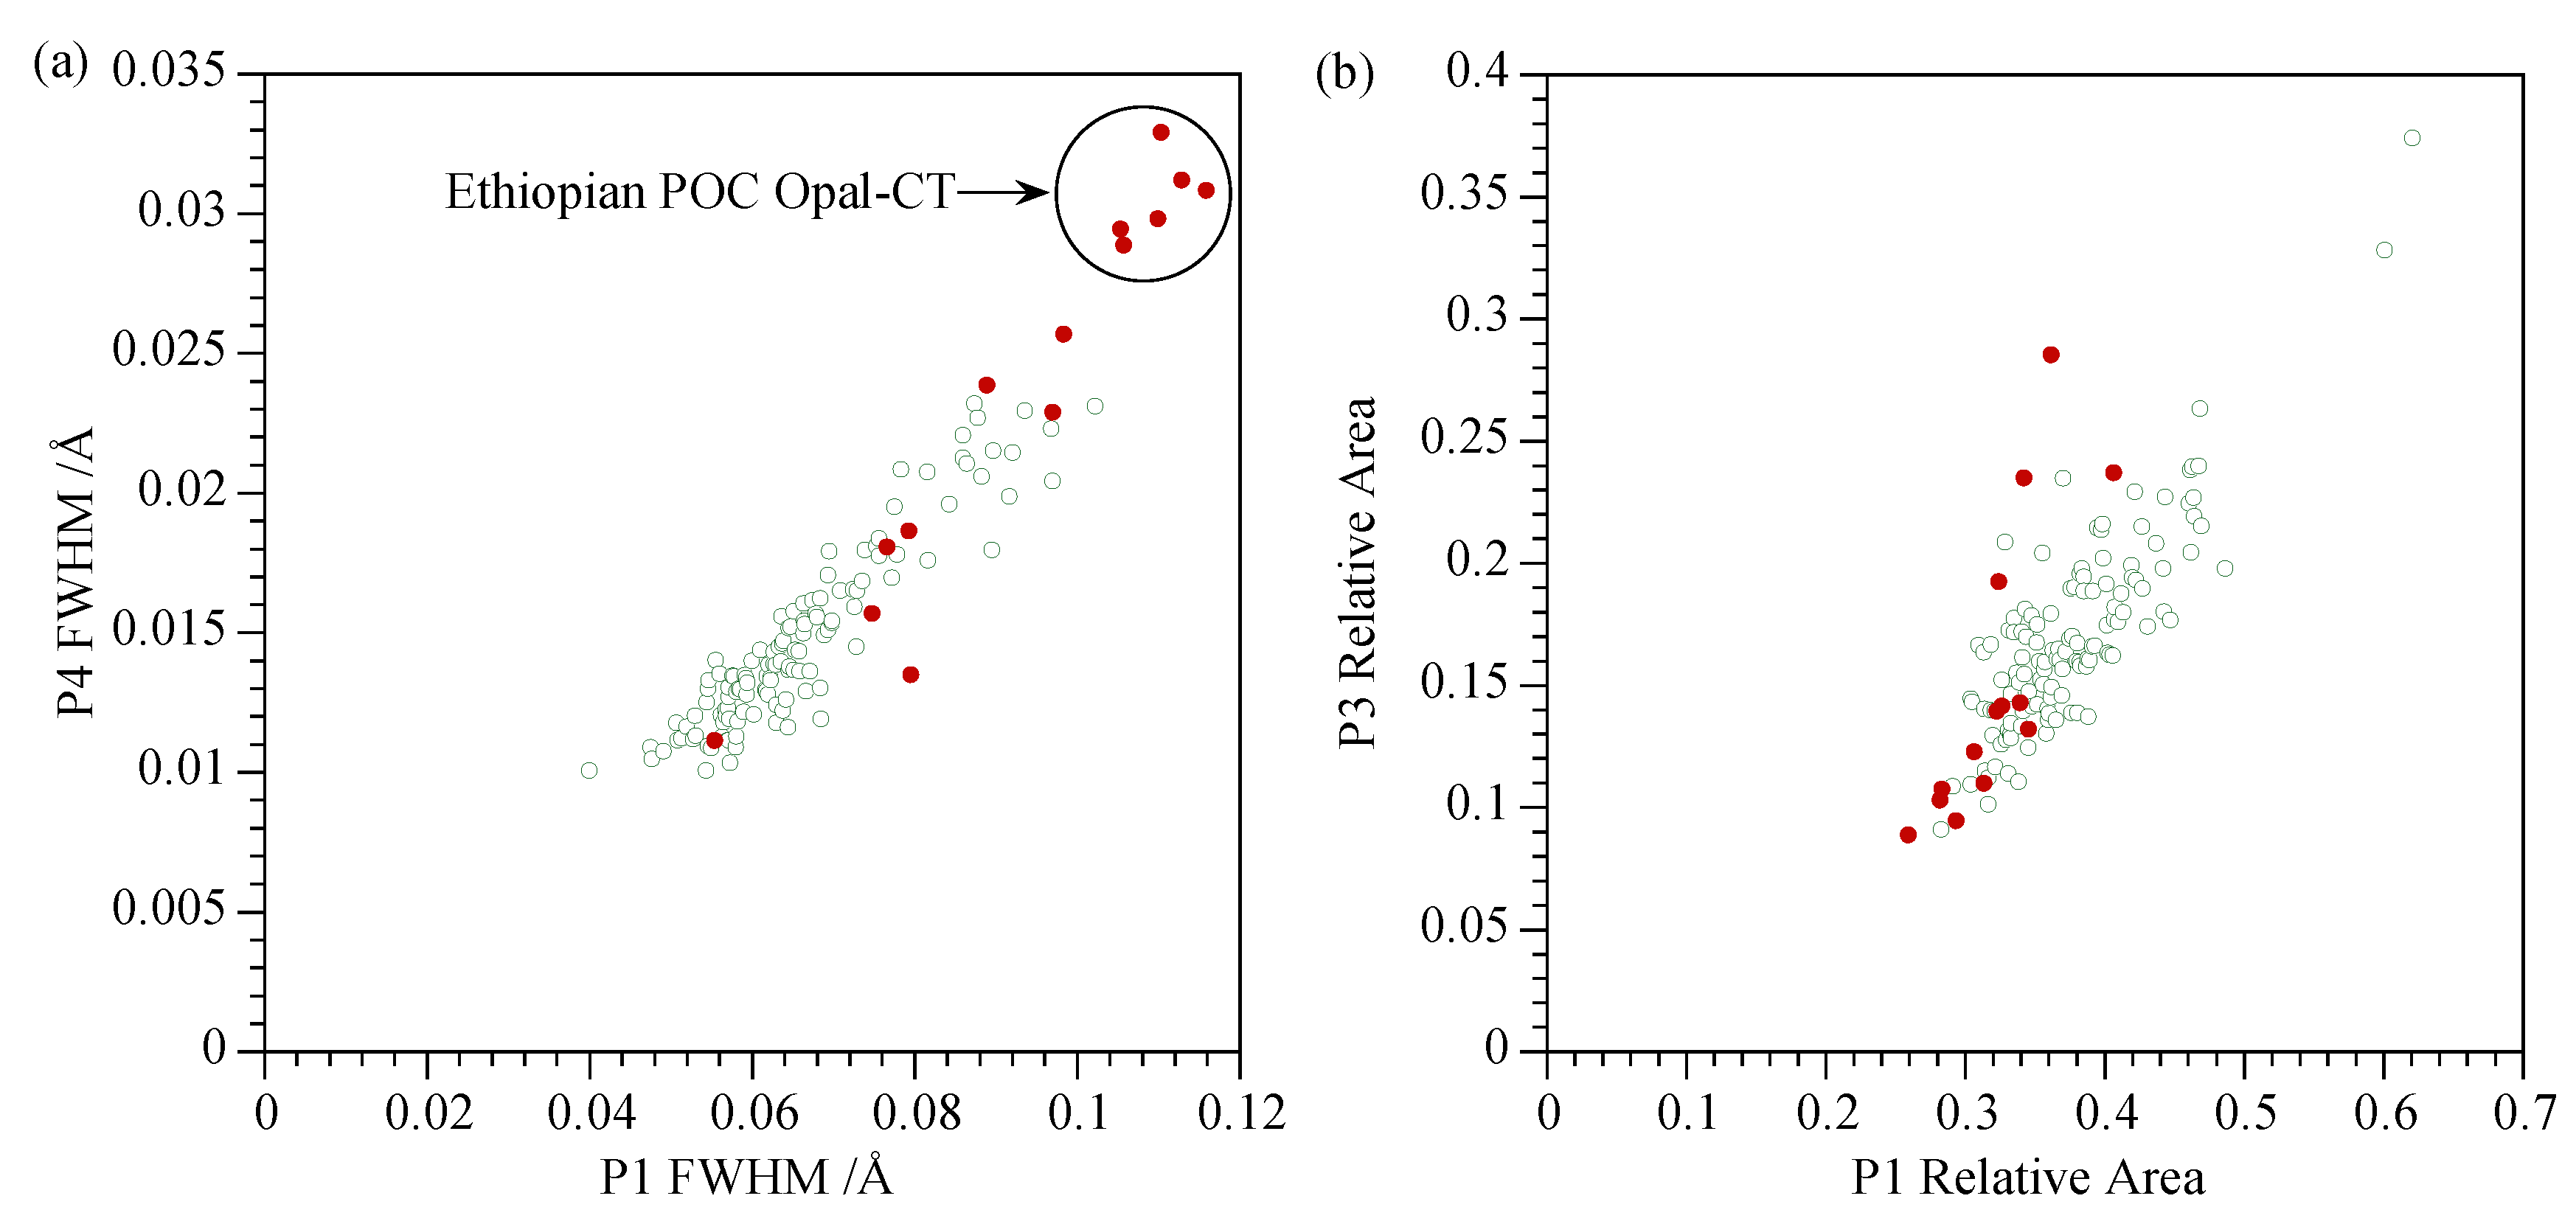
3.3. Opal-CT
3.4. Opal-C
3.5. Transitional Samples
3.5.1. Samples Showing Opal-A and Opal-CT Characteristics
3.5.2. Samples Showing Opal-CT and Opal-C Characteristics
4. Discussion
4.1. Applicability of XRD for Primary Classification
4.2. Homogeneity and Characterisation of Opal Groups
4.2.1. Opal-A
4.2.2. Opal-CT
4.2.3. Opal-C
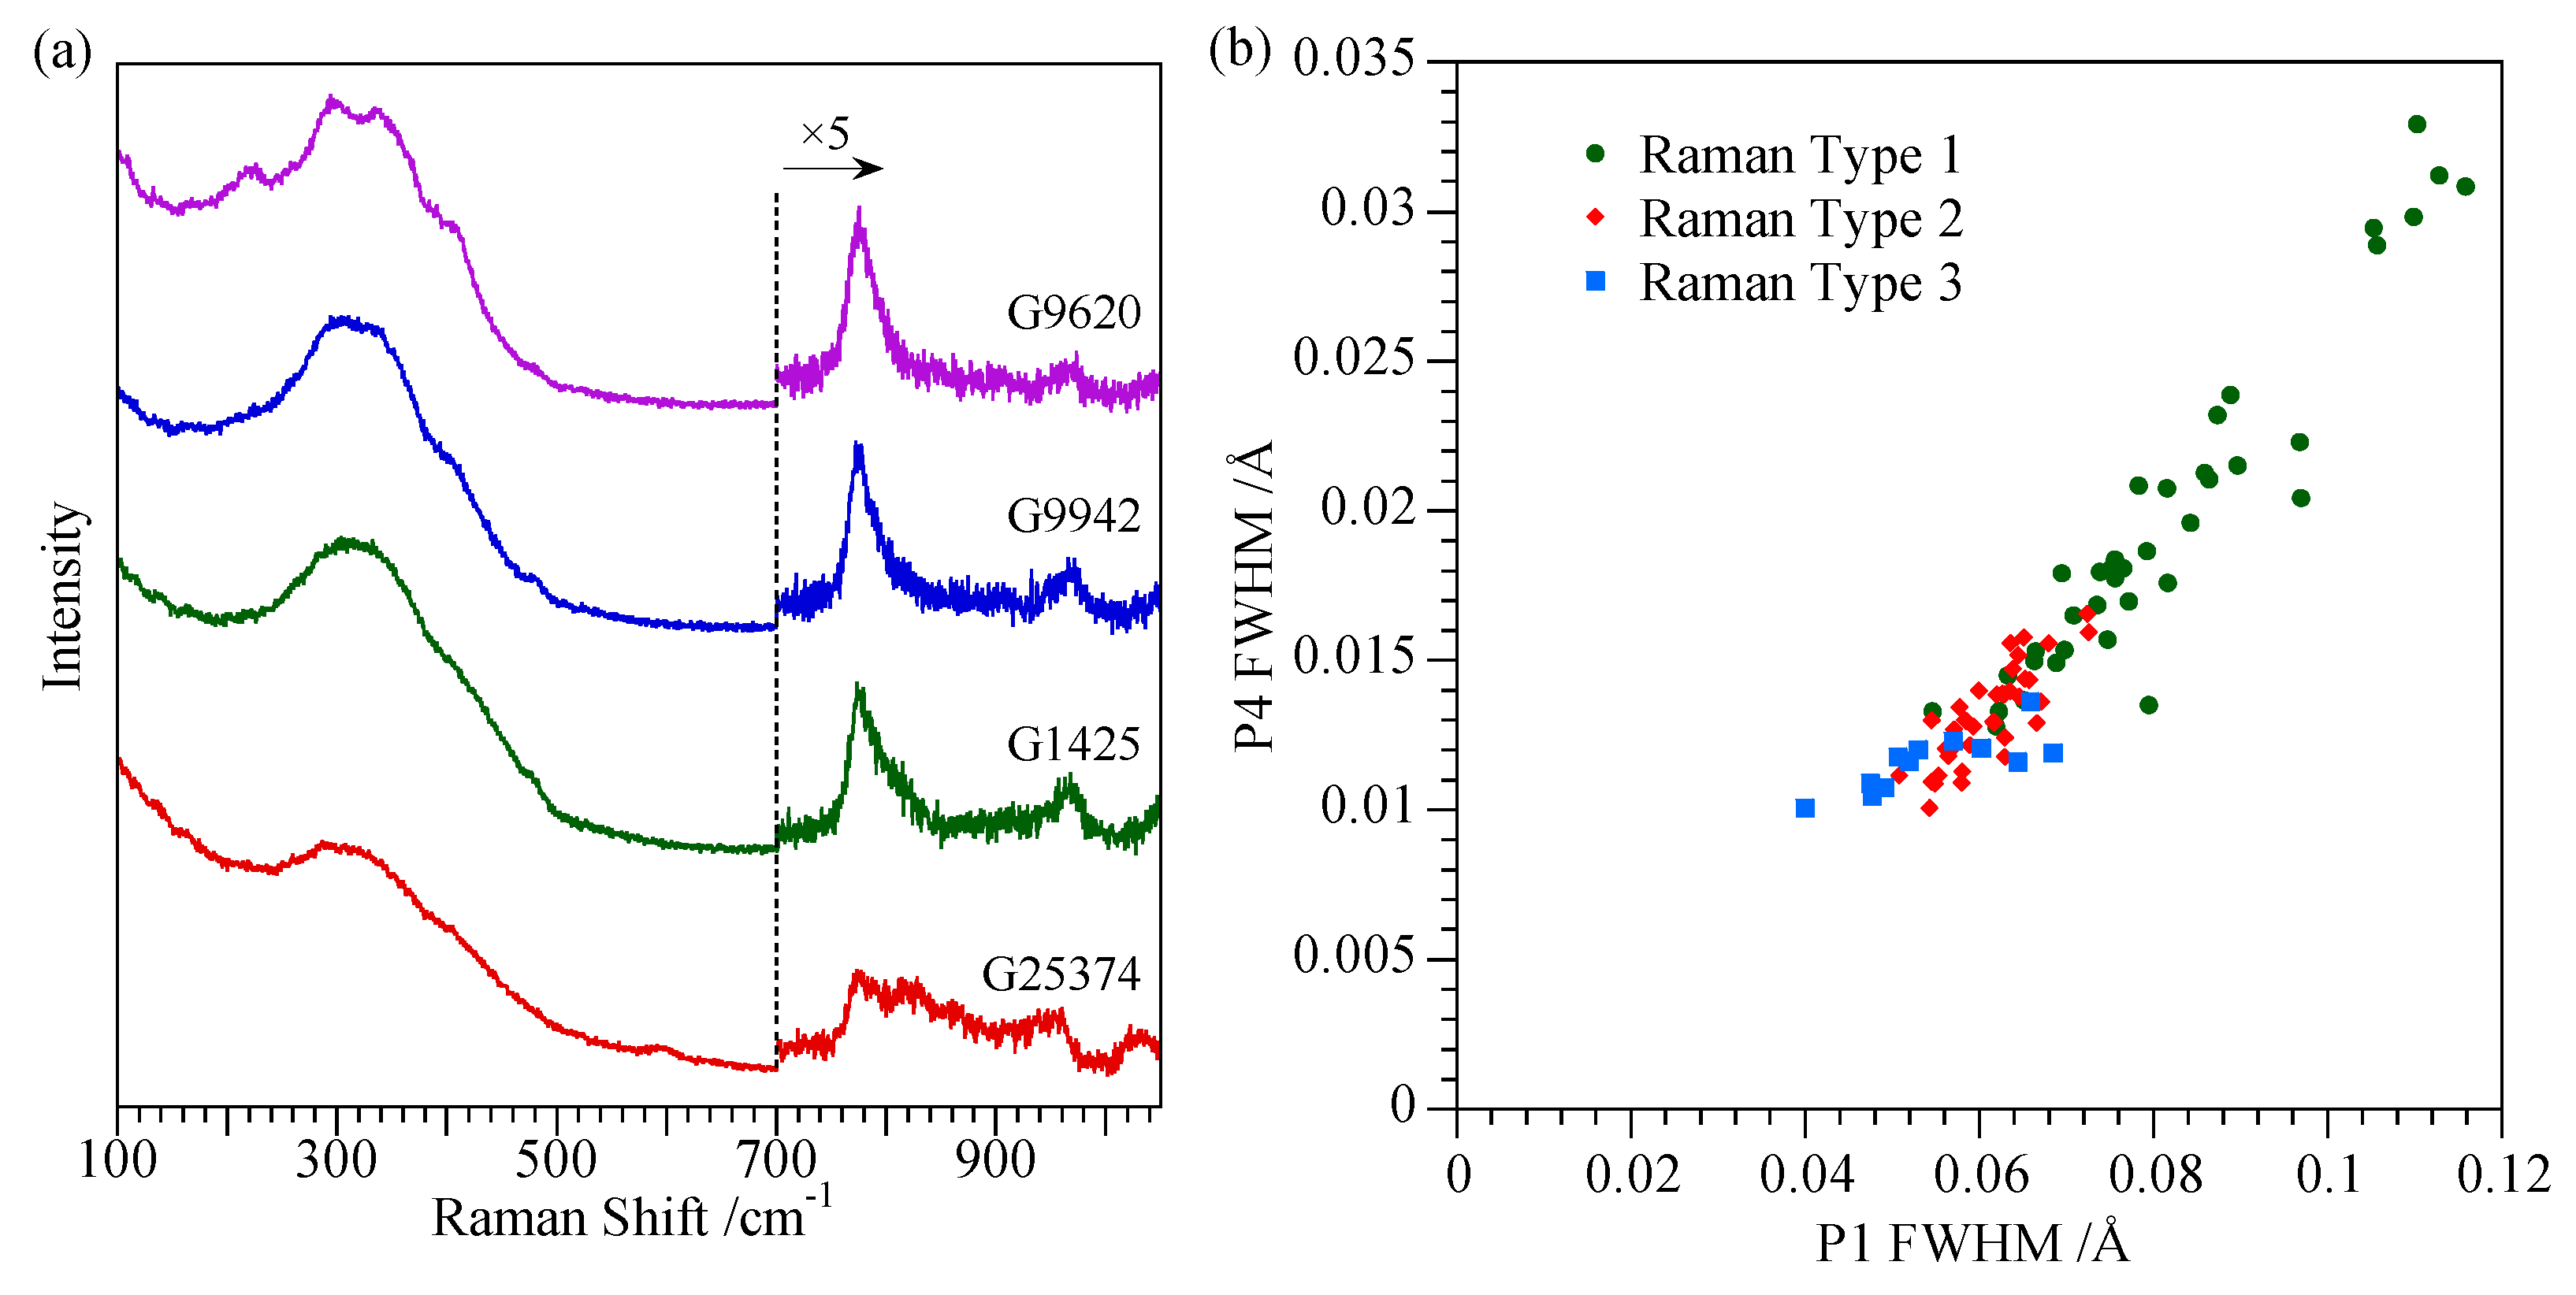
4.3. Spectroscopic Characterisation Techniques
4.4. Comments on Nature of Opal-CT
4.5. Comments on Opal Formation and Transitions Between Opal-A, Opal-CT, Opal-C and Quartz
4.6. Summary
Supplementary Materials
Author Contributions
Funding
Acknowledgments
Conflicts of Interest
References
- Jones, J.B.; Segnit, E.R. The Nature of Opal I. Nomenclature and Constituent Phases. J. Geol. Soc. Aust. 1971, 18, 57–68. [Google Scholar] [CrossRef]
- Murray, M.J.; Sanders, J.V. Close packed structures of spheres of two different sizes II. The packing densities of likely arrangements. Philos. Mag. A 1980, 42, 721–740. [Google Scholar] [CrossRef]
- Caucia, F.; Ghisoli, C.; Marinoni, L.; Bordoni, V. Opal, a beautiful gem between myth and reality. Neues Jahrbuch für Mineralogie Abhandlungen J. Miner. Geochem. 2013, 190, 1–9. [Google Scholar] [CrossRef]
- Sanders, J.V. Colour of precious opal. Nature 1964, 204, 1151–1153. [Google Scholar] [CrossRef]
- Chauvire, B.; Rondeau, B.; Mazzero, F.; Ayalew, D. The precious opal deposit at Wegel Tena, Ethiopia: Formation via successive pedogenesis events. Can. Miner. 2017, 55, 701–723. [Google Scholar] [CrossRef]
- Simoni, M.; Caucia, F.; Adamo, I.; Galinetto, P. New occurence of fire opal from Bemia, Madagascar. Gems Gemol. 2010, 46, 114–121. [Google Scholar] [CrossRef]
- Ansori, C. Model mineralisasi pembentukan opal banten. Jurnal Geol. Indones. 2010, 5, 151–170. [Google Scholar] [CrossRef]
- Shigley, J.E.; Laurs, B.M.; Renfro, N.D. Chrysoprase and prase opal from Haneti, Central Tanzania. Gems Gemol. 2009, 45, 271–279. [Google Scholar] [CrossRef]
- Hatipoglu, M.; Kibici, Y.; Yanik, G.; Ozkul, C.; Demirbilek, M.; Yardmici, Y. Nano-structure of the Cristobalite and Tridymite Staking Sequences in the Common Purple Opal from the Gevrekseydi Deposit, Seyitomer-Kutahka, Turkey. Orient. J. Chem. 2015, 31, 35–49. [Google Scholar] [CrossRef]
- Pewkliang, B.; Pring, A.; Brugger, J. The formation of precious opal: Clues from the opalization of bone. Can. Miner. 2008, 46, 139–149. [Google Scholar] [CrossRef]
- Gauthier, J.-P.; Fritsch, E.; Aguilar-Reyes, B.; Barreau, A.; Lasnier, B. Phase de Laves dans la première opale CR disperse. Mineralogie 2004, 336, 187–196. [Google Scholar]
- Sanders, J.V. Close-packed structures of spheres of two different sizes I. Observations of natural opal. Philos. Mag. A 1980, 42, 705–720. [Google Scholar] [CrossRef]
- Sodo, A.; Municchia, A.C.; Barucca, S.; Bellatreccia, F.; Ventura, G.D.; Butini, F.; Ricci, M.A. Raman, FT-IR and XRD investigation of natural opals. J. Raman Spectrosc. 2016, 47, 1444–1451. [Google Scholar] [CrossRef]
- Ghisoli, C.; Caucia, F.; Marinoni, L. XRPD patterns of opals: A brief review and new results from recent studies. Powder Diffr. 2010, 25, 274–282. [Google Scholar] [CrossRef]
- Liesegang, M.; Milke, R. Australian sedimentary opal-A and its associated minerals: Implications for natural silica sphere formation. Am. Miner. 2014, 99, 1488–1499. [Google Scholar] [CrossRef]
- Jones, J.B.; Segnit, E.R. Genesis of Cristobalite and Tridymite at Low Temperature. J. Geol. Soc. Aust. 1972, 18, 419–422. [Google Scholar] [CrossRef]
- Elzea, E.L.; Odom, I.E.; Miles, W.J. Distinguishing well ordered opal-CT and opal-C from high temperature cristoblite by x-ray diffraction. Anal. Chim. Acta 1994, 286, 106–116. [Google Scholar] [CrossRef]
- Gaillou, E.; Delaunay, A.; Rondeau, B.; Bouhnik-le-Coz, M.; Fritsch, E.; Corren, G.; Monnier, C. The geochemistry of gem opals as evidence of their origin. Ore Geol. Rev. 2008, 34, 113–126. [Google Scholar] [CrossRef]
- Ostrooumov, N.; Fritsch, E.; Lasnier, B.; Lefrant, S. Spectres Raman des opales: Aspect diagnostique et aide a la classification. Eur. J. Miner. 1999, 11, 899–908. [Google Scholar] [CrossRef]
- Smallwood, A.G.; Thomas, P.S.; Ray, A.S. Characterisation of sedimentary opals by Fourier transfrom Raman spectroscopy. Spectrochim. Acta Part A 1997, 53, 2341–2345. [Google Scholar] [CrossRef]
- Kingma, K.J.; Hemley, R.J. Raman spectroscopic study of microcrystalline silica. Am. Miner. 1994, 79, 269–273. [Google Scholar]
- Paris, M.; Fritsch, E.; Aguilar-Reyes, B. 1H, 29Si and 27Al NMR study of the destabilization process of a paracrystalline opal from Mexico. J. Non-Cryst. Solids 2007, 353, 1650–1656. [Google Scholar] [CrossRef]
- Brown, L.D.; Ray, A.S.; Thomas, P.S. 29Si and 27Al NMR study of amorphous and paracrystalline opals from Australia. J. Non-Cryst. Solids 2003, 332, 242–248. [Google Scholar] [CrossRef]
- de Jong, B.W.H.S.; van Hoek, J.; Veeeman, W.S.; Manson, D.V. X-ray diffraction and 29Si magic-angle-spinning NMR of opals: Incoherent long- and short-range order in opal-CT. Am. Miner. 1987, 72, 1195–1203. [Google Scholar]
- Graetsch, H.; Gies, H.; Topalovic, I. NMR, XRD and IR study on microcrstalline opal. Phys. Chem. Miner. 1994, 21, 166–175. [Google Scholar] [CrossRef]
- Graetsch, H.; Mosset, A.; Gies, H. XRD and 29Si MAS-NMR study of some non-crystalline silica minerals. J. Non-Cryst. Solids 1990, 119, 173–190. [Google Scholar] [CrossRef]
- Smith, J.V.; Blackwell, C.S. Nuclear magnetic resonance of silica polymorphs. Nature 1983, 303, 223–225. [Google Scholar] [CrossRef]
- Day, R.; Jones, B. Variations in water content in opal-A and opal-CT from geyser discharge aprons. J. Sediment. Res. 2008, 78, 301–315. [Google Scholar] [CrossRef]
- Bobon, M.; Christy, A.A.; Kluvanec, D.; Illasova, L. State of water molecules and silanol groups in opal minerals: A near infrared spectrscopic study of opals from Slovakia. Phys. Chem. Miner. 2011, 38, 809–818. [Google Scholar] [CrossRef]
- Chauviré, B.; Rondeau, B.; Mangold, N. Near infrared signature of opal and chalcedony as a proxy for their structure and formation conditions. Eur. J. Miner. 2017, 29, 409–421. [Google Scholar] [CrossRef]
- Eckert, J.; Gourdon, O.; Jacob, D.E.; Meral, C.; Monteiro, P.J.M.; Vogel, S.C.; Wirth, R.; Wenk, H.-R. Ordering of water in opals with different microstructures. Eur. J. Miner. 2015, 27, 203–213. [Google Scholar] [CrossRef]
- Rondeau, B.; Fritz, E.; Mazzero, F.; Gauthier, J.-P.; Cencki-Tok, B.; Bekele, E.; Gaillou, E. Play-of-color opal from Wegel Tena, Wollo Province, Ethiopia. Gems Gemol. 2010, 46, 90–105. [Google Scholar] [CrossRef]
- McOrist, G.D.; Smallwood, A. Trace elements in precious and common opals using neutron activation analysis. J. Radioanal. Nucl. Chem. 1997, 223, 9–15. [Google Scholar] [CrossRef]
- Brown, L.D.; Ray, A.S.; Thomas, P.S. Elemental Analysis of Australian amorphous banded opals by laser-ablation ICP-MS. Neues Jahrbuch für Minerologie Monatshefte 2004, 2004, 411–424. [Google Scholar] [CrossRef]
- Dutkiewicz, A.; Landgrebe, T.C.W.; Rey, P.F. Origin of silica and fingerprinting of Australian sedimentary opals. Gondwana Res. 2015, 27, 786–795. [Google Scholar] [CrossRef]
- Rondeau, B.; Cenki-Tok, B.; Fritsch, E.; Mazzero, F.; Gauthier, J.-P.; Bodeur, Y.; Bekele, E.; Gaillou, E.; Ayalew, D. Geochemical and petrological characterizarion of gem opals from Wegel Tena, Wolo, Ethiopia: Opal formation in an Oligocene soil. Geochem. Explan. Environ. Anal. 2012, 12, 93–104. [Google Scholar] [CrossRef]
- Ivey, J. Grape agate from West Sulawesi, Indonesia. Miner. Rec. 2018, 49, 827–836. [Google Scholar]
- Jones, B.; Renaut, R.W. Microstructural changes accompanying the opal-A to opal-CT transition: New evidence from the siliceous sinters of Geysir, Haukadalur, Iceland. Sedimentology 2007, 54, 921–948. [Google Scholar] [CrossRef]
- Martin, E.; Gaillou, E. Insight on gem opal formation in volcanic ash deposits from a supereruption: A case study through oxygen and hydrogen isotopic composition of opals from Lake Tecopa, California, U.S.A. Am. Miner. 2018, 103, 803–811. [Google Scholar] [CrossRef]
- Fritsch, E.; Gaillou, E.; Rondeau, B.; Barreau, A.; Albertini, D.; Ostroumov, M. The nanostructure of fire opal. J. Non-Cryst. Solids 2006, 352, 3957–3960. [Google Scholar] [CrossRef]
- Williams, L.A.; Crerar, D.A. Silica diagenesis, II. General mechanisms. J. Sediment. Petrol. 1985, 55, 312–321. [Google Scholar]
- Lynne, B.Y.; Campbell, K.A.; James, B.; Browne, P.R.L.; Moore, J. Siliceous sinter diagenesis: Order among the randomness. In Proceedings of the 28th NZ Geothermal Workshop, Auckland, New Zealand, 15–17 November 2006. [Google Scholar]
- Rice, S.B.; Freund, H.; Huang, W.-L.; Clouse, J.A.; Isaacs, C.M. Application of Fourier transform infrared spectrscopy to silica diagenis: The opal-A to opal-CT transformation. J. Sediment. Res. 1995, A65, 639–647. [Google Scholar]
- Smith, D.K. Opal, cristobalite and tridymite: Noncrystallinity versus crystallinity, nomenclature of the silica minerals and bibliography. Powder Diffr. 1998, 13, 2–19. [Google Scholar] [CrossRef]
- Anthony, J.W.; Bideaux, R.A.; Bladh, K.W.; Nichols, M.C. Handbook of Mineralogy, vol 2 Silica, Silicates; Mineral Data Publishing: Tucson, AZ, USA, 1995. [Google Scholar]
- Pecharsky, V.L.; Zavalij, P.Y. Fundamentals of Powder Diffraction and Structural Characterization of Materials; Springer Verlag: Secaucus, NJ, USA, 2005. [Google Scholar]
- Kihara, K.; Hirose, T.; Shinoda, K. Raman spectra, normal modes and disorder in monoclinic tridymite and its higher temperature orthorhombic modification. J. Miner. Petrol. Sci. 2005, 100, 91–103. [Google Scholar] [CrossRef]
- Schmidt, P.; Bellot-Gurlet, L.; Sciau, P. Moganite detection in silica rocks using Raman and inrared spectroscopy. Eur. J. Miner. 2013, 25, 797–805. [Google Scholar] [CrossRef]
- Ostrooumov, M. A Raman, infrared and XRD analysis of the instability in volcanic opals from Mexico. Spectrochim. Acta Part A 2007, 68, 1070–1076. [Google Scholar] [CrossRef]
- Etchepare, J.; Merian, M.; Kaplan, P. Vibrational normal modes of SiO2, II Cristobalite and tridymite. J. Chem. Phys. 1978, 68, 1531–1537. [Google Scholar] [CrossRef]
- Bates, J.B. Raman Spectra of alpha and beta cristobalite. J. Chem. Phys. 1972, 57, 4042–4047. [Google Scholar] [CrossRef]
- Ilieva, A.; Mihailova, B.; Tsintov, Z.; Petrov, O. Structural state of microcrystalline opals: A Raman spectroscopic study. Am. Miner. 2007, 92, 1325–1333. [Google Scholar] [CrossRef]
- Schmidt, P.; Bellot-Gurlet, L.; Slodczyk, A.; Froehlich, F. A hitherto unrecognised band ub the Raman spectra of silica rocks: Influence of hydroxylated Si-O bonds (silanole) on the Raman moganite band in chalcedony and flint (SiO2). Phys. Chem. Miner. 2012, 39, 455–464. [Google Scholar] [CrossRef]
- Lippincott, E.R.; Valkenbur, A.v.; Weir, C.E.; Bunting, E.N. Infrared studies of polymorphs of silicon dioxide and germaniun dioxide. J. Res. Natl. Bur. Stand. 1958, 61, 61–70. [Google Scholar] [CrossRef]
- Elzea, J.M.; Rice, S.B. TEM and X-Ray diffraction evidence for cristobalite and tridymite stacking sequences in opal. Clays Clay Miner. 1996, 44, 492–500. [Google Scholar] [CrossRef]
- Nagase, T.; Akizura, M. Texture and structure of opal-CT and opal-C in volcanic rocks. Can. J. Miner. 2007, 35, 947–958. [Google Scholar]
- Wilson, M.J. The structure of opal-CT revisited. J. Non-Cryst. Solids 2014, 405, 68–75. [Google Scholar] [CrossRef]
- Esenli, F.; Sans, B.E. XRD studies of opals (4A peak) in bentonites from Turkey: Implications for the origin of bentonites. Neues Jahrbuch für Minerologie Abhandlungen 2013, 191, 45–63. [Google Scholar] [CrossRef]
- Smallwood, A.G.; Thomas, P.S.; Ray, A.S. Comparative Analysis of Sedimentary and Volcanic Opals from Australia. J. Aust. Ceram. Soc. 2008, 44, 17–22. [Google Scholar]
- Thomas, P.S.; Ray, A. The thermophysical properties of australian opal. In Proceedings of the 9th International Congress for Appplied Mineralogy, Brisbane, Australia, 8–10 September 2008; pp. 557–565. [Google Scholar]
- Gaillou, E. An overview of gem opals: From the geology to color and microstructure. In Proceedings of the Thirteenth Annual Sinkankas Symposium—Opal, Carlsbad, CA, USA, 18 April 2015. [Google Scholar]
- Kiefert, L.; Karampelas, S. The use of the Raman spectrometer in gemmological laboratories: Review. Spectrochim. Acta Part A 2011, 80, 119–124. [Google Scholar] [CrossRef]
- Guthrie, G.D.; Bish, D.L.; Reynolds, R.C. Modeling the X-ray diffraction pattern of opal-CT. Am. Miner. 1995, 80, 869–872. [Google Scholar] [CrossRef]
- Ivanov, V.G.; Reyes, B.A.; Fritsch, E.; Faulques, E. Vibrational States in Opal Revisited. J. Phys. Chem. C 2011, 115, 11968–11975. [Google Scholar] [CrossRef]
- Eversull, L.G.; Ferrell, R.E. Disordered silica with tridymite-like structure in the Twiggs clay. Am. Miner. 2008, 93, 565–572. [Google Scholar] [CrossRef]
- Altree-Williams, A.; Pring, A.; Ngothai, Y.; Brugger, J. Textural and compositional complexities resulting from coupled dissolution–reprecipitation reactions in geomaterials. Earth-Sci. Rev. 2015, 150, 628–651. [Google Scholar] [CrossRef]
- Xia, F.; Brugger, J.; Ngothai, Y.; O’Neill, B.; Chen, G.; Pring, A. Three-dimensional ordered arrays of zeolite nanocrystals with uniform size and orientation by a pseudomorphic coupled dissolution–reprecipitation replacement route. Cryst. Growth Des. 2009, 9, 4902–4906. [Google Scholar] [CrossRef]


| Country | Location | Sample ID | Appearance | Type |
|---|---|---|---|---|
| Australia | White Cliffs, NSW | G1401 | Translucent no POC | A |
| Australia | Eurolowie, NSW | G1425 | Translucent pale brown glossy | CT |
| Australia | Iron Monarch, SA | G9620 | White glossy opaque | CT |
| Australia | White Cliffs, NSW | G8608 | White opaque POC | A |
| Australia | Unknown | G9260 | White to grey opaque | A |
| Australia | Two mile Coober Pedy, SA | G9594 | Translucent milky glossy minor POC | A |
| Australia | Four miles S of Angaston, SA | G9942 | Translucent white glossy | CT |
| Australia | Near Murwillumbah, NSW | G9964 | Slightly cloudy, clear POC | CT |
| Australia | Lightning Ridge, NSW | G13769 | Black, glassy band in matrix | A |
| Australia | White Cliffs, NSW | G13771 | Bag of samples | A |
| Australia | Angaston, SA | G24346 | Brown opaque | CT |
| Australia | Springsure, Qld | M8736 | Glassy (hyalite like) | A |
| Australia | Yinnar, Vic | T19006 | Glassy grey-brown | CT |
| Czech Rep | Valec, Bohemia | OOC11 | Glassy clear | A |
| Czech Rep | Valec, Bohemia | G32740 | Hyalite outgrowth, colourless | A |
| Ethiopia | Mezezo | G25374 | Deep-brown translucent | CT |
| Ethiopia | Afar | G32752 | Brown glass, some with POC | CT |
| Ethiopia | Mezezo | NMNH Eth1 | Pinkish POC on white | CT |
| Ethiopia | Yita Ridge, Menz-Gishe | G31892 | Nodules with clear orange centres | CT |
| Ethiopia | Mezezo | NMNH Eth 2 | Transparent brown POC | CT |
| Ethiopia | Wello | NMNH Eth 3 | Milky transparent POC | CT |
| Honduras | Unknown | G1441 | Milky transparent some POC | CT |
| Iceland | Unknown | M5081 | Opaque white | C |
| Indonesia | Cilayang Village, West Java | G34240 | Colourless with POC | CT |
| Indonesia | Mangarrai Prov, Flores | OOC6 | Translucent white | CT |
| Indonesia | Mamuju, West Sulawesi | OOC13 | Blue-green matrix of “grape agate” | A |
| Kazakhstan | Voznesenovka, Martuk | M53407 | Orange glass | CT |
| Kazakhstan | Zelinograd | G32925 | Translucent vermilion glassy | CT |
| Madagascar | Bemi, Befotaka District | G NEW05 | Clear yellow | CT |
| Madagascar | Bemi, Befotaka District | G NEW07 | Translucent pale brown | CT |
| Mexico | La Trinidad Queretaro | G31851 | Single piece with opal inclusions | CT |
| Namibia | Khorixas district | G NEW29 | Blue to white opaque | CT |
| Peru | Acari | G33912 | Massive blue | CT |
| Spain | Mazarron, Murcia | OOC4 | Composite with green zones | CT |
| Tanzania | Kigoma, Region | G NEW19 | Pale orange shades glassy | CT |
| Tanzania | Haneti | G NEW03 | Opaque green | CT |
| Tanzania | Haneti | G NEW04 | Opaque green, some glassy zones | CT |
| Tanzania | Arusha | G34238 | Transparent green layer | CT |
| Turkey | Kutahya | G NEW24 | Translucent green and brown | CT |
| Turkey | Eskisehir | G NEW25 | Opaque white with indigo speckles | CT |
| Turkey | Anatolia | G NEW26 | Opaque white transparent green inside | CT |
| Turkey | Yozgat, Anatolia | G NEW27 | Blue-green transparent glass | CT |
| Turkey | Yozgat, Anatolia | G NEW28 | Olive-green transparent glass | CT |
| USA | Opal Butte Mine, Oregon | G NEW18 | Glassy white | CT-C |
| USA | Manzano Mtns. New Mexico | G NEW30 | White opaque mass | CT |
| USA | Virgin Valley, Nevada | G31852 | Milky and translucent zones | CT |
| USA | Virgin Valley, Nevada | G32263 | Translucent brown | CT |
| USA | Virgin Valley, Nevada | M19717 | Opaque glassy POC | CT |
| USA | Virgin Valley, Nevada | OOC5 | White and POC zones | CT |
| Opal Type | XRD | Raman a | IR b (ATR) | 29Si NMR b (Single Pulse) |
|---|---|---|---|---|
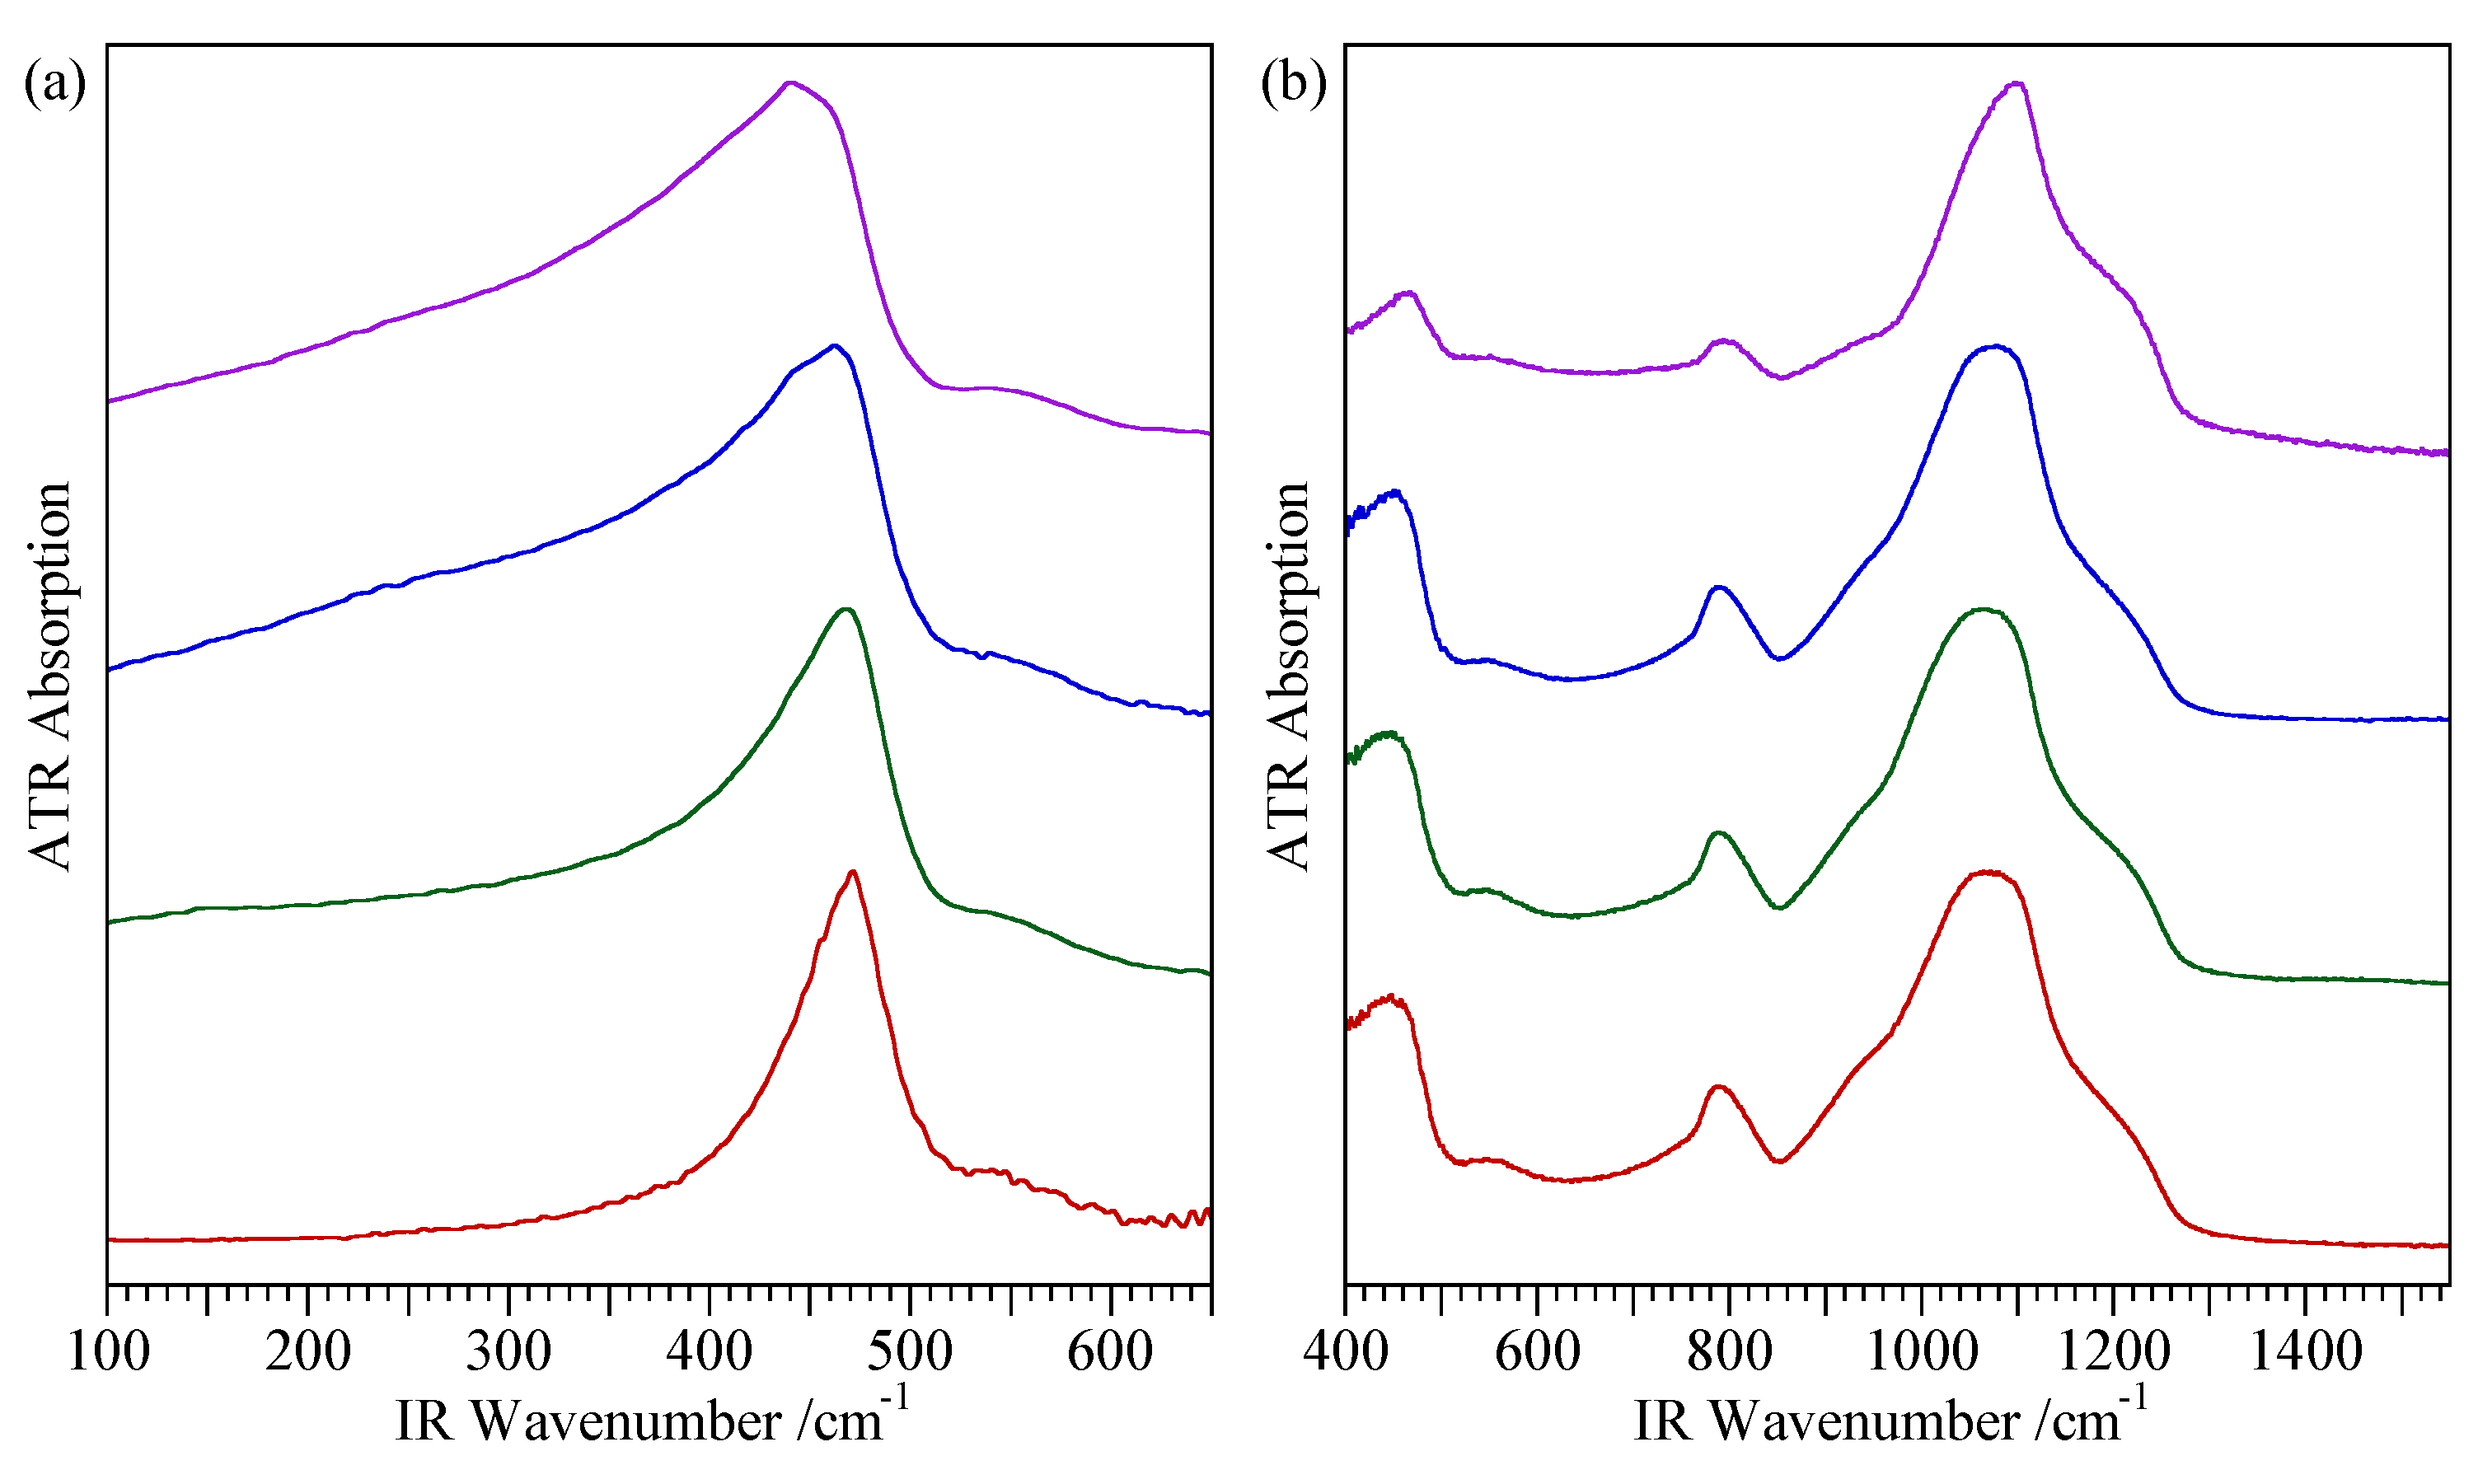
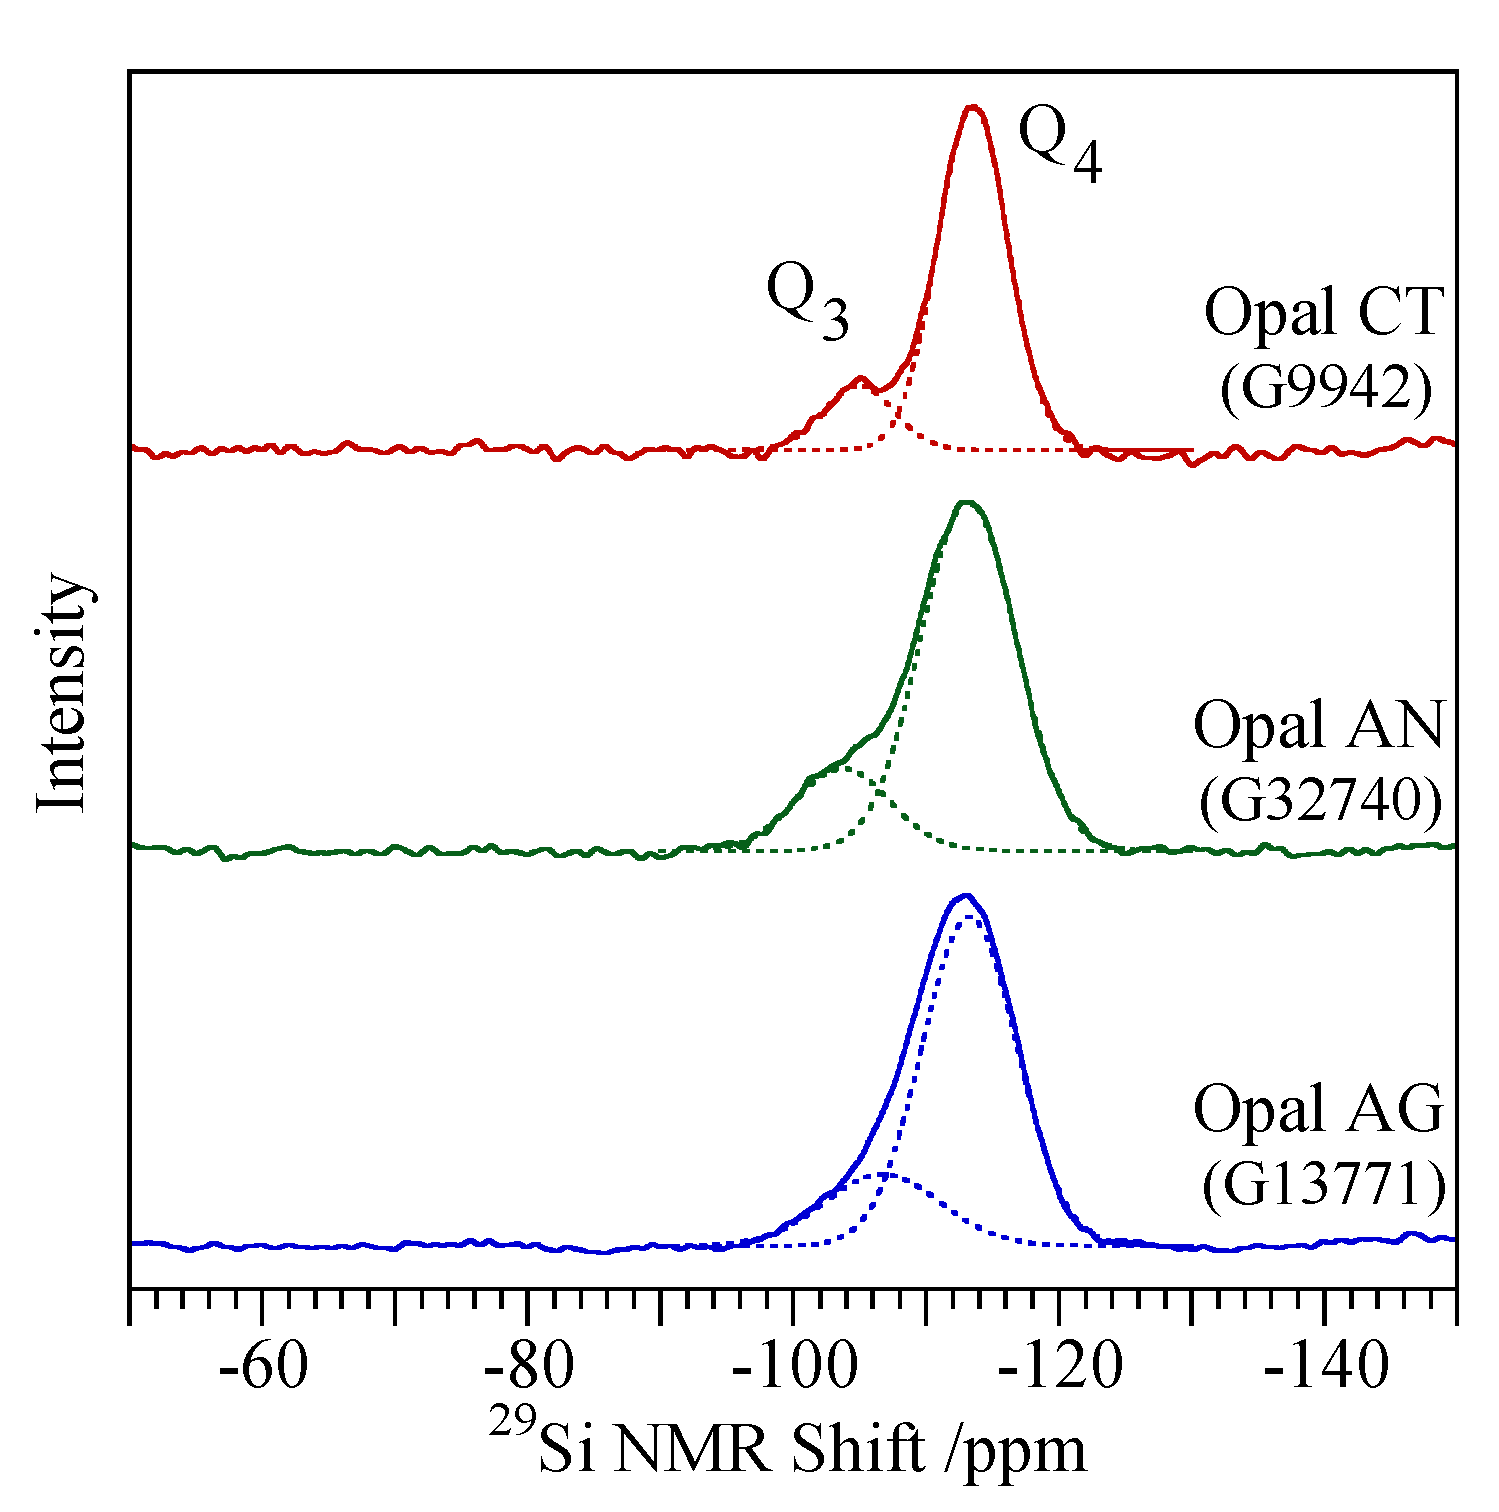
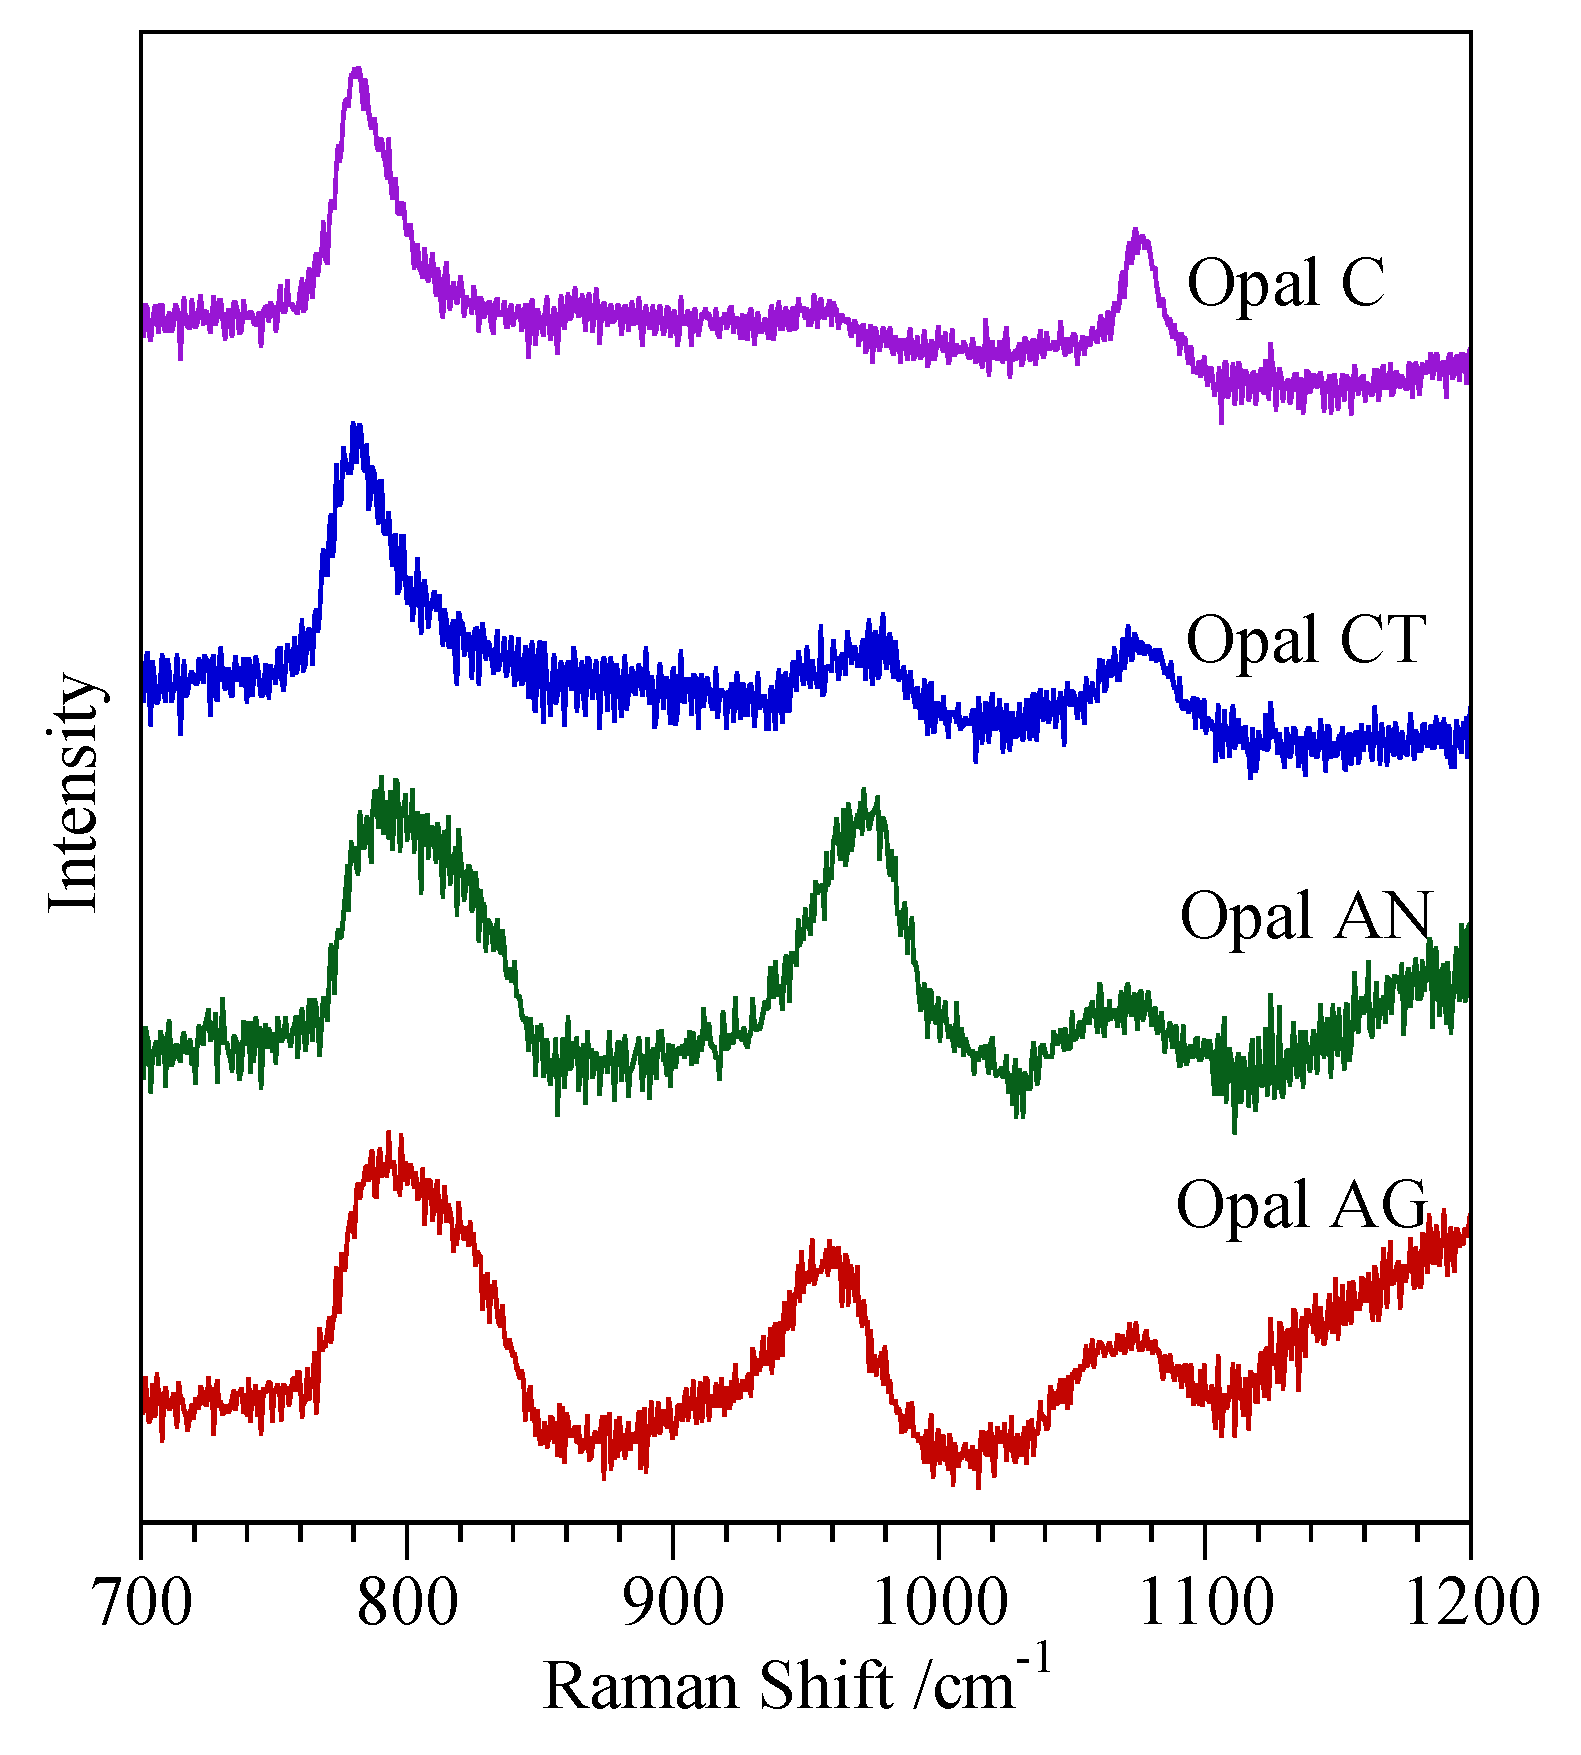
| Opal-AG | Very broad peak between ~2.2 Å and ~6.5 Å with maximum at 3.9–4.0 Å | Broad peak between ~230 and ~530 cm−1 with maximum at ~370 cm−1; 760–860 cm−1 970–975 cm−1 | Peak at 530 cm−1 | Q4 FWHM 8.5 ppm Q3 peak(s) not prominent |
| Opal-AN (hyalite) | Very broad peak between ~2.2 Å and ~6.5 Å with maximum at 3.9–4.0 Å | Broad peak between ~230 and ~530 cm−1 with maximum at ~370 cm−1 760–860 cm−1 960–965 cm−1 | Peak at 530 cm−1 | Q4 FWHM 8.3 ppm Q3 peak visible as a shoulder |
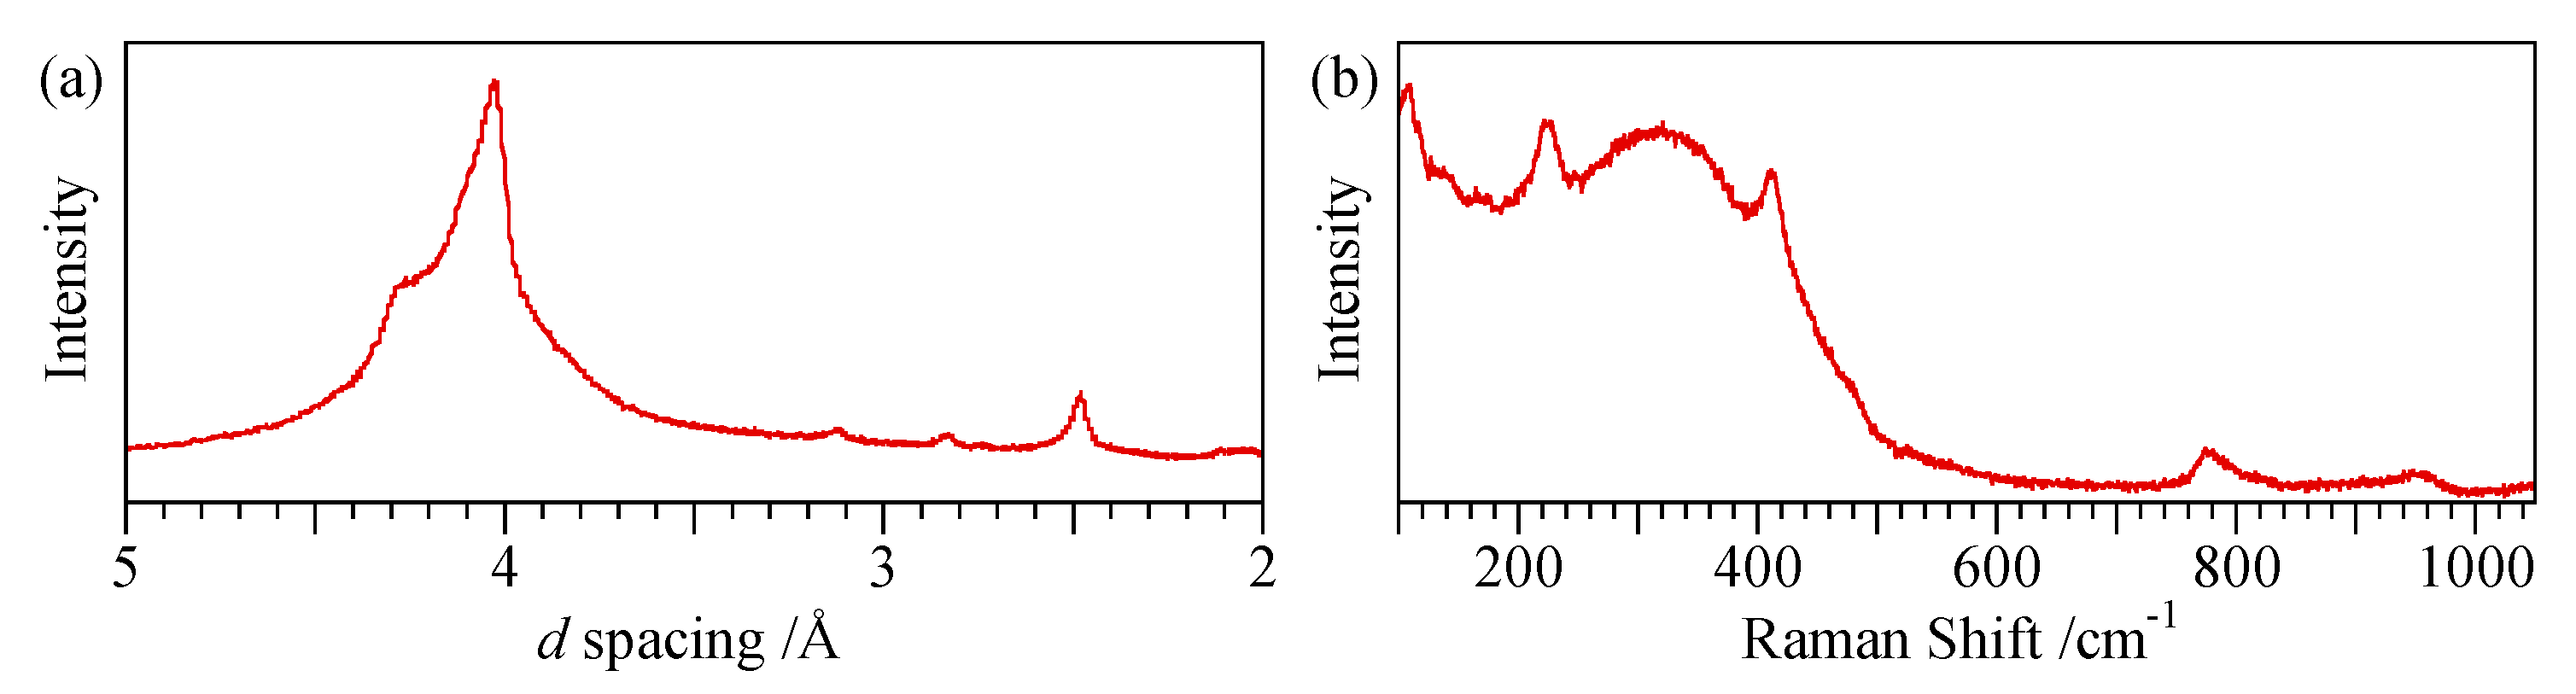
| Opal-CT c | All have peak at 2.50 Å. Simpler types have a single peak at 4.08 Å. More complex types also show a peak or shoulder at 4.28 Å and a shoulder at 3.89 Å | Broad peak between ~180 and ~500 cm−1 with maximum at ~300 cm−1 to more defined maxima at 220, 295, 340 and 410 cm−1 | Absence of peaks at 530 and 625 cm−1 | Q4 FWHM 6.5 ppm Q3 peak visible |
| Opal-C | 4.04 Å and 2.50 Å | Sharp peaks at 107, 222 and 409 cm−1 | Peaks at 300, 385, 470 and 625 cm−1 | No common feature |
© 2019 by the authors. Licensee MDPI, Basel, Switzerland. This article is an open access article distributed under the terms and conditions of the Creative Commons Attribution (CC BY) license (http://creativecommons.org/licenses/by/4.0/).
Share and Cite
Curtis, N.J.; Gascooke, J.R.; Johnston, M.R.; Pring, A. A Review of the Classification of Opal with Reference to Recent New Localities. Minerals 2019, 9, 299. https://doi.org/10.3390/min9050299
Curtis NJ, Gascooke JR, Johnston MR, Pring A. A Review of the Classification of Opal with Reference to Recent New Localities. Minerals. 2019; 9(5):299. https://doi.org/10.3390/min9050299
Chicago/Turabian StyleCurtis, Neville J., Jason R. Gascooke, Martin R. Johnston, and Allan Pring. 2019. "A Review of the Classification of Opal with Reference to Recent New Localities" Minerals 9, no. 5: 299. https://doi.org/10.3390/min9050299