Article

The Effect of the Ionic Strength of Process Water on the Interaction of Talc and CMC: Implications of Recirculated Water on Floatable Gangue Depression

Centre for Minerals Research, Department of Chemical Engineering, University of Cape Town, Private Bag, Rondebosch 7701, South Africa
*
Author to whom correspondence should be addressed.
Minerals 2019, 9(4), 231; https://doi.org/10.3390/min9040231
Submission received: 19 March 2019 / Revised: 8 April 2019 / Accepted: 9 April 2019 / Published: 15 April 2019
(This article belongs to the Special Issue Surfactants at Interfaces and Thin Liquid Films)

Abstract

:
Previous studies speculate that hydroxo species present in flotation pulps at pH > 9, particularly those of polyvalent cations, selectively adsorb onto gangue minerals. Such species supposedly enhance the depressive action of carboxymethyl cellulose (CMC) onto gangue via an acid-base interaction between the positively charged mineral surface and the negatively charged CMC molecule. Thus, the hydrophilicity of gangue minerals is enhanced, preventing the dilution of the concentrate. However, as there is little evidence to support these claims for complex process waters of increasing ionic strength, it is important to investigate. Adsorption data and mineral surface charge analyses provide a fundamental understanding of how electrolytes and their ionic strengths affect gangue mineral-depressant adsorption. It is strongly anticipated that decoupling these effects will allow process operators to tailor their process water quality needs towards best flotation operating regimes and, in the long run, effect closed water circuits. Thus, using talc as a proxy for naturally floatable gangue common in sulfidic Cu–Ni–PGM ores, this work investigates the influence of the ionic strength of process water on the adsorption of CMC onto talc for a perspective on how saline water in sulfidic ores would affect the behavior and therefore management of floatable gangue. In the presence of CMC, the microflotation results showed that the rate of talc recovery decreased with increasing ionic strength of process water. Increases in ionic strength resulted in an increase in the adsorption of CMC onto talc. Talc particles proved to have been more coagulated at higher ionic strength since the settling time decreased with increasing ionic strength. Furthermore, the zeta potential of talc particles became less negative at higher ionic strengths of process water. It is thus proposed that increases in the ionic strength of process water increased the zeta potential of talc particles, enhancing the adsorption of CMC onto talc. This in turn created a more coagulated nature on talc particles, increasing their hydrophilicity and thereby retarding floatability.

Graphical Abstract

1. Introduction

The phenomenon of gangue depression in mineral flotation is of critical importance as regards the attainment of a required concentrate grade. The depressant of choice has to have a high selectivity for the targeted gangue minerals. This would prevent gangue from reporting to the concentrate without inadvertently depressing the value bearing mineral. The chemistry of the environment regulates the manner in which gangue depression occurs. In sulfidic Cu–Ni–Pt ore flotation, polysaccharides are used to depress naturally floatable gangue which may, in the case of Merensky ores, exist as talc (the most problematic issue) [1]. Two widely used polysaccharides in the South African context are carboxymethyl cellulose (CMC) and modified guar gum. Polysaccharides depress gangue by rendering the surface hydrophilic or by preventing the formation of hydrophobic layers on the gangue mineral surface, forming large gangue aggregates and thereby increasing their heterocoagulative nature [2]. These interactions are highly dependent upon the chemistry within the pulp. It stands to reason that the underlying interaction mechanism from a talc-ion-CMC interaction be investigated so as to address the question of floatable gangue management for flotation in highly saline recirculated process waters.
The mechanism through which these polysaccharides adsorb at the mineral surface seemed unclear, in fact, a number of mechanisms had been proposed by the end of the 20th Century, and these were said to be “rarely founded on detailed experimental evidence” [3] hence the need to investigate. These mechanisms, as detailed by more recent papers, included hydrogen bonding, electrostatic interactions, hydrophobic interactions and or acid-base interactions [4,5].
Morris et al. [6] investigated CMC adsorption at the talc–water interface as a function of the ionic strength and pH of a KCl solution. Their findings showed that at low ionic strengths of KCl and more acidic pH, the adsorption density of CMC was low, whereas, at high ionic strength and high pH, the adsorption density was high. They concluded that the depression of talc had a strong dependence on the solution ionic strength and pH and that it was a reduction in the electrostatic repulsive force between the negatively charged carboxyl group and the negatively charged talc that enabled an increase in the adsorption density at high ionic strength and low pH. Pawlik et al. [7] showed that CMC in brine (50% KCl/NaCl) adsorbed very strongly and in large quantities onto minerals such as illite and dolomite compared to CMC in distilled water. At increased ionic strength, it was also reported that the CMC macromolecules coiled in solution, reduced the intrinsic viscosity and thereby increasing coagulation. Burdukova et al. [8] showed greater adsorption of CMC to talc in the presence of a 0.01 mol∙dm−3 Ca(NO3)2 solution compared with a 0.01 mol∙dm−3 KNO3 at pH 9. Furthermore, these authors also suggested that the presence of Ca2+ induced the coiling of CMC’s macromolecules. These findings complemented the work of Parolis et al. [5] who also showed that Ca2+ and Mg2+ ions increased the adsorption of CMC depressants onto talc compared to K+ ions at ionic strengths of 10−3 mol∙dm−3 and that the adsorption was even higher at increased ionic strength. Additionally, Feng et al. [9] showed that the pH of a solution is an important parameter in the adsorption of CMC onto mineral surfaces. The presence of Ca2+ and Cu2+ in solution at pH values above 9 improved the depression of gangue. In the flotation of sulfidic ores such as the Merensky type, the targeted base metal sulfides (BMS) (chalcopyrite, pentlandite, pyrrhotite, etc.) make up about 1% of the ore, the rest being gangue (floatable and non-floatable). Forty-five percent of this BMS content is mostly in the form of pyrrhotite. Floating gangue is mostly in the form of talc and exists in the raw ore feed at mass percentages of ca. 1–4%. It has been reported that there exist pyrrhotite-pentlandite-gangue composites which make the floatability of BMS—in relation to talc—a topic of interest in Cu–Ni–PGM concentrators in saline water [10].
It has been reported that a great amount of heavy metal ions such as Cu2+, Zn2+ and Pb2+ adsorb onto the highly anionic pyrrhotite [11]. This adsorption is said to occur via an attractive force between the divalent cations and the negatively charged surface of pyrrhotite. The negatively charged collector ligand then adsorbs onto the passivated pyrrhotite thereby inducing its hydrophobicity. However, Hodgson and Agar [12] reported that Ca2+, S2O32− and SO42− were found to be active on the pyrrhotite surface at the normal process pH; it was found that Ca2+ competed with xanthate for adsorption on the surface of pyrrhotite, rendering pyrrhotite less hydrophobic such that xanthate dosage had to be increased to impart the necessary hydrophobicity. This begs the question as to whether any competition exists between the anionic collector and the anionic depressant regarding their adsorption onto the pyrrhotite surface with active inorganic electrolytes. Bıçak et al. [13] reported the lowest Cu recovery per unit mass pull with waters containing high concentrations of Ca2+ and S2O32−. They ascribed this to the depressing action of inorganic electrolytes on the flotation of Cu bearing minerals. Ikumapayi et al. [14] conducted zeta potential measurements on galena in deionized water and process water containing Ca2+, SO42− and S2O32− and found that the surface charge became less negative in process water compared to deionized water. They ascribed the depression of galena to the passivation of the galena surface by hydroxyl, sulfoxy and carbonate species. They also showed that the hydrophobicity of the mineral was reduced in process water owing to the presence of inorganic electrolytes which hindered xanthate adsorption onto galena. Moreover, previous work conducted at the Centre for Minerals Research on a Merensky ore showed that the use of saline water resulted in a decrease in the rate of naturally floatable gangue and a decrease in the degree of entrainment per unit water in the presence of CMC [15]. These observations were attributed to greater adsorption of CMC onto talc in increased ionic strength as well as a resultant froth destabilization. It is, however, important to note that Corin and Wiese [15], Corin et al. [16] and Manono et al. [17] carried out their investigations on talc containing ore and therefore speculated on the behavior of floatable gangue (and therefore talc).
Given water quality variation in Cu–Ni–PGM concentrators, it is thus necessary to examine the behaviour of talc under varying ionic strengths of plant water. Although a number of studies have been conducted on CMC adsorption onto talc in single salt solutions, there is limited research on the behaviour of talc in complex process water recipes. Thus this study considers the adsorption of CMC onto talc in complex synthetic plant waters of increasing ionic strength as well as a consideration to provide experimental evidence for the heterocoagulation speculations which have been suggested in previous publications [15,17,18].

2. Materials & Methods

2.1. Materials

1 kg of talc was supplied by Ward’s Natural Science Establishment NY. This was crushed manually using a hammer to 100% passing 1000 µm sieve. The crushed sample was pulverized, and the fraction of +38–106 µm was used for all the test work.

2.2. Depressant Preparation

The polysaccharide used was CMC, Depramin 267, with a molecular weight of 325,000 g∙mol−1, a density of 1.43 g/mL, a degree of substitution of 0.62, and purity of 72%. Distilled water was used to prepare 1% by weight solutions of CMC. In order to ensure complete hydration of the CMC in solution, the 1% CMC solution was stirred for 2 h.

2.3. Synthetic Plant Water Preparation

Synthetic plant waters (SPW) were prepared based on standard plant water developed at the Centre for Minerals Research (CMR) at the University of Cape Town (UCT) to mimic actual process water [19]. These synthetic plant water types were prepared as shown in Table 1 by the addition of known masses of single salts to distilled water such that the total dissolved solids of 1SPW were 1023 mg/L (with an ionic strength (IS) of 0.0242 mol∙dm−3). Multiplying the total dissolved solids (TDS) by 5 and 10 yielded 5SPW and 10SPW.

2.4. Microflotation

Figure 1 shows a schematic diagram of the microflotation cell developed by Bradshaw et al. [20] at the CMR. When air is introduced at the base of the cell through a microsyringe, the air and particles can make contact, the loaded bubbles (bubble-particle aggregates) rise to the top of the cell, deflect off the cone at the top of the cell and report to the launder where the concentrates are collected.
Microflotation tests were performed using 3 g of talc at a size fraction of +38–106 µm. 50 mL of the particular water quality (adjusted for pH 9 using very dilute stock solutions of either NaOH and or HCl) was added to the mineral sample; the mixture was then ultra-sonicated for 5 min to allow for good dispersion of the mineral mixture. The suspension was then transferred to the microflotation cell, and the pulp was circulated by a peristaltic pump set at 90 rpm. 90 µL (300 g/t) of 1% CMC solution was then added to the cell and conditioned for 1 min. The cell was then topped up with the particular water quality to the 250 mL mark. Through a microsyringe, air was introduced at the base of the cell at a flow rate of 7 mL/min. Concentrates were then collected at 2, 6, 12 and 20 min of flotation and a tailings sample was taken after the collection of the last concentrate. The concentrates and tailings were filtered, dried and weighed. The procedure was repeated for the various water qualities, and all runs were done in duplicate to minimise experimental error.

2.5. Adsorption Studies

In order to investigate the extent to which CMC adsorbs onto talc under varying ionic strengths of process water, 90 mL of the particular synthetic plant water was measured into a conical flask. The pH of the solution was adjusted using dilute stock solutions of HCl and NaOH such that a pH of 9 was attained. 9 g of talc was added to the conical flask containing the pH adjusted synthetic plant water. This was followed by the addition of 270 µL of a 1% CMC stock solution, and thereafter the contents of the conical flask were conditioned in an Ecobath for 3 min [22]. This meant that the initial concentration of CMC in the conical flask was 30 mg∙L−1 (equivalent to 300 g/t). Immediately after conditioning, the solution (supernatant) from the conical flask was filtered using a 0.22 μm Millipore syringe filter. The determination of CMC concentration in the filtrate was made possible through the use of the du Bois calorimetric method [23]. The amount of CMC adsorbed onto the mineral surface was calculated by deducting the concentration in the supernatant from the initial 30 mg/L. The experiments were conducted in triplicate for each synthetic plant water.

2.6. Zeta Potential Tests

Synthetic plant water solutions of the water type under investigation were added into six test beakers; the pH solution was adjusted using dilute stock solutions of HCl and NaOH such that there were six test beakers, each with a pH of 2, 4, 6, 8, 10, and 12. A sample weighing 0.0625 g of talc with a particle size of −25 µm was added to each of the six test beakers. The suspension contained in a test beaker was placed on a magnetic stirrer for 15 min. The pH of the suspension was again measured and corrected as necessary. 1 mL of suspension was transferred into a Malvern Dip Cell (Malvern Instruments Ltd., Malvern, Worcestershire, UK) and inserted into a Malvern Zetasizer (Malvern Instruments Ltd., Malvern, Worcestershire, UK) for zeta potential measurements. All zeta potential measurements were performed in triplicate to ensure reproducibility and reliability of the test results. It is important to note that pH was adjusted just before zeta potential measuring so as to avoid any unnecessary time-dependent reactions with the ions that would blind the comparability of the results from one pH to another.

2.7. Flocculation Tests

It has been speculated in the literature that the presence of inorganic electrolytes and CMC in flotation imparts a heterocoagulative nature on floatable gangue [8,15,24]. This speculation is largely supported by the observation of large talc-CMC coils/aggregates [8] and decreases in the rate of floatable gangue recovery per unit water with increasing ionic strength of plant water [17,18]. Thus, classical flocculation-coagulation tests in the form of settling tests were performed. Talc in the absence and presence of CMC under varying ionic strengths was tested. Each test was duplicated to minimize error. 9 g of talc was added to 90 mL of the particular synthetic plant water in a 100 mL beaker to make a slurry containing 10% solids. The prepared slurry was allowed to mix for a period of 1 min using a magnetic stirrer and, thereafter, the pH of the slurry was adjusted to 9 using NaOH or HCl. Immediately after adjusting the pH, the suspension was mixed at 300 rpm for 3 min both in the absence and presence of CMC. A 90 µL solution of CMC was added to the 100 mL beaker for tests containing CMC. The conditioning time of 3 min was chosen as this is typical of the standard UCT batch and microflotation procedure. After mixing, the slurry was carefully transferred to a 100 mL graduated cylinder. A stop watch was used to measure the time that it would take for solid talc particles to settle. The contents of the measuring cylinder were carefully monitored until a clear supernatant liquid was observed against a clear background after which timing was stopped and the settling time recorded. A baseline picture was taken, printed and displayed next to the test rig to serve as a reference point for all settling tests.

3. Results

3.1. The Microflotation Response of Talc to Process Water Ionic Strength and CMC Dosages

Figure 2 shows the total recovery of talc for various ionic strengths of SPW in the absence (0 CMC g/t) and presence of CMC (300 CMC g/t). In the absence of CMC, the recovery of talc increased with increasing ionic strength of SPW. However, upon the addition of CMC at a dosage of 300 g/t, talc recovery decreased with increasing ionic strength.
Figure 3 shows the flotation recoveries for talc under varying ionic strength conditions in the absence of CMC as a function of time. Figure 3 shows that the recovery of talc and its flotation rate increased with increasing ionic strength.
Figure 4 shows the flotation recoveries for talc under varying ionic strength conditions in the presence of CMC against time. Figure 4 shows that the recovery of talc had an apparent decreased slightly with increasing ionic strength of SPW. Also, the rate of talc flotation showed a slight decrease with increasing ionic strength of process water.

3.2. Investigating the Adsorption of CMC onto Talc with Increased Ionic Strength of SPW

Figure 5 shows the concentration of CMC that was adsorbed onto talc as well as the concentration of CMC remaining in the supernatant from an initial CMC dosage of 30 mg/L. From Figure 5, it is evident that there was an increase in the absorption of CMC onto talc with increasing ionic strength of process water; hence the decrease in the concentration of CMC in the supernatant.

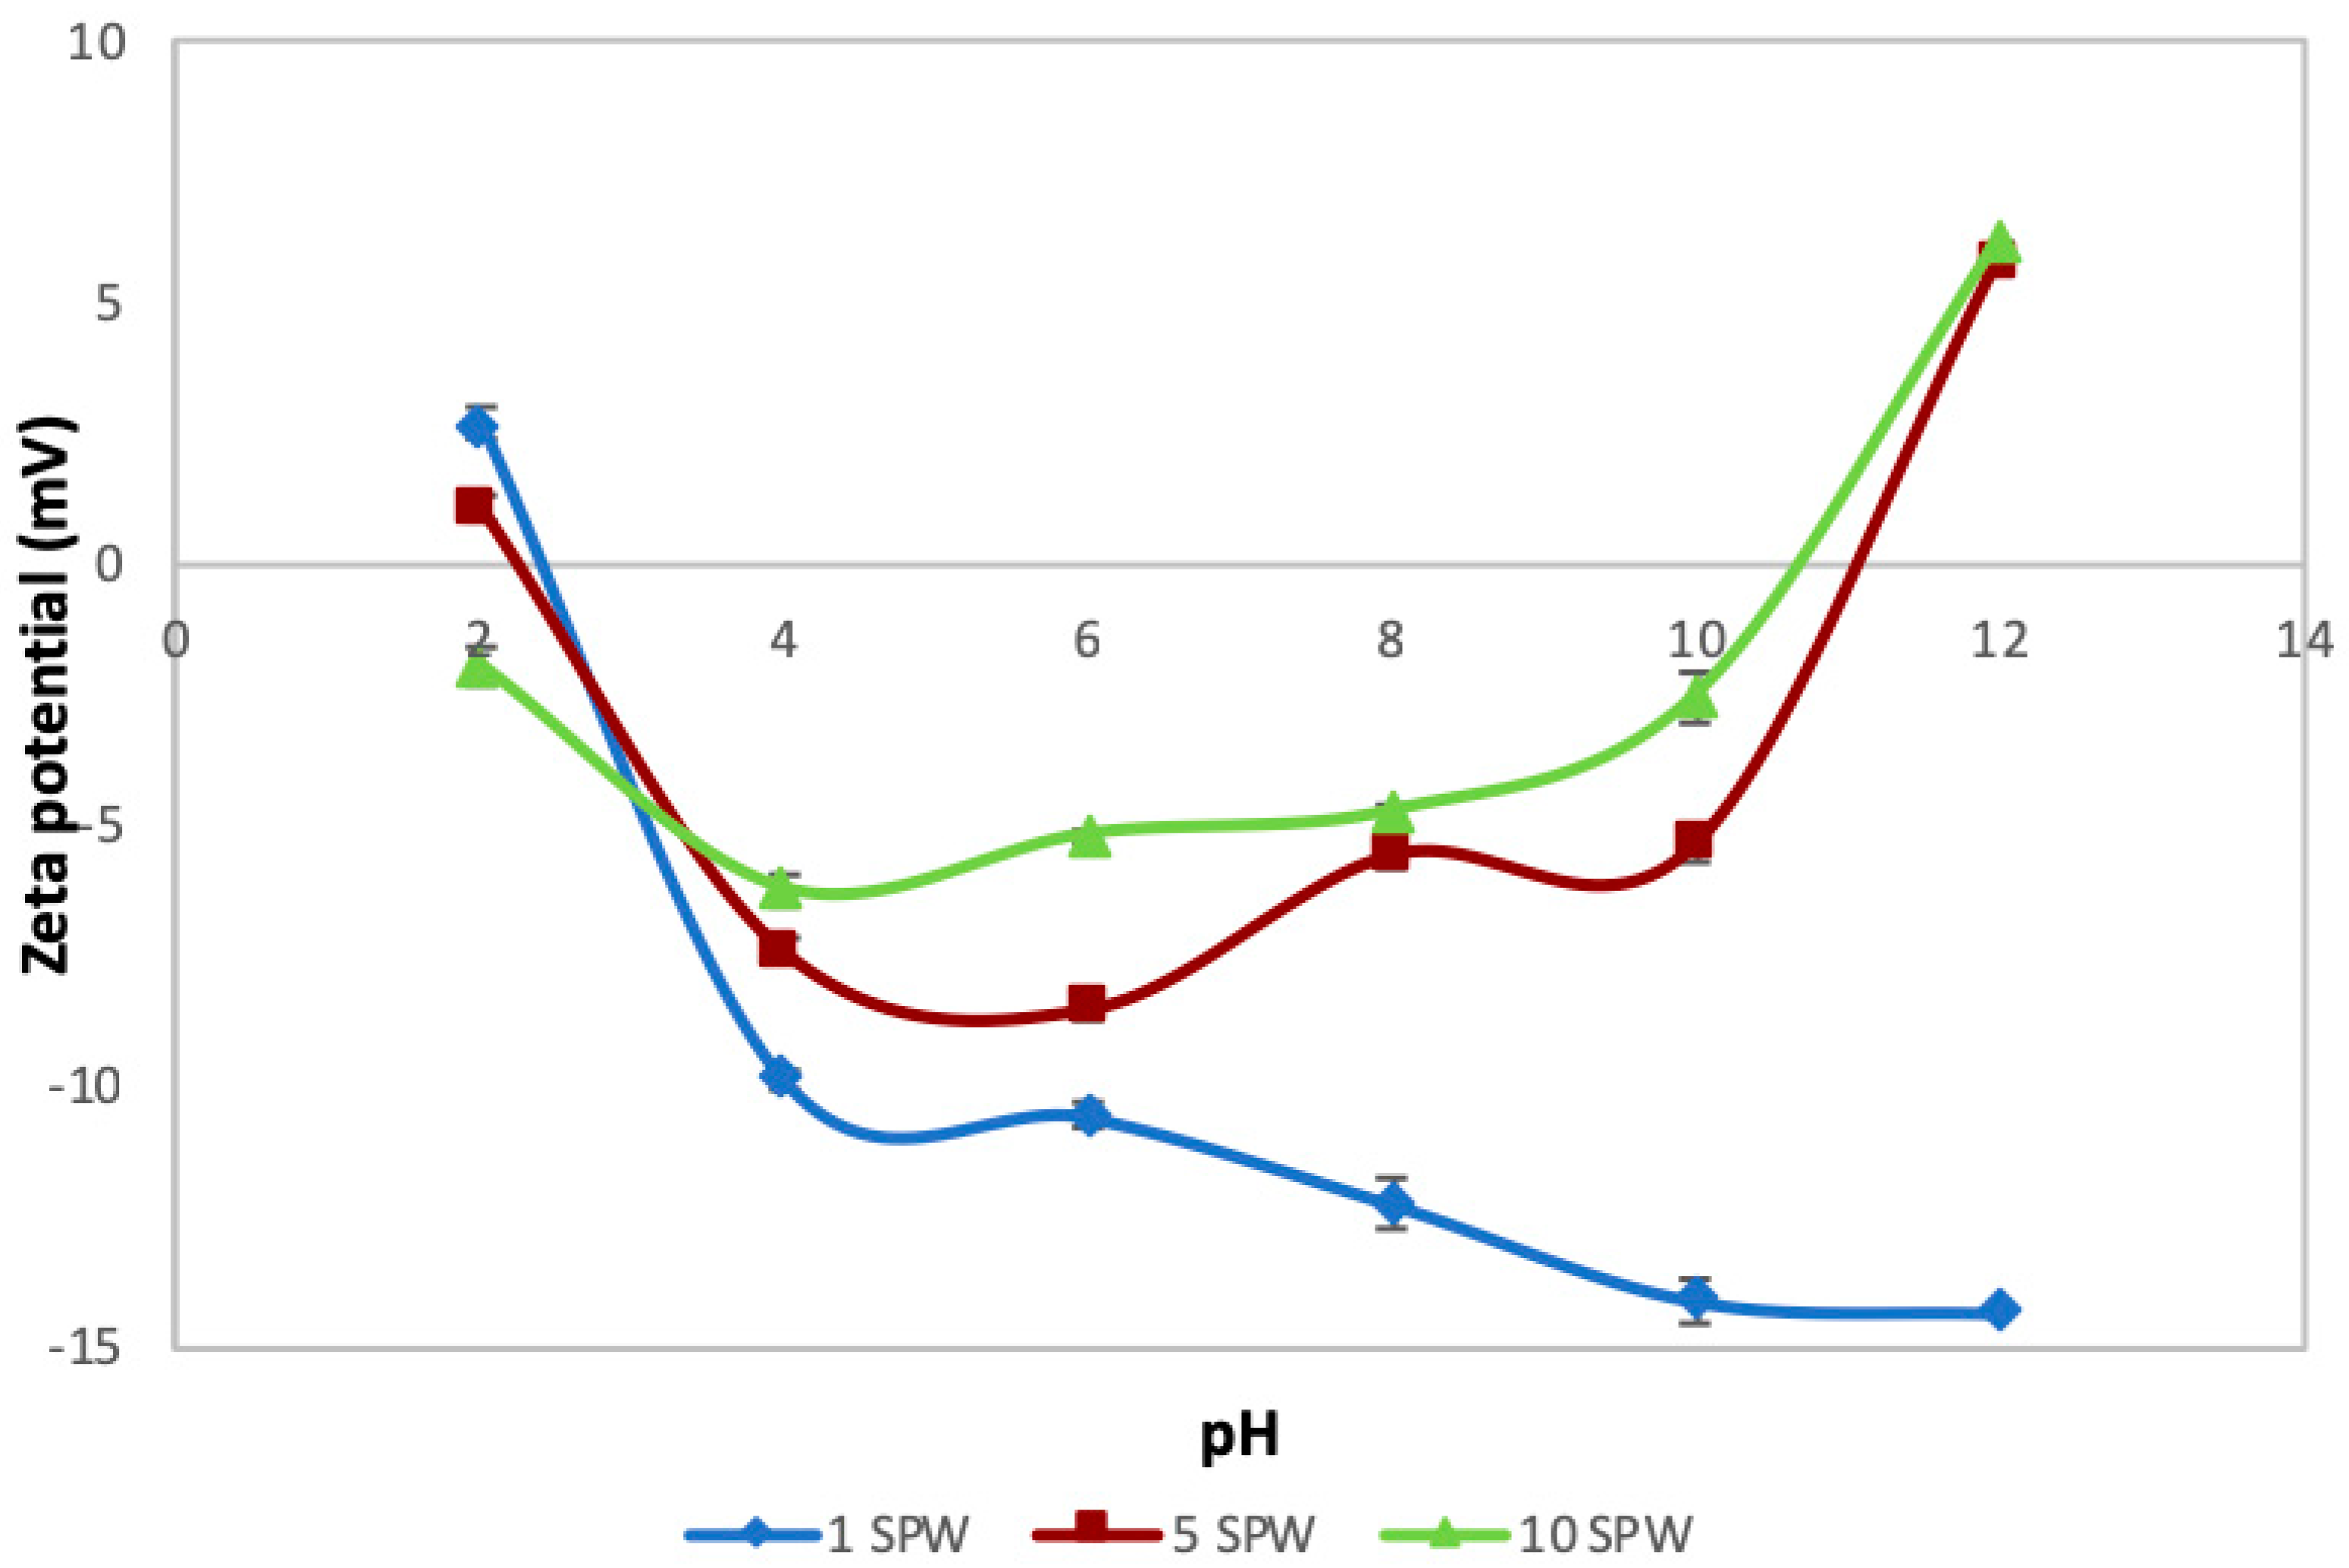
3.3. Effect of Ionic Strength and pH on the Zeta Potential of Talc Particles

Figure 6 shows the zeta potential of talc over pH 2–12 under varying ionic strength in the absence of CMC. It is clear that the zeta potential of talc became less negative across the studied pH range with increasing ionic strength of plant water. At about pH 11 and above, the zeta potential became completely positive. It is interesting to note that 1SPW yielded a different trend compared to both 5SPW and 10SPW in that the zeta potential became more negative as the pH of the suspension increased.

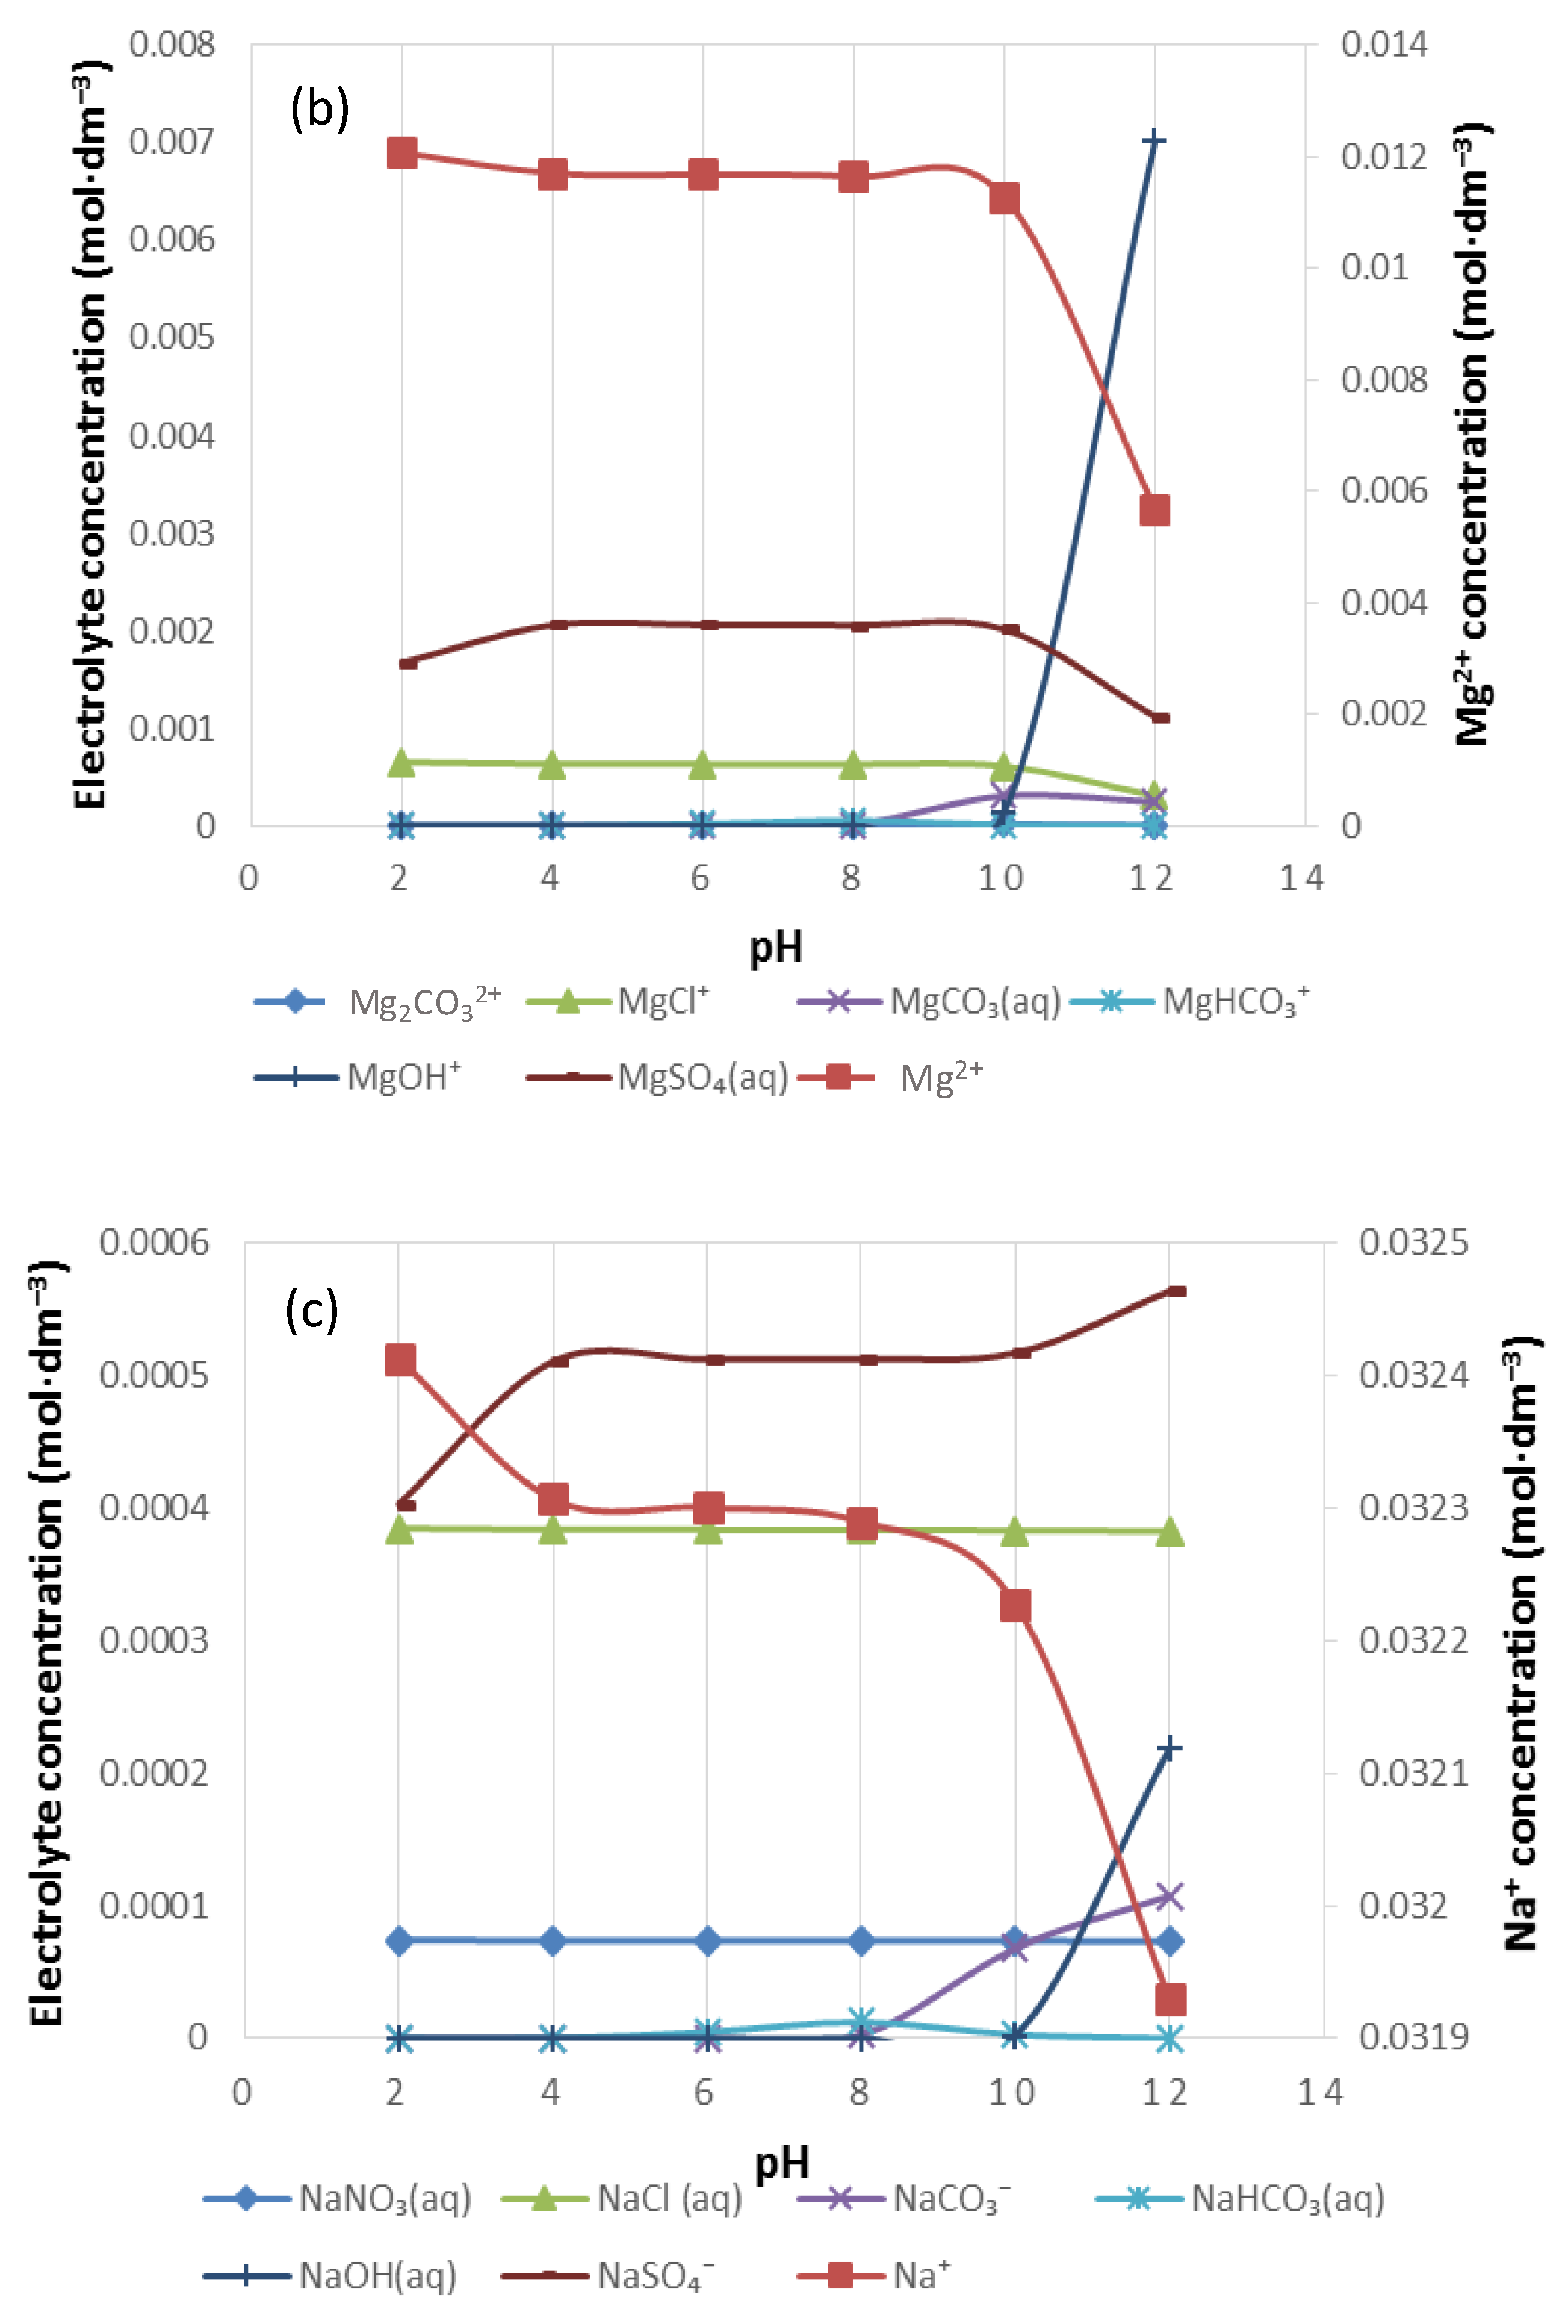
3.4. Effect of Ionic Strength and pH on the Inorganic Electrolyte Speciation

Figure 7, Figure 8, Figure 9, Figure 10, Figure 11 and Figure 12 are speciation diagrams of anions in H+, calcium, magnesium and sodium ions in plant water of 0.0242 mol∙dm−3 (1SPW), 0.1212 mol∙dm−3 (5SPW) and 0.2426 mol∙dm−3 (10SPW) ionic strengths. These were generated using Visual MinteQ software (3.1, Jon Petter Gustafsson, KTH, Stockholm, Sweden). Figure 7 and Figure 8 illustrate the speciation of 1SPW from pH 2 to pH 10, these are split into anion and specific cation speciation diagrams for the purpose of a better illustration of the speciation changes occurring in 1SPW as pH varies. The logic is applied over those speciation diagrams for 5SPW in Figure 9 and Figure 10, and for 10SPW in Figure 11 and Figure 12.
Figure 7 demonstrates the distribution of Cl, CO32−, NO3 and SO42− to H+ in 1SPW for a pH range of 2–12. It can be seen that the concentration of Cl and NO3 remained fairly constant across the given pH range and were not distributed to any H+ ions. However, CO32− and SO42− were distributed to H+ ions such that H2CO3(aq), HCO3 and HSO4 formed. It is also interesting to note that H2CO3 and HSO4 are seen at pH 2–4, whereas HCO3 appears at pH 6–9. Worth mentioning is the fact that at pH > 10, [OH] rises whereas with [H+] increases ions as the pH of 1SPW drops below pH 4.
Figure 8 shows the distribution of Ca2+, Mg2+ and Na+ in 1SPW for a pH range of 2–12. It can be seen that the divalent cations are present in solution at higher concentrations than the monovalent Na+ (i.e., [Mg2+] > [Ca2+] > [Na+]). The concentration of CaSO4(aq), MgSO4(aq) and NaSO4(aq) in each individual cation species distribution seems to be higher than all other inorganic complex species as seen in Figure 8a–c respectively. These are followed by an evident presence of CaCl+, MgCl+ and NaCl. An increase in the concentration of CaCO3(aq), MgCO3(aq) and NaCO3 beyond pH 8 can also be observed.
Figure 9 illustrates the distribution of Cl, CO32, NO3 and SO42 to H+ in 5SPW for a pH range of 2–12. It can be seen that Cl and NO3 were not distributed to any H+ ions in solution. However, CO32− and SO42− were distributed to H+ ions and formed species such as H2CO3(aq), HCO3 and HSO4 as [H+] decreased evidently with an increase in pH between pH 2–4. Between pH 2–8, there was an apparent presence of H2CO3(aq), though decreasing with an increase in pH until pH 8. HSO4 as the pH increases beyond pH 2. There was an evident increase in the [HCO3] from pH 4 to pH 8 and thereafter the concentration of HCO3 decreased. Also, beyond pH 10, there was a significant increase in [OH].
Figure 10 shows the distribution of Ca2+, Mg2+ and Na+ in 5SPW for a pH range of 2–12. As the pH increases from pH 2, [Mg2+], [Ca2+] and [Na+] decrease and thus other species form. In Figure 10a it can be seen that the concentrations of CaCl+ and CaNO3+ remained the same despite increases in pH. At pH > 2, the presence of CaSO4(aq) supersedes any other Ca2+ bearing species in solution. At pH > 2 there is an increase in [CaHCO3+] and decreases again at pH > 10. At pH > 8, there is an increase in [CaCO3(aq)] whilst [CaOH+] rises at pH > 10. In Figure 10b a strong presence of MgCl+ and MgSO4(aq) is seen, though not higher than Mg2+. MgSO4(aq) decreases at pH > 10. Evident increase in the concentration of MgCO3(aq) is seen at pH > 8. Furthermore, a significant increase in [MgOH+] occurs at pH > 10. Figure 10c shows the speciation of Na+ in 5SPW; there is an increase in the concentration of NaSO4(aq) beyond any other Na+ species above pH 3. An increase in the concentration of NaHCO3(aq) is seen at pH > 6 which then drops at pH > 8. [NaCO3] increases as pH increases from pH 8 whilst [NaOH(aq)] increases as the pH of 5SPW increases from pH 10.
Figure 11 depicts the distribution of Cl, CO32, NO3 and SO42 to H+ in 10SPW for a pH range of 2–12. It can be seen that all the anions that were added from the 10SPW single salts recipe were distributed to H+ ions in solution except Cl and NO3. Between pH 2–4 a decrease in the concentrations of HSO4 to an apparent minimum is seen as the concentration of H+ ions decreases with an increase in pH whereas the concentrations H2CO3(aq) becomes an apparent minimum at about pH 8. A rise in the concentration of HCO3 is seen from pH 4 until it reaches a maximum at pH 8 and drops again to a negligible value after pH 10. There is an apparent rise in the concentrations of CO32− and OH as the pH of 10SPW increases beyond pH 10.
Figure 12 shows the distribution of Ca2+, Mg2+ and Na+ in 10SPW for a pH range of 2–12. As the pH increases from pH 2, [Mg2+], [Ca2+] and [Na+] decrease and thus other species form. It can be seen that in Figure 12a,b there is a strong presence of CaSO4(aq) and MgSO4(aq) in solution. A similar observation can be made from Figure 12c with regard to NaSO4, although this anionic species shows to have the highest concentration at pH 7 in Na distribution. Also, at pH > 7 CaCO3(aq), MgCO3(aq) and NaCO3 showed an apparent increase in concentration whereas CaHCO3+, MgHCO3+ and NaHCO3(aq) were seemingly significant at 4 < pH < 12.

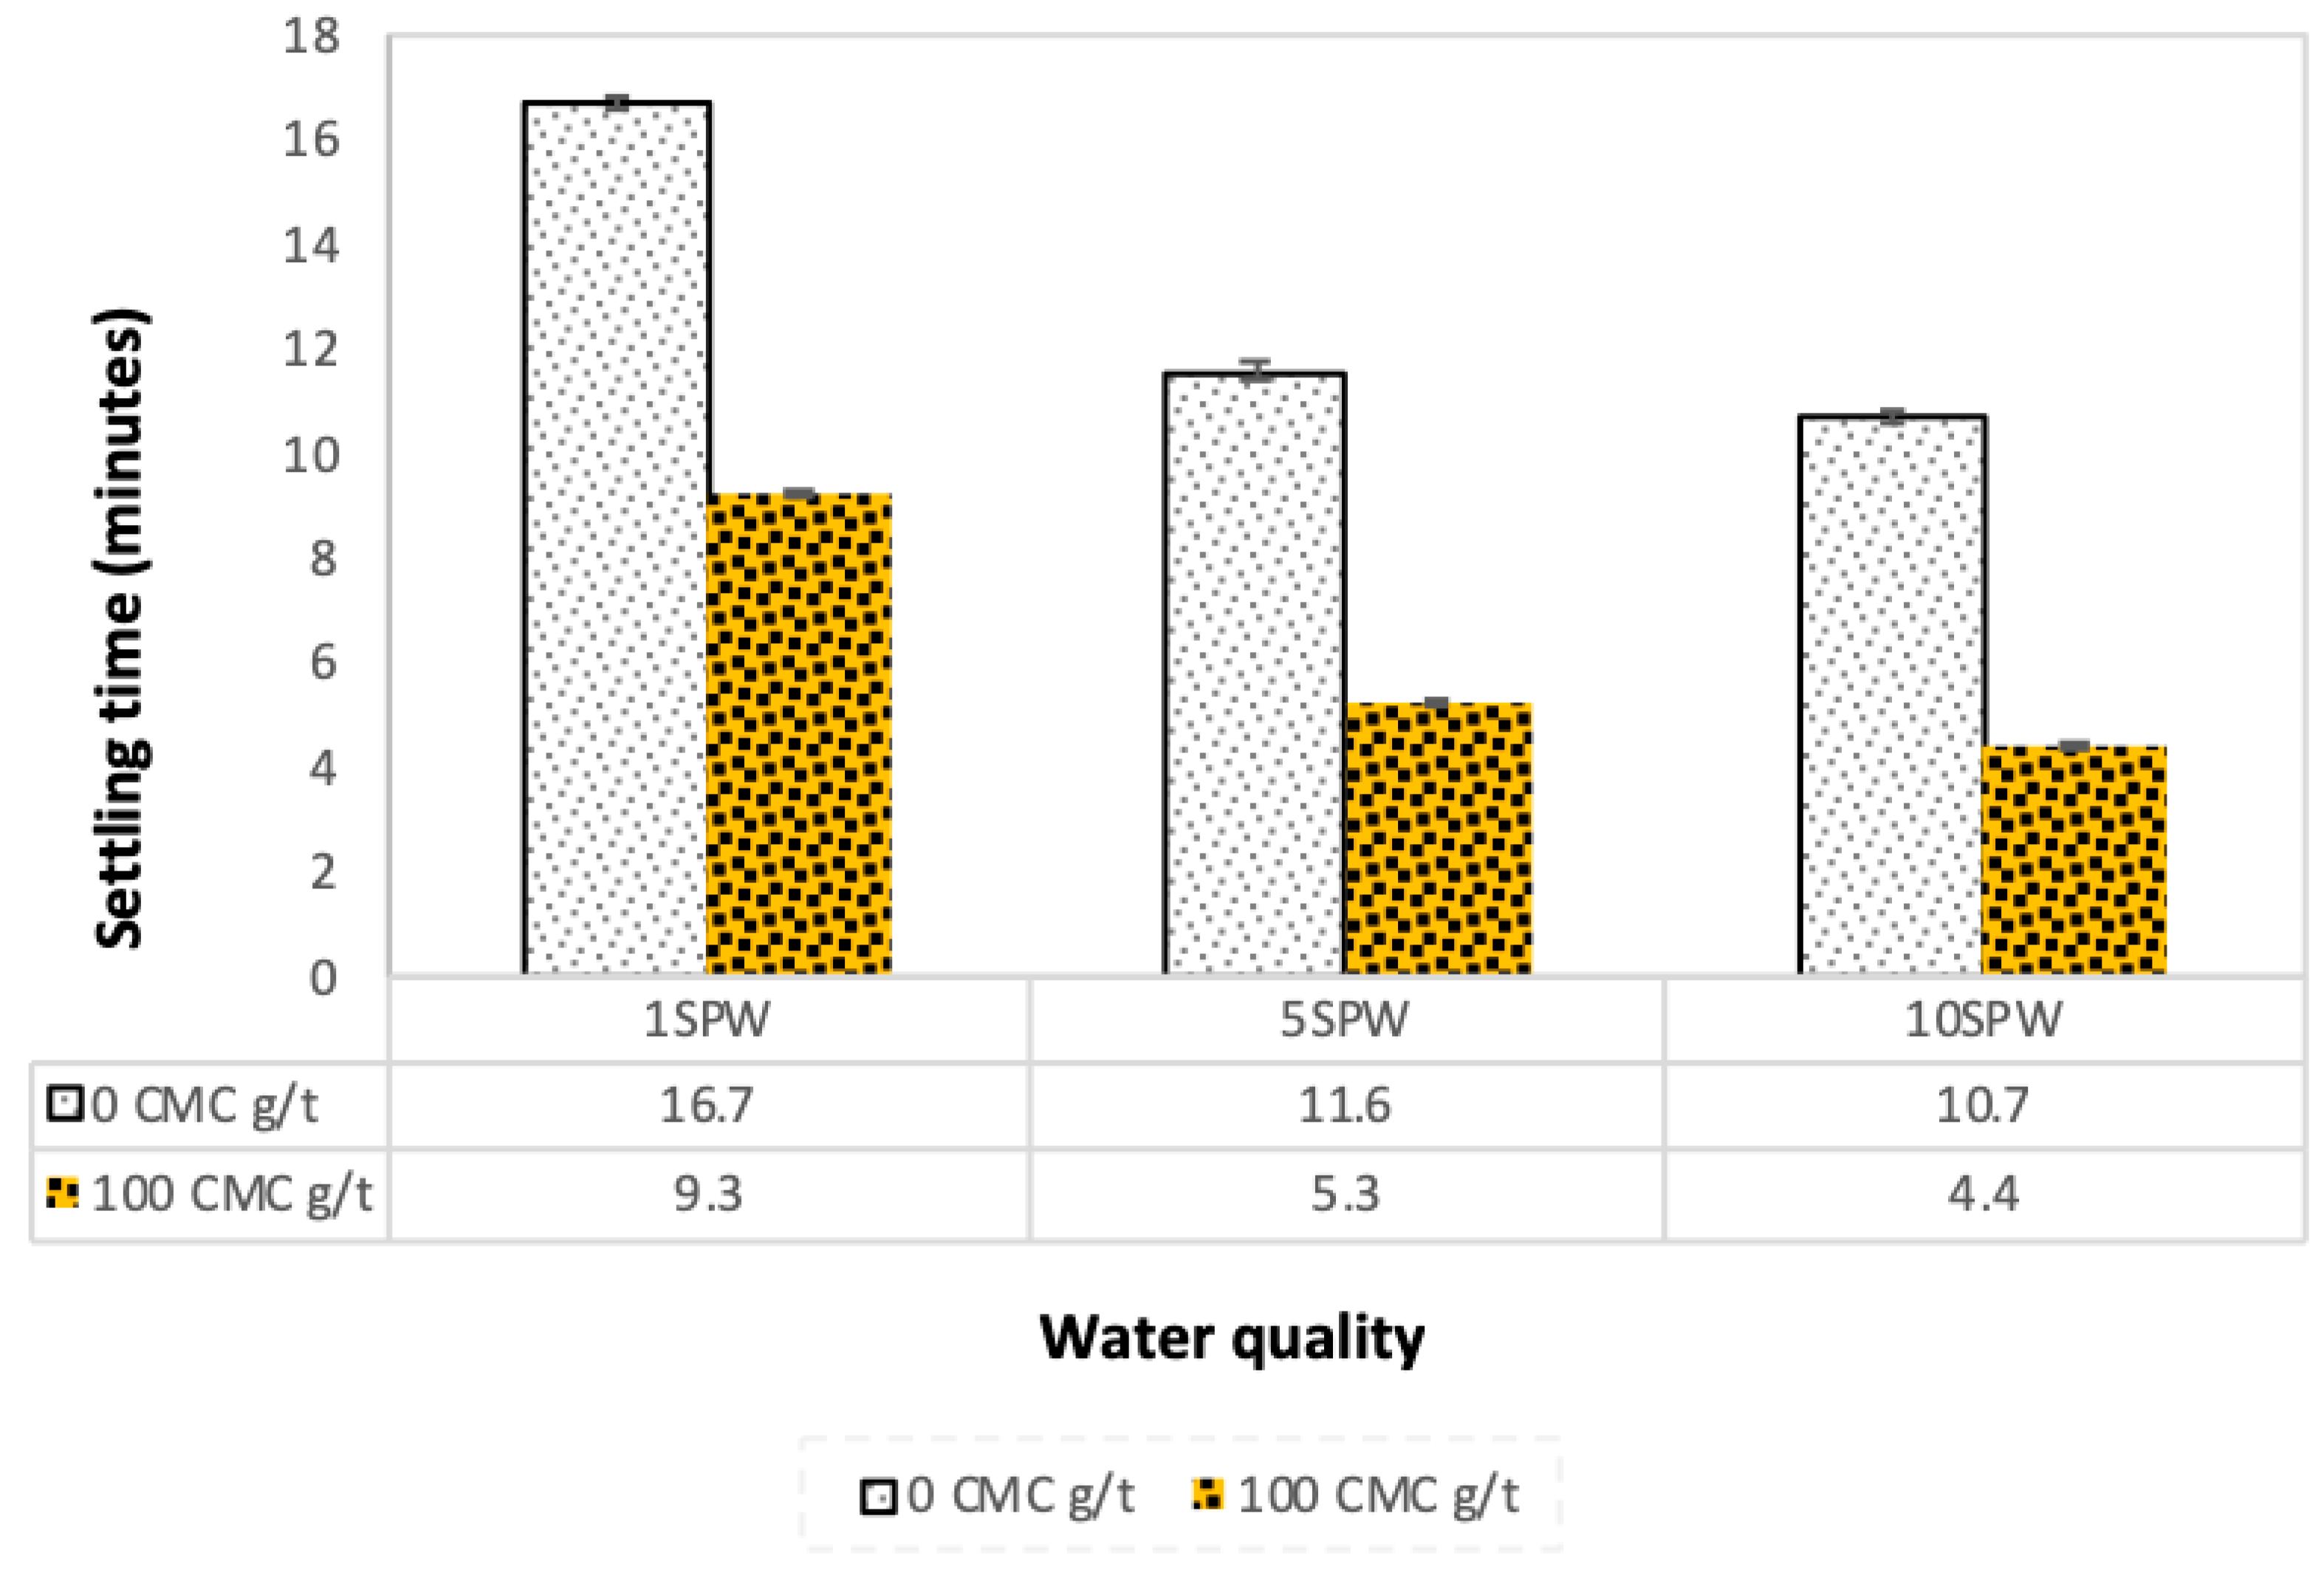
3.5. Effect of Ionic Strength on the Settling Time of Talc Particles

The settling time of talc particles in the presence and absence of CMC at varying ionic strength of SPW is shown in Figure 13. Talc particles settled faster as the ionic strength of plant water increased. However, the settling of talc particles was even quicker in the presence of CMC, indicating that both ionic strength and the addition of CMC enhanced the coagulation of talc particles independently.

4. Discussion

The results presented in Figure 3 showed that in increasing ionic strengths of synthetic plant water, the recovery of talc and the rate of flotation increased in the absence of CMC. However, an opposite trend was observed when CMC was added at 300 g/t in that there was a slight decrease in the rate of flotation of talc with increasing ionic strength. Furthermore, comparing Figure 3 to Figure 4, it is clear that the addition of CMC decreased the total recovery of talc. The trend of an increase in the recovery of talc with increasing ionic strength in the absence of CMC could be linked to an enhancement in the bubble-particle attachment which increased bubble loading [25]. It has been reported that inorganic electrolytes compress the electrical double layer; this is potentially a result of cations surrounding the thin liquid film around the bubble, ensuring a decrease in any repulsive forces that may exist in the system [26,27,28]. This, in turn, would enhance the electrostatic interactions between the negatively charged talc and the cations (such as Ca2+ and Mg2+) on the surface of the bubble film, thereby increasing bubble particle collisions [25]. Also, electrolytes are reported to cause bubble size reductions similar to that of frothers [29,30,31]. These increases in ionic strength must have led to an increase in the total bubble surface area to which bubble-particle attachment occurred, and thus, in this way, led to increases in talc recovery and its rate of flotation. Thus it is proposed that, in the absence of CMC, an increase in the ionic strength of SPW decreased the bubble diameter, which in turn resulted in an increase in the electrostatic interactions between the cations on the surface of the bubble and the negatively charged talc surface. This postulation is supported by Figure 14 from an investigation carried by Manono et al. [32] which considered the effect of increasing the ionic strength of synthetic plant water on the bubble size, showing that there was a decrease in bubble size with increasing ionic strength.
The trend of a decrease in the rate of talc recovery with increasing ionic strength of SPW can be explained by Corin and Wiese [15] who showed a clear decrease in the rate of floatable gangue recovery with increasing ionic strength. Corin and Wiese [15] speculated that increases in ionic strength might have increased the adsorption of CMC onto floatable gangue and thereby inducing the coagulation of floatable gangue particles. It can therefore be said that the microflotation results of this work are a piece of experimental evidence to that speculation, as the rate of talc recovery decreased as the particles became more passivated, allowing for a more conducive environment for CMC adsorption, and thus impeding their flotation.
The trend of an increase in the absorption of CMC onto talc with increasing ionic strength of plant water seen in Figure 5 is in agreement with the microflotation results shown in Figure 4; there was a decrease in recoveries in the presence of CMC with increasing ionic strength. Therefore, it stands to reason that increases in ionic strength of plant water in the presence of CMC may lead to an enhanced depression of talc in flotation. This action of inorganic electrolytes on talc-CMC interactions may counter the action of inorganic electrolytes on bubble coalescence. This behavior was also observed in a study involving an actual ore containing Cu–Ni–PGM and non-sulfide gangue by Manono et al. [18]. This action which results from an electrolyte-talc-CMC interaction is ascribed to the action of inorganic electrolytes such as CaOH+, which passivate the mineral surface and thereby reduce its hydrophobicity—as previously reported in previous studies where single salt solutions were investigated [8,24]. On this basis, the zeta potential of talc was investigated in synthetic plant waters of increasing ionic strength with the results shown in Figure 6. This sudden increase in the zeta potential of talc in increasing ionic strength of SPW is attributed to the presence of oxyhydroxyl species on the surface of the mineral. The findings of this work further support the theory of an induced acid-base interaction between the passivated mineral surface and the highly negatively charged CMC as a mechanism through which CMC adsorption onto minerals such as talc occurs in flotation pulps [24]. The speciation diagrams presented in Figure 7, Figure 8, Figure 9, Figure 10, Figure 11 and Figure 12 are in agreement with the zeta potential results in that at pH > 9 oxyhydroxyl species are seen. Figure 7, Figure 8, Figure 9, Figure 10, Figure 11 and Figure 12 illustrate that at higher pH values of the pulp compared to pH 9 where the flotation of sulfides occurs, the concentration of Ca2+, Mg2+ and Na+ decreases whilst the concentration of their respective hydroxides and carbonates increases. This trend is particularly stronger in the divalent Ca2+ and Mg2+ speciation compared to the monovalent Na+. Furthermore, it can be seen that the increase in ionic strength from 0.0242 to 0.2426 mol∙dm−3 increases the concentration of the oxyhydroxyl species which may be responsible for the increase in the zeta potential of talc in increasing ionic strength of SPW.
Therefore it stands to reason that the effect of these oxyhydroxyl species in 10SPW would have a stronger effect on the interactions occurring in the pulp phase of flotation. The species present at the various pH and ionic strength values correlate well with the zeta potential results, in that the mineral surface is more passivated at pH 9 and above, showing the effect of the oxyhydroxyl species—and their increased concentrations—on the mineral surface charge. Thus the zeta potential trend of the minerals is ascribed to these oxyhydroxyl species which may render the mineral hydrophilic and coagulative as seen in the adsorption of talc, and its results in floatability and settling time.

5. Conclusions

The microflotation results, for a system containing CMC, indicated a decrease in the recovery of talc with increasing ionic strength. The adsorption results agreed with these findings in that more CMC was adsorbed onto the mineral surface as the ionic strength of SPW increased. Also, the settling time decreased with increasing ionic strength—with an even further decrease upon the addition of CMC, resulting in the fastest settling time in the water with the highest concentration of inorganic electrolytes (10SPW).
It is proposed, from the findings of this investigation, that increases in ionic strength of process water enhance the adsorption of CMC onto naturally floatable gangue, imparting a coagulative nature onto the gangue mineral particles and thereby inhibiting their flotation.
The zeta potential observations clearly showed that electrolytes present in process water, as seen in the speciation diagrams, act to passivate the mineral surface. Through the proposed acid-base interaction between the mineral surface—passivated by oxyhydroxyl species—and the negatively charged CMC ligand, CMC adsorbs preferentially onto the mineral surface. This may have resulted in the formation of large talc-CMC flocs which have enhanced coagulative and hydrophilic natures. This, in turn, results in the depression of talc and therefore floatable gangue.

Author Contributions

M.M. conceptualised the work, conducted the experiments, analysed the experimental data, wrote the manuscript whilst K.C. and J.W. assisted with conceptualisation, advised on the experimental test work, proofread and edited the manuscript.

Funding

This work was supported in part by the National Research Foundation (NRF) of South Africa (SA) (Grant numbers 99262, 103641, and 118062). Any opinions, findings, conclusions or recommendations expressed in any publication generated by NRF supported research is that of the authors, and the NRF accepts no liability whatsoever in this regard. This work has also been part of the South African Minerals to Metals Research Institute (SAMMRI) Project No. S1612 funded by the Department of Science and Technology, SA.

Acknowledgments

Financial and technical support from the members of the UCT CMR’s Reagent Research Group is also acknowledged.

Conflicts of Interest

The authors declare no conflict of interest.

References

  1. O’Connor, C.; Wiese, J.; Corin, K.; McFadzean, B. On the Management of Gangue Minerals in the Flotation of Platinum Group Minerals. Min. Metall. Explor. 2019, 36, 55–62. [Google Scholar] [CrossRef]
  2. Shortridge, P.G.; Harris, P.J.; Bradshaw, D.J. The influence of ions on the effectiveness of polysaccharide depressants in the flotation of talc. In Polymers in Mineral Processing, Proceedings of the 3rd UBC-McGill Bi-Annual International Symposium on Fundamentals of Mineral Processing, Quebec City, QC, Canada, 22–26 August 1999; Laskowski, J.S., Ed.; CIM: Quebec City, QC, Canada, 1999; pp. 155–169. [Google Scholar]
  3. Pugh, R.J. Macromolecular organic depressants in suiphide flotation—A review, 2. Theoretical analysis of the forces involved in the depressant action. Int. J. Miner. Process. 1989, 25, 131–146. [Google Scholar] [CrossRef]
  4. Jenkins, P.; Ralston, J. Adsorption of a polysaccharide at the talc-aqueous solution interface. Colloids Surf. A Physicochem. Eng. Asp. 1998, 139, 27–40. [Google Scholar] [CrossRef]
  5. Parolis, L.A.S.; van der Merwe, R.; Groenmeyer, G.V.; Harris, P.J. The influence of metal cations on the behaviour of carboxymethyl celluloses as talc depressants. Colloids Surf. A Physicochem. Eng. Asp. 2008, 317, 109–115. [Google Scholar] [CrossRef]
  6. Morris, G.E.; Fornasiero, D.; Ralston, J. Polymer depressants at the talc-water interface: Adsorption isotherm, microflotation and electrokinetic studies. Int. J. Miner. Process. 2002, 67, 211–227. [Google Scholar] [CrossRef]
  7. Pawlik, M.; Laskowski, J.S.; Ansari, A. Effect of carboxymethylcellulose and ionic strength on the stability of mineral suspensions in a potash ore flotation system. J. Colloid Interface Sci. 2003, 260, 251–258. [Google Scholar] [CrossRef]
  8. Burdukova, E.; Van Leerdam, G.C.; Prins, F.E.; Smeink, R.G.; Bradshaw, D.J.; Laskowski, J.S. Effect of calcium ions on the adsorption of CMC onto the basal planes of New York talc—A ToF-SIMS study. Miner. Eng. 2008, 21, 1020–2025. [Google Scholar] [CrossRef]
  9. Feng, Q.M.; Feng, B.; Lu, Y.P. Influence of copper ions and calcium ions on adsorption of CMC on chlorite. Trans. Nonferr. Met. Soc. China (Engl. Ed.) 2013, 23, 237–242. [Google Scholar] [CrossRef]
  10. Becker, M.; Harris, P.J.; Wiese, J.G.; Bradshaw, D.J. Mineralogical characterisation of naturally floatable gangue in Merensky reef ore flotation. Int. J. Miner. Process. 2009, 246–255. [Google Scholar] [CrossRef]
  11. Allison, S.A.; O’Connor, C.T. An investigation into the flotation behaviour of pyrrhotite. Miner. Eng. 2011, 98, 202–207. [Google Scholar] [CrossRef]
  12. Hodgson, M.; Agar, G. Electrochemical investigations into the flotation chemistry of pentlandite and pyrrhotite: Process water and xanthate interactions. Can. Metall. Q. 1989, 28, 189–198. [Google Scholar] [CrossRef]
  13. Biçak, Ö.; Ekmekçi, Z.; Can, M.; Öztürk, Y. The effect of water chemistry on froth stability and surface chemistry of the flotation of a Cu-Zn sulfide ore. Int. J. Miner. Process. 2012, 102–103, 32–37. [Google Scholar] [CrossRef]
  14. Ikumapayi, F.; Makitalo, M.; Johansson, B.; Rao, K.H. Recycling of process water in sulphide flotation: Effect of calcium and sulphate ions on flotation of galena. Miner. Eng. 2012, 39, 77–88. [Google Scholar] [CrossRef]
  15. Corin, K.C.; Wiese, J.G. Investigating froth stability: A comparative study of ionic strength and frother dosage. Miner. Eng. 2014, 66, 130–134. [Google Scholar] [CrossRef]
  16. Corin, K.C.; Reddy, A.; Miyen, L.; Wiese, J.G.; Harris, P.J. The effect of ionic strength of plant water on valuable mineral and gangue recovery in a platinum bearing ore from the Merensky reef. Miner. Eng. 2011, 24, 131–137. [Google Scholar] [CrossRef]
  17. Manono, M.S.; Corin, K.C.; Wiese, J.G. An investigation into the effect of various ions and their ionic strength on the flotation performance of a platinum bearing ore from the Merensky reef. Miner. Eng. 2012, 36–38. [Google Scholar] [CrossRef]
  18. Manono, M.; Corin, K.; Wiese, J. Water quality effects on a sulfidic PGM ore: Implications for froth stability and gangue management. Physicochem. Probl. Miner. Process. 2018, 54, 1253–1265. [Google Scholar] [CrossRef]
  19. Wiese, J.; Harris, P.; Bradshaw, D. The influence of the reagent suite on the flotation of ores from the Merensky reef. Miner. Eng. 2005, 18, 189–198. [Google Scholar] [CrossRef]
  20. Bradshaw, D.J.; Harris, P.J.; O’Connor, C.T. Synergistic interactions between reagents in sulphide flotation. J. S. Afr. Inst. Min. Metall. 1998, 98, 189–194. [Google Scholar]
  21. Nyabeze, W.; McFadzean, B. Adsorption of copper sulphate on PGM-bearing ores and its influence on froth stability and flotation kinetics. Miner. Eng. 2016, 92, 28–36. [Google Scholar] [CrossRef]
  22. Mhlanga, S.S.; O’Connor, C.T.; McFadzean, B. A study of the relative adsorption of guar onto pure minerals. Miner. Eng. 2012, 36–38, 172–178. [Google Scholar] [CrossRef]
  23. du Bois, M.; Giles, K.A.; Hamilton, J.K.; Rebers, P.A.; Smith, F. Colorimetric method for determination of sugars and related substances. Anal. Chem. 1956, 28, 350–356. [Google Scholar] [CrossRef]
  24. Laskowski, J.S.; Liu, Q.; O’Connor, C.T. Current understanding of the mechanism of polysaccharide adsorption at the mineral/aqueous solution interface. Int. J. Miner. Process. 2007, 84, 59–68. [Google Scholar] [CrossRef]
  25. Farrokhpay, S.; Zanin, M. An investigation into the effect of water quality on froth stability. Adv. Powder Technol. 2012, 23, 493–497. [Google Scholar] [CrossRef]
  26. Manono, M.; Corin, K.; Wiese, J. Perspectives from literature on the influence of inorganic electrolytes present in plant water on flotation performance. Physicochem. Probl. Miner. Process. 2018, 54, 1191–1214. [Google Scholar] [CrossRef]
  27. Quinn, J.J.; Kracht, W.; Gomez, C.O.; Gagnon, C.; Finch, J.A. Comparing the effect of salts and frother (MIBC) on gas dispersion and froth properties. Miner. Eng. 2007, 20, 1296–1302. [Google Scholar] [CrossRef]
  28. Quinn, J.J.; Sovechles, J.M.; Finch, J.A.; Waters, K.E. Critical coalescence concentration of inorganic salt solutions. Miner. Eng. 2014, 58, 1–6. [Google Scholar] [CrossRef]
  29. Castro, S.; Miranda, C.; Toledo, P.; Laskowski, J.S. Effect of frothers on bubble coalescence and foaming in electrolyte solutions and seawater. Int. J. Miner. Process. 2013, 124, 8–14. [Google Scholar] [CrossRef]
  30. Laskowski, J.S.; Cho, Y.S.; Ding, K. The effect of frothers on bubble size and foam stability in potash ore flotation systems. Can. J. Chem. Eng. 2003, 81, 63–69. [Google Scholar] [CrossRef]
  31. Ramos, O.; Castro, S.; Laskowski, J.S. Copper-molybdenum ores flotation in sea water: Floatability and frothability. Miner. Eng. 2013, 53, 108–112. [Google Scholar] [CrossRef]
  32. Manono, M.S.; Corin, K.C.; Wiese, J.G. The effect of ionic strength of plant water on foam stability: A 2-phase flotation study. Miner. Eng. 2013, 40, 57–67. [Google Scholar] [CrossRef]
Figure 1. A schematic representation of the University of Cape Town (UCT)-Centre for Minerals Research (CMR) microflotation cell adapted from Nyabeze and McFadzean [21].
Minerals 09 00231 g001
Figure 2. Total talc recoveries in increasing ionic strength without (0 CMC g/t) and with carboxymethyl cellulose (CMC) (300 CMC g/t).
Minerals 09 00231 g002
Figure 3. Talc recoveries as a function of time under increasing ionic strength conditions in the absence of CMC (0 CMC g/t).
Minerals 09 00231 g003
Figure 4. Talc recoveries as a function of time under increasing ionic strength in the presence of CMC at 300 g/t.
Minerals 09 00231 g004
Figure 5. Total concentrations of CMC absorbed onto talc and remaining in solution as a function of the ionic strength of SPW.
Minerals 09 00231 g005
Figure 6. Zeta potential as a function of pH under increasing ionic strength conditions for talc.
Minerals 09 00231 g006
Figure 7. The distribution of Cl, CO32−, NO3 and SO42− to H+ in 1SPW.
Minerals 09 00231 g007
Figure 8. The speciation of (a) Ca2+, (b) Mg2+ and (c) Na+ in 1SPW.
Minerals 09 00231 g008aMinerals 09 00231 g008b
Figure 9. The speciation of cation-free anions in 5SPW.
Minerals 09 00231 g009
Figure 10. The speciation of (a) Ca2+, (b) Mg2+ and (c) Na+ in 5SPW.
Minerals 09 00231 g010aMinerals 09 00231 g010b
Figure 11. The speciation of cation-free anions in 10SPW.
Minerals 09 00231 g011
Figure 12. The speciation of (a) Ca2+, (b) Mg2+ and (c) Na+ in 10SPW.
Minerals 09 00231 g012aMinerals 09 00231 g012b
Figure 13. Solids settling time as a function of the ionic strength of SPW and CMC dosages.
Minerals 09 00231 g013
Figure 14. Pulp bubble diameter as a function of the ionic strength of SPW adapted from Manono et al. [32].
Minerals 09 00231 g014
Table 1. Synthetic plant water types and their ion compositions.
Water Type Ca2+ (ppm) Mg2+ (ppm) Na+ (ppm) Cl (ppm) SO42− (ppm) NO3 (ppm) CO32− (ppm) TDS (mg/L)IS [M]
1SPW 80701532872401761710230.0242
5SPW 400350765143512008808551150.1212
10SPW 800700153028702400176085010,2300.2426

