Article

Mechanism Study of Xanthate Adsorption on Sphalerite/Marmatite Surfaces by ToF-SIMS Analysis and Flotation

1
School of Chemical Engineering and Energy, Zhengzhou University, Zhengzhou 450001, China
2
State Key Laboratory of Complex Nonferrous Metal Resources Clean Utilization, Faculty of Land Resource Engineering, Kunming University of Science and Technology, Kunming 650093, China
3
School of Chemical & Environmental Engineering, China University of Mining and Technology (Beijing), Beijing 100083, China
4
Guizhou Center Laboratory of Geological and Mineral Resources, Guiyang 550004, China
*
Authors to whom correspondence should be addressed.
Minerals 2019, 9(4), 205; https://doi.org/10.3390/min9040205
Submission received: 12 February 2019 / Revised: 18 March 2019 / Accepted: 22 March 2019 / Published: 29 March 2019

Abstract

:
In this work, the active sites and species involved in xanthate adsorption on sphalerite/marmatite surfaces were studied using adsorption capacity measurements, single mineral flotation, and time-of-flight secondary ion mass spectrometry (ToF-SIMS) analysis. The effects of Fe concentration on the xanthate adsorption capacity, Cu activation, and the flotation response of sphalerite/marmatite were determined. A discovery was that xanthate can interact with Fe atoms in the crystal of sphalerite/marmatite, as well as with Zn and Cu on the surface. We detected C2S2 fragment ions from dixanthogen, and dixanthogen may have been adsorbed on the surface of marmatite. The amounts of Cu and copper xanthate adsorbed on the marmatite surface were lower than those on the sphalerite surface, because Fe occupies Cu and Zn exchange sites. These results help to address the long-standing controversy regarding the products and mechanisms of xanthate adsorption on Fe-bearing sphalerite surfaces.

Graphical Abstract

1. Introduction

Sphalerite is an important Zn-containing mineral and is often found in association with sulfide minerals such as galena, pyrite, and chalcopyrite [1,2]. In industry, the flotation method is generally used to achieve the separation of these different minerals [3,4]. During separation of sphalerite and pyrite, copper sulfate is added to activate the sphalerite, and then xanthate is added to make the sphalerite surface hydrophobic and induce floating [5,6]. Copper sulfate and xanthate are used in the recovery of single zinc sulfide ores because they enable substantial recovery of sphalerite.
Xanthate adsorption on sphalerite depends on the nature of the flotation pulp, e.g., the pulp pH, the ionic composition of the flotation water, and release of the components of fluid inclusions [7,8,9,10]. The adsorption process also depends on the properties of the sphalerite crystals, e.g., crystal lattice defects, and doping and substitution by impurity atoms [7,11,12,13]. Sphalerite usually contains significant amounts of Cd and Mn substituted for Zn, and small amounts of other elements, e.g., Ga, Ge, In, Co, and Hg [14]. The most common impurity is Fe, which is generally present at levels up to 26 mol %, although contents of 56 mol % have been reported [15,16,17].
Fe-bearing sphalerite, known as marmatite, is usually formed by isomorphous doping, substitution, or solid dissolution of Fe atoms in sphalerite crystals during mineralization and crystallization. Marmatite is one of the most important zinc sulfide minerals, and is globally distributed, e.g., in Australia, the United States, China, and Kazakhstan [18,19,20]. Infrared spectroscopy, ultraviolet (UV) spectroscopy, X-ray absorption spectroscopy, and density functional theory calculations have been used to study the effects of Fe on xanthate adsorption on sphalerite/marmatite [13,19,21,22,23,24,25,26]. Chen et al. [21] used density functional theory calculations to simulate the effects of Fe impurities on the electronic structure of sphalerite. The results showed that Fe impurities changed the sphalerite from a p-type to an n-type semiconductor. This facilitates oxidation of xanthate on the sphalerite surface to dixanthogen. Szczypa et al. [22] synthesized artificial sphalerite samples with various Fe contents and compared the concentrations of residual xanthate in the solutions after xanthate adsorption by marmatite. Their results showed that the amount of xanthate that remained in the solution decreased with increasing amount of Fe. The thickness of the xanthate layer on the sphalerite surface was found to be less than one molecule layer. At pH 6–10, the amount of xanthate adsorption was not affected by the solution pH. Boulton [23] found that at pH 11 the amount of xanthate adsorbed by sphalerite was twice that adsorbed by marmatite after Cu activation. Gigowski et al. [24] suggested that xanthate adsorption at pH 6.5 strongly depends on activation by Cu, regardless of the Fe content. In terms of the effects of Fe on Cu activation of sphalerite, Chandra et al. [25] reported that Fe impurities decrease the adsorption of Cu ions on the sphalerite surface. Boulton et al. suggested that Fe decreases the exchange of Cu ions and Zn [26]. However, the study by Harmer et al. [19] showed that surface adsorption of Cu increased with increasing Fe addition. The number of surface defects in marmatite is greater than that in sphalerite with a low Fe content, therefore more Cu ions can be adsorbed on the surface. These results suggest that Fe has significant effects on Cu activation of sphalerite as well as xanthate adsorption, but this is still debatable.
As is well-known, xanthate can increase the floatability of Fe-bearing sphalerites but various adsorption products are formed on the sphalerite. The following questions still need to be satisfactorily answered. What are the main adsorption products formed from xanthate in Fe-bearing sphalerite? What are the active sites? What are the effects of Fe impurities and Cu ions on the adsorption of xanthate in Fe-bearing sphalerite? The results of previous studies are controversial. Some researchers have suggested that the xanthate products adsorbed on the surface of non-activated sphalerite are zinc xanthate and dixanthogen [27,28]. Some studies have shown that xanthate is adsorbed as copper xanthate after Cu activation [29,30,31]. However, X-ray photoelectron spectroscopy results obtained by Mikhlin et al. [32] showed that almost no zinc xanthate or dixanthogen was present. Gigowski et al. [24] found that xanthate was preferentially adsorbed on marmatite.
In this study, to explain the contradictory results of previous studies of xanthate adsorption products and their formation mechanisms in sphalerite/marmatite, we used adsorption determination, single mineral flotation, and time-of-flight secondary ion mass spectrometry (ToF-SIMS) to investigate the effects of iron on xanthate adsorption and identify their active sites.

2. Materials and Methods

2.1. Materials

Natural sphalerite samples were obtained from a polymetallic ore deposit in Dulong, Yunnan Province, China. Marmatite samples were obtained from a polymetallic mining area in Nandan, Guangxi Province, China. The samples were manually crushed and handpicked, dry ground in an agate mortar, and dry screened to obtain particles of size 37–74 μm for flotation and xanthate adsorption capacity tests. Chemical assays showed that the sphalerite (SPH1) contained 63.73 wt % Zn, 0.60 wt % Fe, 31.80 wt % S, 1.16 wt % Pb, and 0.15 wt % Cu, and the marmatite (SPH5) contained 48.26 wt % Zn, 14.70 wt % Fe, 33.10 wt % S, 0.09 wt % Pb, and 0.17 wt % Cu. The results of the above chemical analysis indicated that the purity of sphalerite and marmatite were both high and could be used as suitable research objects. Analytically pure CuSO4∙5H2O was purchased from the Tianjin Chemical Reagent Factory (Tianjin, China), sodium butyl xanthate and terpineol were purchased from Zhuzhou Flotation Reagents Ltd. (Zhuzhou, China). Deionized water was used in all experiments.

2.2. Adsorption Capacity Measurements

The concentration of xanthate was determined by UV spectroscopy (UV765, Jingke, Shanghai, China). Before the xanthate adsorption capacity tests, the characteristic absorption wavelength of sodium butyl xanthate was determined; the wavelength was 301 nm. The absorption wavelength was used to establish an equation for the relationship between xanthate concentration and solution absorbance. A sample (2 g) of particle size 37–74 μm was weighed with electronic scales. Before adding the reagent, the sample was ultrasonically cleaned in deionized water three times (3 min for each time) to remove surface oxidizing materials. For the xanthate adsorption capacity test without Cu activation, sodium butyl xanthate solution (40 mL) was injected into a 100 mL beaker containing the sample. The beaker was placed on a thermostatic magnetic stirrer rotating at a speed of 1000 rpm. Agitation was stopped after 3 min, the slurry was centrifuged, and the concentration of sodium butyl xanthate in the separated liquid was determined by UV spectroscopy by using the relationship between the xanthate concentration and solution absorbance. The xanthate adsorption capacity was calculated as
Γ = ( C 0 C ) × V m
where Γ is the amount of sodium butyl xanthate adsorbed (mol/g); C0 is the initial concentration of sodium butyl xanthate (mol/L); C is the concentration of sodium butyl xanthate in the solution after adsorption of butyl xanthate on the sample (mol/L), i.e., the concentration in the separation liquid; V is the solution volume (L); and m is the sample mass (g).
For the xanthate adsorption test with Cu activation, CuSO4 solution (40 mL) of concentration 1 × 10⁻⁵ mol/L was injected into a 100 mL beaker containing the sample (2 g). The beaker was placed on a thermostatic magnetic stirrer rotating at a speed of 1000 rpm. Agitation was stopped after 2 min. The pulp was centrifuged to obtain a Cu-activated sample for the xanthate adsorption capacity test. The subsequent steps in the xanthate adsorption test were the same as those in the test without Cu activation. All xanthate adsorption tests were performed at natural pH.

2.3. Single Mineral Flotation

Single mineral flotation was used for flotation tests on sphalerite and marmatite. For the flotation test without Cu activation, a sample (2 g) of particle size 37–74 μm was weighed with electronic scales and the sample surface was cleaned ultrasonically to remove surface oxidizing materials before flotation. The rinsed sample was poured into a 50 mL flotation cell containing deionized water (40 mL). The flotation machine, which had a rotor speed of 1600 rpm, was started and then sodium butyl xanthate solution (1 × 10⁻⁴ mol/L) and 2# oil (20 mg/L) were added. Froths were collected for 220 s by turning on the air valve at a rate of 35 mL/min before stopping flotation. The collected flotation sphalerite and the Fe-doped sphalerite left at the bottom of the flotation tank were filtered and dried and the flotation recovery of the Fe-doped sphalerite was calculated. For the flotation test after Cu activation, CuSO4 solution (1 × 10⁻⁵ mol/L) was first added to the pulp; the other steps were the same as those in the test without Cu activation. All flotation tests were performed at natural pH.

2.4. ToF-SIMS Analysis

The preparation of bulk Sphalerite/marmatite samples follows the following steps: (1) The samples were cut into rectangular shaped pieces approximately 1.5 × 1 × 0.5 cm in length, width, and depth, using a fine slow diamond saw. (2) Cut samples were polished with wet silicon carbide paper in the sequence of 600, 800, 1200, 2000, and 4000 meshes, and then polished with 5 and 1 μm alumina powder suspensions, respectively. (3) The freshly polished samples were ultrasonically cleaned for 3 min each in deionized water, absolute ethanol, and deionized water. (4) The cleaned samples were dried by using high-purity nitrogen. The samples that were not activated by Cu were placed in a sodium butyl xanthate solution (40 mL) of concentration 1 × 10⁻⁴ mol/L for 15 min and then removed. The samples were dried with high-purity nitrogen. The samples activated by Cu were first placed in CuSO4 solution (40 mL) of concentration 1 × 10⁻⁴ mol/L, and reacted for 15 min, and then removed and immediately placed in sodium butyl xanthate solution (40 mL) of concentration 1 × 10⁻⁴ mol/L. After reaction for 15 min, they were removed and dried with high-purity nitrogen. The dried samples were immediately placed in the ToF-SIMS V (ION-TOF GmbH, Münster, Germany) sample chamber. The analysis was started when the vacuum in the sample chamber reached 1 × 10⁻⁹ mbar. A 30 keV Bi3+ primary gun with a pulsed current of 1.04 pA was used to analyze a sample area of 500 × 500 μm, and a flood gun was used for charge compensation. The Bi3+ beam was rastered in random mode, 256 × 256 pixels, and was stopped after 240 s. Positive-ion and negative-ion spectra were recorded with the instrument optimized for high mass resolution (mm ~6000–9000 at m/z 64) over the mass range m/z 0–815. ToF-SIMS spectra were collected in four different areas of each sample surface. Positive-ion spectra were calibrated against the peaks for C+, CH3+, C2H3+, and Zn+ before further analysis. Negative-ion spectra were calibrated against the peaks for C, CH, C2, C2H, and S before further analysis. Data acquisition and subsequent data processing and analysis were performed using ION-TOF SurfaceLab software (6.7, ION-TOF GmbH, Münster, Germany).

3. Results

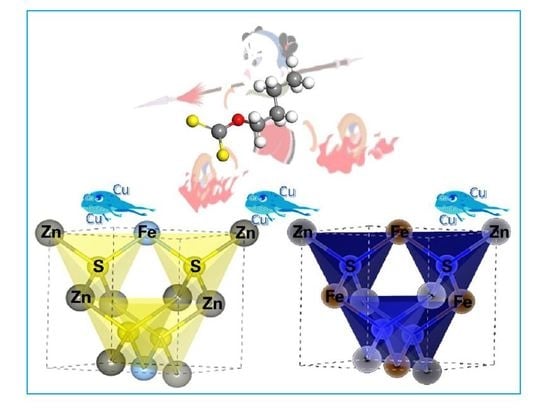
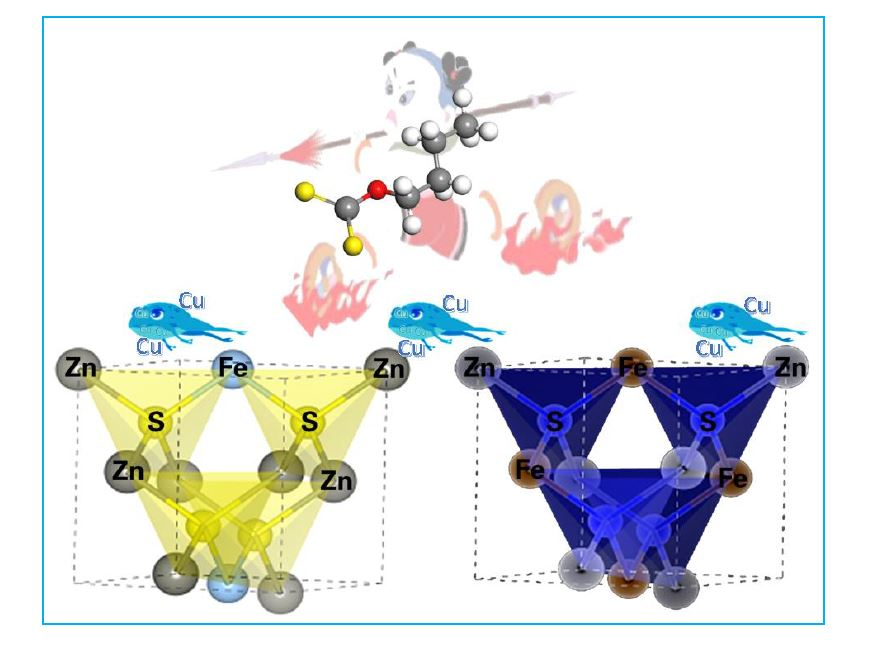
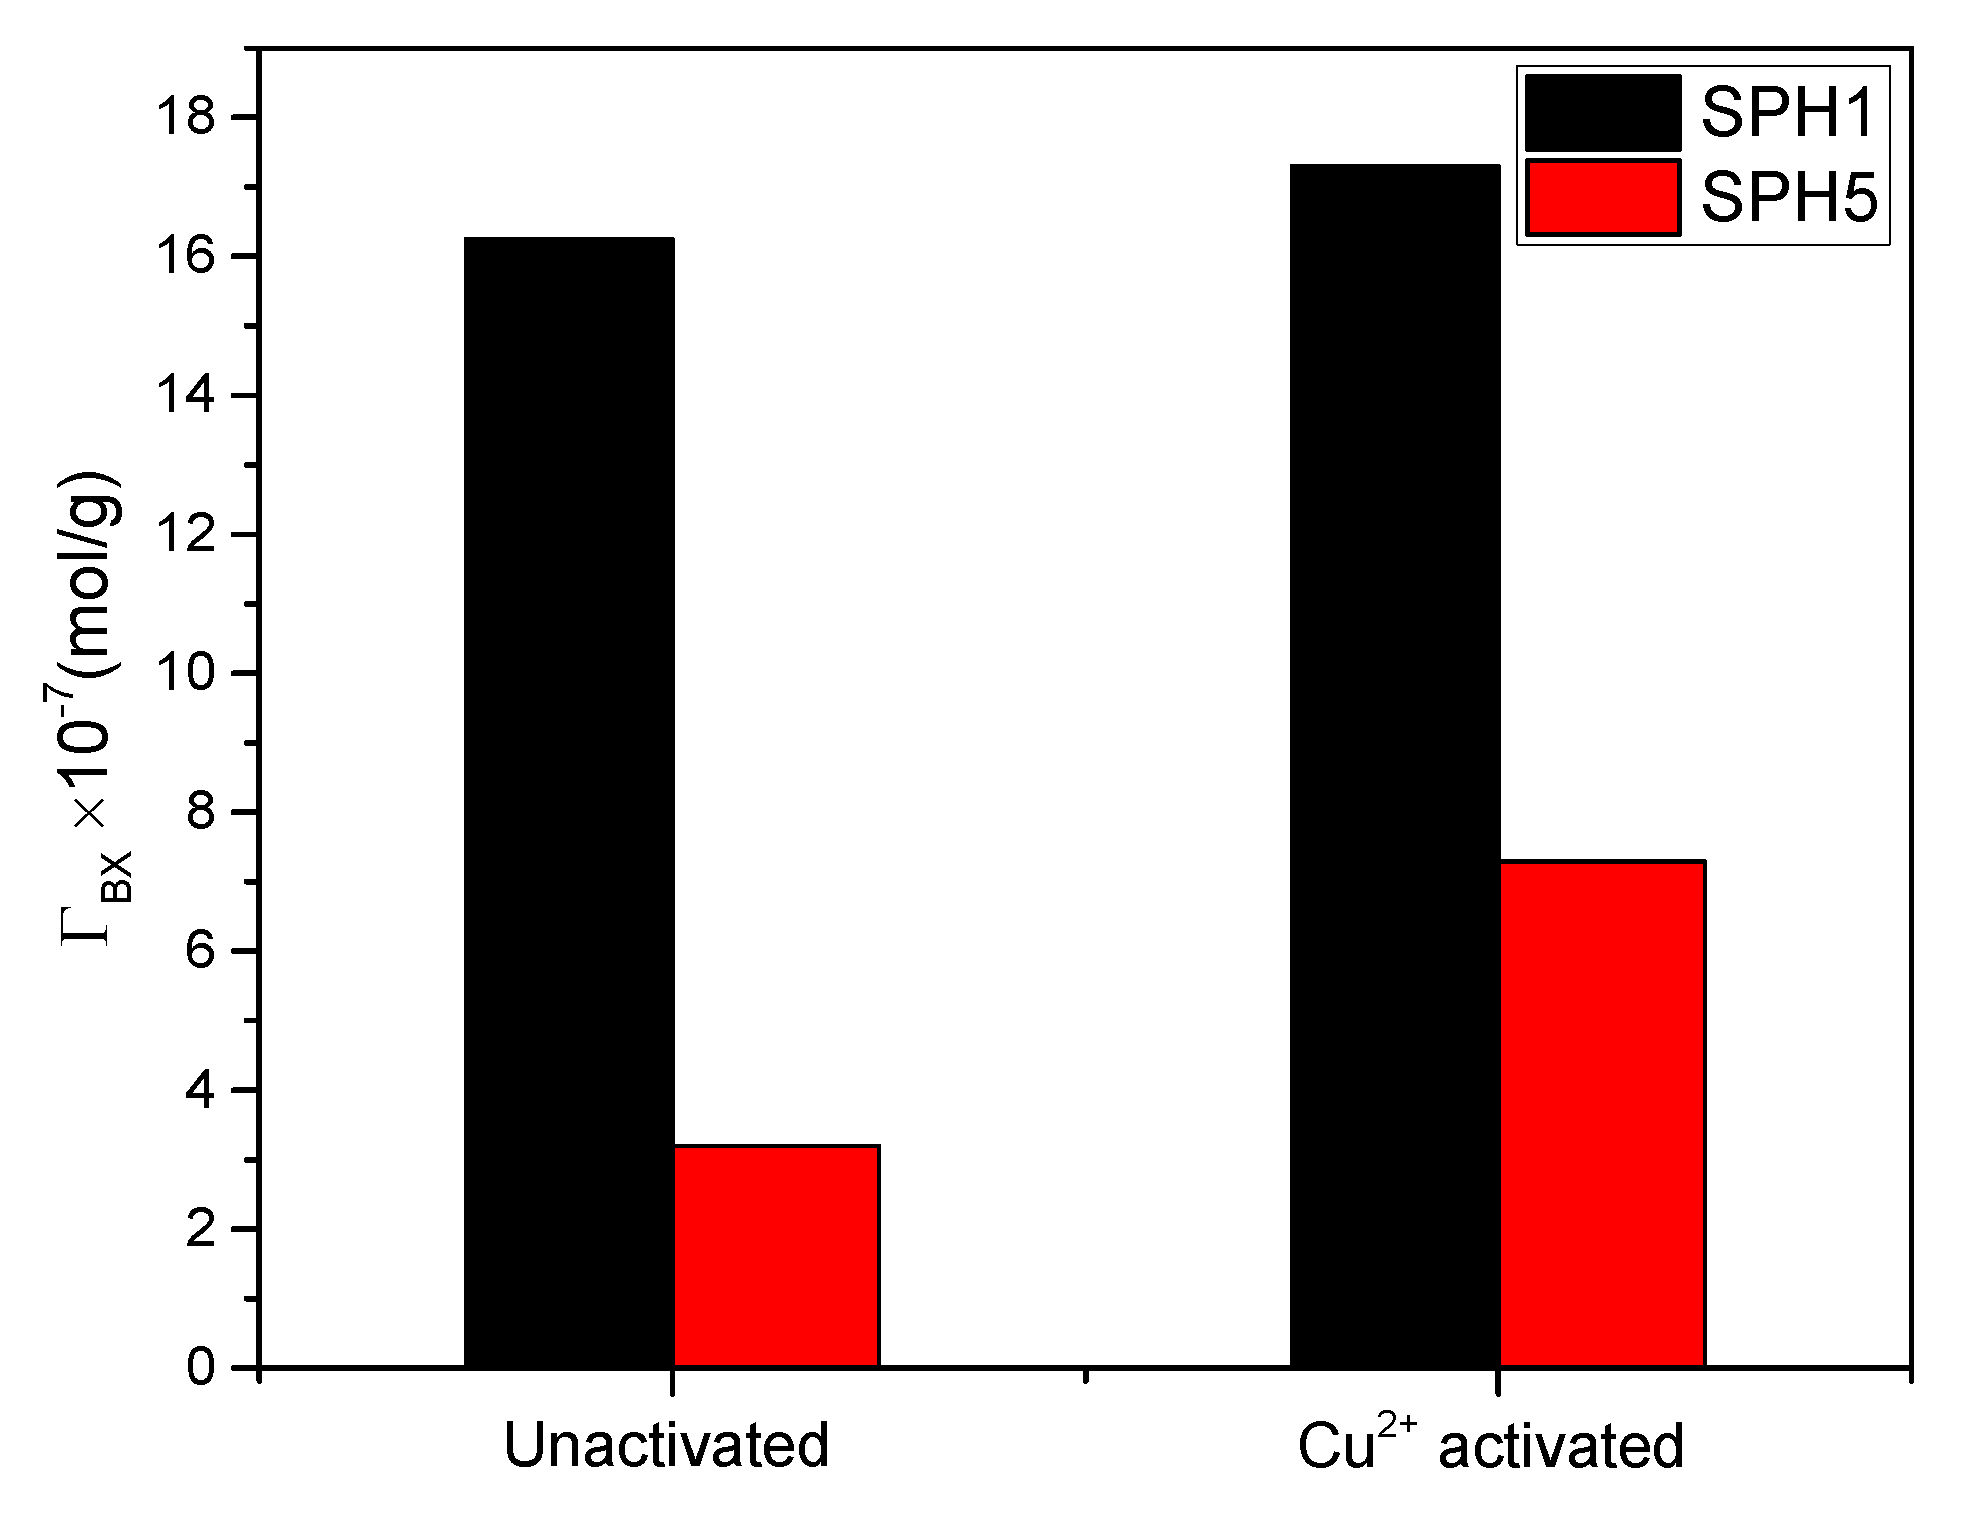
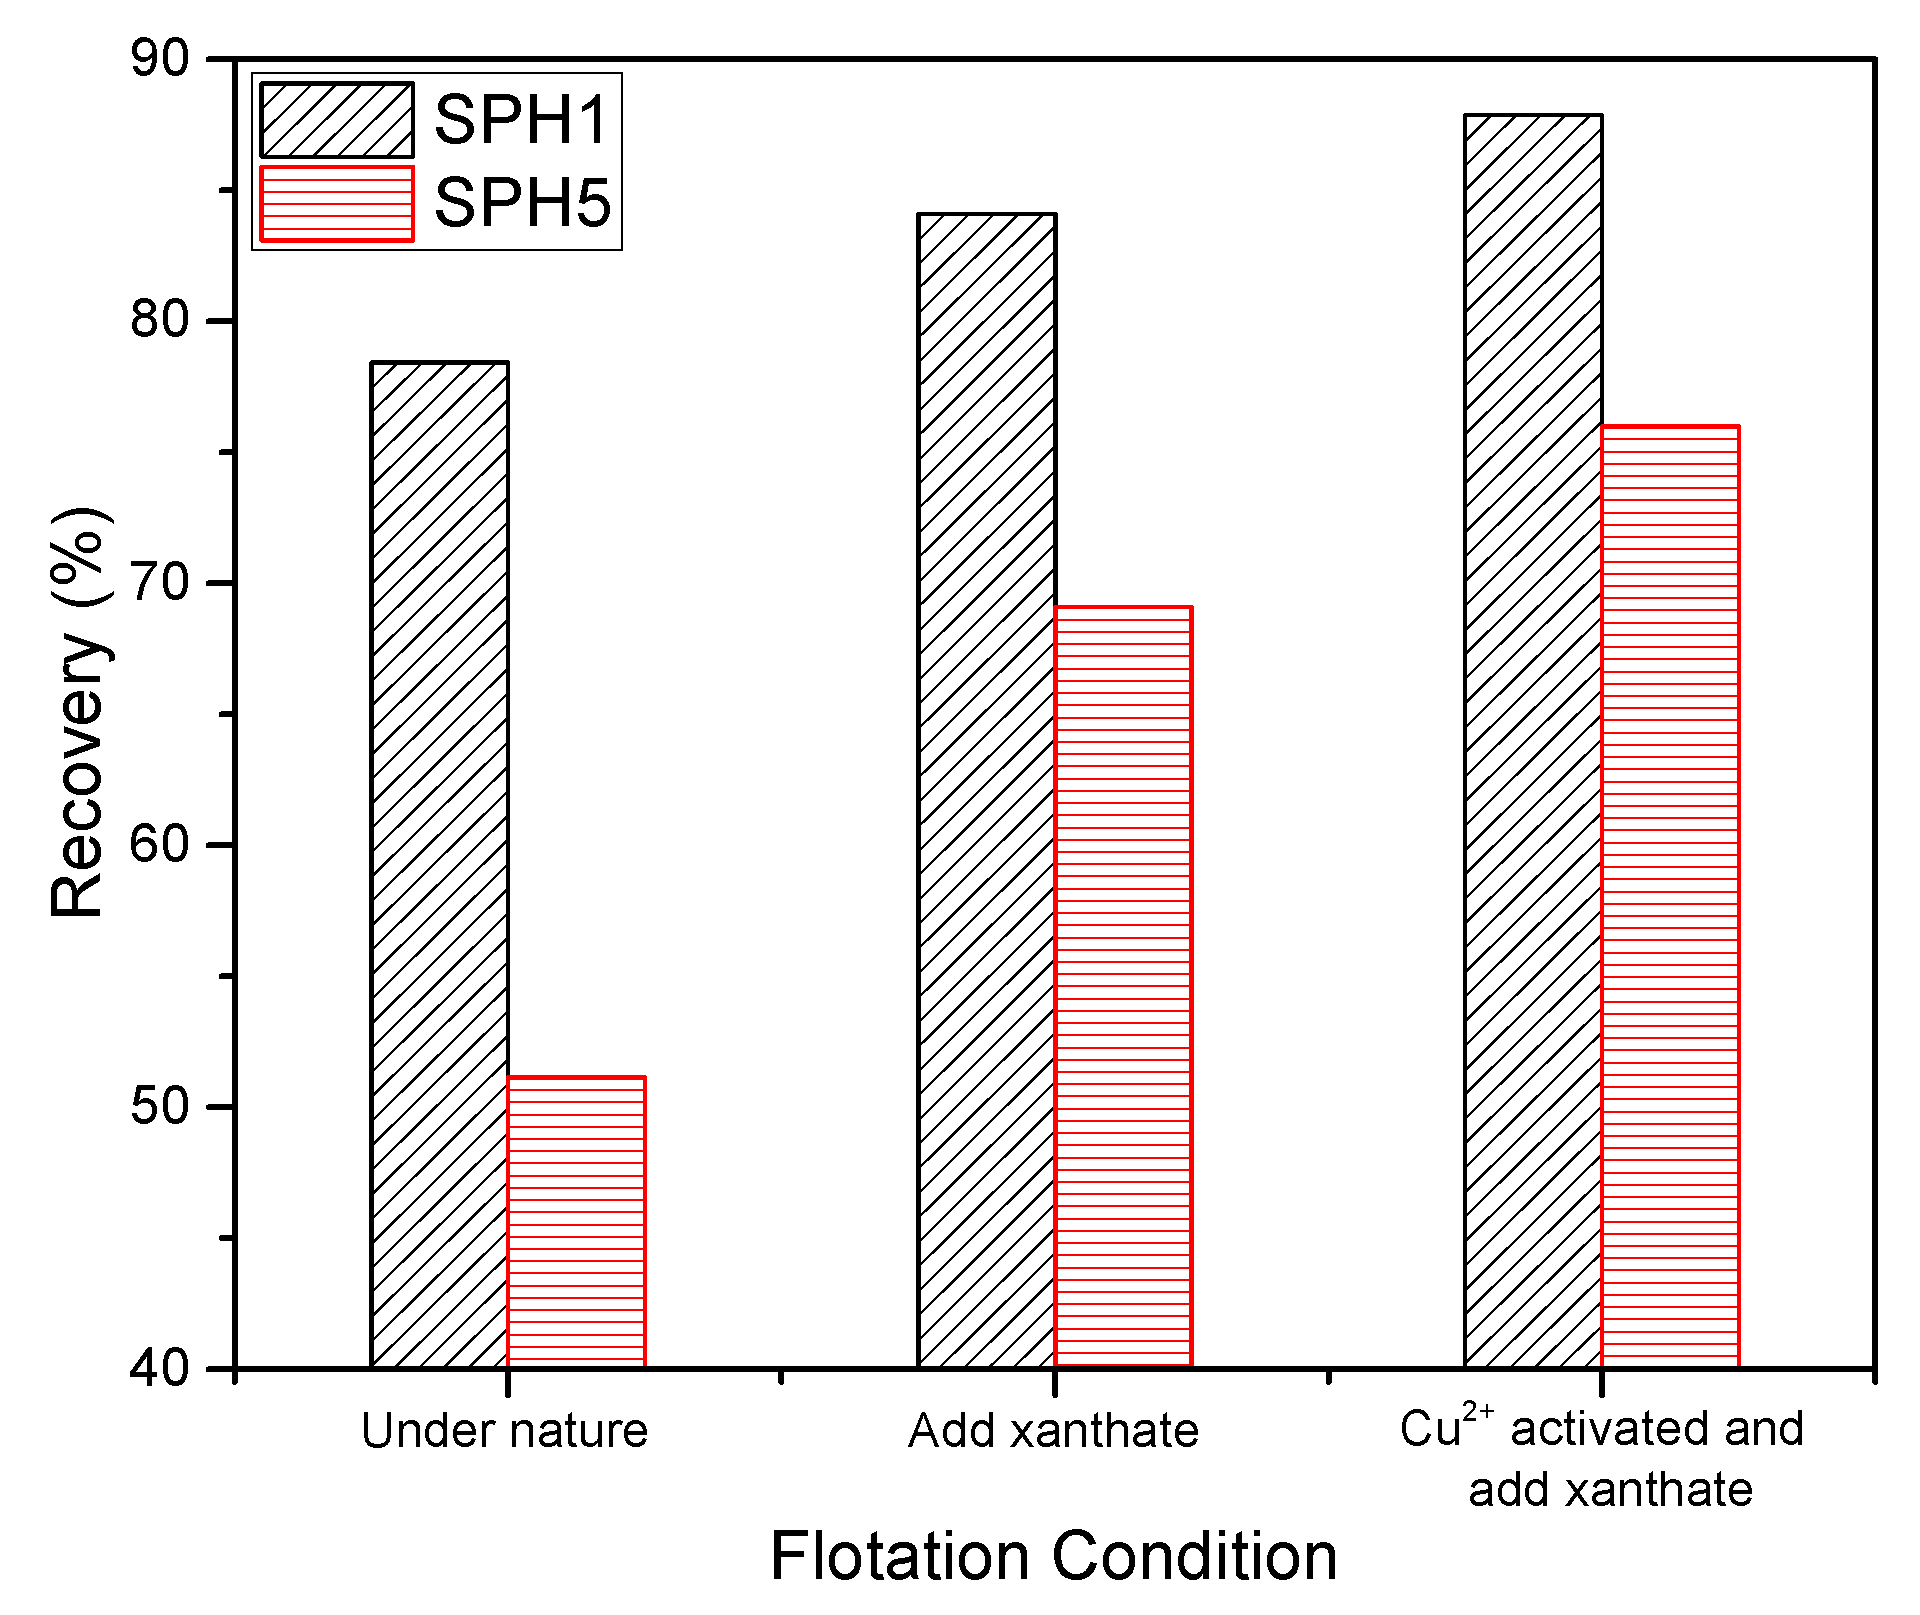
3.1. Effects of Fe Concentration on Xanthate Adsorption and Flotation Response

In this work, UV spectroscopy was used to determine the adsorption capacity of butyl xanthate (BX) on sphalerite and marmatite with Fe contents of 0.6% and 14.7%, respectively (Figure 1). The results show that at pH 6.5 without copper sulfate addition, the quantity of xanthate adsorbed on sphalerite was five times that for marmatite. After Cu activation, the adsorption capacities for xanthate on the sphalerite/marmatite surface increased. At this point, the amount of xanthate adsorbed on sphalerite was 2.5 times that adsorbed on marmatite.
The xanthate adsorption capacity of sphalerite only increased by 1 × 10⁻⁷ mol/g after Cu activation; the adsorption capacity increased by 4 × 10⁻⁷ mol/g for marmatite after Cu activation. This indicates that Cu activation has a greater effect on the xanthate adsorption capacity of marmatite than on that of sphalerite. Although the xanthate adsorption capacity on the marmatite increased after Cu activation, it was still much lower than that for sphalerite. These results are consistent with those reported by Boulton [23]: Fe impurities in the crystal lattice of sphalerite are not conducive to xanthate adsorption.
Figure 2 shows the flotation responses of sphalerite/marmatite. The floatability of sphalerite was better than that of marmatite. In the absence of xanthate flotation, the flotation recovery of marmatite was only 51.15%, whereas that of sphalerite was 78.43%. After xanthate addition, the flotation recovery of marmatite increased to 69.1%, and that for the sphalerite was 84.1%.
The flotation recovery of marmatite increased after CuSO4 addition. This clearly indicates that Cu ions activate marmatite in a xanthate flotation system. The studies by Popov et al. [33] and Boulton [23] showed that the flotation recoveries of marmatite were low under alkaline and non-collector conditions. Xanthate can improve the floatability of marmatite, and Cu activation can promote marmatite flotation in a xanthate system. The results in Figure 1 indicate that Fe impurities in marmatite are not conducive to xanthate adsorption or marmatite flotation.

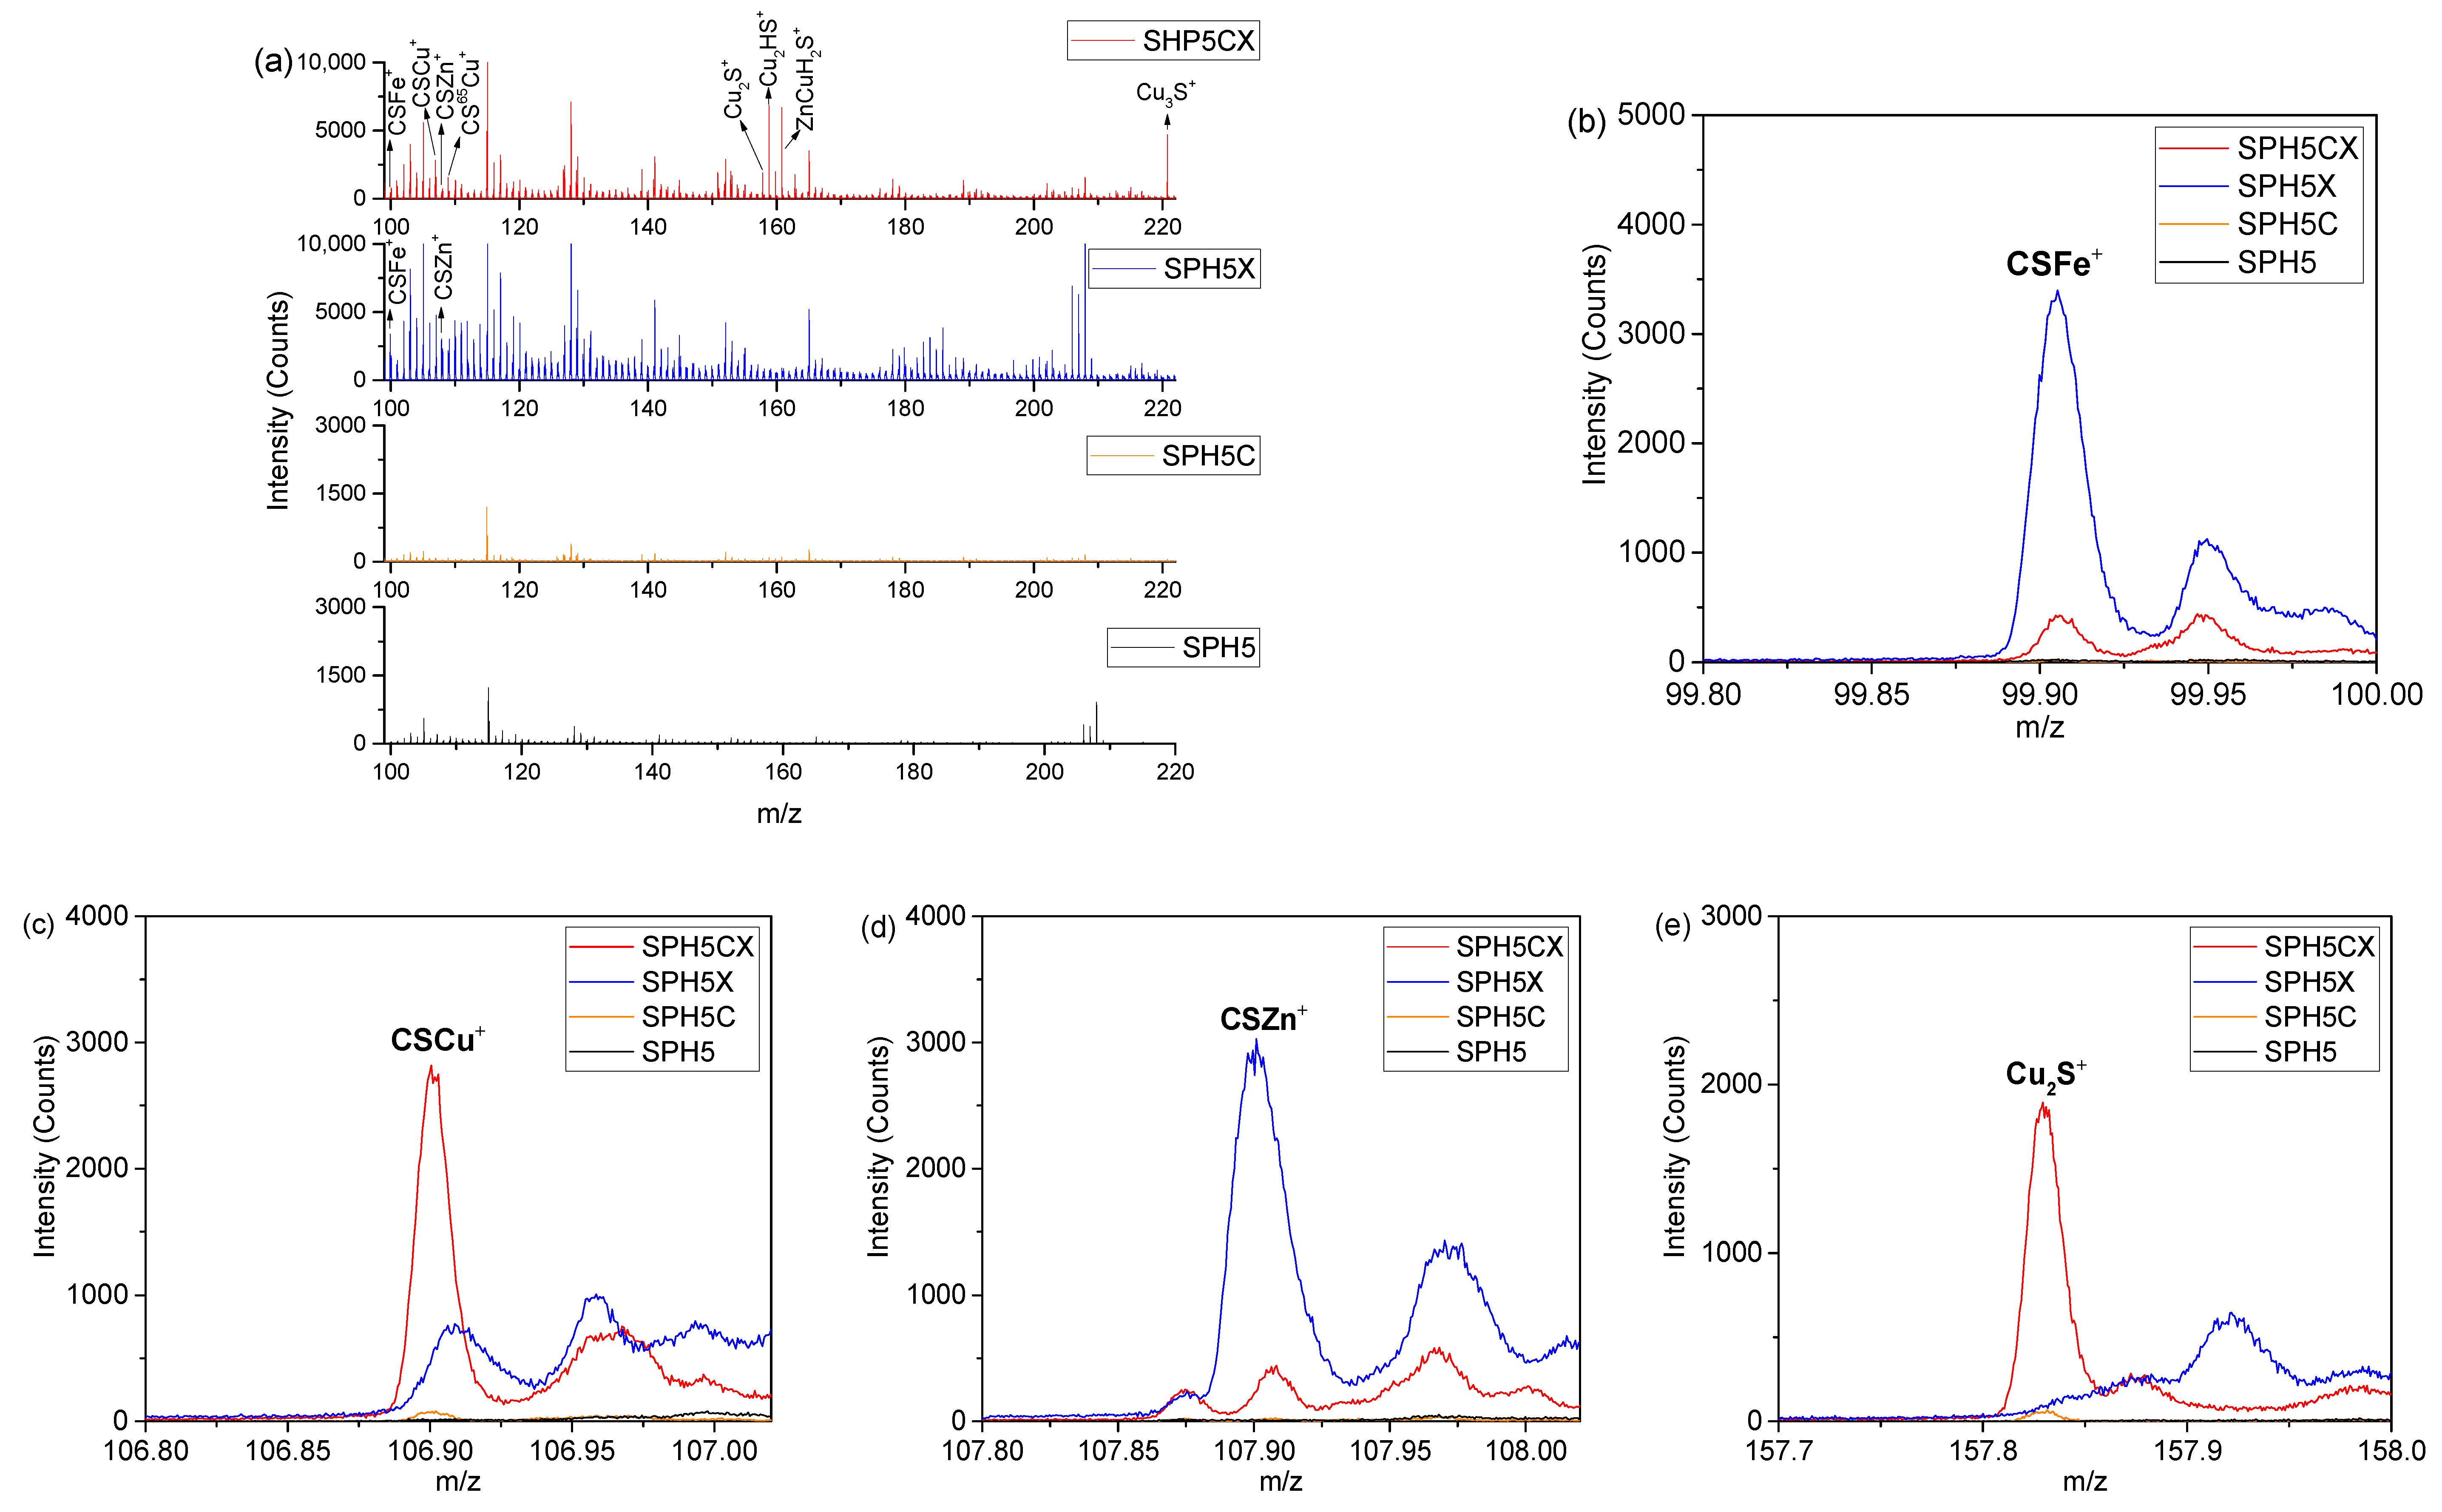
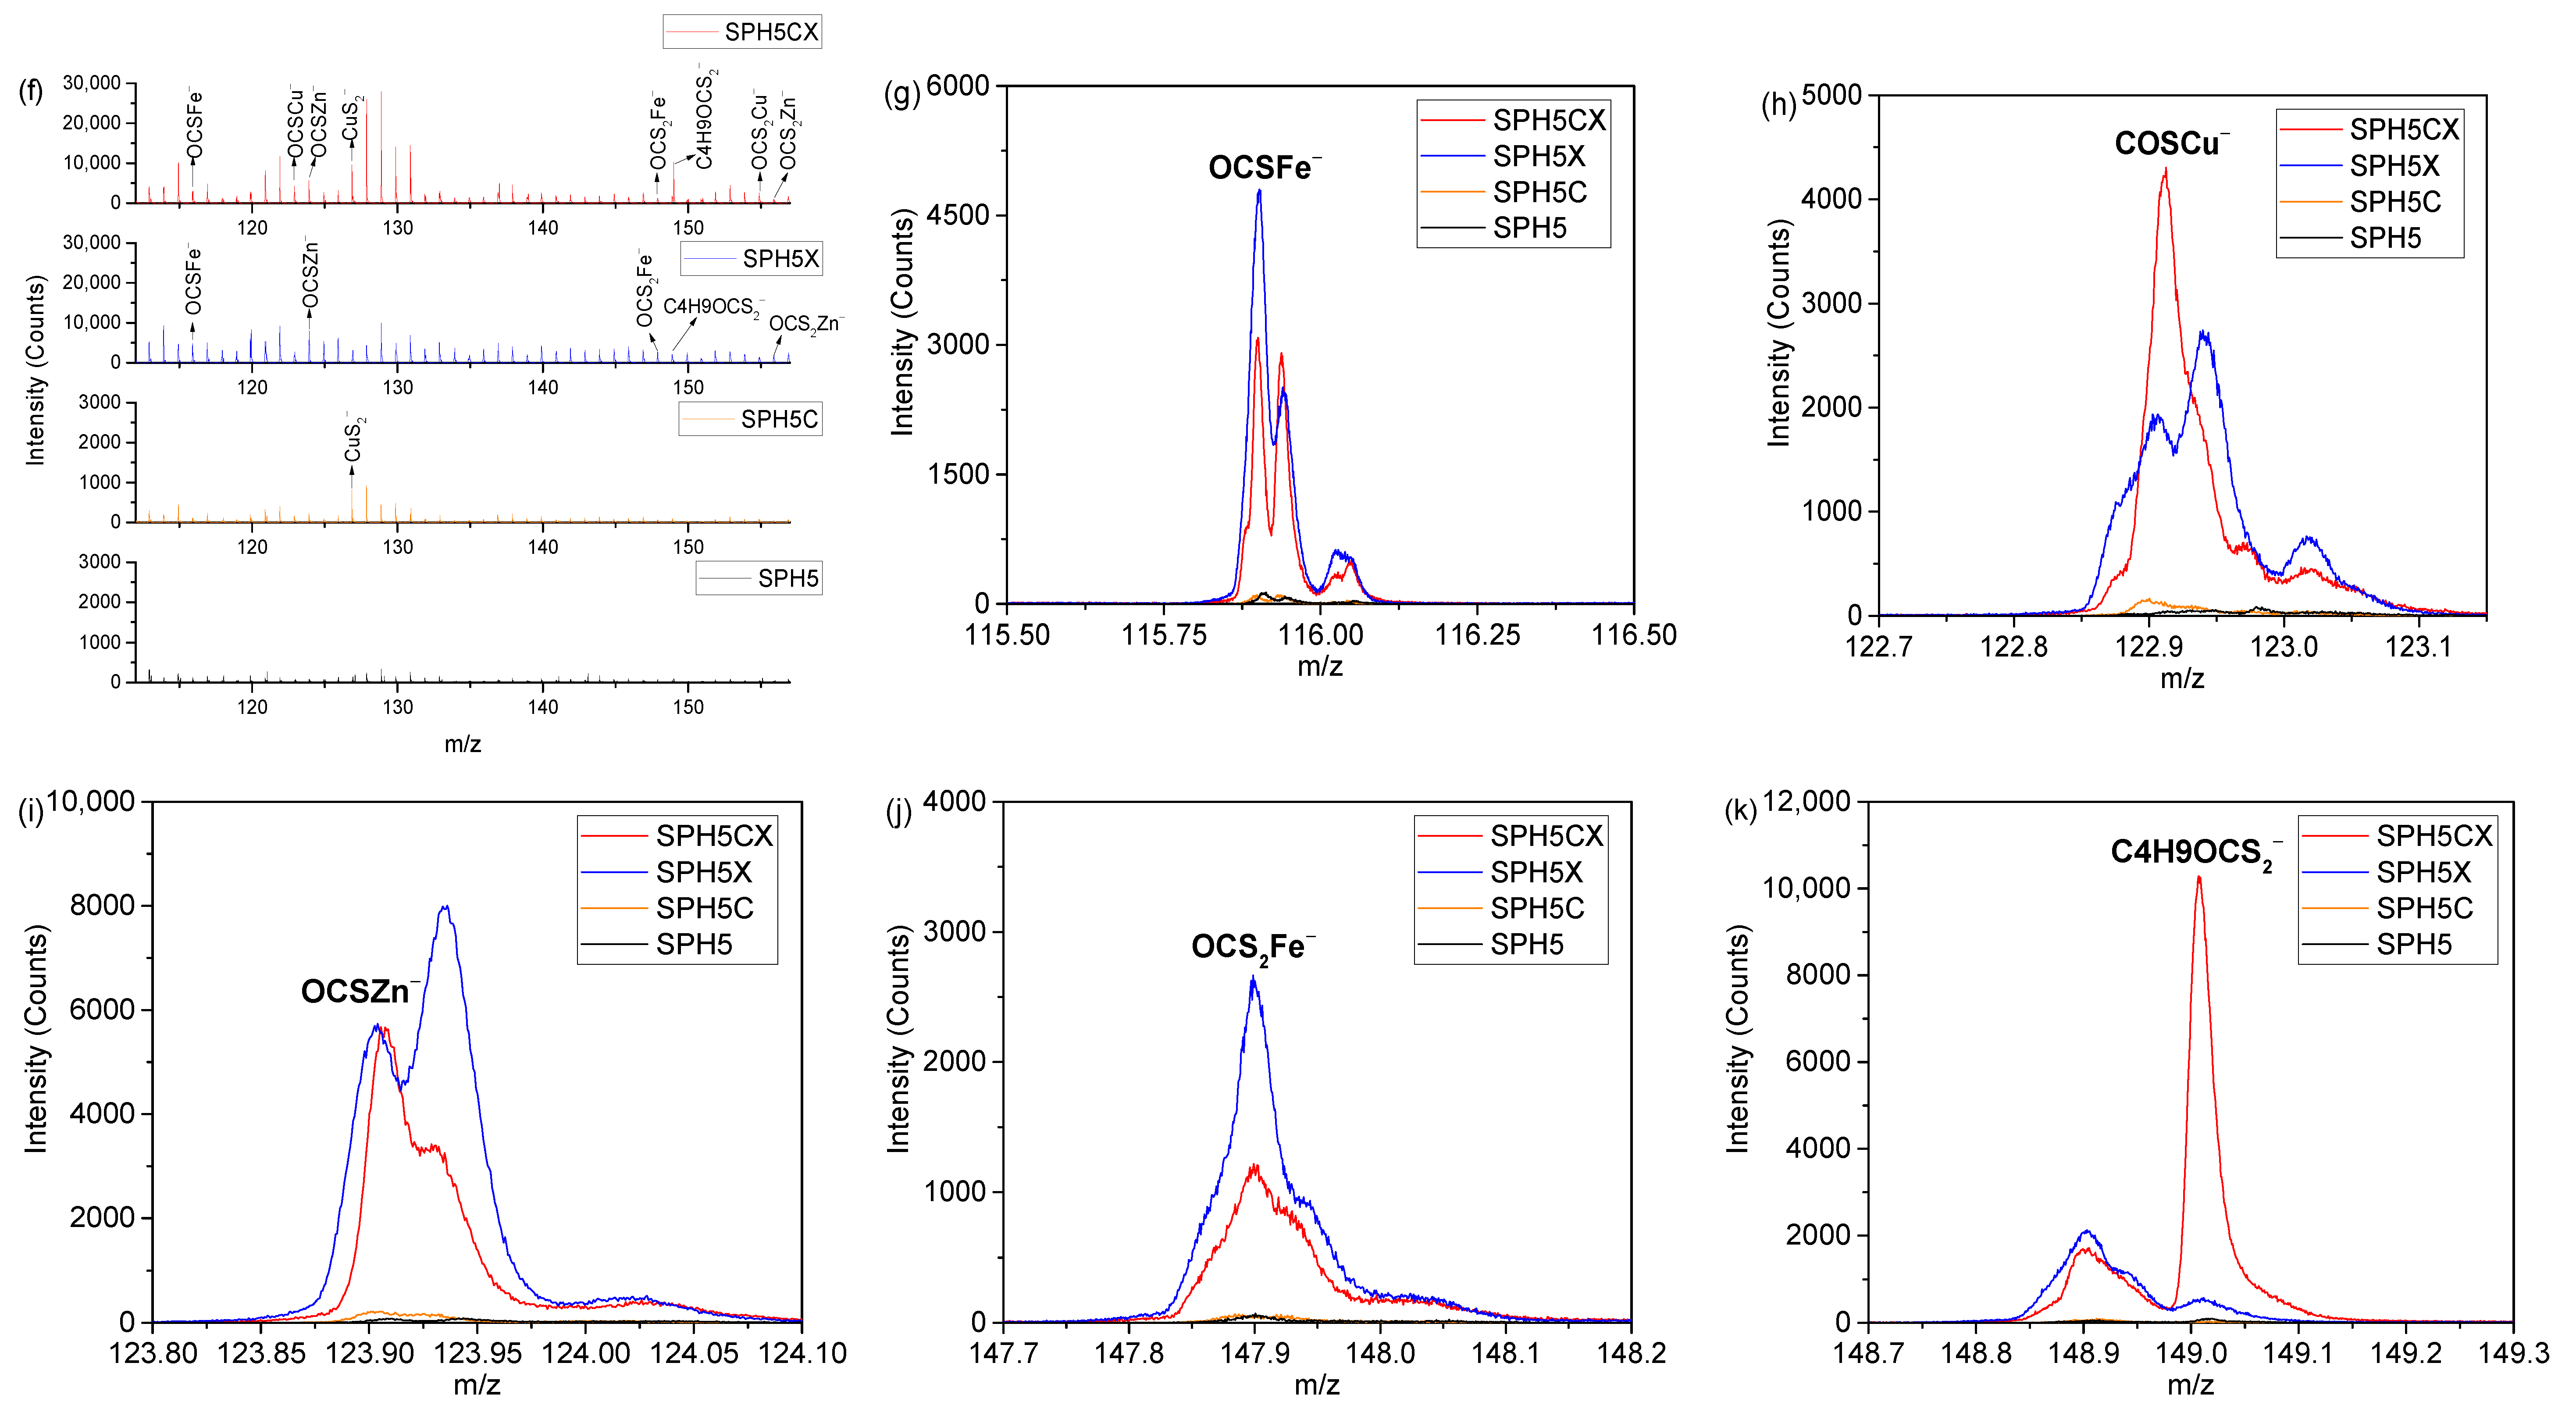
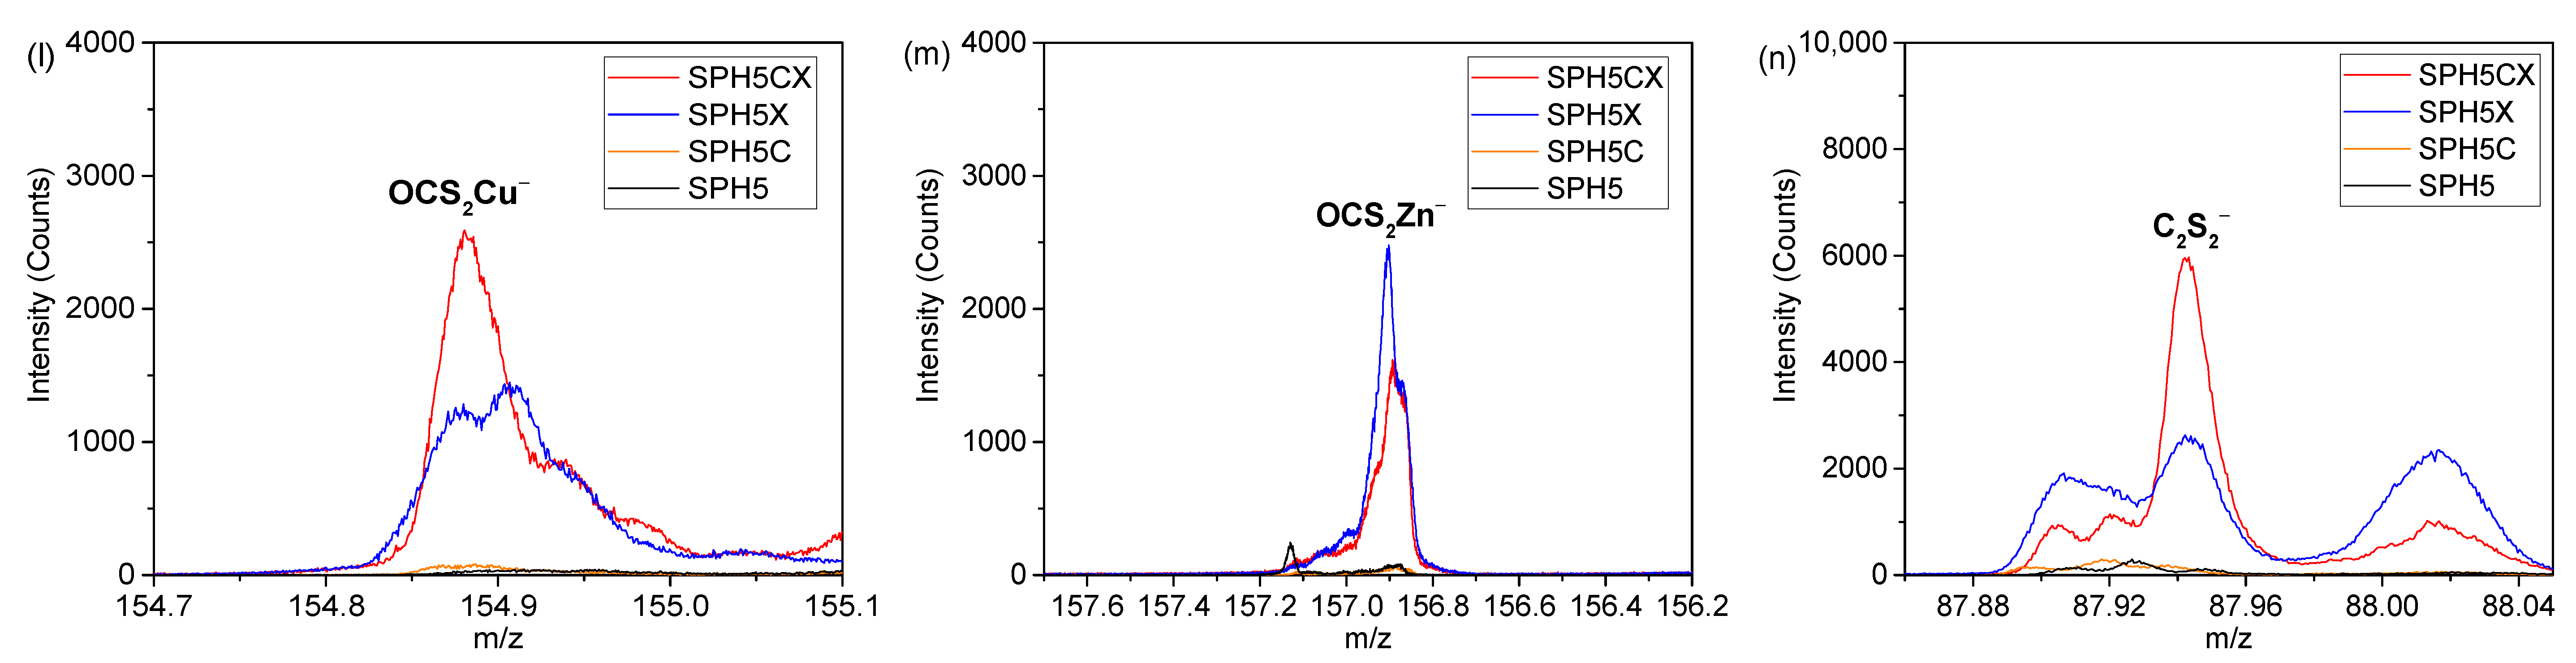
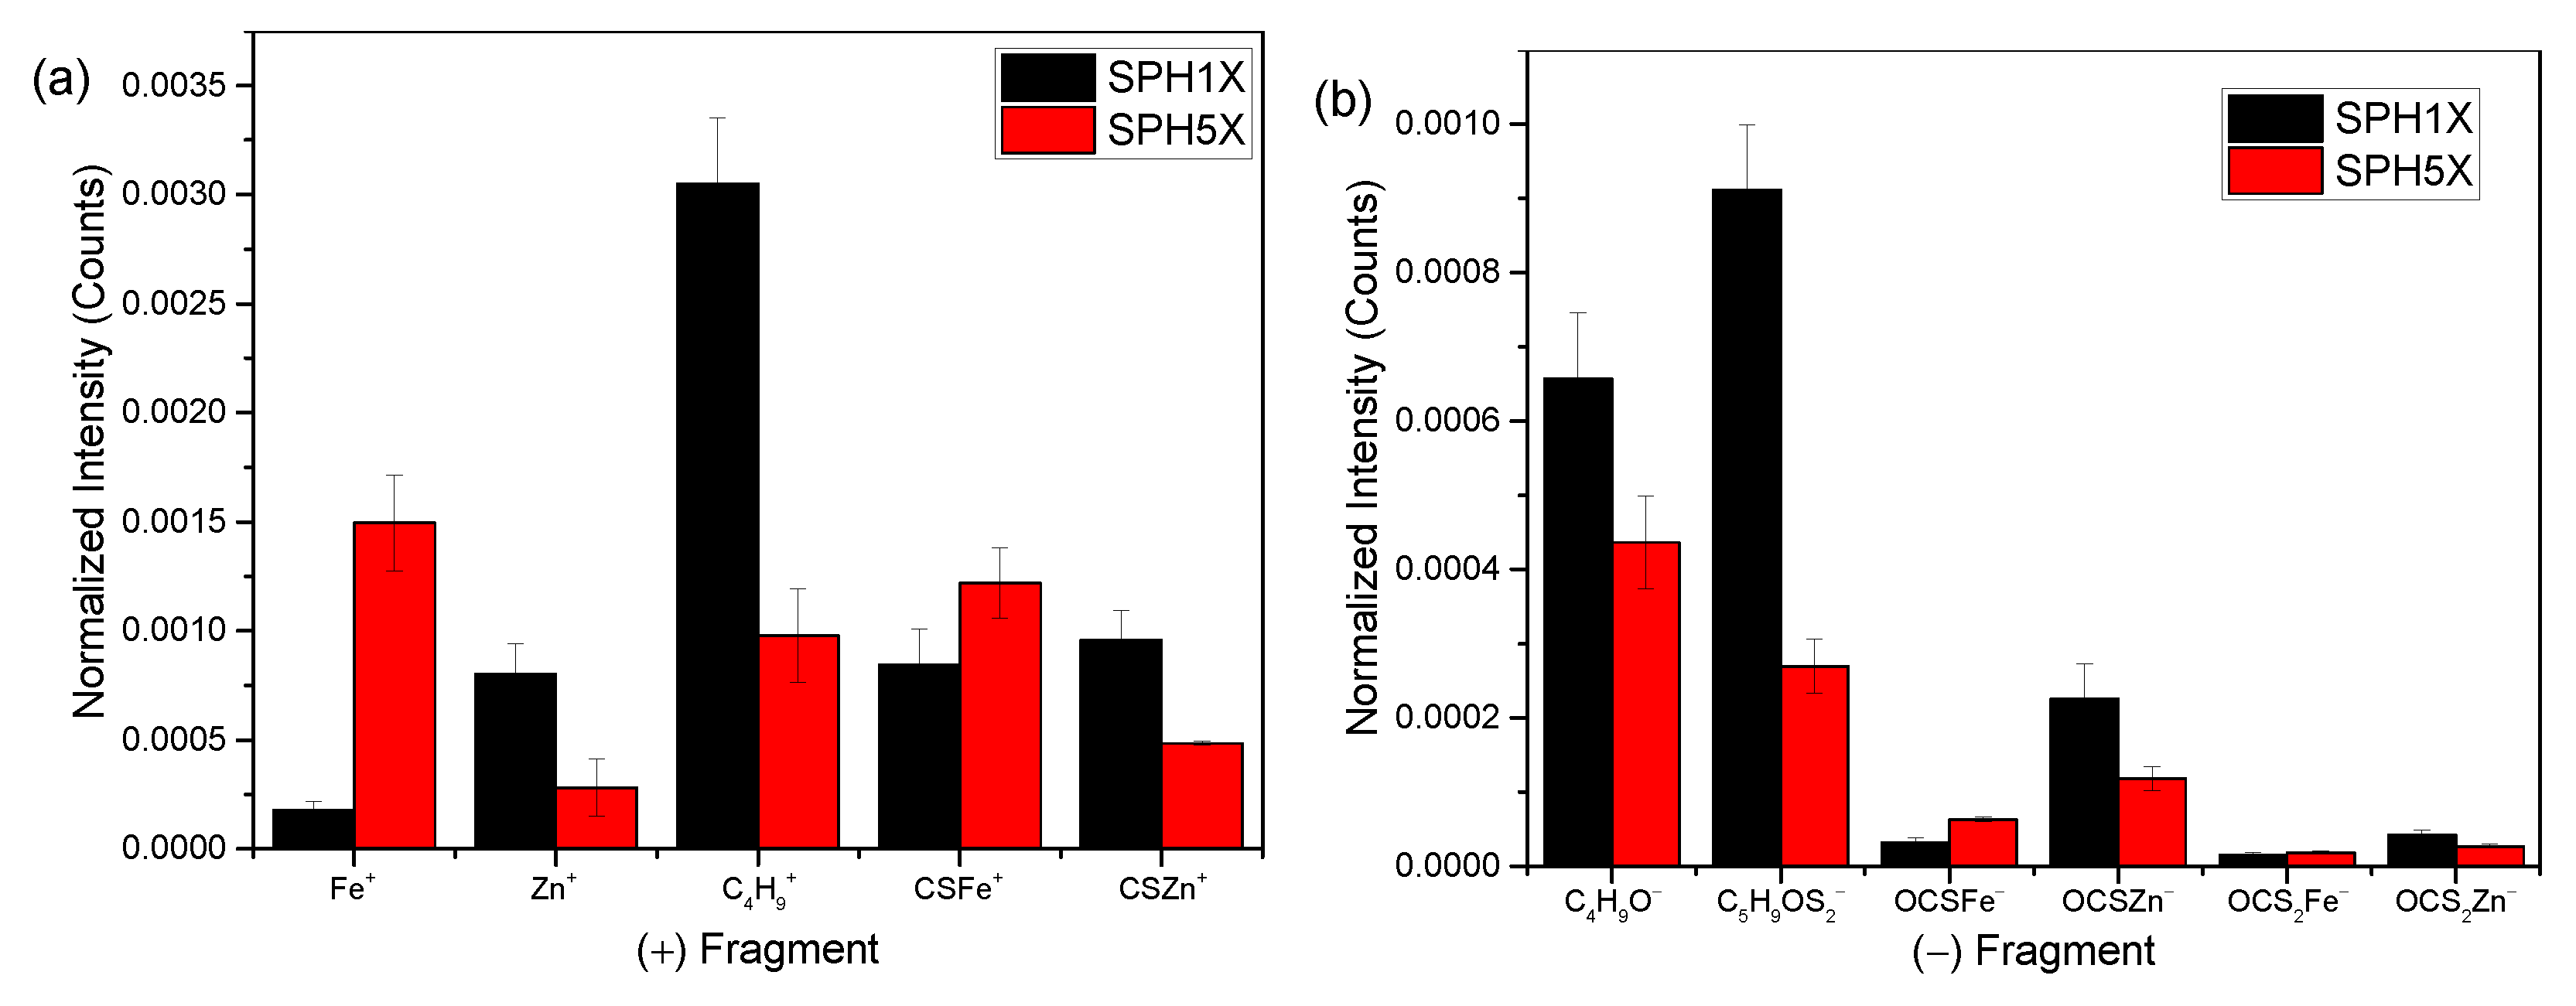
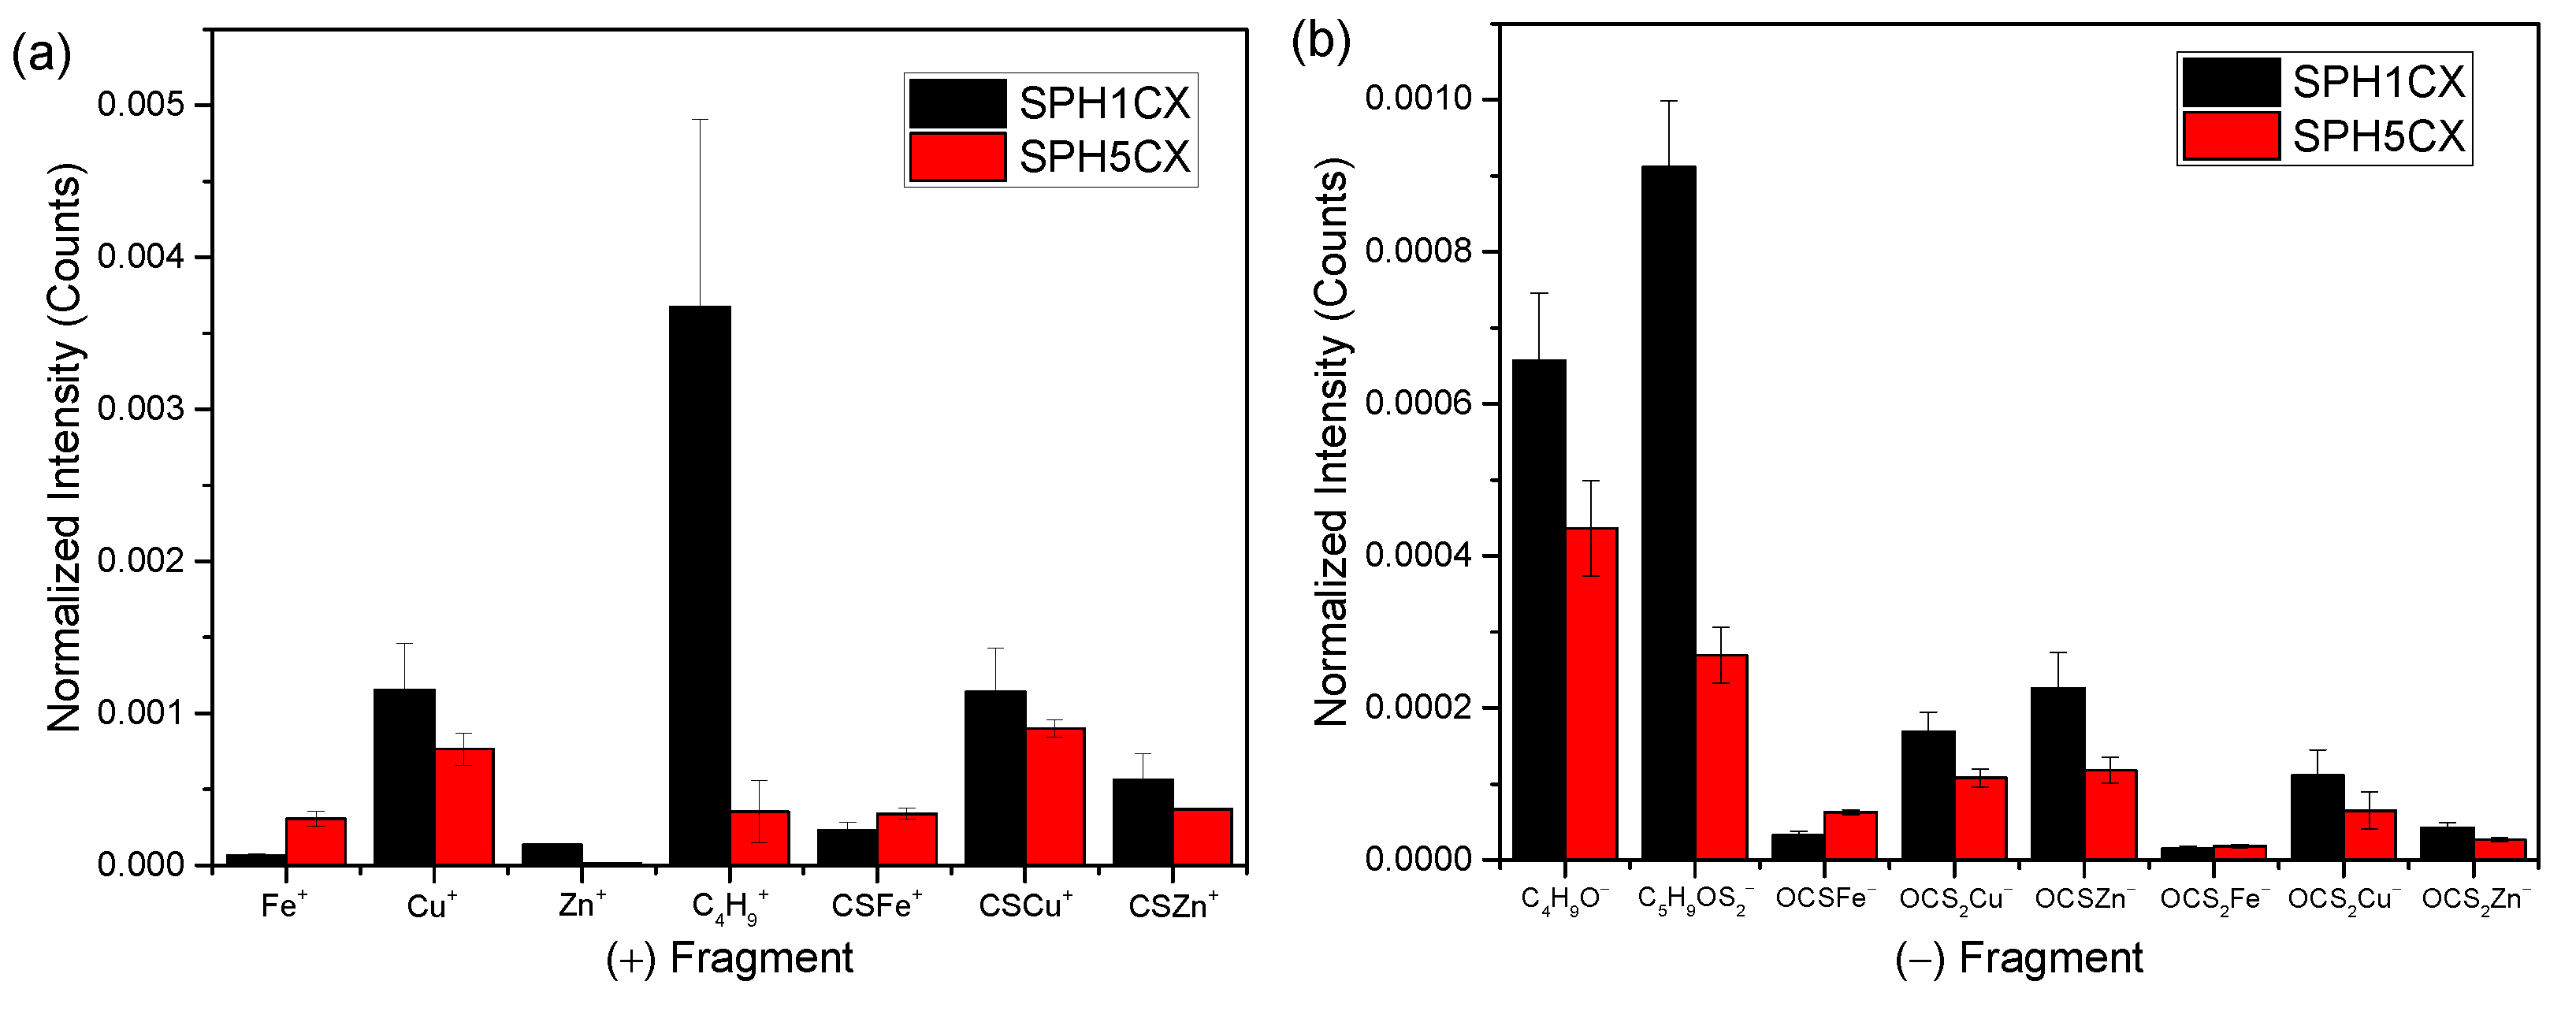
3.2. ToF-SIMS Spectra Analysis

In ToF-SIMS analysis, a small number of primary ions (<1013 cm−2) are injected into the material surface. The ToF-SIMS mass spectra are obtained by collecting secondary ions from 1–2 nm of materials surface. Its detection limit is at the ppm–ppb level [34]. Mass spectrometry can provide structural information and two-dimensional and three-dimensional distribution information for materials. In this study, a pulsed 30 keV Bi3+ primary ion beam was used to collect mass spectra of the sphalerite/marmatite samples surface, to identify the active sites for xanthate on sphalerite/marmatite.
Figure 3a–e shows the positive-ion mass spectra in the mass range 112–157 m/z of marmatite. Xanthate addition led to the formation of CSFe+ and CSZn+ fragment ions on the marmatite surface. The Cu-activated marmatite surface was enriched with fragment ions such as CSFe+, CSCu+, CSZn+, CS65Cu+, Cu2S+, Cu2HS+, ZnCuH2S+, and Cu3S+ after xanthate absorption.
Figure 3f–n shows the negative-ion mass spectra in the mass range 112–157 m/z of marmatite. The results show that xanthate addition led to the marmatite surface enriched with OCSFe, OCSZn, OCS2Fe, C4H9OCS2, and OCS2Zn fragment ions. The Cu-activated marmatite surface was enriched with OCSFe, OCSCu, OCSZn, OCS2Fe, OCS2Cu, C4H9OCS2, and OCS2Zn fragment ions after xanthate adsorption.
Figure 3a–n shows that xanthate can be adsorbed on marmatite surface with or without Cu activation. It can interact with Zn, Fe, and Cu to form the corresponding metal xanthates. We also detected products similar to those observed for marmatite in the ToF-SIMS mass spectra of the sphalerite. Previous studies have clarified the role of xanthate interactions with Zn and Cu, and Figure 3a–n confirms these previous observations. The results of this work show that xanthate interacts with Fe in the crystal of marmatite.
Marmatite surface has higher intensity of fragment ion peaks from iron xanthate (CSFe+, OCSFe, and OCS2Fe) and zinc xanthate (CSZn+, OCSZn, and OCS2Zn) than Cu-activated marmatite surface after xanthate absorption. However, Cu-activated marmatite surface has higher intensity of fragment ion peaks from xanthate (C4H9+, C4H9O, and C4H9OCS2) than marmatite surface after xanthate absorption. In addition, the fragment ion peaks from copper xanthate (CSCu+, OCSCu+, and OCS2Cu+) were detected on the Cu-activated marmatite surface after xanthate absorption. This is in agreement with the experimental result that the xanthate adsorption capacity of the Cu-activated marmatite surface was greater than that of the marmatite surface (Figure 1).
These results show that for Cu-activated marmatite, xanthate preferentially interacts with surface Cu, and the interactions are stronger than those with Fe in the crystal. We also detected the C2S2 from dixanthogen. Dixanthogen adsorption on the marmatite surface is therefore possible.
After xanthate adsorption on the Cu-activated marmatite, fragment ions (Cu2S+, Cu2HS+, ZnCuH2S+, Cu3S+, and CuS2) from Cu–S compounds were detected. The intensities of these fragment ions were much weaker than those of fragment ions from Cu-activated marmatite without xanthate addition. This is probably because these Cu–S fragment ions originated from different Cu–S compounds, or Cu–S compounds were covered by xanthate. In addition, the ToF-SIMS matrix may affect the strengths of these fragment ions.
Figure 4 shows semi-quantitative results for surface fragment ions for xanthate absorbed sphalerite/marmatite. The results show that the Zn+, C4H9+, CSZn+, C4H9O, C4H9OCS2, OCSZn, and OCS2Zn from the sphalerite after xanthate addition were stronger than those from the marmatite, i.e., Fe+, OCSFe, and OCS2Fe were weaker. This indicates that xanthate adsorption on the surface of sphalerite is higher than that on marmatite. This is consistent with the results shown in Figure 1. Iron xanthate adsorption is higher and zinc xanthate adsorption is lower because there is more Fe and less Zn on the surface of marmatite.
Figure 5 shows the semi-quantitative results for surface fragment ions from Cu-activated sphalerite/marmatite after xanthate addition. The results show that the surface Zn+, Cu+, C4H9+, CSCu+, CSZn+, C4H9O, C4H9OCS2, OCSCu, OCSZn, OCS2Cu, and OCS2Zn ions from Cu-activated sphalerite after xanthate addition were stronger than those from Cu-activated marmatite; the Fe+, OCSFe, and OCS2Fe ions were weaker. This indicates that more xanthate was adsorbed on the surface of Cu-activated sphalerite than on Cu-activated marmatite. This is in agreement with the results shown in Figure 1.
We also detected Zn+, CSZn+, OCSZn, and OCS2Zn on the surfaces of Cu-activated sphalerite/marmatite. However, it is generally considered that Cu activation of a sphalerite surface involves Cu ions replacing Zn in the crystal lattice [35,36]. Therefore, Cu may not completely replace Zn in the sphalerite/marmatite surface layer 1–2 nm.
The study by Gerson et al. [37] showed that after reaction of Cu and sphalerite for 15 min, less than 40% of Zn was replaced by Cu, even in the outermost layer of sphalerite. The Cu+, OCSCu, and OCS2Cu ions on the surface of Cu-activated marmatite were weaker than those for Cu-activated sphalerite. This indicates that smaller amounts of Cu and copper xanthate were adsorbed on the surface of marmatite.
Chen et al. [38] performed density functional theory calculations and reported that Fe on sphalerite favors the replacement of Cu with Zn. The number of sites for exchange of Cu and Zn decreases because Fe on the sphalerite surface cannot be replaced by Cu. It is therefore considered that Cu and copper xanthate adsorption are lower on the surface of marmatite because Fe occupies sites for exchange of Cu and Zn.
The results in Figure 3 show that xanthate will interact with Fe on the surface of marmatite. Figure 4 and Figure 5 show that the presence of Fe is not conducive to xanthate adsorption because Fe occupies Cu and Zn exchange sites. Figure 1 and Figure 2 show that Fe is unfavorable for xanthate adsorption and sphalerite flotation. We can therefore infer that the interactions between xanthate and Fe are weaker than those between xanthate and Zn or Cu. This makes xanthate adsorption on the marmatite surface more difficult.

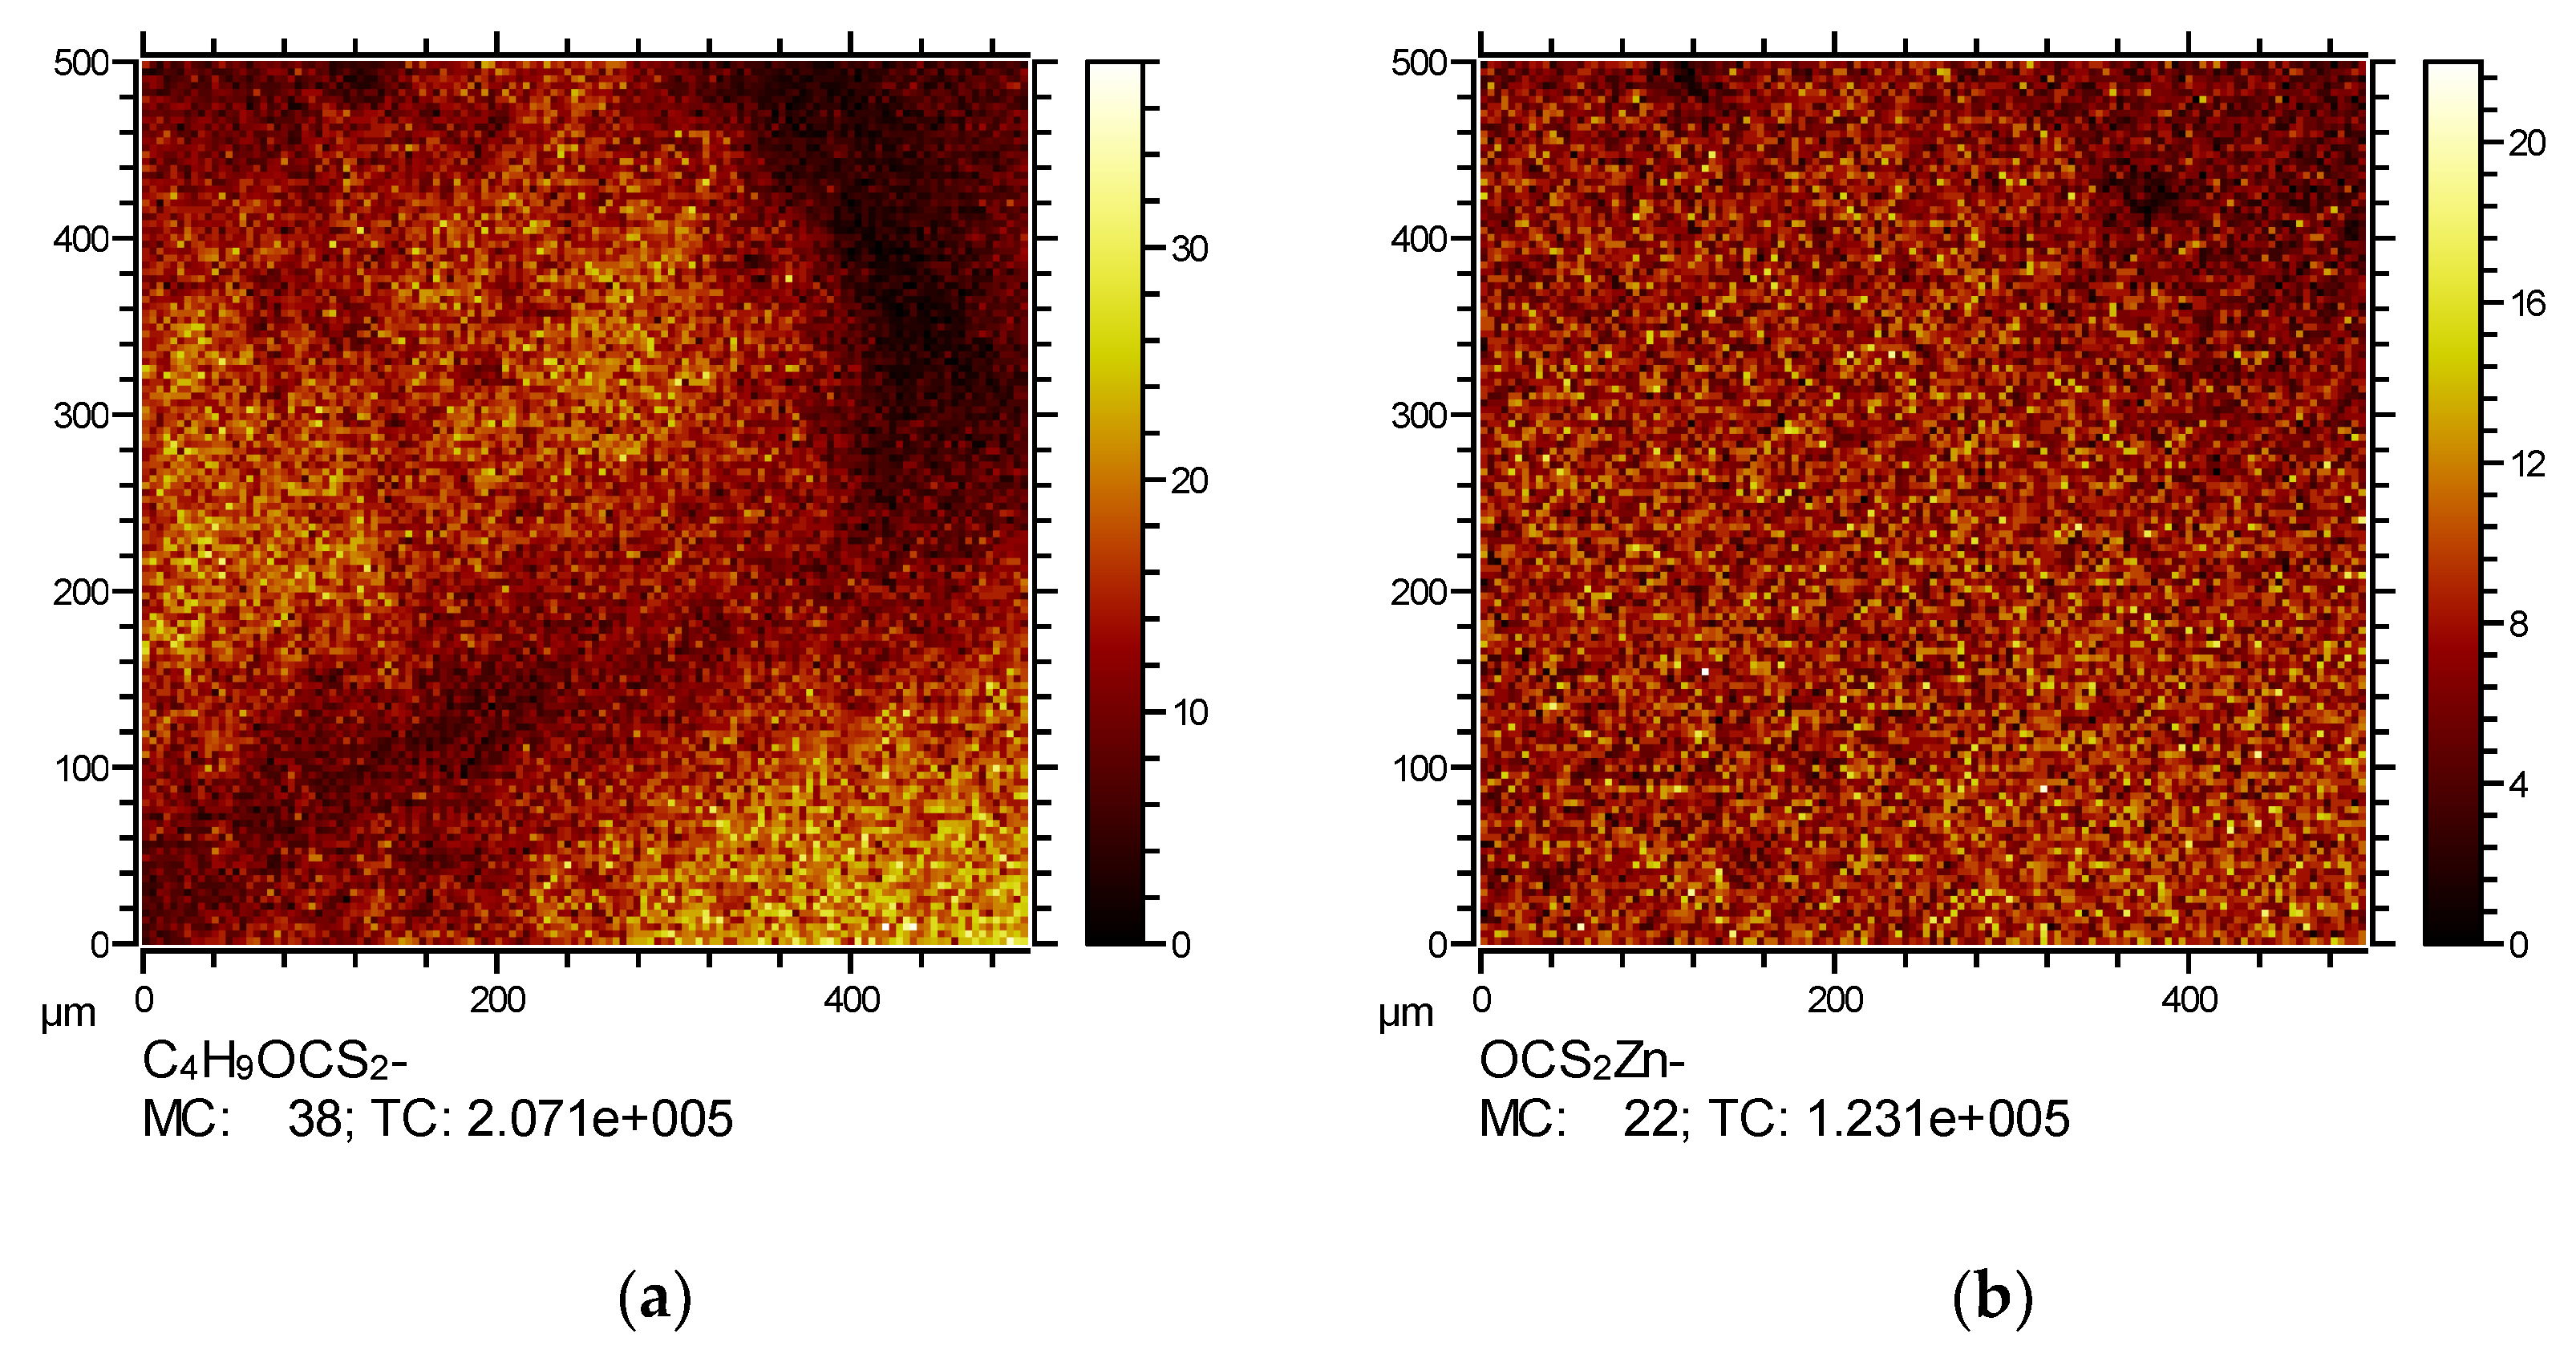
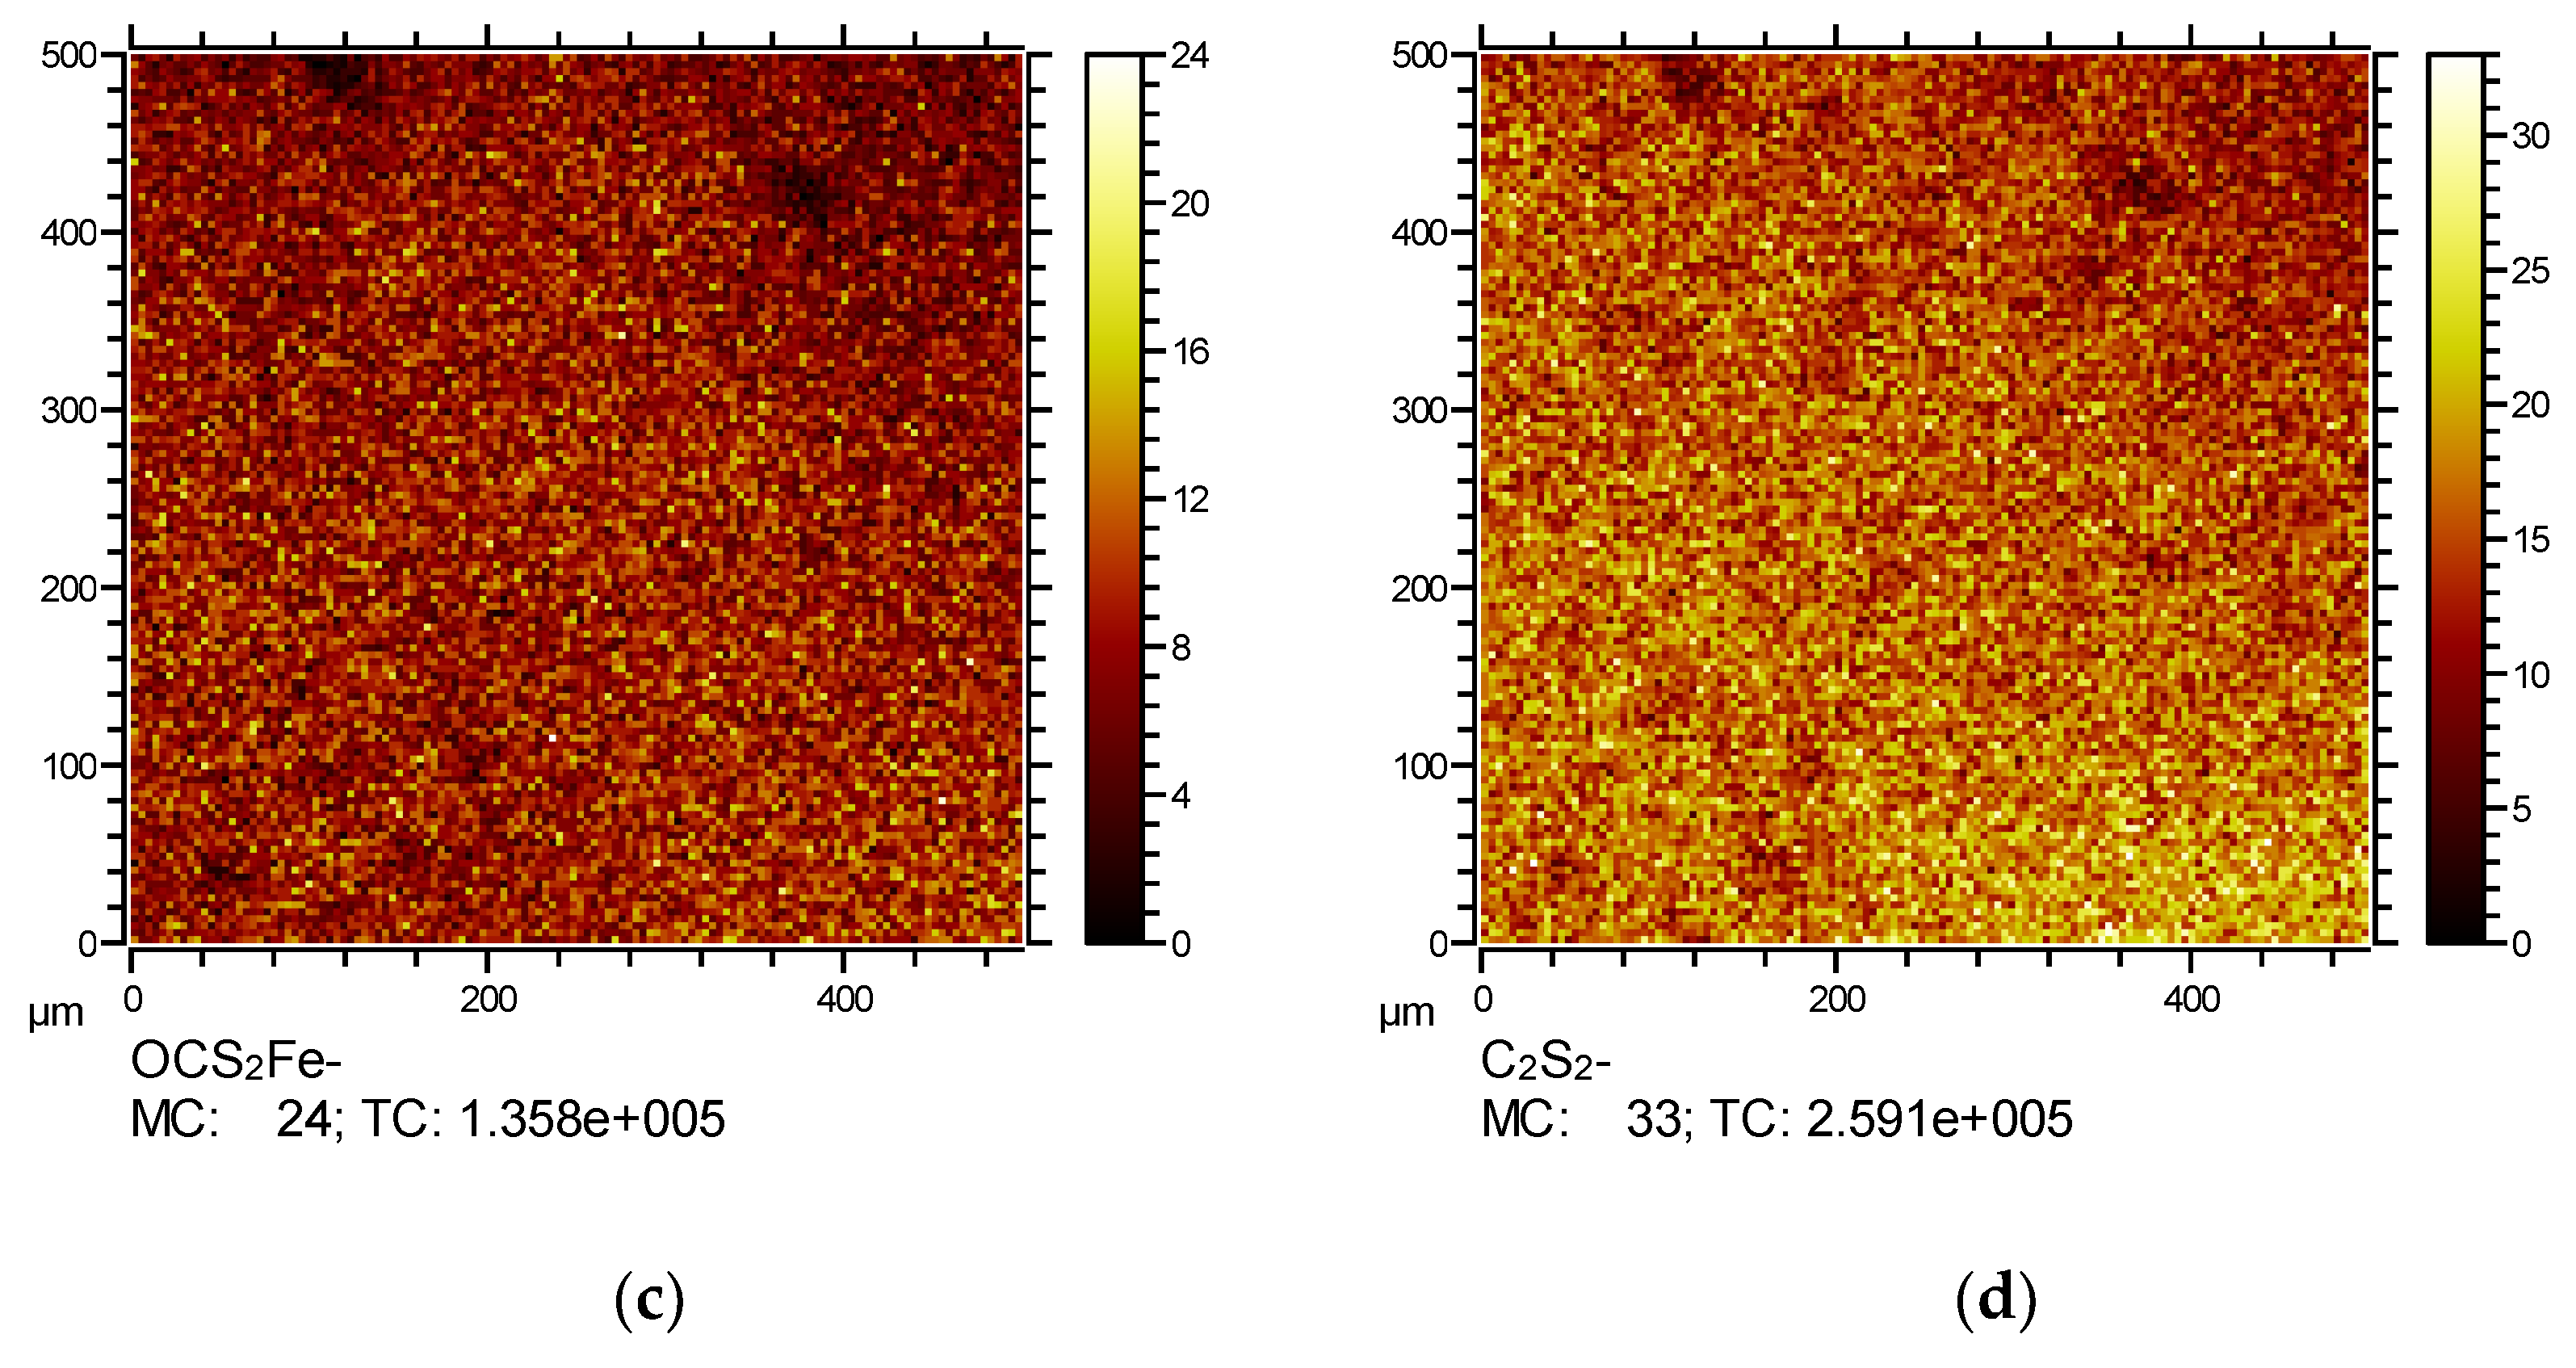
3.3. ToF-SIMS Imaging Analysis

Figure 6 shows the ToF-SIMS negative-ion images of xanthate absorbed marmatite surface at pH 6.5. In the 500 × 500 μm2 analysis area, the fragment ion C4H9OCS2 from xanthate is bright (higher distribution) in some areas, and dark (lower distribution) in others. This indicates uneven xanthate adsorption on the unactivated marmatite. The image of the OCS2Fe fragment ion from iron xanthate is similar to that of the OCS2Zn fragment ion from zinc xanthate, and most areas are of the same brightness. This shows that zinc xanthate and iron xanthate have similar, uniform distributions, and xanthate is not adsorbed only in the form of metal xanthates. The distribution of C2S2 from dixanthogen is different from that of C4H9OCS2, which further confirmed that dixanthogen was adsorbed on the marmatite surface.
Figure 7 shows the ToF-SIMS negative-ion images of Cu-activated marmatite surface after interaction with xanthate at pH 6.5. In the 500 × 500 μm2 analysis area, the C4H9OCS2 fragment ion derived from xanthate has an incompletely uniform distribution. However, contrary to the results shown in Figure 3, C4H9OCS2, OCS2Fe, OCS2Cu, OCS2Zn, CuS2, and C2S2 have similar spatial distributions. This indicates that after Cu activation of marmatite, different types of xanthate adsorbent on the surface have similar distributions.

4. Conclusions

In this work, the active sites and species involved in xanthate adsorption on sphalerite/marmatite surfaces were studied using adsorption capacity measurements, single mineral flotation, and ToF-SIMS analysis. The effects of Fe concentration on the xanthate adsorption capacity, Cu activation, and flotation response of sphalerite were determined. The following conclusions can be drawn.
(1) At pH 6.5 without addition of copper sulfate, the xanthate adsorption capacity on the sphalerite was five times that for marmatite. After Cu activation, the amount of xanthate adsorbed on sphalerite was 2.5 times that for marmatite. The effect of Cu activation on the xanthate adsorption capacity of marmatite was greater than that for sphalerite.
(2) Xanthate reacted with Zn, Fe, and Cu to generate the corresponding metal xanthates. A major discovery was that xanthate can interact with Fe atoms in the crystal of sphalerite/marmatite, as well as with Zn and Cu on the surface. For Cu-activated sphalerite/marmatite, there were fragment ions (C4H9+, C4H9O, and C4H9OCS2) from xanthate, and fragment ions (CSCu+, OCSCu+, and OCS2Cu+) from copper xanthate. We detected C2S2 fragment ions from dixanthogen, and dixanthogen may have been adsorbed on the surface of marmatite.
(3) After Cu activation, xanthate preferentially interacted with surface Cu, which is more potent than Fe in the crystal of sphalerite/marmatite. The interaction between xanthate and Fe is weaker than that between xanthate and Zn or Cu. This makes xanthate adsorption on the marmatite surface more difficult than sphalerite surface. The amounts of Cu and copper xanthate adsorbed on the marmatite surface were lower than those on the sphalerite surface, because Fe occupies Cu and Zn exchange sites.
These results help to address the long-standing controversy regarding the products and mechanisms of xanthate adsorption on Fe-bearing sphalerite surfaces.

Author Contributions

Conceptualization, H.L., J.D., and S.L.; data curation, H.L. and W.C.; formal analysis, H.L., J.D., W.C., S.L., and L.H.; funding acquisition, J.D.; investigation, J.D. and S.L.; methodology, H.L. and L.H.; project administration, J.D.; resources, W.C.; validation, H.L. and J.D.; writing–original draft, H.L., J.D., and S.L.; writing–review and editing, J.D.; G.F., and H.X.

Funding

This research was funded by National Natural Science Foundation of China (51764022 & 51404119), Fok Ying Tong Education Foundation (161046), China Postdoctoral Science Foundation (2018M632810), and Open Project of State Key Laboratory of Mineral Processing Science and Technology (BGRIMM-KJSKL-2017-15), and Open Project of Key Laboratory of Biohydrometallurgy, Ministry of Education, Central South University (MOEKLB1706).

Acknowledgments

The authors would like to acknowledge the National Natural Science Foundation of China, Fok Ying Tung Education Foundation, and China Postdoctoral Science Foundation. Last but not least, the authors would like to thank the Zhengzhou University, Kunming University of Science and Technology, Beijing General Research Institute of Mining & Metallurgy, and Central South University in providing the research facilities to execute this research. We sincerely thank Helen McPherson, from Liwen Bianji, Edanz Editing (www.liwenbianji.cn/ac), for editing the English text of a draft of this manuscript.

Conflicts of Interest

The authors declare no conflict of interest.

References

  1. Fontboté, L.; Kouzmanov, K.; Chiaradia, M.; Pokrovski, G.S. Sulfide minerals in hydrothermal deposits. Elements 2017, 13, 97–103. [Google Scholar] [CrossRef]
  2. Deng, J.-S.; Mao, Y.-B.; Wen, S.-M.; Liu, J.; Xian, Y.-J.; Feng, Q.-C. New influence factor inducing difficulty in selective flotation separation of Cu-Zn mixed sulfide minerals. Int. J. Miner. Metall. Mater. 2015, 2, 111–115. [Google Scholar] [CrossRef]
  3. Thella, J.; Farrokhpay, S.; Nguyen, A.V. The influence of water quality on sulfide mineral flotation-a review. In Proceedings of the Asia Pacific Confederation of Chemical Engineering Congress 2015: APCChE 2015, Incorporating CHEMECA 2015, Melbourne, Australia, 27 September–1 October 2015; Engineers Australia: Barton, Australia, 2015; pp. 2405–2408. [Google Scholar]
  4. Nemchinova, L.; Zimin, A. Thermomechanical aspect of selective flotation of sphalerite and pyrite. Eurasian Min. 2015, 1, 19. [Google Scholar]
  5. Deng, J.; Lei, Y.; Wen, S.; Chen, Z. Modeling interactions between ethyl xanthate and Cu/Fe ions using DFT/B3LYP approach. Int. J. Miner. Process. 2015, 140, 43–49. [Google Scholar] [CrossRef]
  6. Liu, J.; Wen, S.; Wang, Y.; Deng, J.; Chen, X. Transition state search study on the migration of Cu absorbed on the S sites of sphalerite (110) surface. Int. J. Miner. Process. 2016, 147, 28–30. [Google Scholar] [CrossRef]
  7. Sarvaramini, A.; Larachi, F.; Hart, B. Collector attachment to lead-activated sphalerite–Experiments and DFT study on pH and solvent effects. Appl. Surf. Sci. 2016, 367, 459–472. [Google Scholar] [CrossRef]
  8. Deng, J.; Wen, S.; Xian, Y.; Liu, J.; Bai, S. New discovery of unavoidable ions source in chalcopyrite flotation pulp: Fluid inclusions. Miner. Eng. 2013, 42, 22–28. [Google Scholar] [CrossRef]
  9. Deng, J.; Wen, S.; Liu, J.; Xian, Y.; Wu, D.; Bai, S. New source of unavoidable ions in bornite flotation aqueous solution: Fluid inclusions. Ind. Eng. Chem. Res. 2013, 52, 4895–4901. [Google Scholar] [CrossRef]
  10. Deng, J.-S.; Wen, S.-M.; Wu, D.-D.; Liu, J.; Zhang, X.-L.; Shen, H.-Y. Existence and release of fluid inclusions in bornite and its associated quartz and calcite. Int. J. Miner. Metall. Mater. 2013, 20, 815–822. [Google Scholar] [CrossRef]
  11. Mohseni, M.; Abdollahi, M.; Poursalehi, R.; Khalesi, M.R. An insight into effect of surface functional groups on reactivity of Sphalerite (110) surface with Xanthate collector: A DFT study. J. Min. Environ. 2017, 9, 431–439. [Google Scholar]
  12. Long, X.; Chen, Y.; Chen, J.; Xu, Z.; Liu, Q.; Du, Z. The effect of water molecules on the thiol collector interaction on the galena (PbS) and sphalerite (ZnS) surfaces: A DFT study. Appl. Surf. Sci. 2016, 389, 103–111. [Google Scholar] [CrossRef]
  13. Liu, J.; Wang, Y.; Luo, D.; Chen, L.; Deng, J. Comparative study on the copper activation and xanthate adsorption on sphalerite and marmatite surfaces. Appl. Surf. Sci. 2018, 439, 263–271. [Google Scholar] [CrossRef]
  14. Cook, N.J.; Ciobanu, C.L.; Pring, A.; Skinner, W.; Shimizu, M.; Danyushevsky, L.; Saini-Eidukat, B.; Melcher, F. Trace and minor elements in sphalerite: A LA-ICPMS study. Geochim. Cosmochim. Acta 2009, 73, 4761–4791. [Google Scholar] [CrossRef]
  15. Pattrick, R.A.; Mosselmans, J.F.W.; Charnock, J.M. An X-ray absorption study of doped sphalerites. Eur. J. Mineral. 1998, 10, 239–250. [Google Scholar] [CrossRef]
  16. Benedetto, F.D.; Andreozzi, G.; Bernadini, G.; Borgheresi, M.; Caneschi, A.; Cipciani, C.; Gatteschi, D.; Romanelli, M. Short range order of Fe2+ impurities, isolated and in pairs. ZnS and CdS studies by the Mossbauer effect. Phys. Chem. Miner. 2005, 32, 339–348. [Google Scholar] [CrossRef]
  17. Wright, K.; Gale, J.D. A first principles study of the distribution of iron in sphalerite. Geochim. Cosmochim. Acta 2010, 74, 3514–3520. [Google Scholar] [CrossRef]
  18. Quast, K.; Hobart, G. Marmatite depression in galena flotation. Miner. Eng. 2006, 19, 860–869. [Google Scholar] [CrossRef]
  19. Harmer, S.L.; Mierczynska-Vasilev, A.; Beattie, D.A.; Shapter, J.G. The effect of bulk iron concentration and heterogeneities on the copper activation of sphalerite. Miner. Eng. 2008, 21, 1005–1012. [Google Scholar] [CrossRef]
  20. Lepetit, P.; Bente, K.; Doering, T.; Luckhaus, S. Crystal chemistry of Fe-containing sphalerites. Phys. Chem. Miner. 2003, 30, 185–191. [Google Scholar] [CrossRef]
  21. Chen, Y.; Chen, J.; Guo, J. A DFT study on the effect of lattice impurities on the electronic structures and floatability of sphalerite. Miner. Eng. 2010, 23, 1120–1130. [Google Scholar] [CrossRef]
  22. Szczypa, J.; Solecki, J.; Komosa, A. Effect of surface oxidation and iron contents on xanthate ions adsorption of synthetic sphalerites. Int. J. Miner. Process. 1980, 7, 151–157. [Google Scholar] [CrossRef]
  23. Boulton, A.B. Improving Sulphide Mineral Flotation Selectivity Against Iron Sulphide Gangue. Ph.D. Thesis, University of South Australia, Adelaide, Australia, 2002. [Google Scholar]
  24. Gigowski, B.; Vogg, A.; Wierer, K.; Dobias, B. Effect of Fe-lattice ions on adsorption, electrokinetic, calorimetric and flotation properties of sphalerite. Int. J. Miner. Process. 1991, 33, 103–120. [Google Scholar] [CrossRef]
  25. Chandra, A.P.; Gerson, A.R. A review of the fundamental studies of the copper activation mechanisms for selective flotation of the sulfide minerals, sphalerite and pyrite. Adv. Colloid Interface Sci. 2009, 145, 97–110. [Google Scholar] [CrossRef] [PubMed]
  26. Boulton, A.; Fornasiero, D.; Ralston, J. Effect of iron content in sphalerite on flotation. Miner. Eng. 2005, 18, 1120–1122. [Google Scholar] [CrossRef]
  27. Yu, R.; Qiu, G.; Hu, Y.; Qin, W. Adsorption mechanism of ethyl xanthate on marmatite. Metal Mine 2004, 29–31. (In Chinese) [Google Scholar]
  28. Zhang, Q.; Hu, Y.; Xu, J.; Chen, T. Study of the marmatite collectorless flotation. Nonferrous Met. Mieral Process. Sect. 2005, 19–21. (In Chinese) [Google Scholar]
  29. Zhang, Q.; Yue-Hua, H.U.; Guo-Hua, G.U.; Jing, X.U. Mechanism of Cu2+ ion activation flotation of marmatite in absence and presence of ethyl xanthate. Chin. J. Nonferrous Met. 2004, 14, 676–680. (In Chinese) [Google Scholar]
  30. Pattrick, R.A.D.; England, K.E.R.; Charnock, J.M.; Mosselmans, J.F.W. Copper activation of sphalerite and its reaction with xanthate in relation to flotation: An X-ray absorption spectroscopy (reflection extended X-ray absorption fine structure) investigation. Int. J. Miner. Process. 1999, 55, 247–265. [Google Scholar] [CrossRef]
  31. Khmeleva, T.N.; Chapelet, J.K. Depression mechanisms of sodium bisulphite in the xanthate-induced flotation of copper activated sphalerite. Int. J. Miner. Process. 2006, 79, 61–75. [Google Scholar] [CrossRef]
  32. Mikhlin, Y.; Karacharov, A.; Tomashevich, Y.; Shchukarev, A. Interaction of sphalerite with potassium n-butyl xanthate and copper sulfate solutions studied by XPS of fast-frozen samples and zeta-potential measurement. Vacuum 2016, 125, 98–105. [Google Scholar] [CrossRef]
  33. Popov, S.R.; Vučinić, D.R. Floatability and adsorption of ethyl xanthate on copper-activated sphalerite in weakly acidic medium. Colloids Surf. 1990, 47, 81–94. [Google Scholar] [CrossRef]
  34. Sodhi, R.N. Time-of-flight secondary ion mass spectrometry (TOF-SIMS):—Versatility in chemical and imaging surface analysis. Analyst 2004, 129, 483–487. [Google Scholar] [CrossRef] [PubMed]
  35. Sutherland, K.L.; Wark, I.W. Principles of Flotation; Australasian Institute of Mining and Metallurgy: Carlton, Victoria, Australia, 1995. [Google Scholar]
  36. Ejtemaei, M.; Nguyen, A.V. Characterisation of sphalerite and pyrite surfaces activated by copper sulphate. Miner. Eng. 2017, 100, 223–232. [Google Scholar] [CrossRef]
  37. Gerson, A.R.; Lange, A.G.; Prince, K.E.; Smart, R.S.C. The mechanism of copper activation of sphalerite. Appl. Surf. Sci. 1999, 137, 207–223. [Google Scholar] [CrossRef]
  38. Chen, J.; Chen, Y.; Zeng, X.; Li, Y. First principle study of effect of Fe impurity on electronic structure and activation of sphalerite surface. Chin. J. Nonferrous Met. 2009, 19, 1517–1523. (In Chinese) [Google Scholar]
Figure 1. Butyl xanthate (BX) adsorption capacity of sphalerite/marmatite at pH 6.5; concentrations of Cu2+ and BX were 1 × 10⁻⁵ and 1 × 10⁻⁴ mol/L, respectively; the black histogram is for sphalerite (SPH1) and the red histogram is for marmatite (SPH5).
Minerals 09 00205 g001
Figure 2. Flotation recovery of sphalerite/marmatite at pH 6.5 in 220 s; concentrations of Cu2+ and BX are 1 × 10⁻⁵ and 1 × 10⁻⁴ mol/L, respectively; the black histogram is for sphalerite (SPH1) and the red histogram is for marmatite (SPH5).
Minerals 09 00205 g002
Figure 3. Time-of-flight secondary ion mass spectrometry (ToF-SIMS) spectra of marmatite (SPH5) at pH 6.5: (ae) positive-ion mass spectra and (fn) negative-ion mass spectra. The red line is the mass spectra of Cu-activated marmatite surface after BX absorption; the blue line is the mass spectra of BX absorbed marmatite surface; and the orange line is the mass spectra of the Cu-activated marmatite surface; the black line is the mass spectra of marmatite surface.
Minerals 09 00205 g003aMinerals 09 00205 g003bMinerals 09 00205 g003c
Figure 4. Normalized intensity of fragment ions for BX absorbed sphalerite (SPH1)/marmatite (SPH5): (a) positive fragment ions and (b) negative fragment ions; the black histogram is the BX absorbed sphalerite and the red histogram is the BX absorbed marmatite.
Minerals 09 00205 g004
Figure 5. Normalized intensity of surface fragment ions in ToF-SIMS for Cu-activated sphalerite (SPH1)/marmatite (SPH5) after BX addition at pH 6.5: (a) positive fragment ions and (b) negative fragments ions; the black histogram is Cu-activated sphalerite and the red histogram is Cu-activated marmatite.
Minerals 09 00205 g005
Figure 6. ToF-SIMS negative-ion images of BX absorbed marmatite surface at pH 6.5. (a): C4H9OCS2; (b): OCS2Zn; (c): OCS2Fe; (d): C2S2.
Minerals 09 00205 g006aMinerals 09 00205 g006b
Figure 7. ToF-SIMS negative-ion images of Cu-activated marmatite surface after interaction with BX at pH 6.5. (a): C4H9CS2O; (b): OCS2Fe; (c): OCS2Cu; (d): OCS2Zn; (e): CuS2; (f): C2S2.
Minerals 09 00205 g007

