Article

Pore Connectivity Characterization of Lacustrine Shales in Changling Fault Depression, Songliao Basin, China: Insights into the Effects of Mineral Compositions on Connected Pores

1
State Key Laboratory of Petroleum Resources and Prospecting, China University of Petroleum, Beijing 102249, China
2
Unconventional Natural Gas Research Institute, China University of Petroleum, Beijing 102249, China
*
Author to whom correspondence should be addressed.
Minerals 2019, 9(3), 198; https://doi.org/10.3390/min9030198
Submission received: 22 February 2019 / Revised: 14 March 2019 / Accepted: 22 March 2019 / Published: 26 March 2019
(This article belongs to the Special Issue Nanomineralogy)

Abstract

:
Pore connectivity of lacustrine shales was inadequately documented in previous papers. In this work, lacustrine shales from the lower Cretaceous Shahezi Formation in the Changling Fault Depression (CFD) were investigated using field emission scanning electron microscopy (FE-SEM), mercury intrusion capillary pressure (MICP), low pressure gas (CO2 and N2) sorption (LPGA) and spontaneous fluid imbibition (SFI) experiments. The results show that pores observed from FE-SEM images are primarily interparticle (interP) pores in clay minerals and organic matter (OM) pores. The dominant pore width obtained from LPGA and MICP data is in the range of 0.3–0.7 nm and 3–20 nm. The slopes of n-decane and deionized (DI) water SFI are in the range of 0.34–0.55 and 0.22–0.38, respectively, suggesting a mixed wetting nature and better-connected hydrophobic pores than hydrophilic pores in the Shahezi shales. Low pore connectivity is identified by the dominant nano-size pore widths (0.3–20 nm), low DI water SFI slopes (around 0.25), high geometric tortuosity (4.75–8.89) and effective tortuosity (1212–6122). Pore connectivity follows the order of calcareous shale > argillaceous shale > siliceous shale. The connected pores of Shahezi shales is mainly affected by the high abundance and coexistence of OM pores and clay, carbonate minerals host pores.

1. Introduction

Organic-shales and coals are proposed to contain complex pore systems with various pore types, shapes and wide pore size distribution (PSD) ranges [1,2,3,4,5,6,7]. Understanding pore characteristics is essential for assessing shale gas storage capacity and gas transport mechanisms in organic shales [8,9,10,11,12,13]. Pore structure characterization is also the key issue of shale gas resource and coalbed methane assessment [14,15,16,17,18,19,20,21]. The pore characteristics (types, shapes, geometries, PSDs and evolution mechanisms) of gas shales were extensively studied around the world in previous studies by several researchers [1,3,13,14,21,22,23,24,25,26,27,28]. For example, field emission scanning electron microscopy (FE-SEM) [1,7,29], small angle neutron scattering (SANS) [2,24], low pressure gas adsorption (LPGA) and mercury intrusion capillary pressure (MICP) [2,3,9] were used to characterize the pore structure in shales. However, less attention was paid to the connectivity of pore networks in organic shales. Pore connectivity significantly affects the gas flow distance in the shale matrix, and is critical to shale gas development [30]. High pore connectivity may improve the gas flow through the matrix, while low pore connectivity may be the main cause for the rapid decline of the initial shale gas production [24,31,32]. Pore connectivity in shales can be evaluated by various methods [33,34,35,36,37,38,39]. Three dimensional pore system reconstruction by micro- and nano-scale X-ray computed tomography (micro-CT and nano-CT) and focused ion beam-scanning electron microscopy (FIB-SEM) techniques [29,40], the hysteresis loops of LPGA and MICP isotherms [41,42,43,44], the spontaneous fluid imbibition (SFI) features [34,45,46] and the divergence of MICP and nuclear magnetic resonance (NMR) results [47,48], can be used to evaluate pore connectivity in organic shales. Among these methods, SFI is a simple and effective technique, because the SFI process is much faster than diffusion, and only requires monitoring mass change over time [32,34,36,49,50]. The pore connectivity of marine shales in North America and southern China were assessed through SFI experiments [33,45,46]. However, only a few studies documented the pore connectivity of lacustrine shales in Sichuan Basin and Ordos Basin of China [24,48]. Therefore, previous studies on the pore connectivity of lacustrine shale are still inadequate.
Lacustrine shales gas accounts for about 32% of the total recoverable shale gas resources in China [51,52,53]. The lower Cretaceous Shahezi shales were studied as major source rocks for conventional gas resources in Songliao Basin [54,55]. Recently, these shales in the Changling Fault Depression (CFD) have become shale gas exploration targets [48]. Lacustrine shales are significantly distinct from marine shales in terms of the rapid sedimentary environment changes, discontinuous and complex lithofacies association and high concentration of clay minerals [56,57,58]. Recently, shale lithofacies and their impacts on the pore characteristics and pore fractal dimensions of the lacustrine shales in the Shahezi Formation were investigated [58,59]. In this work, the pore connectivity of these shales was evaluated, and the control of the matrix compositions on pore connectivity was further discussed. Our findings are of significance to an understanding of gas transport mechanisms and the impacts of lacustrine shale gas production.
The objectives of this work are to (1) determine the pore structure characteristics (pore type, pore size distribution and pore volume); (2) assess the pore connectivity; (3) and investigate the controls of OM and mineral compositions on the pore connectivity of Shahezi shales. An integrated experiment procedure including total organic carbon contents (TOC), X-ray diffraction (XRD), FE-SEM, MICP, LPGA and SFI (n-decane and deionized water) experiments was conducted in this study.

2. Samples and Experiments
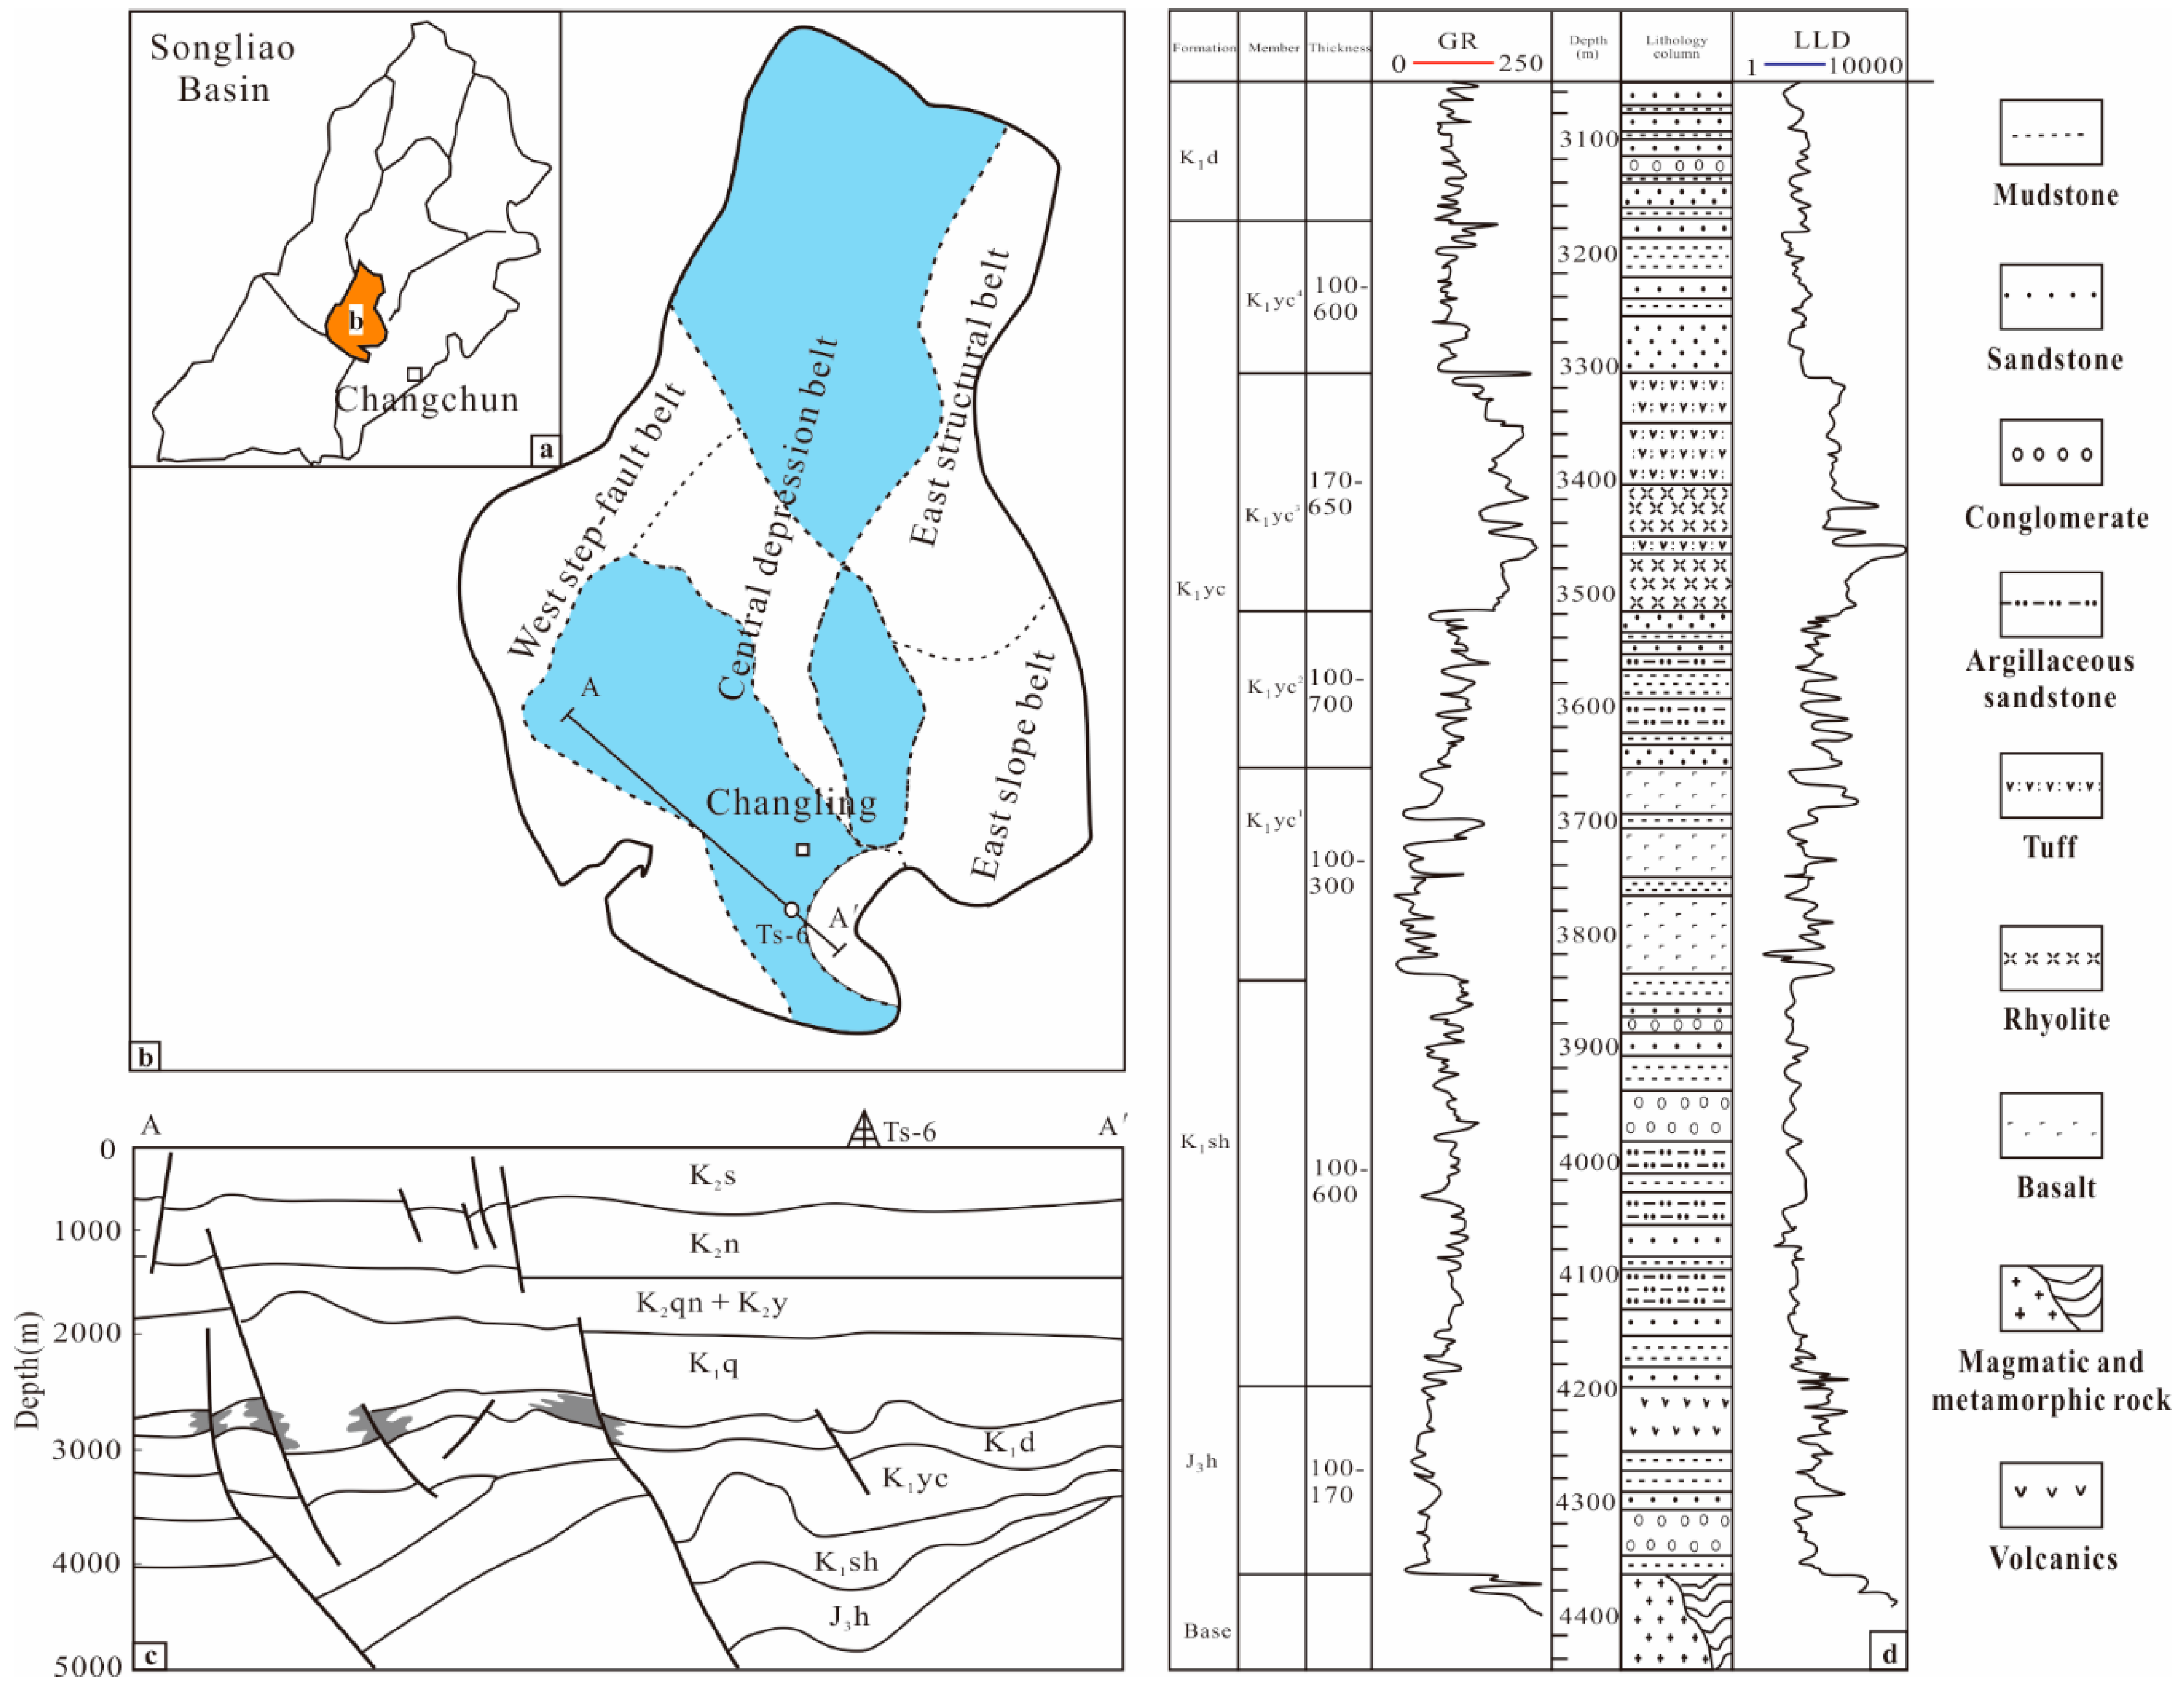
2.1. Samples

In total, six lacustrine shale core samples (about 9.5 cm in diameter and 2–5 cm in length) were collected from the lower Cretaceous Shahezi Formation in Well TS-6, which was drilled in the CFD of Songliao Basin (seen in Figure 1a,b). The CFD can be subdivided into the west step-fault belt, central depression belt, east slope belt and east structural belt based on structural features [60]. The rift stage for the Songliao Basin occurs during the Jurassic-early Cretaceous episode [61]. From bottom to top, the lower Cretaceous strata consist of the Huoshiling Formation (K1h), the Shahezi Formation (K1sh), the Yingcheng Formation (K1y) and the Denglouku Formation (K1d) (Figure 1c,d). Black mudstones and shales in the K1sh and K1y Formations deposited in semi-deep to deep lacustrine environments are the main source rocks of natural gas (with Ro values above 2%) in the study area [58,59,62]. The sample information, including depth and lithofacies, are listed in Table 1. The lithofacies of the selected samples was determined by core logging data of the Jilin oil field Branch, Petrochina.

2.2. Experiments

Each shale core sample was subsampled and prepared for the total organic carbon content (TOC), XRD, FE-SEM, LPGA, MICP and SFI experiments. The subsamples were taken as homogeneous as possible in order to correlate the results.

2.2.1. TOC and XRD

The TOC content was determined by a Leco CS230 carbon/sulfur analyzer (LECO Corporation, St. Joseph, MI, USA). In detail, shale samples were crushed to 100 mesh, treated with hydrochloric acid to remove carbonates and washed with distilled water. After being dried at 70 °C, the TOC values were measured. The bulk XRD mineral compositions were measured on powder samples, which were mixed with ethanol on glass slides for an XRD analysis. The XRD experiments were performed on an X-ray diffractometer (Bruker D8 DISCOVER, Bruker AXS Corporation, Karlsruhe, Germany) using Co Ka-radiation of 45 kV and 35 mA. The quantitative analysis of the bulk mineral compositions and clay minerals was performed on the Bruker customized Topas software.

2.2.2. FE-SEM

FE-SEM imaging was performed on an Argon-ion polished surface of shale samples on a Helios NanoLab 650 FEI SEM (Thermo Fisher Scientific, Waltham, MA, USA). The brick shaped samples (about 1 cm × 1 cm × 0.5 cm) were ion polished on a Hitachi ion milling IM-4000 System (Hitachi, Ltd., Tokyo, Japan) and imaged using an FE-SEM (Zeiss Helios NanoLab 650, FEI, Carl Zeiss, Heidenheim, Germany) equipped with secondary electron (SE) and backscattered electron (BSE) detectors. The SE mode detects the topographic variation, and the BSE mode shows the compositional variation [1]. The accelerating voltages were 1–10 kV. The working distances from detector to samples were 3–7 mm in this FE-SEM system.

2.2.3. MICP

The MICP experiments were performed on shale core plugs (about 2.54 cm in diameter) on a mercury porosimeter (Micromeritics AutoPore 9510, Micromeritics, Atlanta, GA, USA) with the maximum intrusion pressure set to 400 MPa. Before the MICP test, each shale sample was oven-dried at 80 °C for 24 h to remove moisture. With increasing pressure, the mercury volumes are recorded; conversely, the intruded mercury will extrude from the sample when the pressure drops. The pore throat is obtained based on the Washburn equation, assuming a specific pore cylindrical shape. The inputting physical constants of mercury include the surface tension γ = 485 mN/m and the contact angle θ = 130°.

2.2.4. LPGA

The LPGA (N2 and CO2) experiments were conducted on a Micromeritics ASAP-2460 System (Micromeritics, Atlanta, GA, USA). The samples were crushed to 100 mesh and degassed at 110 °C for 12 h. Nitrogen and carbon dioxide physisorption isotherms were obtained at 77.3 K and 273.1 K, respectively. The micro-pore volumes and surface areas were determined from low pressure CO2 adsorption branches using a DFT (Density Functional Theory) model. The BJH (Barrett-Joyner-Halenda) pore volumes, BET (Brunauer-Emmett-Teller) surfaces areas and average pore sizes were determined by low pressure N2 adsorption data.

2.2.5. SFI

The SFI experiments were performed following the procedure proposed by Gao and Hu [63]. Briefly, 1 cm-sized cubic samples were cut from the shale cores at each depth intervals provided in Table 1. Two subsamples for each shale sample were used for the DI-water and n-decane imbibition measurements. The SFI direction was parallel to the laminae of the shales. Except for the bottom and top sides, the other four sides were coated with epoxy. Following this, the epoxied cubes were oven-dried at 80 °C for 12 h and cooled to room temperature (23 ± 0.5 °C). For the DI water and n-decane SFI experiments, the bottom surface was merged at about 1 mm in the fluids. The weight change was automatically recorded by a high precision electric balance. In the homogeneous porous materials with the capillary as the main forces for the SFI, the slopes of the log total imbibition versus log imbibition time curves can be used to assess the pore connectivity [63]. The DI water and n-decane SFI can be used to investigate the connectivity of hydrophilic and hydrophobic pores, respectively [61,64,65].

3. Results

3.1. Mineral Compositions and TOC Content

The detailed sample information, including lithofacies, TOC contents and mineral composition, was listed in Table 1. Quartz and clay mineral contents are dominant in these samples, accounting for over 70 wt % in the Shahezi shale samples. The clay minerals are the most significant mineral components. The clay minerals mainly consist of mixed illite-smectite (66 wt %–79 wt %), illite (13 wt %–23 wt %) and chlorite (9 wt %–13 wt %) in our sample set. The dolomite, pyrite and siderite contents are relatively low. Three lithofacies, including argillaceous shale, siliceous shale and calcareous shale, are classified on the basis of the core logging of the Jilin oil field Branch and verified by bulk XRD results. The TOC contents range from 1.09 wt % to 4.75 wt %, with an average of 2.841 wt % in the samples.

3.2. Pore characterization

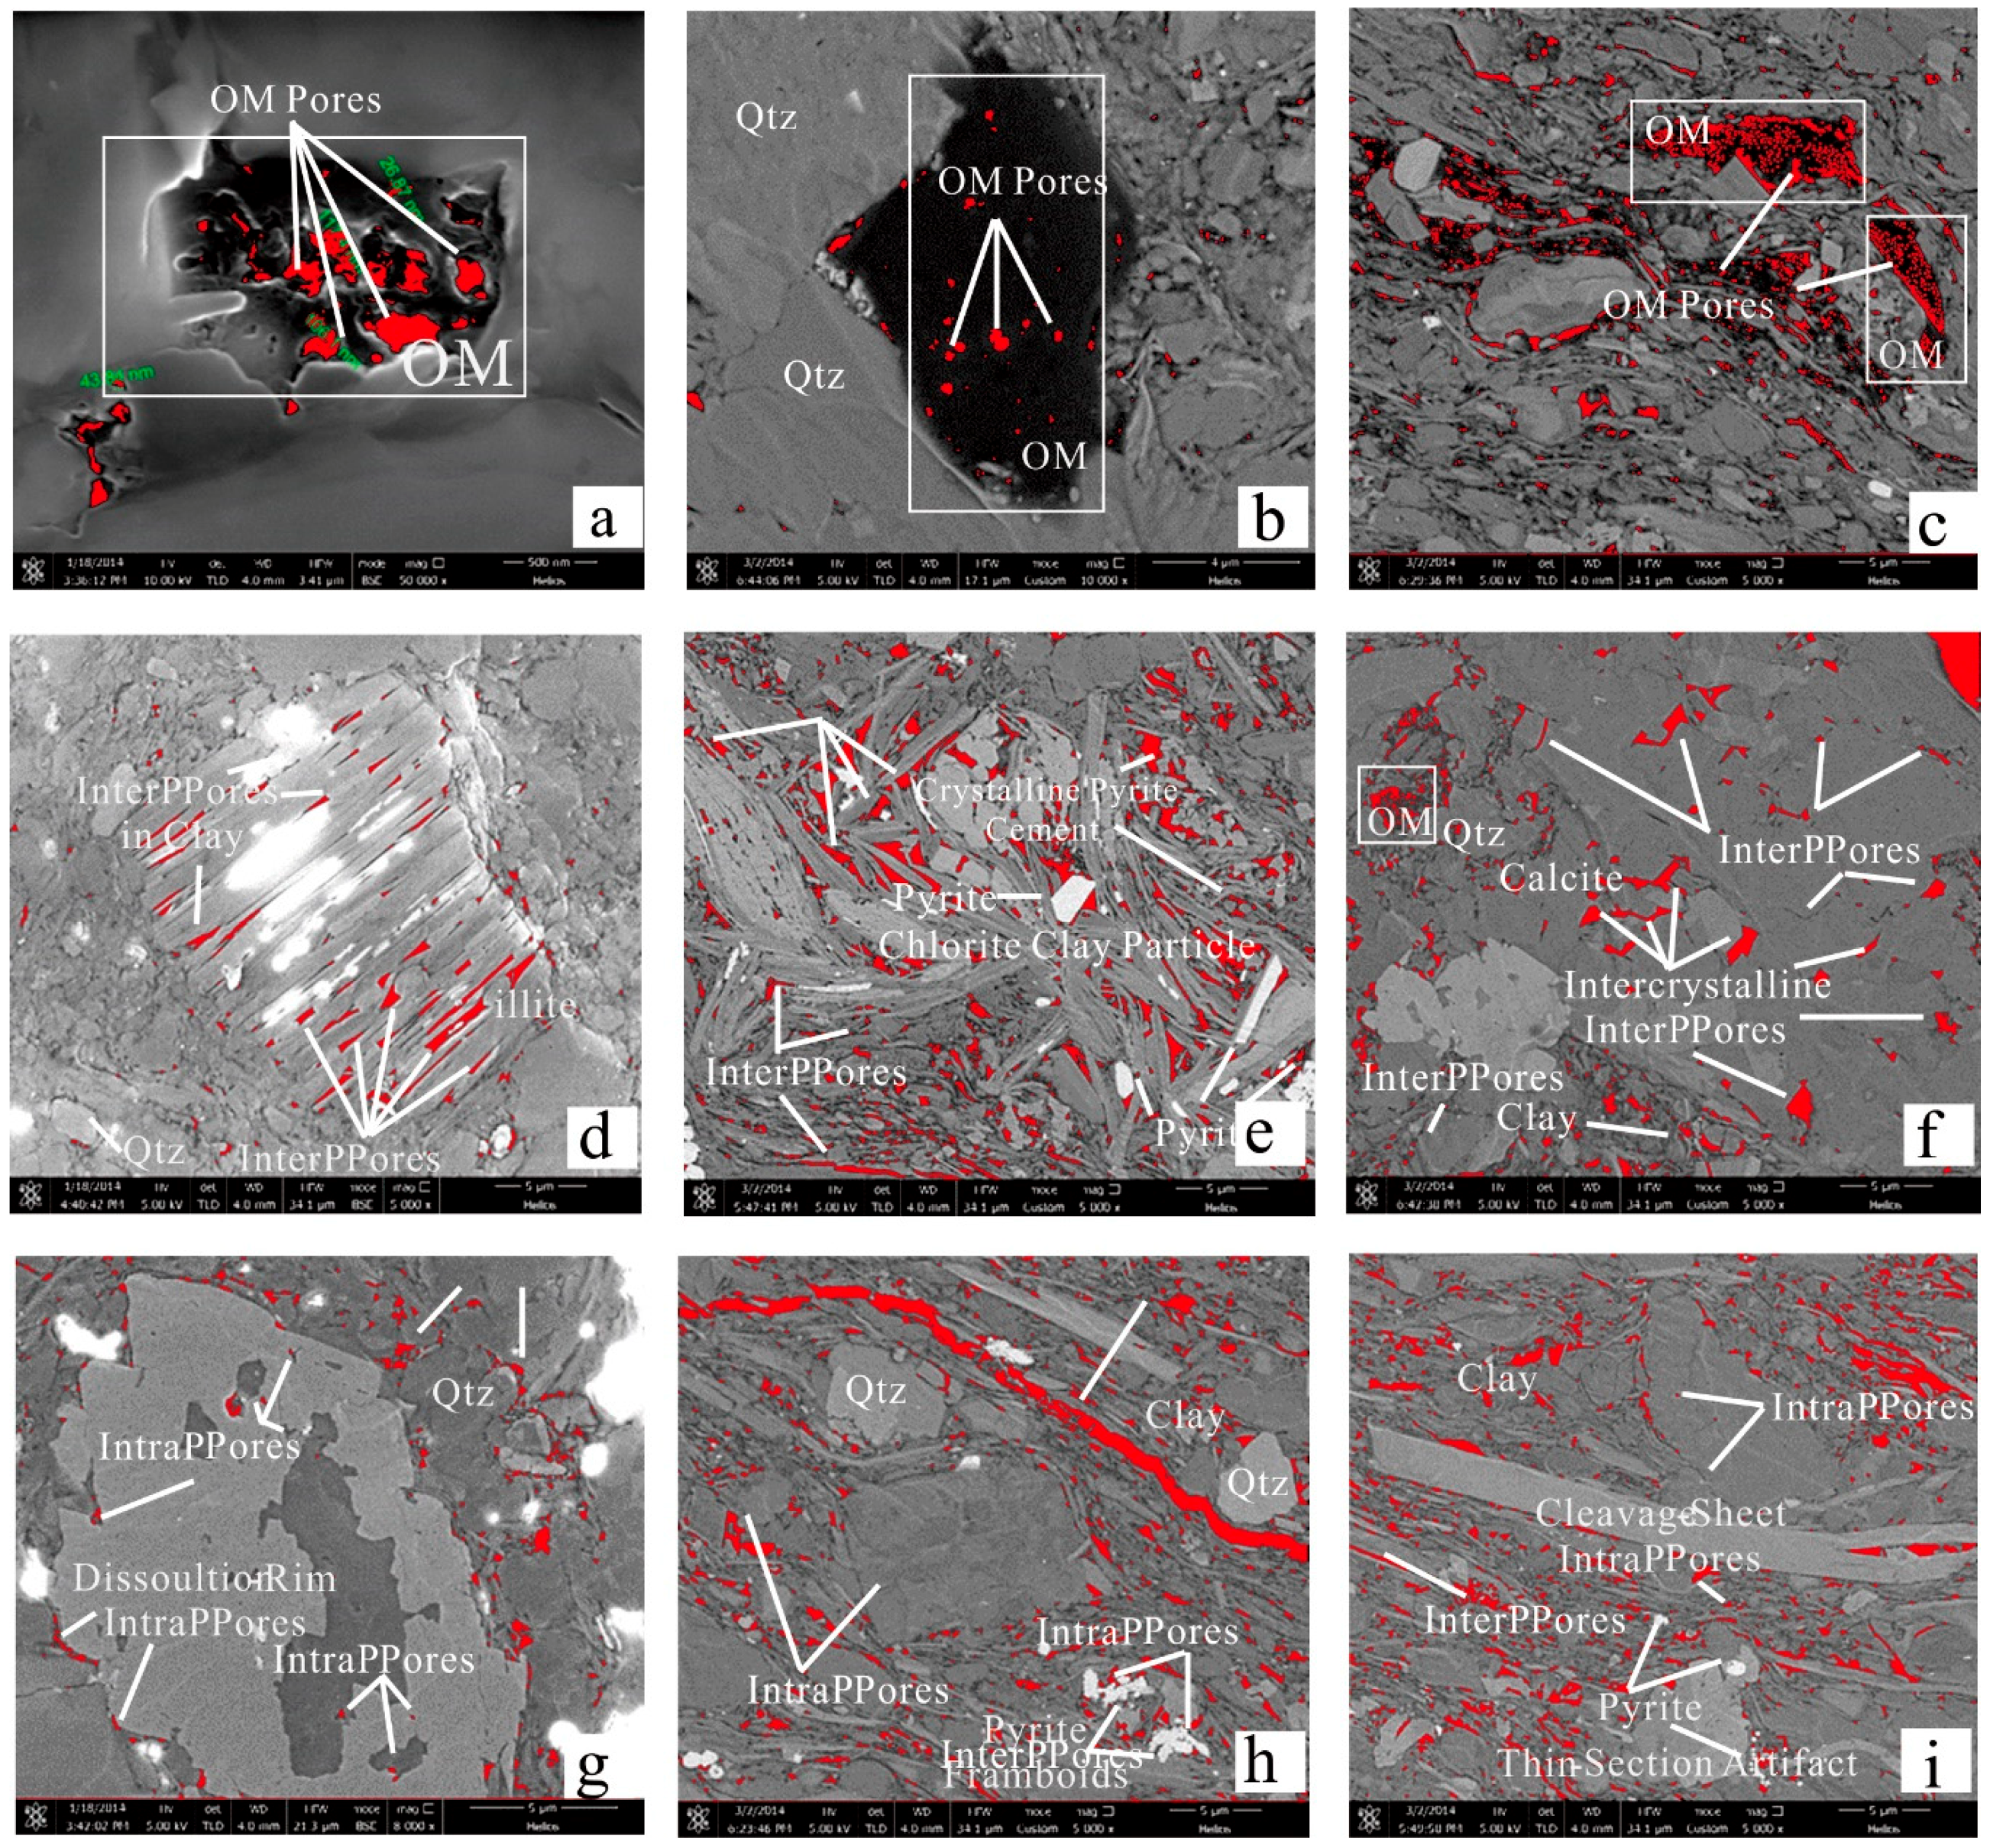
3.2.1. FE-SEM Imaging and Image Processing Analysis

The FE-SEM images show pore characteristics in the Shahezi shale samples with different lithofacies (TS-6-4, TS-6-5 and TS-6-7). According to the classification scheme proposed by Loucks et al. [1], organic matter (OM) pores and interparticle pores (interP pores) between clay flakes are dominant in the Shahezi shales. OM pores are observed in siliceous shale samples and these pores are elliptical, bubble-like, irregular (Figure 2a–c) in shape. Many OM pores display better connectivity in 3D dimensions (Figure 2a). OM surrounded by rigid mineral grains could be protected from compaction and well preserved (Figure 2b).
InterP pores are commonly observed between illite flakes and chlorite in Shahezi shale samples (Figure 2d,e). A few larger-sized interP pores between quartz grains were observed as well (Figure 2f). InterP pores connected to OM pores could serve as a significant migration pathway for shale gas [1]. Shale gas is expected to flow along the most conductive pathway associated with the connected pores [64].
A few intraparticle pores (intraP pores) can be observed in the Shahezi shales (Figure 2g–i), which are primary formed due to the dissolution of chemically unstable minerals, such as carbonate and feldspar [1].
An image processing analysis were performed on the FE-SEM images of the Shahezi shales (Figure 2) using Image-Pro Plus software [66]. The results of the image processing include the pore number, pore width and fractal dimension, all listed in Table 2. In total, 869 pores, including OM pores, interP pores and intraP pores, were extracted from the FE-SEM images (Figure 2).
For the siliceous shale sample (TS-6-4), interP pores contribute the highest percentage in the total pore systems (53.21%). However, intraP pores contribute the lowest percentage (16.06%). The mean pore sizes of the OM pores, interP pores, and intraP pores are 113.6, 90.1, and 54.2 nm. IntraP pores have the lowest fractal dimension (1.08), while OM pores have the highest value (1.68). For the calcareous shale sample (TS-6-5), no OM pores were extracted from the FE-SEM image (Figure 2g), while 44 interP pores and 25 intraP pores were extracted. The mean pore sizes of the interP pores and intraP pores are 181.7 and 193.1, respectively. Both InterP pores and intraP pores have close fractal dimensions of 1.17 and 1.21. For the argillaceous shale sample (TS-6-7), 582 pores in total were extracted from the images (Figure 2c–e,h,i). InterP pores have the highest percentage of pore numbers (57.73%), while intraP pores contribute the lowest percentage (19.59%). The mean pore sizes of the OM pores, interP pores, and intraP pores are 56.3, 224.6, and 89.3 nm.
Overall, interP pores provide the highest proportion of pore numbers and a relatively larger mean pore size in the studied shale samples. The pores in the studied Shahezi shales are mostly irregular in shape as displayed by the fractal dimension data, which is consistent with previous image processing work [58].

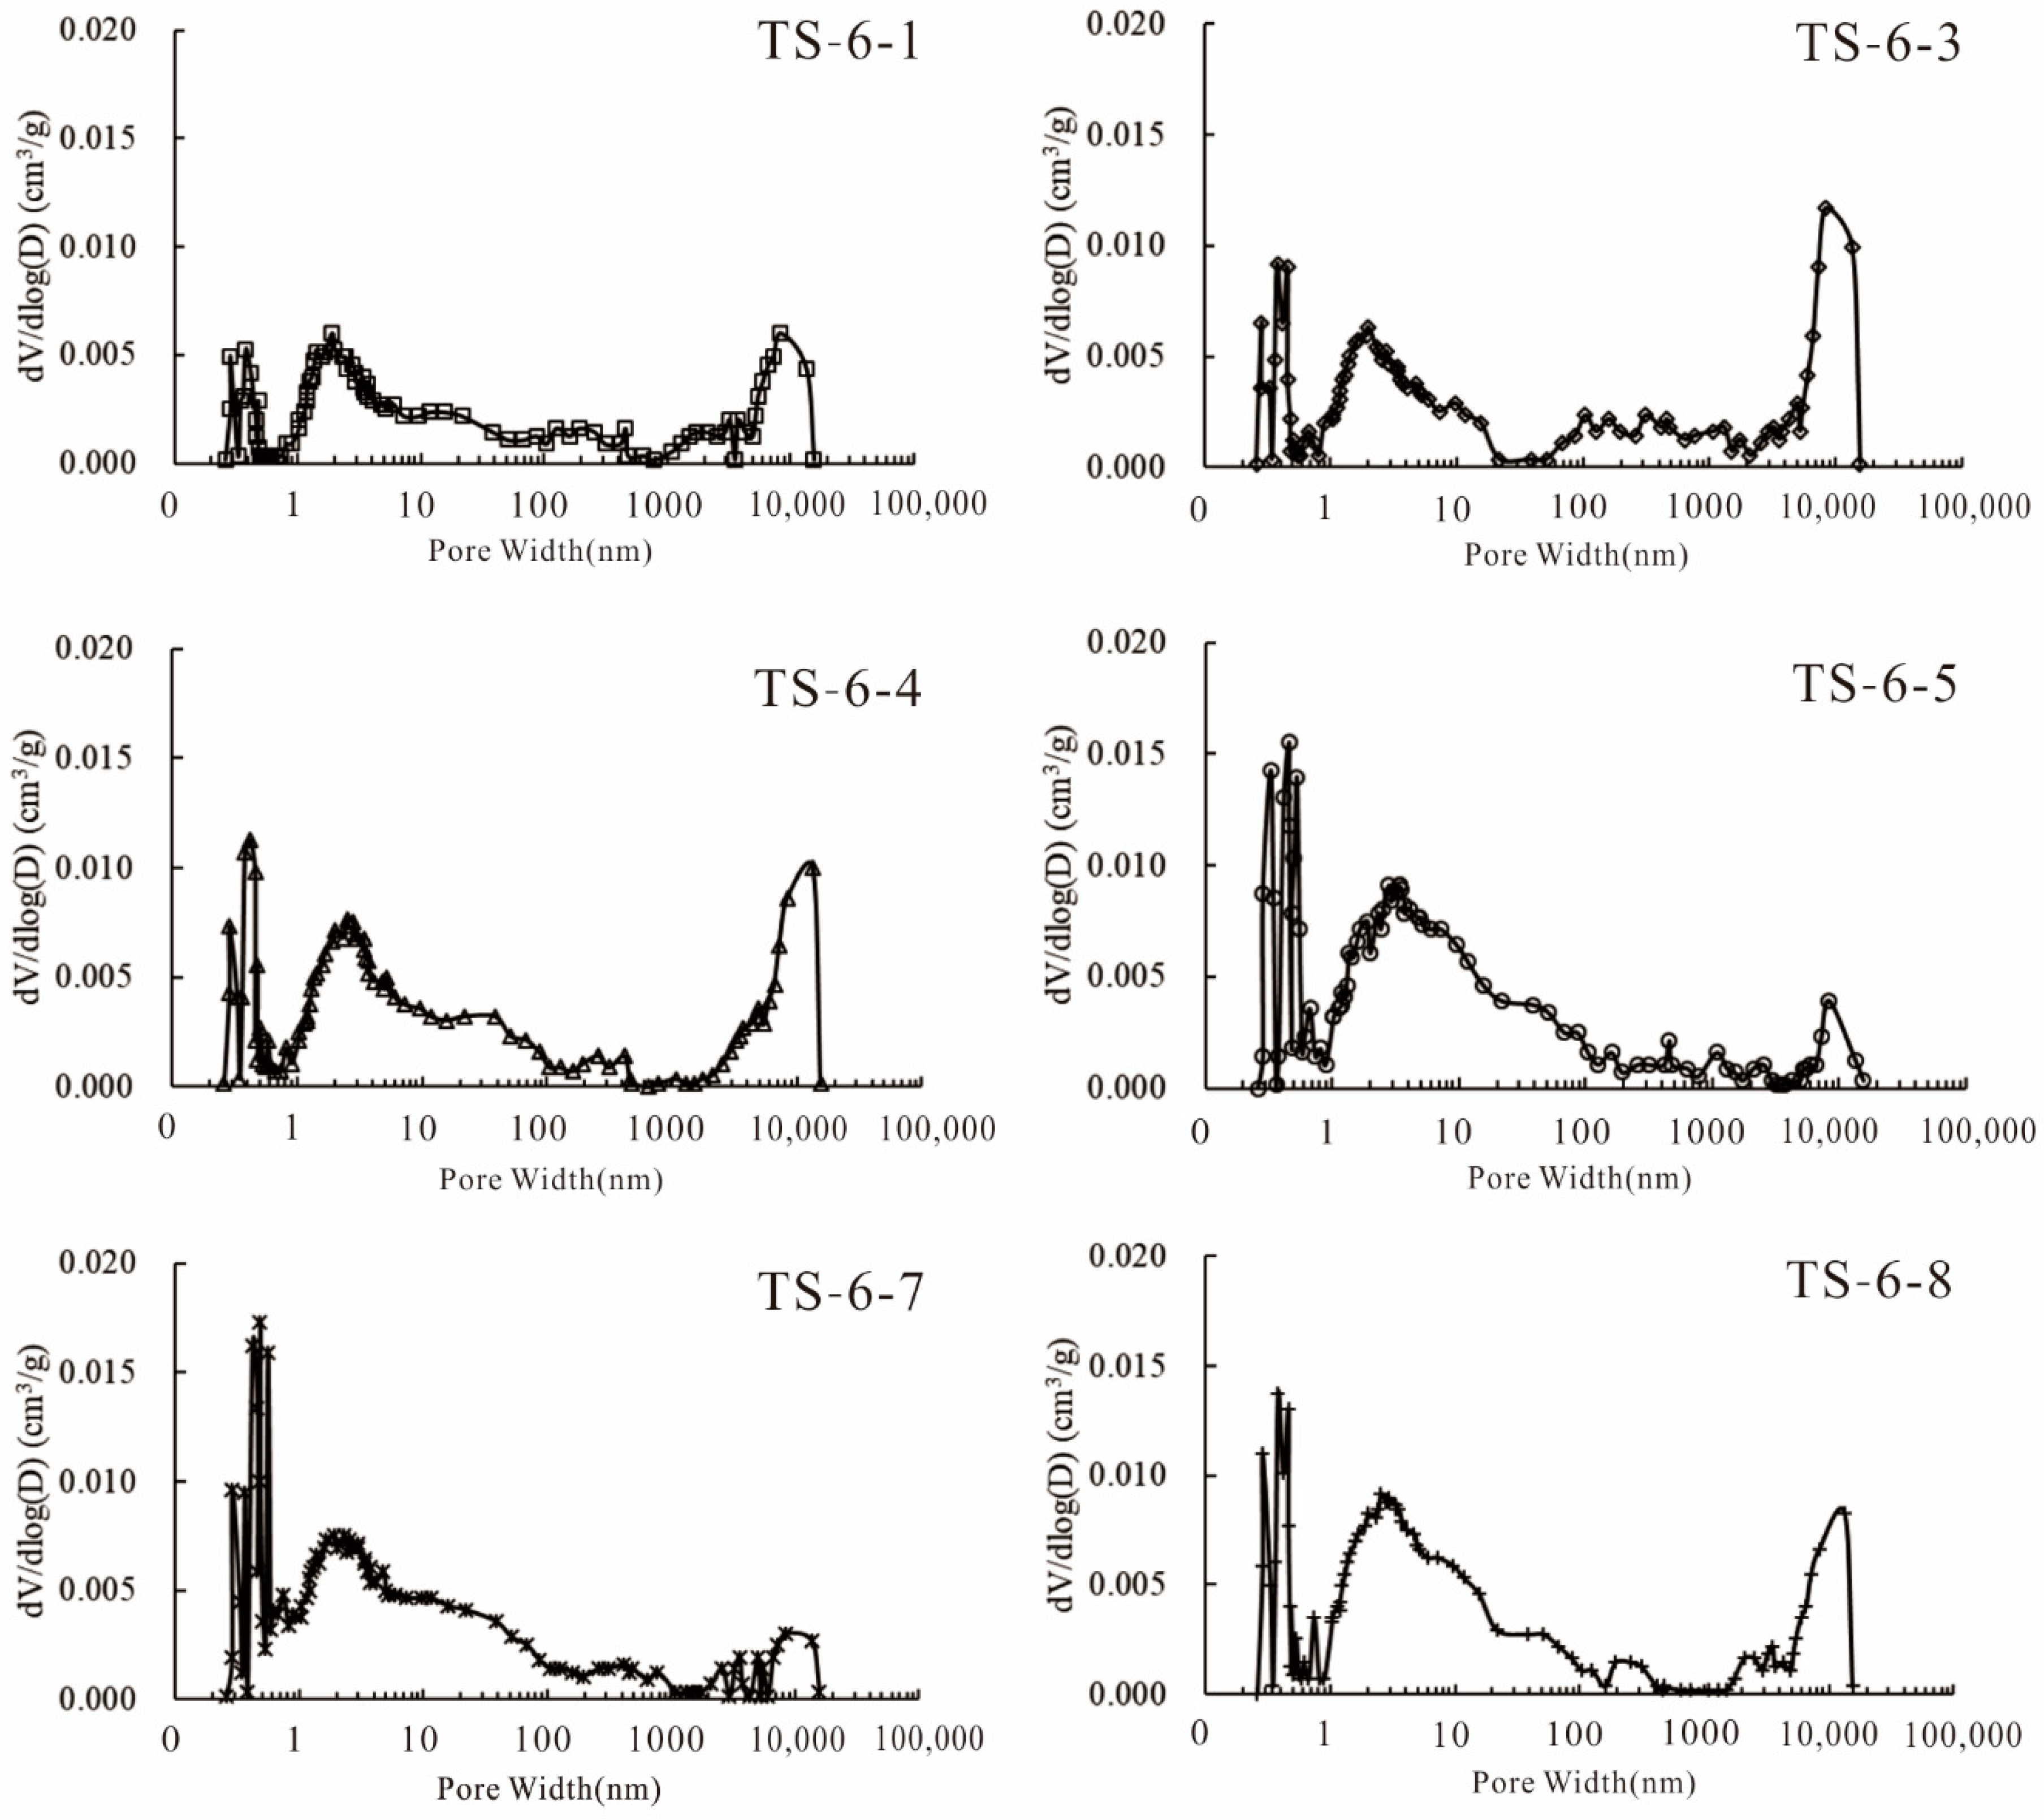
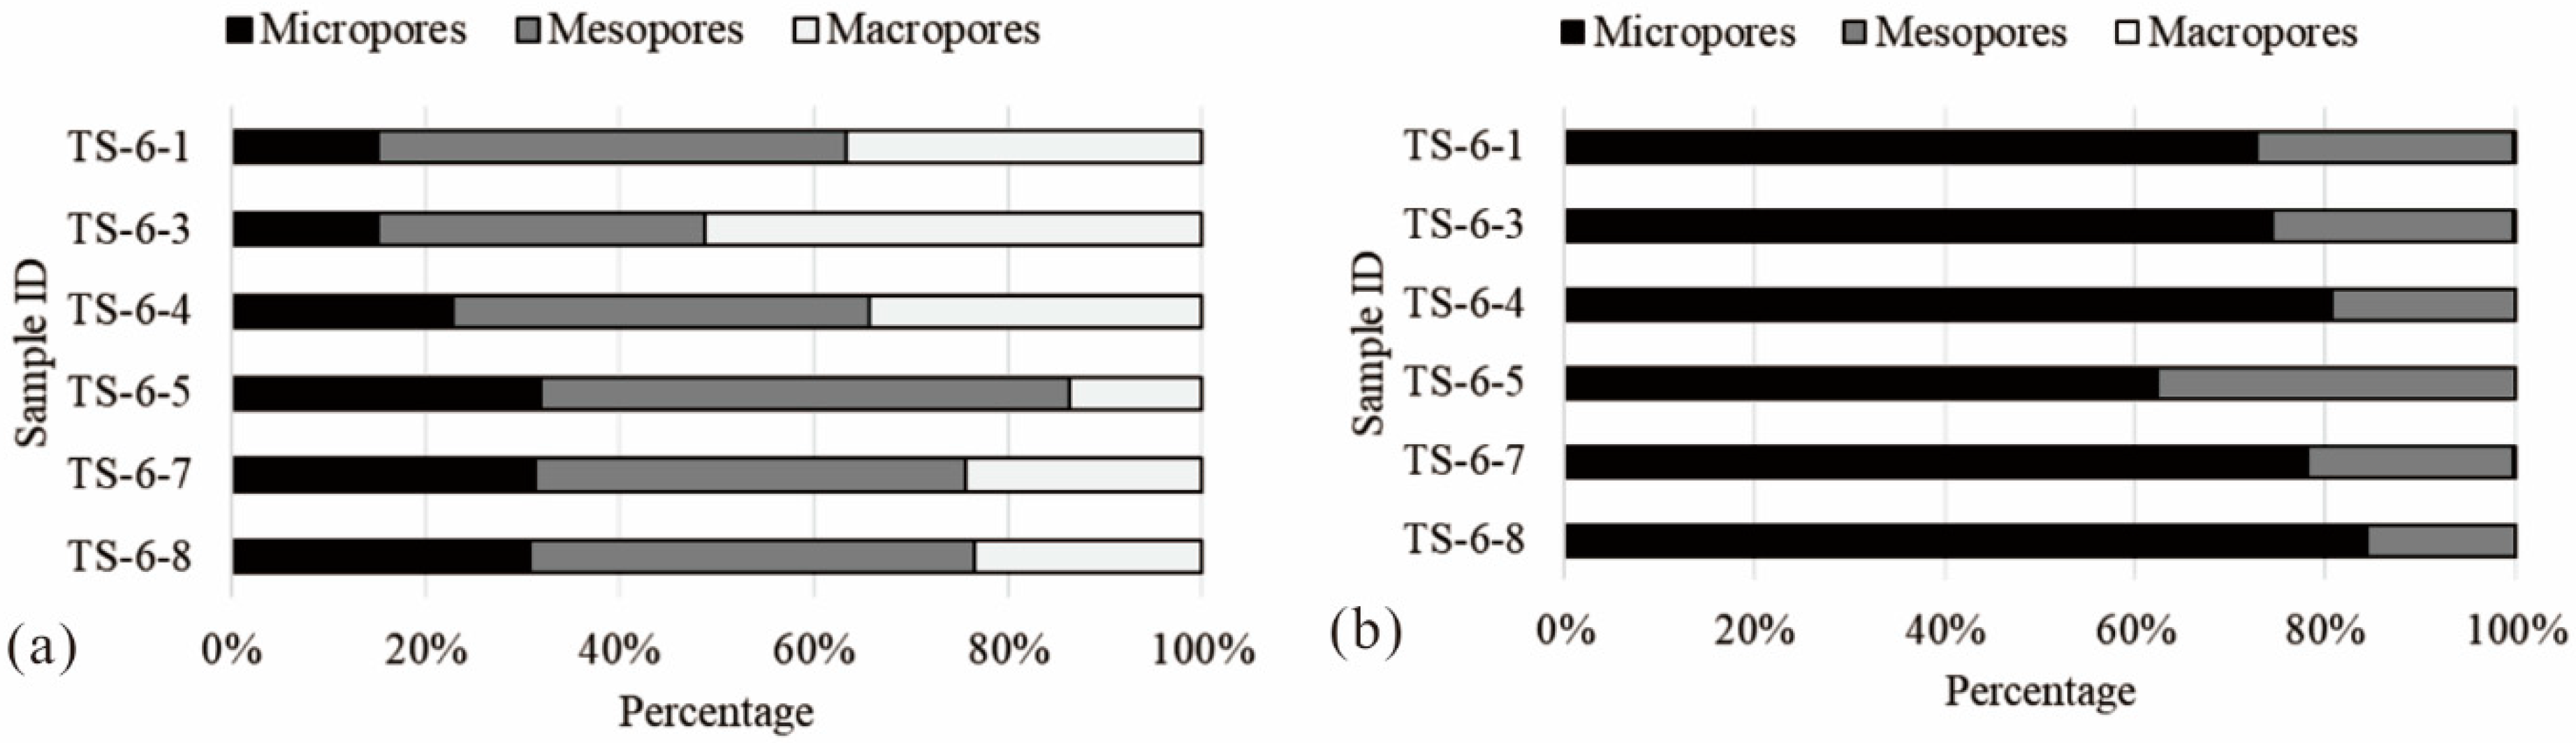
3.2.2. Full-Size Pore Size Distribution

Figure 3 illustrates the full-size PSD by combining the low pressure gas adsorption (CO2 and N2) and MICP data. Micropores (<2 nm), mesopores (2–50 nm), and macropores (>50 nm) are well developed in all shale samples, according to the International Union of Pure and Applied Chemistry (IUPAC) classification [67]. Multimodal PSD characteristics of the lacustrine Shahezi shale samples can be determined in the ranges of 0.3–0.7 nm and, 3–20 nm (Figure 3). The peaks at 10–30 μm determined by MICP are considered fake peaks, which may be due to artificial fractures formed during the sample preparation [11].
In this paper, the micropore (pore width <2 nm) volumes of the Shahezi shale samples were determined by low pressure CO2 adsorption, the mesopore (2 nm < pore width < 50 nm) volumes were determined by low pressure N2 adsorption, and the macropore (pore width >50 nm) volumes were determined by MICP experiments. The total volume of each sample is the sum of the micropore, mesopore and macropore volumes. The total pore volumes are in the range of 0.79 and 1.38 cm3/100 g for the Shahezi shales (Table 3). The micropore volumes with an average of 0.281 cm3/100 g (0.12–0.44 cm3/100 g) account for approximately 25% of the total pore volume, mesopore volumes with a mean value of 0.503 cm3/100 g (0.38–0.79 cm3/100 g) account for approximately 45% of the total pore volume, and macropore volumes with an average of 0.335 cm3/100 g (0.25–0.61 cm3/100 g) account for approximately 30% of the total pore volume (Table 3, Figure 4a). Therefore, mesopores provide the largest contribution to the total pore volume, followed by macropores. Micropores contribute the least proportion to the total pore volume. Micropores have the highest proportion to the total specific surface area (over 75%), mesopores only account for a small portion (about 24%), and the surface area provided by macropores is negligible (Table 3, Figure 4b).

3.2.3. Tortuosity

Tortuosity refers to the ratio of the actual distance of the fluid transport to the apparent straight-line length through the medium [45], which is calculated from Equation (1):
τ = D 0 D e = 1 Φ ( L e L ) 2 ,
where D0 is the aqueous diffusion coefficient in certain fluids (m2/s), De is the effective diffusion coefficient in porous media (m2/s), Le is the actual distance (m) travelled by a molecule, and L is the length a molecule moves between two points in a porous medium (m) [45].
The effect tortuosity values can be calculated from Equation (2) by the MICP results [32]:
τ = ρ 24 k ( 1 + ρ V t o t ) η = r c , min η = r c , max η 2 f v ( η ) d η ,
where τ is effective tortuosity, ρ is the mercury density (g/cm3), Vtot is the total pore volume (mL/g), η = r c , min η = r c , max η 2 f v ( η ) d η is the pore throat volume probability density function, r c , max is the maximum pore radius, r c , min is the minimum pore radius, f v ( η ) is the density function distributed over v points, η is the pore throat density, and k is the absolute permeability.
The geometrical tortuosity (Le/L) can be calculated based on Equation (1) by inputting the effective tortuosity (τ) and MICP derived porosity (Φ).
As can be seen in Figure 3 and Figure 4, most pore sizes in the Shahezi shale are smaller than 100 nm, with an average pore throat diameter of 6.13–13.68 nm (Table 3). In addition, the maximum intrusion pressure of MICP in the present study is 400 MPa, which results in a minimum detected pore throat of about 4.5 nm. Therefore, the effective tortuosity values of this study represent the mercury flow characteristics in a predominant pore throat width of 4.5–13.68 nm. Low pore connectivity commonly leads to high tortuosity [32].
The effective tortuosity and geometrical tortuosity (Le/L) values calculated from the MICP data of the Shahezi shale samples are in the range of 1212–6122 and 4.75–8.89, respectively, which is consistent with the previous reported values of Barnett shales (1772–5372 and 2.13–11.6), Longmaxi shales (123–1716 and 11.1–41.4), Niutitang shales (6284–6807), Dongyuemiao (284 and 11.2) and Dalong shales (104 and 14) [24,32,68]. Tortuosity can be used to evaluate pore connectivity in a porous medium [30]. According to the tortuosity values of this study and previously reported tortuosity values of typical gas shales [24,32,68], low pore connectivity can be identified in the Shahezi shales in the CFD, Songliao Basin.

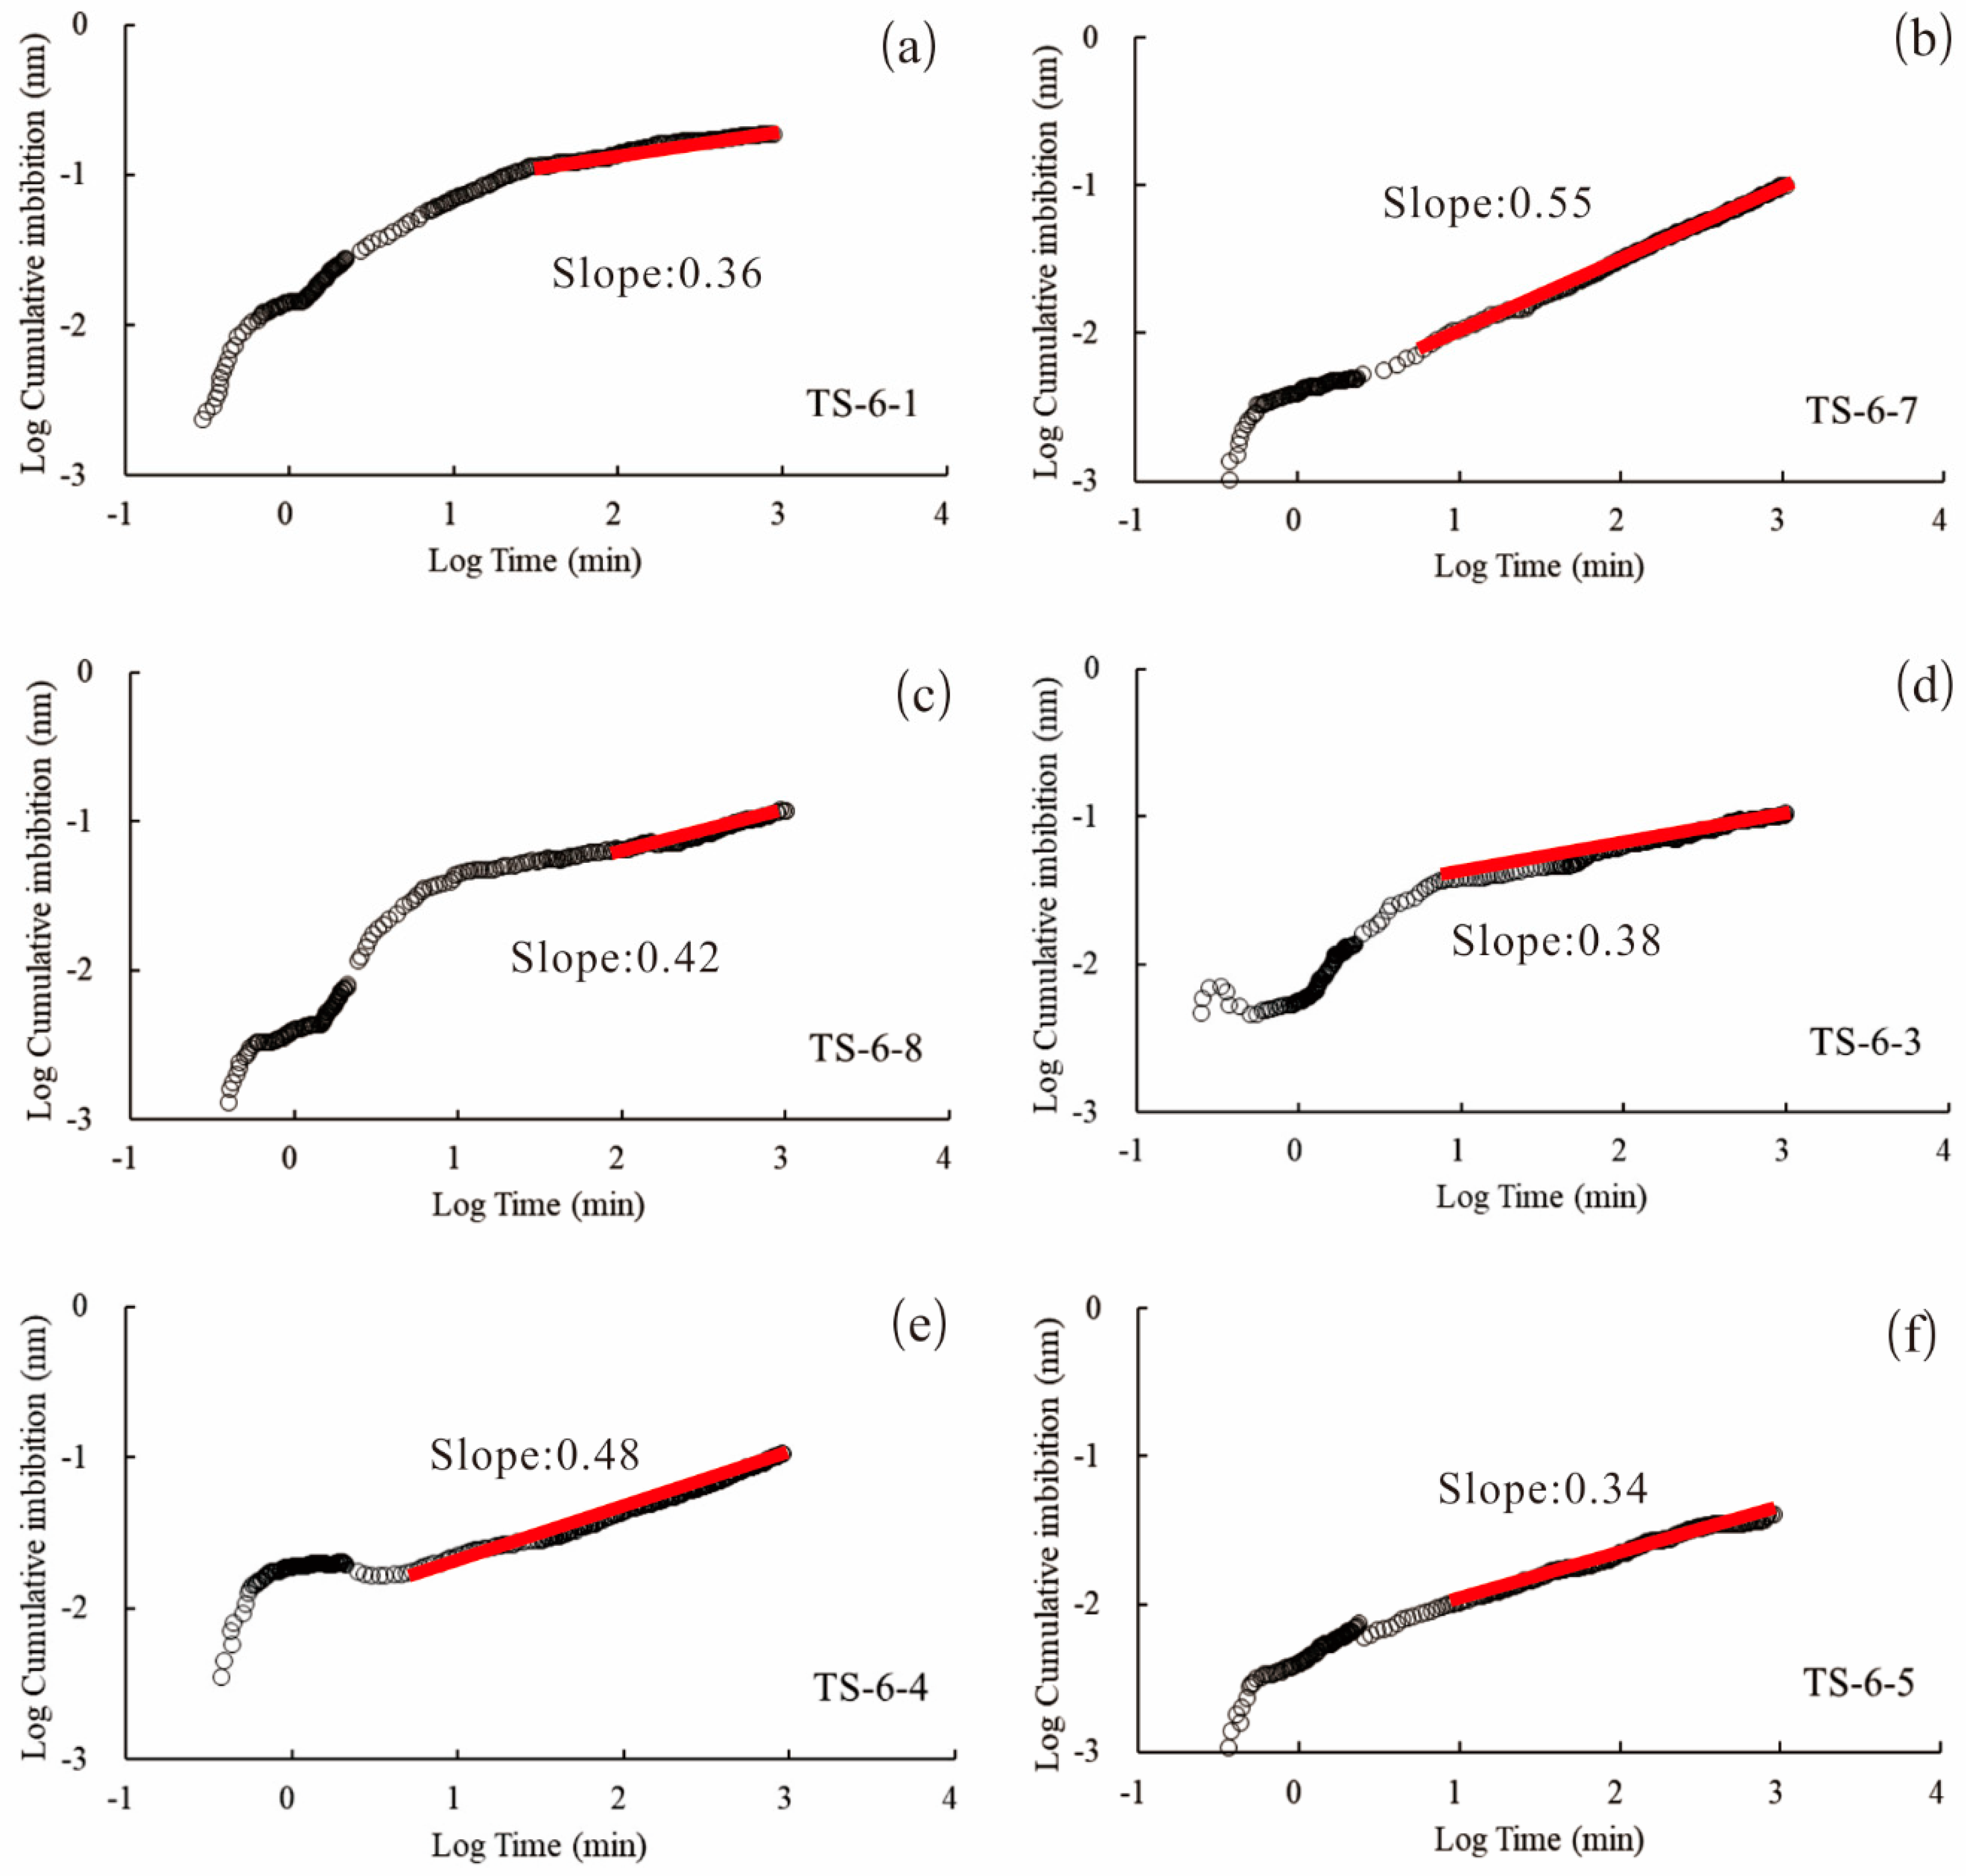
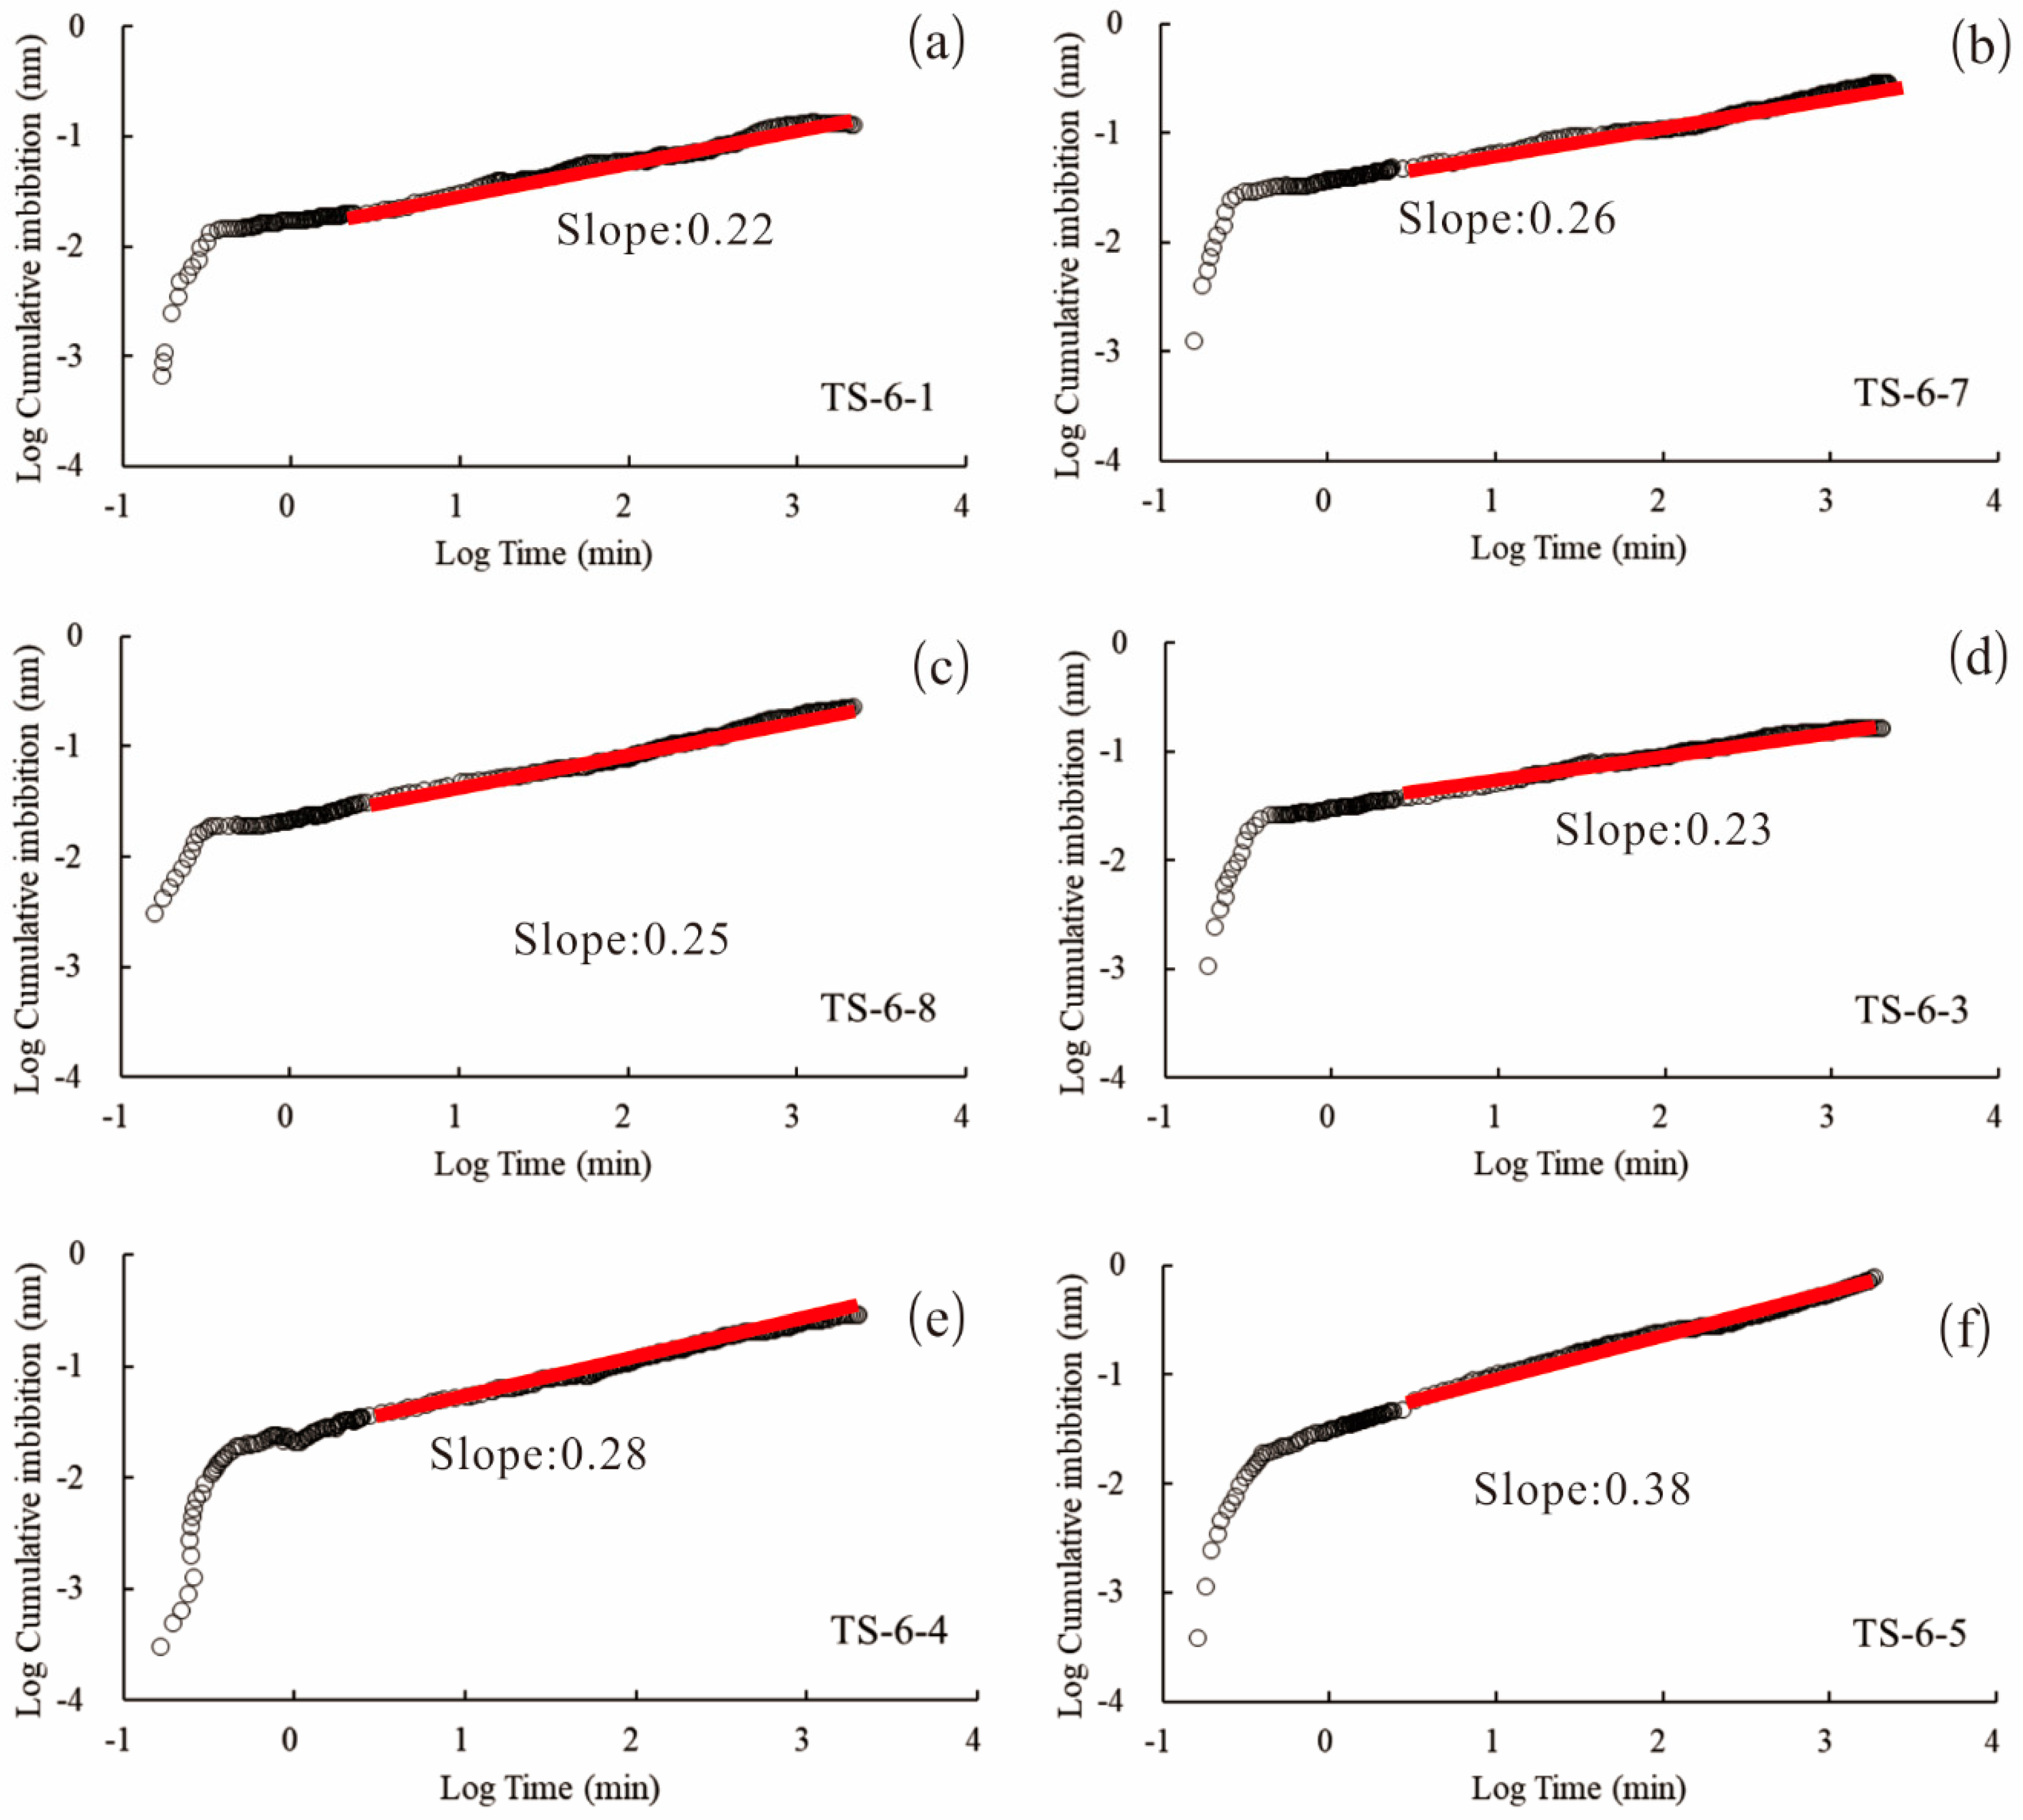
3.3. Spontaneous Fluid Imbibition

Log cumulative imbibition (mm)-log time (min) plots of n-decane and DI water SFI of the Shahezi shales are shown in Figure 5 and Figure 6. The DI water SFI curves can be segmented to an initial stage (0–120 s), an increasing stage (120 s–23 h) and a final stage (23–24 h) [38]. The rapid increases and fluctuations of imbibition in the initial stage may result from boundary effects, which is due to the initial contact of samples with fluids and to the migrations of fluid up the outside of the sample [24]. Following this, one or two linear segments with different slopes can be observed. Larger SFI slopes suggest more imbibed fluids and higher imbibition rates. The variations of the SFI slopes may reflect the complex connectivity and spatial wettability of these organic shales [30,31,32,33,34]. For instance, a decrease in the SFI slopes suggests that the imbibed fluids transport from larger pores to smaller pores in the connected pore networks within the shale matrix [36]. Based on the percolation theory, the stable slopes in the log-log plots were used to quantitatively assess the pore connectivity, as high pore connectivity had slopes of about 0.5 (classical Fickian behavior), medium pore connectivity had slopes of 0.26–0.5, and low pore connectivity had slopes of about 0.25 [30,36,46,69,70]. The imbibition increases very little in the final stage (23–24 h), suggesting that the samples are saturated with fluids.
The n-decane SFI slopes of the Shahezi shales are in the range of 0.34–0.55 (Figure 5a–f). The samples with TOC contents over 4 wt % have higher SFI slopes (0.48–0.55) than other samples (Figure 5b,e). The n-decane SFI slopes are in the range of 0.36–0.55 for the argillaceous shales (Figure 5a–c), 0.34 for the calcareous shales (Figure 5d), and 0.38–0.48 for the siliceous shales (Figure 5e,f). The DI water SFI slopes of the Shahezi shales are in the range of 0.22–0.38 (Figure 6a–f). The DI water SFI slopes are in the range of 0.22–0.26 and 0.23–0.28 for argillaceous shales (Figure 6a–c) and siliceous shales (Figure 6e,f), respectively. The calcareous shale sample has the highest SFI slope, at 0.38 (Figure 6d).

4. Discussion

4.1. Pore Connectivity Obtained from SFI Slopes and Tortuosity Values

SFI is an effective way to assess pore connectivity in organic shales [30,31,32,33,34,36,63]. The SFI slopes of <0.25, 0.25–0.5 and >0.5 refer to poor-connected, moderate-connected, and well-connected pore networks for specific SFI fluids [30,36,46,71,72]. Specifically, DI water may preferentially be imbibed into the hydrophilic pores, while n-decane may be primarily imbibed into the hydrophobic pores [24]. The SFI process is affected by the wettability of both pores and fluids [63,73]. Rocks can have a good pore connectivity for a wetting fluid, but a poor connection for a nonwetting fluid [30]. Previous studies suggest that OM pores are commonly oil wetting and inorganic pores are water wetting [68,69]. A mixture of oil-wetting and water-wetting pores will result in the mixed wettability nature of organic shales [38]. The wettability of shale can be divided into more-water-wet, more-oil-wet, and mixed wet [36]. Different slopes of DI water and n-decane SFI can be applied to study the wettability of the shale matrix [24,30,31,32,33,34]. The ratio of the n-decane imbibition slope to DI water imbibition slope may provide useful information about the wettability. The ratios that are lower than one mean that the pore surface is more hydrophilic. Compared with DI water, the n-decane SFI of the studied Shahezi shales shows larger slopes (Figure 5 and Figure 6), suggesting that the hydrophobic pore networks are better connected than the hydrophilic pores in the Shahezi shales and that the studied shale samples are all more oil-wet. The well-connected OM pores and inorganic pores contribute to the mixed-wetting characteristics of the lacustrine Shahezi shales. This result can be supported by OM pores observed in the FE-SEM images (Figure 2a–c).
The pore connectivity of the Shahezi shales vary in different shale lithofacies (Figure 7). The calcareous shale has the highest DI water SFI slope, at 0.38, followed by the siliceous shale and argillaceous shale samples, with slopes ranging from 0.22 to 0.28. These results suggest that hydrophilic pore networks are moderate-connected in calcareous shale and poor-connected in siliceous and argillaceous shales. In addition, the hydrophobic pore connectivity evaluated by the n-decane SFI of argillaceous shales (0.42–0.55) is better than for siliceous shales (0.38–0.48) and calcareous shales (0.34). The TS-6-7 sample has the largest n-decane SFI slope, suggesting well-connected hydrophobic pores in the argillaceous shale sample. Well-connected OM pores were observed in sample TS-6-4 (Figure 2a,b). Considering the similar TOC contents and thermal maturity of samples TS-6-7 and TS-6-4, it can be inferred that OM pores with a high connectivity formed in sample TS-6-7. According to the indication of the SFI slope of 0.25 [46], a high pore connectivity for n-decane and low connectivity for DI water can be determined [36,71,72,73,74].
Tortuosity is another parameter for the pore connectivity evaluation [24,32]. The effective tortuosity obtained from the non-wetting MICP data is correlated with the pore connectivity but unrelated to the pore wettability [24,68]. The tortuosity represents both connected OM pores and inorganic pores in shales [24,30,31,32,33]. We can observe negative correlations of the effective tortuosity (Figure 8a) and geometrical tortuosity (Figure 8b) with the DI water SFI slopes, suggesting that poor-connected pores in the Shahezi shale samples lead to high tortuosity [32]. The geometrical tortuosity (Le/L) values also correlated well with the DI water SFI slopes and indicate the pore connectivity of hydrophilic pore networks. Specifically, the maximum Le/L value is 8.89, suggesting that non-wetting mercury has to travel 8.89 cm to move a linear distance of 1 cm in the shale matrix. Therefore, the low pore connectivity of the Shahezi shales results in this high tortuosity [24]. The shale sample TS-6-5, which has the highest water SFI slope, has the shortest diffusion distance (lowest geometrical tortuosity), while sample TS-6-1, with the lowest water imbibition slope, has the farthest diffusion distance (highest geometrical tortuosity) (Table 3). Shales with low pore connectivity have significant proportions of unconnected pores, which will slow the gas diffusion in the shale matrix and increase the effective tortuosity values [24,32]. Overall, moderate-connected oil-wetting and poor-connected water-wetting pore networks were identified in the Shahezi shales, which is consistent with gas shales in the US with limited connected water-wet pore systems [31,32].
Shales are characterized by an extremally low matrix permeability on the nanodarcy scale [75,76,77,78,79]. Therefore, a diffusive mechanism is proposed to be the mass transfer process within complex matrix pore systems [75,80,81]. Low permeability and limited pore connectivity will result in the extremely slow fluid transport within the shale matrix, which may explain the steep decline of hydrocarbon production within the initial years [32]. The Shahezi shale samples are predominantly in the nanometer size range (Figure 3 and Table 3), which is expected to have an extremely low permeability and slow fluid transport. The low connectivity of pore networks will also slow the diffusive transport.

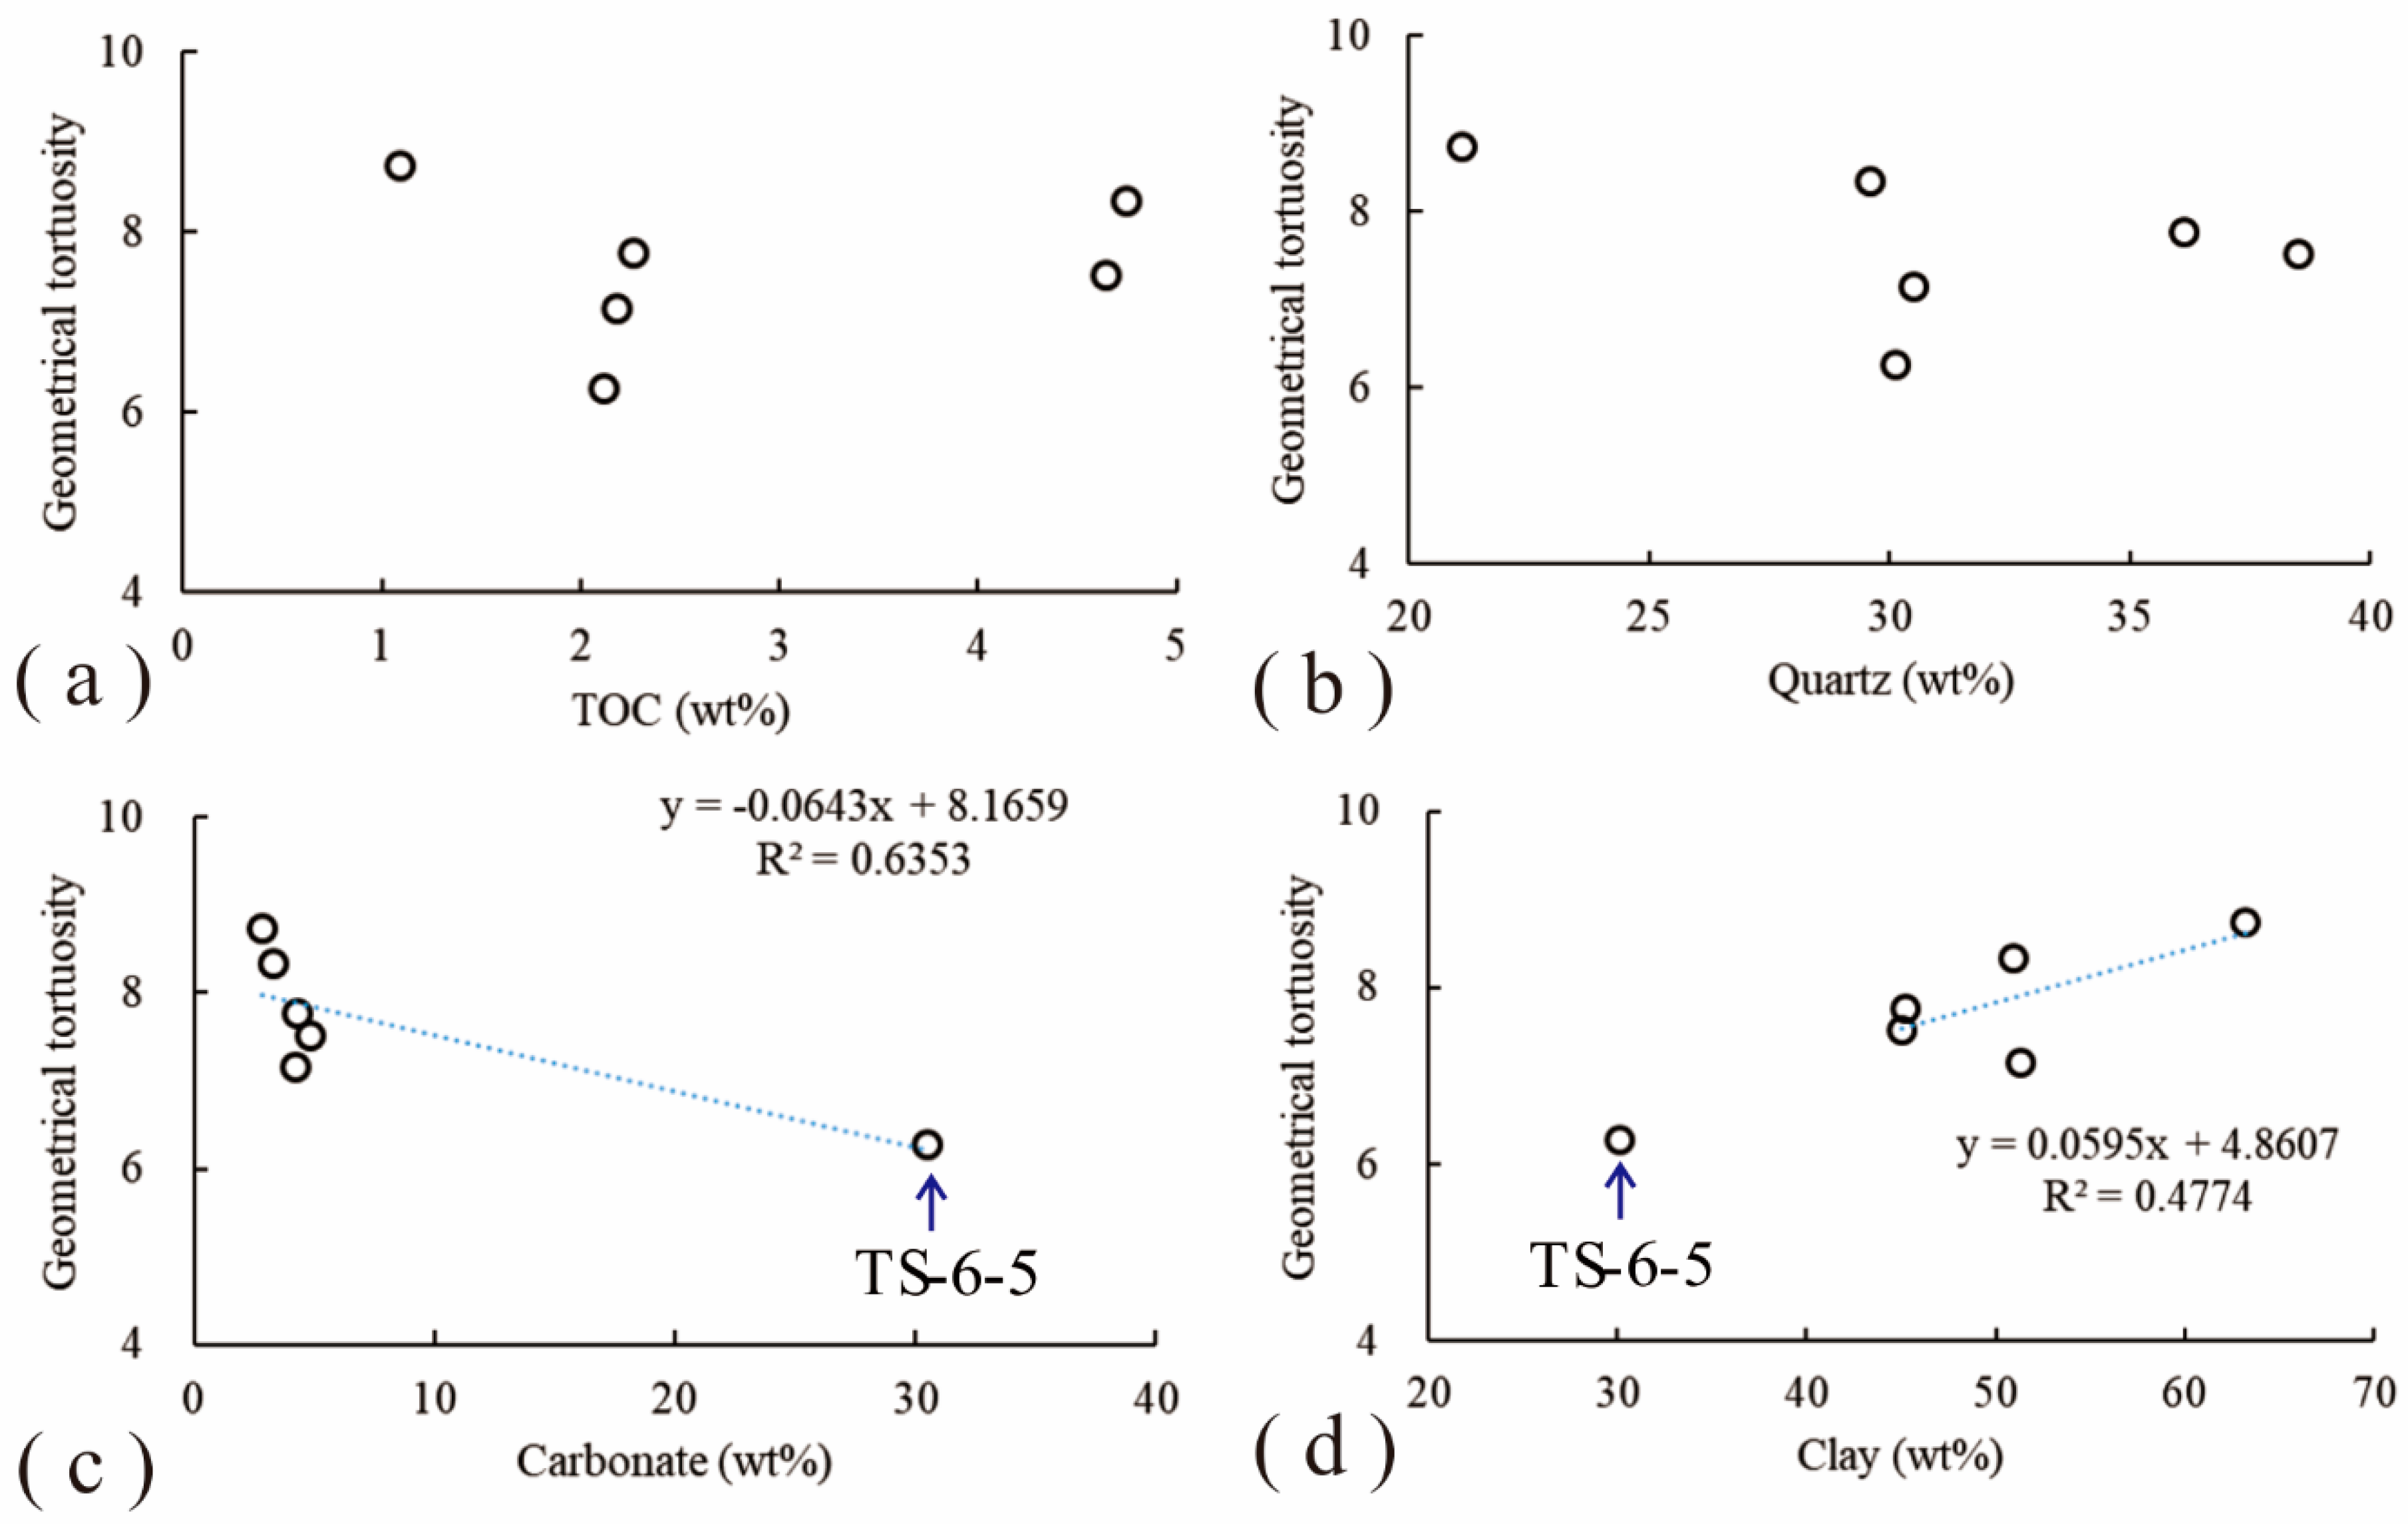
4.2. Effects of Matrix Compositions on Pore Connectivity

The effects of shale matrix compositions on the pore connectivity of the studied shale samples were discussed with respect to lithofacies (Figure 7). The argillaceous shale contains the most abundant clay minerals. The siliceous shale and the calcareous shale are rich in quartz and calcite, respectively (Table 1). Therefore, OM and mineral compositions in Shahezi shales exert different impacts on pore connectivity.
The clay mineral compositions of the studied sample are mainly mixed-layer illite/smectite (I/S), illite and chlorite (Table 1). I/S minerals have a larger water-swelling potential [82], which may alter the pore structure of shales and control the gas flow [83]. In addition, clay mineral swelling may be the reason for the lower imbibition capacity of the samples [84]. Consequently, the pore structure of the Shahezi shale samples could be altered due to the swelling of clay minerals. Gao and Hu [36] performed triplicate water imbibition experiments, and the results show poor reproducibility, which indicates a strong interaction between the imbibed DI water and clay minerals. Therefore, the water or n-decane imbibition slope obtained in the first SFI experiment is used to evaluate the initial connectivity and wettability of our samples [35,36,37].
Pore connectivity varies in different shale lithofacies. The n-decane SFI slopes are all larger than 0.25 (0.36–0.55) for argillaceous shales rich in clay minerals, especially for sample TS-6-7 (TOC = 4.75 wt %), which displays the highest slope: 0.55 (Figure 7). The DI water SFI slopes of argillaceous shales are close to 0.25 (0.22–0.26) (Figure 5a–c). In addition, sample TS-6-1 (TOC = 1.09 wt %) has the highest effective tortuosity and geometrical tortuosity at 6122 and 8.89, indicating low pore connectivity. Well-connected OM pores may lead to higher n-decane SFI slopes, while insufficient OM pores may result in low n-decane SFI slopes [24,32]. The FE-SEM images show pores within OM-clay composites in the argillaceous shales (Figure 2d,e). InterP pores formed when coming in contact with OM-clay are often connected to OM pores to increase the pore connectivity of the argillaceous shales (Figure 2d,e).
The siliceous shale samples also have higher SFI slopes for n-decane as well as a lower effective tortuosity and geometrical tortuosity than DI water, also suggesting a higher hydrophobic pore connectivity (Figure 5d,e and Figure 6d,e). The siliceous shale samples show a good pore connectivity for n-decane, but a moderate pore connectivity for the DI water fluid. The n-decane SFI slope of 0.48 in sample TS-6-4 with a TOC content of 4.64 wt % is consistent with the well-connected OM pores shown in the FE-SEM images (Figure 2a,b) [30,32,46].
The calcareous shale sample (TS-6-5) has similar SFI slopes for both DI water (0.38) and n-decane (0.34) (Figure 5f and Figure 6f), suggesting a mixed wettability and moderate-connected pores in this sample [30]. This result is also supported by the fact that it exhibits the lowest geometrical tortuosity, at 6.27 (Figure 8b). Well-developed inorganic pores and poor-developed OM pores in calcareous shales are more accessible to water due to the good connection of hydrophobic pores (Figure 2g).
The pore connectivity of various lithofacies with TOC values of about 2 wt % is following the order in terms of SFI slopes and geometrical tortuosity (Le/L), from high to low: calcareous shale (TS-6-5), argillaceous shale (TS-6-1 and TS-6-7 and TS-6-8) and siliceous shale (TS-6-3 and TS-6-4) (Table 3). The correlations of geometrical tortuosity (Le/L) with matrix compositions, including TOC, clay minerals, quartz, and carbonate mineral content, are presented in Figure 9. The geometrical tortuosity (Le/L) values show no obvious correlations with the TOC and quartz contents (Figure 9a,b). This result is probably due to the insufficient OM pores and quartz host pores in the Shahezi shales. The geometrical tortuosity (Le/L) values are negatively correlated with carbonate mineral contents and positively correlated with the clay minerals (Figure 9c,d). Abundant complex interP and intraP pores are formed in the OM-clay composites, which may enhance the pore connectivity.
A small amount of calcite and dolomite with dissolved pores is shown in the FE-SEM images of the Shahezi shales (Figure 2g). High contents of calcite should play an important role in pore development, because of the solubility of calcite and the large number of dissolved pores within the calcite. However, the samples with a calcite content <5 wt % show a negative correlation (Figure 9c). Therefore, we speculate that only a high concentration of calcite (over 20 wt %) plays significant roles in pore development and in the enhancement of pore connectivity [59,85].

5. Conclusions

Based on our studies, the following conclusions can be drawn.
(1)
FE-SEM images show that the most observed pores in the Shahezi shales are clay minerals related to interP pores and OM pores. The primary pore width calculated by combining LPGA and MICP data is in the range of 0.3–0.7 nm and 3–20 nm.
(2)
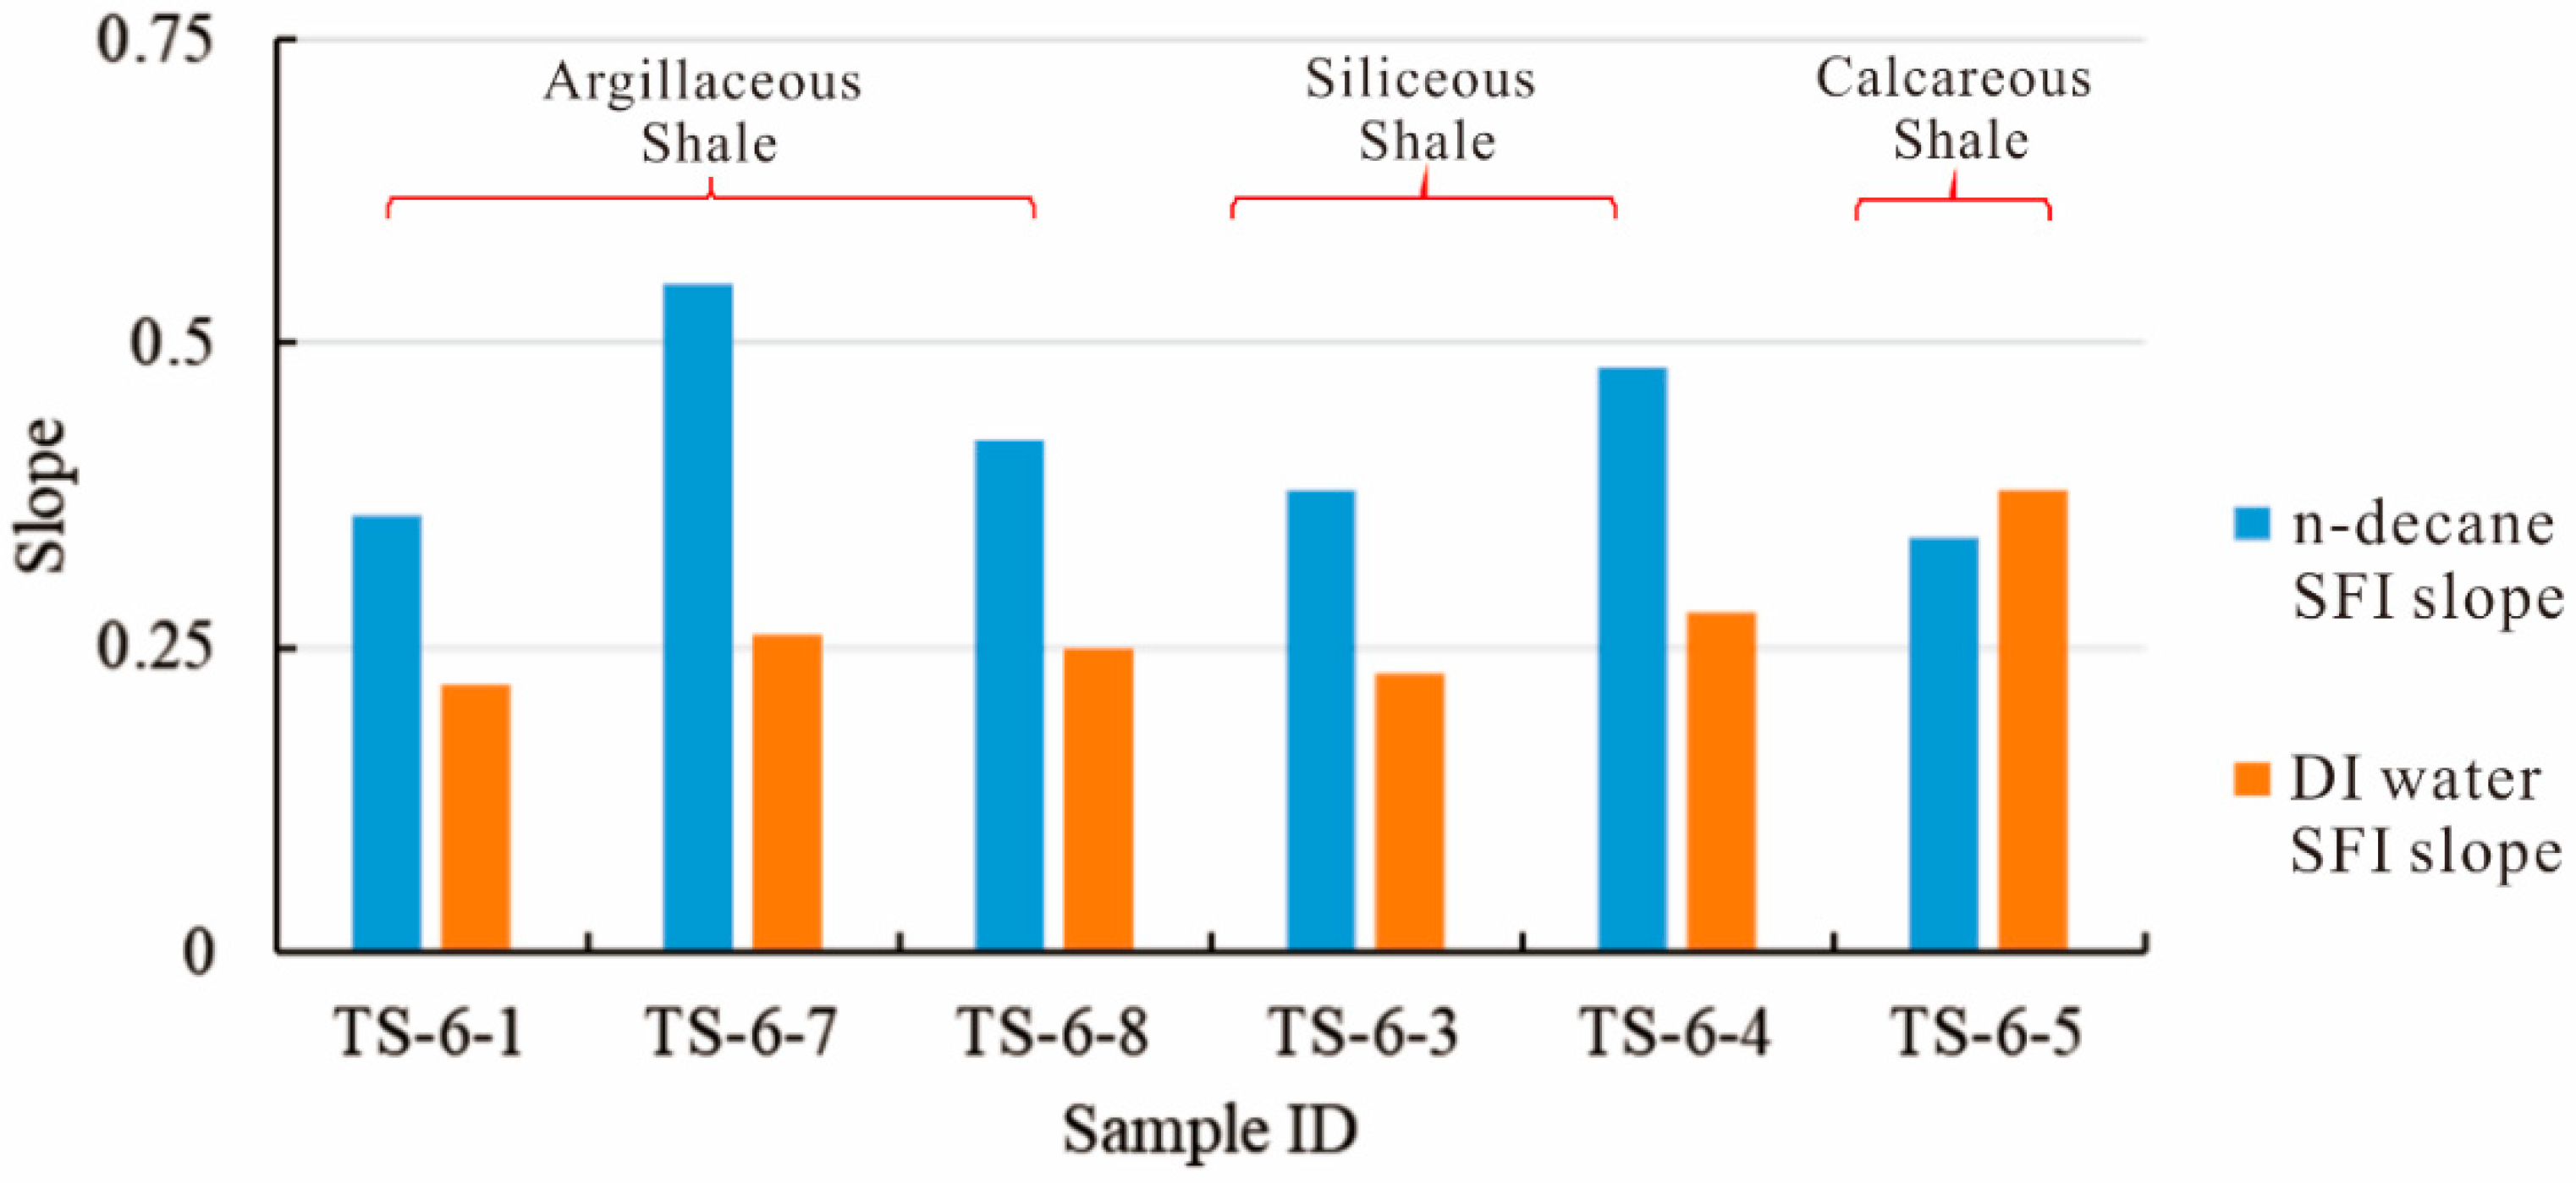
The n-decane and DI water SFI slopes (0.34–0.55 and 0.22–0.38) indicate a mixed wetting nature and relatively better-connected hydrophobic pores than hydrophilic pores in the Shahezi shales.
(3)
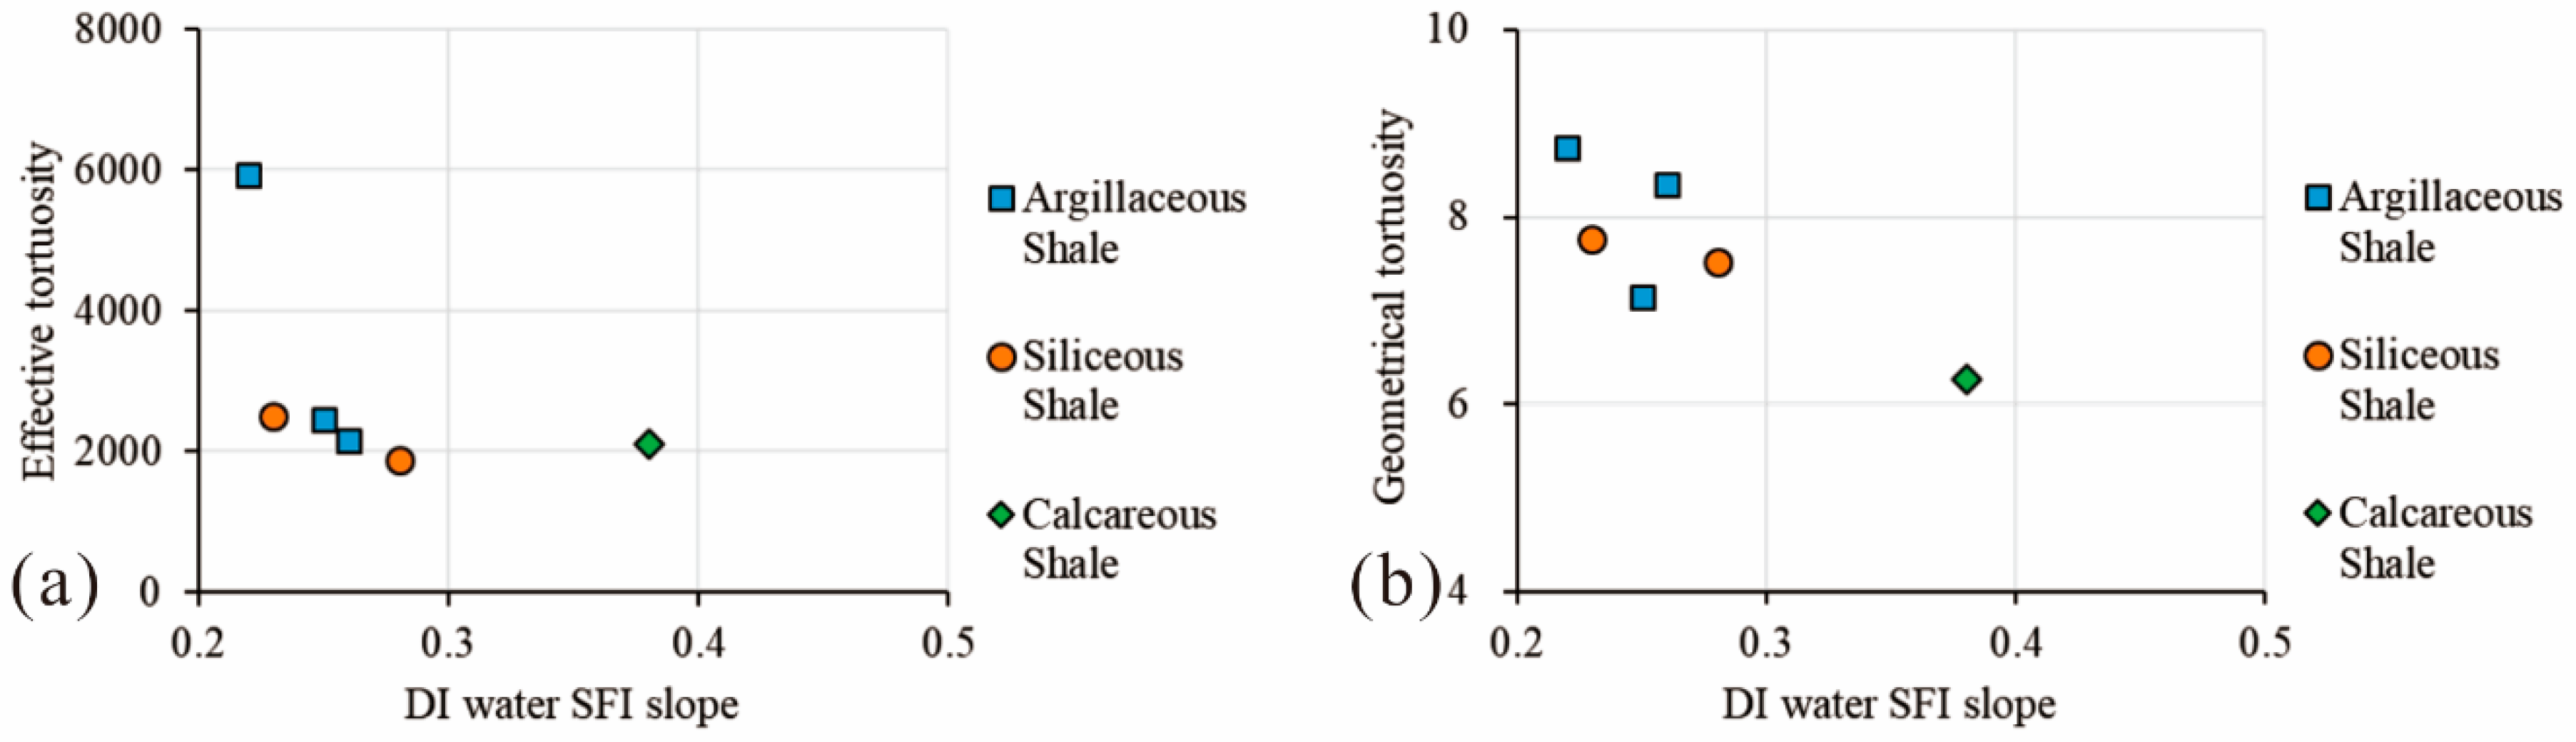
The limited pore connectivity of the Shahezi shales is identified by the dominant pore widths (0.3–20 nm), low DI water SFI slopes (around 0.25), high geometric tortuosity (4.75–8.89) and effective tortuosity (1212–6122).
(4)
The pore connectivity, affected by both the OM and inorganic compositions, varies among the shale lithofacies and follows the connectivity order of calcareous shale > argillaceous shale > siliceous shale. The high concentration of clay and calcite (over 20 wt %) significantly controls the pore connectively of the Shahezi shale in the CFD.

Author Contributions

Z.L. (Zhuo Li) and Z.J. designed and supervised the project; H.Y. and Z.L. (Zhikai Liang) performed the experiments and analyzed the data; Z.L. (Zhuo Li) wrote this paper and Z.J. corrected it; L.X. and Y.Y. modified the formats.

Funding

This study is supported by the National Major Project of China (2016ZX05034-001) and National Natural Science Foundation of China (41502123).

Acknowledgments

The Jilin oil company Branch of PetroChina is thanked for providing shale samples and geological background references. We are grateful to editors and reviewers for their constructive comments and suggestions.

Conflicts of Interest

The authors declare no conflict of interest.

References

  1. Loucks, R.; Reed, R.; Ruppel, S.; Hammes, U. Spectrum of pore types and networks in mudrocks and a descriptive classification for matrix-related mudrock pores. AAPG Bull. 2012, 96, 1071–1098. [Google Scholar] [CrossRef]
  2. Clarkson, C.R.; Solano, N.; Bustin, R.M.; Bustin, A.M.M.; Chalmers, G.R.L.; He, L.; Melnichenko, Y.B.; Radlinski, A.P.; Blach, T.P. Pore structure characterization of North American shale gas reservoirs: Using USANS/SANS, gas adsorption, and mercury intrusion. Fuel 2013, 103, 606–616. [Google Scholar] [CrossRef]
  3. Wang, G.; Ju, Y.; Yan, Z.; Li, Q. Pore structure characteristics of coal-bearing shale using fluid invasion methods: A case study in the Huainan–Huaibei Coalfield in China. Mar. Pet. Geol. 2015, 62, 1–13. [Google Scholar] [CrossRef]
  4. Loucks, R.G.; Reed, R.M.; Ruppel, S.C.; Jarvie, D.M. Morphology, genesis and distribution of nanometer-scale pores in siliceous mudstones of the Mississippian Barnett Shale. J. Sediment. Res. 2009, 79, 848–861. [Google Scholar] [CrossRef]
  5. Mastalerz, M.; Drobniak, A.; Strapoc, D.; Acosta, W.S.; Rupp, J. Variations in pore characteristics in high volatile bituminous coals; implications for coalbed gas content. Int. J. Coal Geol. 2008, 76, 205–216. [Google Scholar] [CrossRef]
  6. Chalmers, G.R.L.; Bustin, R.M.; Power, I.M. Characterization of gas shale pore systems by porosimetry, pycnometry, surface area, and field emission scanning electron/transmission electron microscopy image analyses: Examples from the Barnett Woodford, Haynesville, Marcellus and Doig units. AAPG Bull. 2012, 96, 1099–1119. [Google Scholar] [CrossRef]
  7. Karayiğit, A.İ.; Mastalerz, M.; Oskay, R.G.; Buzkan, İ. Bituminous coal seams from underground mines in the Zonguldak Basin (NW Turkey): Insights from mineralogy, coal petrography, Rock-Eval pyrolysis, and meso- and microporosity. Int. J. Coal Geol. 2018, 199, 91–122. [Google Scholar] [CrossRef]
  8. Ross, D.J.K.; Bustin, R.M. Characterizing the shale gas resource potential of Devonian-Mississippian strata in the Western Canada sedimentary basin: Application of an integrated formation evaluation. AAPG Bull. 2015, 92, 87–125. [Google Scholar] [CrossRef]
  9. Ross, D.J.K.; Bustin, R.M. The importance of shale composition and pore structure upon gas storage potential of shale gas reservoirs. Mar. Pet. Geol. 2009, 26, 916–927. [Google Scholar] [CrossRef]
  10. Bowker, K.A. Barnett shale gas production, Fort Worth Basin: Issues and discussion. AAPG Bull. 2007, 91, 523–533. [Google Scholar] [CrossRef]
  11. Thommes, M.; Kaneko, K.; Neimark, A.V.; Olivier, J.P.; Rodriguez-Reinoso, F.; Rouquerol, J.; Sing, K.S. Physisorption of gases, with special reference to the evaluation of surface area and pore size distribution (IUPAC Technical Report). Pure Appl. Chem. 2015, 87, 1051–1069. [Google Scholar] [CrossRef] [Green Version]
  12. Mastalerz, M.; He, L.; Melnichenko, B.Y.; Rupp, J.A. Porosity of coal and shale: Insights from gas adsorption and SANS/USANS techniques. Energy Fuels 2012, 26, 5109–5120. [Google Scholar] [CrossRef]
  13. Mastalerz, M.; Schimmelmann, A.; Drobniak, A.; Chen, Y. Porosity of Devonian and Mississippian New Albany Shale across a maturation gradient: Insights from organic petrology, gas adsorption, and mercury intrusion. AAPG Bull. 2013, 97, 1621–1643. [Google Scholar] [CrossRef]
  14. Milliken, K.L.; Rudnicki, M.; Awwiller, D.N.; Zhang, T. Organic matter-hosted pore system, Marcellus Formation (Devonian), Pennsylvania. AAPG Bull. 2013, 97, 177–200. [Google Scholar] [CrossRef]
  15. Furmann, A.; Mastalerz, M.; Bish, D.; Schimmelmann, A.; Pedersen, P.K. Porosity and pore size distribution in mudrocks from the Belle Fourche and Second White Specks formations in Alberta, Canada. AAPG Bull. 2016, 100, 1265–1288. [Google Scholar] [CrossRef]
  16. Wang, P.; Jiang, Z.; Ji, W.; Zhang, C.; Yuan, Y.; Chen, L.; Yin, L. Heterogeneity of intergranular, intraparticle and organic pores in Longmaxi shale in Sichuan Basin, South China: Evidence from SEM digital images and fractal and multifractal geometries. Mar. Pet. Geol. 2016, 72, 122–138. [Google Scholar] [CrossRef]
  17. Cao, T.T.; Song, Z.G.; Wang, S.B.; Cao, X.X.; Li, Y.; Xia, J. Characterizing the pore structure in the Silurian and Permian shales of the Sichuan Basin, China. Mar. Pet. Geol. 2015, 61, 140–150. [Google Scholar] [CrossRef]
  18. Chen, L.; Jiang, Z.X.; Liu, K.Y.; Tan, J.Q.; Gao, F.L.; Wang, P.F. Pore structure characterization for organic-rich lower Silurian shale in the upper Yangtze platform, South China: A ssible mechanism for pore development. J. Nat. Gas Sci. Eng. 2017, 46, 1–15. [Google Scholar] [CrossRef]
  19. Chen, S.; Tang, D.; Tao, S.; Xu, H.; Li, S.; Zhao, J.; Ren, P.; Fu, H. In-situ stress measurements and stress distribution characteristics of coal reservoirs in major coalfields in China: Implication for coalbed methane (CBM) development. Int. J. Coal Geol. 2017, 182, 66–84. [Google Scholar] [CrossRef]
  20. Lee, M.C.; Richard, J.H.; Hywel, J.S.; Thomas, R. Dual porosity modelling of the coupled mechanical response of coal to gas flow and adsorption. Int. J. Coal Geol. 2019, 205, 115–125. [Google Scholar]
  21. İnan, S.; Al Badairy, H.; İnan, T.; Al Zahrani, A. Formation and occurrence of organic matter-hosted porosity in shales. Int. J. Coal Geol. 2018, 199, 39–51. [Google Scholar] [CrossRef]
  22. Jiang, F.J.; Chen, D.; Wang, Z.F.; Xu, Z.Y.; Chen, J.; Liu, L.; Huyan, Y.Y.; Liu, Y. Pore characteristic analysis of a lacustrine shale: A case study in the Ordos Basin. NW China. Mar. Pet. Geol. 2016, 73, 554–571. [Google Scholar] [CrossRef]
  23. Chen, L.; Jiang, Z.X.; Liu, K.Y.; Wang, P.F.; Ji, W.M.; Gao, F.L.; Li, P.; Hu, T.; Zhang, B.; Huang, H.X. Effect of lithofacies on gas storage capacity of marine and continental shales in the Sichuan Basin, China. J. Nat. Gas Sci. Eng. 2016, 36, 773–785. [Google Scholar] [CrossRef]
  24. Sun, M.D.; Yu, B.S.; Hu, Q.H.; Yang, R.; Zhang, Y.F.; Li, B. Pore connectivity and tracer migration of typical shales in south China. Fuel 2017, 203, 32–46. [Google Scholar] [CrossRef]
  25. Curtis, M.E.; Sondergeld, C.H.; Ambrose, R.J.; Rai, C.S. Microstructural investigation of gas shales in two and three dimensions using nanometer-scale resolution imaging. AAPG Bull. 2012, 96, 665–677. [Google Scholar] [CrossRef]
  26. Xiong, J.; Liu, X.; Liang, L. Experimental study on the pore structure characteristics of the Upper Ordovician Wufeng Formation shale in the southwest portion of the Sichuan Basin, China. J. Nat. Gas. Sci. Eng. 2015, 22, 530–539. [Google Scholar] [CrossRef]
  27. Yang, F.; Ning, Z.; Liu, H. Fractal characteristics of shales from a shale gas reservoir in the Sichuan Basin, China. Fuel 2015, 115, 378–384. [Google Scholar] [CrossRef]
  28. Yang, C.; Zhang, J.C.; Wang, X.Z.; Tang, X.; Chen, Y.C.; Jiang, L.L.; Gong, X. Nanoscale pore structure and fractal characteristics of a marine-continental transitional shale: A case study from the lower Permian Shanxi Shale in the southeastern Ordos Basin, China. Mar. Pet. Geol. 2017, 88, 54–68. [Google Scholar] [CrossRef]
  29. Tang, X.L.; Jiang, Z.X.; Jiang, S.; Li, Z. Heterogeneous nanoporosity of the Silurian Longmaxi Formation shale gas reservoir in the Sichuan Basin using the QEMSCAN, FIB-SEM, and nano-CT methods. Mar. Pet. Geol. 2016, 78, 99–109. [Google Scholar] [CrossRef]
  30. Hu, Q.H.; Liu, X.G.; Gao, Z.Y.; Liu, S.G.; Zhou, W.; Hu, W.X. Pore structure and tracer migration behavior of typical American and Chinese shales. Pet. Sci. 2015, 12, 651–663. [Google Scholar] [CrossRef] [Green Version]
  31. Gao, Z.Y.; Hu, Q.H. Estimating permeability using median pore-throat radius obtained from mercury intrusion porosimetry. J. Geophys. Eng. 2013, 10, 025014. [Google Scholar] [CrossRef]
  32. Hu, Q.H.; Ewing, R.P.; Rowe, H.D. Low nanopore connectivity limits gas production in Barnett formation. J. Geophys. Res.-Solid Earth 2015, 120, 8073–8087. [Google Scholar] [CrossRef]
  33. Hu, Q.H.; Gao, X.; Gao, Z.; Ewing, R.; Dultz, S.; Kaufmann, J. Pore accessibility and connectivity of mineral and kerogen phases for shales. In Proceedings of the Unconventional Resources Technology Conference, Denver, CO, USA, 25–27 August 2014; pp. 1188–1204. [Google Scholar]
  34. Lan, Q.; Dehghanpour, H.; Wood, J.; Sanei, H. Wettability of the Montney Tight Gas Formation. SPE Reserv. Eval. Eng. 2015, 18, 417–431. [Google Scholar] [CrossRef]
  35. Gao, Z.; Yang, S.; Jiang, Z.; Zhang, K.; Chen, L. Investigating the spontaneous imbibition characteristics of continental Jurassic Ziliujing Formation shale from the northeastern Sichuan Basin and correlations to pore structure and composition. Mar. Pet. Geol. 2018, 98, 697–705. [Google Scholar] [CrossRef]
  36. Gao, Z.Y.; Hu, Q.H. Wettability of Mississippian Barnett Shale samples at different depths: Investigations from directional spontaneous imbibition. AAPG Bull. 2016, 100, 101–114. [Google Scholar] [CrossRef]
  37. Gao, Z.; Hu, Q. Pore structure and spontaneous imbibition characteristics of marine and continental shales in China. AAPG Bull. 2018, 102, 1941–1961. [Google Scholar] [CrossRef]
  38. Yang, R.; Hao, F.; He, S.; He, C.C.; Guo, X.S.; Yi, J.Z.; Hu, H.Y.; Zhang, S.W.; Hu, Q.H. Experimental investigations on the geometry and connectivity of pore space in organic-rich Wufeng and Longmaxi shales. Mar. Pet. Geol. 2017, 84, 225–242. [Google Scholar] [CrossRef]
  39. Wang, Y.; Pu, J.; Wang, L.H.; Wang, J.Q.; Jiang, Z.; Song, Y.F.; Wang, C.C.; Wang, Y.F.; Jin, C. Characterization of typical 3D pore networks of Jiulaodong formation shale using nanotransmission X-ray microscopy. Fuel 2016, 170, 84–91. [Google Scholar] [CrossRef]
  40. Saif, T.; Lin, Q.Y.; Bijeljic, B.; Martin, J.B. Microstructural imaging and characterization of oil shale before and after pyrolysis. Fuel 2017, 197, 562–574. [Google Scholar] [CrossRef]
  41. Liu, H.L.; Seaton, N.A. Determination of the connectivity of porous solids from nitrogen sorption measurements III. Solids containing large mesopores. Chem. Eng. Sci. 1994, 49, 1869–1878. [Google Scholar] [CrossRef]
  42. Liu, H.L.; Zhang, L.; Seaton, N.A. Determination of the connectivity of porous solids from nitrogen sorption measurements II. Generalization. Chem. Eng. Sci. 1992, 47, 4393–4404. [Google Scholar] [CrossRef]
  43. Liu, H.L.; Lai, B.T.; Chen, J.H. Unconventional spontaneous imbibition into shale matrix: Theory and a methodology to determine relevant parameters. Transp. Porous Media 2016, 111, 41–57. [Google Scholar] [CrossRef]
  44. Seaton, N.A. Determination of the connectivity of porous solids from nitrogen sorption measurements. Chem. Eng. Sci. 1991, 46, 1895–1909. [Google Scholar] [CrossRef]
  45. Armatas, G.S.; Salmas, C.E.; Louloudi, M.; Androutsopoulos, G.P.; Pomonis, P.J. Relationships among pore size, connectivity, dimensionality of capillary condensation, and pore structure tortuosity of functionalized mesoporous silica. Langmuir 2003, 19, 3128–3136. [Google Scholar] [CrossRef]
  46. Hu, Q.; Ewing, R.P.; Dultz, S. Low pore connectivity in natural rock. J. Contam. Hydrol. 2012, 133, 76–83. [Google Scholar] [CrossRef] [PubMed]
  47. Gao, F.; Song, Y.; Li, Z.; Xiong, F.; Chen, L.; Zhang, X.; Chen, Z.; Moortgat, J. Quantitative characterization of pore connectivity using NMR and MIP: A case study of the Wangyinpu and Guanyintang shales in the Xiuwu basin, Southern China. Int. J. Coal Geol. 2018, 197, 53–65. [Google Scholar] [CrossRef]
  48. Ning, C.; Jiang, Z.; Gao, Z.; Su, S.; Li, T.; Wang, G.; Chen, L. Characteristics and controlling factors of reservoir space of mudstone and shale in Es3x in the Zhanhua Sag. Mar. Pet. Geol. 2017, 88, 214–224. [Google Scholar] [CrossRef]
  49. Ghanbari, E.; Dehghanpour, H. The fate of fracturing water: A field and simulation study. Fuel 2016, 163, 282–294. [Google Scholar] [CrossRef]
  50. Dehghanpour, H.; Zubair, H.A.; Chhabra, A.; Ullah, A. Liquid Intake of Organic Shales. Energy Fuels 2012, 26, 5750–5758. [Google Scholar] [CrossRef]
  51. Jiang, S.; Tang, X.L.; Cai, D.S.; Xue, G.; He, Z.L.; Long, S.X.; Peng, Y.M.; Gao, B.; Xu, Z.Y.; Dahdah, N. Comparison of marine, transitional, and lacustrine shales: A case study from the Sichuan Basin in China. J. Pet. Sci. Eng. 2017, 150, 334–347. [Google Scholar] [CrossRef]
  52. Zhang, D.; Li, Y.; Zhang, J.; Qiao, D.; Jiang, W.; Zhang, J. National Survey and Assessment of Shale Gas Resource Potential in China; Geologic Publishing House: Beijing, China, 2012; pp. 8–92. (In Chinese) [Google Scholar]
  53. Jiang, S.; Xu, Z.; Feng, Y.; Zhang, J.; Cai, D.; Chen, L.; Wu, Y.; Zhou, D.S.; Bao, S.J.; Long, S.X. Geologic characteristics of hydrocarbon-bearing marine, transitional and lacustrine shales in china. J. Asian Earth Sci. 2015, 115, 404–418. [Google Scholar] [CrossRef]
  54. Lu, R.J. The Evaluation of Deep Source Rocks in Changling Fault Depression of Songliao Southern Basin. Ph.D. Thesis, Northeast Petroleum University, Daqing, China, 2011. (In Chinese). [Google Scholar]
  55. Sun, D. The Prediction of Source Rocks Distribution and the Research of Hydrocarbon Generation Potential of Changling Fault Depression. Ph.D. Thesis, Northeast Petroleum University, Daqing, China, 2014. (In Chinese). [Google Scholar]
  56. Tang, Y.; Yang, R.Z.; Zhu, J.; Yin, S.; Fan, T.; Dong, Y.; Hou, Y. Analysis of continental shale gas accumulation conditions in a rifted basin: A case study of Lower Cretaceous shale in the southern Songliao Basin, northeastern China. Mar. Pet. Geol. 2019, 101, 389–409. [Google Scholar] [CrossRef]
  57. Hao, F.; Zou, H.Y.; Lu, Y.C. Mechanisms of shale gas storage: Implications for shale gas exploration in China. AAPG Bull. 2013, 97, 1325–1346. [Google Scholar] [CrossRef]
  58. Li, Z.; Liang, Z.K.; Jiang, Z.X.; Gao, F.L.; Zhang, Y.H.; Yu, H.L.; Xiao, L.; Yang, Y.D. The Impacts of Matrix Compositions on Nanopore Structure and Fractal Characteristics of Lacustrine Shales from the Changling Fault Depression, Songliao Basin, China. Minerals 2019, 9, 127. [Google Scholar] [CrossRef]
  59. Gao, F.L.; Song, Y.; Li, Z.; Xiong, F.Y.; Chen, L.; Zhang, Y.H.; Liang, Z.K.; Zhang, X.X.; Chen, Z.Y.; Joachim, M. Lithofacies and reservoir characteristics of the Lower Cretaceous continental Shahezi Shale in the Changling Fault Depression of Songliao Basin, NE China. Mar. Pet. Geol. 2018, 98, 401–421. [Google Scholar] [CrossRef]
  60. Yang, G.; Zhao, Z.Y.; Shao, M.L. Formation of carbon dioxide and hydrocarbon gas reservoirs in the Changling fault depression, Songliao Basin. Pet. Explor. Dev. 2011, 38, 52–58. [Google Scholar]
  61. Wu, H.Y.; Liang, X.D.; Xiang, C.F.; Wang, Y.W. Characteristics of petroleum accumulation in syncline of the Songliao basin and discussion on its accumulation mechanism. Sci. China 2007, 50, 702–709. [Google Scholar] [CrossRef]
  62. Lin, J.H.; Jiang, T.; Song, L.B.; Cao, Y.; Xia, D.; Wang, Y. The origin and gas vertical distribution of the Harjin mixed-gas reservoir. Acta Pet. Sin. 2010, 34, 927–932. [Google Scholar]
  63. Gao, Z.Y.; Hu, Q.H. Initial water saturation and imbibition fluid affect spontaneous imbibition into Barnett shale samples. J. Nat. Gas Sci. Eng. 2016, 34, 541–551. [Google Scholar] [CrossRef]
  64. Graue, A.; Fernø, M.A. Water mixing during spontaneous imbibition at different boundary and wettability conditions. J Pet. Sci. Eng. 2011, 78, 586–595. [Google Scholar] [CrossRef]
  65. Mason, G.; Fischer, H.; Morrow, N.R.; Ruth, D.W.; Wo, S. Effect of sample shape on counter-current spontaneous imbibition production vs time curves. J. Petrol. Sci. Eng. 2009, 66, 83–97. [Google Scholar] [CrossRef]
  66. Jiao, K.; Ye, Y.H.; Liu, S.G.; Ran, B.; Deng, B.; Li, Z.W.; Li, J.X.; Yong, Z.Q.; Sun, W. Characterization and Evolution of Nanoporosity in Superdeeply Buried Shales: A Case Study of the Longmaxi and Qiongzhusi Shales from MS Well #1, North Sichuan Basin, China. Energy Fuels 2018, 32, 191–203. [Google Scholar]
  67. Sing, K.S.W.; Everett, D.H.; Haul, R.A.W.; Mescou, L.; Pierotti, R.A.; Rouquerol, J.; Siemieniewska, T. Reporting physisorption data for gas/solid systems with special reference to the determination of surface area and porosity. Pure Appl. Chem. 1985, 57, 603–619. [Google Scholar] [CrossRef]
  68. Yang, R.; Hu, Q.H.; He, S.; Hao, F.; Guo, X.S.; Yi, J.Z.; He, X.P. Pore structure, wettability and tracer migration in four leading shale formations in the Middle Yangtze Platform, China. Mar. Pet. Geol. 2018, 89, 415–427. [Google Scholar] [CrossRef]
  69. Gao, Z.Y.; Hu, Q.H. Investigating the Effect of Median Pore-Throat Diameter on Spontaneous Imbibition. J. Porous Media 2015, 18, 1231–1238. [Google Scholar] [CrossRef]
  70. Dehghanpour, H.; Lan, Q.; Saeed, Y.; Fei, H.; Qi, Z. Spontaneous Imbibition of Brine and Oil in Gas Shales: Effect of Water Adsorption and Resulting Microfractures. Energy Fuels 2013, 27, 3039–3049. [Google Scholar] [CrossRef]
  71. Hu, M.Q.; Persoff, P.; Wang, J.S.Y. Laboratory measurement of water imbibition into low-permeability welded tuff. J. Hydrol. 2001, 242, 64–78. [Google Scholar] [CrossRef]
  72. Ma, S.; Morrow, N.R.; Zhang, X. Generalized scaling of spontaneous imbibition data for strongly water-wet systems. J. Petrol. Sci. Eng. 1997, 18, 165–178. [Google Scholar]
  73. Guo, C.; Xu, J.; Wu, K.; Wei, M.; Liu, S. Study on gas flow through nano pores of shale gas reservoirs. Fuel 2015, 143, 107–117. [Google Scholar] [CrossRef]
  74. Ghanizadeh, A.; Clarkson, C.R.; Aquino, S.; Ardakani, O.H.; Sanei, H. Petrophysical and geomechanical characteristics of Canadian tight oil and liquid-rich gas reservoirs: I. Pore network and permeability characterization. Fuel 2015, 153, 664–681. [Google Scholar] [CrossRef]
  75. Anovitz, L.M.; Cole, D.R. Characterization and analysis of porosity and pore structures. Rev. Mineral. Geochem. 2015, 80, 61–164. [Google Scholar] [CrossRef]
  76. Pommer, M.; Milliken, K. Pore types and pore-size distributions across thermal maturity, Eagle Ford Formation, southern Texas Pores across Thermal Maturity, Eagle Ford. AAPG Bull. 2015, 99, 1713–1744. [Google Scholar] [CrossRef]
  77. Hsieh, P.A.; Tracy, J.V.; Neuzil, C.E.; Bredehoeft, J.D.; Silliman, S.E. A transient laboratory method for determining the hydraulic properties of ‘tight’rocks—I. Theory. In International Journal of Rock Mechanics and Mining Sciences & Geomechanics Abstracts; Pergamon: Oxford, UK, 1981; pp. 245–252. [Google Scholar]
  78. Cui, X.; Bustin, A.M.M.; Bustin, R.M. Measurements of gas permeability and diffusivity of tight reservoir rocks: Different approaches and their applications. Geofluids 2009, 9, 208–223. [Google Scholar] [CrossRef]
  79. Jia, B.; Feng, R.; Tsau, J.S.; Barati, R. Multiphysical Flow Behavior in Shale and Permeability Measurement by Pulse-Decay Method. In Petrophysical Characterization and Fluids Transport in Unconventional Reservoirs; Elsevier: Amsterdam, The Netherlands, 2019; pp. 301–324. [Google Scholar]
  80. Javadpour, F.; Fisher, D.; Unsworth, M. Nanoscale gas flow in shale gas sediments. J. Can. Pet. Technol. 2007, 46, 55–61. [Google Scholar] [CrossRef]
  81. Hughes, J.D. Energy: A reality check on the shale revolution. Nature 2013, 494, 307–308. [Google Scholar] [CrossRef]
  82. Hensen, E.J.; Smit, B. Why clays swell. J. Phys. Chem. B. 2002, 106, 12664–12667. [Google Scholar] [CrossRef]
  83. Odusina, E.; Sondergeld, C.; Rai, C. An NMR study on shale wettability. In Proceedings of the Canadian Unconventional Resources Conference, Calgary, AL, Canada, 15–17 November 2011; pp. 1–15. [Google Scholar]
  84. Shen, Y.; Ge, H.; Li, C.; Yang, X.; Ren, K.; Yang, Z.; Su, S. Water imbibition of shale and its potential influence on shale gas recovery—A comparative study of marine and continental shale formations. J. Nat. Gas Sci. Eng. 2016, 35, 1121–1128. [Google Scholar] [CrossRef]
  85. Li, T.; Jiang, Z.; Li, Z.; Wang, P.; Xu, C.; Liu, G.; Su, S.; Ning, C. Continental shale pore structure characteristics and their controlling factors: A case study from the lower third member of the Shahejie Formation, Zhanhua Sag, Eastern China. J. Nat. Gas Sci. Eng. 2017, 45, 670–692. [Google Scholar] [CrossRef]
Figure 1. (a) Location map of the Changling Fault Depression (CFD). (b) Location map of the study area and the sub-tectonic units of the CFD in southern Songliao Basin. (c) Cross section across the CFD showing the structural pattern and stratigraphic intervals. (d) Stratigraphic column showing the lithology of the strata and lithology in the CFD.
Minerals 09 00198 g001
Figure 2. Field emission-scanning electron microcopy (FE-SEM) images of pores in the Shahezi shale samples. (a,b) Organic particle with relatively large organic matter (OM) pores showing heterogeneous distribution and high connectivity (TS-6-4, siliceous shale); (c) organic particle distributed as lumps with poorly developed and isolated OM pores (TS-6-7, argillaceous shale); (d,e) interP pores in illite grains containing a cleavage-sheet (TS-6-7, argillaceous shale); (f) shale sample contains coexisted intercrystal line interP pores, intraP pores and OM pores (TS-6-4, siliceous shale); (g) dissolution-rim and intraP pores in calcite crystals (TS-6-5, calcareous shale); (h,i) linear interP pore along clay grains (TS-6-7, argillaceous shale).
Minerals 09 00198 g002
Figure 3. Pore size distribution (PSD) of the selected lacustrine shale samples from CFD. The micropores are obtained from low pressure CO2 adsorption data, the mesopores from low pressure N2 adsorption data, and the macropores from mercury intrusion capillary pressure (MICP) experiments.
Minerals 09 00198 g003
Figure 4. (a) The percentage of pore volume and (b) specific surface area of micropores, mesopores, macropores of lacustrine shales from the CFD.
Minerals 09 00198 g004
Figure 5. Plots of log cumulative n-decane spontaneous fluid imbibition (SFI) versus log imbibition time for the lacustrine Shahezi shales from the CFD. (a) Argillaceous shale (TS-6-1) with slope of 0.36; (b) argillaceous shale (TS-6-7) with slope of 0.55; (c) argillaceous shale (TS-6-8) with slope of 0.42; (d) siliceous shale (TS-6-3) with slope of 0.38; (e) siliceous shale (TS-6-4) with slope of 0.48; (f) calcareous shale (TS-6-5) with slope of 0.34.
Minerals 09 00198 g005
Figure 6. Plots of log cumulative DI water SFI versus log imbibition time for the lacustrine Shahezi shales from the CFD. (a) Argillaceous shale (TS-6-1) with slope of 0.22; (b) argillaceous shale (TS-6-7) with slope of 0.26; (c) argillaceous shale (TS-6-8) with slope of 0.25; (d) siliceous shale (TS-6-3) with slope of 0.23; (e) siliceous shale (TS-6-4) with slope of 0.28; (f) calcareous shale (TS-6-5) with slope of 0.38.
Minerals 09 00198 g006
Figure 7. Slopes of the n-decane SFI and DI water SFI of different lithofacies of the lacustrine Shahezi shales from the CFD.
Minerals 09 00198 g007
Figure 8. Correlations of (a) the effective tortuosity and (b) geometrical tortuosity with the DI water SFI slopes of different lithofacies of the lacustrine Shahezi shales from the CFD.
Minerals 09 00198 g008
Figure 9. Correlations of the geometrical tortuosity (Le/L) with (a) the total organic carbon (TOC) contents, (b) quartz contents; (c) carbonate contents and (d) clay mineral contents of the lacustrine Shahezi shales from the CFD.
Minerals 09 00198 g009
Table 1. Basic properties of lacustrine shale samples from the lower Cretaceous Shahezi Formation in the Changling Fault Depression (CFD).
Sample IDDepth Beneath to Surface (m)LithofaciesTotal Organic Carbon (wt %)Mineral Composition (wt %)
QuartzFeldsparCalciteDolomitePyriteSideriteClayMixed Illite-SmectiteIlliteChlorite
TS-6-13696.00–3696.03Argillaceous Shale1.0921.18.91.21.62.30.863.272199
TS-6-33734.30–3743.32Siliceous Shale2.2736.113.23.80.51.8-45.2662311
TS-6-43738.00–3738.05Siliceous Shale4.6438.57.22.72.12.20.845741610
TS-6-53759.00–3759.02Calcareous Shale2.1230.15.230.5--3.130.1672013
TS-6-73765.00–3765.03Argillaceous Shale4.7529.68.30.92.41.80.350.979138
TS-6-83787.30–3787.33Argillaceous Shale2.1830.59.62.91.32.6-51.375169
Table 2. Image processing results of the Shahezi shales with various lithofacies in the CFD.
Sample IDLithofaciesPore TypeNumber of PoresPercentage (%)Pore Size (nm)Fractal Dimension
Min ValueMax ValueMean
TS-6-4Siliceous ShaleOM pore6730.7330.7890.5113.61.68
InterP pore11653.2157.8458.790.11.24
IntraP pore3516.0645.9210.854.21.08
TS-6-5Calcareous ShaleOM pore00----
InterP pore4463.77192.9336.5181.71.17
IntraP pore2536.2378.5423.9193.11.21
TS-6-7Argillaceous ShaleOM pore13222.6842.6155.956.31.52
InterP pore33657.7378.4801.7224.61.72
IntraP pore11419.5955.9231.689.31.38
Table 3. Pore structure parameters obtained from low pressure gas physisorption and mercury intrusion capillary pressure (MICP) of lacustrine shale samples from the Shahezi Formation in the CFD.
Sample IDCO2 PhysisorptionN2 PhysisorptionMercury Injection Capillary PressureTotal Pore Surfaces Areas (m2/g)Total Pore Volumes (cm3/100 g)
DFT Surface Area (m2/g)DFT Pore Volume (cm3/100 g)BET Surface Area (m2/g)BJH Pore Volume (cm3/100 g)Average Pore Size (nm)Surface Area (m2/g)Pore Volume (cm3/100 g)Porosity (%)TortuosityLe/L
TS-6-16.4780.122.4130.389.850.0100.291.2959228.74 8.9010.79
TS-6-38.2230.182.8150.408.850.0090.612.4224957.77 11.0471.19
TS-6-414.8430.263.5230.497.990.0070.393.0118797.52 18.3731.14
TS-6-56.3850.443.8710.756.130.0050.191.8621126.27 10.2611.38
TS-6-78.5320.362.3890.517.040.0090.282.0824587.15 10.931.15
TS-6-813.7520.332.5460.4913.680.0070.253.2221608.34 16.3051.07

