Magma Mixing Genesis of the Mafic Enclaves in the Qingshanbao Complex of Longshou Mountain, China: Evidence from Petrology, Geochemistry, and Zircon Chronology

Abstract
:1. Introduction
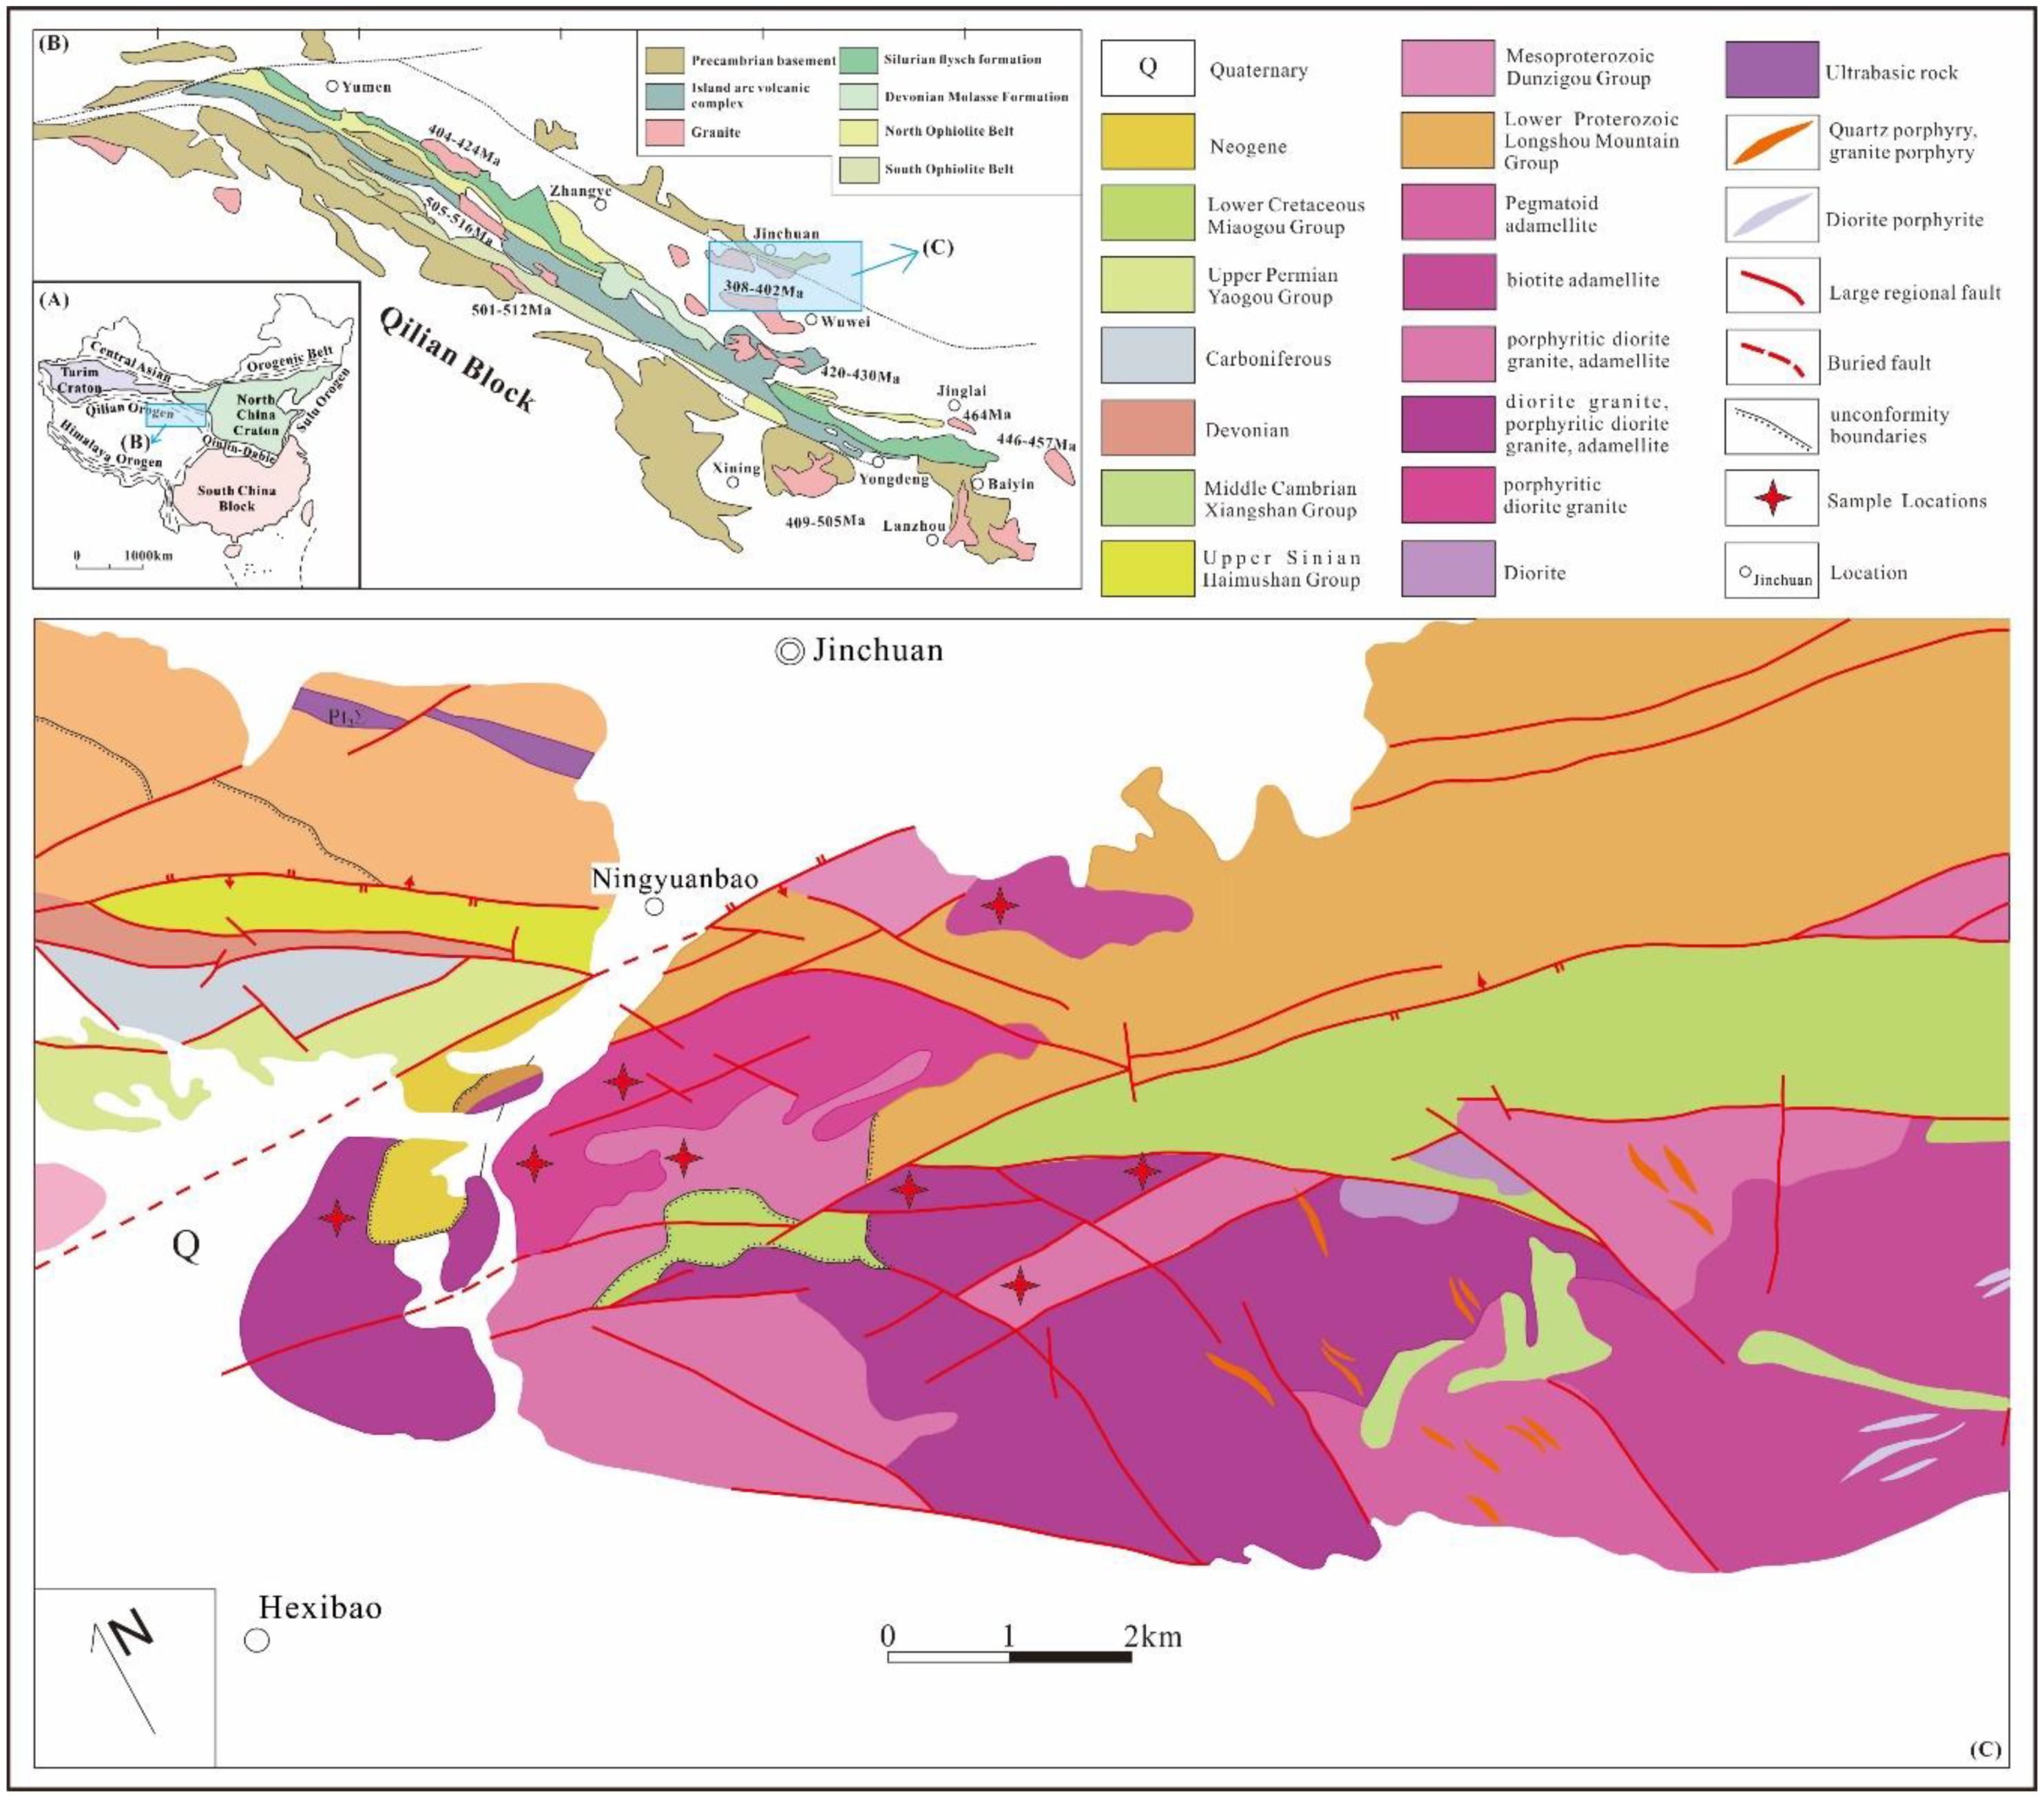
2. Geological Summary
3. Petrographic Characteristics
4. Analytical Methods
5. Mineralogical Characteristics
6. Elemental Geochemical Characteristics
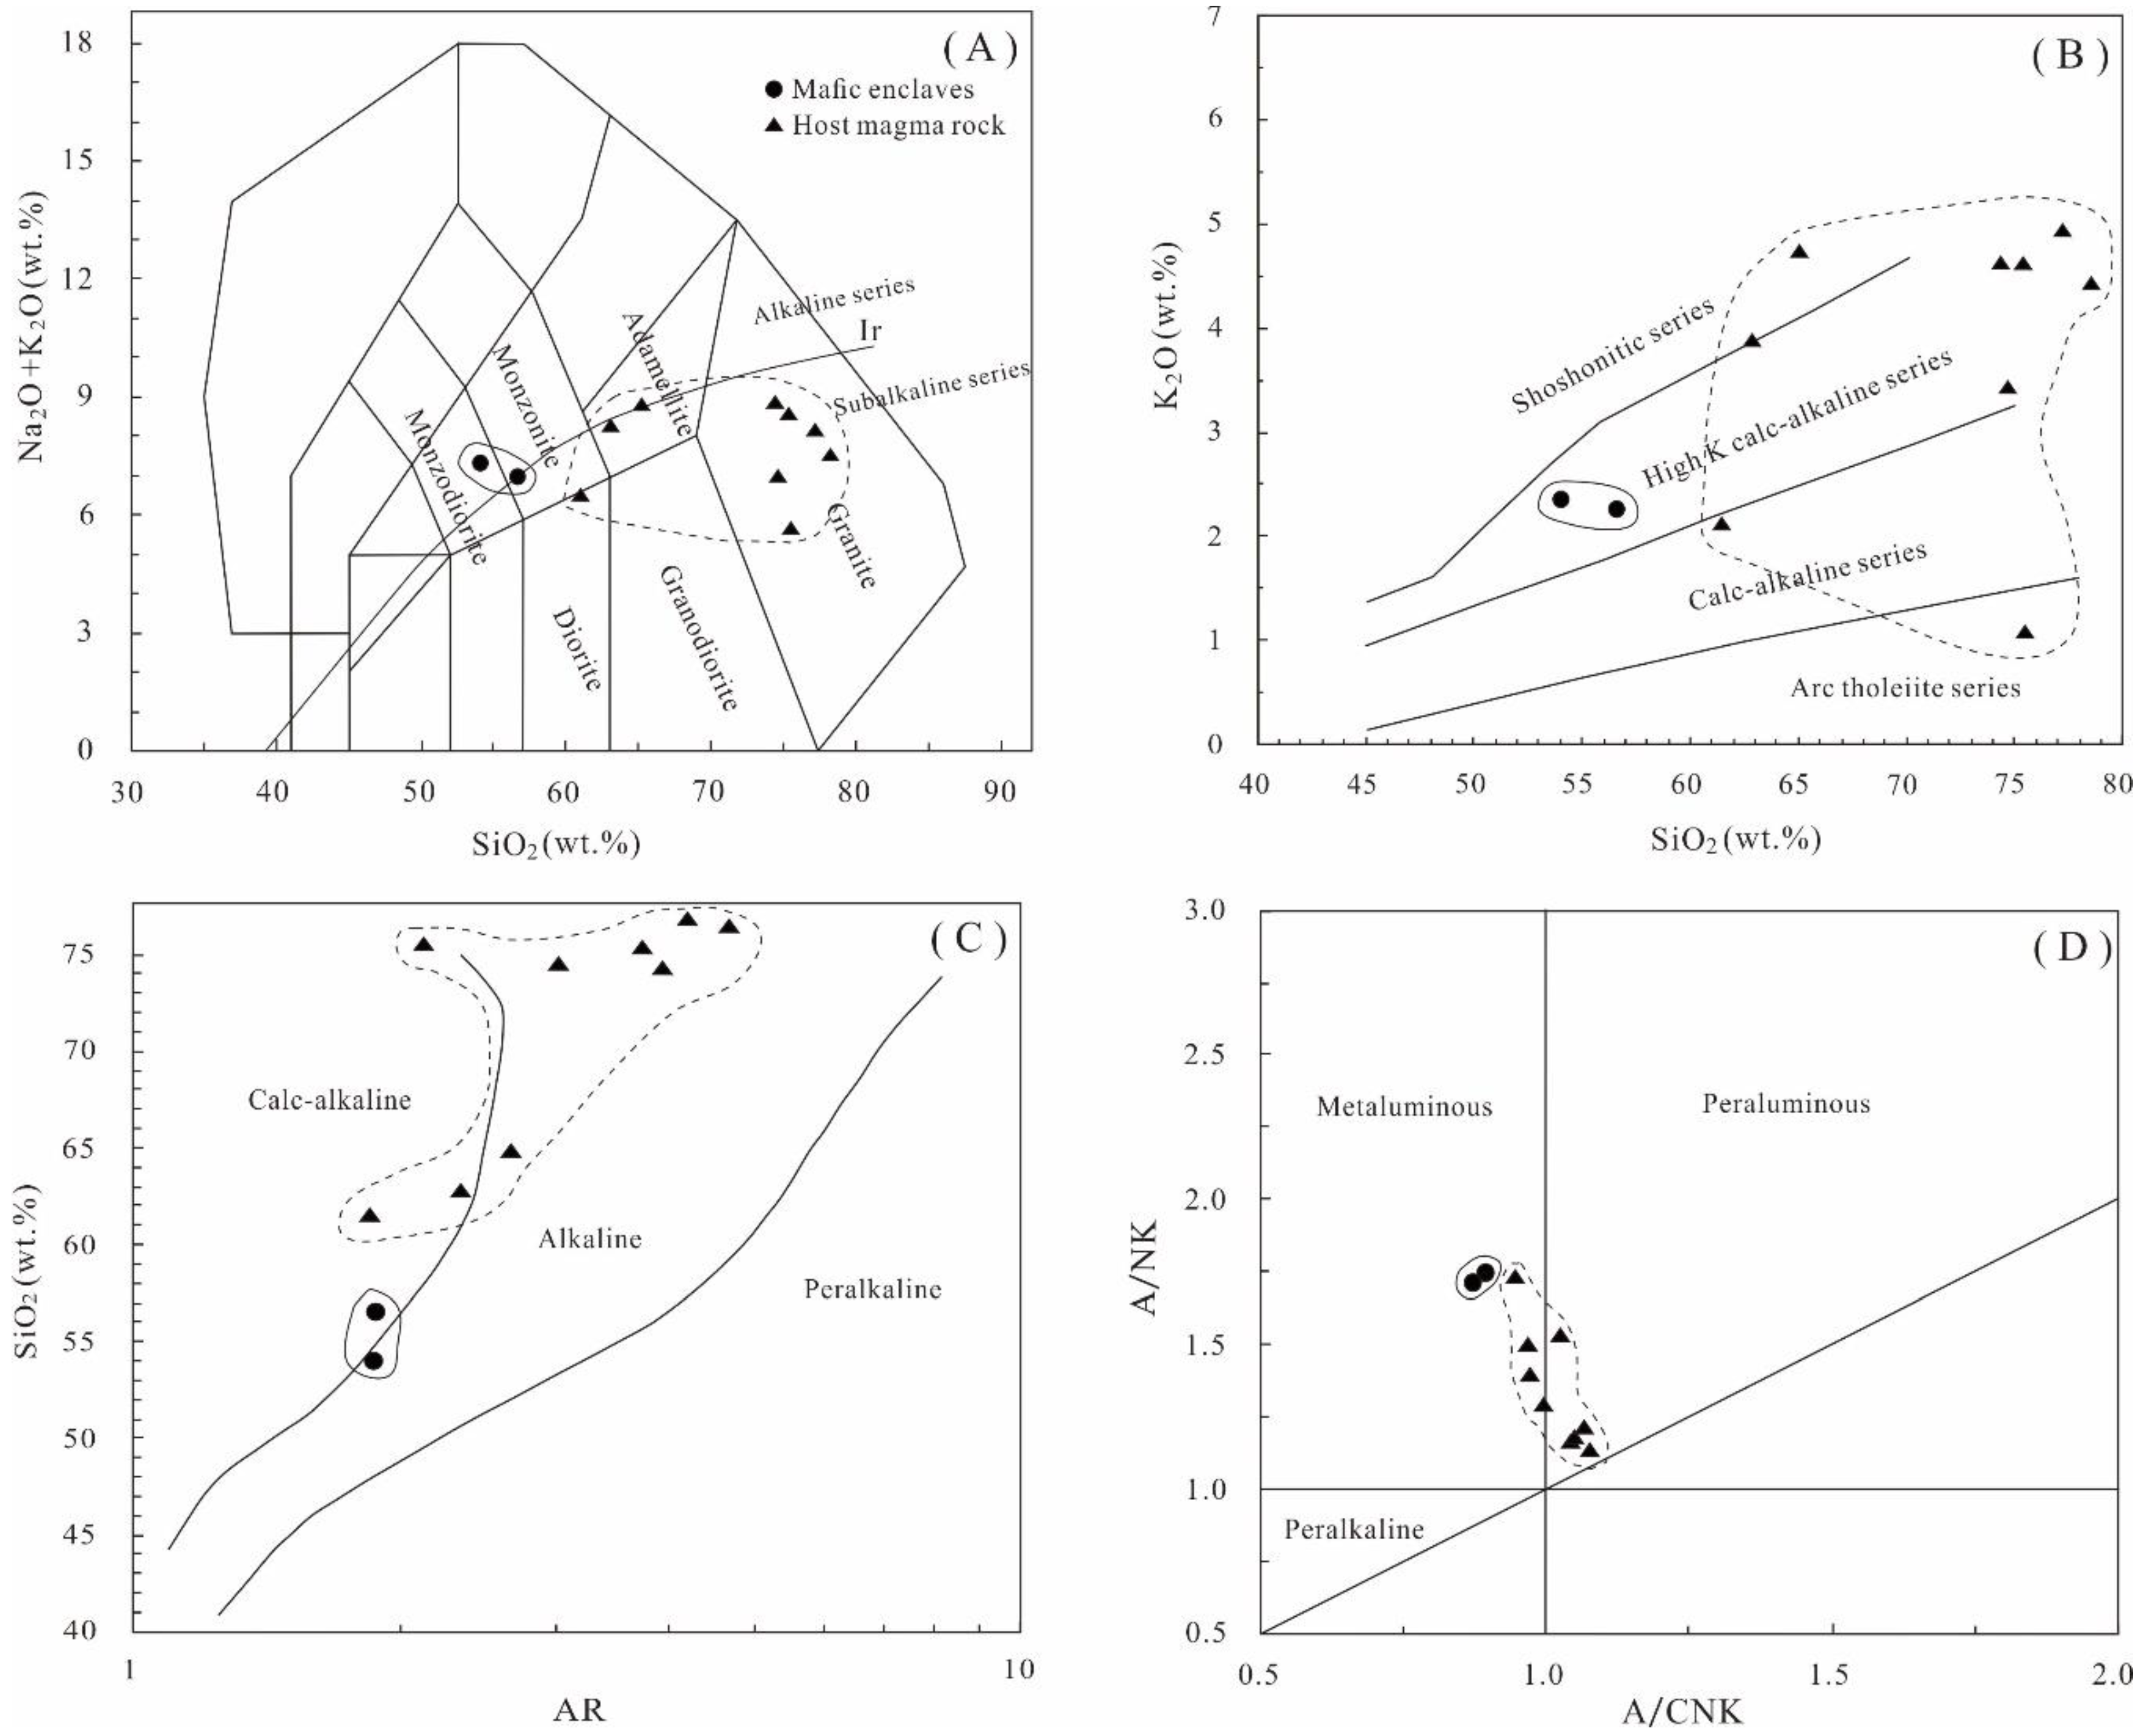
6.1. Geochemical Characteristics of Major Elements
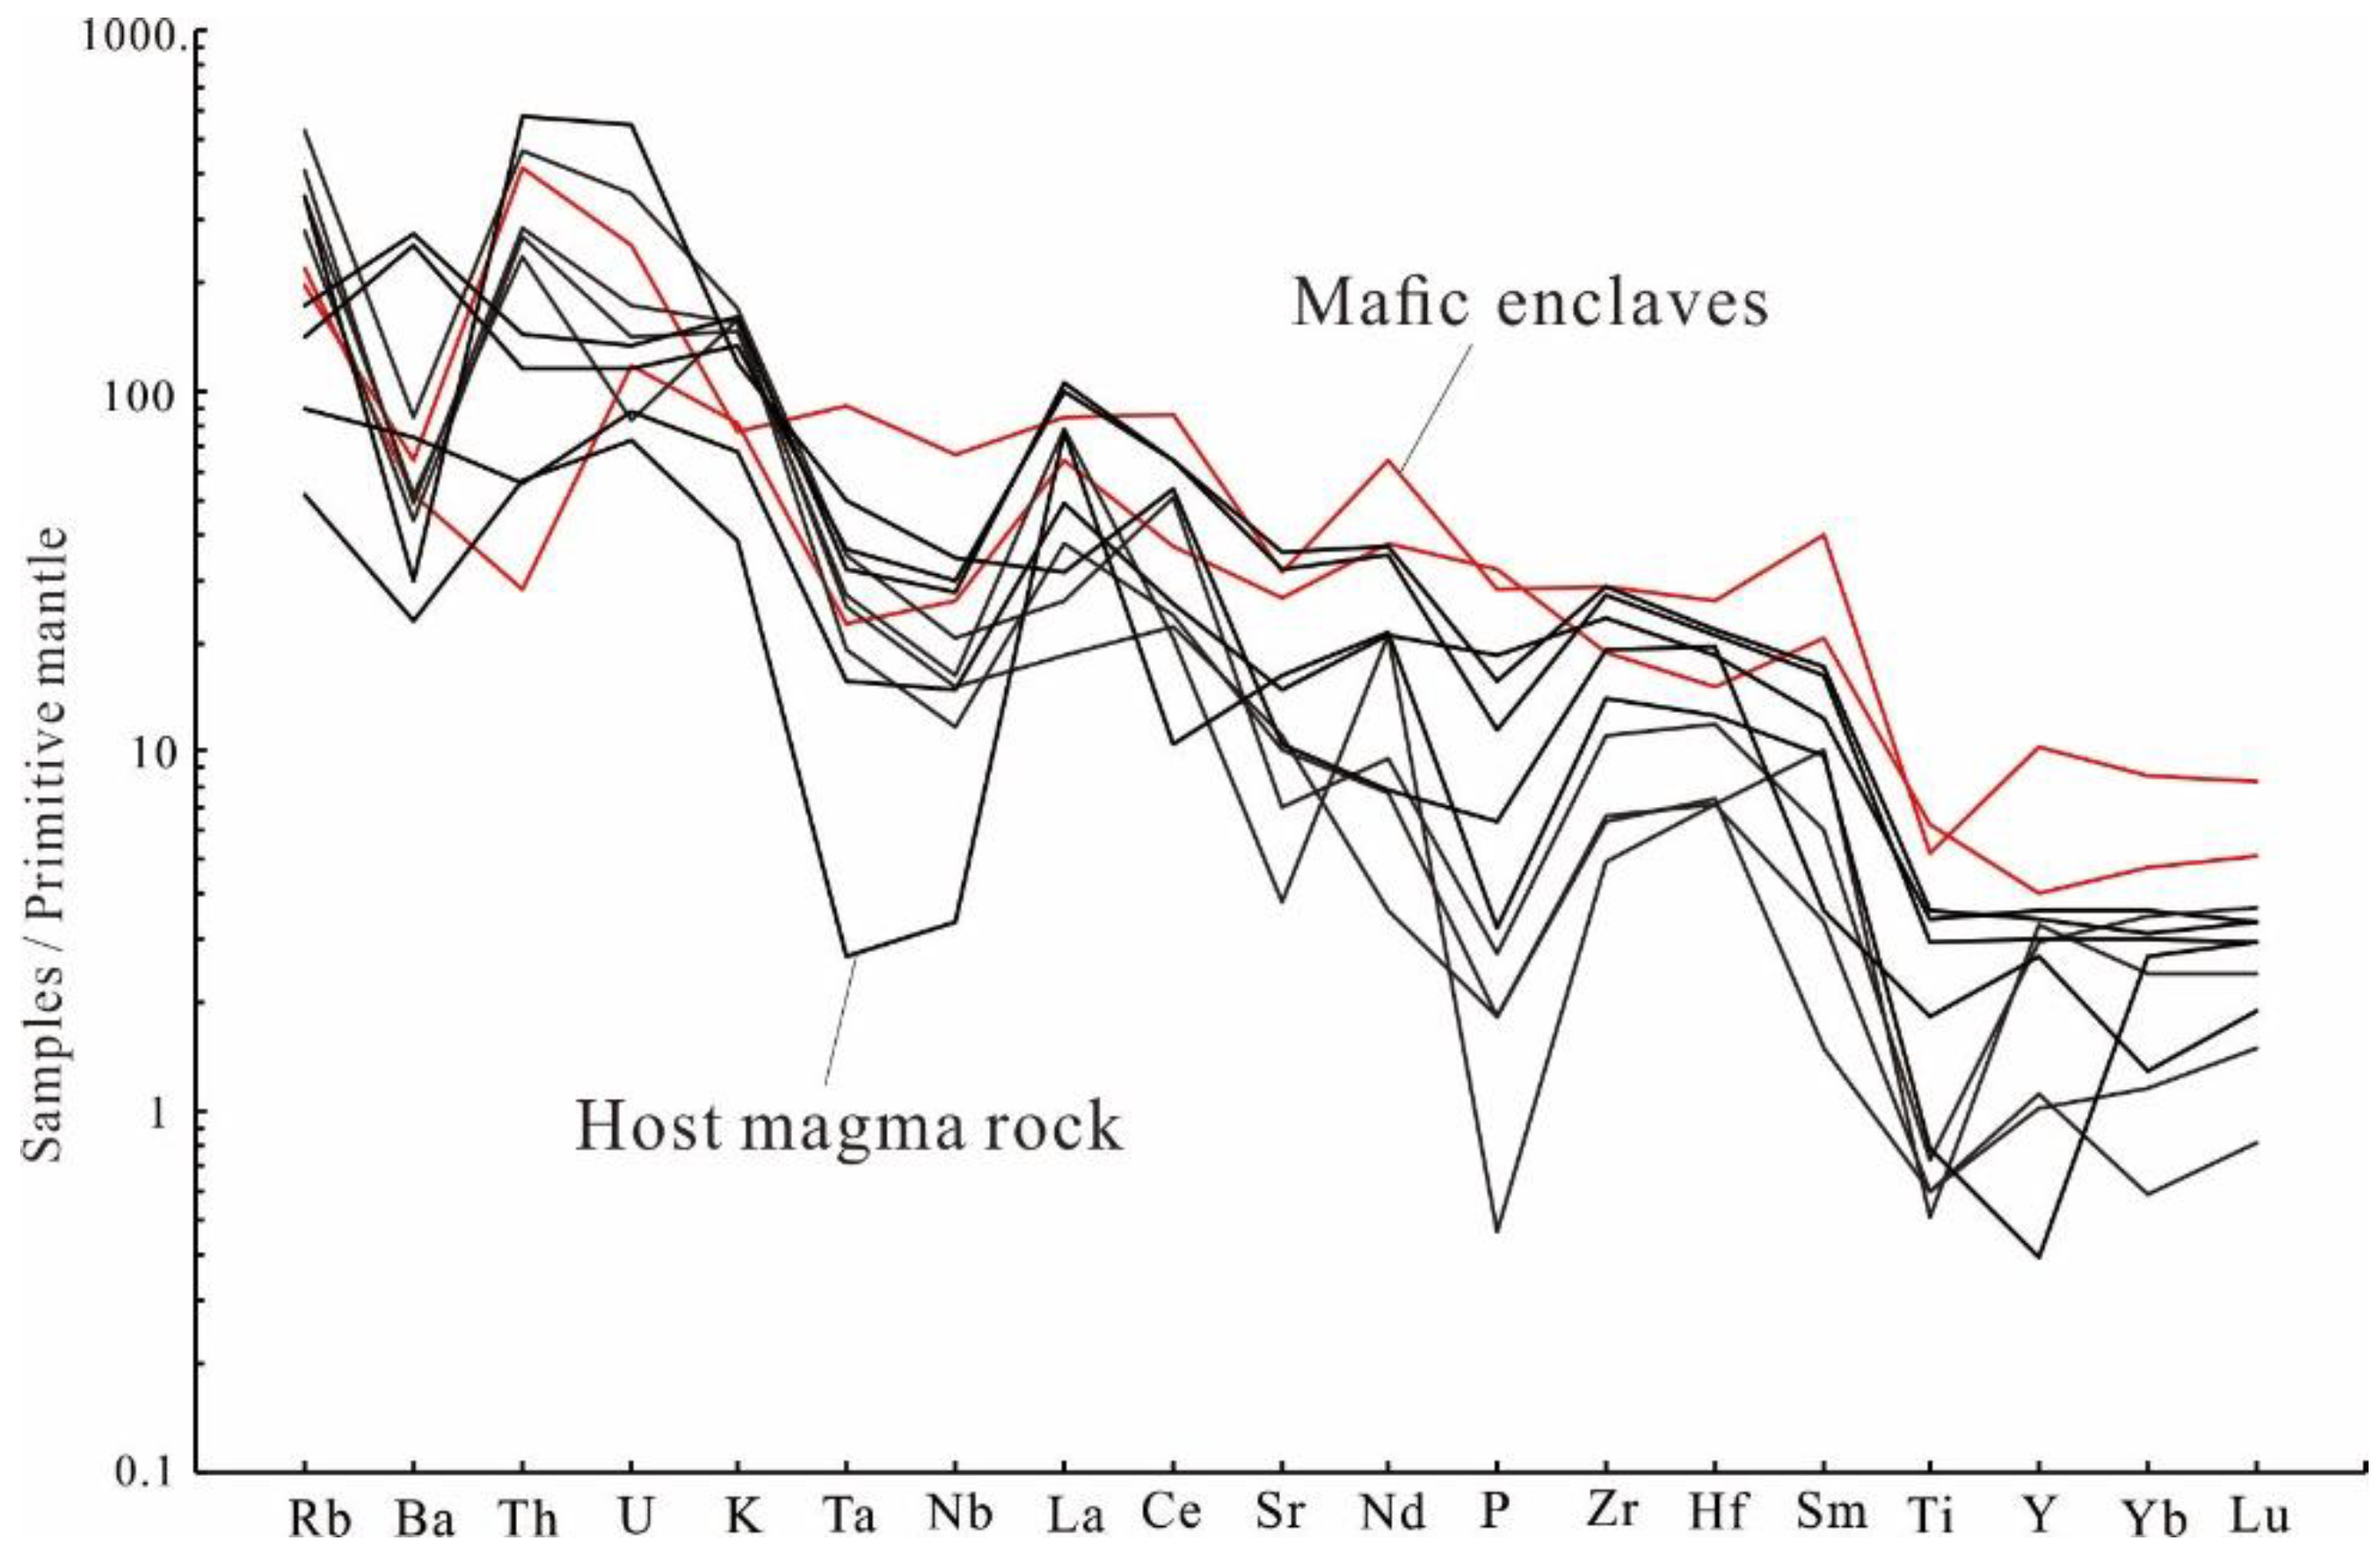
6.2. Trace Element Geochemical Characteristics
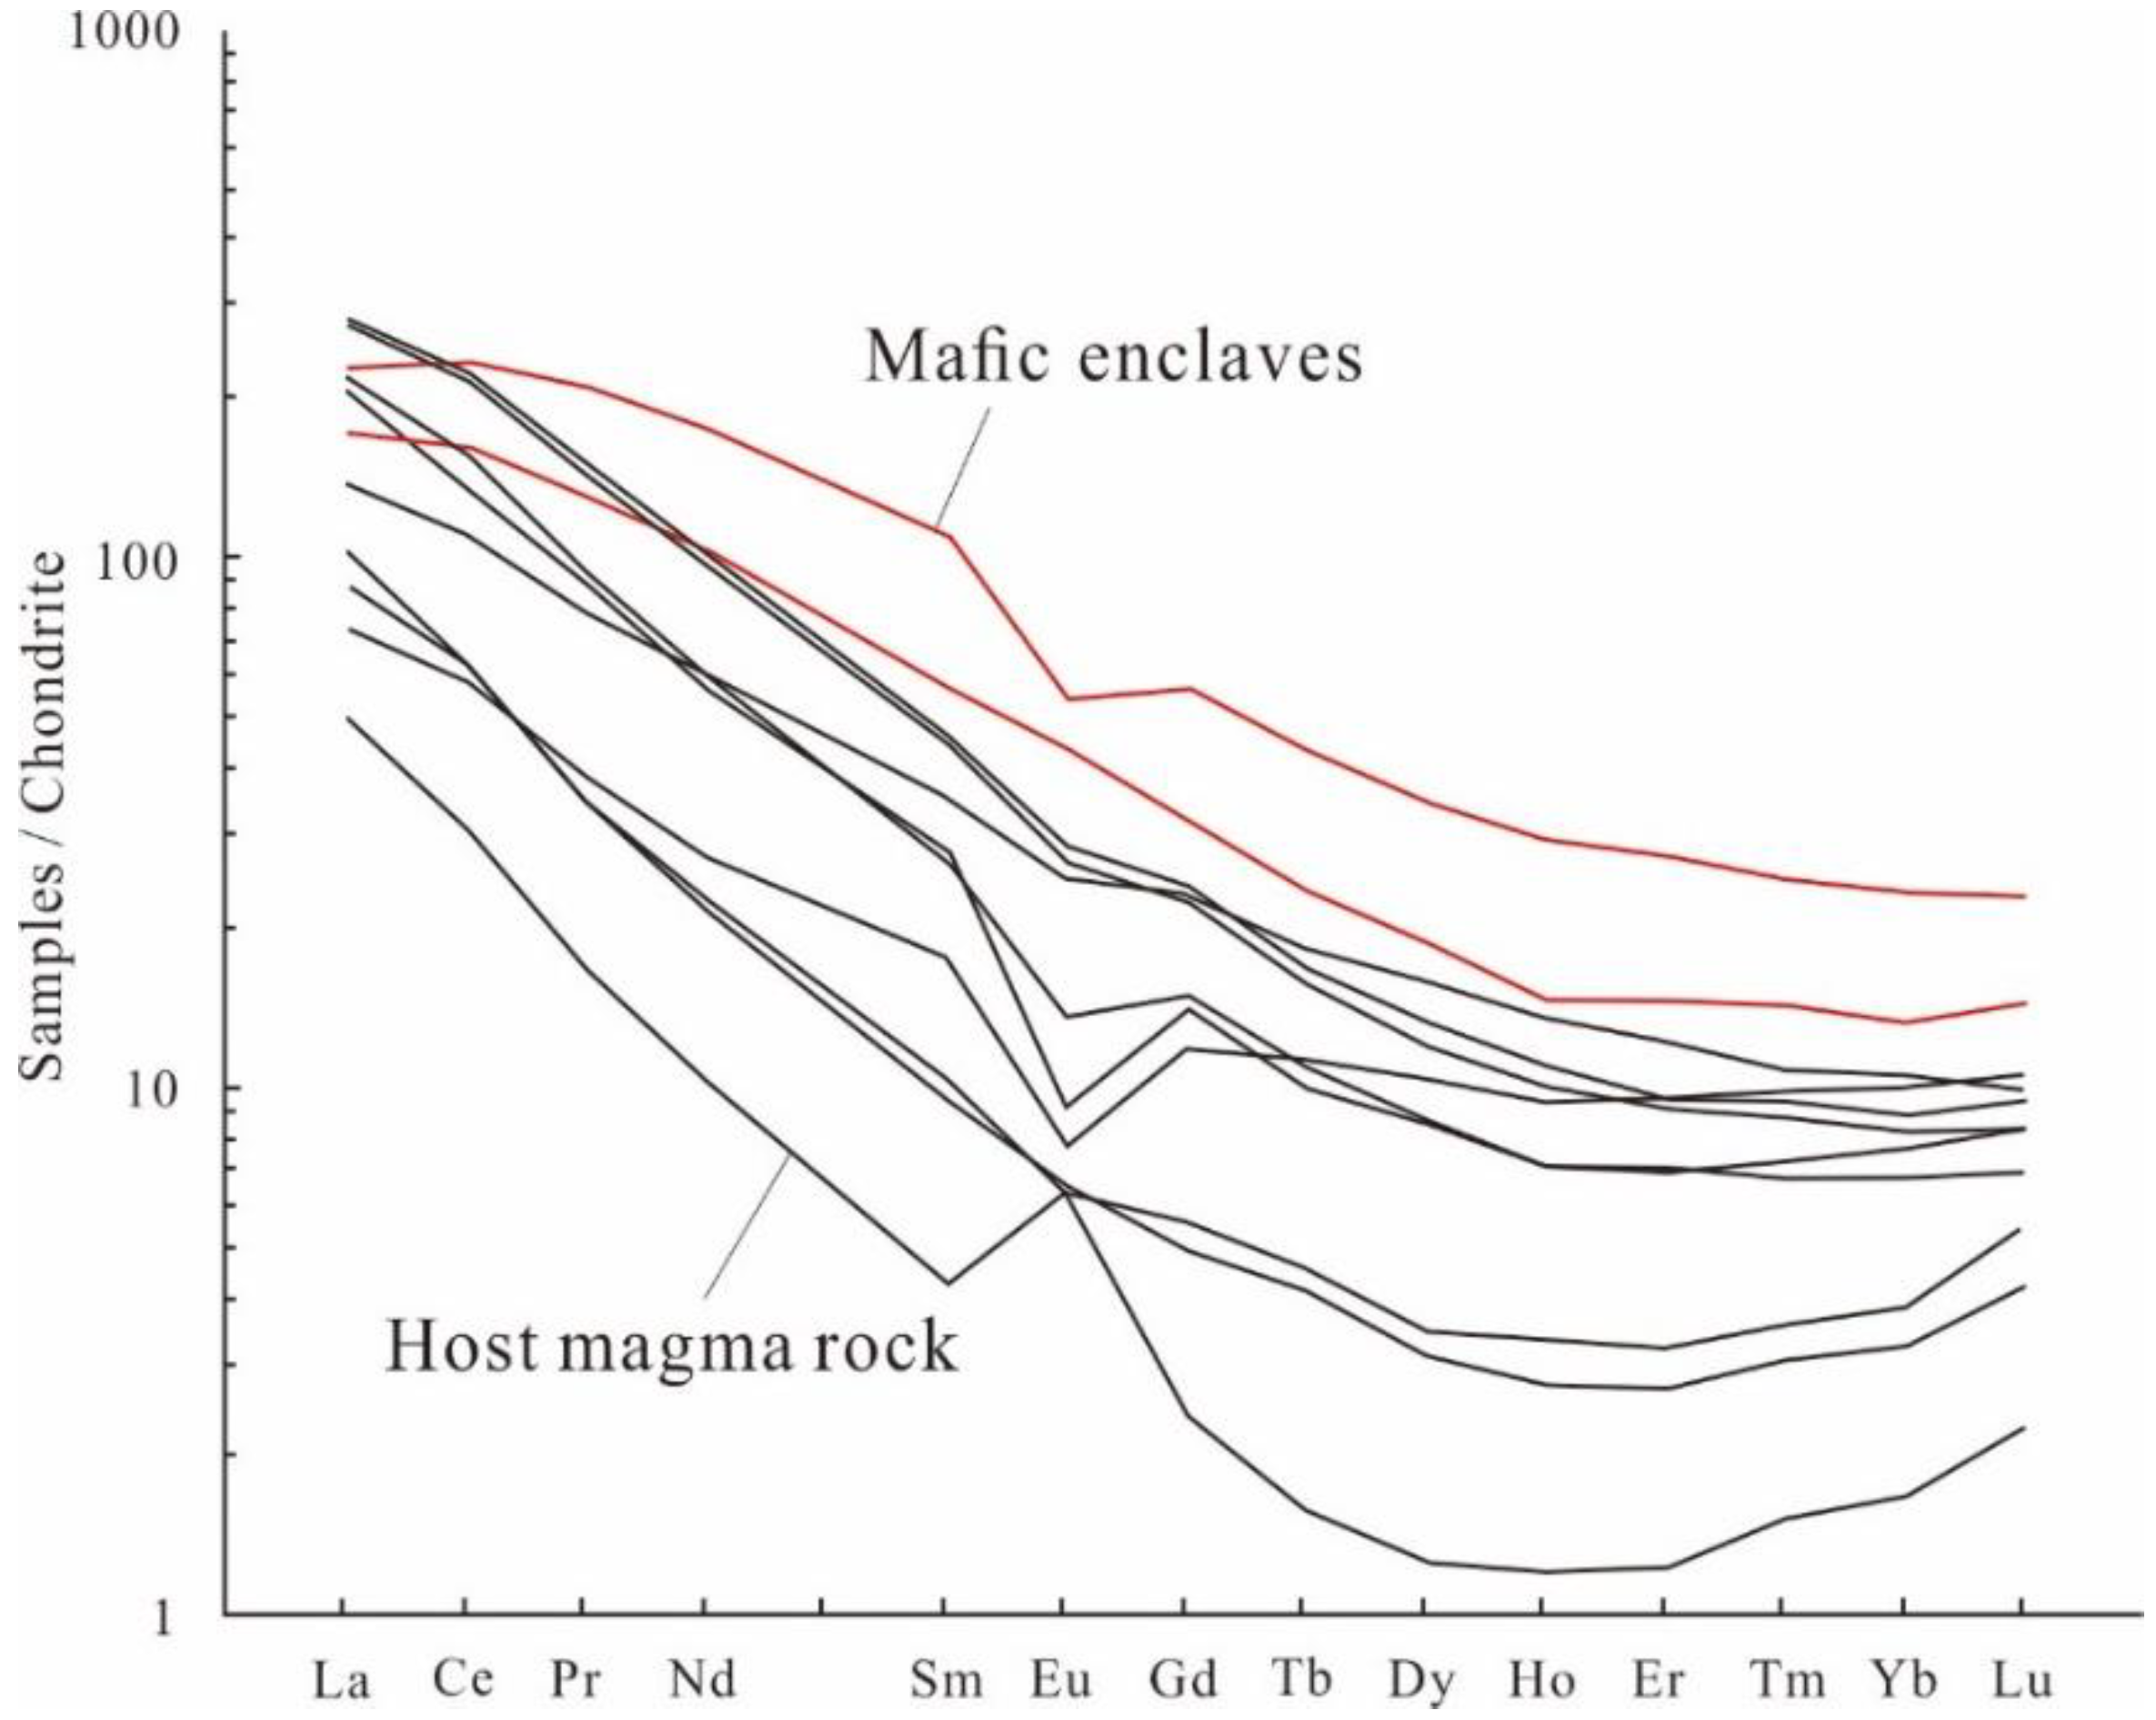
6.3. REE Geochemical Characteristics
7. Zircon U-Pb Chronology
8. Discussion
8.1. Origin of the Mafic Enclaves
- (1)
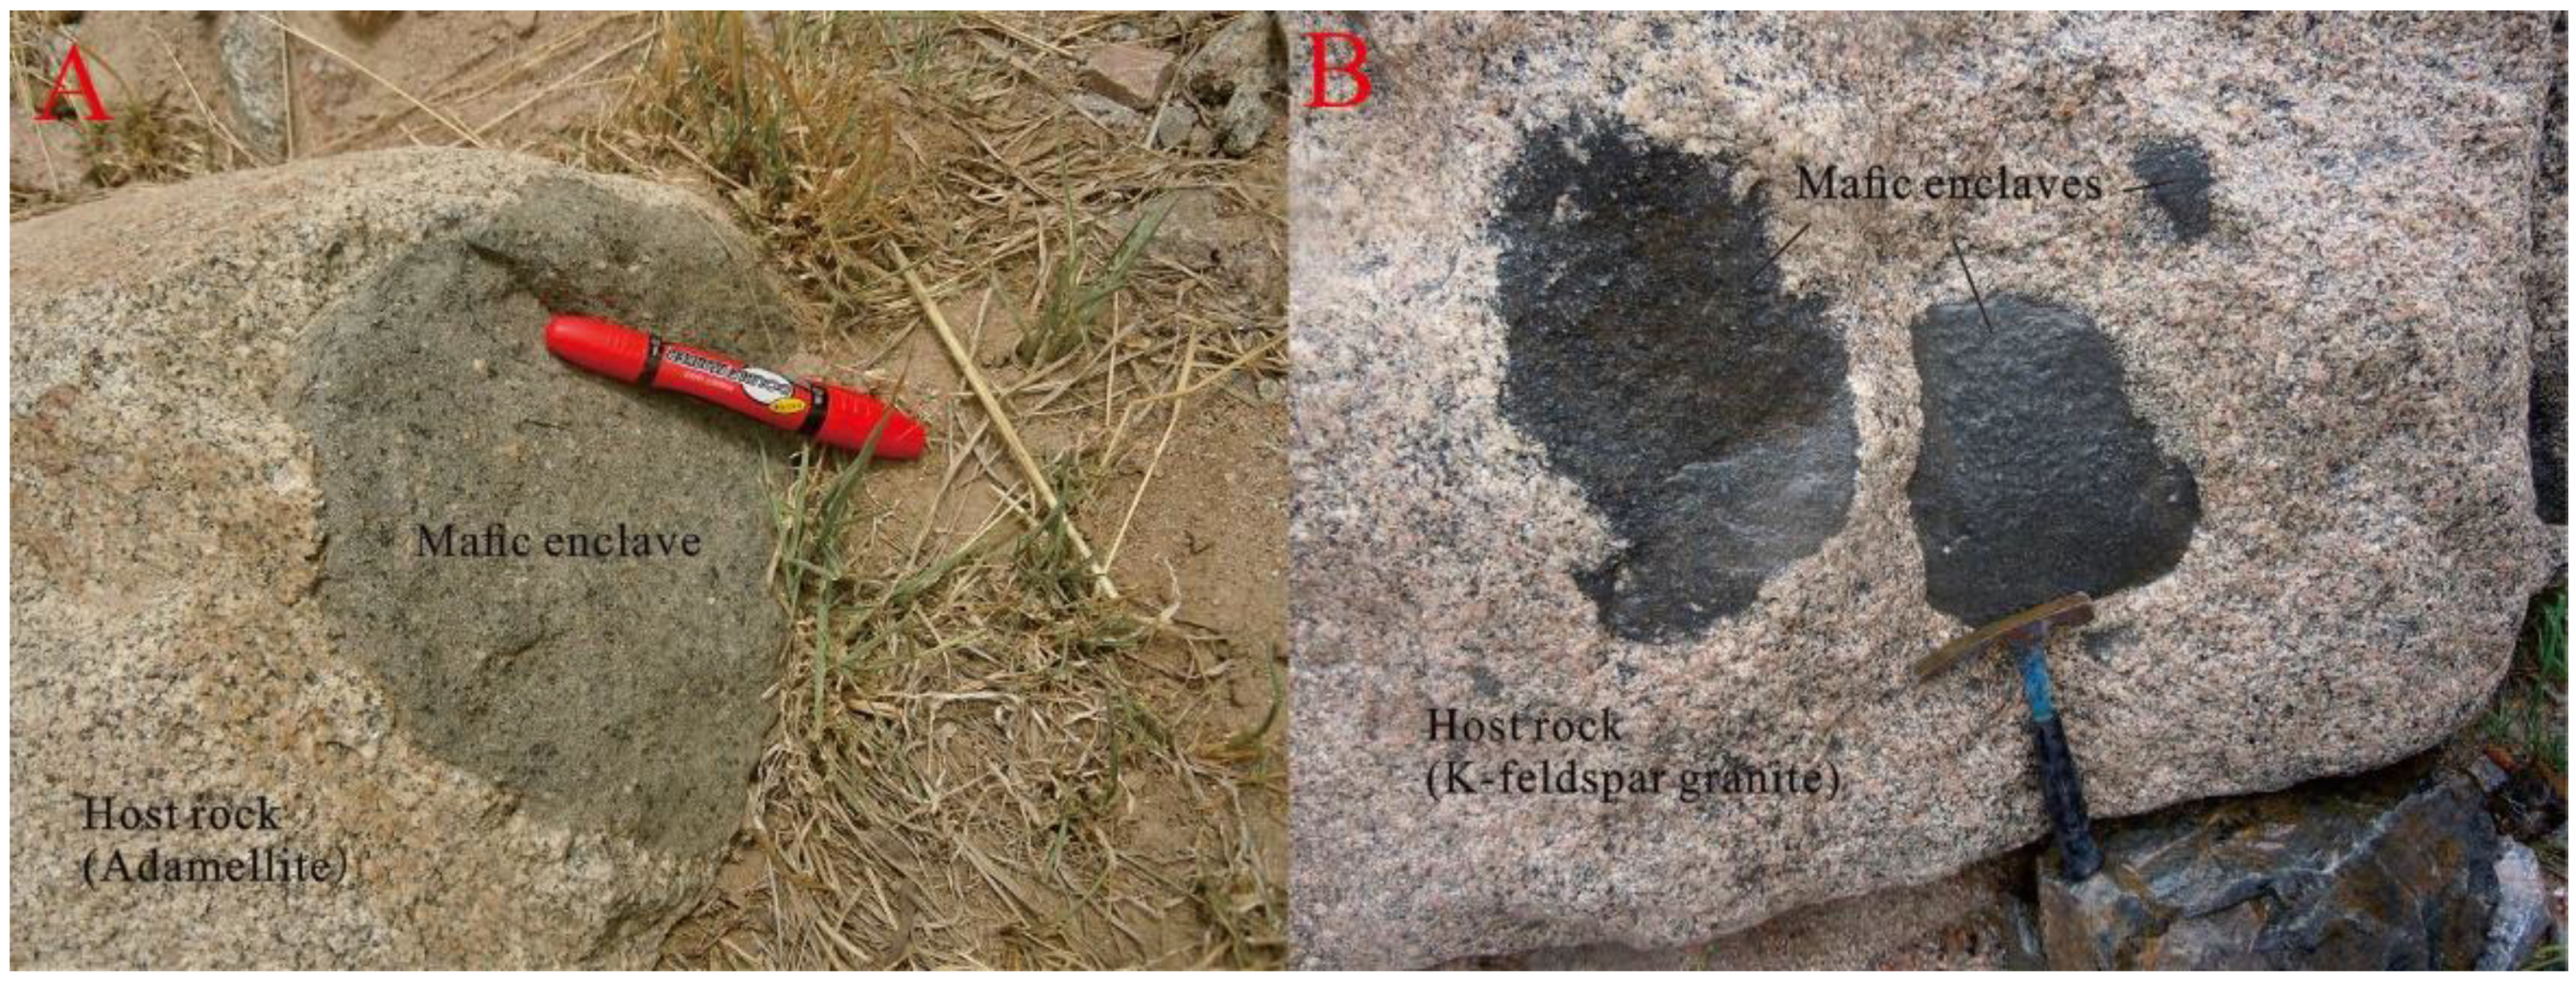
- The mafic enclaves of the Qingshanbao complex are ellipsoidal, lenticular, or globular in shape within the host rock (Figure 2). This is considered to indicate a fluid state between the two magmas and is a clear sign of mixing [48,54]. In addition, the boundary between the mafic enclaves and the host rock is straight, clear, and cut-off type [55] and is therefore not likely to be related to a melting relationship between the two magmas. However, dark borders and light-colored edges are also visible at some boundaries between the enclaves and the granite. The dark edges are located at the inner contact between the mafic enclaves and the host rock and are the result of the aggregation of femic minerals in the mafic enclaves. The light-colored edges are the result of the outward migration of elements from the enclaves.
- (2)
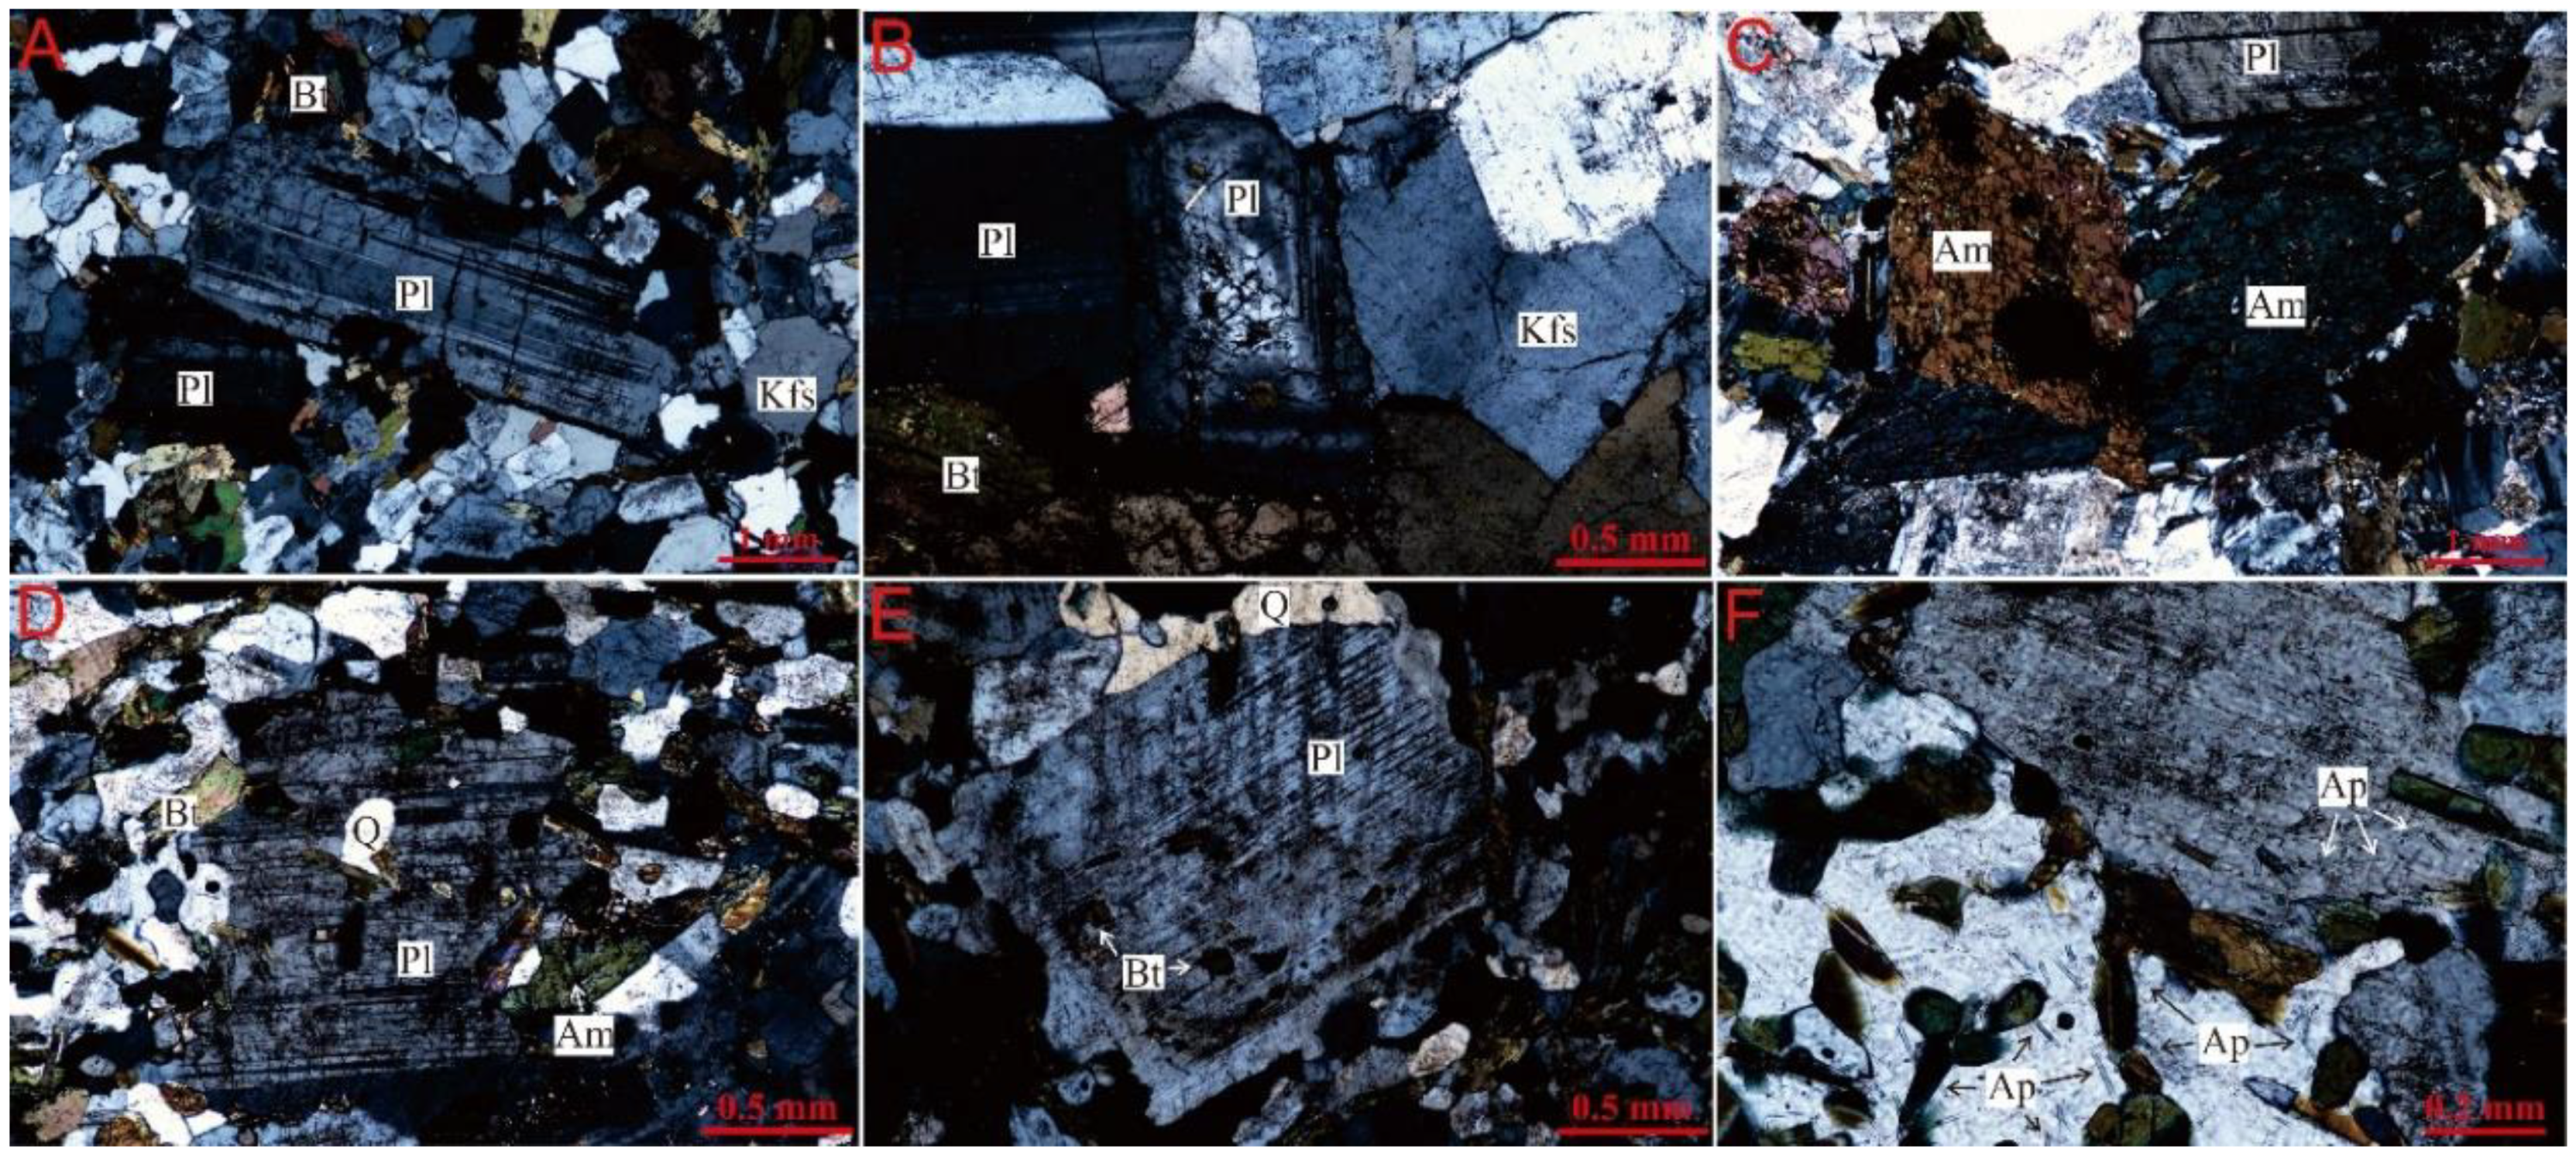
- The mafic enclaves of the Qingshanbao complex are fine-grained semi-automorphic granular structures with typical magmatic textural features (Figure 3A). Kim et al. [56] noted that the grain size and fine-grained texture of the enclaves indicate that the mafic magma invaded the granite magma in an approximately liquid state. Microscopically, plagioclase shows obvious dissolution textures with embayed edges (Figure 3E) and reverse zoning, which could be related to the heating of a cooler, partially crystallized felsic magma by the hot basic magma. In addition, the rapidly crystallized ferromagnesian minerals in the rapidly cooled enclaves are encapsulated by larger plagioclase crystals formed at a later stage, under lower nucleation rates and high growth rates (Figure 3E). The rounded quartz crystals present as inclusions in some plagioclase crystals may represent quartz captured from the host magma (Figure 3D). Both the above scenarios indicate a magma mixing origin for these enclaves.
- (3)
- Needle-shaped apatite is widely present in the mafic enclaves (Figure 3F) and has an aspect ratio that varies between 5 and 15. It can be distinguished from the short columnar apatite (with a length to width ratio of 3–4) in normal granite and is a recognized standard mineral, suggesting magma mixing. Acicular apatite is commonly considered as a crystalline product obtained when high-temperature basic magma is injected into a lower temperature, more evolved magma during mixing, causing a sudden drop in the temperature of the basic magma [57,58]. Wyllie et al. [59] also proved through experiments that acicular apatite is formed in a “quenching” environment when the magma is rapidly cooled, which represents important evidence for the magma mixing process.
- (4)
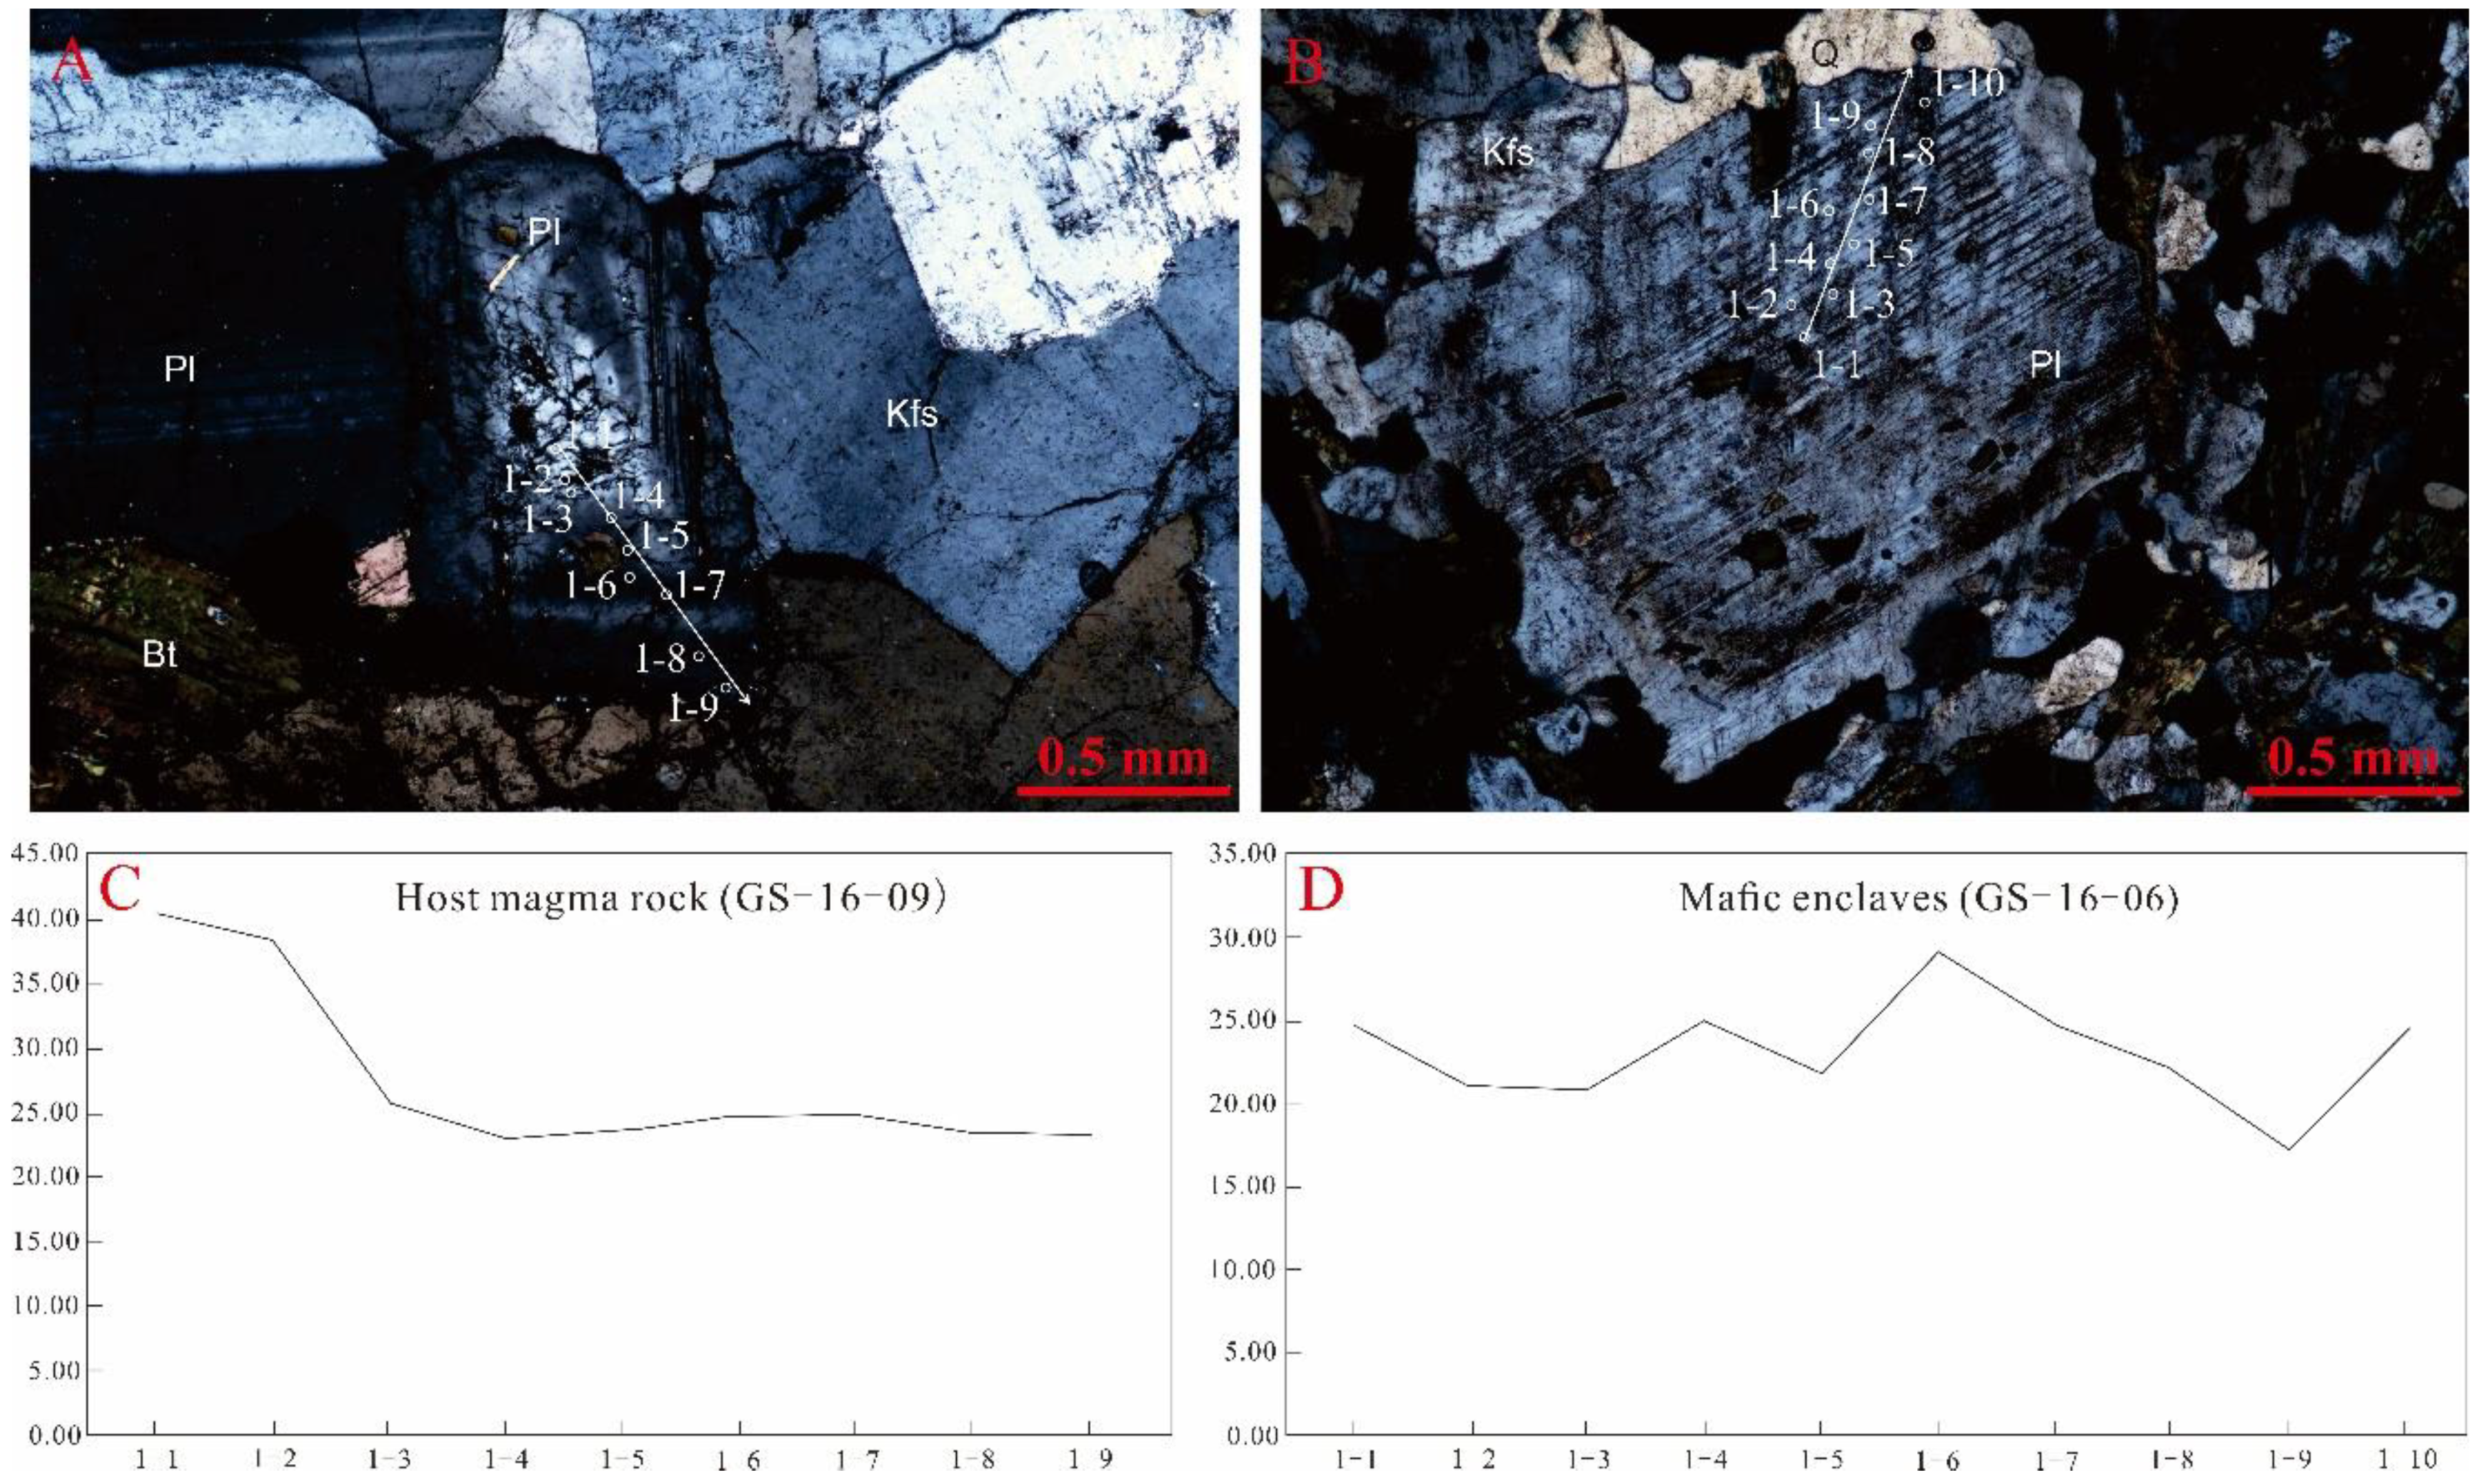
- Electron probe analyses showed that the plagioclase in the host rock is normally zoned and formed due to the normal crystallization of the magma. However, the plagioclase in the mafic enclaves shows reverse-zoning characteristic of a chilled basic magma. Overall, the resident felsic magma with partially crystallized plagioclase with more evolved compositions became heated during mixing, and the basicity of the magma also increased due to the compositional mixing of the two magmas. More basic plagioclase then crystallized on the periphery of the more evolved plagioclase cores.
- (5)
- In terms of geochemical characteristics, the Harker diagrams showing the compositions of the mafic enclaves and the host rock exhibit a good linear relationship. A linear relationship within Harker diagrams was generally interpreted as either being due to crystallization differentiation, residual body incompatibility, or magma mixing [23,60,61,62]. However, crystallization differentiation generally shows a curved distribution [23,36,63]. Most of the residual body that was not extensively mixed comprises S-type granite [55], and is closed by the northern part of the area. The resulting tectonic setting of continent collisional orogeny does not match [47,64,65]. Thus, only in the case of magma mixing could the Harker diagrams of the dark enclave and host rock compositions exhibit such a linear relationship. In addition, compared with the host rock, the mafic enclaves are richer in Fe, Mg, lean Si, K, and the ratios of trace elements such as Nb/La, Rb/Sr, and Nb/Ta lie between the ratios of the crust and the mantle, suggesting that the mafic enclaves contain iron and resulted from a combination of mafic and felsic magma. In terms of REE characteristics, both the mafic enclaves and the host rock exhibit a right-inclined trend of light rare earth element enrichment and heavy rare earth element loss, and the distribution patterns are similar. The total amount of REEs in the mafic enclaves is higher than the value for the corresponding element in the host rock and this suggests that the mafic enclaves are not the products of early crystallization differentiation of the host magma. These geochemical characteristics show that the mafic enclaves formed by magma mixing, rather than from granitic magma crystallization differentiation and other origins.
- (6)
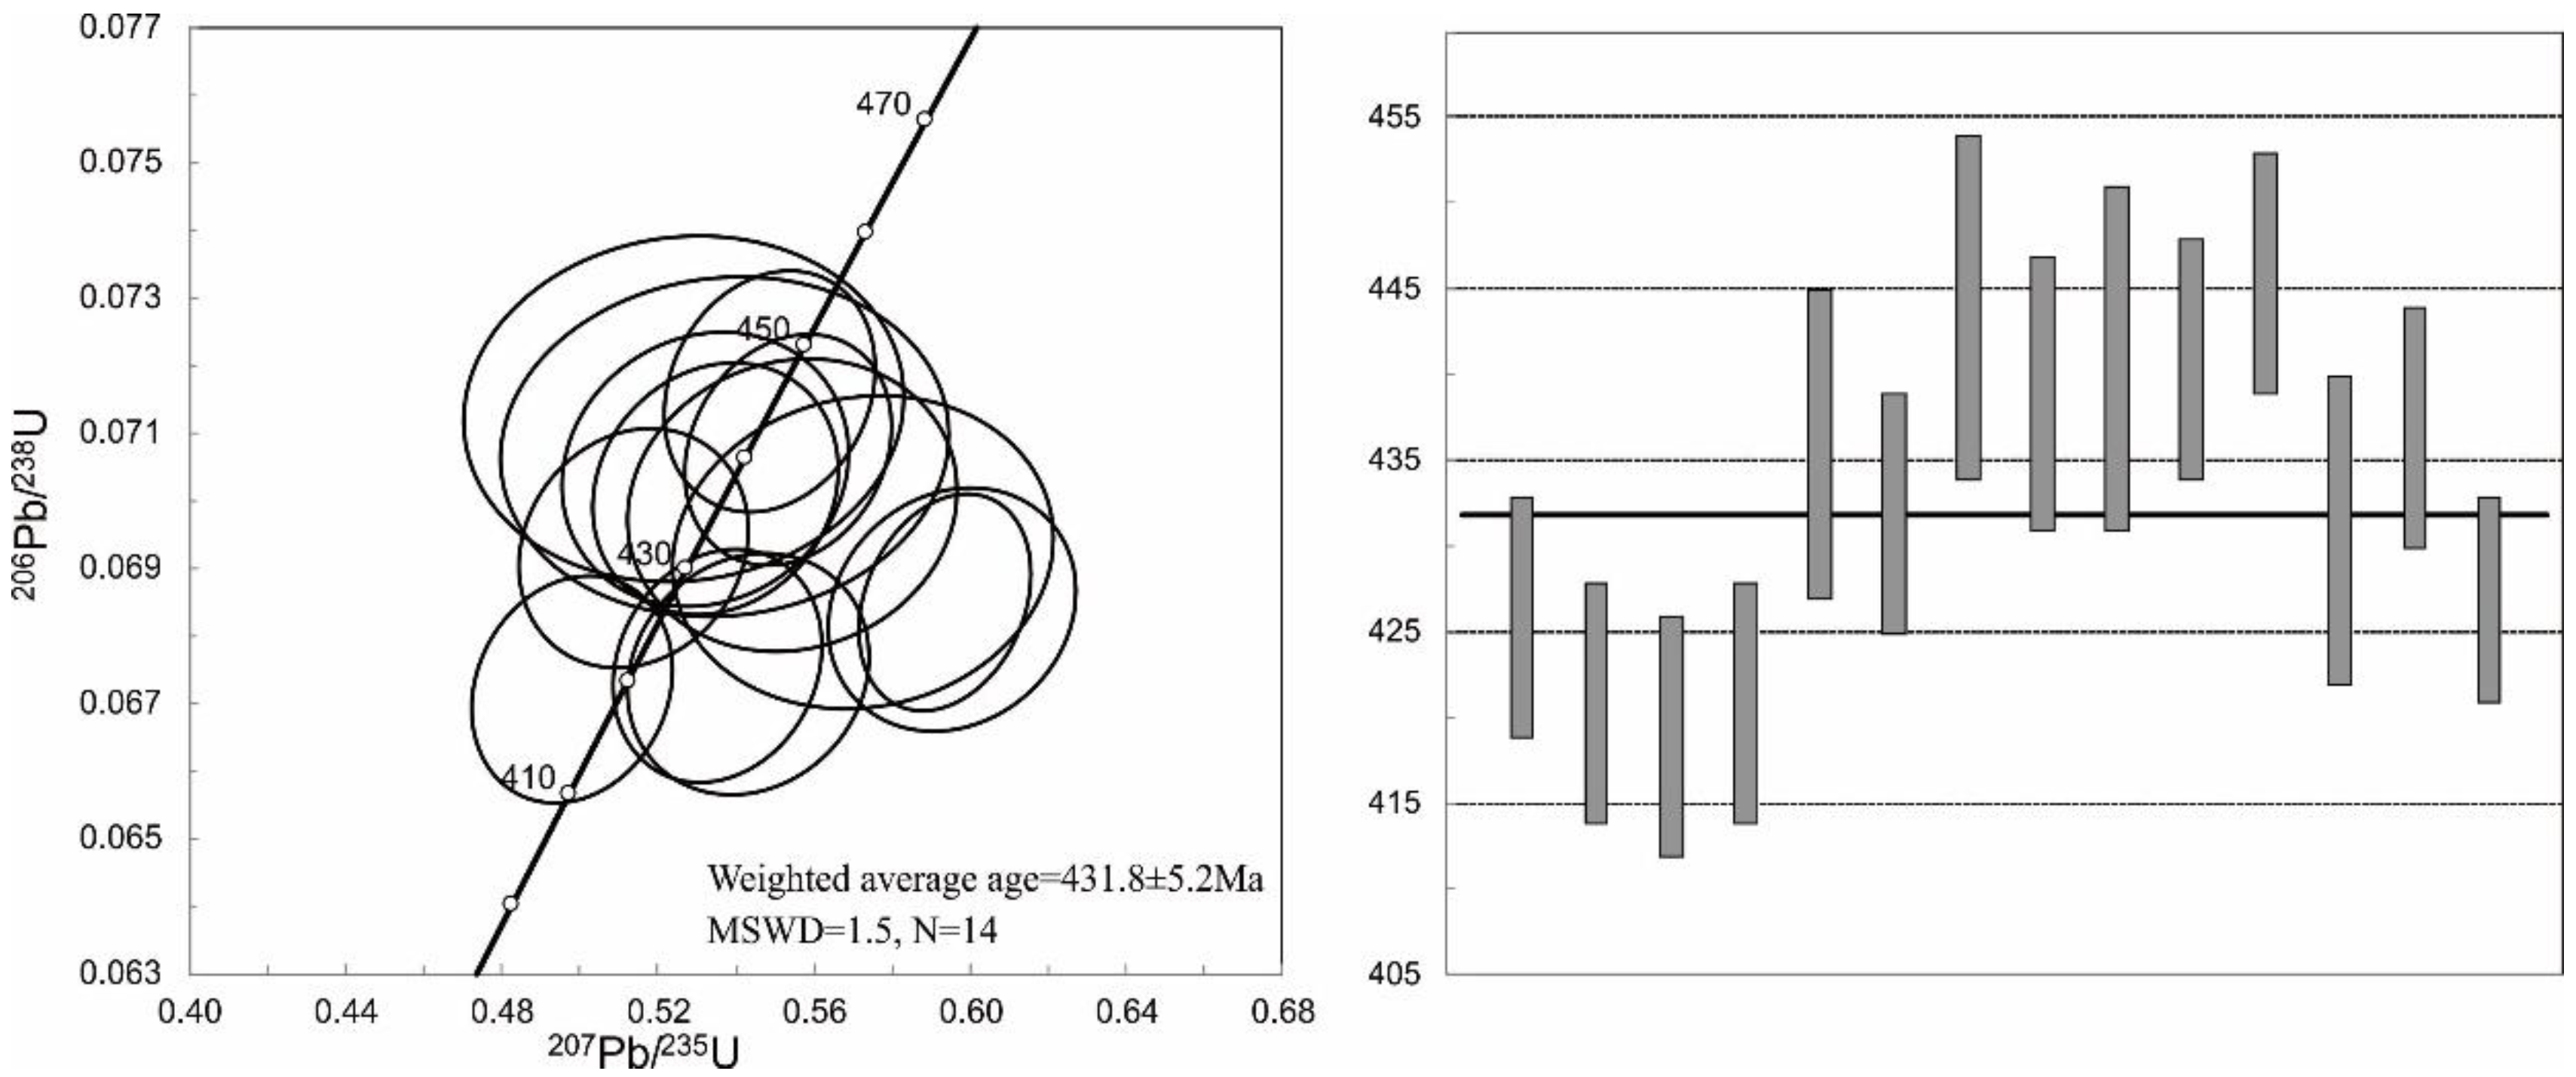
- In terms of crystallization age of the Qingshanbao complex, Wei et al. [9] reported a U-Pb age of zircons in the Mengshan Dawan granite of Qingshanbao as 444 ± 2 Ma (MSWD = 0.25, n = 13) and Liu et al. (to be published) obtained a zircon U-Pb age of the medium-coarse grained K-feldspar granite in the Qingshanbao complex as 441.6 ± 4.2 Ma (MSWD = 1.4, n = 14). In the present study, the LA-ICP-MS U-Pb dating results for magmatic zircons in the mafic enclaves and host rocks yielded ages of 431.8 ± 5.2 Ma (MSWD = 1.5, n = 14) and 432.8 ± 4.2 Ma (MSWD = 1.7, respectively, n = 16), respectively. The two ages are not only highly consistent, but also approximately consistent with the crystallization age of the complex reported in previous studies. If the mafic enclaves were traps or residues, they would have formed earlier than the host rock. Thus, only mafic enclaves formed as a result of magma mixing allow the crystallization age to be consistent with, or very close to, the age of the host rock.
8.2. Tectonic Significance
9. Conclusions
- (1)
- Electron microprobe analyses show that the plagioclase in the host rock is normally zoned, while the plagioclase in the mafic enclaves shows discontinuous zoning and shows instances of reverse-zoning.
- (2)
- The zircon LA-ICP-MS U-Pb analyses indicate that mafic enclaves and host rocks formed at 431.8 ± 5.2 Ma (MSWD = 1.5, n = 14) and 432.8 ± 4.2 Ma (MSWD = 1.7, n = 16), which coincide with the timing of the collision of the Alashan Block (late Caledonian).
- (3)
- Mafic enclaves were formed in a collisional orogenic setting resulting from mixing of the crust-derived and mantle-derived magmas in a subduction–collision setting in the Alashan Block in the early Silurian.
Author Contributions
Funding
Conflicts of Interest
References
- Castro, A.; Morenoventas, I.; Delarosa, J.D. Multistage crystallization of tonalitic enclaves in granitoid rocks (Hercynian belt, Span): Implications for magma mixing. Geol. Rundsch. 1991, 80, 109–120. [Google Scholar] [CrossRef]
- Barbarin, B.; Didier, J. Genesis and evolution of mafic microgranular enclaves through various types of interaction between coexisting felsic and mafic magmas. Trans. R. Soc. Edinb. Earth Sci. 1992, 83, 145–153. [Google Scholar] [CrossRef]
- Wiebe, R.A.; Smith, D.; Sturm, M. Enclaves in the Cadillac mountain granite (coastal Maine): Samples of hybrid magma from the base of the chamber. J. Petrol. 1997, 38, 393–423. [Google Scholar] [CrossRef]
- Wang, T.; Wang, X.X.; Li, W.P. Evaluation of multiple emplacement mechanisms of Huichizi granite pluton, Qinling orogenic belt, central China. J. Struct. Geol. 2000, 22, 505–518. [Google Scholar] [CrossRef]
- Wilcox, R.E. The idea of magma mixing: History of a struggle for acceptance. J. Geol. 1999, 107, 421–432. [Google Scholar] [CrossRef]
- Ma, X.X.; Joseph, G.M.; Xu, Z.Q.; Zhao, Z.B. Evidence of magma mixing identified in the Early Eocene Caina pluton from the Gangdese Batholith, southern Tibet. Lithos 2017, 278–281, 126–139. [Google Scholar] [CrossRef]
- Ma, X.H.; Chen, B.; Yang, M.C. Magma mixing origin for the Aolunhua porphyry related to Mo–Cu mineralization, eastern Central Asian Orogenic Belt. Gondwana Res. 2013, 24, 1152–1171. [Google Scholar] [CrossRef]
- Didier, J.; Barbarin, B. Enclaves and Granite Petrology; Elsevier Science Publishers: Amsterdam, The Netherlands, 1991. [Google Scholar]
- Wei, Q.Q.; Hao, L.B.; Lu, J.L.; Zhao, Y.Y.; Zhao, X.Y.; Shi, H.L. LA-MC-ICP-MS zircon U-Pb age and its geological significance in Hexibao granite, Gansu Province. Bull. Mineral. Geochem. 2013, 32, 729–735. [Google Scholar]
- Zhao, R.Y.; Chen, Y.J.; Wu, B.; Wang, G. A metallogenic model of the sodic-metasomatic type uranium deposit in the Jiling area of Longshoushan, Gansu Province. Geol. Explor. 2013, 49, 67–74. [Google Scholar]
- Chen, Y.J.; Fu, C.M.; Wang, W.; Li, T. Discussion on the genesis and prospecting direction of the Jinbiansi uranium deposit in Gansu. J. Mineral. 2013, 747–748. [Google Scholar]
- Song, S.G.; Niu, Y.L.; Su, L.; Xia, X.H. Tectonics of the North Qilian orogen, NW China. Gondwana Res. 2013, 23, 1378–1401. [Google Scholar] [CrossRef]
- Jackson, S.E.; Pearson, N.J.; Griffin, W.L.; Belousova, E.A. The application of laser ablation-inductively coupled plasma-massspectrometry to in situ U–Pb zircon geochronology. Chem. Geol. 2004, 211, 47–69. [Google Scholar] [CrossRef]
- Black, L.; Gulson, B. The age of the Mud Tank carbonatite, Strangways Range, Northern Territory. BMR J. Aust. Geol. Geophys. 1978, 3, 227–232. [Google Scholar]
- Van Achterbergh, E.; Ryan, C.; Jackson, S.; Griffin, W. Data reduction software for LA-ICP-MS. Laser-Ablation-ICPMS in the earth sciences principles and applications. Miner. Assoc. Can. 2001, 29, 239–243. [Google Scholar]
- Andersen, T. Correction of common lead in U-Pb analyses that do not report 204Pb. Chem. Geol. 2002, 192, 59–79. [Google Scholar] [CrossRef]
- Panjasawatwong, Y.; Danyushevsky, L.V.; Crawford, A.J.; Harris, K.L. An Experimental study of the effects of melt composition on Plagioclase-melt equilibria at 5 and 10 kbar: Implications for the origin of magmatic high-an plagioclase. Contrib. Mineral. Petrol. 1995, 118, 420–432. [Google Scholar] [CrossRef]
- Guo, F.; Li, H.X.; Fan, W.M.; Li, J.; Zhao, L.; Huang, M.; Xu, W.L. Early Jurassic subduction of the paleo-pacific ocean in NE China: Petrologic and geochemical evidence from the Tumen mafic intrusive complex. Lithos 2015, 224–225, 46–60. [Google Scholar] [CrossRef]
- Feng, G.Y.; Liu, W.; Niu, X.L.; Yang, J.Y. Chronology, geochemistry and petrogenesis of the Early-Middle Permian mafic intrusive rocks in the Zhangguangcailing block. Earth Sci. 2018, 43, 1293–1310. [Google Scholar]
- Xie, L.; Wang, D.Z.; Wang, Y.C.; Qiu, J.S.; Chen, X.M. Quartz diorite enclaves in the Putuo granit complex in Zhejiang: A study of the complex annulus inside the plagioclase and a history of magma mixing. J. Rock 2004, 20, 96–107. [Google Scholar]
- Niu, Z.J.; Liu, Y.; Di, Y.J. Characteristics and geological significance of the plagioclase belt in the Mesozoic coarse-rock in the Wudaogou area, Daxing’anling. J. Rock Mineral. 2014, 33, 102–108. [Google Scholar]
- Smith, R.K.; Lofgren, G.E. Ananalytical and experimental study of zoning in plagioclase. Lithos 1983, 16, 153–168. [Google Scholar] [CrossRef]
- Choe, W.H.; Jwa, Y.J. Petrological and geochemical evidences for magma mixing in the Palgongsan rock mass. Geosci. J. 2004, 8, 343–354. [Google Scholar] [CrossRef]
- Barbarin, B. Mafic magmatic enclaves and mafic rocks associated with some granitoids of the central Sierra Nevada batholith, California: Nature, origin, and relations with the hosts. Lithos 2005, 80, 155–177. [Google Scholar] [CrossRef]
- Zhao, H.D.; Han, Z.Z.; Zhao, H.B.; Niu, Y.H.; Ma, L.L. Characteristics and genesis of enclaves in the riprap granite in northeastern Inner Mongolia. Geol. Bull. 2005, 24, 841–847. [Google Scholar]
- Zhang, J.J.; Wang, T.; Zhang, Z.C.; Tong, Y.; Zhang, L.; Shi, X.J.; Guo, L.; Li, S.; Zeng, T. The magmatic mixing genesis of the Yamatu rock mass in the Bayinuoergong-Wolshan area in the western part of the northern margin of the North China block: Lithofacies and elemental geochemical evidence. Geol. Rev. 2012, 58, 53–66. [Google Scholar]
- Middlemost, E.A.K. Naming materials in the magma/igneous rock system. Earth-Sci. Rev. 1994, 37, 215–224. [Google Scholar] [CrossRef]
- Peccerillo, A.; Taylor, S.R. Geochemistry of Eocene calc-alkaline volcanic rocks from the Kastamonu area, Northern Turkey. Contrib. Mineral. Petrol. 1976, 58, 63–91. [Google Scholar] [CrossRef]
- Wright, J.B.A. Simple alkalinity ratio and its application to question of non-orogenic granite geneses. Geol. Mag. 1969, 106, 370–384. [Google Scholar] [CrossRef]
- Maniar, P.D.; Piccoli, P.M. Tectonic discrimination of granitoids. Geol. Soc. Am. Bull. 1989, 10, 635–643. [Google Scholar] [CrossRef]
- Fu, Q.; Ge, W.S.; Wen, C.S.; Cai, K.Q.; Li, S.F.; Zhang, Z.W.; Li, X.F. Geochemical Characteristics and Genesis Analysis of Guangxi Michang Granite and Its Dark Particle enclaves. Acta Geosci. Sin. 2011, 32, 293–303. [Google Scholar]
- Anderson, P.L. Chemical composition of the mantle. Geophys. Res. 1983, 88, 41–52. [Google Scholar] [CrossRef]
- Liu, Z.H.; Zhang, L.; Yang, C.X.; Wu, T.A.; Cui, X.F.; Ren, J.D.; Yang, C.Q. Magmatic mixing characteristics and significance of the Lushan rock mass in Lushan, Henan Province. Geol. Surv. Res. 2004, 27, 75–81. [Google Scholar]
- Wang, Y.; Fan, W.; Peng, T.; Zhang, H.; Guo, F. Nature of the mesozoic lithospheric mantle and tectonic decoupling beneath the Dabie Orogen, central China: Evidence from 40Ar/39Ar geochronology, elemental and Sr-Nd-Pb isotopic compositions of early cretaceous mafic igneous rocks. Chem. Geol. 2005, 220, 165–189. [Google Scholar] [CrossRef]
- Kocak, K. Hybridization of mafic microgranular enclaves: Mineral and whole-rock chemistry evidence from the Karamadaz Granitoid, Central Turkey. Int. J. Earth Sci. 2006, 95, 587–607. [Google Scholar] [CrossRef]
- Zang, W.J.; Lai, S.C.; Qin, J.F.; Li, X.J.; Luo, J.C. Geochemistry and genesis of the dark-colored enclaves of the Wulong rock mass in the South Qinling Mountains. J. Northwest Univ. Nat. Sci. Ed. 2011, 41, 278–284. [Google Scholar]
- Sun, S.S.; McDonough, W.F. Chemical and isotopic systematics of oceanic basalts: Implications for mantle composition and processes. Geol. Soc. 1989, 42, 313–345. [Google Scholar] [CrossRef]
- Rudnick, R.L.; Gao, S. Composition of the Continental Crust. In Treatise on Geochemistry; Holland, H.D., Turekian, K.K., Eds.; Pergamon: Oxford, UK, 2003; pp. 1–64. [Google Scholar]
- Chen, L.G.; Wang, B.Y.; Chen, L.R.; Zhang, B.; Dai, X.Y. Theenclaves characteristics and indication significance of granites in Huashan Mountain. Shanxi Geol. 2003, 21, 61–66. [Google Scholar]
- Taylor, S.R.; McLennan, S.M. The Continental Crust: Its Composition and Evolution; Blackwell: Oxford, UK, 1985; 312p. [Google Scholar]
- Wang, Y.W.; Wang, J.B.; Wang, S.L.; Wang, L.J.; Ding, R.F.; Pu, K.X. Magmatic mixing and its metallogenic significance in the Xiuli Kuduk area, Fuyun, Xinjiang. J. Geol. 2008, 82, 221–233. [Google Scholar]
- Zhang, Y.M.; Zhang, H.F.; Liu, W.C.; Zhou, Z.G. Age and genesis of Damiao rock mass in Siziwangqi, central Inner Mongolia. J. Petrol. 2009, 25, 3165–3181. [Google Scholar]
- Ahmad, M. Enclavess in granitoids of north of Jonnagiri schist belt, Kurnool district, Andhra Pradesh: Evidence of magma mixing and mingling. J. Geol. Soc. India 2011, 77, 557–573. [Google Scholar] [CrossRef]
- Liu, L.; Qiu, J.S.; Li, Z.; Li, Y.L. The genesis of the Early Cretaceous quartz monzonite in Longyou, Zhejiang Province: The elements of the mafic enclaves and host rocks and the Sr-Nd isotope geochemical evidence. J. Rock 2012, 28, 3993–4006. [Google Scholar]
- Rubatto, D.; Gebauer, D. Use of cathodoluminescence for U-Pb zircon dating by IOM Microprobe: Some examples from the western Alps. In Cathodoluminescence Geosci.; Springer: Berlin, Germany, 2000; pp. 373–400. [Google Scholar]
- Wu, Y.B.; Zheng, Y.F. Zircon genesis mineralogy and its constraints on U-Pb age interpretation. Sci. Bull. 2004, 49, 1589–1604. [Google Scholar] [CrossRef]
- Song, S.G.; Niu, Y.L.; Zhang, L.F.; Zhang, G.B. Time constraints on orogenesis from oceanic subduction to continental subduction, collision and exhumation: An example from North Qilian and North Qaidam HP-UHP belts. Acta Petrol. Sin. 2009, 25, 2067–2077. [Google Scholar]
- Vernon, R.H. Microgranitoid enclaves in granites: Globules of hybrid magma quenched in a rock massic environment. Nature 1984, 309, 438–439. [Google Scholar] [CrossRef]
- Dahlquist, J.A. Mafic microgranular enclaves: Early segregation from metaluminous magma (Sierra de Chepes), Pampean Ranges, NW Argentina. J. S. Am. Earth Sci. 2002, 15, 643–655. [Google Scholar] [CrossRef]
- Donaire, T.; Pascual, E.; Pin, C. Microgranular enclaves as evidence of rapid cooling in granitoid rocks: The case of the Los Pedroches granodiorite, Iberian Massif, Spain. Contrib. Mineral. Petrol. 2005, 149, 247–265. [Google Scholar] [CrossRef]
- Chappell, B.W. Magma mixing and the production of compositional variation within granite suites: Evidence from the granites of Southeastern Australia. J. Petrol. 1996, 37, 449–470. [Google Scholar] [CrossRef]
- White, A.J.R.; Chappell, B.W.; Wyborn, D. Application of the restite model to the Deedick granodiorite and its enclaves: A reinterpretation of the observations and data of Maas et al. (1997). J. Petrol. 1999, 40, 413–421. [Google Scholar] [CrossRef]
- Silva, M.V.G.; Neiva, A.M.R.; Whitehouse, M.J. Geochemistry of enclavess and host granites from the Nelas area, central Portugal. Lithos 2000, 50, 153–170. [Google Scholar] [CrossRef]
- Fan, L.T.; Fang, S.Y.; Tao, Z.J.; Liang, Y.D. Discovery of Dark Microgranular enclaves (MME) in Uranium Granite of Miaoershan and Crust-Mantle Interaction. J. Mineral. 2009, 29, 625–626. [Google Scholar]
- Xue, Y.S.; Liu, Z.J.; Wang, J.P.; Cheng, S.B. Characteristics of the Dark Particles of Granite and Its Research Direction. Contrib. Geol. Miner. Resour. Res. 2014, 29, 20–30. [Google Scholar]
- Kim, J.S.; Shin, K.C.; Lee, J.D. Petrographical study on the Yucheon granite and its enclaves. Geosci. J. 2002, 6, 289–302. [Google Scholar] [CrossRef]
- Vernon, R.H. Restite, xenoliths and microgranitoid enclavess in granites. J. Proc. R. Soc. N. S. W. 1983, 116, 77–103. [Google Scholar]
- Piccoli, P.M.; Candela, P.A. Apatite in igneous system. Rev. Mineral. Geochem. 2002, 48, 255–292. [Google Scholar] [CrossRef]
- Wyllie, P.J.; Cox, K.G.; Biggar, G.M. The habit of apatite in synthetic systems and igneous rocks. J. Petrol. 1962, 3, 238–242. [Google Scholar] [CrossRef]
- Chappell, B.W.; White, A.J.R.; Wyhorn, D. The importance of residual source material (restite) in Granite Petrogenesis. J. Petrol. 1987, 28, 1111–1138. [Google Scholar] [CrossRef]
- Liu, M.; Zhao, Z.D.; Guan, Q.; Dong, G.C.; Mo, X.X.; Liu, Y.S.; Hu, Z.C. The magma mixing genes of the Early Jurassic meta-granite and its enclaves in the Nierong micro-continent, Tibet: Zircon LA-ICP-MS U-Pb dating and Hf isotope evidence. J. Rock 2011, 27, 1931–1937. [Google Scholar]
- Zang, W. Study on the Magmatic Mixing of the Late Triassic Wulong Rock Mass in the South Qinling Orogenic Belt. Ph.D. Thesis, Northwestern University, Xi’an, China, 2011. [Google Scholar]
- Zhou, X.R. Granite mixing effect. Front. Geosci. 1994, 1, 87–97. [Google Scholar]
- Zhou, L.F. Early Paleozoic tectonic features and evolution in the southern margin of the Alashan block. J. Northwest Univ. 1992, 22, 107–115. [Google Scholar]
- Xia, L.Q.; Xia, Z.C.; Xu, X.Y. The genesis of volcanic magma in the Ordovician arc basin of the North Qilian Mountains. China Geol. 2003, 30, 48–60. [Google Scholar]
- Zhou, T.Z.; Chen, J.F.; Zhang, W.; Li, X.M. Geochemical characteristics of the North Huaiyang granite-syenite belt and its tectonic significance. Geol. Rev. 1995, 41, 144–151. [Google Scholar]
- Wang, X.X.; Wang, T.; Ilmari, H.; Lu, X.X. The magmatic mixing genesis and petrological significance of mafic enclaves in the Qinling ring-spotted granite: Elemental and Nd, Sr isotope geochemical evidence. J. Rock 2005, 21, 935–946. [Google Scholar]
- Mo, X.X.; Luo, Z.H.; Deng, J.F.; Yu, X.H.; Liu, C.D.; Chen, H.W.; Yuan, W.M.; Liu, Y.H. East Kunlun orogenic belt granite and crustal growth. J. Geol. Univ. China 2007, 13, 403–414. [Google Scholar]
- Mo, X.X. Magma effect and evolution of the Qinghai-Tibet Plateau. Coll. Geol. 2011, 17, 351–367. [Google Scholar]
- Qin, J.F.; Lai, S.C.; Li, Y.F. Slab breakoff model for the triassicpost-collisional adakitic granitoids in the Qinling orogenic velt, central China: Zircon U-Pb ages, geochemistry and Sr-Nd-Pb isotopic constaints. Int. Geol. Rev. 2008, 50, 1080–1104. [Google Scholar] [CrossRef]
- Deng, J.F.; Zhao, H.L.; Mo, X.X.; Wu, Z.X.; Luo, Z.H. Root-Column Structure of the Chinese Mainland: The Key to Continental Dynamics; Geological Publishing House: Beijing, China, 1996; pp. 14–82. [Google Scholar]
- Jin, Z.M.; Gao, S. Bottom intrusion and its dynamic significance of crust-mantle evolution. Geol. Sci. Inf. 1996, 15, 1–7. [Google Scholar]
- Huppert, H.E.; Sparks, R.S.J. The generation of granitic magmas by intrusion of basalt into continental crust. J. Petrol. 1988, 29, 599–624. [Google Scholar] [CrossRef]
- Ma, C.Q.; Wang, R.J.; Qiu, J.Y. The origin of granitic magma and the sign of multiple magma mixing: Baoshangyi takes Beijing Zhoukoudian rock mass as an example. Geol. Rev. 1992, 38, 109–119. [Google Scholar]
- Xu, Y.J.; Du, Y.S.; Cawood, P.; Guo, H.; Huang, H.; An, Z.H. Detrital zircon record of continental collision: Assembly of the Qilian Orogen, China. Sediment. Geol. 2010, 230, 35–45. [Google Scholar] [CrossRef]
- Xia, L.Q.; Xia, Z.C.; Zhao, J.T.; Xu, X.Y.; Yang, H.Q.; Zhao, D.H. Determination of the properties of the Proterozoic continental overflow basalt in the western segment of the North Qilian Mountains. Chin. Sci. 2000, 30, 1–8. [Google Scholar]
- Wu, F.Y.; Li, X.H.; Yang, J.H.; Zheng, Y.F. Several problems in the study of granite genesis. J. Rock 2007, 23, 1217–1238. [Google Scholar]


| GS-09 | Host Rock | ||||||||
|---|---|---|---|---|---|---|---|---|---|
| 1-1 | 1-2 | 1-3 | 1-4 | 1-5 | 1-6 | 1-7 | 1-8 | 1-9 | |
| SiO2 | 57.31 | 58.08 | 61.55 | 62.25 | 62.49 | 61.55 | 61.30 | 62.10 | 62.13 |
| TiO2 | 0.03 | - | - | - | 0.02 | - | - | 0.03 | 0.01 |
| Na2O | 6.85 | 7.07 | 8.48 | 8.95 | 8.93 | 8.90 | 8.77 | 8.91 | 8.94 |
| NiO | - | 0.02 | - | - | 0.02 | - | - | - | 0.03 |
| K2O | 0.11 | 0.08 | 0.10 | 0.16 | 0.14 | 0.13 | 0.18 | 0.16 | 0.14 |
| MgO | - | 0.01 | - | - | - | - | - | - | - |
| FeO | 0.08 | 0.05 | 0.06 | 0.09 | 0.10 | - | 0.04 | 0.07 | 0.04 |
| CaO | 8.46 | 8.03 | 5.31 | 4.85 | 5.12 | 5.34 | 5.33 | 4.93 | 4.90 |
| MnO | - | 0.02 | - | - | - | - | - | 0.02 | 0.01 |
| Al2O3 | 26.99 | 27.06 | 24.55 | 24.03 | 24.42 | 24.41 | 24.45 | 24.32 | 24.08 |
| Cr2O3 | - | 0.02 | - | - | 0.01 | 0.03 | - | - | 0.02 |
| P2O5 | 0.07 | 0.01 | 0.01 | - | - | - | - | - | 0.02 |
| Total | 99.90 | 100.44 | 100.06 | 100.33 | 101.24 | 100.35 | 100.07 | 100.53 | 100.33 |
| Number of ions (based on O = 8) | |||||||||
| Si | 2.59 | 2.61 | 2.69 | 2.70 | 2.70 | 2.68 | 2.68 | 2.69 | 2.69 |
| Ti | - | - | - | - | - | - | - | - | - |
| Na | 0.60 | 0.62 | 0.72 | 0.75 | 0.75 | 0.75 | 0.74 | 0.75 | 0.75 |
| Ni | - | - | - | - | - | - | - | - | - |
| K | 0.01 | - | 0.01 | 0.01 | 0.01 | 0.01 | 0.01 | 0.01 | 0.01 |
| Mg | - | - | - | - | - | - | - | - | - |
| Fe2+ | - | - | - | - | - | - | - | - | - |
| Ca | 0.41 | 0.39 | 0.25 | 0.23 | 0.24 | 0.25 | 0.25 | 0.23 | 0.23 |
| Mn | - | - | - | - | - | - | - | - | - |
| Al | 1.44 | 1.43 | 1.26 | 1.23 | 1.24 | 1.25 | 1.26 | 1.24 | 1.23 |
| Cr | - | - | - | - | - | - | - | - | - |
| P | - | - | - | - | - | - | - | - | - |
| Total | 5.06 | 5.06 | 4.93 | 4.91 | 4.93 | 4.94 | 4.94 | 4.93 | 4.92 |
| An | 40.29 | 38.38 | 25.55 | 22.85 | 23.85 | 24.73 | 24.89 | 23.21 | 23.07 |
| Ab | 59.06 | 61.16 | 73.88 | 76.27 | 75.39 | 74.58 | 74.12 | 75.87 | 76.15 |
| Or | 0.65 | 0.47 | 0.57 | 0.88 | 0.76 | 0.69 | 1.00 | 0.92 | 0.77 |
| GS-06 | Mafic Enclaves | |||||||||
|---|---|---|---|---|---|---|---|---|---|---|
| 1-1 | 1-2 | 1-3 | 1-4 | 1-5 | 1-6 | 1-7 | 1-8 | 1-9 | 1-10 | |
| SiO2 | 60.82 | 63.02 | 62.36 | 61.00 | 62.55 | 62.87 | 61.43 | 64.11 | 60.76 | 62.19 |
| TiO2 | 0.01 | - | - | 0.02 | 0.01 | 0.01 | 0.01 | 0.01 | - | 0.01 |
| Na2O | 8.86 | 9.18 | 9.38 | 8.80 | 8.53 | 7.51 | 8.58 | 9.13 | 6.47 | 8.72 |
| NiO | 0.03 | 0.01 | - | 0.02 | - | 0.06 | 0.01 | - | 0.16 | 0.00 |
| K2O | 0.10 | 0.14 | 0.22 | 0.16 | 0.30 | 0.99 | 0.29 | 0.33 | 0.19 | 0.14 |
| MgO | - | - | 0.01 | 0.01 | 0.02 | 0.04 | 0.01 | 0.04 | 0.03 | 0.01 |
| FeO | 0.04 | 0.01 | 0.07 | 0.07 | 0.02 | 0.09 | 0.06 | 0.13 | 0.05 | 0.03 |
| CaO | 5.35 | 4.47 | 4.55 | 5.38 | 4.42 | 6.11 | 5.24 | 4.80 | 2.51 | 5.14 |
| MnO | - | 0.01 | 0.01 | 0.02 | 0.02 | - | - | - | - | - |
| Al2O3 | 24.45 | 23.97 | 23.73 | 24.54 | 23.66 | 23.75 | 24.20 | 24.84 | 24.02 | 24.43 |
| Cr2O3 | 0.01 | - | - | - | 0.01 | - | - | - | 0.01 | - |
| P2O5 | 0.02 | - | - | - | 0.01 | - | 0.04 | 0.05 | - | - |
| Total | 99.68 | 100.80 | 100.33 | 100.01 | 99.55 | 101.44 | 99.88 | 103.44 | 94.18 | 100.66 |
| Number of ions (based on O = 8) | ||||||||||
| Si | 2.67 | 2.71 | 2.70 | 2.67 | 2.71 | 2.70 | 2.68 | 2.72 | 2.75 | 2.70 |
| Ti | - | - | - | - | - | - | - | - | - | - |
| Na | 0.75 | 0.77 | 0.79 | 0.75 | 0.72 | 0.63 | 0.73 | 0.75 | 0.57 | 0.73 |
| Ni | - | - | - | - | - | - | - | - | - | - |
| K | 0.01 | 0.01 | 0.01 | 0.01 | 0.02 | 0.05 | 0.02 | 0.02 | 0.01 | 0.01 |
| Mg | - | - | - | - | - | - | - | - | - | - |
| Fe2+ | - | - | - | - | - | - | - | - | - | - |
| Ca | 0.25 | 0.21 | 0.21 | 0.25 | 0.21 | 0.28 | 0.25 | 0.22 | 0.12 | 0.24 |
| Mn | - | - | - | - | - | - | - | - | - | - |
| Al | 1.27 | 1.22 | 1.21 | 1.27 | 1.21 | 1.20 | 1.25 | 1.24 | 1.28 | 1.25 |
| Cr | - | - | - | - | - | - | - | - | - | - |
| P | - | - | - | - | - | - | - | - | - | - |
| Total | 4.95 | 4.91 | 4.92 | 4.95 | 4.86 | 4.87 | 4.92 | 4.95 | 4.74 | 4.93 |
| An | 24.88 | 21.03 | 20.88 | 25.02 | 21.88 | 29.27 | 24.83 | 22.09 | 17.37 | 24.38 |
| Ab | 74.59 | 78.20 | 77.94 | 74.09 | 76.33 | 65.10 | 73.54 | 76.11 | 81.08 | 74.83 |
| Or | 0.54 | 0.77 | 1.18 | 0.89 | 1.79 | 5.63 | 1.63 | 1.80 | 1.54 | 0.80 |
| Samples | Mafic Enclaves | Host Rock | |||||||||
|---|---|---|---|---|---|---|---|---|---|---|---|
| From K-Feldspar Granite | From Adamellite | K-Feldspar Granite | Adamellite | Granodiorite | |||||||
| GS-06 | QSB-06 | GS-03 | GS-16 | GS-27 | GS-02 | GS-07 | GS-25 | GS-04 | GS-09 | GS-23 | |
| SiO2 | 54.05 | 56.54 | 74.33 | 78.51 | 77.16 | 75.37 | 75.41 | 74.58 | 62.79 | 64.93 | 61.47 |
| TiO2 | 1.36 | 1.14 | 0.13 | 0.11 | 0.16 | 0.13 | 0.17 | 0.40 | 0.79 | 0.64 | 0.74 |
| Al2O3 | 18.53 | 17.50 | 13.96 | 11.31 | 12.12 | 13.66 | 13.52 | 12.46 | 17.12 | 16.68 | 16.36 |
| TFe2O3 | 6.98 | 6.53 | 0.92 | 0.76 | 0.89 | 0.88 | 1.72 | 2.29 | 4.12 | 3.38 | 5.27 |
| K2O | 2.45 | 2.33 | 4.78 | 4.44 | 5.10 | 4.64 | 1.15 | 3.58 | 4.00 | 4.83 | 2.04 |
| Na2O | 4.83 | 4.65 | 4.03 | 2.95 | 3.07 | 3.81 | 4.58 | 3.47 | 4.25 | 4.05 | 4.37 |
| CaO | 5.63 | 5.50 | 0.87 | 0.68 | 0.40 | 0.85 | 2.46 | 1.64 | 3.56 | 2.96 | 4.38 |
| MgO | 4.02 | 3.15 | 0.34 | 0.24 | 0.29 | 0.29 | 0.50 | 0.91 | 1.75 | 1.31 | 2.28 |
| MnO | 0.19 | 0.14 | 0.03 | 0.02 | 0.03 | 0.03 | 0.03 | 0.06 | 0.08 | 0.06 | 0.09 |
| P2O5 | 0.70 | 0.61 | 0.04 | 0.01 | 0.06 | 0.04 | 0.07 | 0.14 | 0.34 | 0.25 | 0.4 |
| LOI 1000 | 1.59 | 0.90 | 0.88 | 0.83 | 0.80 | 0.95 | 0.59 | 0.91 | 1.32 | 0.73 | 3.08 |
| Total | 100.33 | 98.99 | 100.31 | 99.86 | 100.08 | 100.65 | 100.20 | 100.44 | 100.12 | 99.82 | 100.48 |
| K2O + Na2O | 7.28 | 6.98 | 8.81 | 7.39 | 8.17 | 8.45 | 5.73 | 7.05 | 8.25 | 8.88 | 6.41 |
| K2O/Na2O | 0.51 | 0.5 | 1.19 | 1.51 | 1.66 | 1.22 | 0.25 | 1.03 | 0.94 | 1.19 | 0.47 |
| AR | 1.86 | 1.87 | 3.93 | 4.21 | 4.76 | 3.79 | 2.12 | 3 | 2.33 | 2.65 | 1.89 |
| DI | 58.83 | 60.83 | 93.15 | 94.09 | 93.26 | 92.77 | 85.16 | 88.52 | 76.15 | 79.96 | 72.26 |
| σ | 4.78 | 3.49 | 2.48 | 1.54 | 1.95 | 2.21 | 1.01 | 1.58 | 3.43 | 3.58 | 2.23 |
| A/CNK | 0.89 | 0.87 | 1.04 | 1.04 | 1.07 | 1.06 | 1.02 | 0.99 | 0.96 | 0.97 | 0.94 |
| A/NK | 1.75 | 1.72 | 1.18 | 1.17 | 1.15 | 1.21 | 1.54 | 1.30 | 1.51 | 1.40 | 1.74 |
| R1 | 1104 | 1397 | 2369 | 3127 | 2829 | 2541 | 3076 | 2822 | 1617 | 1663 | 1912 |
| R2 | 1167 | 1104 | 383 | 307 | 295 | 371 | 553 | 464 | 805 | 712 | 901 |
| Samples | Mafic Enclaves | Host Rock | |||||||||
|---|---|---|---|---|---|---|---|---|---|---|---|
| GS-06 | QSB-06 | GS-03 | GS-16 | GS-27 | GS-02 | GS-07 | GS-25 | GS-04 | GS-09 | GS-23 | |
| Ag ** | 0.05 | <0.01 | 0.08 | 0.05 | 0.11 | 0.01 | 0.04 | 0.09 | 0.30 | 0.06 | 0.1 |
| W | 0.5 | 0.4 | 0.3 | 0.6 | 1.8 | 0.3 | 0.2 | 0.2 | 0.3 | 0.2 | 0.9 |
| Zn * | 131 | 102 | 20 | 13 | 17 | 16 | 31 | 49 | 75 | 59 | 89 |
| Cu ** | 2.4 | 24.6 | 2.1 | 1.1 | 2.4 | 1.3 | 2.2 | 1.8 | 27.4 | 9.4 | 20.2 |
| Pb ** | 13.9 | 23.9 | 31.3 | 27.4 | 55.5 | 30.8 | 14.7 | 28.0 | 21.4 | 23.0 | 7.6 |
| Mo ** | 0.68 | 0.77 | 0.20 | 0.15 | 0.50 | 0.2 | 0.12 | 0.47 | 0.57 | 0.43 | 0.4 |
| Ba | 358 | 450 | 358 | 307 | 586 | 341 | 159.5 | 208 | 1790 | 1915 | 520 |
| K | 20,335 | 19,339 | 39,674 | 36,856 | 42,330 | 38,517 | 9545 | 29,714 | 33,200 | 40,089 | 16,934 |
| P * | 3052 | 2660 | 174 | 44 | 262 | 174 | 305 | 610 | 1482 | 1090 | 1744 |
| As ** | 3.20 | 1.80 | 3.10 | 3.7 | 1.80 | 1.4 | 2.50 | 3.70 | 3.00 | 3.50 | 4.1 |
| Be ** | 4.06 | 3.96 | 3.83 | 2.45 | 4.45 | 5.09 | 2.48 | 4.02 | 2.22 | 1.95 | 1.6 |
| Ti ** | 8146 | 6829 | 779 | 659 | 958 | 779 | 1018 | 2396 | 4732 | 3834 | 4433 |
| Bi ** | 0.33 | 0.27 | 0.11 | 0.11 | 0.28 | 0.19 | 0.10 | 0.10 | 0.25 | 0.07 | 0.04 |
| Cd ** | 0.15 | 0.05 | 0.02 | <0.02 | 0.04 | 0.02 | 0.04 | <0.02 | 0.14 | 0.04 | 0.05 |
| Ce | 65.2 | 154.0 | 42.5 | 36.6 | 89.5 | 39.5 | 18.50 | 94.7 | 114.0 | 113.0 | 45.7 |
| Co ** | 19.0 | 17.3 | 1.6 | 1.1 | 1.4 | 1.3 | 2.7 | 4.6 | 9.2 | 6.9 | 13.8 |
| Ni ** | 49.4 | 15.5 | 3.0 | 2.1 | 8.0 | 2 | 4.6 | 6.9 | 15.2 | 8.2 | 13.9 |
| Cr | 57 | 17 | 3 | 2 | 11 | 2 | 4 | 7 | 10 | 8 | 26 |
| Cs | 7.53 | 12.40 | 5.96 | 6.96 | 16.95 | 8.97 | 2.89 | 7.48 | 3.42 | 2.55 | 2.58 |
| Ga ** | 24.1 | 26.5 | 15.65 | 12.85 | 17.70 | 16 | 15.70 | 18.40 | 20.3 | 19.30 | 18.9 |
| Li | 55.8 | 75.2 | 35.9 | 12.8 | 53.1 | 35.6 | 19.3 | 64.0 | 27.6 | 21.3 | 69.2 |
| Nb | 19.9 | 47.3 | 9.2 | 11.5 | 14.0 | 11.1 | 2.3 | 25.0 | 22.9 | 19.3 | 10.5 |
| Sc | 12.6 | 13.1 | 2.0 | 2.1 | 2.6 | 1.7 | 1.3 | 4.3 | 5.6 | 4.1 | 8.7 |
| Sn | 4.6 | 3.7 | 1.1 | 2.1 | 0.7 | 1.4 | 0.5 | 2.5 | 2.4 | 1.8 | 1.8 |
| V | 126 | 121 | 10 | 8 | 10 | 10 | 19 | 29 | 62 | 49 | 72 |
| Rb ** | 139.0 | 125.0 | 220 | 176.5 | 334 | 262 | 32.6 | 219 | 89.2 | 109.0 | 56.7 |
| Sr ** | 559 | 668 | 211 | 80.1 | 147 | 235 | 345 | 219 | 749 | 677 | 313 |
| Cs | 7.53 | 12.40 | 5.96 | 6.51 | 16.95 | 8.32 | 2.89 | 7.48 | 3.42 | 2.55 | 2.5 |
| Hf | 4.7 | 8.1 | 2.2 | 2.2 | 3.7 | 2.3 | 3.9 | 6.0 | 6.7 | 6.5 | 5.7 |
| Nb | 18.7 | 47.3 | 8.3 | 11.5 | 14.7 | 10.7 | 2.4 | 24.7 | 21.3 | 19.6 | 10.5 |
| Ta | 0.92 | 3.74 | 0.79 | 1.11 | 1.43 | 1.03 | 0.11 | 2.03 | 1.48 | 1.30 | 0.64 |
| La | 44.1 | 58.4 | 25.9 | 17.9 | 53.9 | 21.4 | 12.7 | 53.3 | 69.1 | 72.0 | 33.4 |
| Th | 2.37 | 35.4 | 20.0 | 22.7 | 39.8 | 24.1 | 4.79 | 49.6 | 9.82 | 12.25 | 4.73 |
| U | 2.45 | 5.33 | 1.74 | 2.95 | 7.47 | 3.6 | 1.54 | 11.50 | 2.42 | 2.79 | 1.84 |
| Y | 18.5 | 46.5 | 4.6 | 15 | 13.4 | 5.1 | 1.8 | 12.2 | 15.6 | 13.8 | 16.3 |
| Zr | 209 | 319 | 74 | 55 | 124 | 71 | 157 | 216 | 322 | 304 | 261 |
| Ga | 23.1 | 26.5 | 14.1 | 12.8 | 16.9 | 15.8 | 14.7 | 18.2 | 19.0 | 19.3 | 18 |
| Th/U | 0.97 | 6.64 | 11.49 | 7.69 | 5.33 | 6.69 | 3.11 | 4.31 | 4.06 | 4.39 | 2.57 |
| Nb/Ta | 21.63 | 12.65 | 11.65 | 10.36 | 9.79 | 10.78 | 20.91 | 12.32 | 15.47 | 14.85 | 16.41 |
| Nb/La | 0.45 | 0.81 | 0.36 | 0.64 | 0.26 | 0.52 | 0.18 | 0.47 | 0.33 | 0.27 | 0.31 |
| Rb/Sr | 0.25 | 0.19 | 1.04 | 2.20 | 2.27 | 1.11 | 0.09 | 1.00 | 0.12 | 0.16 | 0.18 |
| Samples | Mafic Enclaves | Host Rock | |||||||||
|---|---|---|---|---|---|---|---|---|---|---|---|
| GS-06 | QSB-06 | GS-03 | GS-27 | GS-16 | GS-07 | GS-25 | GS-02 | GS-04 | GS-09 | GS-23 | |
| La | 44.1 | 58.4 | 25.9 | 53.9 | 17.9 | 12.7 | 53.3 | 21.4 | 69.1 | 72.0 | 33.4 |
| Ce | 105.5 | 154.0 | 40.4 | 87.7 | 36.4 | 19.9 | 100.0 | 39.6 | 145.5 | 142.0 | 69 |
| Pr | 13.25 | 21.4 | 3.48 | 8.97 | 3.73 | 1.65 | 9.18 | 3.41 | 15.25 | 14.20 | 7.6 |
| Nd | 51.1 | 87.3 | 10.4 | 28.2 | 12.8 | 4.9 | 29.2 | 10.6 | 50.4 | 47.5 | 28.3 |
| Sm | 9.23 | 17.80 | 1.50 | 4.49 | 2.7 | 0.67 | 4.28 | 1.61 | 7.55 | 7.17 | 5.47 |
| Eu | 2.67 | 3.36 | 0.39 | 0.55 | 0.45 | 0.38 | 0.82 | 0.37 | 1.73 | 1.62 | 1.45 |
| Gd | 6.84 | 12.25 | 1.04 | 3.03 | 2.44 | 0.50 | 3.15 | 1.15 | 5.12 | 4.79 | 4.86 |
| Tb | 0.92 | 1.71 | 0.16 | 0.39 | 0.42 | 0.06 | 0.42 | 0.17 | 0.66 | 0.61 | 0.69 |
| Dy | 5.01 | 9.25 | 0.81 | 2.24 | 2.63 | 0.33 | 2.26 | 0.89 | 3.49 | 3.19 | 4.05 |
| Ho | 0.87 | 1.75 | 0.16 | 0.41 | 0.53 | 0.07 | 0.41 | 0.19 | 0.65 | 0.59 | 0.78 |
| Er | 2.53 | 4.69 | 0.46 | 1.20 | 1.58 | 0.21 | 1.22 | 0.53 | 1.66 | 1.56 | 2.06 |
| Tm | 0.38 | 0.65 | 0.08 | 0.18 | 0.25 | 0.04 | 0.19 | 0.09 | 0.25 | 0.23 | 0.28 |
| Yb | 2.36 | 4.19 | 0.57 | 1.19 | 1.72 | 0.29 | 1.32 | 0.64 | 1.55 | 1.48 | 1.79 |
| Lu | 0.38 | 0.61 | 0.11 | 0.18 | 0.27 | 0.06 | 0.22 | 0.14 | 0.25 | 0.22 | 0.25 |
| Y | 18.5 | 46.5 | 4.6 | 13.4 | 15 | 1.8 | 12.2 | 5.1 | 15.6 | 13.8 | 16.3 |
| ΣREE | 245.14 | 377.36 | 85.46 | 192.63 | 83.82 | 41.76 | 205.97 | 80.79 | 303.16 | 297.16 | 159.98 |
| LREE | 225.85 | 342.26 | 82.07 | 183.81 | 73.98 | 40.20 | 196.78 | 76.99 | 289.53 | 284.49 | 145.22 |
| HREE | 19.29 | 35.10 | 3.39 | 8.82 | 9.84 | 1.56 | 9.19 | 3.8 | 13.63 | 12.67 | 14.76 |
| LREE/HREE | 11.71 | 9.75 | 24.21 | 20.84 | 7.52 | 25.77 | 21.41 | 20.26 | 21.24 | 22.45 | 9.84 |
| LaN/YbN | 13.40 | 10.00 | 32.59 | 32.49 | 7.46 | 31.41 | 28.96 | 23.98 | 31.98 | 34.90 | 13.38 |
| δEu | 0.98 | 0.66 | 0.90 | 0.43 | 0.53 | 1.92 | 0.65 | 0.79 | 0.80 | 0.80 | 0.84 |
| δCe | 1.06 | 1.07 | 0.90 | 0.89 | 1.04 | 0.92 | 1.02 | 1.03 | 1.05 | 1.02 | 1.02 |
| Analysis | 232Th | 238U | Th/U | Isotopic Ratios | Isotopic Ages (Ma) | ||||||||||
|---|---|---|---|---|---|---|---|---|---|---|---|---|---|---|---|
| 207Pb/206Pb | 207Pb/235U | 206Pb/238U | 207Pb/206Pb | 207Pb/235U | 206Pb/238U | ||||||||||
| (ppm) | (ppm) | 1sd (±%) | 1sd (±%) | 1sd (±%) | 1sd (±%) | 1sd (±%) | 1sd (±%) | ||||||||
| GS06-1 | 408 | 231 | 1.77 | 0.06313 | 0.00232 | 0.59519 | 0.02093 | 0.06838 | 0.00119 | 713 | 80 | 474 | 13 | 426 | 7 |
| GS06-2 | 230 | 164 | 1.40 | 0.05842 | 0.00229 | 0.54318 | 0.02048 | 0.06744 | 0.00118 | 546 | 88 | 441 | 13 | 421 | 7 |
| GS06-3 | 399 | 232 | 1.72 | 0.05377 | 0.00189 | 0.49820 | 0.01694 | 0.06720 | 0.00110 | 361 | 81 | 410 | 11 | 419 | 7 |
| GS06-4 | 407 | 303 | 1.34 | 0.05747 | 0.00198 | 0.53519 | 0.01773 | 0.06755 | 0.00113 | 510 | 78 | 435 | 12 | 421 | 7 |
| GS06-5 | 393 | 158 | 2.49 | 0.05752 | 0.00300 | 0.55447 | 0.02771 | 0.06992 | 0.00143 | 512 | 118 | 448 | 18 | 436 | 9 |
| GS06-6 | 159 | 164 | 0.97 | 0.05379 | 0.00208 | 0.51380 | 0.01924 | 0.06929 | 0.00117 | 362 | 89 | 421 | 13 | 432 | 7 |
| GS06-7 | 51 | 73 | 0.69 | 0.05353 | 0.00390 | 0.52657 | 0.03716 | 0.07135 | 0.00168 | 351 | 168 | 430 | 25 | 444 | 10 |
| GS06-8 | 223 | 121 | 1.84 | 0.05477 | 0.00259 | 0.53205 | 0.02429 | 0.07046 | 0.00134 | 403 | 109 | 433 | 16 | 439 | 8 |
| GS06-9 | 175 | 61 | 2.88 | 0.05503 | 0.00402 | 0.53707 | 0.03802 | 0.07079 | 0.00166 | 413 | 168 | 436 | 25 | 441 | 10 |
| GS06-10 | 257 | 167 | 1.54 | 0.05673 | 0.00183 | 0.55337 | 0.01734 | 0.07075 | 0.00113 | 481 | 73 | 447 | 11 | 441 | 7 |
| GS06-11 | 391 | 163 | 2.40 | 0.05556 | 0.00186 | 0.54858 | 0.01779 | 0.07161 | 0.00117 | 435 | 76 | 444 | 12 | 446 | 7 |
| GS06-12 | 178 | 113 | 1.58 | 0.06000 | 0.00350 | 0.57256 | 0.03205 | 0.06922 | 0.00153 | 604 | 130 | 460 | 21 | 431 | 9 |
| GS06-13 | 298 | 118 | 2.53 | 0.05528 | 0.00221 | 0.53483 | 0.02071 | 0.07018 | 0.00123 | 424 | 91 | 435 | 14 | 437 | 7 |
| GS06-14 | 247 | 242 | 1.02 | 0.06285 | 0.00159 | 0.59355 | 0.01451 | 0.06850 | 0.00106 | 703 | 55 | 473 | 9 | 427 | 6 |
| Analysis | 232Th | 238U | Th/U | Isotopic Ratios | Isotopic Ages (Ma) | ||||||||||
|---|---|---|---|---|---|---|---|---|---|---|---|---|---|---|---|
| 207Pb/206Pb | 207Pb/235U | 206Pb/238U | 207Pb/206Pb | 207Pb/235U | 206Pb/238U | ||||||||||
| (ppm) | (ppm) | 1sd (±%) | 1sd (±%) | 1sd (±%) | 1sd (±%) | 1sd (±%) | 1sd (±%) | ||||||||
| qsb-15-1 | 569 | 743 | 0.77 | 0.06189 | 0.00303 | 0.5763 | 0.02693 | 0.06753 | 0.00099 | 670 | 108 | 462 | 17 | 421 | 6 |
| qsb-15-2 | 1079 | 1113 | 0.97 | 0.05836 | 0.00112 | 0.5598 | 0.01188 | 0.0696 | 0.00105 | 543 | 43 | 451 | 8 | 434 | 6 |
| qsb-15-3 | 250 | 165 | 1.52 | 0.05721 | 0.00146 | 0.54353 | 0.01444 | 0.06892 | 0.00105 | 500 | 58 | 441 | 9 | 430 | 6 |
| qsb-15-4 | 681 | 769 | 0.89 | 0.05962 | 0.00112 | 0.56903 | 0.01177 | 0.06925 | 0.00102 | 590 | 42 | 457 | 8 | 432 | 6 |
| qsb-15-5 | 694 | 815 | 0.85 | 0.06133 | 0.00108 | 0.56913 | 0.01115 | 0.06733 | 0.00097 | 651 | 39 | 457 | 7 | 420 | 6 |
| qsb-15-6 | 338 | 431 | 0.78 | 0.06617 | 0.00125 | 0.63676 | 0.01311 | 0.06982 | 0.00101 | 812 | 40 | 500 | 8 | 435 | 6 |
| qsb-15-7 | 754 | 429 | 1.76 | 0.0618 | 0.00112 | 0.58593 | 0.01164 | 0.06879 | 0.00098 | 667 | 40 | 468 | 7 | 429 | 6 |
| qsb-15-8 | 375 | 252 | 1.49 | 0.0577 | 0.00119 | 0.57422 | 0.01266 | 0.07221 | 0.00105 | 518 | 46 | 461 | 8 | 449 | 6 |
| qsb-15-9 | 417 | 585 | 0.71 | 0.06378 | 0.00121 | 0.60421 | 0.01245 | 0.06874 | 0.00098 | 734 | 41 | 480 | 8 | 429 | 6 |
| qsb-15-10 | 609 | 795 | 0.77 | 0.05802 | 0.00118 | 0.57858 | 0.01296 | 0.07242 | 0.00111 | 531 | 46 | 464 | 8 | 451 | 7 |
| qsb-15-11 | 533 | 838 | 0.64 | 0.05798 | 0.00125 | 0.55667 | 0.01298 | 0.06971 | 0.00107 | 529 | 48 | 449 | 8 | 434 | 6 |
| qsb-15-12 | 491 | 429 | 1.15 | 0.0589 | 0.00139 | 0.57282 | 0.01438 | 0.0706 | 0.00109 | 563 | 53 | 460 | 9 | 440 | 7 |
| qsb-15-13 | 446 | 465 | 0.96 | 0.05807 | 0.00122 | 0.55623 | 0.0126 | 0.06949 | 0.00104 | 532 | 47 | 449 | 8 | 433 | 6 |
| qsb-15-14 | 346 | 602 | 0.57 | 0.05628 | 0.0012 | 0.53889 | 0.01239 | 0.06947 | 0.00104 | 463 | 48 | 438 | 8 | 433 | 6 |
| qsb-15-15 | 630 | 840 | 0.75 | 0.06396 | 0.0013 | 0.61097 | 0.01347 | 0.06929 | 0.00103 | 740 | 44 | 484 | 8 | 432 | 6 |
| qsb-15-16 | 609 | 808 | 0.75 | 0.06023 | 0.00126 | 0.57104 | 0.01288 | 0.06877 | 0.00103 | 612 | 46 | 459 | 8 | 429 | 6 |
© 2019 by the authors. Licensee MDPI, Basel, Switzerland. This article is an open access article distributed under the terms and conditions of the Creative Commons Attribution (CC BY) license (http://creativecommons.org/licenses/by/4.0/).
Share and Cite
Liu, W.; Liu, X.; Pan, J.; Wang, K.; Wang, G.; Niu, Y.; Gong, W. Magma Mixing Genesis of the Mafic Enclaves in the Qingshanbao Complex of Longshou Mountain, China: Evidence from Petrology, Geochemistry, and Zircon Chronology. Minerals 2019, 9, 195. https://doi.org/10.3390/min9030195
Liu W, Liu X, Pan J, Wang K, Wang G, Niu Y, Gong W. Magma Mixing Genesis of the Mafic Enclaves in the Qingshanbao Complex of Longshou Mountain, China: Evidence from Petrology, Geochemistry, and Zircon Chronology. Minerals. 2019; 9(3):195. https://doi.org/10.3390/min9030195
Chicago/Turabian StyleLiu, Wenheng, Xiaodong Liu, Jiayong Pan, Kaixing Wang, Gang Wang, Yuben Niu, and Wanjing Gong. 2019. "Magma Mixing Genesis of the Mafic Enclaves in the Qingshanbao Complex of Longshou Mountain, China: Evidence from Petrology, Geochemistry, and Zircon Chronology" Minerals 9, no. 3: 195. https://doi.org/10.3390/min9030195