Geological, Geochronological, and Geochemical Insights into the Formation of the Giant Pulang Porphyry Cu (–Mo–Au) Deposit in Northwestern Yunnan Province, SW China

Abstract
:1. Introduction
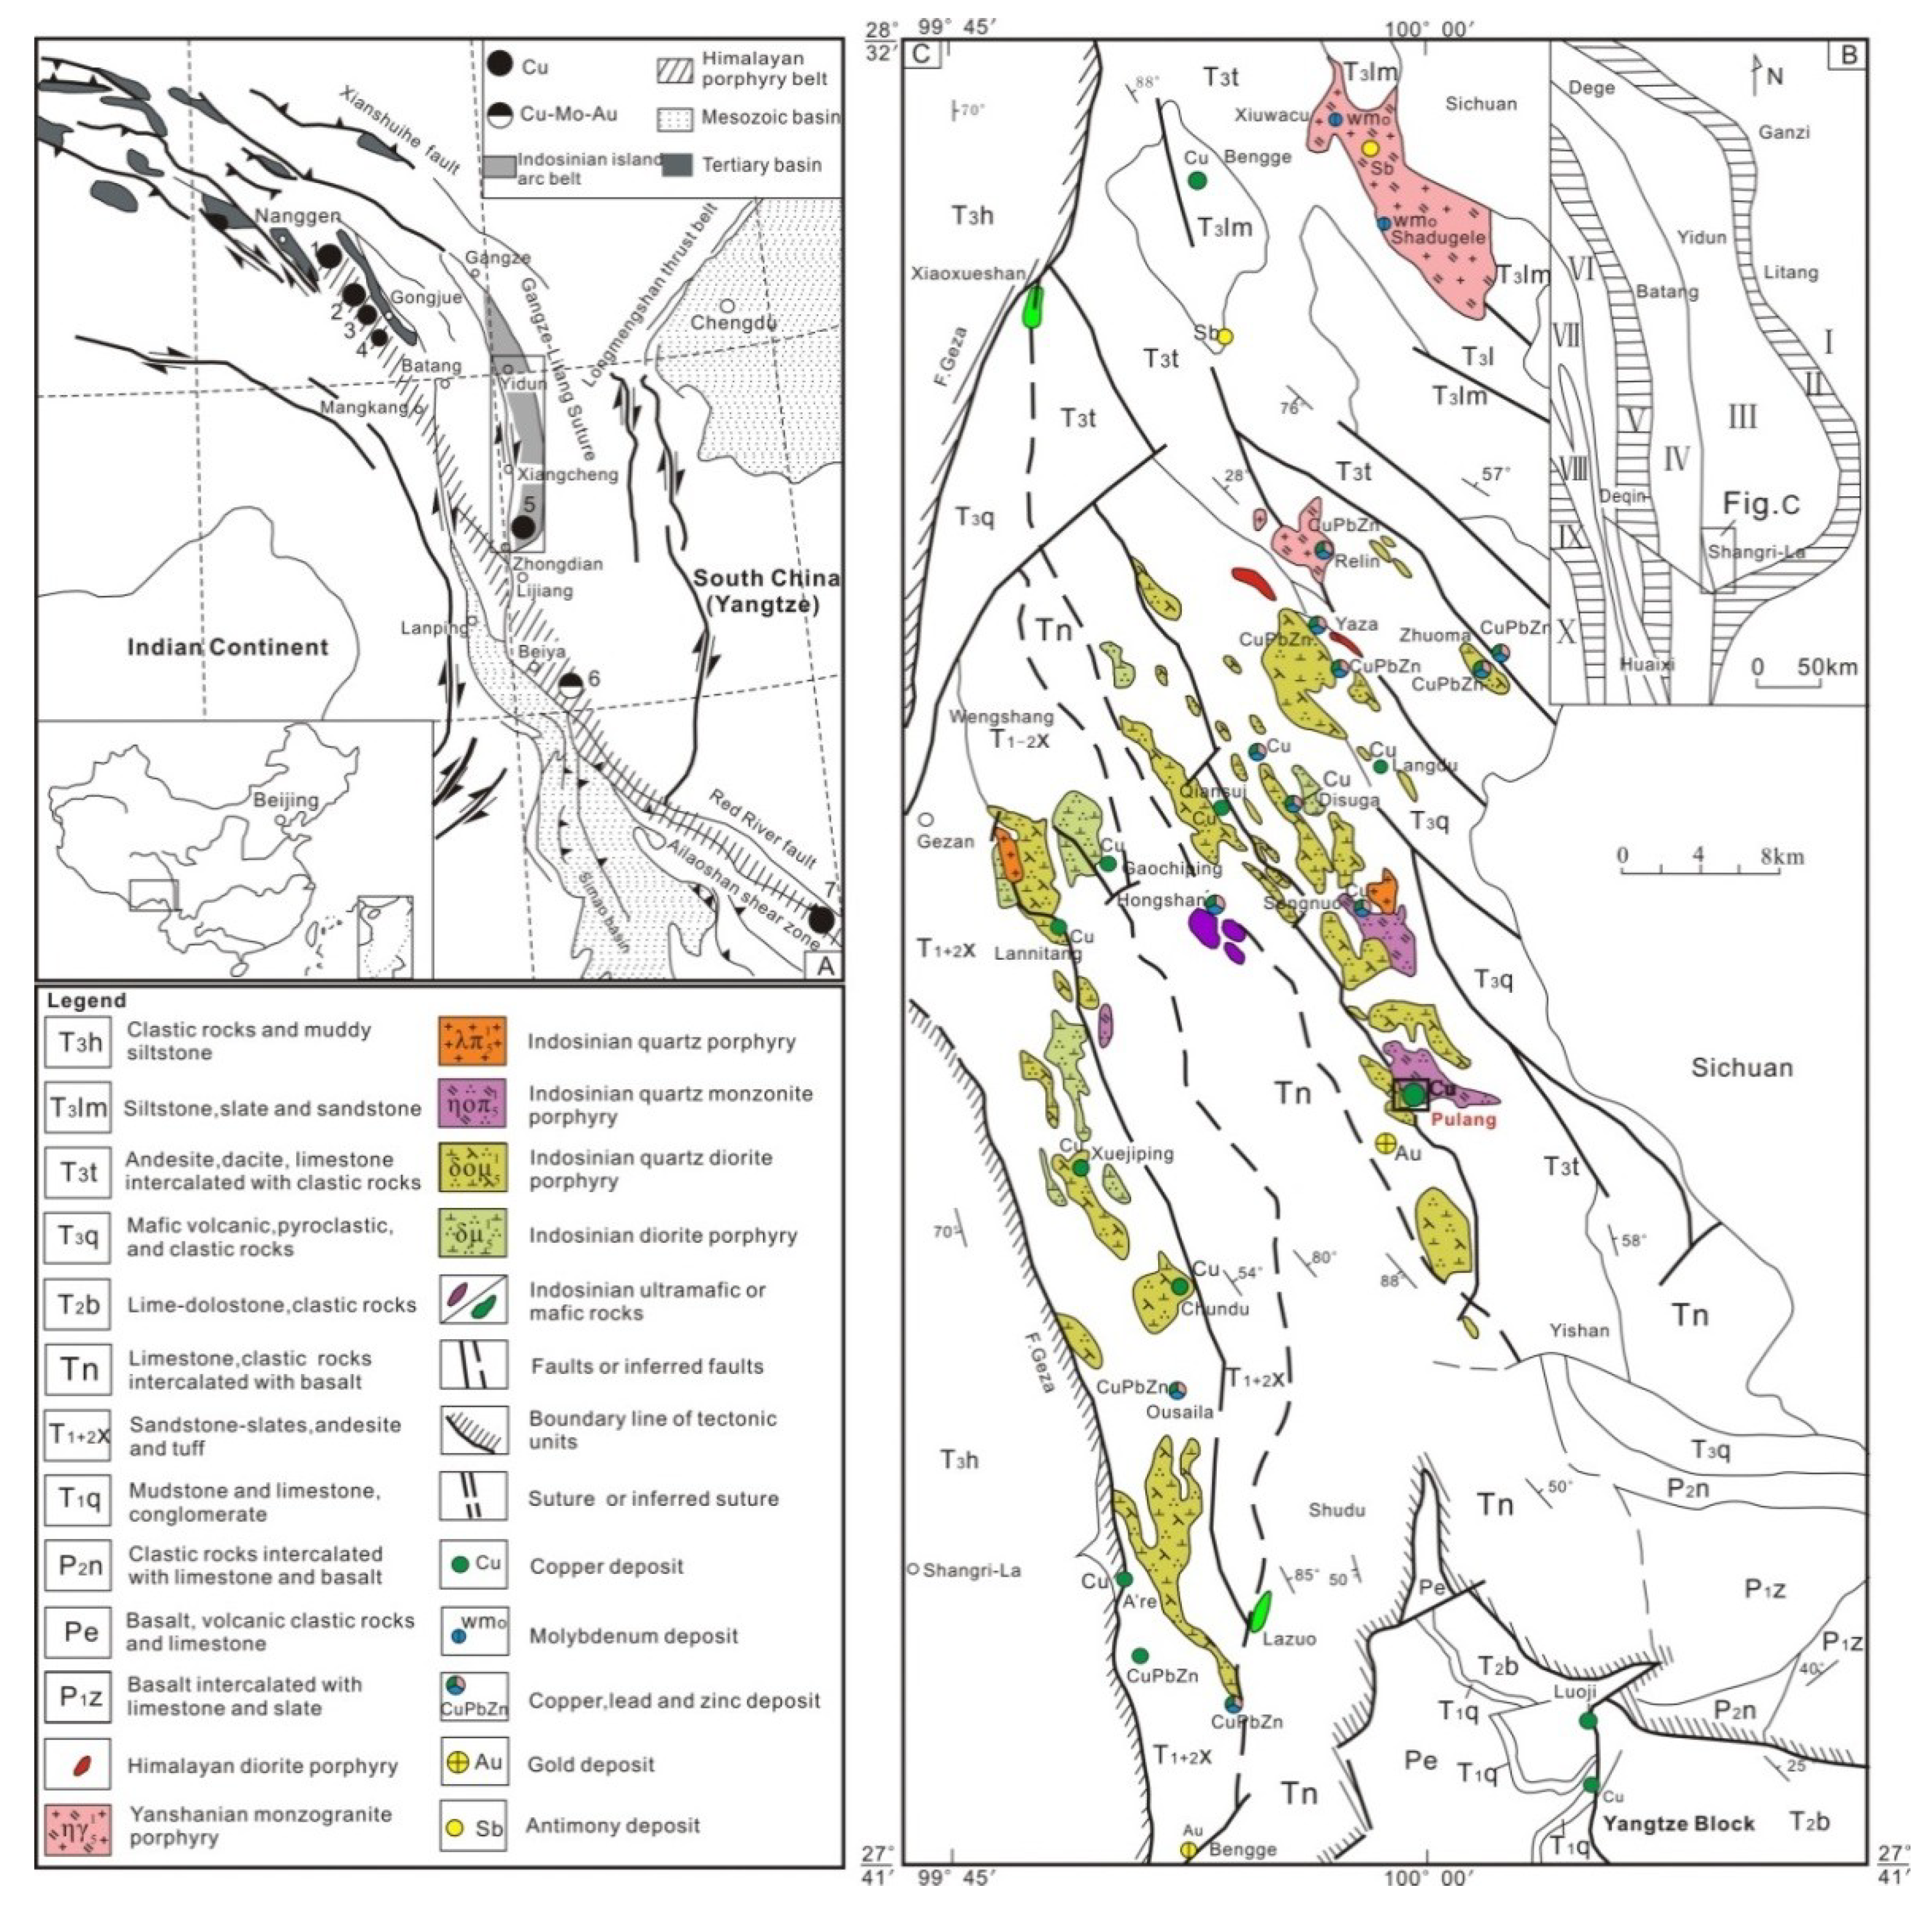
2. Geological Background
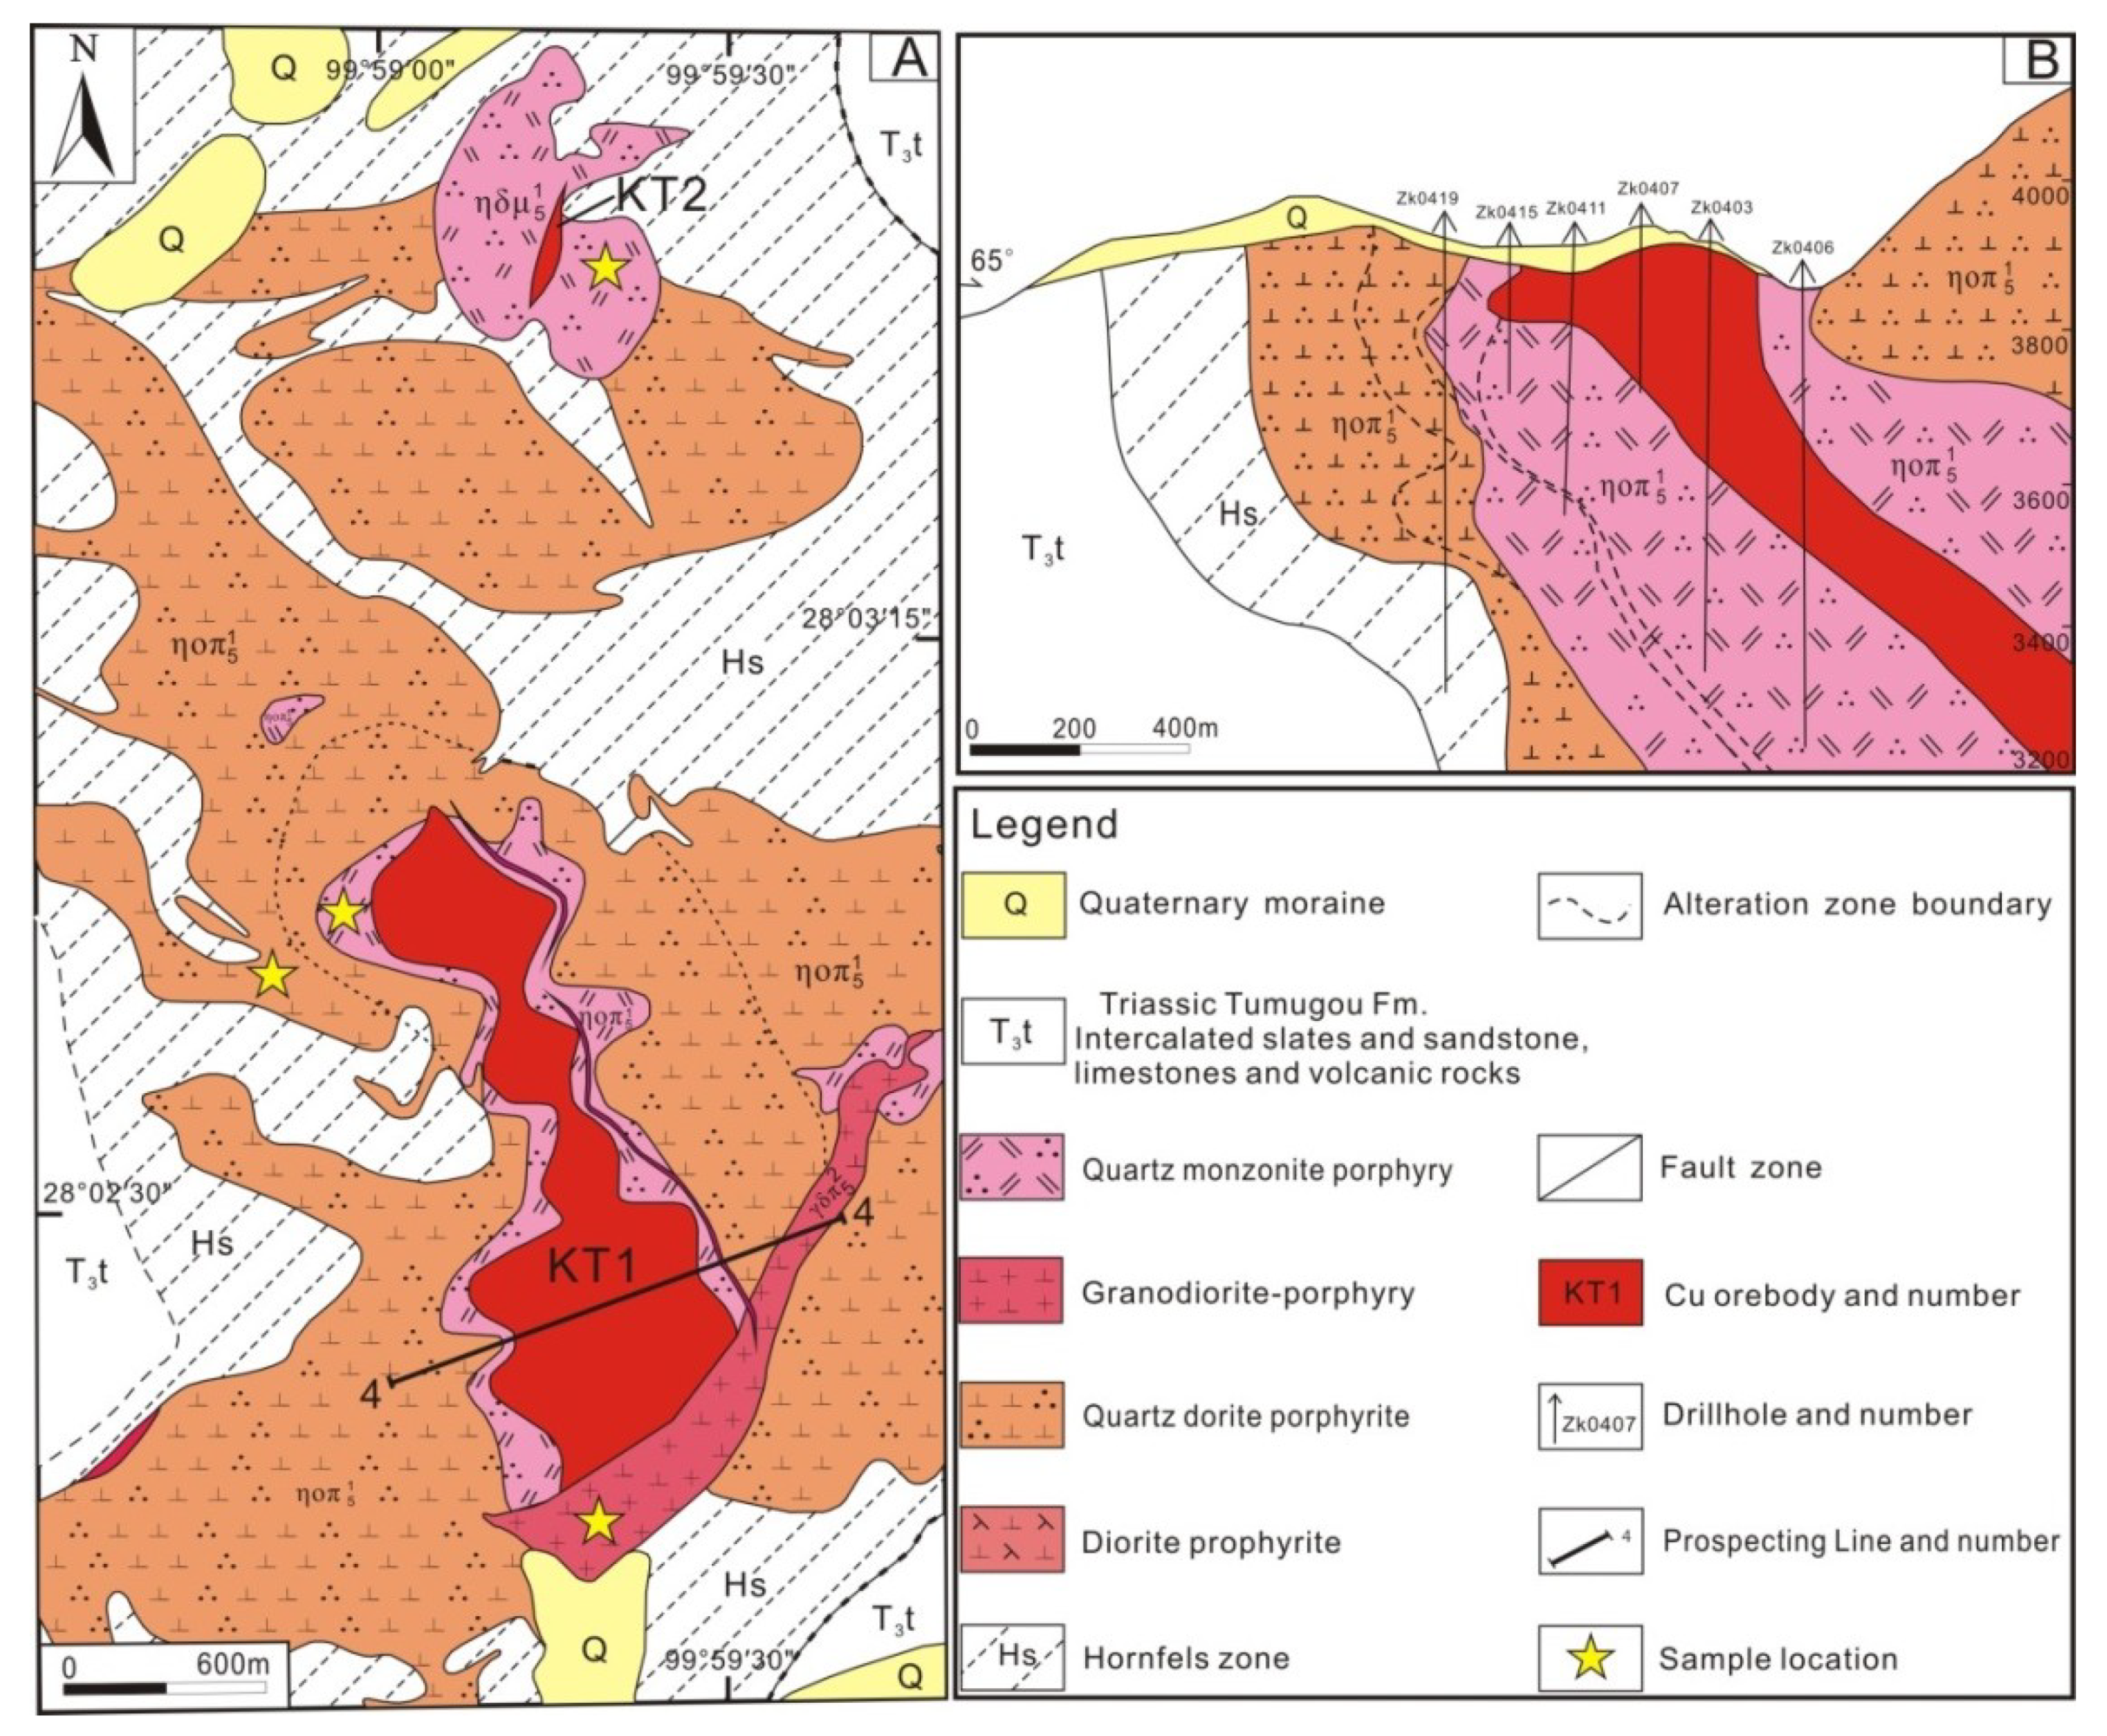
3. Deposit Geology
4. Samples and Analytical Methods
4.1. LA-ICP-MS Zircon U–Pb Dating
4.2. Molybdenite Re–Os Dating
4.3. Major and Trace Element Concentrations
5. Analytical Results
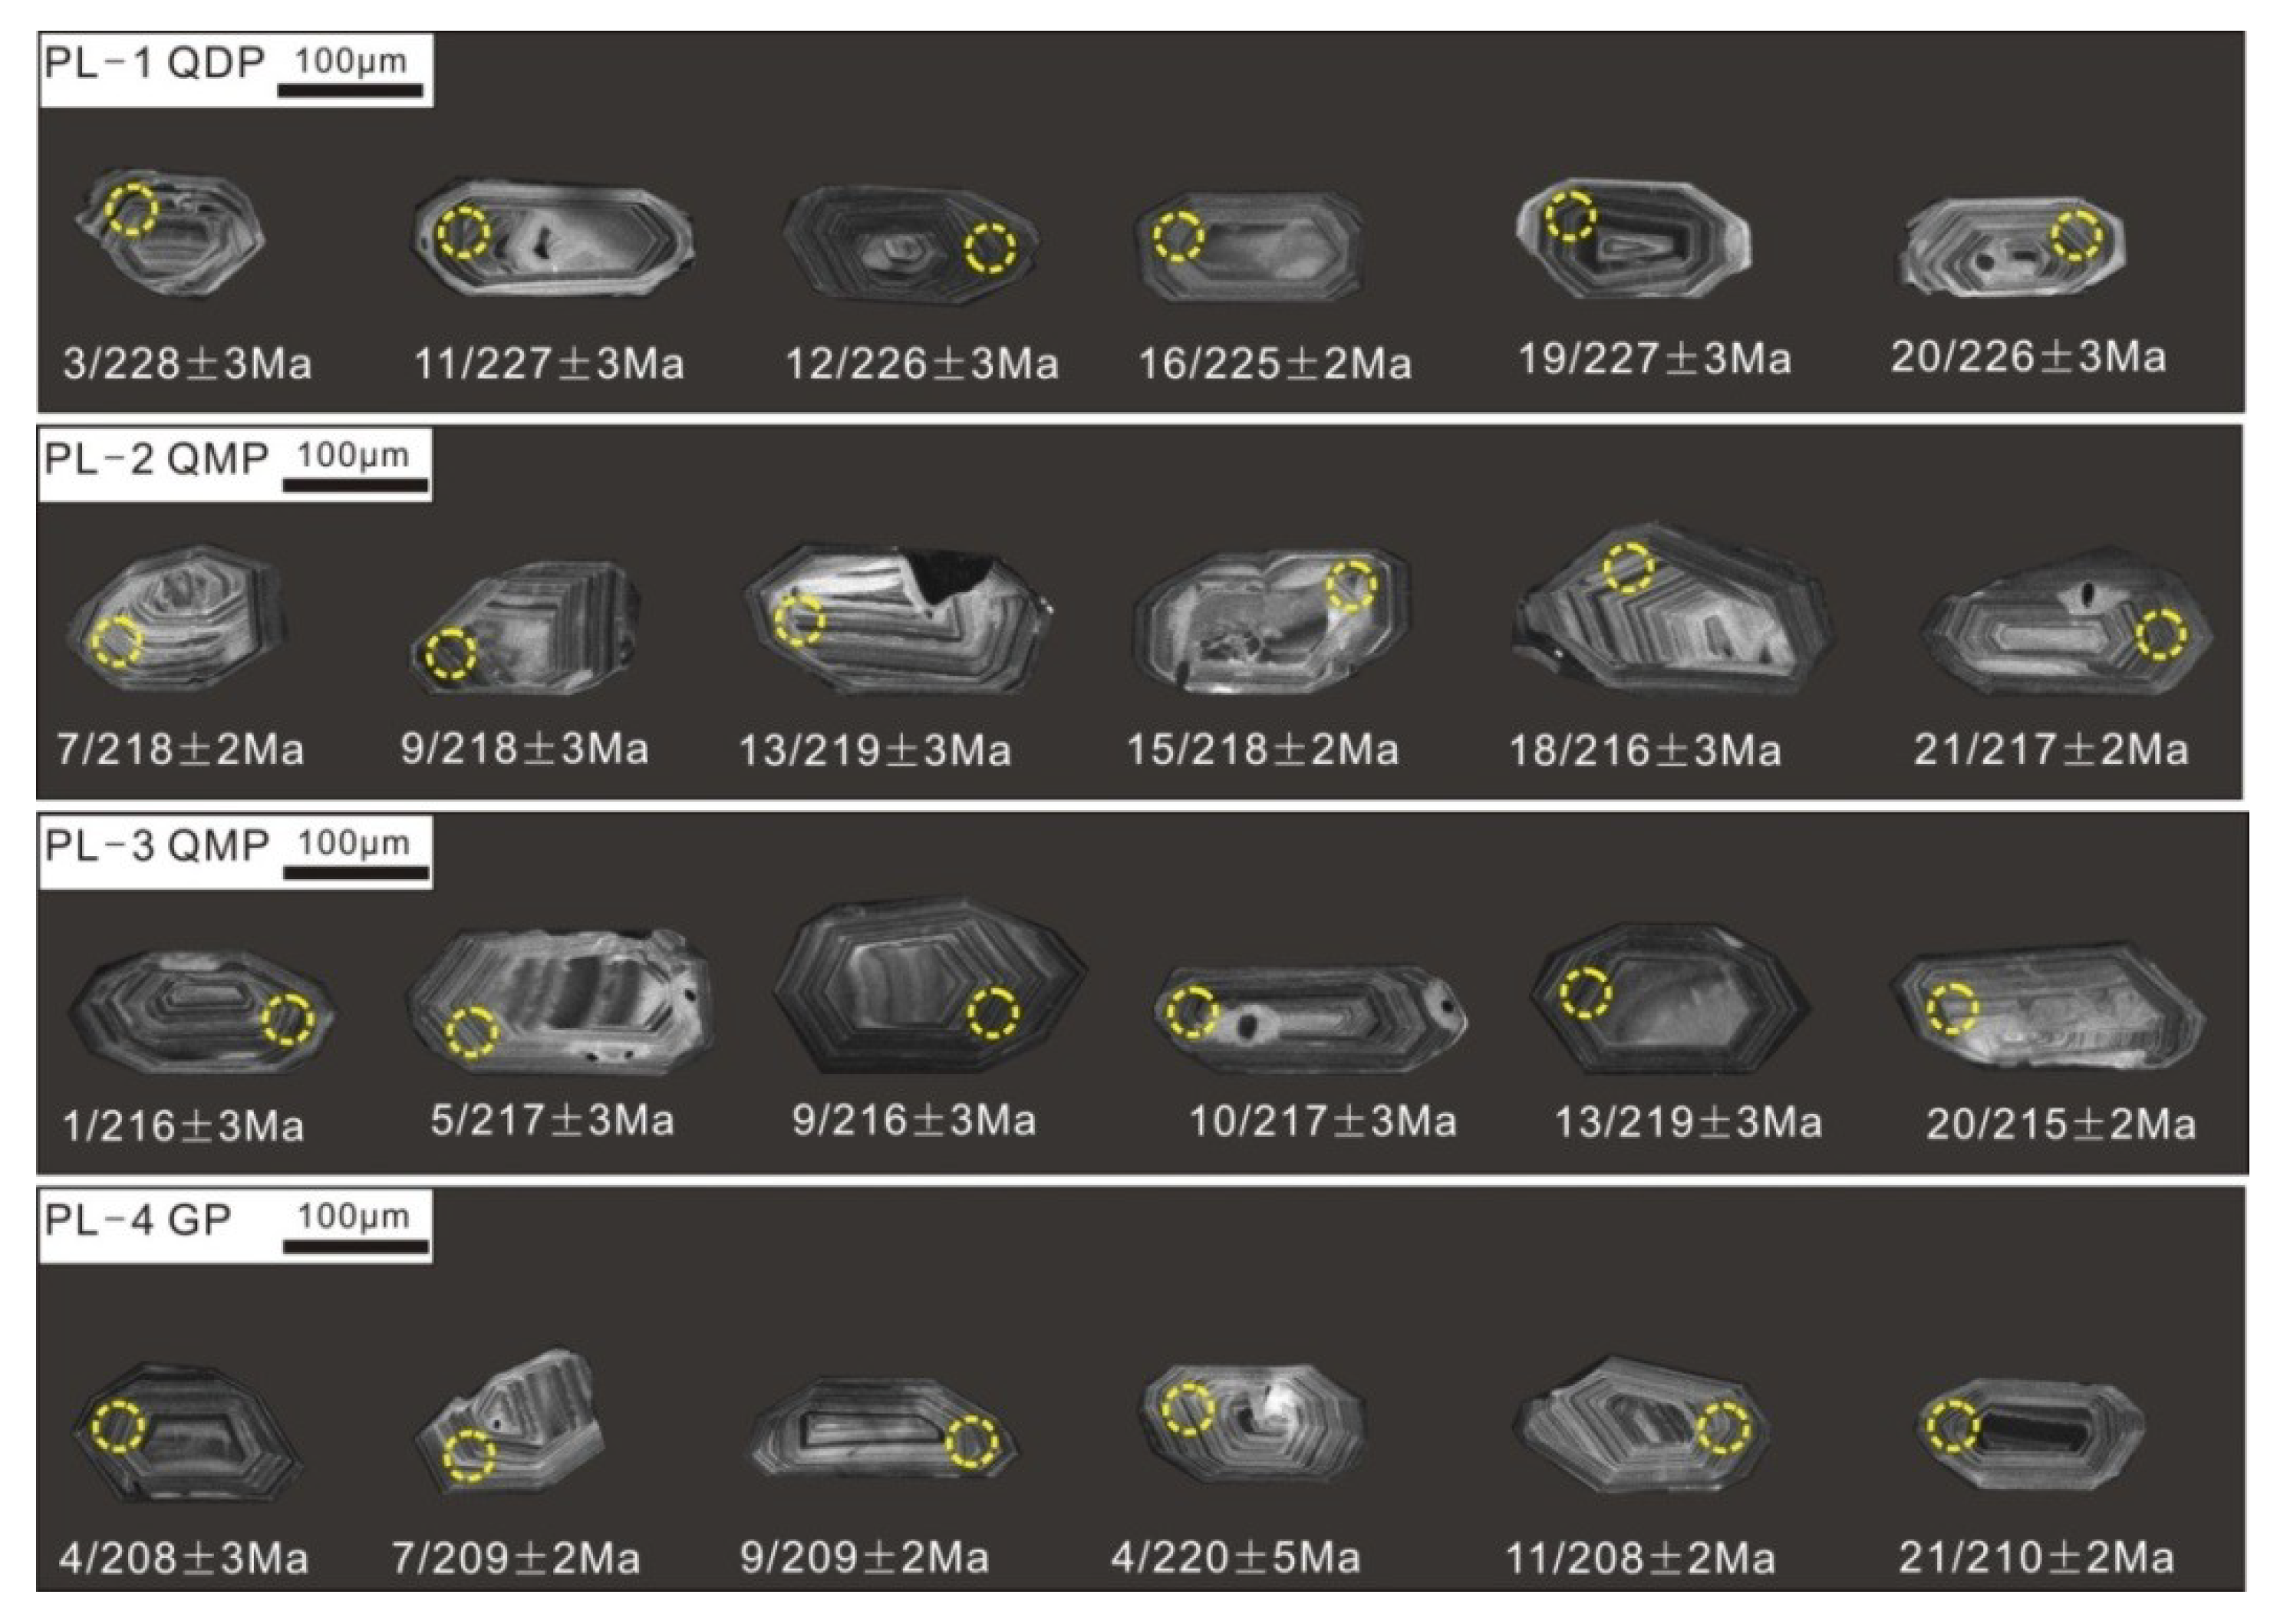
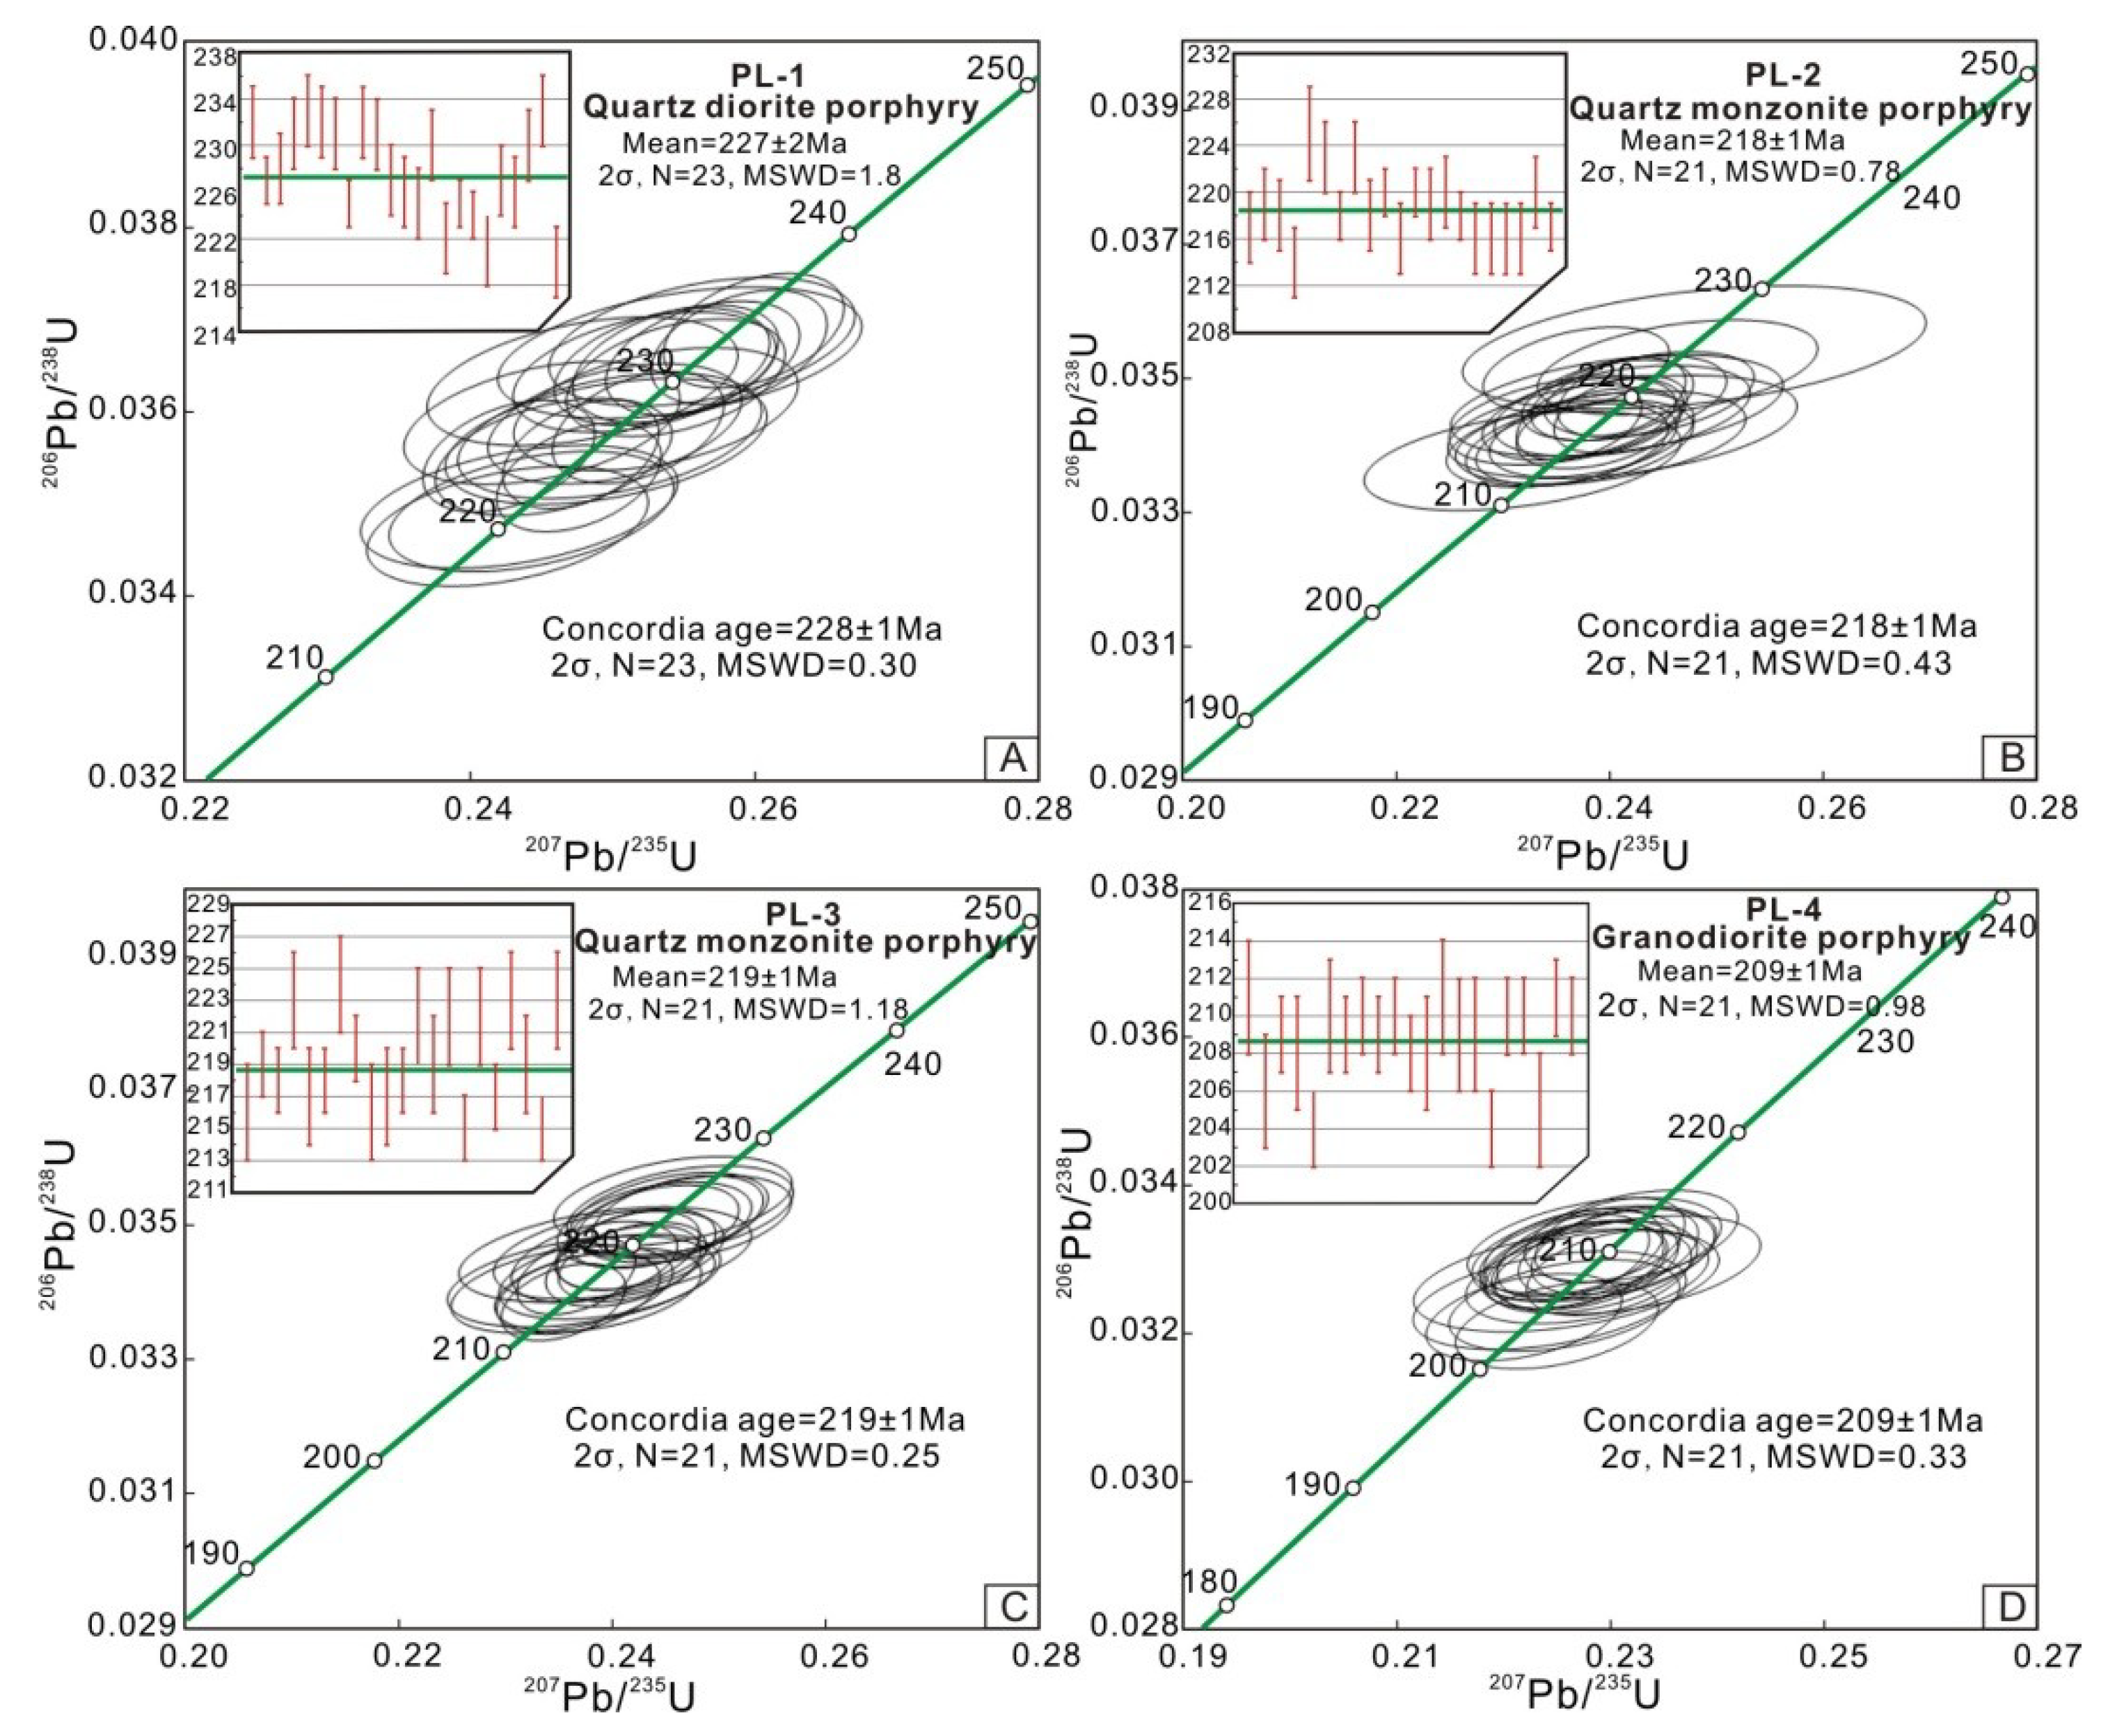
5.1. Zircon U–Pb Dating
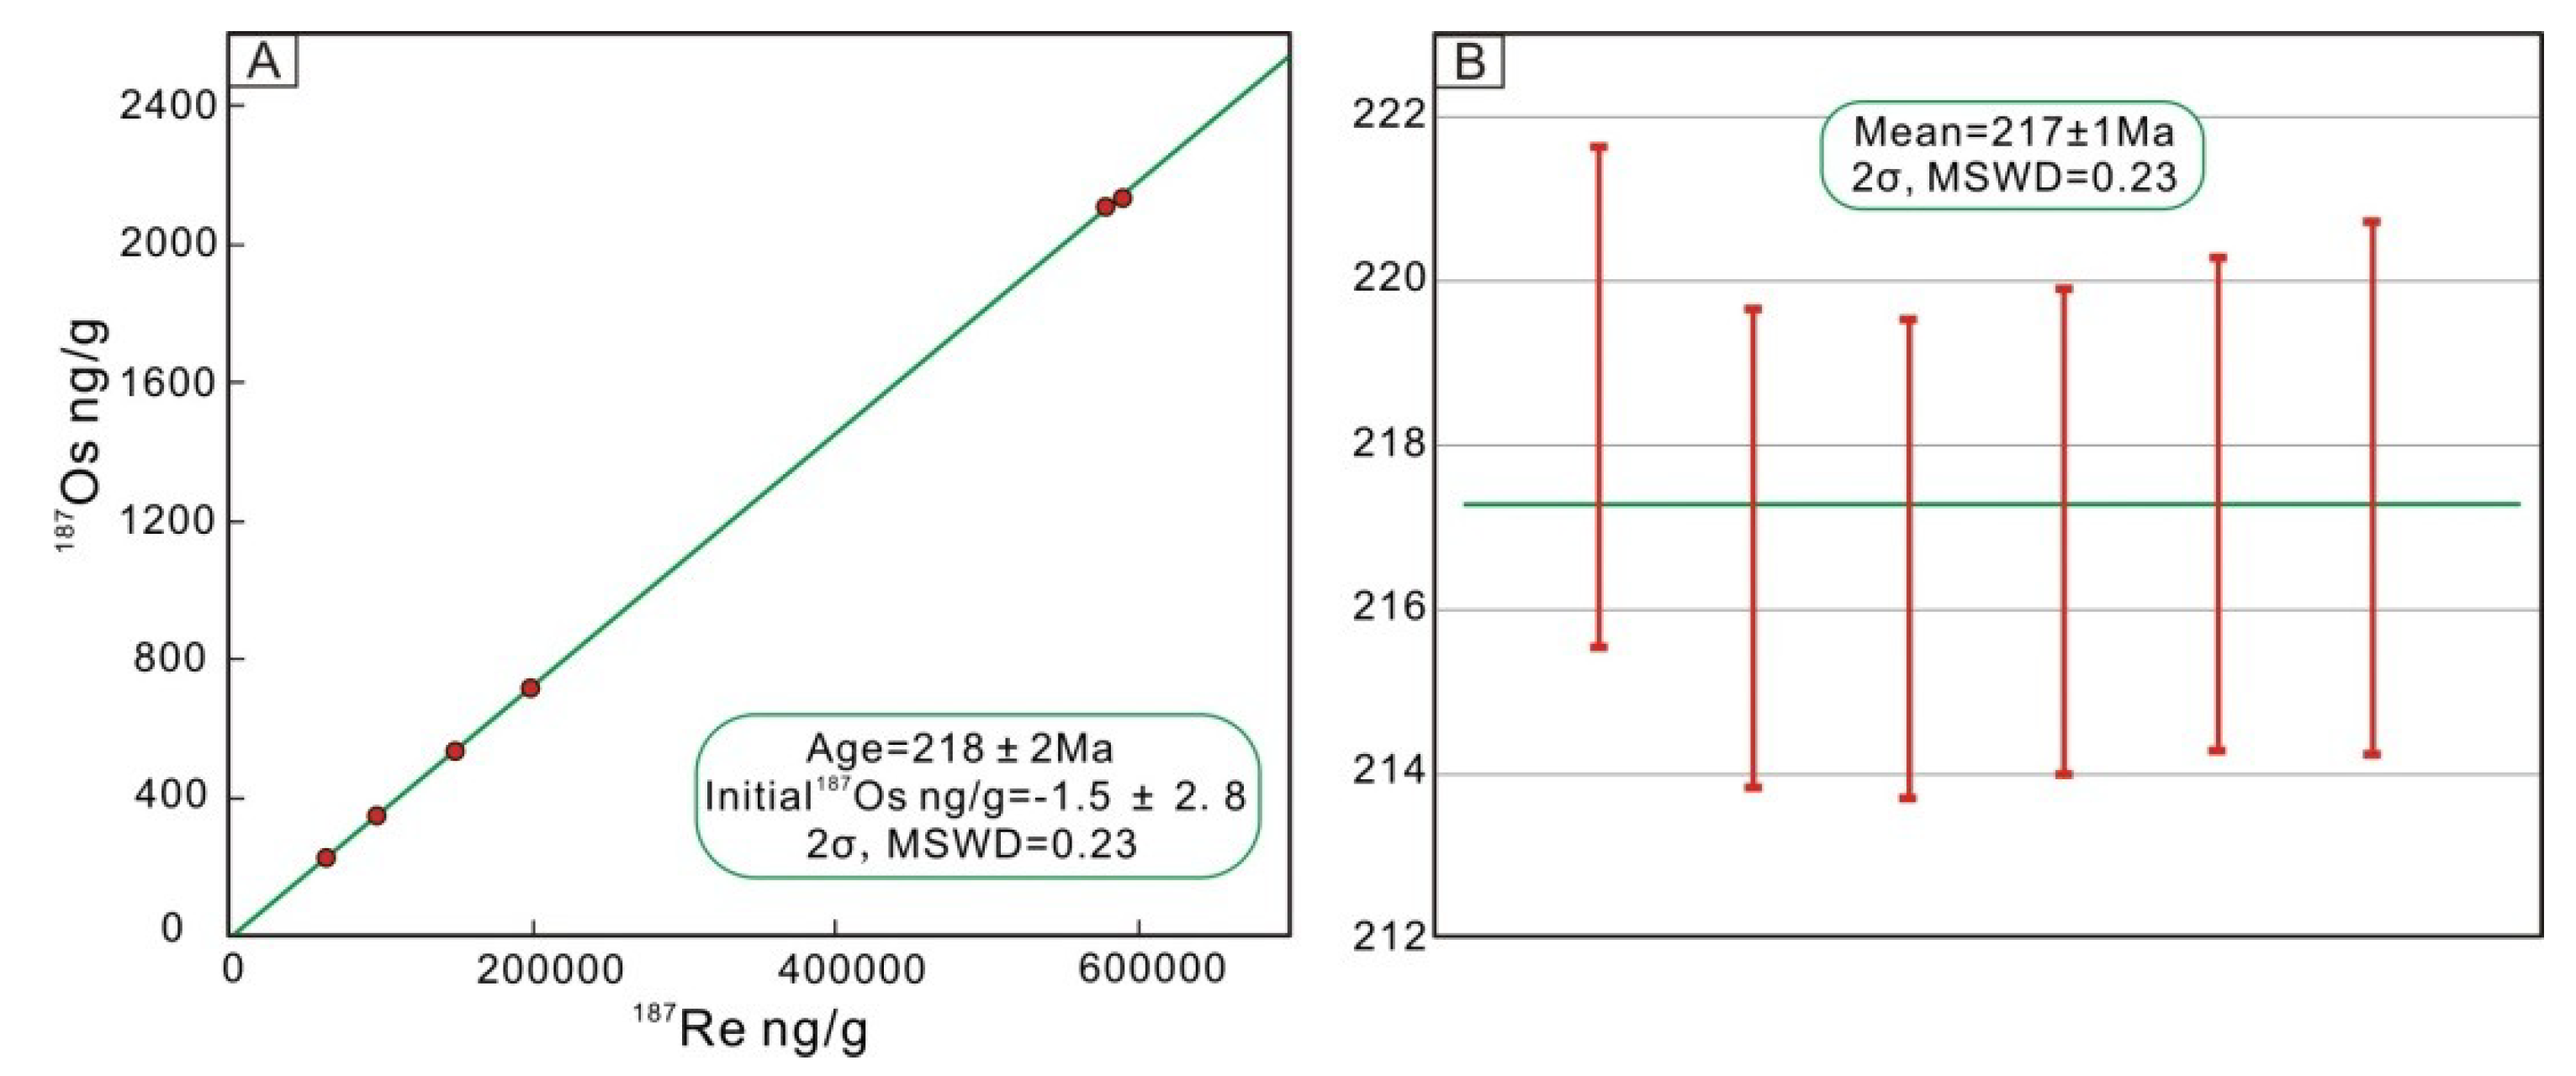
5.2. Molybdenite Re–Os Dating
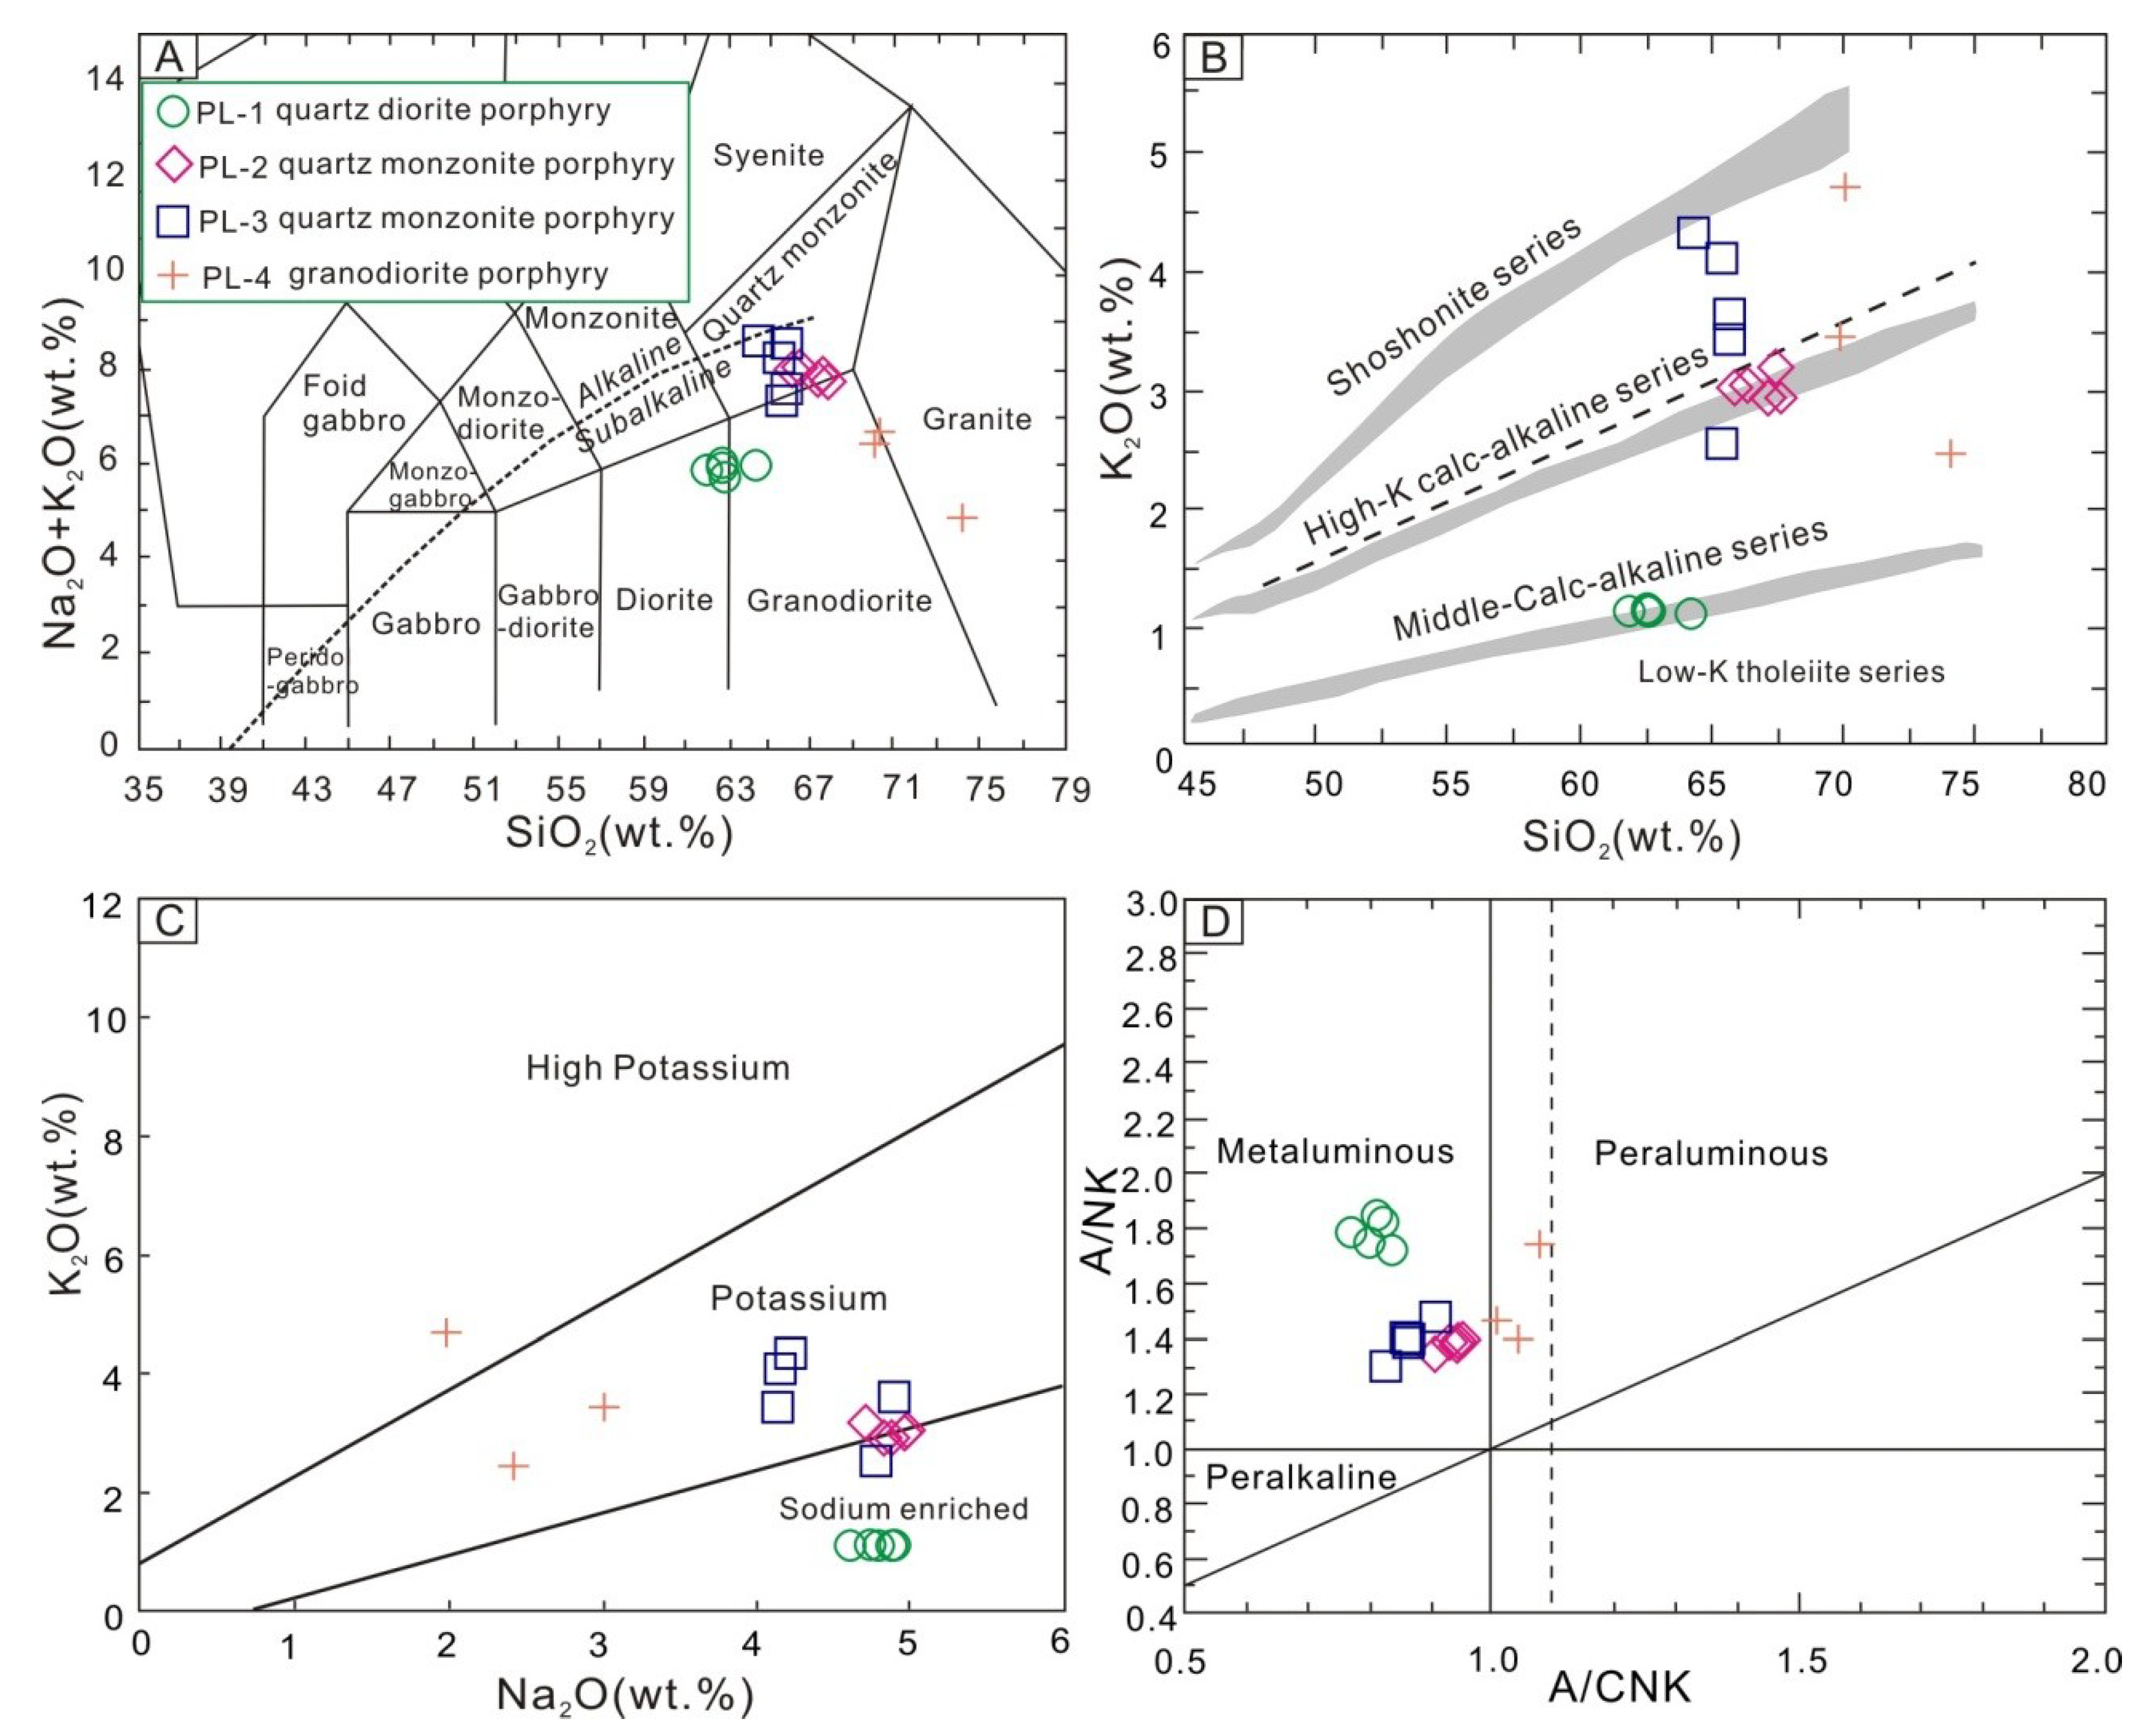
5.3. Major and Trace Element
6. Discussion
6.1. Timing of Magmatism and Cu Mineralization
6.2. Petrogenesis and Tectonic Setting
6.3. Implications for the Cu Mineralization
7. Conclusions
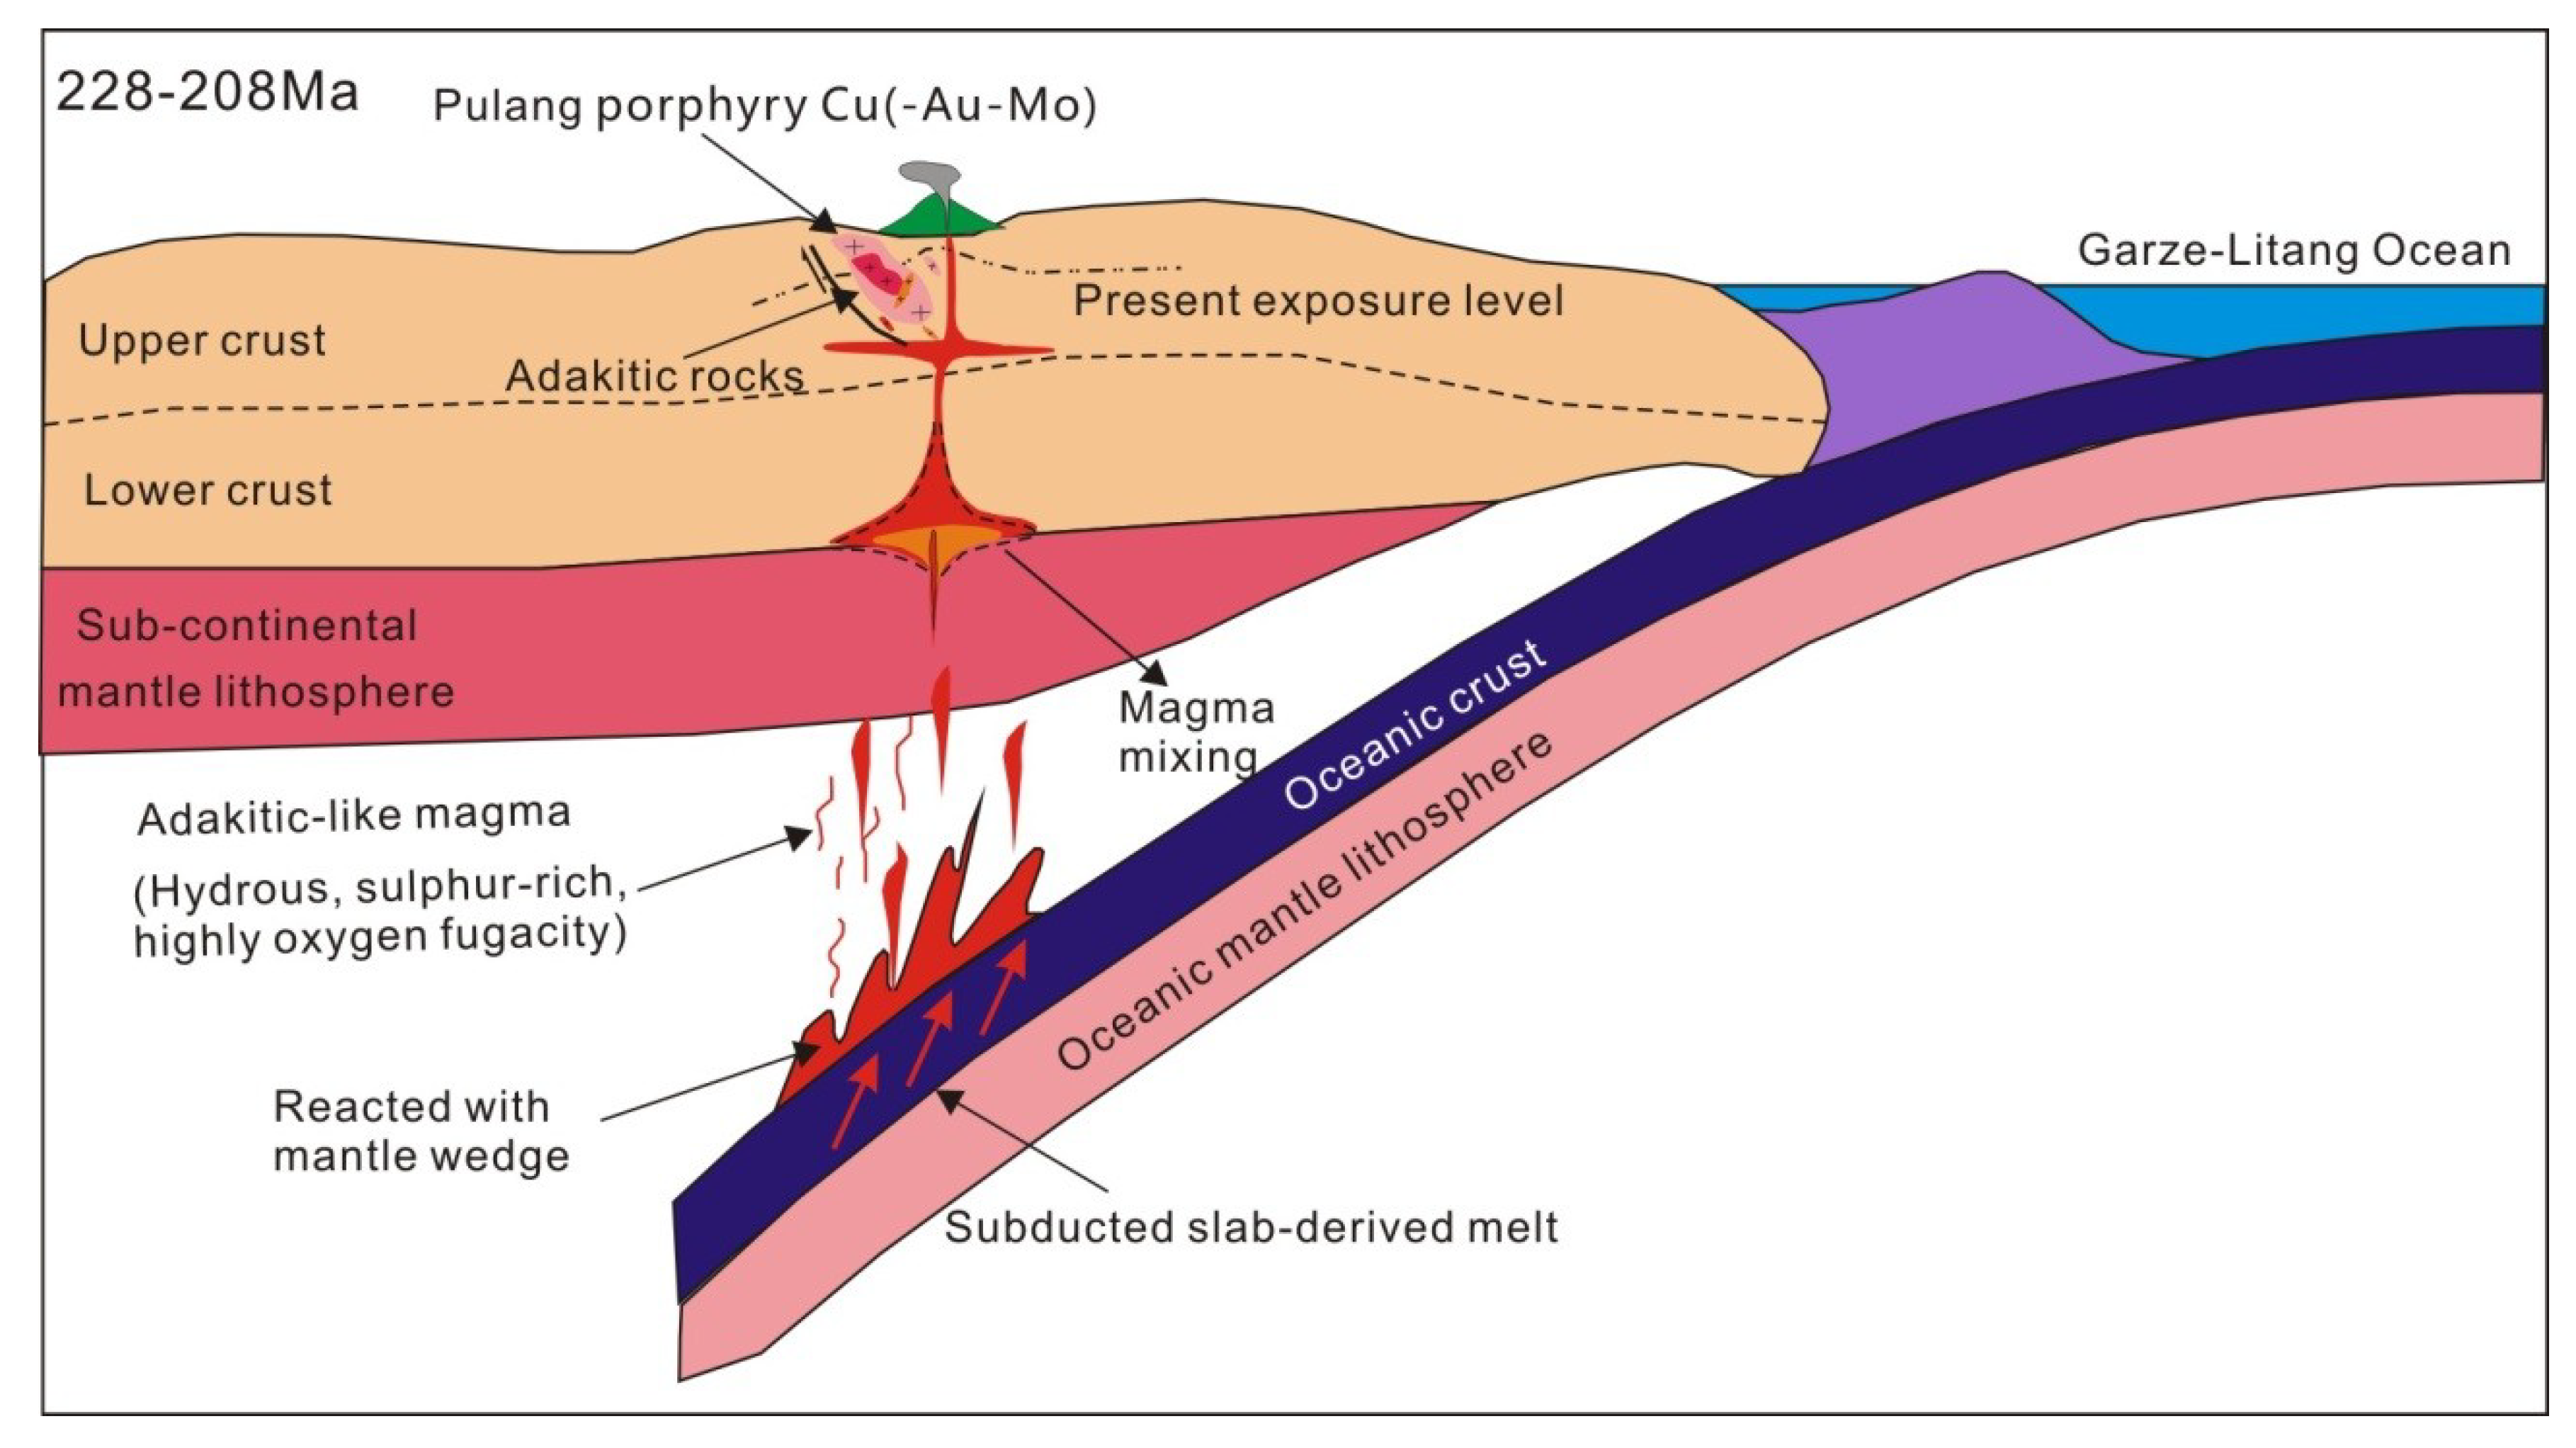
- Molybdenite from the Pulang porphyry Cu deposit yields the Re–Os age of 218 ± 2 Ma, which is in accordance with most of the porphyry-type Cu deposits in the southern Yidun Arc having mineralization ages of 217–221 Ma. Zircons from the quartz diorite porphyry, quartz monzonite porphyry, and granodiorite porphyry yield U–Pb ages of 227 ± 2 Ma, 218 ± 1 Ma, and 209 ± 1 Ma, respectively, suggesting a close spatial, temporal, and genetical relationship between Cu mineralization and quartz monzonite porphyry.
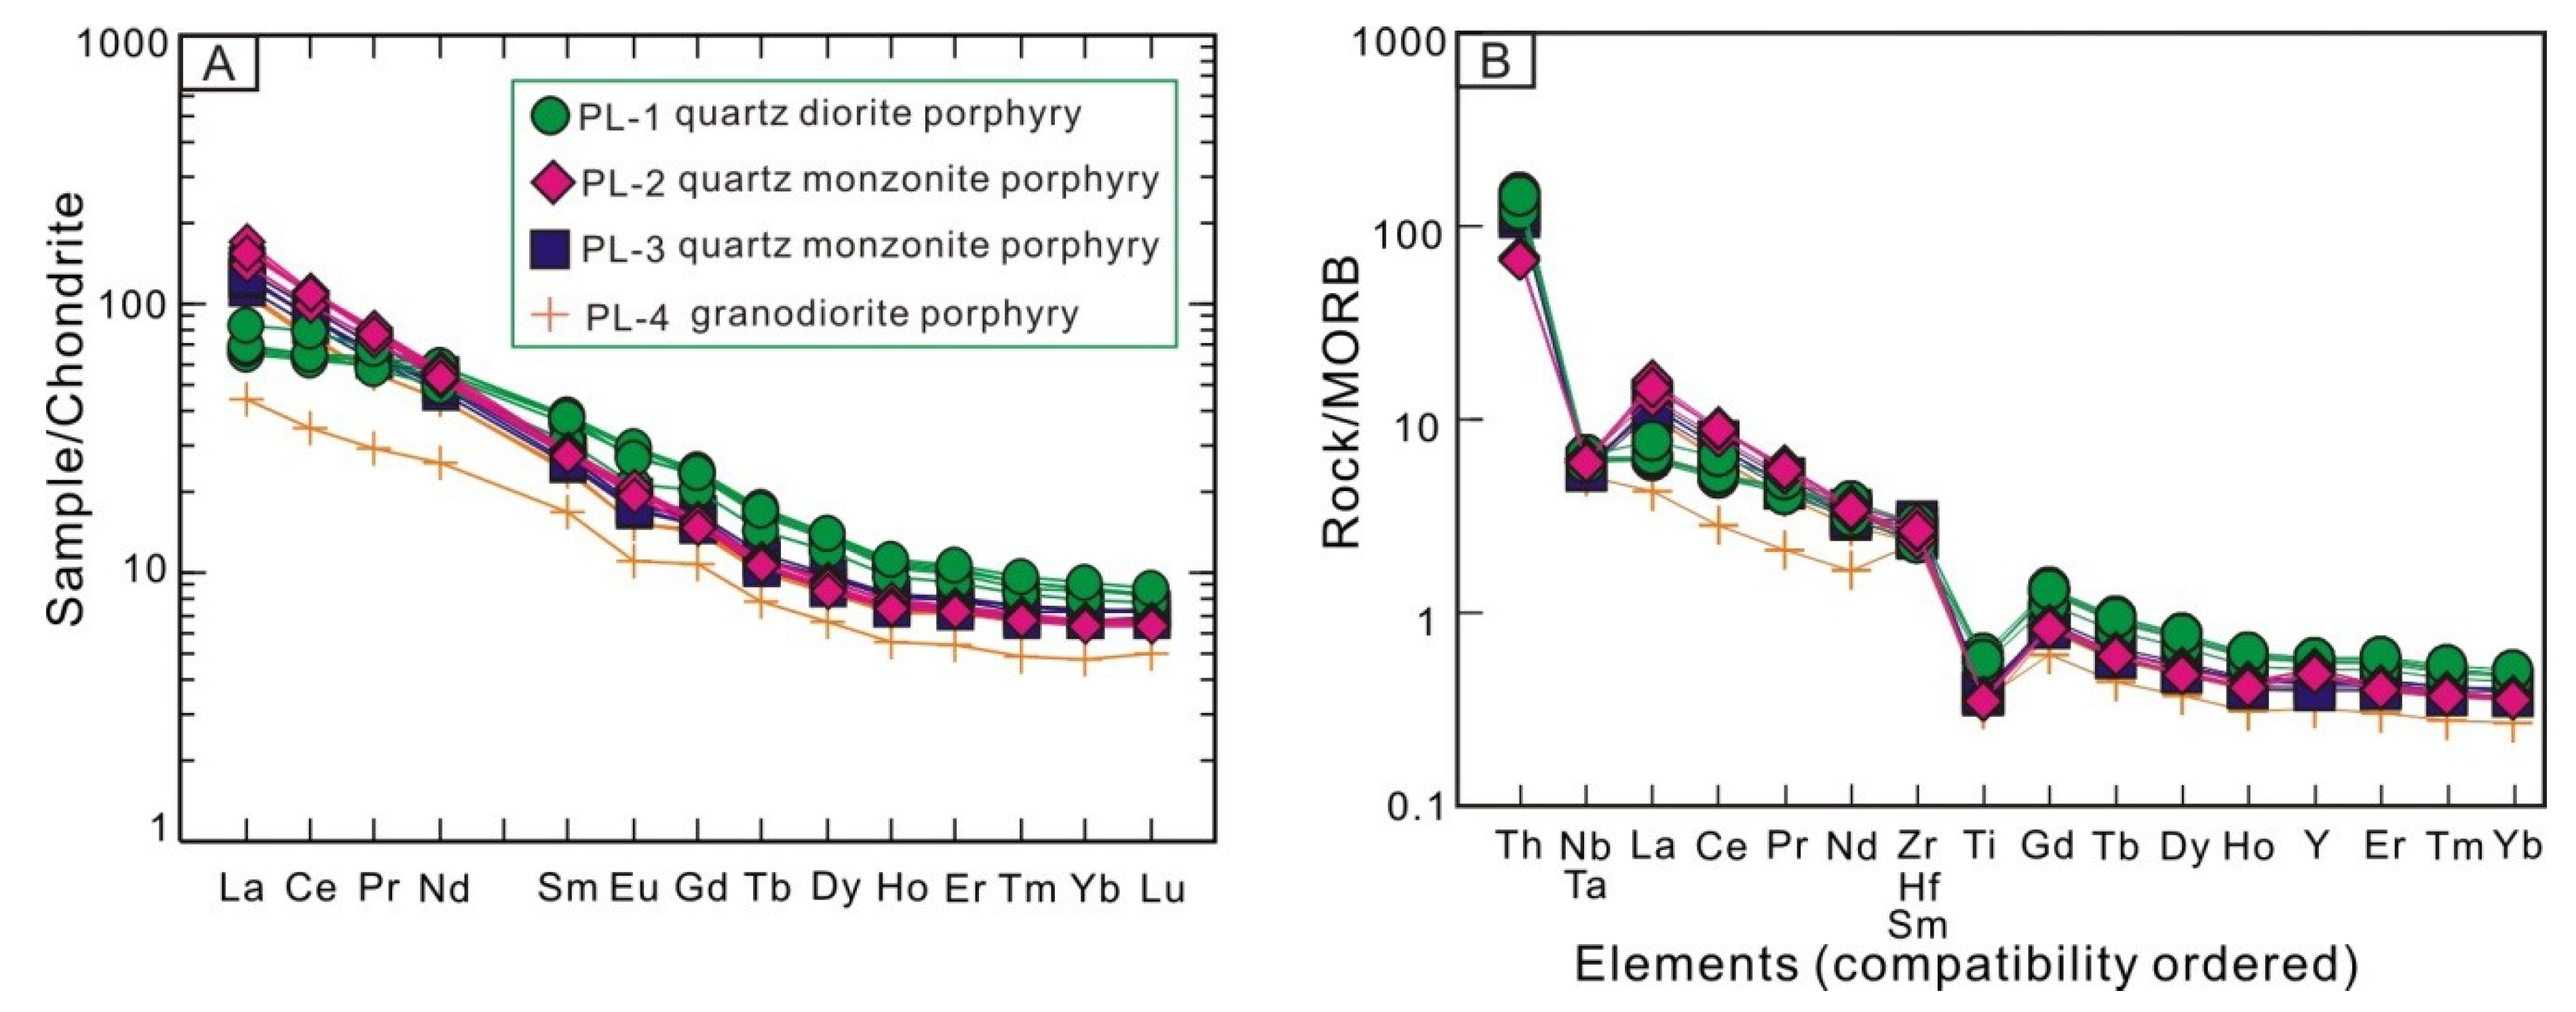
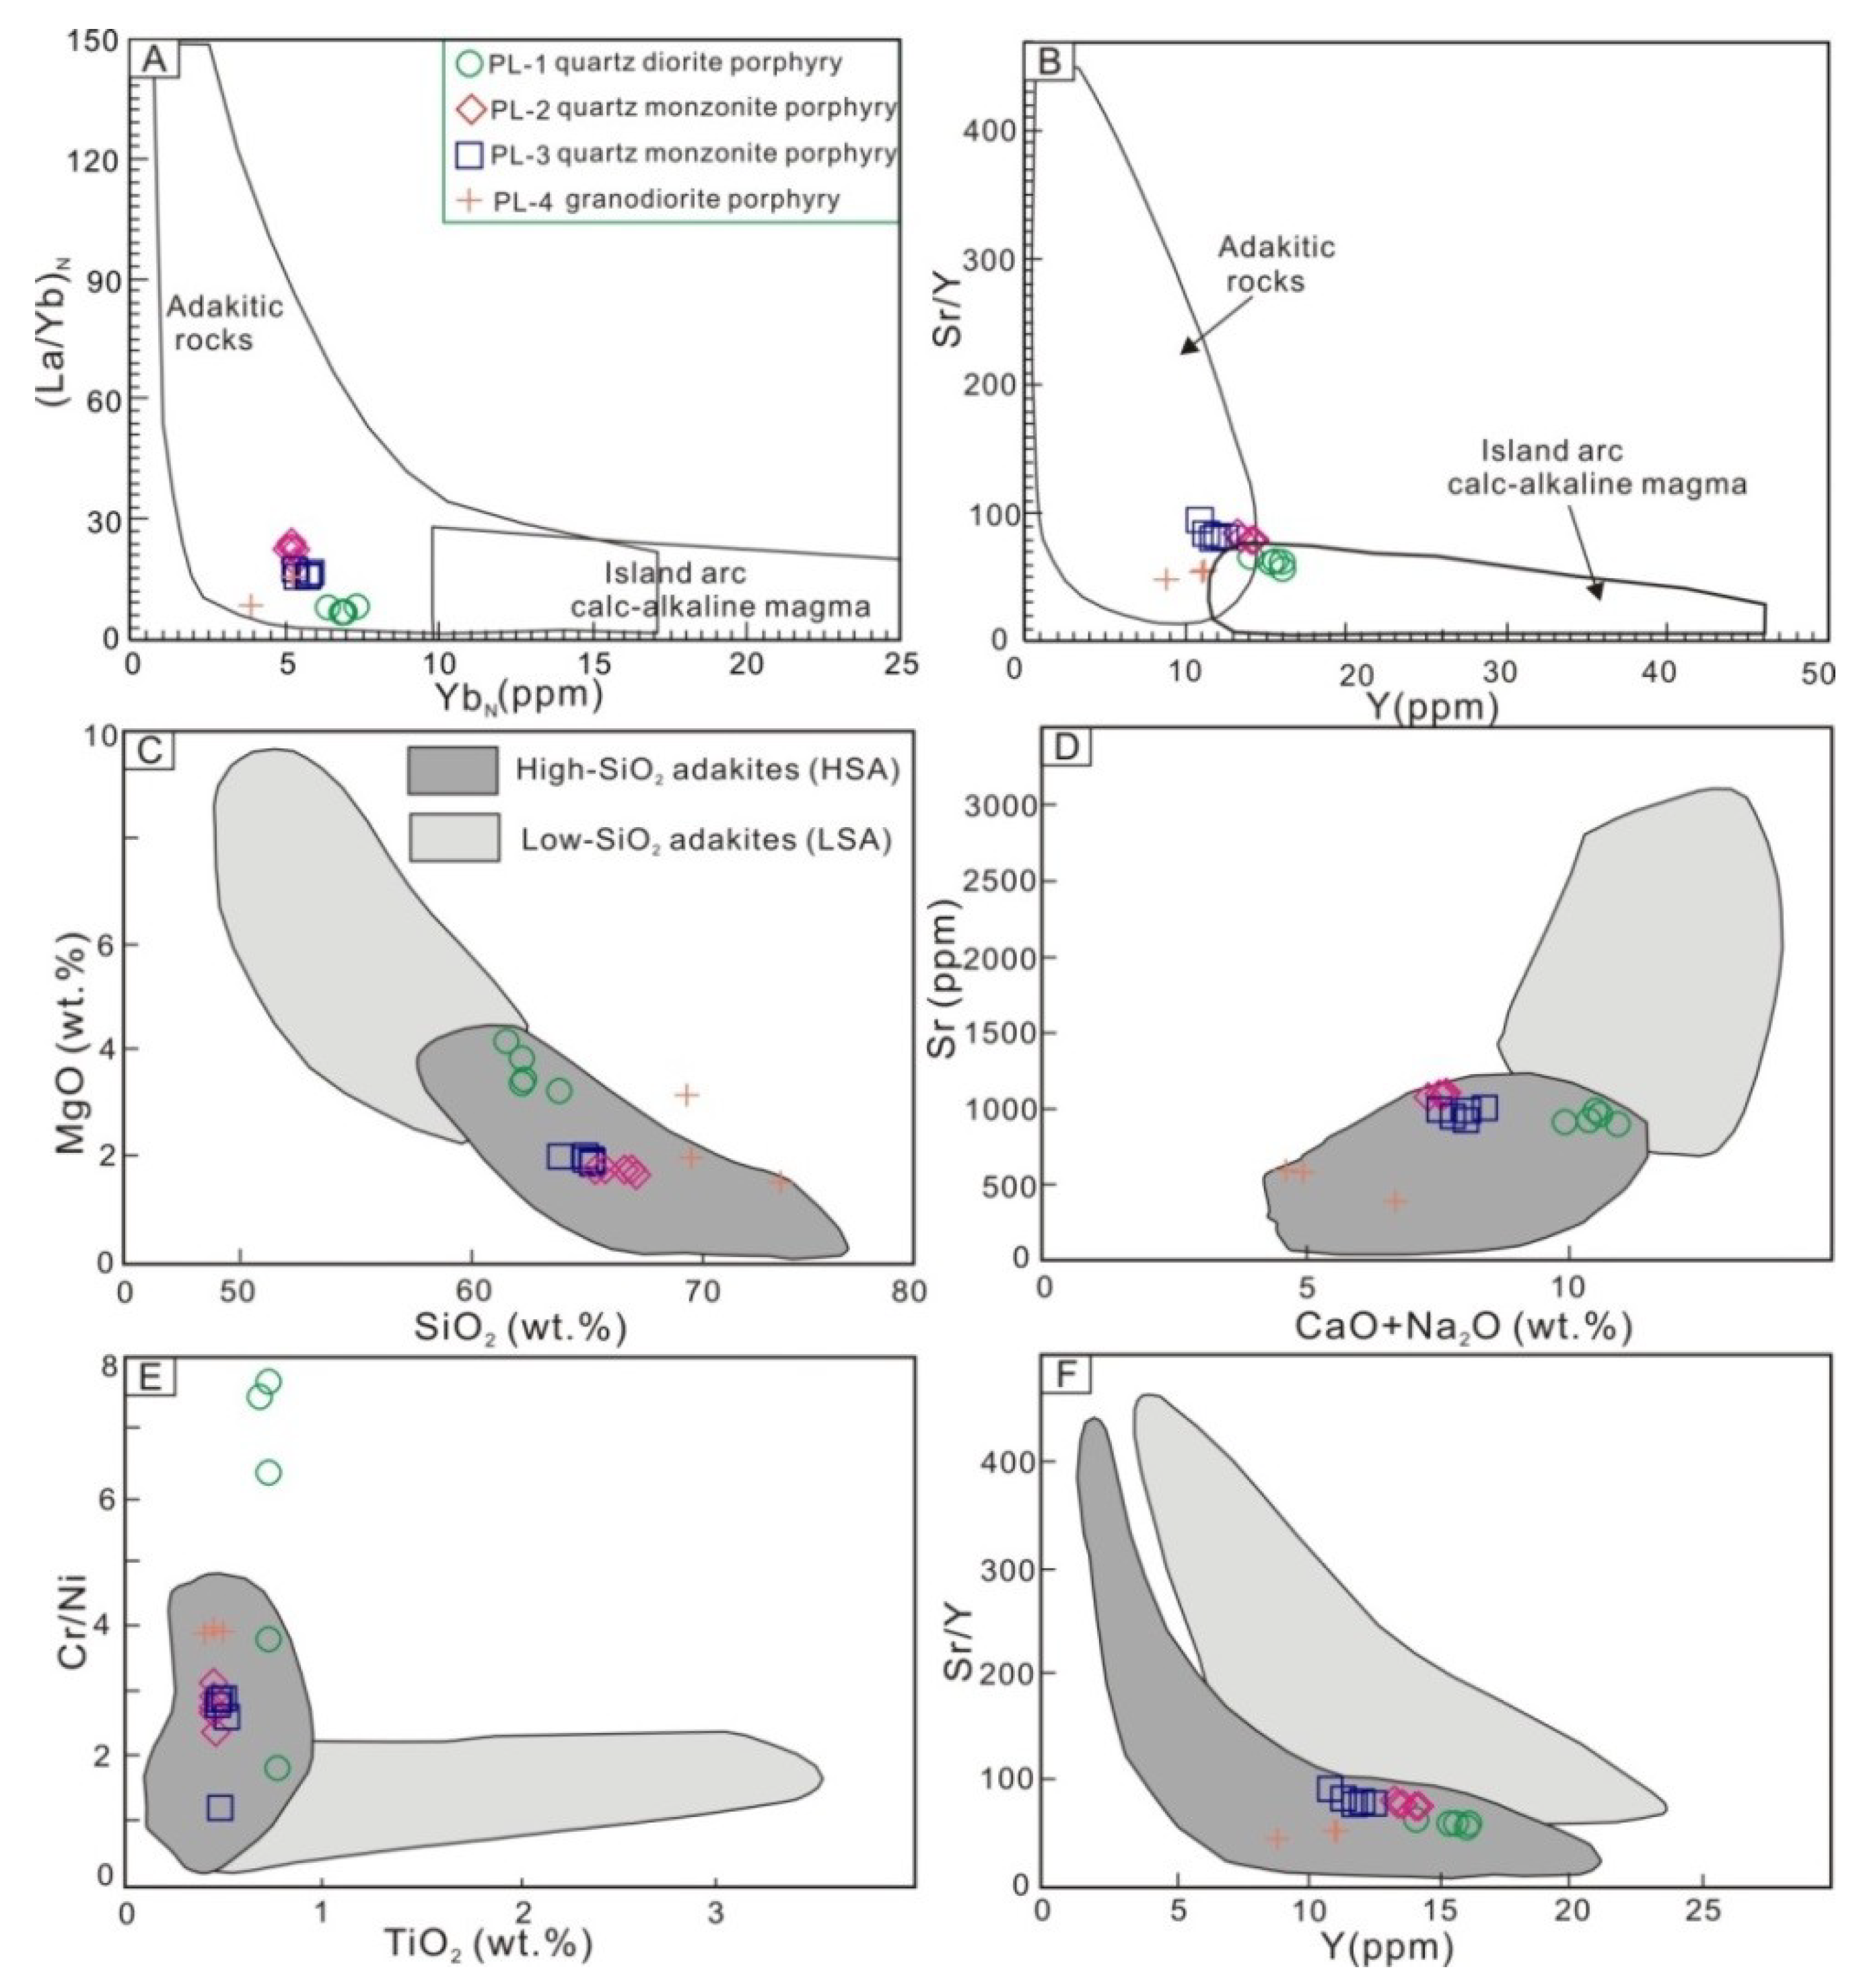
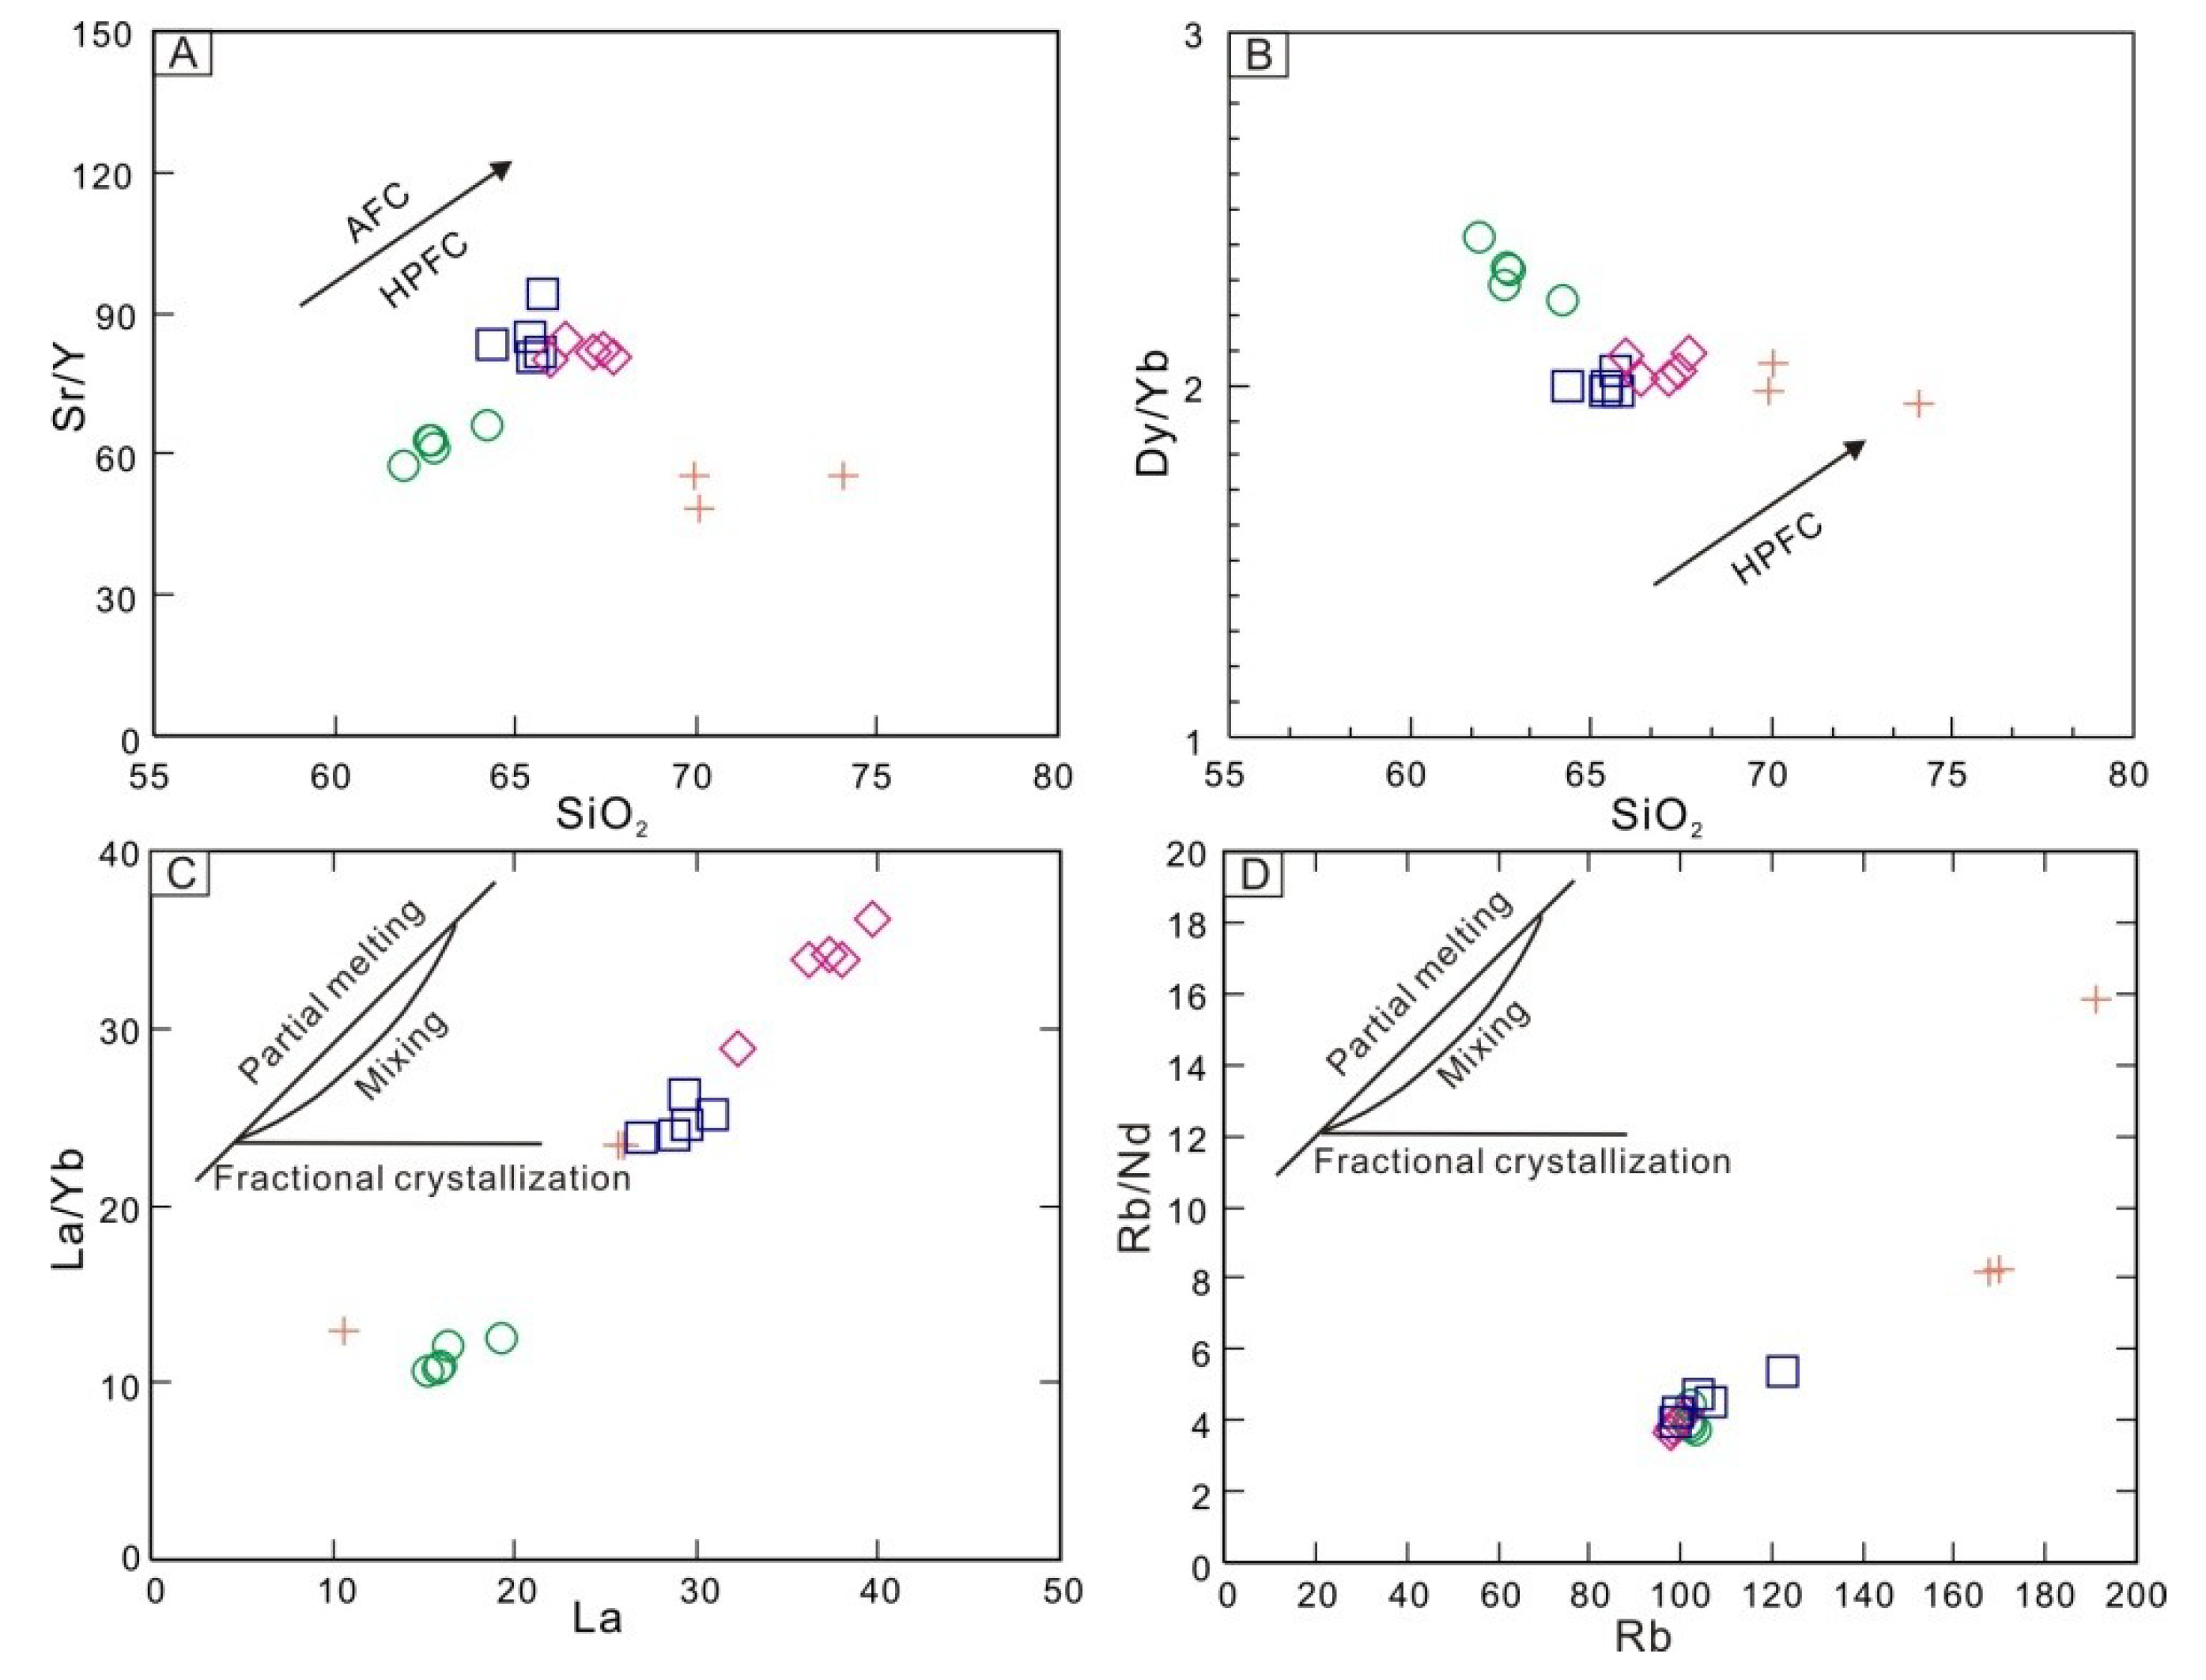
- The Pulang porphyry intrusions geochemically belong to high silica (HSA) adakitic rocks. These intrusions derived from the partial melting of subducted Ganzi-Litang oceanic plate that reacted with peridotite during its ascent through the mantle wedge.
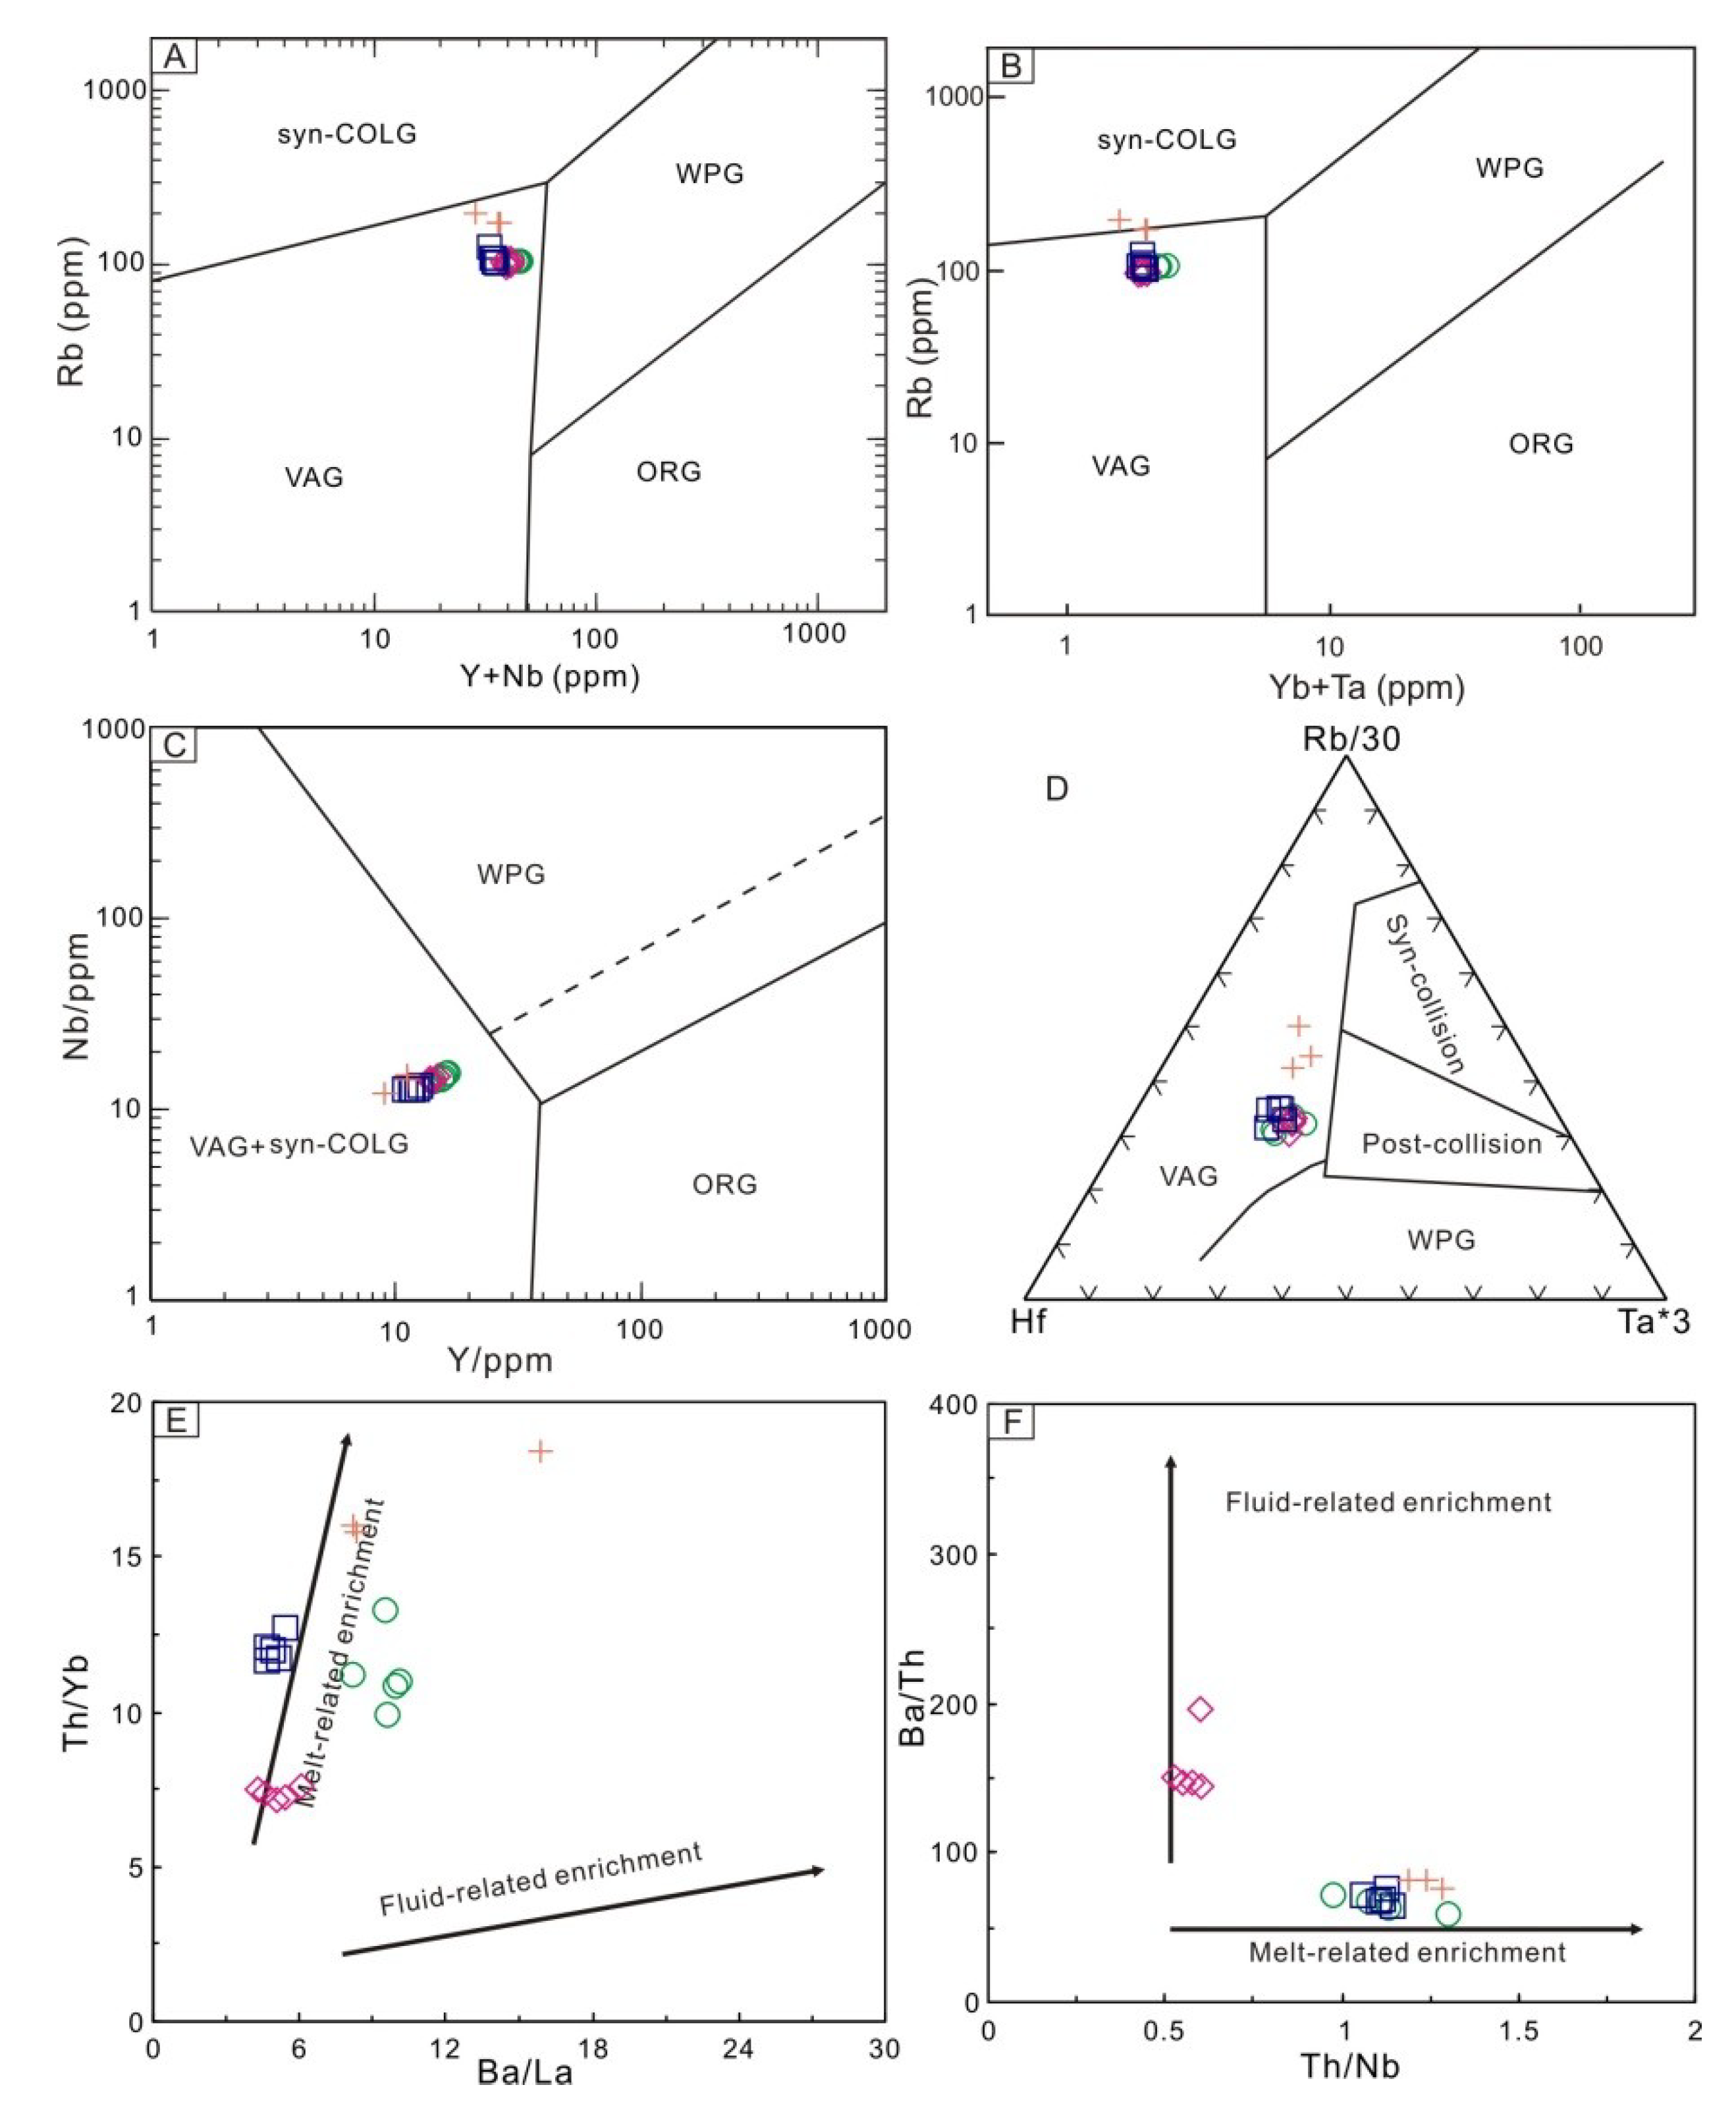
- The Pulang deposit shows similar geological characteristics to the most other porphyry-type Cu deposits in the southern Yidun Arc. These porphyry-type Cu deposits are considered to be related to the westward subduction of the Ganzi-Litang oceanic lithosphere during the Late Triassic.
Supplementary Materials
Author Contributions
Funding
Acknowledgments
Conflicts of Interest
References
- Leng, C.-B.; Zhang, X.-C.; Wang, S.-X.; Qin, C.-J.; Gou, T.-Z.; Wang, W.-Q. SHRIMP zircon U–Pb dating of the Songnuo ore–hosting porphyry, Zhongdian, Northwest Yunnan, China and its geological implication. Geotecton. Metall. 2008, 32, 124–130. (In Chinese) [Google Scholar]
- Zhang, X.-C.; Leng, C.-B.; Yang, C.-Z.; Wang, W.-Q.; Qin, C.-J. Zircon SIMS U–Pb isotopic age and its significance of ore–bearing porphyry of Chundu porphyry copper deposit in Zhongdian, Northwestern Yunnan. Acta Miner. Sin. 2009, 29, 359–360. (In Chinese) [Google Scholar]
- Cao, D.-H. Porphyry Copper Deposit Model and Exploration Technique in Zhongdian, Yunnan. Ph.D. Thesis, Chinese Academy of Geological Sciences, Beijing, China, 2007. (In Chinese). [Google Scholar]
- Liu, J.-T. Late-Trassic Cu Mineralization in Porphyry Environment, Northwest Yunnan, China. Ph.D. Thesis, China University of Geosciences, Beijing, China, 2014. (In Chinese). [Google Scholar]
- Pang, Z.-S.; Du, Y.-S.; Wang, G.-W.; Guo, X.; Cao, Y.; Li, Q. Single–grain zircon U–Pb isotopic ages, geochemistry and its implication of Pulang complex in Yunnan Province, China. Acta Petrol. Sin. 2009, 25, 159–165. (In Chinese) [Google Scholar]
- Liu, X.-L.; Li, W.-C.; Yin, G.-H.; Zhang, N. The geochronology, mineralogy and geochemistry study of the Pulang porphyry copper deposits in Geza arc of Yunnan Province. Acta Petrol. Sin. 2013, 29, 3049–3064. (In Chinese) [Google Scholar]
- Leng, C.-B.; Zhang, X.-C.; Hu, R.-Z.; Wang, S.-X.; Zhong, H.; Wang, W.-Q.; Bi, X.-W. Zircon U–Pb and molybdenite Re–Os geochronology and Sr–Nd–Pb–Hf isotopic constraints on the genesis of the Xuejiping porphyry copper deposit in Zhongdian, Northwest Yunnan, China. J. Asian Earth Sci. 2012, 60, 31–48. [Google Scholar] [CrossRef]
- Cao, D.-H.; Wang, A.-J.; Huang, Y.-F.; Zhang, W.; Hou, K.-J.; Li, R.-P.; Li, Y.-K. SHRIMP geochronology and Hf isotope composition of zircons from Xuejiping porphyry copper deposit, Yunnan province. Acta Geol. Sin. 2009, 83, 1430–1435. (In Chinese) [Google Scholar]
- Li, W.-C.; Yu, H.-J.; Gao, X.; Liu, X.-L.; Wang, J.-H. Review of Mesozoic multiple magmatism and porphyry Cu–Mo (W) mineralization in the Yidun Arc, eastern Tibet Plateau. Ore Geol. Rev. 2017, 90, 795–812. [Google Scholar] [CrossRef]
- Wang, B.-Q.; Zhou, M.-F.; Li, J.-W.; Yan, D.-P. Late Triassic porphyritic instructions and associated volcanic rocks from the Shangri–La region, Yidun terrane, Eastern Tibetan Plateau: Adakitic magmatism and porphyry copper mineralization. Lithos 2011, 127, 24–38. [Google Scholar] [CrossRef]
- Chen, J.-L.; Xu, J.-F.; Ren, J.-B.; Huang, X.-X.; Wang, B.-D. Geochronology and geochemical characteristics of Late Triassic porphyritic rocks from the Zhongdian arc, eastern Tibet, and their tectonic and metallogenic implications. Gondwana Res. 2014, 26, 492–504. [Google Scholar] [CrossRef] [Green Version]
- Ren, J.-B.; Xu, J.-F.; Chen, J.-L. Zircon geochronology and geological implications of ore-bearing porphyries from Zhongdian arc. Acta Petrol. Sin. 2011, 27, 2591–2599. (In Chinese) [Google Scholar]
- Ren, J.-B.; Xu, J.-F.; Chen, J.-L.; Zhang, S.Q.; Liang, H.Y. Geochemistry and petrogenesis of Pulang porphyries in Sanjiang region. Acta Petrol. Miner. 2011, 30, 581–592. (In Chinese) [Google Scholar]
- Wang, P.; Dong, G.-C.; Zhao, G.-C.; Han, Y.-G.; Li, Y.-P. Petrogenesis of the Pulang porphyry complex, southwestern China: Implications for porphyry copper metallogenesis and subduction of the Paleo-Tethys Oceainc lithosphere. Lithos 2018. [Google Scholar] [CrossRef]
- Zeng, P.-S.; Mo, X.-X.; Yu, X.-H.; Hou, Z.-Q.; Xu, Q.-D.; Wang, H.-P.; Li, H.; Yang, C.-Z. Porphyries and porphyry copper deposits in Zhongdian Area, Northwestern Yunnan. Miner. Depos. 2003, 22, 394–400. (In Chinese) [Google Scholar]
- Li, W.-C.; Zeng, P.-S. Characteristics and metallogenic model of the Pulang superlarge porphyry copper deposit in Yunnan, China. J. Chengdu Univ. Technol. 2007, 34, 436–446. (In Chinese) [Google Scholar]
- Guo, X.; Du, Y.-S.; Pang, Z.-S.; Li, S.-T.; Li, Q. Characteristics of the ore-forming fluids in alteration zones of the Pulang porphyry copper deposit in Yunnan Province and its metallogenic significance. Geosciences 2009, 23, 465–471. [Google Scholar]
- Zeng, P.-S.; Li, W.-C.; Wang, H.-P.; Li, H. The Indoshinian Pulang superlarge porphyry copper deposit in Yunnan, China: Petrology and chronology. Acta Petrol. Sin. 2006, 22, 989–1000. (In Chinese) [Google Scholar]
- Li, W.-C.; Yin, G.-H.; Lu, Y.-X.; Liu, X.-L.; Xu, D.; Zhang, S.-Q.; Zhang, N. The evolution and 40Ar–39Ar isotopic evidence of the Pulang Complex in Zhongdian. Acta Geol. Sin. 2009, 83, 1421–1429. (In Chinese) [Google Scholar]
- Li, W.-C.; Zeng, P.-S.; Hou, Z.-Q.; Zeng, P.-S.; Noel, C.-W. The Pulang Porphyry Copper Deposit and Associated Felsic Intrusions in Yunnan Province, Southwest China. Econ. Geol. 2011, 106, 79–92. [Google Scholar]
- Liu, H.; Zhang, C.-Q.; Jia, F.-D.; Zhou, Y.-M.; Lou, D.-B. Mineral and geochemical evidences of magma-mixing from Pulang porphyry copper deposit in SW Sanjiang, China. Acta Petrol. Sin. 2015, 31, 3189–3202. (In Chinese) [Google Scholar]
- Wang, S.-X.; Zhang, X.-C.; Leng, C.-B.; Qing, J.-C.; Ma, D.-Y.; Wang, W.Q. Zircon SHRIMP U–Pb dating of the Pulang porphyry copper deposit, Northwestern Yunnan, China: The ore-forming time limitation and geological significance. Acta Petrol. Sin. 2008, 24, 2313–2321. (In Chinese) [Google Scholar]
- Yang, Z. Late Triassic mineralization of the porphyry copper deposits in Yidun arc, Southwest China. Ph.D. Thesis, China University of Geosciences, Beijing, China, 2017. (In Chinese). [Google Scholar]
- Fan, Y.-H.; Li, W.-C. Geological characteristics of the Pulang porphyry copper deposit, Yunnan. Geol. China 2006, 33, 352–362. (In Chinese) [Google Scholar]
- Zeng, P.-S.; Wang, H.-P.; Mo, X.-X.; Yu, X.; Li, W. Tectonic setting and prospects of porphyry copper deposits in Zhongdian island-arc belt. Acta Geosci. Sin. 2004, 25, 535–540. (In Chinese) [Google Scholar]
- Sun, H.-S.; Li, H.; Martin, D.; Xia, Q.-L.; Jiang, C.-L.; Wu, P.; Yang, H.; Fan, Q.-R.; Zhu, D.-S. U–Pb and Re–Os geochronology and geochemistry of the Donggebi Mo deposit, Eastern Tianshan, NW China: Insights into mineralization and tectonic setting. Ore Geol. Rev. 2017, 86, 584–599. [Google Scholar] [CrossRef]
- Cao, K.; Xu, J.-F.; Chen, J.-L.; Huang, X.-X.; Ren, J.-B. Origin of porphyry intrusions hosting superlarge Pulang porphyry copper deposit in Yunnan Province: Implications for metallogenesis. Miner. Depos. 2014, 33, 307–322. (In Chinese) [Google Scholar]
- Cao, K.; Yang, Z.-M.; Xu, J.-F.; Fu, B.; Li, W.-K.; Sun, M.-Y. Origin of dioritic magma and its contribution to porphyry Cu–Au mineralization at Pulang in the Yidun arc, eastern Tibet. Lithos 2018. [Google Scholar] [CrossRef]
- Xiao, L.; He, Q.; Pirajno, F.; Ni, P.; Du, J.-X.; Wei, Q.-R. Possible correlation between a mantle plume and the evolution of Paleo-Tethys Jinshajiang Ocean: Evidence from a volcanic rifted margin in the Xiaru-Tuoding area, Yunnan, SW China. Lithos 2008, 100, 112–126. [Google Scholar] [CrossRef]
- Roger, F.; Jolivet, M.; Malavieille, J. The tectonic evolution of the Songpan-Garzê (North Tibet) and adjacent areas from Proterozoic to Present: A synthesis. J. Asian Earth Sci. 2010, 39, 254–269. [Google Scholar] [CrossRef]
- Pullen, A.; Kapp, P.; Gehrels, G.E.; Vervoort, J.D.; Ding, L. Triassic continental subduction in central Tibet and Mediterranean-style closure of the Paleo-Tethys Ocean. Geology 2008, 36, 351–354. [Google Scholar] [CrossRef]
- Hou, Z.-Q.; Yang, Y.-Q.; Qu, X.-M.; Huang, D.-H.; Lü, Q.-T.; Wang, H.-P.; Yu, J.-J.; Tang, S.-H. Tectonic evolution and mineralization systems of the Yidun Arc Orogen in Sanjiang Region, China. Acta Geol. Sin. 2004, 78, 109–120. (In Chinese) [Google Scholar]
- Gao, X.; Yang, L.-Q.; Orovan, E.A. The lithospheric architecture of two subterranes in the eastern Yidun Terrane, East Tethys: Insights from Hf–Nd isotopic mapping. Gondwana Res. 2018, 62, 127–143. [Google Scholar] [CrossRef]
- Wang, C.-Y.; Li, W.-C.; Wang, K.-Y.; Zhou, X.-B.; Yin, G.-H.; Yu, H.-J.; Xue, S.-R. Characteristics of fluid inclusions and genesis of Xuejiping copper deposit in Northwestern Yunnan Province. Acta Petrol. Sin. 2015, 31, 967–978. (In Chinese) [Google Scholar]
- Reid, A.J.; Wilson, C.J.; Liu, S. Structural evidence for the Permo-Triassic tectonic evolution of the Yidun Arc, eastern Tibetan Plateau. J. Struct. Geol. 2005, 27, 119–137. [Google Scholar] [CrossRef]
- Yang, T.-N.; Hou, Z.-Q.; Wang, Y.; Zhang, H.-R.; Wang, Z.-L. Late Paleozoic to Early Mesozoic tectonic evolution of northeast Tibet: Evidence from the Triassic composite western Jinsha–Garzê–Litang suture. Tectonics 2012. [Google Scholar] [CrossRef]
- Chen, J.-L.; Xu, J.-F.; Ren, J.-B.; Huang, X.-X. Late Triassic E-MORB-like basalts associated with porphyry Cu-deposits in the southern Yidun continental arc, eastern Tibet: Evidence of slab-tear during subduction? Ore Geol. Rev. 2017, 90, 1054–1062. [Google Scholar] [CrossRef]
- Hou, K.-J.; Li, Y.-H.; Tian, Y.-R. In situ U−Pb zircon dating using, laser ablation–multiion counting−ICP−MS. Miner. Depos. 2009, 28, 481–492. (In Chinese) [Google Scholar]
- Griffin, W.L.; Powell, W.J.; Pearson, N.J.; O’Reilly, S.Y. GLITTER: Data reduction software for laser ablation ICP–MS. In Laser Ablation–ICP–MS in the Earth Sciences: Current Practices and Outstanding Issues; Mineralogical Association Canada Short Course; Sylvester, P., Ed.; Mineralogical Association Canada: Quebec City, QC, Canada, 2008; Volume 40, pp. 308–311. [Google Scholar]
- Ludwig, K.R. User’s manual for Isoplot 3.0: A Geochronological Toolkit for Microsoft Excel. Berkeley Geochronol. Cent. Spec. Publ. 2003, 4, 25–32. [Google Scholar]
- Anderson, T. Correction of common lead in U–Pb analyses that do not report 204Pb. Chem. Geol. 2002, 192, 59–79. [Google Scholar] [CrossRef]
- Shirey, S.B.; Walker, R.J. Carius tube digestion for low-blank rheniumosmium analysis. Anal. Chem. 1995, 67, 2136–2141. [Google Scholar] [CrossRef]
- Du, A.-D.; Wu, S.-Q.; Sun, D.-Z.; Wang, S.-X.; Qu, W.-J.; Markey, R.; Stain, H.; Morgan, J.; Malinovskiy, D. Preparation and certification of Re–Os dating reference materials: Molybdenite HLP and JDC. Geost. Geoanal. Res. 2004, 28, 41–52. [Google Scholar] [CrossRef]
- Smoliar, M.I.; Walker, R.J.; Morgan, J.W. Re–Os ages of group IIA, IIIA, IVA, and IVB iron meteorites. Science 1996, 271, 1099–1102. [Google Scholar] [CrossRef]
- Hoskin, P.W.O.; Schaltegger, U. The composition of zircon and igneous and metamorphic petrogenesis. Rev. Miner. Geochem. 2003, 53, 27–62. [Google Scholar] [CrossRef]
- Yang, Q.; Ren, Y.-S.; Sun, Z.-M.; Hao, Y.-J.; Zhang, B.; Sun, X.-H.; Lu, S.-Y. Geochronologic evidence of Late Paleozoic magmatic-hydrothermal mineralization in Tianbaoshan metallogenic region, Yanbian Area: A case study of Xinxing lead-zinc (silver) deposit. Acta Petrol. Sin. 2018, 34, 3153–3166. (In Chinese) [Google Scholar]
- Qiu, K.-F.; Yu, H.-C.; Gou, Z.-Y.; Liang, Z.-L.; Zhang, J.-L.; Zhu, R. Nature and origin of Triassic igneous activity in the Western Qinling Orogen: The Wenquan composite pluton example. Int. Geol. Rev. 2018, 60, 242–266. [Google Scholar] [CrossRef]
- Geng, J.-Z.; Qiu, K.-F.; Gou, Z.-Y.; Yu, H.-C. Tectonic regime switchover of Triassic Western Qinling Orogen: Constraints from LA-ICP-MS zircon U–Pb geochronology and Lu–Hf isotope of Dangchuan intrusive complex in Gansu, China. Chem. Erde 2017, 77, 637–651. [Google Scholar] [CrossRef]
- Gou, Z.-Y.; Yu, H.-C.; Qiu, K.-F.; Geng, J.-Z.; Wu, M.-Q.; Wang, Y.-G.; Yu, M.-H.; Li, J. Petrogenesis of ore-hosting diorite in the Zaorendao gold deposit at the Tongren-Xiahe-Hezuo polymetallic district, West Qinling, China. Minerals 2019, 9, 76. [Google Scholar] [CrossRef]
- Yu, H.-C.; Guo, C.-A.; Qiu, K.-F.; McIntire, D.; Jiang, G.-P.; Gou, Z.-Y.; Geng, J.-Z.; Pang, Y.; Zhu, R.; Li, N.-B. Geochronological and geochemical vonstraints on the formation of the giant Zaozigou Au-Sb deposit, West Qinling, China. Minerals 2019, 9, 37. [Google Scholar] [CrossRef]
- Irvine, T.H.; Baragar, W.R.A. A guide to the chemical classification of the common volcanic rocks. Can. J. Earth Sci. 1971, 8, 523–548. [Google Scholar] [CrossRef]
- Peccerillo, A.; Taylor, A.R. Geochemistry of Eocene calc-alkaline volcanic rocks from the Kastamonu area, Northern Turkey. Contrib. Miner. Petrol. 1976, 58, 63–81. [Google Scholar] [CrossRef]
- Middlemost, E.A.K. A simple classification of volcanic rocks. Bull. Volcanol. 1972, 36, 382–397. [Google Scholar] [CrossRef]
- Maniar, P.D.; Piccoli, P.M. Tectonic discrimination of granitoids. Geol. Soc. Am. Bull. 1989, 101, 635–643. [Google Scholar] [CrossRef]
- Pearce, J.A. Geochemical fingerprinting of oceanic basalts with applications to ophiolite classification and the search for Archean oceanic crust. Lithos 2008, 100, 14–48. [Google Scholar] [CrossRef]
- Boynton, W.V. Geochemistry of the rare earth elements: Meteorite studies. In Rare Earth Element Geochemistry; Henderson, P., Ed.; Elsevier: Amsterdam, The Netherlands, 1984; pp. 63–114. [Google Scholar]
- Sun, S.-S.; McDonough, W.F. Chemical and isotopic systematics of oceanic basalts: Implications for mantle composition and processes. Spec. Publ. Geol. Soc. Lond. 1989, 42, 313–345. [Google Scholar] [CrossRef]
- Yang, Q.; Ren, Y.-S.; Chen, S.-B.; Zhang, G.-L.; Zeng, Q.-H.; Hao, Y.-J.; Sun, X.-H.; Li, J.-M.; Yang, Z.-J.; Sun, Z.-M. Ore-forming fluid evolution and materiel sources of the giant Pulang porphyry Cu (–Mo–Au) deposit in Northwestern Yunnan, China: Evidence from fluid inclusions and C–H–O–S–Pb isotopes. J. Geochem. Explor. 2018. under review. [Google Scholar]
- Hou, Z.-Q.; Qu, X.-M.; Zhou, J.-R.; Yang, Y.-Q.; Huang, Q.-H.; Lv, Q.-T.; Tang, S.-H.; Yu, J.-J.; Wang, H.-P.; Zhao, J.-H. Collision-Orogenic Process of the Yidun Arc in the Sanjiang Region: Record of Granites. Acta Geol. Sin. 2001, 4, 484–497. (In Chinese) [Google Scholar]
- Hou, Z.-Q.; Zaw, K.; Pan, G.-T.; Mo, X.-X.; Xu, Q.; Hu, Y.-Z.; Li, X.-Z. Sanjiang Tethyan metallogenesis in SW China: Tectonic setting, metallogenic epochs and deposit types. Ore Geol. Rev. 2007, 31, 48–87. [Google Scholar] [CrossRef]
- Reid, A.; Wilson, C.J.L.; Shun, L.; Pearson, N.; Belousova, E. Mesozoic plutons of the Yidun Arc, SW China: U/Pb geochronology and Hf isotopic signature. Ore Geol. Rev. 2007, 31, 88–106. [Google Scholar] [CrossRef]
- Defant, M.J.; Drummond, M.S. Derivation of some modern arc magmas by melting of young subducted lithosphere. Nature 1990, 347, 662–665. [Google Scholar] [CrossRef]
- Martin, H.; Smithies, R.H.; Rapp, R.; Moyen, J.F.; Champion, D. An overview of adakite, tonalite-trondhjemite-granodiorite (TTG), and sanukitoid: Relationships and some implications for crustal evolution. Lithos 2005, 79, 1–24. [Google Scholar] [CrossRef]
- Richards, J.P.; Kerrich, B. Adakite-like rocks: Their diverse origins and questionable role in metallogenesis. Econ. Geol. 2007, 102, 537–576. [Google Scholar] [CrossRef]
- Moyen, J.F. High Sr/Y and La/Yb ratios: The meaning of the “adakitic signature”. Lithos 2009, 112, 556–574. [Google Scholar] [CrossRef]
- Rapp, R.P.; Watson, E.B. Dehydration melting of metabasalt at 8–32-kbar: Implications for continental growth and crust–mantle recycling. J. Petrol. 1995, 36, 891–931. [Google Scholar] [CrossRef]
- Sen, C.; Dunn, T. Dehydration melting of a basaltic composition amphibolite at 1.5 and 2.0 GPa: Implications for the origin of adakites. Contrib. Miner. Petrol. 1994, 117, 394–409. [Google Scholar] [CrossRef]
- Qiu, K.-F.; Deng, J.; Taylor, R.D.; Song, K.-R.; Song, Y.-H.; Li, Q.Z.; Goldfarb, R.J. Paleozoic magmatism and porphyry Cu-mineralization in an evolving tectonic setting in the North Qilian Orogenic Belt, NW China. J. Asian Earth Sci. 2016, 122, 20–40. [Google Scholar] [CrossRef]
- Qiu, K.-F.; Deng, J. Petrogenesis of granitoids in the Dewulu skarn copper deposit: Implications for the evolution of the Paleotethys Ocean and mineralization in Western Qinling, China. Ore Geol. Rev. 2017, 90, 1078–1098. [Google Scholar] [CrossRef]
- Stern, C.R.; Killian, R. Role of the subducted slab, mantle wedge and continental crust in the genesis of adakites from the Andean Austral Volcanic Zone. Contrib. Miner. Petrol. 1996, 123, 263–281. [Google Scholar] [CrossRef]
- Castillo, P.R.; Janney, P.E.; Solidum, R.U. Petrology and geochemistry of Camiguin Island, southern Philippines: Insights to the source of adakites and other lavas in a complex arc setting. Contrib. Miner. Petrol. 1999, 134, 33–51. [Google Scholar] [CrossRef]
- Kay, S.M.; Mpodozis, C. Magmatism as a probe to the Neogene shallowing of the Nazca plate beneath the modern Chilean flat-slab. J. S. Am. Earth Sci. 2002, 15, 39–57. [Google Scholar]
- Pe-Piper, G.; Piper, J.W. Miocene magnesian andesites and dacites, Evia, Greece: Adakites associated with subducting slab detachment and extension. Lithos 1994, 31, 125–140. [Google Scholar] [CrossRef]
- Atherton, M.P.; Petford, N. Generation of sodium-rich magmas from newly underplated basaltic crust. Nature 1993, 362, 144–146. [Google Scholar] [CrossRef]
- Condie, K.C. TTGs and adakites: Are they both slab melts? Lithos 2005, 80, 33–44. [Google Scholar] [CrossRef]
- Rapp, R.P.; Shimizu, N.; Norman, M.D.; Applegate, G.S. Reaction between slab-derived melts and peridotite in the mantle wedge: Experimental constraints at 3.8 GPa. Chem. Geol. 1999, 160, 335–356. [Google Scholar] [CrossRef]
- Kelemen, P.B.; Hanghøj, K.; Greene, A.R. One view of the geochemistry of subduction-related magmatic arcs, with an emphasis on primitive andesite and lower crust. Treatise Geochem. 2014, 4, 749–806. [Google Scholar]
- Gill, J.B. Orogenic Andesites and Plate Tectonics; Springer: New York, NY, USA, 1981; pp. 1–392. [Google Scholar]
- Martin, H. Effect of steeper Archean geothermal gradient on geochemistry of subduction-zone magmas. Geology 1986, 14, 753–756. [Google Scholar] [CrossRef]
- Pearce, J.A.; Harris, N.B.W.; Tindle, A.G. Trace element discrimination diagrams for the tectonic interpretation of granitic rocks. J. Petrol. 1984, 25, 956–983. [Google Scholar] [CrossRef]
- Pearce, J.A. Sources and settings of granitic rocks. Episodes 1996, 19, 120–125. [Google Scholar]
- Harris, N.B.W.; Pearce, J.A.; Tindle, A.G. Geochemical characteristics of collision-zone magmatism. Geol. Soc. Lond. Spec. Publ. 1986, 19, 67–81. [Google Scholar] [CrossRef]
- Sun, W.-D.; Zhang, H.; Ling, M.-X.; Ding, X.; Chung, S.-L.; Zhou, J.-B.; Yang, X.-Y.; Fan, W.-M. The genetic association of adakites and Cu–Au ore deposits. Int. Geol. Rev. 2011, 53, 691–703. [Google Scholar] [CrossRef]
- Sun, W.-D.; Ling, M.-X.; Chung, S.-L.; Ding, X.; Yang, X.-Y.; Liang, H.-Y.; Fan, W.-M.; Richard, G.; Yin, Q.-Z. Geochemical Constraints on Adakites of Different Origins and Copper Mineralization. Geol. J. 2012, 120, 105–120. [Google Scholar] [CrossRef] [Green Version]
- Mungall, J.E. Roasting the mantle: Slab melting and the genesis of major Au and Au-rich Cu deposits. Geology 2002, 30, 915–918. [Google Scholar] [CrossRef]
- Qiu, K.-F.; Yang, L.-Q. Genetic feature of monazite and its U–Th–Pb dating: Critical considerations on the tectonic evolution of Sanjiang Tethys. Acta Petrol. Sin. 2011, 27, 2721–2732. (In Chinese) [Google Scholar]
- Qiu, K.-F.; Li, N.; Taylor, R.D.; Song, Y.-H.; Song, K.-R.; Han, W.-Z.; Zhang, D.-X. Timing and duration of metallogeny of the Wenquan deposit in the West Qinling, and its constraint on a proposed classification for porphyry molybdenum deposits. Acta Petrol. Sin. 2014, 30, 2631–2643. (In Chinese) [Google Scholar]
- Qiu, K.-F.; Song, K.-R.; Song, Y.-H. Magmatic-hydrothermal fluid evolution of the Wenquan porphyry molybdenum deposit in the north margin of the Western Qinling, China. Acta Petrol. Sin. 2015, 31, 3391–3404. (In Chinese) [Google Scholar]
- Qiu, K.-F.; Taylor, R.D.; Song, Y.-H.; Yu, H.-C.; Song, K.-R.; Li, N. Geologic and geochemical insights into the formation of the Taiyangshan porphyry copper–molybdenum deposit, Western Qinling Orogenic Belt, China. Gondwana Res. 2016, 35, 40–58. [Google Scholar] [CrossRef]
- Qiu, K.-F.; Marsh, E.; Yu, H.-C.; Pfaff, K.; Gulbransen, C.; Gou, Z.-Y.; Li, N. Fluid and metal sources of the Wenquan porphyry molybdenum deposit, Western Qinling, NW China. Ore Geol. Rev. 2017, 86, 459–473. [Google Scholar] [CrossRef]
- Oyarzun, R.; Marquez, A.; Lillo, J.; Lopez, I.; Rivera, S. Giant versus small porphyry copper deposits of Cenozoic age in northern Chile: Adakitic versus normal calcalkaline magmatism. Miner. Depos. 2001, 36, 794–798. [Google Scholar] [CrossRef]
- Sun, W.-D.; Bennett, V.C.; Eggins, S.M.; Arculus, R.J.; Perfit, M.R. Rhenium systematics in submarine MORB and back-arc basin glasses: Laser ablation ICP-MS results. Chem. Geol. 2003, 196, 259–281. [Google Scholar] [CrossRef]
- McDonough, W.F.; Sun, S.S. The composition of the earth. Chem. Geol. 1995, 120, 223–253. [Google Scholar] [CrossRef]


| Sample No. | Lithology | Location | Texture/Structure | Phenocrysts | Matrix |
|---|---|---|---|---|---|
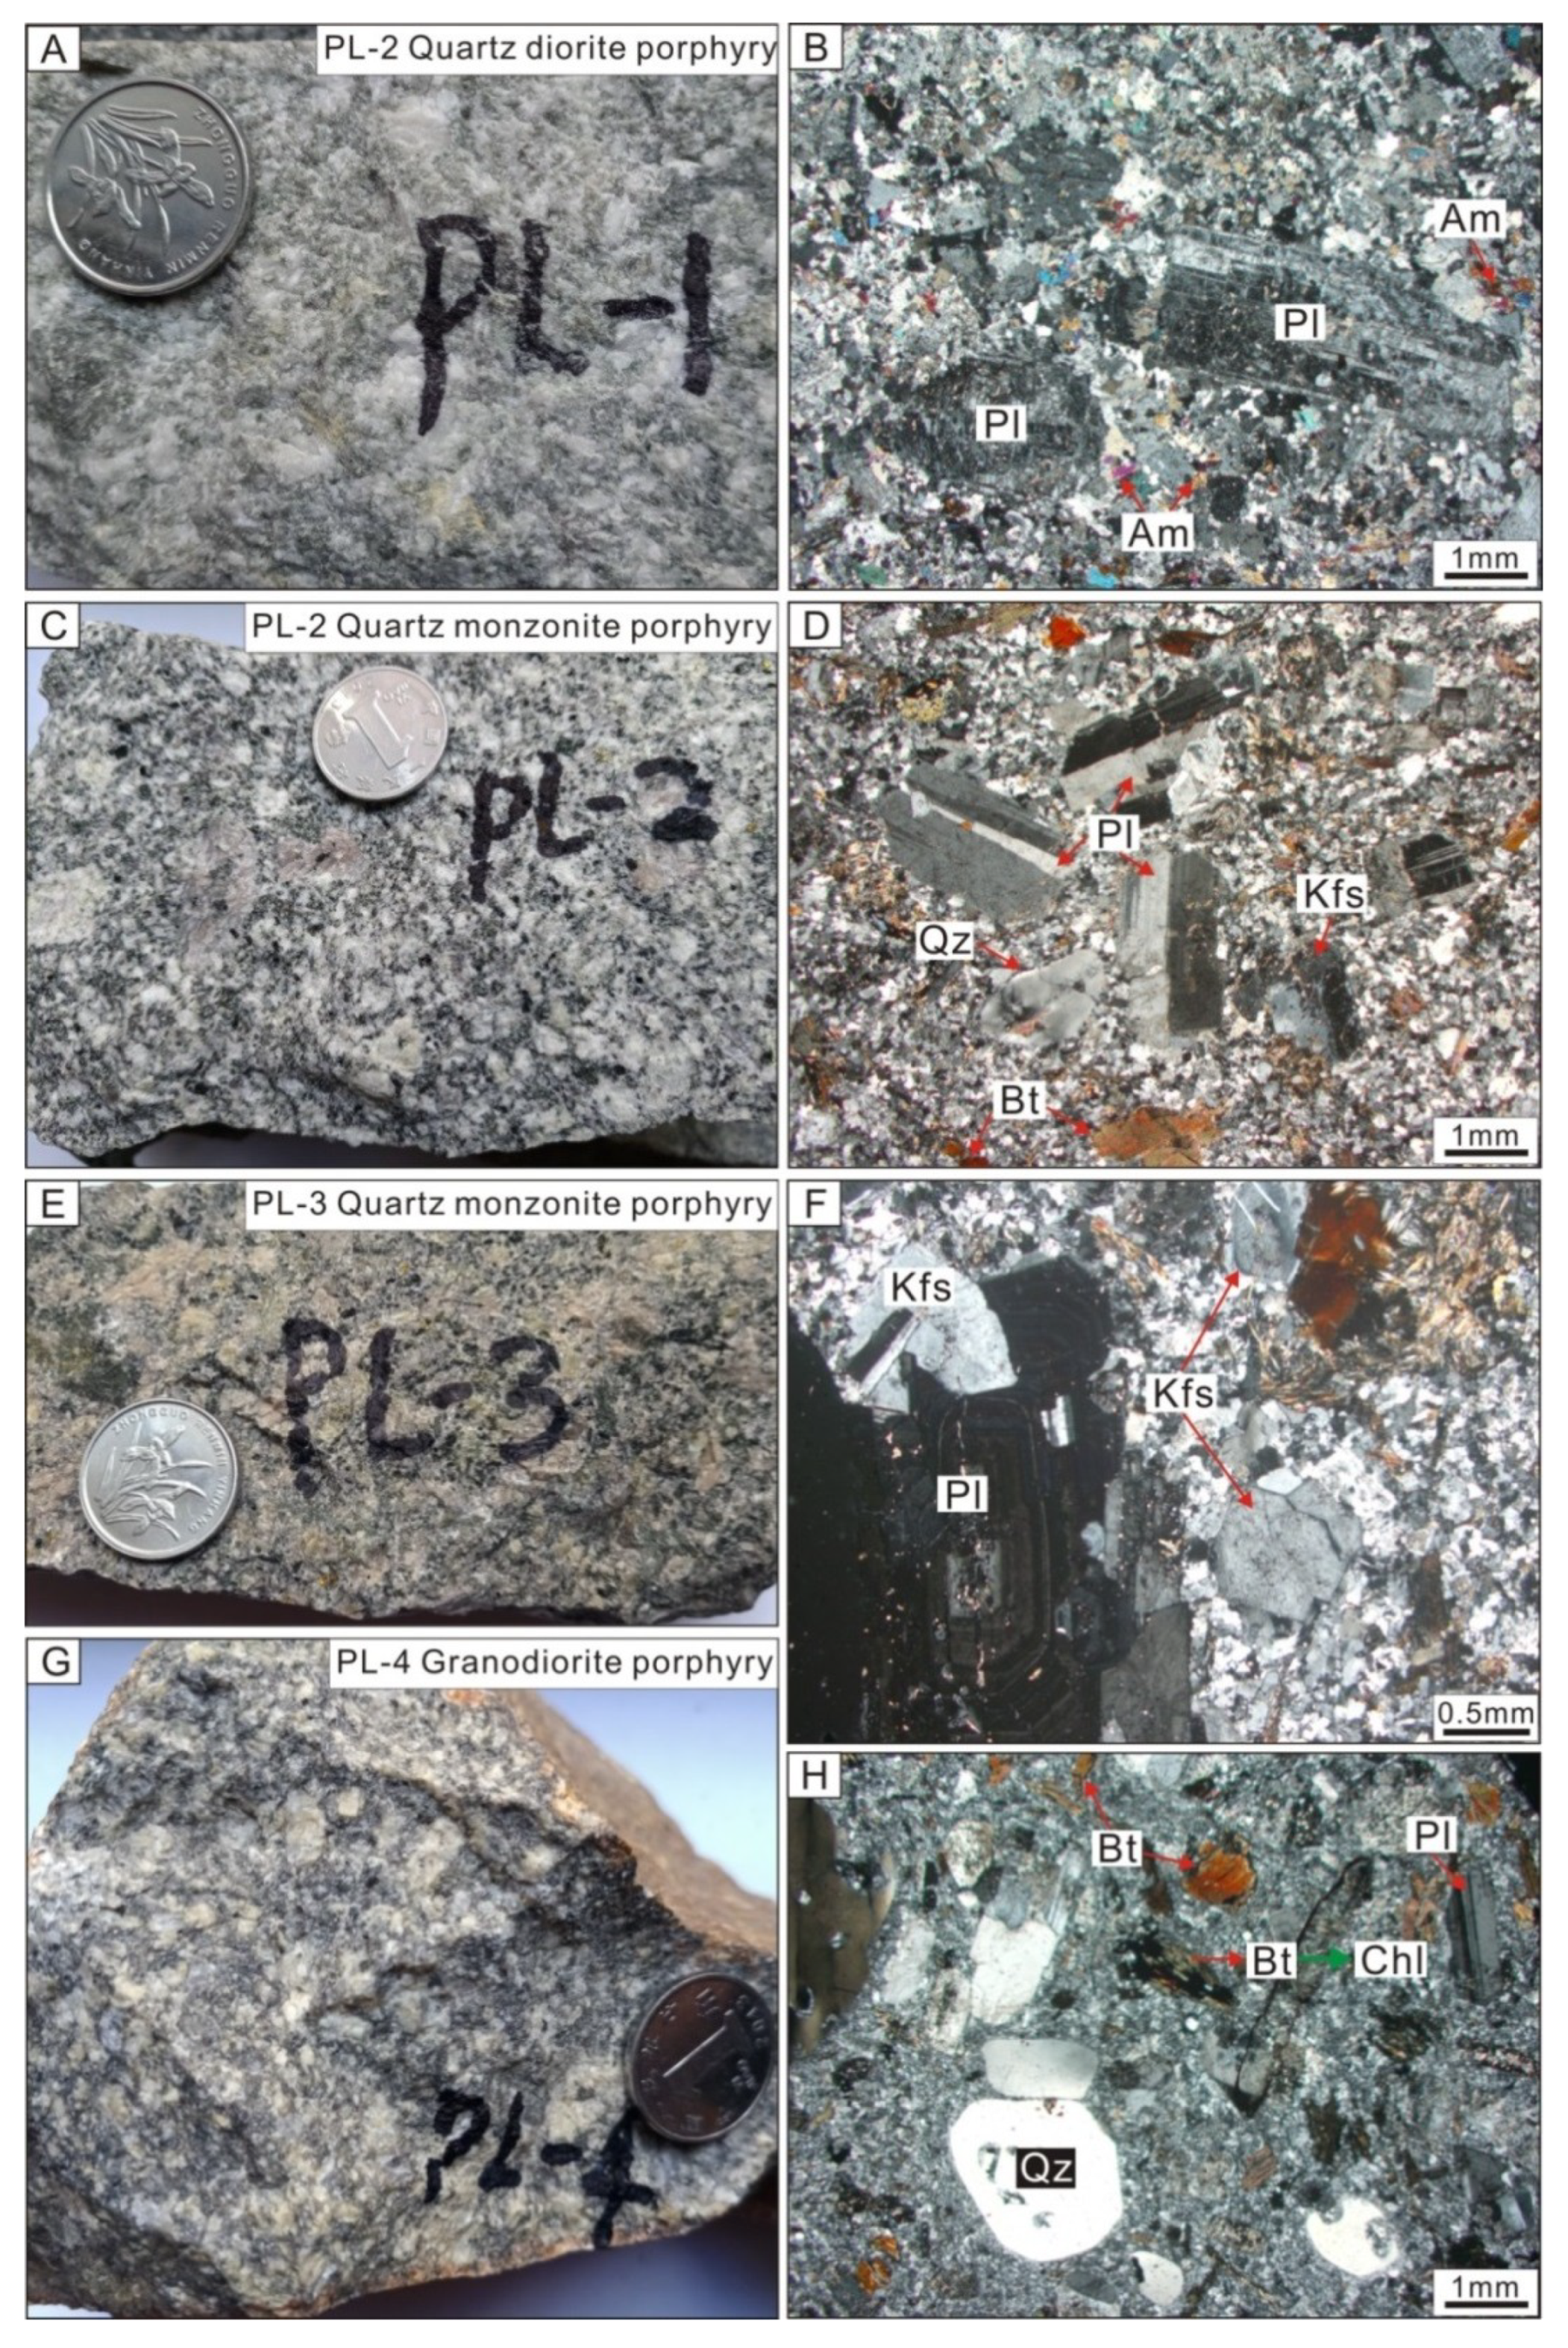
| PL-1 | Quartz diorite porphyry | N: 28°02′49″ E: 99°58′51″ | Porphyritic texture, massive structure | Phenocrysts account for 20% of the rock mass and consist of plagioclase (~15%, 0.5–3.2 mm), amphibole (~3%, 0.3–1.8 mm), and quartz (~2%, 0.4–2.3 mm). | Matrix is primarily a fine-grained texture and is dominated by plagioclase with minor amphibole, K-feldspar, and quartz. |
| PL-2 | Quartz monzonite porphyry | N: 28°03′44″ E: 99°59′19″ | Porphyritic texture, massive structure | Phenocrysts account for 20% of the rock mass and consist of plagioclase (~9%, 0.6–3.8 mm), K-feldspar (~7%, 0.4–3.4 mm), quartz (~3%, 0.5–2.8 mm), and biotite (~1%, 0.2–1.6 mm). | Matrix shows a fine-grained texture and is composed of plagioclase and K-feldspar with minor quartz and biotite. |
| PL-3 | Quartz monzonite porphyry | N: 28°02′54″ E: 99°58′57″ | Porphyritic texture, massive structure | Phenocrysts account for 20% of the rock mass and consist of plagioclase (~9%, 0.6–3.8 mm), K-feldspar (~7%, 0.4–3.4 mm), quartz (~3%, 0.5–2.8 mm), and biotite (~1%, 0.2–1.7 mm). | Matrix shows a fine-grained texture and is composed of plagioclase and K-feldspar with minor quartz and biotite. |
| PL-4 | Granodiorite porphyry | N: 28°02′07″ E: 99°58′18″ | Porphyritic texture, massive structure | Phenocrysts account for 20% of the rock mass and consist of plagioclase (~8%, 0.4–2.3 mm), quartz (~5%, 0.5–2.6 mm), biotite (~3%, 0.3–1.4 mm), amphibole (~2%, 0.2–1.2 mm), and K-feldspar (~2%, 0.5–2.0 mm). | Matrix shows a fine-grained texture and is composed of plagioclase and quartz with minor biotite and amphibole. |
| Sample No. | Lithology | Ore-Hosted Rocks | Location | Re (μg/g) | Common Os (ng/g) | 187Re (μg/g) | 187Os (ng/g) | Model Age (Ma) | |||||
|---|---|---|---|---|---|---|---|---|---|---|---|---|---|
| Measured | Error | Measured | Error | Measured | Error | Measured | Error | Measured | Error | ||||
| PL-8-6 | Mo-bearing quartz veinlet ore | QDP | N: 28°02′45″ E: 99°58′53″ | 921.25 | 8.08 | 0.0184 | 0.4222 | 579.03 | 5.08 | 2112.44 | 13.19 | 218.6 | 3.0 |
| PL-11-2 | Disseminated Mo-bearing chalcopyrite ore | QMP | N: 28°02′53″ E: 99°59′04″ | 101.22 | 0.65 | 0.2262 | 0.4283 | 63.62 | 0.41 | 230.17 | 1.42 | 216.8 | 2.9 |
| PL-11-3 | Disseminated Mo-bearing chalcopyrite ore | QMP | N: 28°02′53″ E: 99°59′04″ | 154.64 | 1.01 | 0.0164 | 0.3759 | 97.19 | 0.64 | 351.44 | 2.09 | 216.6 | 2.9 |
| PL-10-4 | Mo-bearing quartz veinlet ore | QDP | N: 28°02′56″ E: 99°58′52″ | 316.48 | 2.15 | 0.4501 | 0.4819 | 198.91 | 1.35 | 720.58 | 4.47 | 217.0 | 2.9 |
| PL-11-5 | Mo-bearing chalcopyrite quartz vein ore | QDP | N: 28°02′53″ E: 99°59′26″ | 236.07 | 1.64 | 0.5393 | 0.2190 | 148.37 | 1.03 | 538.16 | 3.42 | 217.3 | 3.0 |
| PL-7-1 | Mo-bearing quartz lump ore | QMP | N: 28°02′49″ E: 99°59′10″ | 933.39 | 8.19 | 0.0187 | 0.4278 | 586.65 | 5.15 | 2129.61 | 13.64 | 217.5 | 3.2 |
| Deposit | Type | Commodity | Reserve/Grade | Ore-Hosting Rock | Metal Minerals | Alteration | Related Intrusion Age (Ma) | Mineralization Age (Ma) | Reference |
|---|---|---|---|---|---|---|---|---|---|
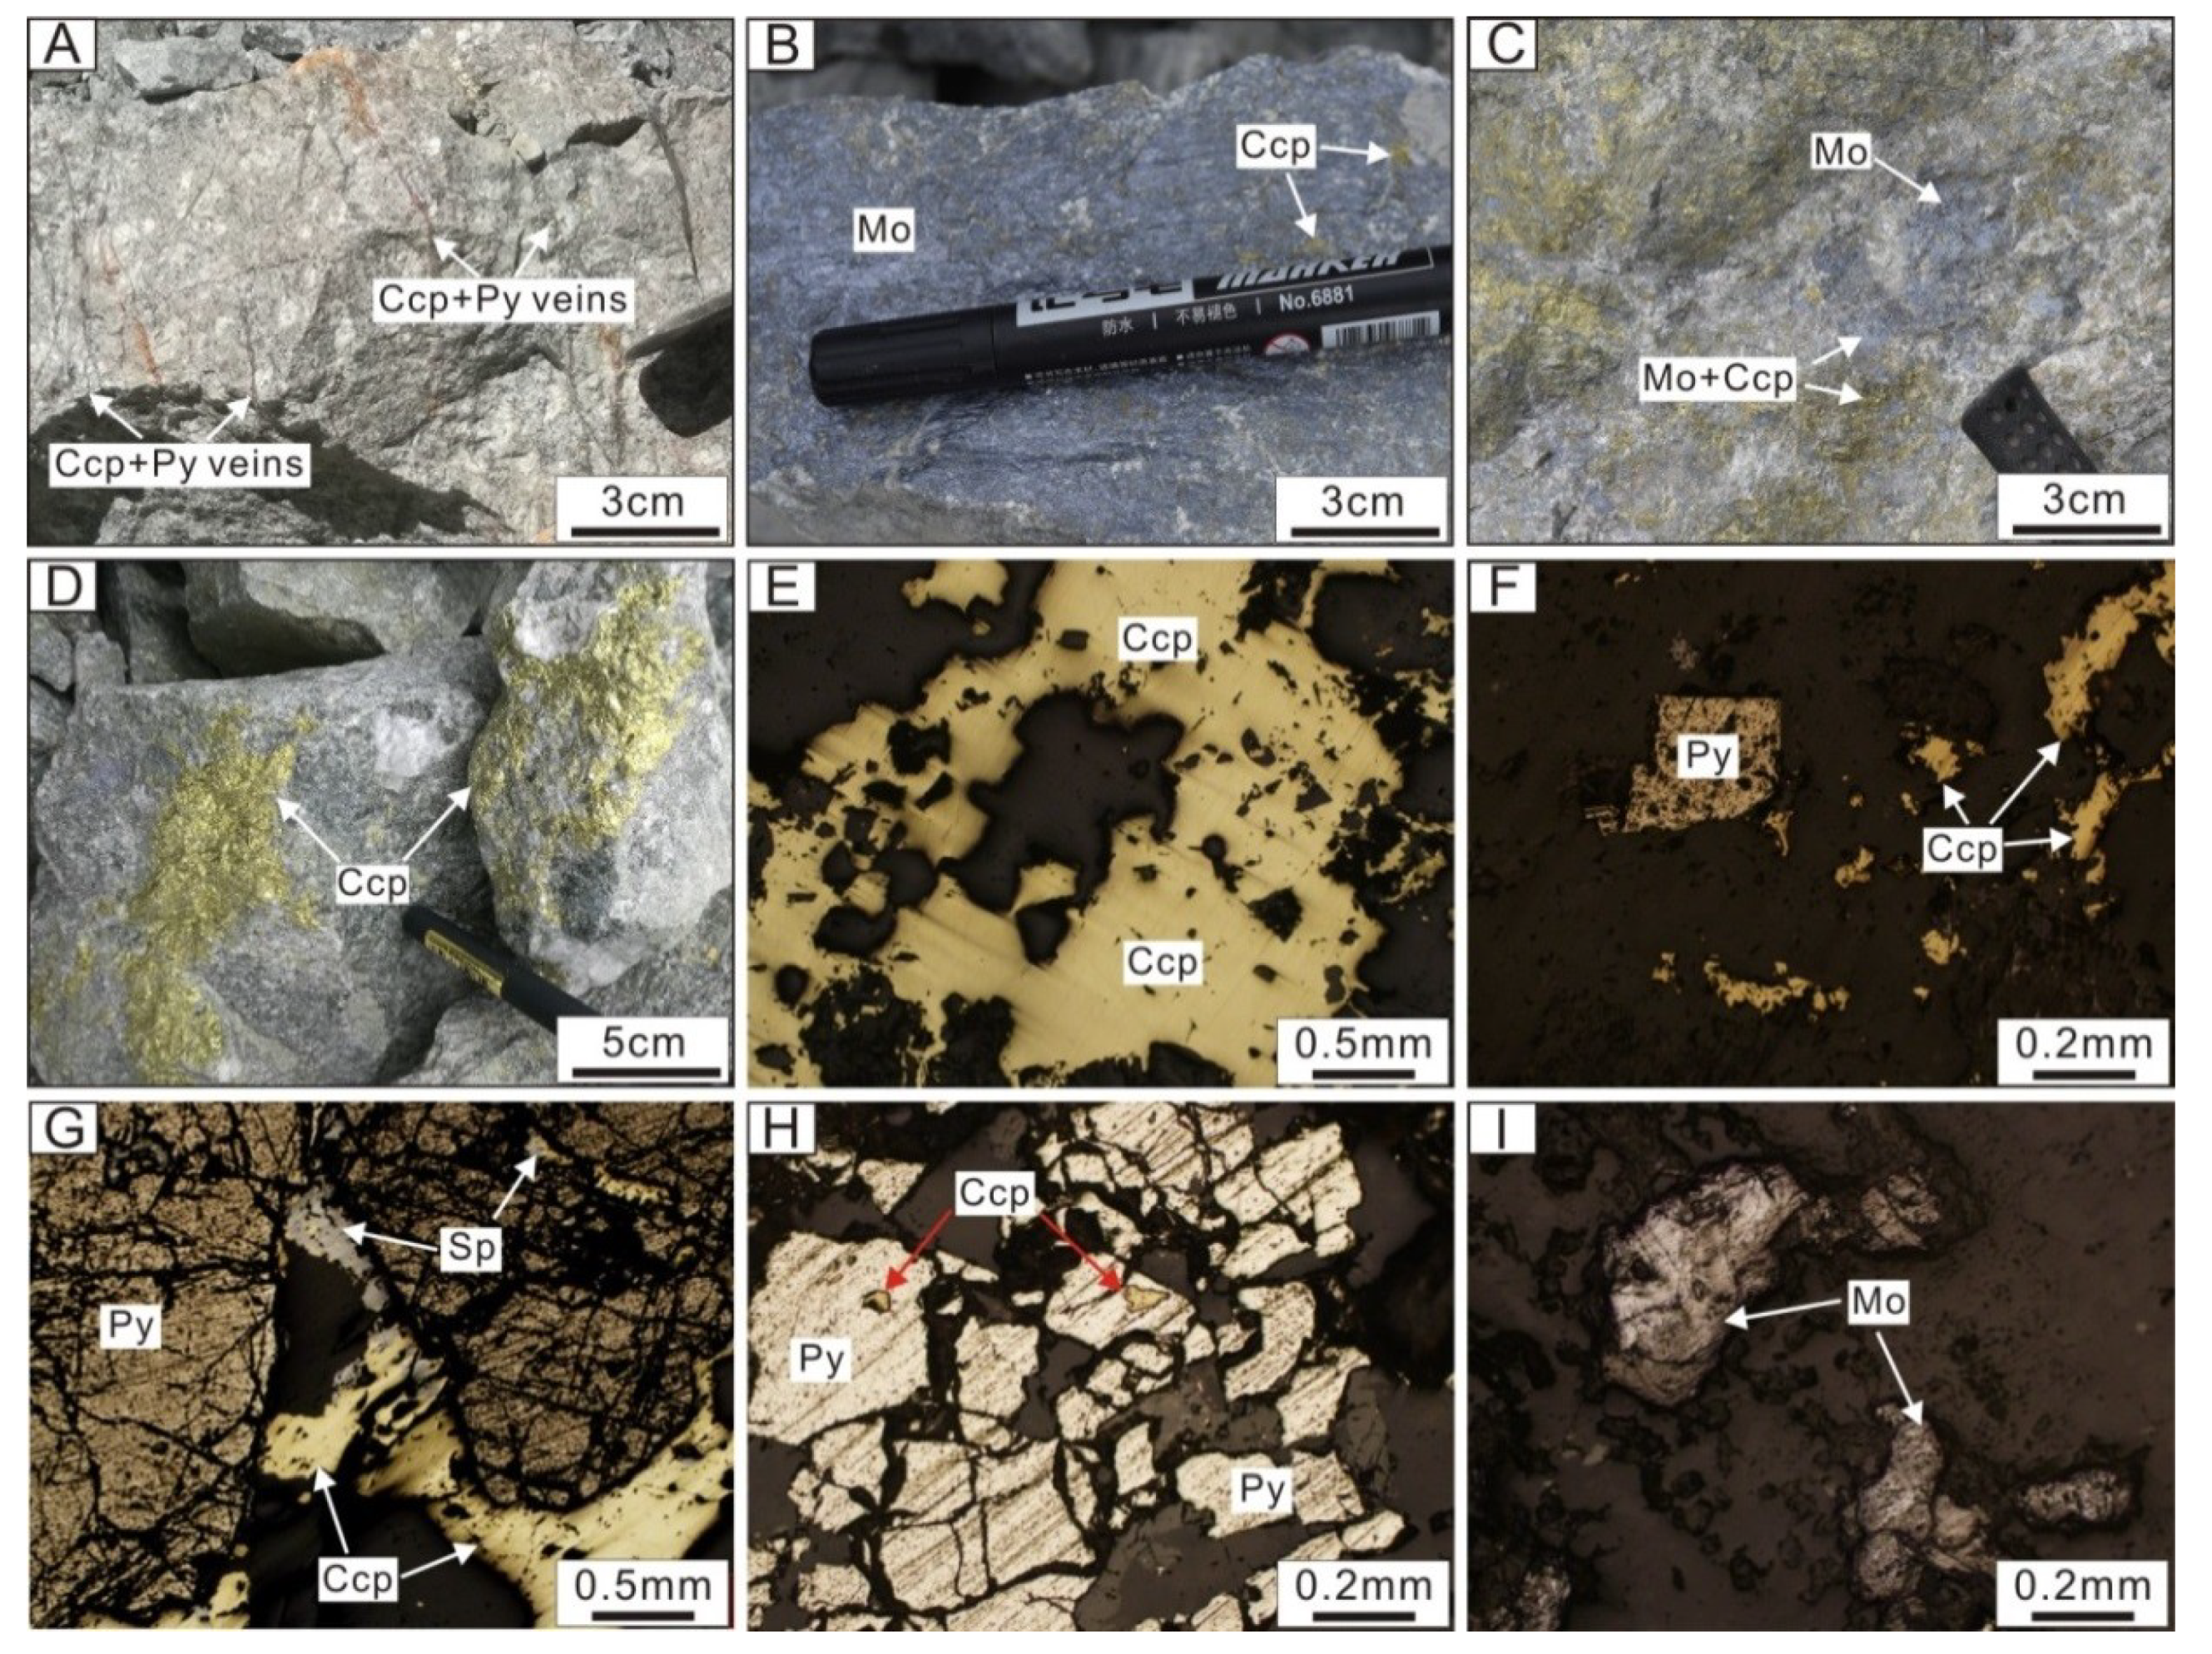
| Pulang | Porphyry | Cu–Mo–Au | Cu: 1.14 Mt @ 0.52% Mo: 6399 t @ 0.0004% Au: 54 t @ 0.18 g/t | QDP, QMP, GP | Ccp, Py, Mo, Bn, Mag, Sp, Pyr, Cv | Qz, Kfs, Ser, Chl, Ep, Cal | QMP (Zircon U–Pb:218 ± 1, 219 ± 1) | Molybdenite Re–Os: 219 ± 2 | This paper [20] |
| Xuejiping | Porphyry | Cu | Cu: 0.30 Mt @ 0.52% | DP, QMP | Ccp, Py, Mo, Gn, Sp | Qz, Kfs, Ser, Chl, Ep, Cal | QMP (Zircon U–Pb:219 ± 2, 215 ± 3) | Molybdenite Re–Os 221 ± 2 | [7,55] |
| Chundu | Porphyry | Cu | No data | DP, QMP, GP | Ccp, Py, Gn, Sp | Qz, Kfs, Ser, Chl, Ep, Cal | QMP (Zircon U–Pb: 220 ± 2) | Triassic | [2] |
| Lannitang | Porphyry | Cu | Cu: 0.18 Mt @ 0.5% | QDP, QMP | Ccp, Py, Clc, Mag, Hem | Qz, Kfs, Chl, Ep | QDP (Zircon U–Pb:225 ± 4) | Triassic | [33] |
| Songnuo | Porphyry | Cu | No data | QMP | Ccp, Py, Pyr | Qz, Chl, Ep, Cal | QMP (Zircon U–Pb:221 ± 4) | Triassic | [9] |
| Langdu | Skarn | Cu–Fe | Cu: 0.10 Mt @ 6% | Skarn and hornfel | Ccp, Py, Pyr, Mag | Qz, Grt, Tr, Chl, Ep, Cal | QMP (Zircon U–Pb:223 ± 1) | Triassic | [33] |
| Adakite | HSA | LSA | Pulang Porphyry Intrusions | |
|---|---|---|---|---|
| SiO2 | ≥56 wt % | ≥60 wt % | ≤60 wt % | 62–74 wt % |
| Al2O3 | ≥15 wt %(rarely lower) | 11.4–16.2 wt % (mostly 15.1–16.2 wt %) | ||
| MgO | <3 wt %(rarely >6 wt %) | 0.5–4.0 wt % | 4.0–9.0 wt % | 1.7–4.2 wt % |
| Na2O | 3.5–7.5 wt % | 2.7–5.0 wt % (mostly 3.4–5.0 wt %) | ||
| K2O/Na2O | ~0.42 (sodic) | 0.2–1.0 wt % (sodic) | ||
| CaO + Na2O | <11 wt % | >10 wt % | 4.6–10.9 wt % | |
| TiO2 | <0.9 wt % | >3.0 wt % | 0.40–0.77 wt % | |
| Sr | >400 ppm (rarely <400 ppm) | <1100 ppm | >1000 ppm | 432–1150 ppm |
| Y | ≤18 ppm | ≤18 ppm | ≤18 ppm | 9–16 ppm |
| Yb | ≤1.9 ppm | ≤1.9 ppm | ≤1.9 ppm | 0.8–1.5 ppm |
| Sr/Y | 40–100 | 48–94 | ||
| Cr/Ni | 0.5–4.5 | 1.0–2.5 | 1.2–7.6 (mostly 1.2–3.9 wt %) | |
| Mg# | ~50 | 46–73 (>46, High-Mg) | ||
| Reference | [62,65] | [79] | [79] | This paper |
© 2019 by the authors. Licensee MDPI, Basel, Switzerland. This article is an open access article distributed under the terms and conditions of the Creative Commons Attribution (CC BY) license (http://creativecommons.org/licenses/by/4.0/).
Share and Cite
Yang, Q.; Ren, Y.-S.; Chen, S.-B.; Zhang, G.-L.; Zeng, Q.-H.; Hao, Y.-J.; Li, J.-M.; Yang, Z.-J.; Sun, X.-H.; Sun, Z.-M. Geological, Geochronological, and Geochemical Insights into the Formation of the Giant Pulang Porphyry Cu (–Mo–Au) Deposit in Northwestern Yunnan Province, SW China. Minerals 2019, 9, 191. https://doi.org/10.3390/min9030191
Yang Q, Ren Y-S, Chen S-B, Zhang G-L, Zeng Q-H, Hao Y-J, Li J-M, Yang Z-J, Sun X-H, Sun Z-M. Geological, Geochronological, and Geochemical Insights into the Formation of the Giant Pulang Porphyry Cu (–Mo–Au) Deposit in Northwestern Yunnan Province, SW China. Minerals. 2019; 9(3):191. https://doi.org/10.3390/min9030191
Chicago/Turabian StyleYang, Qun, Yun-Sheng Ren, Sheng-Bo Chen, Guo-Liang Zhang, Qing-Hong Zeng, Yu-Jie Hao, Jing-Mou Li, Zhong-Jie Yang, Xin-Hao Sun, and Zhen-Ming Sun. 2019. "Geological, Geochronological, and Geochemical Insights into the Formation of the Giant Pulang Porphyry Cu (–Mo–Au) Deposit in Northwestern Yunnan Province, SW China" Minerals 9, no. 3: 191. https://doi.org/10.3390/min9030191