Article

Measuring Copper, Lead and Zinc Concentrations and Oral Bioaccessibility as Part of the Soils in Scottish Schools Project

Department of Pure and Applied Chemistry, University of Strathclyde, Glasgow G1 1XL, UK
*
Author to whom correspondence should be addressed.
Minerals 2019, 9(3), 173; https://doi.org/10.3390/min9030173
Submission received: 6 February 2019 / Revised: 5 March 2019 / Accepted: 7 March 2019 / Published: 11 March 2019
(This article belongs to the Special Issue Medical Geology)

Abstract

:
Determination of potentially toxic elements in soils with which children have regular contact can provide valuable information to support health risk assessment. It is also important to engage schoolchildren with soil science so that they become well-informed citizens. The Soils in Scottish Schools project involved pupils across Scotland in the collection of soil from school grounds for determination of copper, lead and zinc. Samples were subjected to microwave-assisted aqua-regia digestion to determine pseudototal analyte concentrations. The simplified bioaccessibility extraction test was applied to estimate bioaccessibility. Analysis was performed by inductively coupled plasma mass spectrometry. Pseudototal analyte concentrations varied widely: Cu 15.6–220 mg∙kg−1; Pb 24.6–479 mg∙kg−1 and Zn 52.5–860 mg∙kg−1. Higher concentrations were measured in urban areas, which were historically home to heavy manufacturing industries, with lower concentrations in soils from more rural schools. Bioaccessible analyte concentrations also varied widely (Cu 3.94–126 mg∙kg−1; Pb 6.29–216 mg∙kg−1 and Zn 4.38–549 mg∙kg−1) and followed similar trends to pseudototal concentrations. None of the elements studied posed a significant health risk to children through accidental soil ingestion whilst at play during breaks in the school day, although the relatively high bioaccessible levels of lead at some locations are worthy of further investigation.

Graphical Abstract

1. Introduction

Pollution of the urban environment with potentially toxic elements (PTEs) is now a global issue [1]. In the developing world, rapid and often unregulated urbanisation is causing accumulation of PTEs in soil, whilst many cities in the developed world carry a legacy of urban pollutants from past heavy industry. This is of particular concern in locations frequented by children such as public parks, playgrounds and schoolyards.
Numerous studies have investigated concentrations of copper, lead and zinc (along with other analytes) in soils with which children are likely to have regular contact. As shown in Table 1, results vary widely. This is due, in part, to differences in soil parent material and soil properties, together with the use of different sampling strategies and analytical methods by different workers. However, the nature of the city studied—its age, size, population, traffic density and industrial activities (both current and historical)—can all have an influence on PTE levels and distribution. Particularly elevated PTE concentrations are often associated with known sources of pollution such as high road traffic density [2,3,4,5,6]; coal combustion [7]; chemically treated wooden playground equipment [6,8]; or specific industrial emissions. For example, the high concentrations of lead and zinc in playgrounds of Port Pirie, Australia [9] were attributed to the proximity of one of the world’s largest lead-zinc smelters. However, generally elevated “urban background” levels of copper, lead and zinc have also been reported [10]—indeed, these are amongst the PTEs considered indicative of urbanisation [11]. This has also been noted in work focused on soil from locations where children play. Levels of copper, lead and zinc were all higher in soils from inner city day-care centres in Trondheim and Bergen than in samples from outer city sites [12]. In Warsaw and Bydgoszcz, the highest levels of lead and zinc were found in playgrounds and sports areas in the city centres [13]. Average concentrations of copper and lead in soils from urban elementary school playgrounds in Hermosillo [14] were almost double those found in peri-urban school playgrounds, and average levels of zinc were four times those in peri-urban samples.
As well as determination of (pseudo)total PTE levels, there is growing interest in measuring the bioaccessibility of PTEs in soils that children interact with [4,23,24,26,31]. Oral bioaccessibility tests give an indication of the proportion of PTEs that is potentially available for absorption following accidental or deliberate ingestion of soil. Results obtained can support more accurate human health risk assessment and help determine whether contaminated sites require remediation.
Also important is to engage children with soil science and the issues surrounding soil pollution so that they become well-informed adults. The Soils in Scottish Schools project targeted pupils in second year of secondary education in Scotland (12–14-year old). As is common with citizen science projects, it had both an educational and a scientific objective:
  • To provide Scotland’s school teachers with resources to enhance pupils’ understanding of the importance and fragility of the soil resource
  • To carry out an investigation of levels and bioaccessibility of Cu, Pb and Zn in soils collected by pupils from school grounds.
Although soil-focused citizen science projects have been conducted previously (for example references [32,33,34,35]) the current study is unique in terms of its focus on school soils and school pupils.
A request for Expressions of Interest in participating in the project was sent to all 397 secondary schools in Scotland in mid-2017. Ninety-nine schools responded positively. Each of these was provided with:
  • A teaching resource pack to help support a lesson about the chemistry of soil, i.e., a Powerpoint presentation, quiz, and worksheets detailing experiments suitable for the target age group (determination of soil composition and pH).
  • A series of monthly newsletters with updates on the progress of the project, fun activities, and additional scientific information about soil.
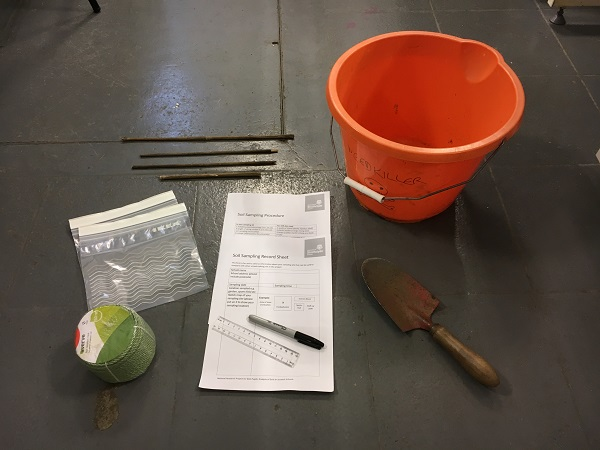
  • A soil sampling pack containing detailed instructions for collection of a soil sample from the school grounds, a sample bag, and a pre-paid envelope in which to post the sample to the university.
In total, forty-three schools returned a soil sample. Once received, the samples were pre-treated, digested in aqua regia and subjected to the simplified bioaccessibility extraction test [36], then digests and extracts were analysed by inductively coupled plasma mass spectrometry (for details, see Materials and Methods). Results for individual schools were distributed in June 2018, along with a project report containing information on the copper, lead and zinc concentration ranges obtained across all samples. Participant schools were encouraged to organise a group poster competition for pupils on the topic “Why is Soil Important?”. The winning teams from each school, along with their teachers, were invited to attend a Grand Environment Day at the University of Strathclyde in September 2018. This involved presentations from staff and students involved in the project, the award of prizes for best poster overall, and a guest lecture by Professor Iain Stewart (University of Plymouth) an expert in science communication who has produced several TV series on geoscience-related topics.
This article discusses the pseudototal and oral bioaccessible concentrations of copper, lead and zinc in the soil samples submitted by schools. Results are discussed in terms of location, in particularly with respect to Scotland’s main area of urbanization in the central belt, and in terms of potential health risk to pupils who have regular access to these soils.

2. Materials and Methods
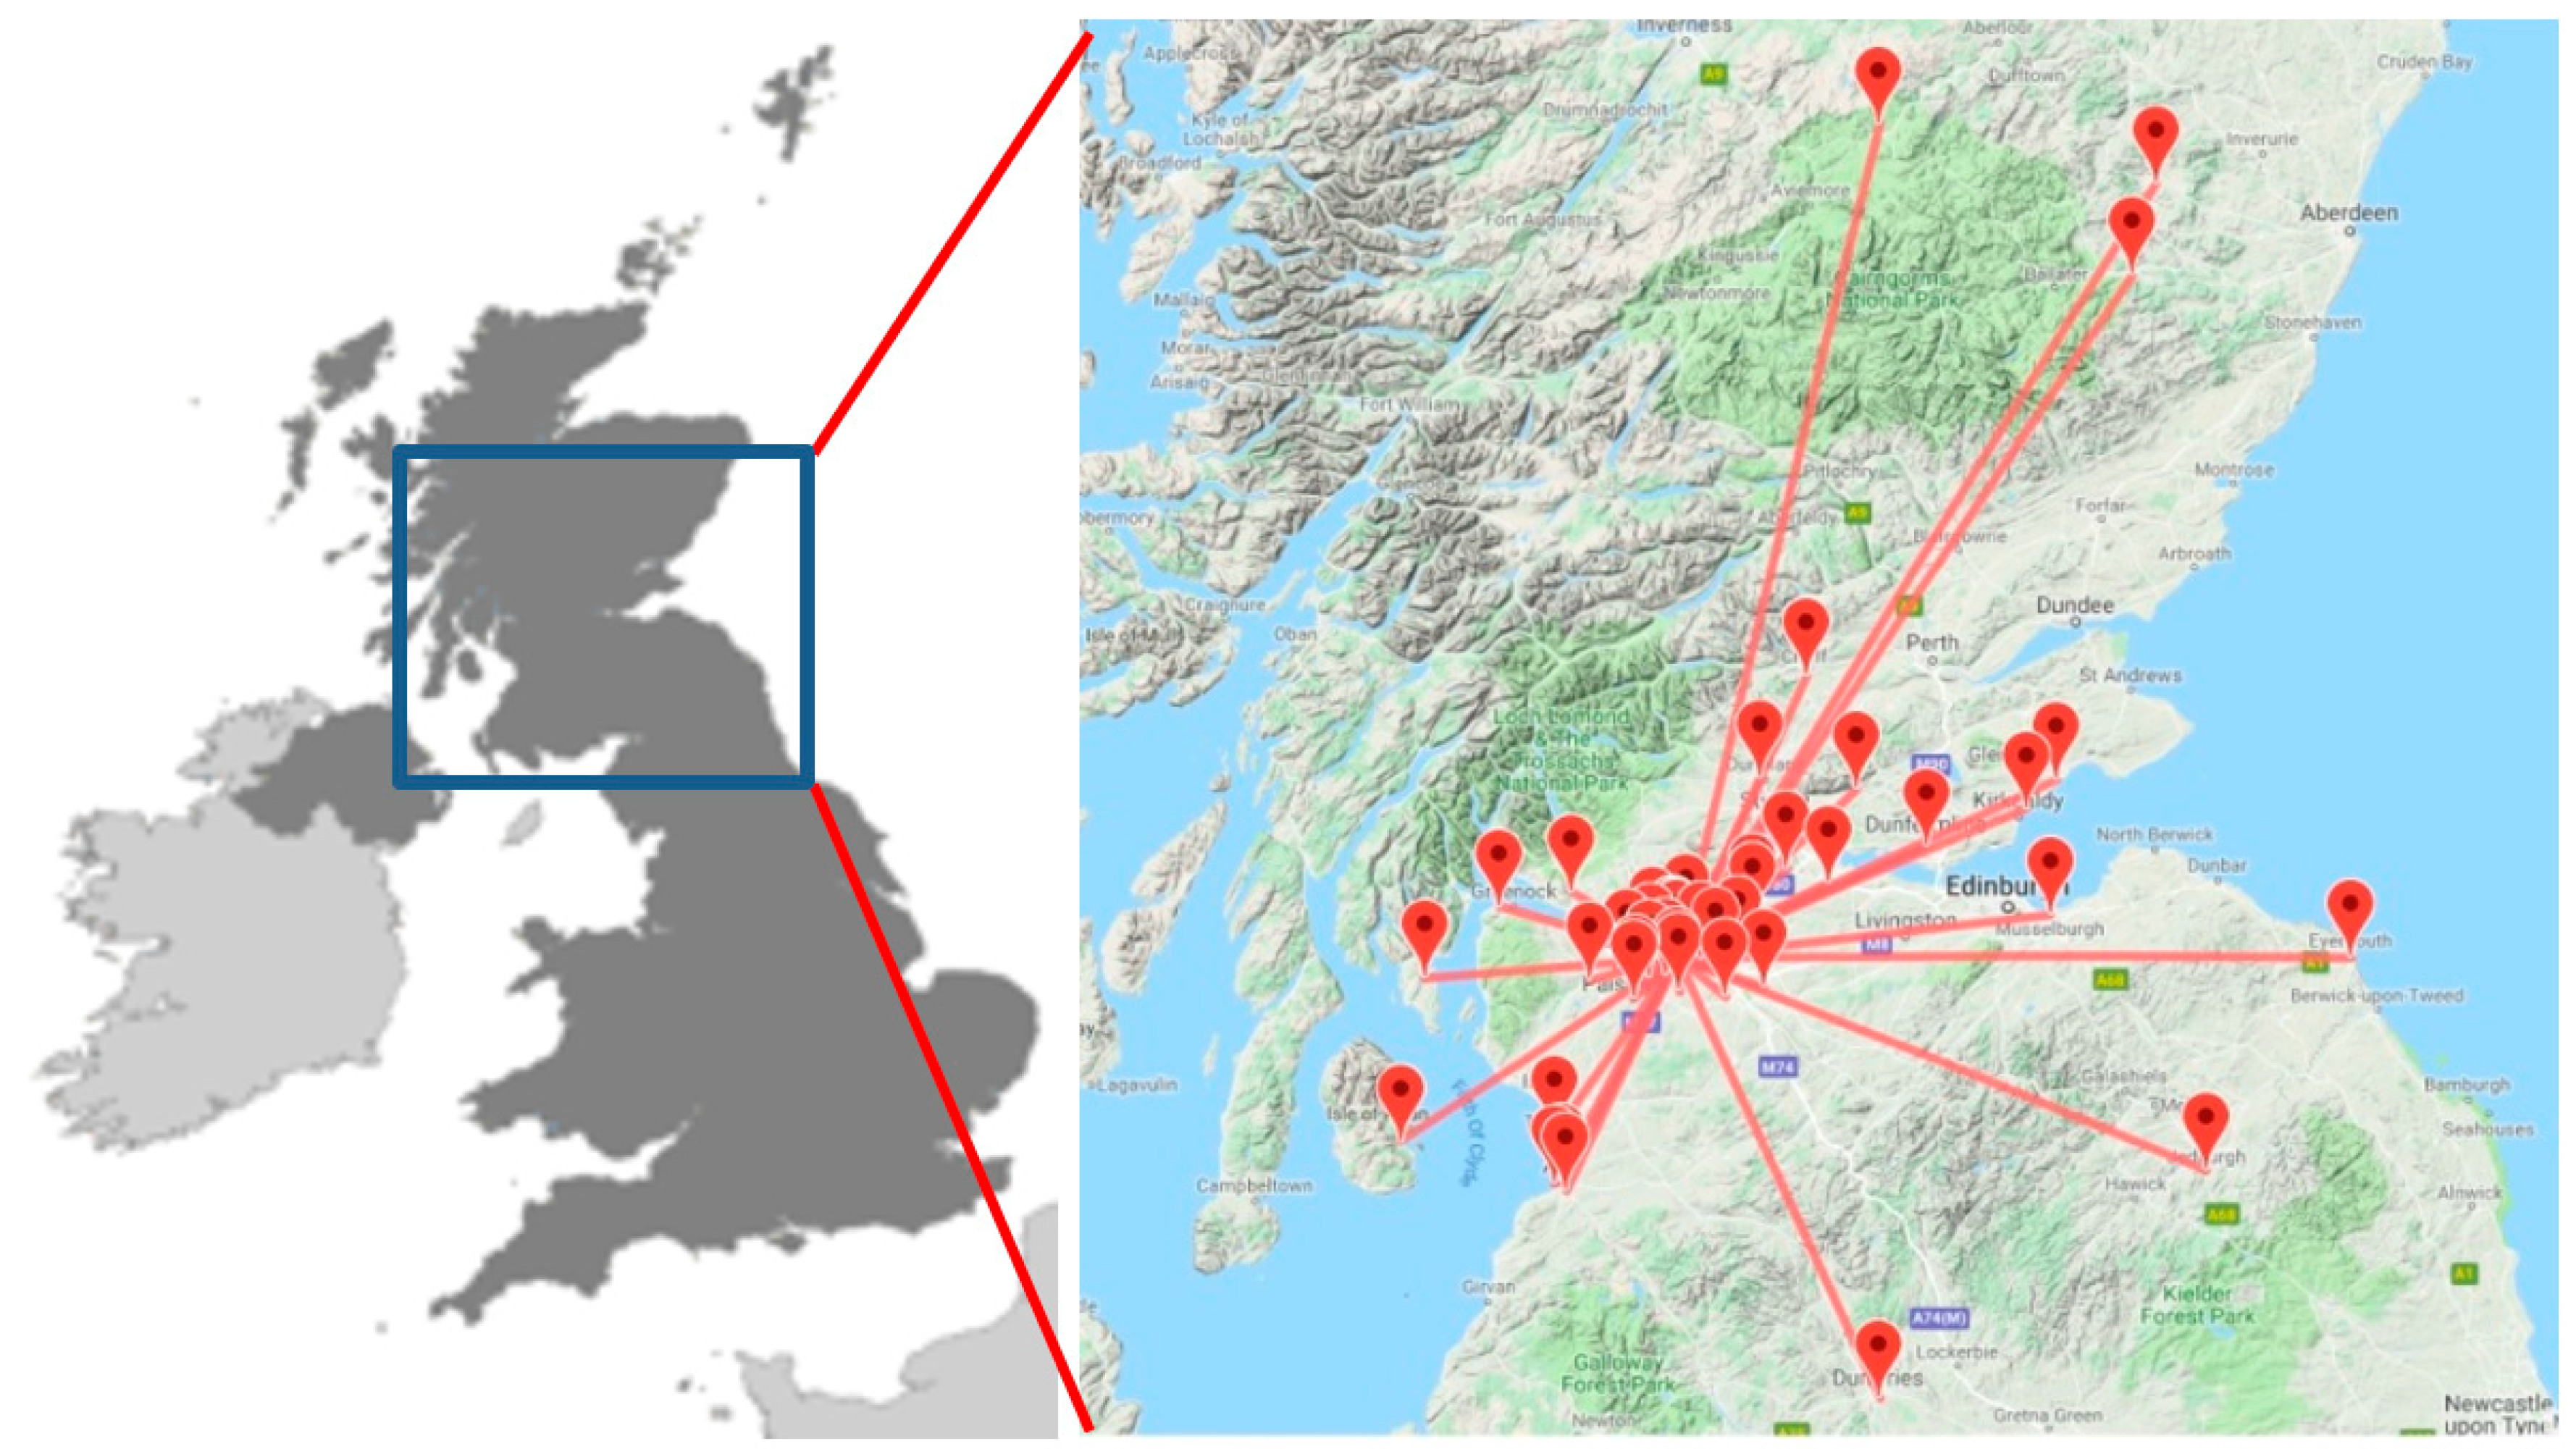
2.1. Sampling

Each participating school was instructed to collect a single bulk composite soil sample from a grassy site within the school grounds, remote from buildings, trees, or likely point sources of PTEs such as roads or staff car parks. They were told to mark out a 2 m square and collect soil to a depth of 10 cm from the centre and corners of the square. The five sub-subsamples were to be mixed thoroughly and then approximately 250 g placed in the sample bag provided and posted to the university. Not all schools returned the requested mass: thirty-seven provided sufficient for both pseudototal analysis and estimation of bioaccessibility, and a further six sufficient for aqua regia digestion only. Samples were received predominantly from schools in central Scotland, but there were also participants from locations in the Scottish Borders, Highlands and Islands (Figure 1).

2.2. Sample Pre-Treatment and General Characterisation

Soil samples were air-dried for at least one week and any aggregates present were gently broken up using a mortar and pestle. The material was then passed through a 2 mm mesh sieve. Residual moisture content was measured by drying at 110 °C and organic matter content estimated by loss-on-ignition at 550 °C. Soil pH was determined in distilled water at a solid:solution ratio of 1:5.

2.3. Pseudototal Digestion

A 20 mL aliquot of freshly prepared aqua regia (3:1 (v/v) HCl + HNO3) was added to a 1 g test portion of soil in a high-pressure vessel; left to stand overnight; and then subjected to microwave-assisted digestion in a MARS Xpress system (CEM, Buckingham, UK). The operating conditions were power 800 W; ramp time from room temperature to 160 °C = 20 min; hold time at 160 °C = 20 min. After cooling, the digests were filtered into 100 mL volumetric flasks. The filtrates were made up to the mark with distilled water and stored at 4 °C prior to analysis. Samples were digested in triplicate, along with a procedural blank.

2.4. Simplified Bioaccessibility Test (SBET) [36]

The soil was sieved for a second time and the <250 μm particle size fraction taken for estimation of oral bioaccessibility. A 100 mL aliquot of 0.4 mol·L−1 glycine adjusted to a pH of 1.5 ± 0.05 with HCl was added to a 1 g test portion in a HDPE bottle and the mixture shaken at 30 rpm for one hour at 37 °C in an incubating shaker. A 10 mL aliquot was removed using a disposable syringe, passed through a 0.45 μm pore size cellulose acetate syringe filter, and stored at 4 °C prior to analysis. The extraction was carried out in triplicate, along with a procedural blank.

2.5. Analysis of Digests and Extracts

Digests and extracts were analysed by inductively coupled plasma mass spectrometry using an Agilent model 7700x instrument (Agilent Technologies, Cheshire, UK) with respect to multi-element standard solutions in 2% aqua regia. Instrument operating conditions were power 1600 W; nebuliser gas flow 1.05 L∙min−1; plasma gas flow 15 L∙min−1, sample uptake rate 1 mL∙min−1. Copper, lead and zinc were quantified based on their 63Cu, 66Zn and 208Pb isotopes, with 45Sc, 72Ge and 209Bi, respectively, as internal standards.

2.6. Reference Material Analysis

An in-house (i.e., secondary) reference material (RM) characterized during the EU URBSOIL project (EVK4-CT-2001-00053) was used for quality control of the pseudototal digestion. This is an urban soil from the city of Glasgow and so the matrix is well-matched to the samples in the current study. Indicative (target) concentrations were 111 ± 5 mg∙kg−1 for Cu; 389 ± 25 mg∙kg−1 for Pb; and 177 ± 11 mg∙kg−1 for Zn (n = 34) [37]. Found concentrations were within 10% of targets, specifically 104 ± 4, 365 ± 10 and 164 ± 11 mg∙kg−1 (n = 3) for Cu, Pb and Zn, respectively. Indicative values for amounts of analytes extractable from the RM using the SBET procedure were not available and, unfortunately, there are no certified reference materials available for this extraction.

3. Results and Discussion

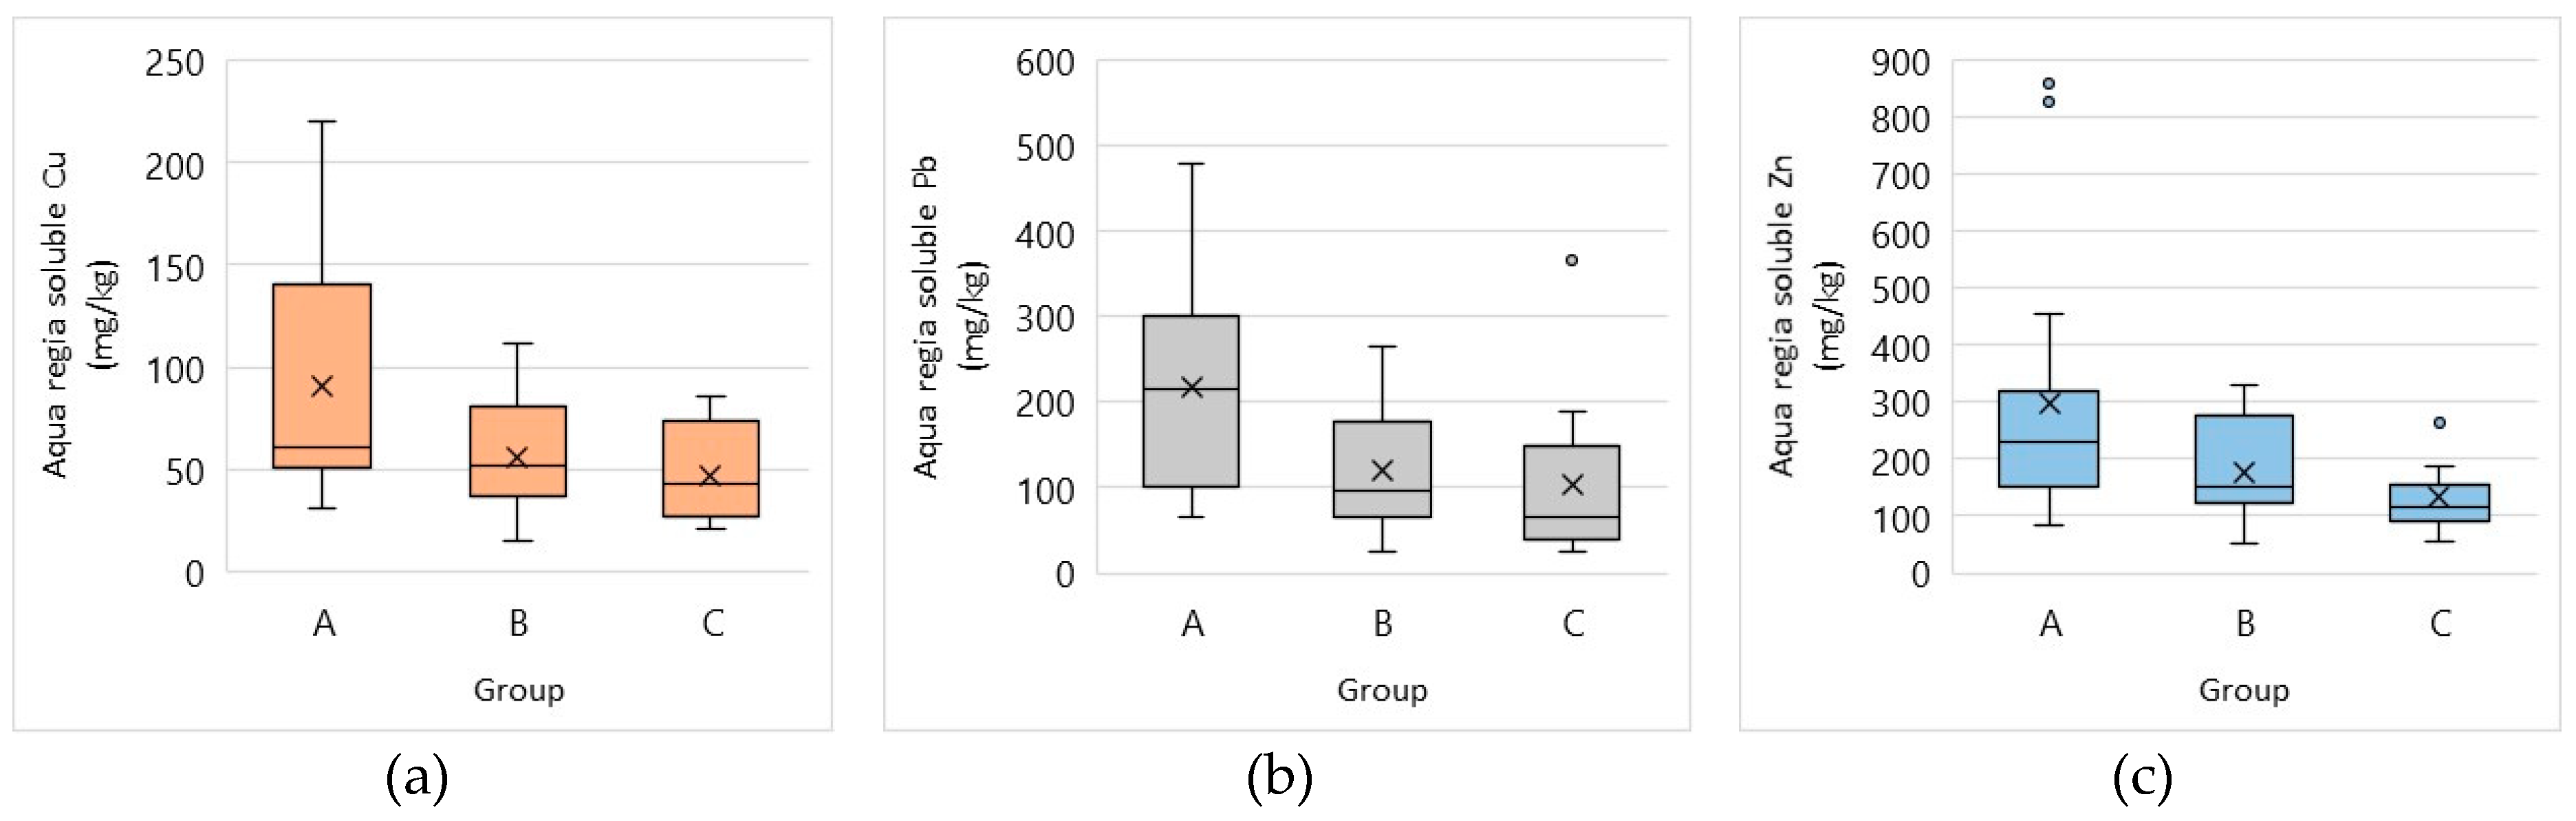
3.1. Pseudototal PTE Concentrations

Aqua regia soluble PTE concentrations in the soils from Scottish schools are shown in Table 2, together with some reference values.
Mean concentrations of copper, lead and zinc were generally towards the upper end of those reported in literature (Table 1) and compiled in the 2011 State of Scotland’s Soils Report [38]. Results varied widely, as might be expected given the diverse locations sampled. In the UK, land contamination is assessed using the Contaminated Land Exposure Assessment model. A preliminary (often desk based) risk assessment is followed by a generic risk assessment and then a detailed site-specific risk assessment. The Department for Environment, Food and Rural Affairs (DEFRA) has published category 4 screening levels (C4SL) for certain PTEs in soil, including lead [39] that can be used as generic assessment criteria to determine whether hazard is acceptably low or further investigation is required. Different C4SL values are recommended for different land use. The category considered most applicable to the current study was Public Open Spaces 1: grassed areas adjacent to residential housing, for which the C4SL is 630 mg·kg−1 [39]. Results were also compared with the internationally cited Dutch Target and Intervention Values [40]. Two samples—both from schools close to the centre of Glasgow—contained copper at concentrations slightly in excess of the Dutch intervention value (212 and 220 mg∙kg−1). None of the soils exceeded either the DEFRA C4SL or the Dutch intervention value for lead. Soils from two different (but also Glasgow inner city) schools contained levels of zinc above the Dutch intervention value. The concentrations found (828 and 860 mg∙kg−1) were almost twice that measured in any other sample (the next highest value was 454 mg∙kg−1). The lowest analyte concentrations were associated with soils from schools in Aberdeenshire, the Scottish Borders, and the Isle of Arran.
Soil pH ranged from 4.7 to 7.6 (mean 6.0 ± 0.7) and estimated organic matter content from 5.8 to 39.4 (mean 16.8 ± 6.7). There was no relationship between either of these parametera and the concentration of any of the PTEs studied. Inter-element correlations were evident, provided the two unusually high Zn concentrations were excluded, but were not strong (R2 values: Cu–Pb 0.5126; Cu–Zn 0.6622; Pb–Zn 0.6328).
The Central Belt contains the highest density of urbanisation in Scotland. The Glasgow area in particular was historically the industrial hub of the country and home to heavy industries including coal mining, steelmaking and shipbuilding, activities that gradually declined over the course of the 20th century. To further explore the potential influence of location on soil PTE concentrations, the schools were divided into three categories and results for each class considered separately (Figure 2):
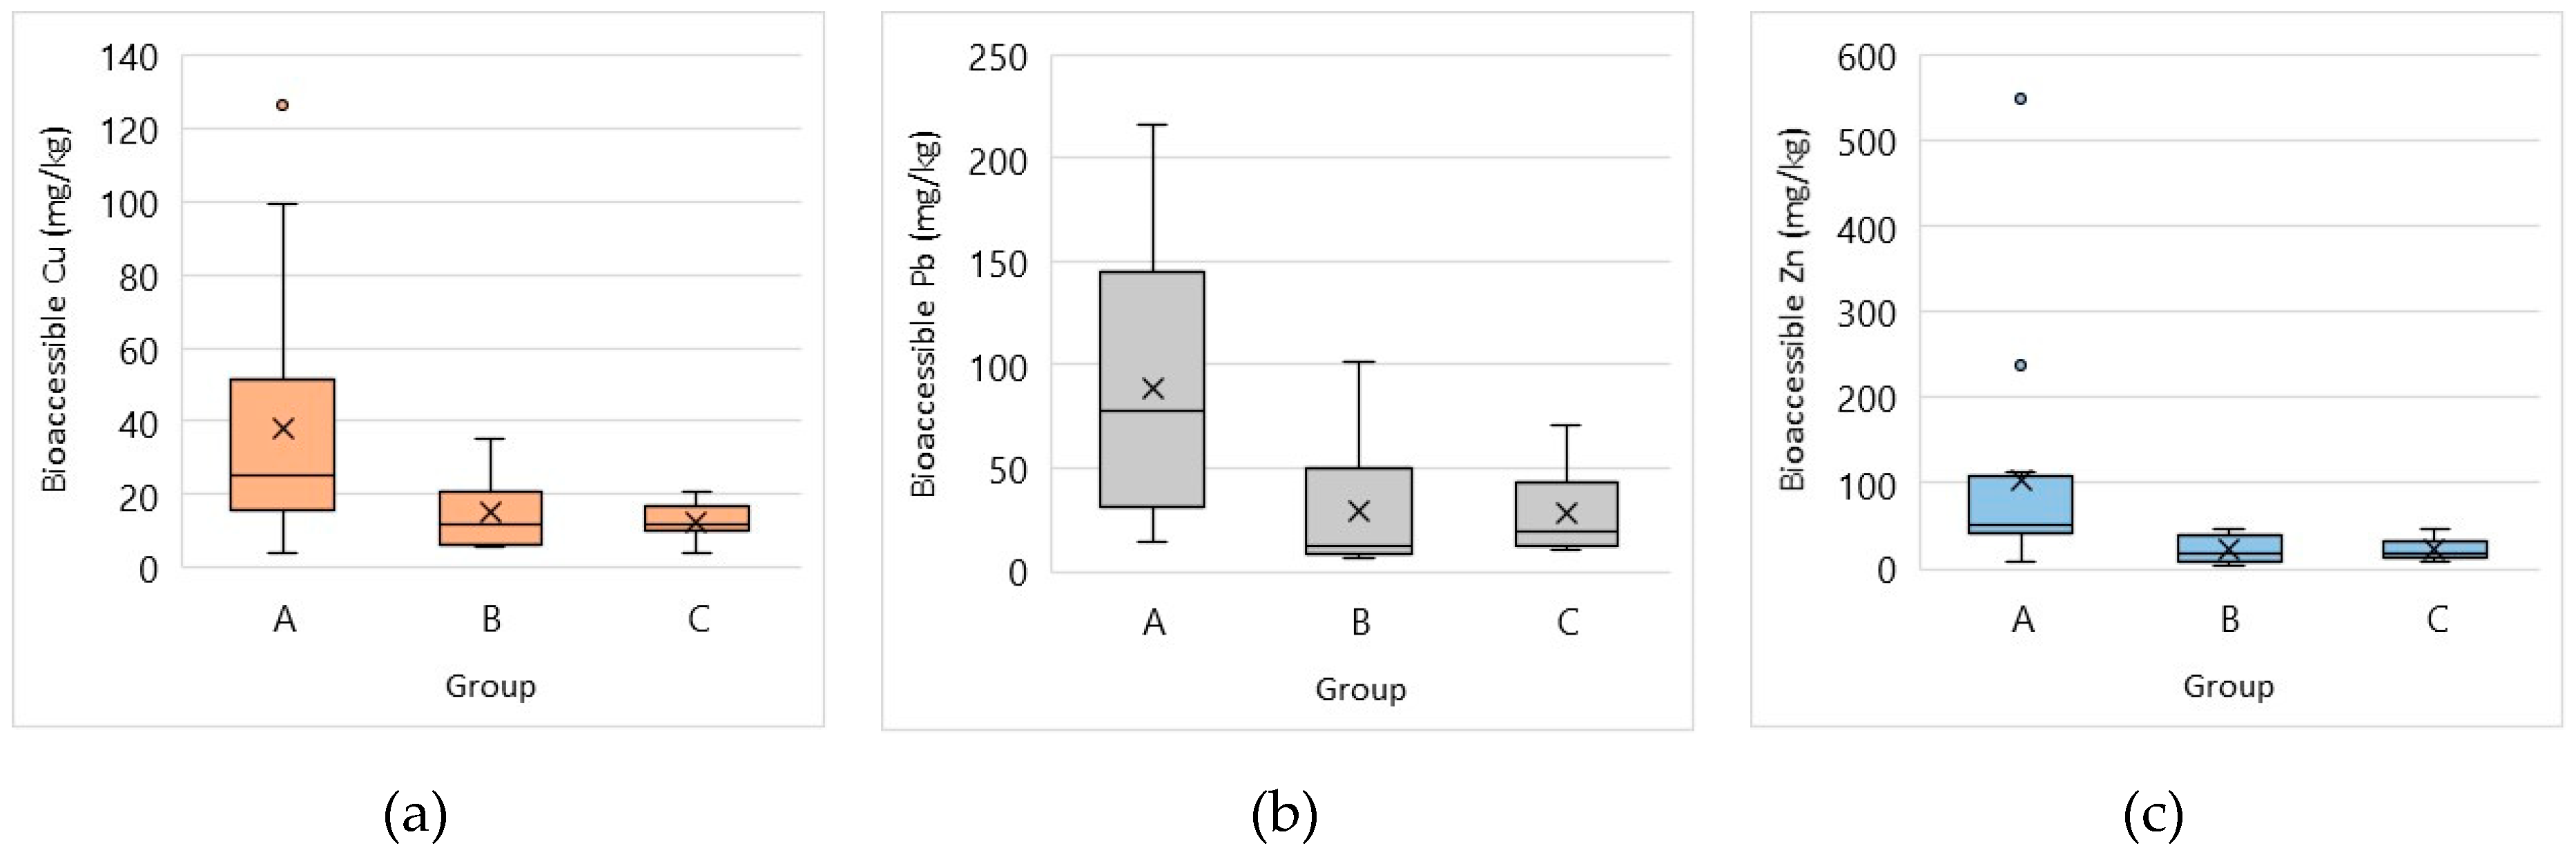
  • Group A: <10 miles from the centre of Glasgow (16 schools)
  • Group B: 10–30 miles from the centre of Glasgow (11 schools)
  • Group C: >30 miles from the centre of Glasgow (15 schools)
Mean copper concentrations were 90.7 ± 61.4 mg∙kg−1 for soils in Group A, 55.6 ± 27.1 mg∙kg−1 for Group B and 46.9 ± 21.9 mg∙kg−1 for Group C. Mean lead levels were 217 ± 120, 121 ± 78 and 102 ± 91 mg∙kg−1 for Groups A, B and C respectively, whilst mean zinc levels were 297 ± 232, 177 ± 89 and 134 ± 67 mg·kg−1. Although concentrations varied markedly within each category, levels of the “urban metals” copper, lead and zinc were clearly generally elevated in the areas of dense urbanisation and lower at more rural locations. Concentrations in Group A were broadly similar to those found in previous work on Glasgow urban soils. Madrid et al. [41] reported copper, lead and zinc concentrations of 85 ± 23, 307 ± 146, and 199 ± 81 mg·kg−1 for Glasgow Green (a major park close to the city centre), whilst Sialelli et al. [42] found 74.5 ± 42.7, 237 ± 144 and 210 ± 137 mg∙kg−1 of the same analytes in a suite of 20 soil samples from across the city (14 from parks and 6 from roadsides). Higher levels of lead (659 ± 477 mg∙kg−1, n = 27) were reported by Farmer et al. [43]. However, they used total digestion (HNO3 + HF + H2O2) and sampled from sites known to exceed the UK Soil Guideline Values in force at that time for at least one of arsenic, chromium or lead.

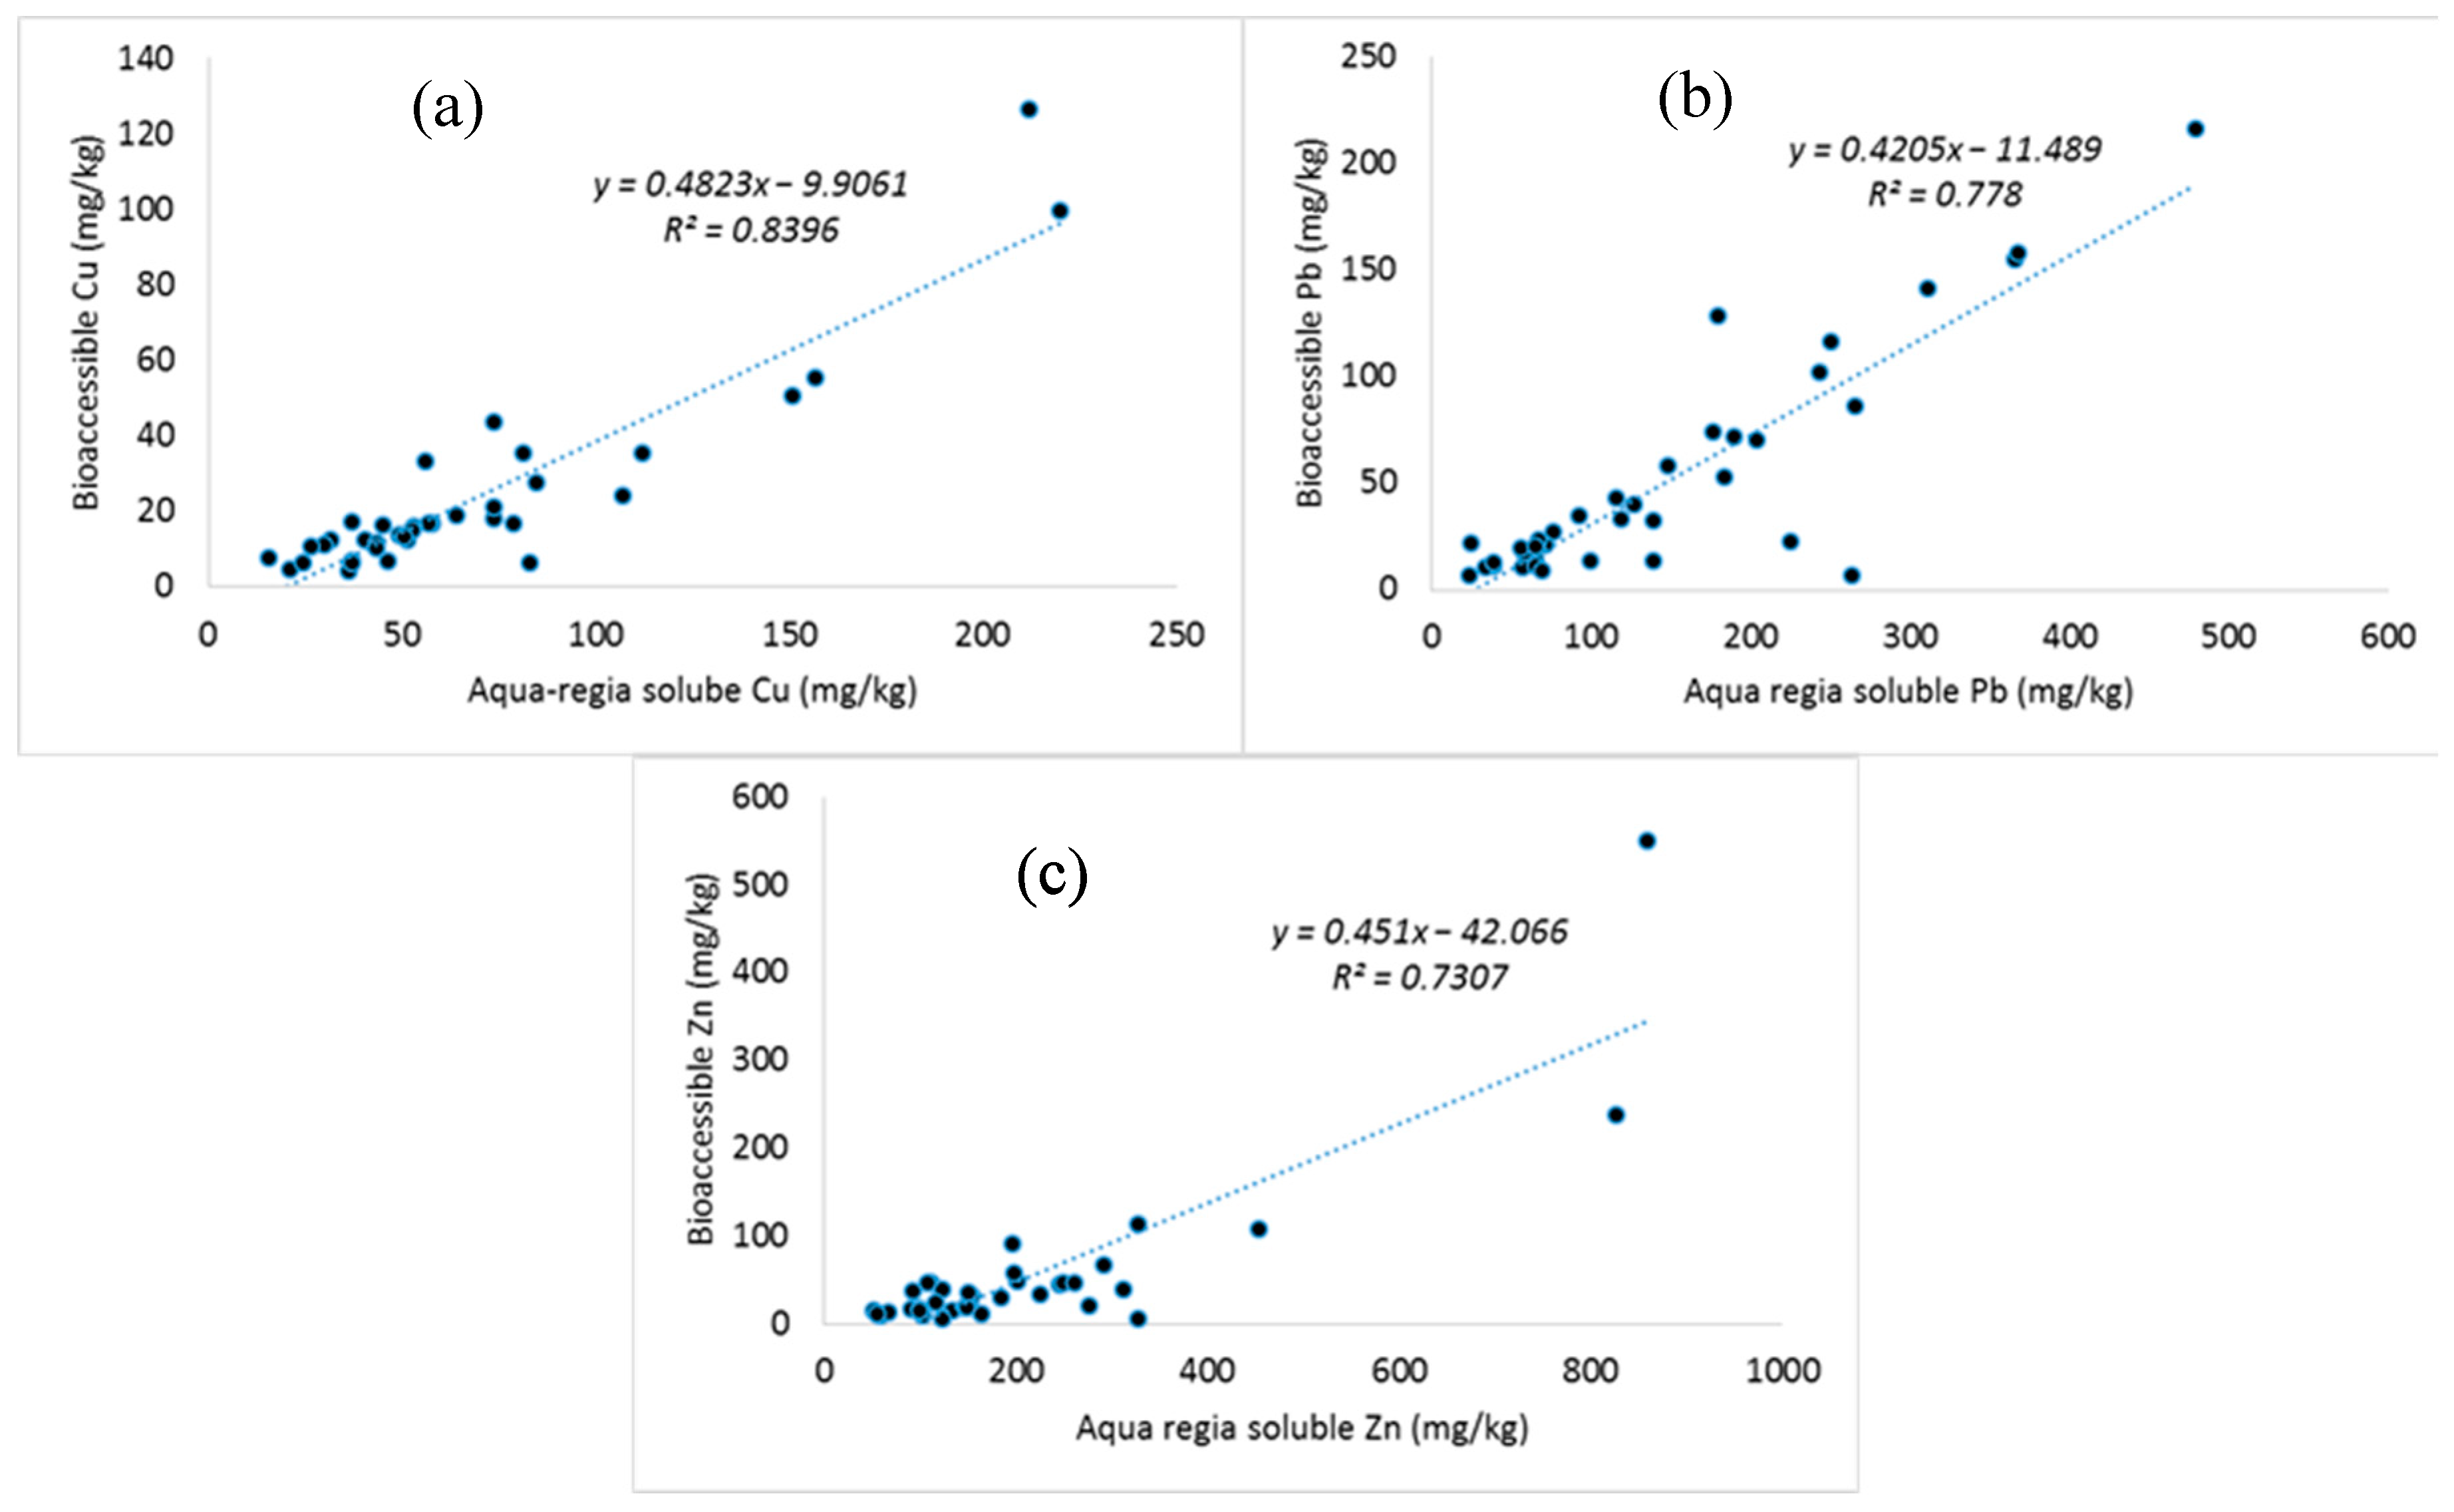
3.2. Bioaccessible PTE Concentrations

Bioaccessible PTE concentrations in soils from Scottish schools are shown in Table 3, together with results from literature studies featuring playground soil. Results again covered extremely wide concentration ranges. Comparison with literature is limited by the use of different extraction protocols by different research groups. However, the mean bioaccessible copper levels in soils from Scottish schools were higher than in playground soils from Madrid [23] and much higher than those reported in Baghdad [24]. Lead levels were higher than in Madrid [23] or Hermosillo [14] and much higher than in Baghdad [24], but broadly similar to playgrounds and schoolyards in NE England [24] and Lisbon [4]. Zinc concentrations were of the same order as in the previous studies.
The relationships between bioaccessible and pseudototal PTE concentrations are shown in Figure 3. It can be seen that, as the amount of PTEs present in the soil increased, the concentration that was bioaccessible also increased. A strong positive correlation between total and bioaccessible lead (as estimated by the unified bioaccessibility test gastric phase) has been noted previously in urban soils from Glasgow, London, Northampton and Swansea [44]. The bioaccessible fraction (Bf) was calculated using Equation (1).
%Bf = bioaccessible concentration/pseudototal concentration × 100
The Bf for copper ranged from 7.2% to 59.4% (mean 30.8%); for lead from 2.4% to 82.7% (mean 42.3%); and for zinc from 1.7% to 63.8% (mean 21.1%). Previous studies also found that the bioaccessible lead fraction was highly variable in soil samples collected from the Glasgow area, e.g., 23%–77% (mean 52%) [43] and 20%–92% (mean 49%) [44].
As with pseudototal concentrations, proximity to Scotland’s former industrial heart also influenced the levels of bioaccessible copper, lead and zinc (Figure 4). Mean bioaccessible copper concentrations were 38.0 ± 35.5 mg∙kg−1 for soils in Group A, 15.1 ± 11.2 mg∙kg−1 for Group B and 12.6 ± 4.7 mg∙kg−1 for Group C. Mean bioaccessible lead levels were 88.5 ± 64.0, 29.5 ± 33.2 and 27.8 ± 19.9 mg∙kg−1 for Groups A, B and C respectively, whilst mean zinc levels were 104 ± 140, 21.5 ± 14.8 and 22.8 ± 11.7 mg∙kg−1. Although soils in Group A always contained higher average bioaccessible PTE levels, differences between samples in Group B (10–30 miles from the centre of Glasgow) and Group C (>30 miles from the centre of Glasgow) were less marked that for the pseudototal concentrations.
Bioaccessible copper, lead and zinc concentrations in Glasgow urban soils (parks and roadside) estimated using the physiologically based extraction test [42] were 24.4 ± 13.5, 80.9 ± 42.9 and 36.6 ± 30.2 mg∙kg−1 respectively. Considerably higher bioaccessible lead values have been measured in soils from the Glasgow area, e.g., 418 mg∙kg−1 [44] but the sites studied were selected specifically because they were known to be impacted by PTEs [43] and so are not necessarily representative of urban background levels.

3.3. Health Risk Assessment

The environmental health risk to children in regular contact with the soils studied was assessed using a similar approach to that of Elom et al. [24]. Estimated oral daily intake (DI) rates were calculated using Equation (2).
DI = (BC × SIR × EF)/BW
where BC is the PTE concentration in the soil; SIR is the soil ingestion rate (50 mg∙day−1 as recommended by the USEPA [45]); EF is the exposure frequency (0.022, corresponding to 1 hour per school day over a 38-week school year); and BW is body weight (37 kg, the average weight of an 11-year-old child, with 11 being the youngest age at which pupils generally transition to secondary education in Scotland). Results, presented in Table 4, were compared with tolerable daily intake values. The Joint FAO/WHO Expert Committee on Food Additives (JECFA) has recommended a provisional maximum tolerable daily intake (PMTDI) of 0.5 mg per kg of body weight per day for copper [46] and a PMTDI of 0.3 mg·kg−1BW/day for zinc [46] but has withdrawn the former provisional tolerable weekly intake value for lead of 25 μg·kg−1BW since new evidence considered in 2011 suggested that it could no longer be considered health protective [47]. The more conservative value of 0.03 μg·kg−1BW/day (equivalent to 30 ng·kg−1BW/day) used by Reis et al. [4] was therefore used in the current study.
Levels of copper and zinc in the school soils were orders of magnitude below that required to reach either element’s PMTDI by oral ingestion (Table 4). Lead is considerably more toxic. However, the highest DI calculated was 14 ng·kg−1BW/day based on pseudototal lead concentrations, or 6.4 ng·kg−1BW/day based on bioaccessible lead concentrations, well below the 30 ng·kg−1BW/day reference value at which dietary intake of lead is considered negligible [4,47]. A few samples contained sufficient bioaccessible lead to exceed 1/10th of the reference value, i.e., they could potentially provide a DI > 3 ng·kg−1BW/day. All of these samples originated from schools in Group A (<10 miles from the centre of Glasgow) and several were from schools located close to major trunk roads or motorways, which may be a (historical) point source of lead.

4. Conclusions

The Soils in Scottish Schools project allowed secondary school pupils across Scotland to gain an appreciation of soil science and take part in scientific research through the sampling of soils from their local environment for trace element analysis. The pseudototal and bioaccessible concentrations of copper, lead and zinc in samples taken from the school grounds varied markedly, as would be expected given the diverse locations sampled across the country. Generally, higher analyte concentrations were associated with locations close to Scotland’s main urban conurbation in and around Glasgow, with the lowest concentrations in areas further from the city. Although concentrations of copper and zinc at a few inner-city locations slightly exceeded Dutch intervention values, none of the soils contained lead at levels in excess of either the Dutch intervention value or the Category 4 screening level published by the UK Department of Environment, Food and Rural Affairs. Correlations were found between pseudototal and bioaccessible concentrations for all three analytes. Lead was the most available of the elements studied, followed by copper and then zinc.
Estimated oral intake of copper and zinc through accidental ingestion of the school soils was orders of magnitude below tolerable daily intake values. Lead was of greater potential concern since the element is considerably more toxic. However, estimated oral intake was always less than the 30 ng·kg−1BW/day level, below which health impact is considered negligible [4]. There is therefore no evidence of significant risk to school children who use the areas studied for recreation. Nevertheless, further study of school and playground soils is warranted, especially in areas currently or historically impacted by potentially toxic elements, and it is recommended that such studies include bioaccessibility testing to give more accurate estimation of children’s exposure and thus support improved health risk assessment.
Overall, this project has provided a snapshot of copper, lead and zinc levels at a wide selection of urban and rural sites in Scotland. It contributes towards improved understanding of the impact of human activities on Scotland’s soils and serves as a useful benchmark for future studies focused on PTE bioaccessibility.

Author Contributions

Conceptualization, C.M.D. and D.W.; formal analysis and investigation, C.D., B.P. and S.J.S.; writing—original draft preparation, C.M.D., C.M. and D.W.; writing—review and editing, C.M.D.; supervision, C.M.D. and D.W.; project administration, D.W. and C.M.; funding acquisition, D.W. and C.M.D.

Funding

The Soils in Scottish Schools Project was funded primarily by an award from the Royal Society of Chemistry Outreach Fund (Large Grants Scheme), supplemented by contributions from the Royal Society of Chemistry Analytical Division Scottish Region and the Royal Society of Chemistry Glasgow and West Scotland Local Section.

Acknowledgments

The authors wish to thank Alexander Clunie for assistance with ICP-MS analysis, and Kara Burke and Fraser J. Scott for assistance with development of the educational resources associated with the project.

Conflicts of Interest

The authors declare no conflict of interest.

References

  1. Wong, C.S.C.; Li, X.D.; Thornton, I. Urban environmental geochemistry of trace metals. Environ. Pollut. 2006, 142, 1–16. [Google Scholar] [CrossRef] [PubMed]
  2. Wong, J.W.C.; Mak, N.K. Heavy metal pollution in children playgrounds in Hong Kong and its health implications. Environ. Toxicol. 1997, 18, 109–115. [Google Scholar] [CrossRef]
  3. Acosta, J.A.; Faz Cano, A.; Arocena, J.M.; Debela, F.; Martinez-Martinez, S. Distribution of metals in soil particle size fractions and its implication to risk assessment of playgrounds in Murcia City (Spain). Geoderma 2009, 149, 101–109. [Google Scholar] [CrossRef]
  4. Reis, A.P.; Patinha, C.; Wragg, J.; Dias, A.C.; Cave, M.; Sousa, A.J.; Batista, M.J.; Prazeres, C.; Costa, C.; Ferreira de Silva, E.; et al. Urban geochemistry of lead in gardens, playgrounds and schoolyards of Lisbon, Portugal: Assessing exposure and risk to human health. Appl. Geochem. 2014, 44, 45–53. [Google Scholar] [CrossRef]
  5. Mugosa, B.; Djurovic, D.; Pirnat, A.; Bulat, Z.; Barjaktarovic-Labovic, S. Children’s health risk assessment based on the content of toxic metals Pb, Cd, Cu and Zn in urban soil samples of Podgorica, Montenegro. Vojnosanit. Pregl. 2015, 72, 807–812. [Google Scholar] [CrossRef] [PubMed]
  6. Sapcanin, A.; Cakal, M.; Jacimovic, Z.; Pehlic, E.; Jancan, G. Soil pollution fingerprints of children playgrounds in Sarajevo city, Bosnia and Herzegovina. Environ. Sci. Pollut. R. 2017, 24, 10949–10954. [Google Scholar] [CrossRef] [PubMed]
  7. Gredilla, A.; de Vallejuelo, S.F.O.; Gomez-Nubla, L.; Carrero, J.A.; de Leao, F.B.; Madariaga, J.M.; Silva, L.F.O. Are children playgrounds safe play areas? Inorganic analysis and lead isotope ratios for contamination assessment in recreational (Brazilian) parks. Environ. Sci. Pollut. R. 2017, 24, 24333–24345. [Google Scholar] [CrossRef] [PubMed]
  8. Guney, M.; Zagury, G.J.; Dogan, N.; Onay, T.T. Exposure assessment and risk characterization from trace elements following soil ingestion by children exposed to playgrounds, parks and picnic areas. J. Hazard Mater. 2010, 182, 656–664. [Google Scholar] [CrossRef] [PubMed]
  9. Taylor, M.P.; Camenzuli, D.; Kirstensen, L.J.; Forbes, M.; Zahran, S. Environmental lead exposure risks associated with children’s outdoor playgrounds. Environ. Pollut. 2013, 178, 447–454. [Google Scholar] [CrossRef] [PubMed]
  10. Ajmone-Marsan, F.; Biasioli, M. Trace elements in soils of urban areas. Water Air Soil Pollut. 2010, 213, 121–143. [Google Scholar] [CrossRef]
  11. McIlwaine, R.; Doherty, R.; Cox, S.F.; Cave, M. The relationship between historical development and potentially toxic element concentrations in urban soils. Environ. Pollut. 2017, 220, 1036–1049. [Google Scholar] [CrossRef] [PubMed]
  12. Ottesen, R.T.; Alexander, J.; Langedal, M.; Haugland, T.; Hoygaard, E. Soil pollution in day-care centers and playgrounds in Norway: National action plan for mapping and remediation. Environ. Geochem. Health 2008, 30, 623–637. [Google Scholar] [CrossRef]
  13. Rozanski, S.L.; Kwasowski, W.; Castejon, J.M.P.; Hardy, A. Heavy metal content and mobility in urban soils of public playgrounds and sport facility areas, Poland. Chemosphere 2018, 212, 456–466. [Google Scholar] [CrossRef] [PubMed]
  14. Gonzalez-Grijalva, B.; Meza-Figueroa, D.; Romero, F.M.; Roble-Morua, A.; Meza-Montenegro, M.; Garcia-Rico, L.; Ochoa-Contreras, R. The role of soiL·mineralogy on oral bioaccessibility of lead: Implications for land use and risk assessment. Sci. Total Environ. 2019, 657, 1468–1479. [Google Scholar] [CrossRef] [PubMed]
  15. Ljung, K.; Selinus, O.; Otabbong, E. Metals in soils of children’s urban environments in the small northern European city of Uppsala. Sci. Total Environ. 2006, 366, 749–759. [Google Scholar] [CrossRef]
  16. De Miguel, E.; Iribarren, I.; Chacon, E.; Ordonez, A.; Charlesworth, S. Risk-based evaluation of the exposure of children to trace elements in playgrounds of Madrid (Spain). Chemosphere 2007, 66, 505–513. [Google Scholar] [CrossRef] [PubMed]
  17. Marjanovic, M.D.; Vukcevic, M.M.; Antonovic, D.G.; Dimitrijevic, S.I.; Jovanovic, D.M.; Matavulj, M.N.; Ristic, M.D. Heavy metal concentration in soils from parks and green areas in Belgrade. J. Serb. Chem. Soc. 2009, 74, 697–706. [Google Scholar] [CrossRef]
  18. Massas, I.; Ehaliotis, C.; Kalivas, D.; Panagopoulou, G. Concentration and availability indicators of soil heavy metals; the case of children’s playgrounds in the City of Athens (Greece). Water Air Soil Pollut. 2010, 212, 51–63. [Google Scholar] [CrossRef]
  19. Figueirido, A.M.G.; Tocchini, M.; dos Santos, T.F.S. Metals in playground soils of Sao Paulo city, Brazil. Procedia Environ. Sci. 2011, 4, 303–309. [Google Scholar] [CrossRef]
  20. Mostert, M.M.R.; Ayoko, G.A.; Kokot, S. Multi-criteria ranking and source identification of metals in public playgrounds in Queensland, Australia. Geoderma 2012, 173–174, 173–183. [Google Scholar] [CrossRef]
  21. Kootbodien, T.; Mathee, A.; Naicker, N.; Moodley, N. Heavy metal contamination in a school vegetable garden in Johannesburg. S. Afr. Med. J. 2012, 102, 226–227. [Google Scholar] [PubMed]
  22. Glorennec, P.; Lucas, J.-P.; Mandin, C.; Le Bot, B. French children’s exposure to metals via ingestion of indoor dust, outdoor playgrounds dust and soil: Contamination data. Environ. Int. 2012, 45, 129–134. [Google Scholar] [CrossRef] [PubMed]
  23. De Miguel, E.; Mingot, J.; Chacon, E.; Charlesworth, S. The relationship between soil geochemistry and the bioaccessibility of trace elements in playground soil. Environ. Geochem. Health 2012, 34, 677–687. [Google Scholar] [CrossRef] [PubMed]
  24. Elom, N.I.; Entwistle, J.A.; Dean, J.R. How safe is the playground? An environmental health risk assessment of As and Pb levels in school playing fields in NE England. Environ. Chem. Lett. 2013, 11, 343–351. [Google Scholar] [CrossRef]
  25. Tume, P.; King, R.; Gonzalez, E.; Bustamante, G.; Reverter, F.; Roca, N.; Bech, J. Trace element concentrations in schoolyard soils from the port city of Talcahuano. J. Geochem. Explor. 2014, 147, 229–236. [Google Scholar] [CrossRef]
  26. Hamad, S.H.; Schauer, J.J.; Shafer, M.M.; Al-Rheem, E.A.; Skaar, P.S.; Heo, J.; Tejedo-Tejedor, I. Risk assessment of total and bioavailable potentially toxic elements (PTEs) in urban soils of Baghdad-Iraq. Sci. Total Environ. 2014, 494, 39–48. [Google Scholar] [CrossRef] [PubMed]
  27. Stajic, J.M.; Milenkovic, B.; Pucarevic, M.; Stojic, N.; Vasiljevic, I.; Nikezic, D. Exposure of school children to polycyclic aromatic hydrocarbons, heavy metals and radionuclides in the urban soil of Kragujevac city, Central Serbia. Chemosphere 2016, 146, 68–74. [Google Scholar] [CrossRef] [PubMed]
  28. Joy, O.; Uchenna, A. Accumulation and risk assessment of heavy metal contents in school playgrounds in Port Hardcourt Metropolis, Rivers State, Nigeria. J. Chem. Health Saf. 2017, 24, 11–22. [Google Scholar] [CrossRef]
  29. Akinwunmi, F.; Akinhanmi, T.F.; Atobatele, Z.A.; Adewole, O.; Odekunle, K.; Arogundade, L.A.; Odukoya, O.O.; Olayiwola, O.M.; Ademuyiwa, O. Heavy metal burdens of public primary school children related to playground soils and classroom dusts in Ibadan North-West local government area, Nigeria. Environ. Toxicol. Pharmacol. 2017, 49, 21–26. [Google Scholar] [CrossRef] [PubMed]
  30. Rodriguez-Oroz, D.; Vidal, R.; Fernandoy, F.; Lambert, F.; Quiero, F. Metal concentrations and source identification in Chilean public children’s playgrounds. Environ. Monit. Assess. 2018, 190, 703. [Google Scholar] [CrossRef] [PubMed]
  31. Ljung, K.; Oomen, A.; Duits, M.; Selinus, O.; Berglund, M. Bioaccessibility of metals in urban playground soils. J. Environ. Sci. Health A 2007, 42, 1241–1250. [Google Scholar] [CrossRef] [PubMed]
  32. Filippelli, G.M.; Adamic, J.; Nichols, D.; Shukle, J.; Frix, E. Mapping the urban lead exposome: A detailed analysis of soil metal concentrations at the household scale using citizen science. Int. J. Environ. Res. Public Health 2018, 15, 1531. [Google Scholar] [CrossRef] [PubMed]
  33. Wilson, S.; Aber, A.; Ravichandran, V.; Wright, L.; Muhammad, O. Soil contamination in urban communities impacted by industrial pollution and goods movement activities. Environ. Justice 2017, 10, 16–22. [Google Scholar] [CrossRef]
  34. Jiao, Y.Q.; Bower, J.K.; Im, W.; Basta, N.; Obrycki, J.; Al-Hamdan, M.Z.; Wilder, A.; Bollinger, C.E.; Zhang, T.W.; Hatten, L.S.; et al. Application of citizen science risk communications tools in a vulnerable urban community. Int. J. Environ. Res. Public Health 2016, 13, 11. [Google Scholar] [CrossRef] [PubMed]
  35. Rossiter, D.G.; Liu, J.; Carlisle, S.; Zhu, A.X. Can citizen science assist digital soil mapping? Geoderma 2015, 259, 71–80. [Google Scholar] [CrossRef]
  36. United States Environment Protection Agency. Standard Operating Procedure for an In Vitro Bioaccessibility Assay for Lead in Soil; 9200.2-86; Environment Agency: Washington, DC, USA, 2012.
  37. Davidson, C.M.; Urquhart, G.J.; Ajmone-Marsan, F.; Biasioli, M.; Duarte, A.C.; Diaz-Barrientos, E.; Grcman, H.; Hossack, I.; Hursthouse, A.S.; Madrid, L.; et al. Fractionation of potentially toxic elements in urban soils from five European cities by means of a harmonized sequential extraction procedure. Anal. Chim. Acta 2006, 565, 63–72. [Google Scholar] [CrossRef]
  38. Dobbie, K.E.; Bruneau, P.M.C.; Towers, W. (Eds.) The State of Scotland’s Soil; Natural Scotland, 2011. Available online: https://www.sepa.org.uk/media/138741/state-of-soil-report-final.pdf (accessed on 11 March 2019).
  39. Department for Environment, Food and Rural Affairs. SP1010: Development of Category 4 Screening Levels for Assessment of Land Affected by Contamination—Policy Companion Document; Department for Environment, Food and Rural Affairs: London, UK, 2014.
  40. Ministry of Housing, Spatial Planning and Environment. Circular on Target and Intervention Values for Soil Remediation; Netherlands Government Gazette: Hague, Netherlands, 2000.
  41. Madrid, L.; Diaz-Barrientos, E.; Ruiz-Cortes, E.; Reinoso, R.; Biasioli, M.; Davidson, C.M.; Duarte, A.C.; Grcman, H.; Hossack, I.; Hursthouse, A.S.; et al. Variability in concentration of potentially toxic elements in urban parks from six European cities. J. Environ. Monit. 2006, 8, 1158–1165. [Google Scholar] [CrossRef] [PubMed]
  42. Sialelli, J.; Urquhart, G.J.; Davidson, C.M.; Hursthouse, A.S. Use of physiologically based extraction test to estimate the human bioaccessibility of potentially toxic elements in urban soils from the city of Glasgow, UK. Environ. Geochem. Health 2010, 32, 517–527. [Google Scholar] [CrossRef]
  43. Farmer, J.G.; Broadway, A.; Cave, M.R.; Wragg, J.; Fordyce, F.M.; Graham, M.C.; Ngwenya, B.T.; Bewley, R.J.F. A lead isotopic study of the human bioaccessibility of lead in urban soils from Glasgow, Scotland. Sci. Total Environ. 2011, 409, 4958–4965. [Google Scholar] [CrossRef]
  44. Appleton, J.D.; Cave, M.R.; Wragg, J. Modelling lead bioaccessibility in urban topsoils based on data from Glasgow, London, Northampton and Swansea, UK. Environ. Pollut. 2012, 171, 265–272. [Google Scholar] [CrossRef]
  45. United States Environment Protection Agency. Highlights of the Child-Specific Exposure Handbook (Final Report); EPA/600/R-08/135; Environment Agency: Washington, DC, USA, 2009.
  46. JEFCA. Evaluation of Certain Food Additives and Contaminants: 26th Report of the Joint FAO/WHO Expert Committee on Food Additives; Technical Report Series 683; WHO: Geneva, Switzerland, 1982. [Google Scholar]
  47. JEFCA. Safety Evaluation of Certain Food Additives and Contaminants: 73rd Report of the Joint FAO/WHO Expert Committee on Food Additives; Technical Report Series 960; WHO: Geneva, Switzerland, 2011. [Google Scholar]
Figure 1. Map showing locations of schools submitting soil samples.
Minerals 09 00173 g001
Figure 2. Variation in concentrations of copper (a), lead (b) and zinc (c) with proximity to Glasgow City Centre (A: <10 miles; B: 10–30 miles; C >30 miles).
Minerals 09 00173 g002
Figure 3. Relationships between pseudototal (aqua regia soluble) PTE and bioaccessible PTE concentrations for copper (a), lead (b) and zinc (c).
Minerals 09 00173 g003
Figure 4. Variation in bioaccessible concentrations of copper (a), lead (b) and zinc (c) with proximity to Glasgow City Centre (A: <10 miles; B: 10–30 miles; C >30 miles).
Minerals 09 00173 g004
Table 1. Concentrations of copper, lead and zinc in some playground soils worldwide (mg∙kg−1).
LocationSampling Site(s)CuPbZnRef.
Hong Kong7 playgrounds28.4195237[2]
Uppsala (Sweden)25 playgrounds24.925.584.0[15]
Madrid (Spain)20 playgrounds17.030.064.0[16]
Trondheim (Norway)320 day-care centers34.535.098.0[12]
Belgrade (Serbia)15 parks/playgrounds46.3299174[17]
Murcia City (Spain)playgrounds in 4 parks9.318.726.9[3]
Athens (Greece)70 playgrounds43.4110174[18]
Istanbul (Turkey)17 playgrounds59.87.153.0[8]
Sao Paulo (Brazil)12 playgrounds in parksndnd81.5[19]
Queensland (Australia)50 playgrounds in parks258020[20]
Johannesburg (S. Africa)school vegetable garden046.8236[21]
France315 playgrounds<2627nd[22]
Madrid (Spain)16 playgrounds21.026.082.0[23]
NE England (UK)12 school playing fieldsnd298nd[24]
Port Pirie (S. Australia)4 playgrounds62.57073260[9]
Talcahuano (Chile)38 schoolyards51.249.2246[25]
Baghdad (Iraq)11 playgrounds164.467[26]
Lisbon (Portugal)19 sites including playgrounds and schoolyardsnd108nd[4]
Kragujevac (Serbia)14 kindergartens28.126.388.2[27]
Podgorica (Montenegro)31 playgrounds52.985.9113[5]
Port Harcourt (Nigeria)10 school playgrounds8.526.9880.4[28]
Ibadan (Nigeria)6 urban school playgrounds2355450[29]
Sarajevo (Bosnia and Herzegovina)4 playgrounds24.233.673.2[6]
Rio Grande do Sul (Brazil)19 playgrounds3.4930.635.7[7]
Warsaw (Poland)42 playgrounds/sports areas35.029.596.5[13]
Bydgoszcz (Poland)36 playgrounds/sports areas34.625.576.4[13]
Biobio region (Chile)10 playgrounds31.517.663.7[30]
Hermosillo (Mexico)15 playgrounds54.949.1261[14]
Results are mean or median values; nd—not determined; values estimated from Figures; excluding one unusually high value of >3000 mg·kg−1.
Table 2. Concentrations of copper, lead and zinc in soils from Scottish schools (mg∙kg−1).
ParameterCu PbZnReference
Mean 65.8 ± 46151 ± 111208 ± 169This study
Median52.9118154
Minimum15.624.652.5
Maximum220479860
NSIS0.19–63.93.9–2394.0–224[38]
UKSHS (rural)2.27–96.72.6–2942.63–211[38]
UKSHS (urban)15.5–62.739.8–29051–212[38]
UK DEFRA (C4SL) 630 [39]
VROM (target)3685140[40]
VROM (intervention)190530720[40]
Results are mean values ±1 standard deviation, n = 42; NSIS—National Soil Inventory of Scotland; UKSHS—United Kingdom Soil and Herbage Survey; UK DEFRA (C4SL)—United Kingdom Department of Environment, Food and Rural Affairs Category 4 screening level; VROM—Ministry of Housing, Spatial Planning and the Environment (The Netherlands).
Table 3. Bioaccessible copper, lead and zinc in soils from Scottish schools (mg∙kg−1, n = 37) together with results from literature.
ParameterCu PbZnExtractionReference
Mean 22.9 ± 25.351.2 ± 52.553.3 ± 94.0SBETThis study
Median15.426.731.2
Minimum3.946.294.38
Maximum126216549
Madrid9.715.338.5SBET[23]
NE Englandnd38.7 ndUBMG[24]
Baghdad0.50.443USP[26]
Lisbonnd65 ndUBMG[4]
Hermosillond25.3 ndPBETG[14]
Results are mean values ±1 standard deviation, n = 37; nd—not determined; literature results are mean values except for those marked which are median values; calculated from data presented in the article; UBMG—unified bioaccessibility test gastric phase; USP—United States Pharmacopeia method; PBETG—physiologically based extraction test gastric phase.
Table 4. Estimated daily intake of copper, lead and zinc from ingestion of soil (ng·kg−1BW/day).
School Sample IDDaily Intake
(Based on Pseudototal Concentrations)
Daily Intake
(Based on Bioaccessible Concentrations)
CuPbZnCuPbZn
16.511143.04.63.2
24.79.39.81.64.23.4
31.61.83.50.430.510.70
46.37.58.73.83.42.0
51.21.72.80.360.571.1
62.43.44.51.01.30.57
71.32.02.70.330.680.46
80.631.21.80.120.340.26
91.12.83.30.121.01.4
102.56.17.30.812.11.3
111.52.34.00.400.790.40
124.511251.54.77.1
132.43.54.60.490.980.93
141.9147.40.556.41.4
153.27.96.00.712.61.4
160.731.02.00.180.300.36
171.73.86.70.481.20.96
182.25.57.80.521.61.4
193.37.39.31.03.01.2
201.55.34.40.352.20.56
211.54.43.00.381.70.47
222.25.65.50.622.10.87
232.57.89.80.180.190.16
240.890.83.00.320.640.45
250.791.21.70.310.370.30
261.11.93.10.200.420.24
271.41.73.70.200.300.13
281.33.04.50.290.380.54
290.621.24.3nanana
301.76.75.90.480.661.7
311.12.04.90.180.320.30
322.5118.2nanana
331.62.18.20.460.270.58
341.34.23.70.470.401.1
35nananananana
361.62.84.7nanana
370.952.13.20.360.621.4
382.25.4261.33.816
390.460.71.60.220.190.41
400.922.52.4nanana
411.74.25.90.980.962.7
421.12.04.50.510.591.0
431.76.77.0nanana
Where na = not analysed because too little soil was submitted.

