Commentary

Breaking Preconceptions: Thin Section Petrography For Ceramic Glaze Microstructures

1
Dept. de Ciències de l’Antiguitat i Edad Mitjana, Facultat de Filosofia i Lletres, Universitat Autònoma de Barcelona (UAB), Edifici B, 08193 Bellaterra, Spain
2
Institut Català d’Arqueologia Clàssica (ICAC), Unitat d’Estudis Arqueomètrics (UEA), Plaça d’en Rovellat, s/n, 43003 Tarragona, Spain
3
U Science Tech, MECAMAT group, University of Vic—Central University of Catalonia, C. De la Laura 13, 08500 Catalonia, Spain
4
Departament de Geologia, Universitat Autònoma de Barcelona, 08193 Bellaterra, Spain
5
Institute de Ciència de Materials de Barcelona (ICMAB-CSIC), Campus de la UAB, 08193 Bellaterra, Spain
6
Renishaw S.p.A Via dei Prati 5, 10044 Pianezza (TO), Italia
7
Departament de Mineralogia, Petrologia i Geologia Aplicada, Facultat de Ciències de la Terra, Universitat de Barcelona, Martí i Franquès s/n, 08028 Barcelona, Spain
*
Author to whom correspondence should be addressed.
Minerals 2019, 9(2), 113; https://doi.org/10.3390/min9020113
Submission received: 16 December 2018 / Revised: 1 February 2019 / Accepted: 12 February 2019 / Published: 15 February 2019
(This article belongs to the Special Issue Minerals and Crystals in Glass)

Abstract

:
During the last thirty years, microstructural and technological studies on ceramic glazes have been essentially carried out through the use of Scanning Electron Microscopy (SEM) combined with energy dispersive X-ray analysis (EDX). On the contrary, optical microscopy (OM) has been considered of limited use in solving the very complex and fine-scale microstructures associated with ceramic glazes. As the crystallites formed inside glazes are sub- and micrometric, a common misconception is that it is not possible to study them by OM. This is probably one of the reasons why there are no available articles and textbooks and even no visual resources for describing and characterizing the micro-crystallites formed in glaze matrices. A thin section petrography (TSP) for ceramic glaze microstructures does not exist yet, neither as a field of study nor conceptually. In the present contribution, we intend to show new developments in the field of ceramic glaze petrography, highlighting the potential of OM in the microstructural studies of ceramic glazes using petrographic thin sections. The outcomes not only stress the pivotal role of thin section petrography for the study of glaze microstructures but also show that this step should not be bypassed to achieve reliable readings of the glaze microstructures and sound interpretations of the technological procedures. We suggest the adoption by the scientific community of an alternative vision on glaze microstructures to turn thin section petrography for glaze microstructures into a new specialized petrographic discipline. Such an approach, if intensively developed, has the potential to reduce the time and costs of scientific investigations in this specific domain. In fact, it can provide key reference data for the identification of the crystallites in ceramic glazes, avoiding the repetition of exhaustive protocols of expensive integrated analyses.

1. Introduction

The production of glass represented one of the major achievements of humanity in science and technology. It allowed the development of a large variety of materials resulting from different processes involving the melting and the subsequent solidification of vitreous compounds. Among them, coloured or uncoloured transparent or opaque glazes were applied over ceramic bodies to decorate, waterproof, or protect the surfaces of the archaeological artefacts. Although some glazes are sometimes completely amorphous, others often contain sub- and micro-crystallites that can form during the firing process or the subsequent cooling stage due to partial or total insolubility of some compounds used in the glaze recipe. At times, the glazes can contain relics of the original crystalline compounds or crystallites formed from the deterioration processes during the burial of the pottery in archaeological sites. The crystallites resulting from the chemical composition of the glazes (including the minor components of the raw materials used) and fabrication conditions (furnace technology and melting conditions) can be characteristic for a recipe and thus a region and/or a period or production. They provide unique information on the output techniques, uses, and trades at the time of production. In other words, the crystallites are among the most important relics of the ceramic technology. During the last thirty years, microstructural and technological studies on glazes and their decorations have been traditionally carried out through the use of Scanning Electron Microscopy (SEM) that has been considered a powerful technique for investigating glaze microstructures [1,2]. In such a way, thin section petrography (TSP) has played a strongly subordinated role in the study of ceramic glaze microstructures, and its use has been limited to address marginal questions of the technological production. Because of the small sizes (often below 15 µm) of the crystallites found into glazes, optical microscopy (OM) is perceived to have limited potential for resolving the very complex and fine-scale microstructures associated with ceramic glazes. However, relevant enhancements of the level of detail at which a glaze matrix of interest can be imaged have been achieved by using OM in recent years. The use of high magnification lenses (i.e., ×100 objectives) enables users to investigate microcrystals and sub-microaggregates at a more and more deep level of detail. The vitreous matrix of glazes is transparent to the visible light; therefore, the observation of thin sections in a petrographic microscope allows to acquire 3-D information on ceramic glaze content and on any kind of crystallite regardless of its orientation and position within the glaze matrix. The aim of the present research is that of launching a critical and profitable discussion about the potential of TSP in the study of ceramic glaze microstructures. The applications here presented, ranging from methodological questions to mineralogical and technological topics, show that the use of OM can make a difference. Then, in ceramic glaze studies, the TSP step should not be bypassed to avoid missing useful information. Besides commenting on the advantages of using OM, we set up a specific methodology based on the feasibility of applying various analytical procedures directly to the thin section. The petrographic identification of the crystallites embedded in glazes by using thin sections promises benefits in reducing time and costs of the scientific investigation within this field. TSP can provide reference data for the glaze mineralogy avoiding the repetition of identification protocols involving the use of expensive characterization techniques. Similar cost savings are furnished by petrography applied to other kinds of samples, both in the geological and archaeological domains.

2. The State of the Art

Conventional optical microscopy has been one of the main tools in examining ceramic pastes of archaeological artefacts [3,4]. TSP has been used for studying pottery—typically coarse-grained ceramic fabrics—by the compositional characterization of the non-plastic inclusions in the ceramic bodies of the artefacts [5,6,7,8,9,10]. In contrast, it is less suitable for the characterization of grains in fine-grained ceramics due to the absence of distinctive coarse inclusions. However, properties such as optical activity, colour, or grain size distribution of fined-grained ceramic pastes can be used to infer technological information such as firing conditions and levigation procedures [11,12,13,14]. Beside ceramic pastes, other research questions were addressed to the methods of the fabrication of slips, decorative treatments, and methods of glazing [15,16,17,18,19]. The studies of coatings by TSP proved that their optical observation represents an easy and approachable tool to distinguish among different productions and to associate samples of different kinds to a same production or provenance area [20,21,22,23,24,25]. However, we must admit that thin section analysis has played a subordinated role in the study of glaze coatings. In fact, it has been used to identify the sequences in which finishing layers were applied [16] and to observe features such as air bubbles, cracks, or silica relicts [26] up to the characterization of the interaction layer between glaze and body [17]. With a few exceptions [17,27], OM has rarely been used to identify newly formed minerals in glazes. As a consequence, today, there is neither a specialized petrography on crystals in glazes nor research on this field or training courses specifically devoted to this speciality. Detailed information on finishing methods, glaze raw materials, composition, identity, shape, and distribution of the different crystalline phases as well as colorants are normally investigated by SEM with an energy-dispersive spectrometer (SEM-EDS), [28,29,30,31,32,33]. However, due to the fact that glass is opaque to electrons, SEM might not be the most suitable technique to investigate crystals embedded in glazes. Our pioneering studies focusing on the use of thin section samples have showed this limitation in contrast with OM that produced images much more useful to identify and interpret the processes that formed the crystallites [34,35,36,37,38]. Indeed, a very common situation in glaze microstructures is that the crystallites (either relics or neo-formed) can be found under the polished glaze surfaces. If so, they cannot be detected and analysed by SEM. In the rest of the present section, we will comment about some examples to illustrate such circumstance.
Example No. 1. Blue decorations. These decorations applied on Renaissance and Modern glazed ceramics, often contain Pb–Ca arsenates crystallites that are formed by the reaction between the arsenic and the other glaze components [33,39,40,41,42,43,44,45,46,47]. The use of thin sections in transmitted plane polarized light (TL-PPL) allows us, on the one hand, to achieve a fast overview on the application procedure of the blue decoration and, on the other, to immediately spot the crystallites (Figure 1a–c). In the transmitted light (TL) mode, we can clearly observe the distribution of the crystallites in the glaze matrix as well as their actual morphologies. As shown by Figure 1b,c, in TL, they appear as needle-like acicular crystallites. On the opposite, using reflected plane polarized light (RL-PPL), similarly to what would happen using SEM, it is not possible to observe the crystallites since they are embedded into the glaze matrix and they do not appear on the polished surface (Figure 1d). In this instance, the difficulty to observe both the crystallites and their real morphologies is also encountered by using SEM. Even in the case that these crystallites reach the polished surface, their morphology can be easily mistaken. In fact, they are normally described in literature as euhedral, rounded, angular, or tabular crystallites with hexagonal sections [40,41,47]. In some cases, acicular morphologies have been observed using SEM, when the crystallites are trapped into degassing bubbles [42,46,47]. In other words, for such thin acicular crystals, the probability to have a longitudinal section on the polished surface is extremely low and only basal or subbasal sections will be visible. Figure 2a,b show how the acicular crystallites look like on the polished surface by using SEM in back scattering mode (BSE): light rounded/tabular particles with some visible basal hexagonal sections [34,48].
Example No. 2. Brown decorations. This is a kind of decoration relevant in archaeology and interesting from a scientific point-of-view. In Post-Medieval glazed tablewares, braunite crystallites (Mn7SiO12) have been identified by using X-ray microdiffraction (µXRD) [35]. When observed in thin section by using transmitted PPL (Figure 3a,b), they show two different morphologies: dark-brown bipyramidal crystallites (br1) and thin brown needle-like ones (br2). In some cases, OM shows br2 crystallites growing from br1 crystals and forming dendritic aggregates (Figure 3a,b). What is intriguing is that OM is able to freeze in time a specific moment of the firing process showing that the crystal growth took place in two different conditions. The first type of braunite (br1) displaying euhedral crystals suggests that the crystallites had time and space to grow during the firing process. By contrast, the second type of braunite (br2)—that with dendritic textures – suggests a condition of fast crystallization. Therefore, the euhedral braunite crystals formed early during the heating. Then, some disequilibrium (e.g., a drop in the temperature) must have occurred during the firing process. Braunite continued to grow under these new conditions but with a different crystalline habit. Thanks to TSP, we can document the incipient formation of the dendritic braunite from the euhedral one (Figure 3a,b). In this example, it is also clear that the inspection of the polished surface alone (either by RL or by SEM) would have failed to unveil these details about the growing conditions. The first type of braunite (br1) appears as a light spot on the polished surface (Figure 3c), while the second kind (br2) is hardly visible (Figure 3c,d) and the process of nucleation from the euhedral braunite (br1) cannot be appreciated (Figure 3c).
Example No. 3. Hematite glazes. The difficulty to get an idea of the 3-D morphologies of the crystallites by only using the 2-D sections observed by SEM entails the risk of generating misleading results and unreliable interpretations of the technological procedures. In the following example [37], OM has proved once more priceless for the study of glaze microstructures that were not visible on the polished surface. What was discovered was extremely explanatory: a Fe oversaturation that led to the precipitation of hematite crystallites despite the relative low iron content detected by SEM inside the glaze (4.6 wt % Fe2O3). Brown and/or deep orange hexagonal neo-formed crystallites (Figure 4a) precipitated in the body-glaze interface were found in many Medieval and Post-Medieval glazed potteries (13th to 18th centuries) coming from different sites (North Africa, Spain, France, and Italy). The hexagonal crystallites were perfectly visible in TL and widespread all over the glazes, sometimes creating a dense mesh in the glaze microstructure. In this case, the problem is laid on the impossibility to see the hexagonal crystallites on the polished surfaces, to analyse them by SEM and to understand the reasons for their presence (Figure 4b).
In fact, the crystallites were found at a depth of about 20 μm compared to the glaze preparation and had never been observed in the BSE images as hexagons. Again, the work of thin section has been crucial in order to understand that the hexagonal crystallites observed in TL corresponded to the very thin laminar sections (250 nm in thickness) observed on the polished surface (Figure 4b). Omitting the step of thin section observations (TL mode), SEM measurements would not have been able to detect the presence of the hexagonal crystallites; therefore, valuable microstructural information would have gone lost. From a technological point of view, hematite crystallites are a typical feature of the aventurine glazes [49,50]. In such glazes, the Fe2O3 contents range from 10% to 30% forming hexagonal crystallites of hematite giving birth to a sparkling decorative effect. In the case of these archaeological glazes, the low iron content (4.6 wt % Fe2O3) measured by SEM would hardly have led to imagine a situation of oversaturation. And that is the great potential of TSP: by showing the real glaze microstructure in TL, TSP is able to provide the key data to understand what happened. The widespread presence of these hematite crystallites can only be explained trough a mechanism of oversaturation. Indeed, during the cooling, the capacity of the melt to retain the Fe in solution is reduced and the excess is precipitates as thin plate crystals of hematite [51].
From the abovementioned examples, it is clear that a full identification of the glaze microstructures, nucleation processes, and composition of the glazes cannot be fully achieved using SEM alone. Besides the fact that glazes are transparent to visible light, another great strength in using specimens in the form of petrographic thin sections is that this kind of sample is extremely versatile and can be successfully integrated with other analytical procedures. Techniques, such as microRaman spectrometry (µRaman) or μXRD using synchrotron radiation, can be easily adapted to thin section specimens and, just like in OM, the observed microcrystals can be analysed regardless of their orientation and position within the glaze matrix.

3. Moving Towards More Informative Studies: Innovative Aspects and Usefulness

If we are to achieve a global comprehension of the ceramic glaze microstructures, then we need to move away from traditional studies largely based on SEM towards methodologies not yet standardized. We suggest a new methodological and ideological approach that places TSP at the centre of the scientific investigation on ceramic glazes. Starting from its present role as an accessory identification technique, TSP should turn into a pivotal pillar of the characterization of microcrystals embedded in ceramic glazes. This idea, which at first sight might seem simple and not so revolutionary, breaks with the traditional approaches and represents a new methodological paradigm within the material science community that has specialized in ceramic glazes. At the same time, our approach marries strategically two historically different approaches (ceramic and glass studies) and specialists in a single new method, potentially allowing to use the same specimen—that is to say the petrographic thin section—for studying both. The development of TSP applied to ceramic glaze microstructures should allow a single analyst to undertake analysis both on the ceramic body and the glaze, and the petrographic contributions on glazes should progressively widen and integrate the already extensive and comprehensive studies of ceramic bodies.
We are not merely suggesting to replace SEM with OM. First of all, the crystallites in glazes should be located, described, and characterised using thin section petrographic methods. Special attention should be paid to a description of the morphologies and optical features of the crystallites. Detailed data about the morphology is crucial to identify the symmetry of the crystals and to understand nucleation processes and conditions of formation. Then, the OM data obtained from the thin section analyses have to be linked to the compositional and structural ones obtained by applying other analytical tools, such as SEM, EMPA (electron probe micro-analyser), µRaman (micro Raman), and SR-μXRD (synchrotron-radiation X-ray microdiffraction), etc., always to the same thin section specimen to provide a solid base for a mineralogical identification.
The originality of our approach lies in weaving a robust link between petrography and the analytical characterization of the crystallites in glaze matrixes. Once this correlation is well-established, it should allow everybody to perform quick and easy identifications of the crystallites as viewed in a thin section under an optical microscope, avoiding the need to repeat all the integrated analyses necessary for an unambiguous characterization. To prove that such a correlation is possible, we can consider again the case of the brown and blue glaze decorations. In these decorations there are crystallites constantly recurring in Medieval and Post-Medieval potteries and tiles. Kentrolite, Pb2Mn2Si2O9, melanotekite Pb2Fe2Si2O9, braunite, MnMn6SiO12, bustamite, (Ca,Mn)2Si2O6 and hematite, Fe2O3, are phases often found in brown decorations as well as lead-calcium arsenates in blue ones [35,37,38,40,41,42,45,47,52,53,54,55,56,57]. We have recently characterized these minerals in glazes using the described approach [34,35,37,38,48], and from now on they could be identified in other glazes using almost exclusively the affordable OM.
Reference works for the identification of minerals and rock fragments in ceramic bodies for the technological and provenance studies are very common in literature [58,59]. The idea behind our research is the development of a similar approach to those used for ceramic bodies but focusing on crystals in glazes and including relevant data from other analytical techniques which will support the identification through OM analysis. By promoting this approach, the specialized scientific community could be able to collectively establish TSP for ceramic glaze microstructures as a different petrographic speciality applicable to a large variety of glazes found in the field of craft history and archaeology.
The importance of the petrographic identification of the crystallites is also based on the fact that they can work as ceramic markers of technology and/or provenance and that they can be associated to a specific ceramic class or workshop. In a broader perspective, ceramic markers can be used to study the chaîne opératoire and the cross-craft interaction [60,61,62,63,64,65]. The latter entails, in particular, the nodes of connection—both technical and social—through human interaction, where two or more technologies or crafts meet, exchange recipes, knowledge, approaches, materials, or simply ideas. The presence, distribution, growth, and nucleation process of the microcrystallites in the glaze microstructures provide direct information about the raw materials exploited and the methods of glazing and of production. The pigments and glaze mixtures, methods of application, and firing patterns used are characteristic of each ceramic production, and they relate directly to the influences, links, and trades between regions. The study of the technological processes is fundamental to understand behavioural attributes related to particular social groups that perform the handicraft. The interpretation of the manufacturing technology can be used to address a range of very different archaeological questions. These include the knowledge and technical skills of artisans and their awareness of the physical behaviour of raw materials, the transmission of technology across space and time, the standardization and specialization, the craft tradition up to the style and the expression of the identity trough ceramic practice. Interpreting the reasoning behind the potters’ actions can be difficult, and it has mostly been achieved by the petrographic study of ceramic bodies. The integration of the study of pastes and glazes will further enhance our understanding of the actions involved in the production of a ceramic object that can be strongly influenced by beliefs, traditions, and identities. As pottery is an integral part to most societies from prehistory onwards, the technological choice is a key feature of any archaeological inquiry.

4. Background to the Analysis of Ceramic Glaze Thin Sections

4.1. Sample Preparation and Optical Microscopy

In the study of archaeological glazed ceramics, the procedure most commonly employed consists of using two different sample preparations: covered thin sections (30 µm thickness) for the study of ceramic pastes and crossed polished sections of few millimetres thick, i.e., polished blocks, for the investigation of glazes (Figure 5a,b). It is generally supposed that two sections prepared from the same ceramic sample are likely to be identical to one another. However, things are not always so “straightforward” and the use of twin sections does not guarantee obtaining identical samples (Figure 5c).
The approach presented here allows the use of thin sections for both pastes and glazes and not only for OM characterisation. Ideally, specimens should be prepared in the form of polished thin sections in order to allow the simultaneous observation of every mineral in both TL and RL and therefore to maximize the range of observed mineral properties. Although a thin section is a physically destructive method that could lead to information losses, it can play a key role in the study of glaze matrices. As the glaze coatings are very delicate materials, the sectioning and subsequent grinding and polishing processes should be carried out with extreme caution to avoid generating artificial cracks that would make observations through OM difficult. The use of the same specimen during all the steps of the study, from the optical observation to other analytical techniques, is crucial. It enables continuity during the analysis and the chance to check, at each step of the investigation, the crystals on which the analysis was first performed. The observation of crystallites using OM requires thin sections with a good finish and a petrographic microscope with enough magnification power.
The advantages of using the common transmitted light mode (TL) have already been remarked in Section 2. In TL, the light passes through the ceramic glaze and the crystallites can be seen even if they are below the surface. Therefore, through different focus positions, it is possible to get an overall idea of the 3-D morphology and the distribution of the crystallites (both single crystals and aggregates) embedded in the glaze. Another important aspect concerns the use of the RL mode. Although it is scarcely used for the ceramic pastes, RL is essential in the study of the glaze microstructures to such an extent that the integrated TL-RL observations are the core of our approach. In fact, observations in RL are necessary to obtain optical images comparable to those from SEM or similar techniques. This step allows to understand which crystallites will be visible on the polished surface and how, making it possible to choose the best analytical strategy and to save time. Furthermore, some properties that can be observed in RL mode, such as polishing relief and reflectance, can be very useful to identify the glaze phases of similar compositions often indistinguishable from one another using SEM. Figure 6 shows how RL works in a specific case study [36]. Lanarkite, Pb2O(SO4) and mattheddleite, (Ca,Pb)10(SiO4)3.5(SO4)2Cl2 were identified in a historical misfired lead glaze. In SEM-BSE images, the presence of these two different mineralogical phases could go unnoticed since they show similar Z-average contrast (Figure 6a). Their morphology could prompt to classify the visible sections in two families: elongated and equidimensional—the latter seemingly with hexagonal symmetry. However, this would be wrong since both lanarkite and mattheddleite show elongated and equidimensional sections as revealed by TSP (this time using RL). Lanarkite (a very soft mineral) showed a pronounced negative relief and a lower reflectivity compared to mattheddleite (Figure 6b). One could argue that in using SEM, at least the idiomorphic hexagonal sections could be assigned to hexagonal mattheddleite and this would be also wrong. In fact, the “small hexagonal section” labelled with II in Figure 6 is actually monoclinic lanarkite. This apparent symmetry contradiction can be solved looking at the optical XPL image (see inset in Figure 6b) where the small “hexagonal section” is actually a pair of twinned crystals. Furthermore, compositional analyses using an EDS detector, in this case, is also problematic because of the large overlapping of S-Kα, Pb-Mα, and Cl-Kα characteristic X-ray peaks. On the contrary, TSP clearly revealed the presence of two different minerals (Figure 6b). After the detection of the minerals, the analyses were much faster and immediate.

4.2. Other Techniques

Besides OM, the choice of analytical techniques that could best complement the studies on ceramic glazes should be based on two main criteria: the information that they can give and the capacity to perform the measurement directly on the petrographic thin section. Within these analytical techniques, SEM (or electron microprobe)—along with associated spectroscopies EDX or WDX—can for sure have a place of its own, although with the drawbacks above illustrated. As far as we are concerned, µRaman and μXRD are two powerful techniques that have been successfully tested on ceramic glaze thin sections. However, the list of techniques that can be directly applied to thin sections is larger, including for instance cathodoluminescence (CL), infrared (µFTIR), and secondary ion mass (µSIMS) spectrometries, etc.

4.2.1. µRaman Applied to Petrographic Thin Sections

The use of Raman spectroscopy to identify and study archaeological materials has flourished in recent years in addition to other standard analytical techniques [66,67,68,69,70]. Some advantages of the Raman spectroscopy include the molecular specificity of the signal (which relates directly to the corresponding vibrational density of states), the no destructiveness, the high spatial and spectral resolution, and the possibility to perform in situ analysis. It can be considered as a fingerprint technique since the materials are identified by comparing their characteristic vibrational spectra with those in a database. In the case of ceramics, the Raman analysis is mainly aimed at investigating raw materials and production procedures in order to study the technological choices and the cultural models within the same context, as well as contaminations and circulations among different cultural groups [71,72,73,74,75,76,77,78]. The huge development of the Raman spectrometry in the study of glass, glazes, and enamels relies on the possibility to use the SiO4 tetrahedron bands as fingerprint of the glass composition, structure, and processing temperature. In this way, each specific glass has a given Raman signature, and different procedures have been developed for the identification of soda, soda lime, alumina, or lead-containing compositions [79,80,81,82,83]. However, it should be pointed out that composition alone does not really correlate with a given Raman signal since different atomic arrangements (crystalline or not) will also produce different spectra.
As far the studies on ceramic glazes and their decorations are concerned, one of the best ways to perform deep investigations on glaze microstructures is certainly Raman microscopy. The coupling of a Raman spectrometer to a high-magnification optical microscope (×100 objective) allows to select specific areas where the Raman signature of isolated minerals can be obtained, to analyse selectively components of heterogeneous samples, to avoid and/or limit fluorescence, and to reduce the amount of sample required [69,84]. However, the more and more widespread Raman applications on glazed ceramics and tiles are normally carried out on archaeological samples in the form of shards or intact items. These procedures have both the advantage to preserve the samples from the sectioning and to cut on time and costs. Sometimes, the samples are prepared in the form of crosscut pieces of several millimetres for the Raman study [85,86,87,88,89,90,91,92,93]. The use of thin sections for the Raman investigations within the frame of Cultural Heritage studies is quite rare, despite what happens in other research areas such as mineralogy and petrology [94,95,96,97]. Notwithstanding that, we must take into account that the optical examination of the glaze microstructures by thin sections should never be neglected in the Raman studies, particularly in case integrated studies on glaze microstructures are not provided (e.g., by using SEM). µRaman systems can be easily used in combination with thin sections, and with an appropriate coupled microscope, the samples can be visualized using both TL and RL modes. An important remark is that by using TL, it is possible to focus on crystals that lie under the polished glaze surface getting the corresponding Raman spectra. The use of TL allows an accurate inspection of the glaze matrix, localizing the crystallites below and above the polished surface and avoiding the overlapping signals corresponding to other mineral phases.
The possibility to gain further knowledge on the glaze microstructures from the combined use of Raman microscopy and thin section preparations is illustrated in Figure 7. Hematite and cristobalite have been identified in ceramic glazes by μRaman and μXRD [35]. Obviously, the identification of these mineral phases could also be easily performed through Raman measurements directly on the ceramic glazes without sectioning them. In such an instance, what makes the difference is really the use of the thin section. Without that step, the microstructural information would be lost. In fact, the thin section not only shows the presence of two crystalline phases in the glaze matrix but also uncovers the kind of relationship existing between them. As Figure 7a shows, cristobalite crystallites have been nucleated around hematite which acted as a nucleation agent. The discovery of such a relationship is a novelty compared to the existing literature on silica polymorphs. Different authors have investigated the formation and stability conditions of trydimite and cristobalite, suggesting hypotheses about temperature and composition of the melt [98,99,100,101,102,103,104]. Alkali environments; PbO; and atoms such as calcium, sodium, and potassium have been considered suitable for their nucleation. In this case, hematite is responsible for the nucleation of cristobalite, and the presence of the latter itself is not related to alkali ions, usually responsible for its formation far from equilibrium conditions.
In case of coloured glass, glazes, and enamels, the Raman identification of the pigments also represents a very efficient approach [105,106,107,108,109,110]. Some pigments have been used for millennia, and existing databases can provide useful reference spectra [111,112]. However, sometimes the composition of minerals can be complex. It is the case of solid solutions for which EMPA or EDX can be used to determine the exact composition of the mineral, while µRaman provides an experimental spectrum that often shows features deriving from the vibration signature of both end-members (Figure 8). Reference Raman spectra of end-member minerals could be used to complement the study of the members of the solid-solution series [55,56].
Apart from the use of a confocal lens, the development of solid-state lasers and Charge Coupled Device (CCD) detectors, another exciting development in Raman spectroscopy in the last decade, concerns the use of 3-D mapping to study geological materials [113,114]. Rock microstructures can exhibit complexity, involving many minerals (which may be present in various polymorphs), or can present overgrowths or intergrowths of different mineral phases. To analyse all these elements in detail, it is essential that the Raman system can achieve high spectral and spatial resolution. In the specific case of ceramic glazes, 3-D images of the microcrystallites can be obtained from a number of images acquired at different stage positions using confocal Raman spectroscopy. An example of this approach is illustrated below using the in Via Qontor (Renishaw) confocal Raman microscope (Renishaw, Pianezza, Italy) of an unexpected crystal morphology encountered in a glaze ceramic that resulted to be common quartz. The crystal morphology observed in the thin section (Figure 9a,b) suggested a mineral of high symmetry with an equidimensional habit and hexagonal faces compatible with the morphology of a tetradecahedron or a truncated octahedron. The μXRD measurements carried out in the crystal region were not conclusive suggesting the presence mainly of quartz and secondarily of cristobalite. From that, one hypothesized that the observed morphology was a “false form”, that is to say that a high symmetry mineral (perhaps beta-cristobalite) was almost completely pseudomorphised in quartz. Following this, a 3-D Raman mapping study disproved the hypothesis. Results showed that the detected signal of cristobalite came from a nearby crystal and that the crystal with the peculiar shape is 100% quartz (Figure 9c–e). A close inspection of the images revealed that the observed hexagonal face was artificially created by cutting the original crystal (which had a common hexagonal bipyramidal morphology) during the process of polishing.

4.2.2. tts-µXRD Applied to Petrographic Thin Sections

Besides μRaman spectroscopy, another very useful technique that can be applied to thin sections is tts-μXRD. The name μXRD is quite generic and can specify a variety of microdiffraction measurement modes, e.g., not only transmission (as is the case in this work) but also reflection ones. Reflection μXRD can be used for the identification of crystallites in glazes [115], but the transmission mode is definitely better. To specify that the measurement in the transmission mode is performed through a substrate supporting the specimen (e.g., a thin section on a glass-substrate), the prefix tts (through-the-substrate) was introduced [116]. Synchrotron tts-μXRD has been successfully tested on thin glaze sections. The advantage of using synchrotron radiation is its high brilliance, ideal to get diffraction intensity even in samples with very low amount of crystalline material, as it is the case of crystallites embedded in glazes.
Previous approaches to the study of glazed ceramics by μXRD were undertaken using two different sample preparations: cross sections of about 50 μm for the μXRD and polished resin blocks for the SEM study [45,52,53,117]. Although this approach provides useful information, it presents a great drawback since in a section of about ~50 μm, the crystallites are not visible (see for instance Figure 3 in Reference [52], Figure 1b in Reference [53], or Figures 1 and 5 in Reference [45]). As the crystallites in ceramic glazes are very small and often found close to one another, it is very difficult to correlate the obtained diffraction patterns from μXRD with the corresponding images, either SEM images or camera images from the synchrotron visualization system. In short, without using a petrographic thin section, it is impossible to see what is exactly being analysed. Blind systematic scans going from the paste-glaze interface up to the glaze surface can be undertaken to capture crystalline phases. However, that generates huge amounts of useless data and does not provide good images that can be of use, if not for a few measured spots.
Pioneering developments of the application of tts-μXRD on petrographic thin sections were done at the microdiffraction-high-pressure station of the MSPD beamline at the ALBA Synchrotron Facility in Barcelona, Spain [35,36,37,38,118,119]. These have represented a healthy change for microdiffraction studies on glazed ceramics, leading to improvements in terms of the accuracy of the analysis, data gathering, and time for data elaboration. The correlation between images from synchrotron camera and OM are easier to perform as the visualized sample is actually the same and some features such as occasional cracks or bubbles can be used to overlap both images (Figure 10).
It is worth to mention that irradiated crystals located under the polished surface will produce diffraction intensities. As we have already commented, these crystals can be seen by a petrographic microscope using TL, but they will be not visible in a 50 µm cross section. One of the few advantages in this latter case is that it is not mounted on a glass slide which is a source of noise in the diffraction data obtained from petrographic sections. However, the signal from the glass can be removed acquiring a blank pattern from the glass slide or subtracting it by modelling the background with specialized software (Figure 10). For a radiation of λ = 0.4246 Å, glass substrates up to 1 mm thickness produce good results. An alternative is represented by the use of thin sections mounted on very thin glass substrates (0.1 mm) allowing the crystallites to be spotted and analysed [120].

5. Technological and Provenance Markers

It is worth pointing out that the detailed characterization of microcrystals embedded in ceramic glazes is not undertaken for the mere benefit of knowledge. As we have explained in Section 3, crystallites found in ceramic glaze microstructures are precious ceramic markers and they can be used to study the chaîne opératoire and the cross-craft interaction. This is illustrated here with a case study directly related to the long and well-appreciated ceramic tradition of Albisola (Liguria, NW Italy). At the beginning of the 18th century, a new high-quality low-cost production called Taches Noires ware was developed [121]. It became a global pottery in a few years, spreading all over the Mediterranean (Italy, France, Spain, Tunisia, and Greece) and also in the New World (Canada, the Caribbean Islands, and Mexico). The success of the Taches Noires ware was so massive that it was soon copied by different Spanish and French workshops [35,38,121,122,123].
A collection of Spanish and French imitations was analysed and compared to the existing data derived from reference samples of Albisola [124]. The study of ceramic pastes made it possible to distinguish the original Ligurian productions from the foreign imitations produced with different local clays. The novelty consisted in the analysis of the glazes by using the approach described in the present paper. In terms of raw materials and technological procedures, the glazes of some French and Spanish imitations were very similar to the original Ligurian ones. In other words, some local imitators used the same glaze recipes as the Abisola potters. We can then infer that either the technological information was transferred or potters from Abisola settled in those countries where they might have set up workshops to produce this ware using local materials. On the other hand, the neo-formed crystallites related to the black-brownish decorations of these wares were valuable markers of technology and provenance, and they allowed us to associate them to a specific workshop.
Mineralogical and chemical details of the analysed crystallites and their significance can be briefly summarised as follows:
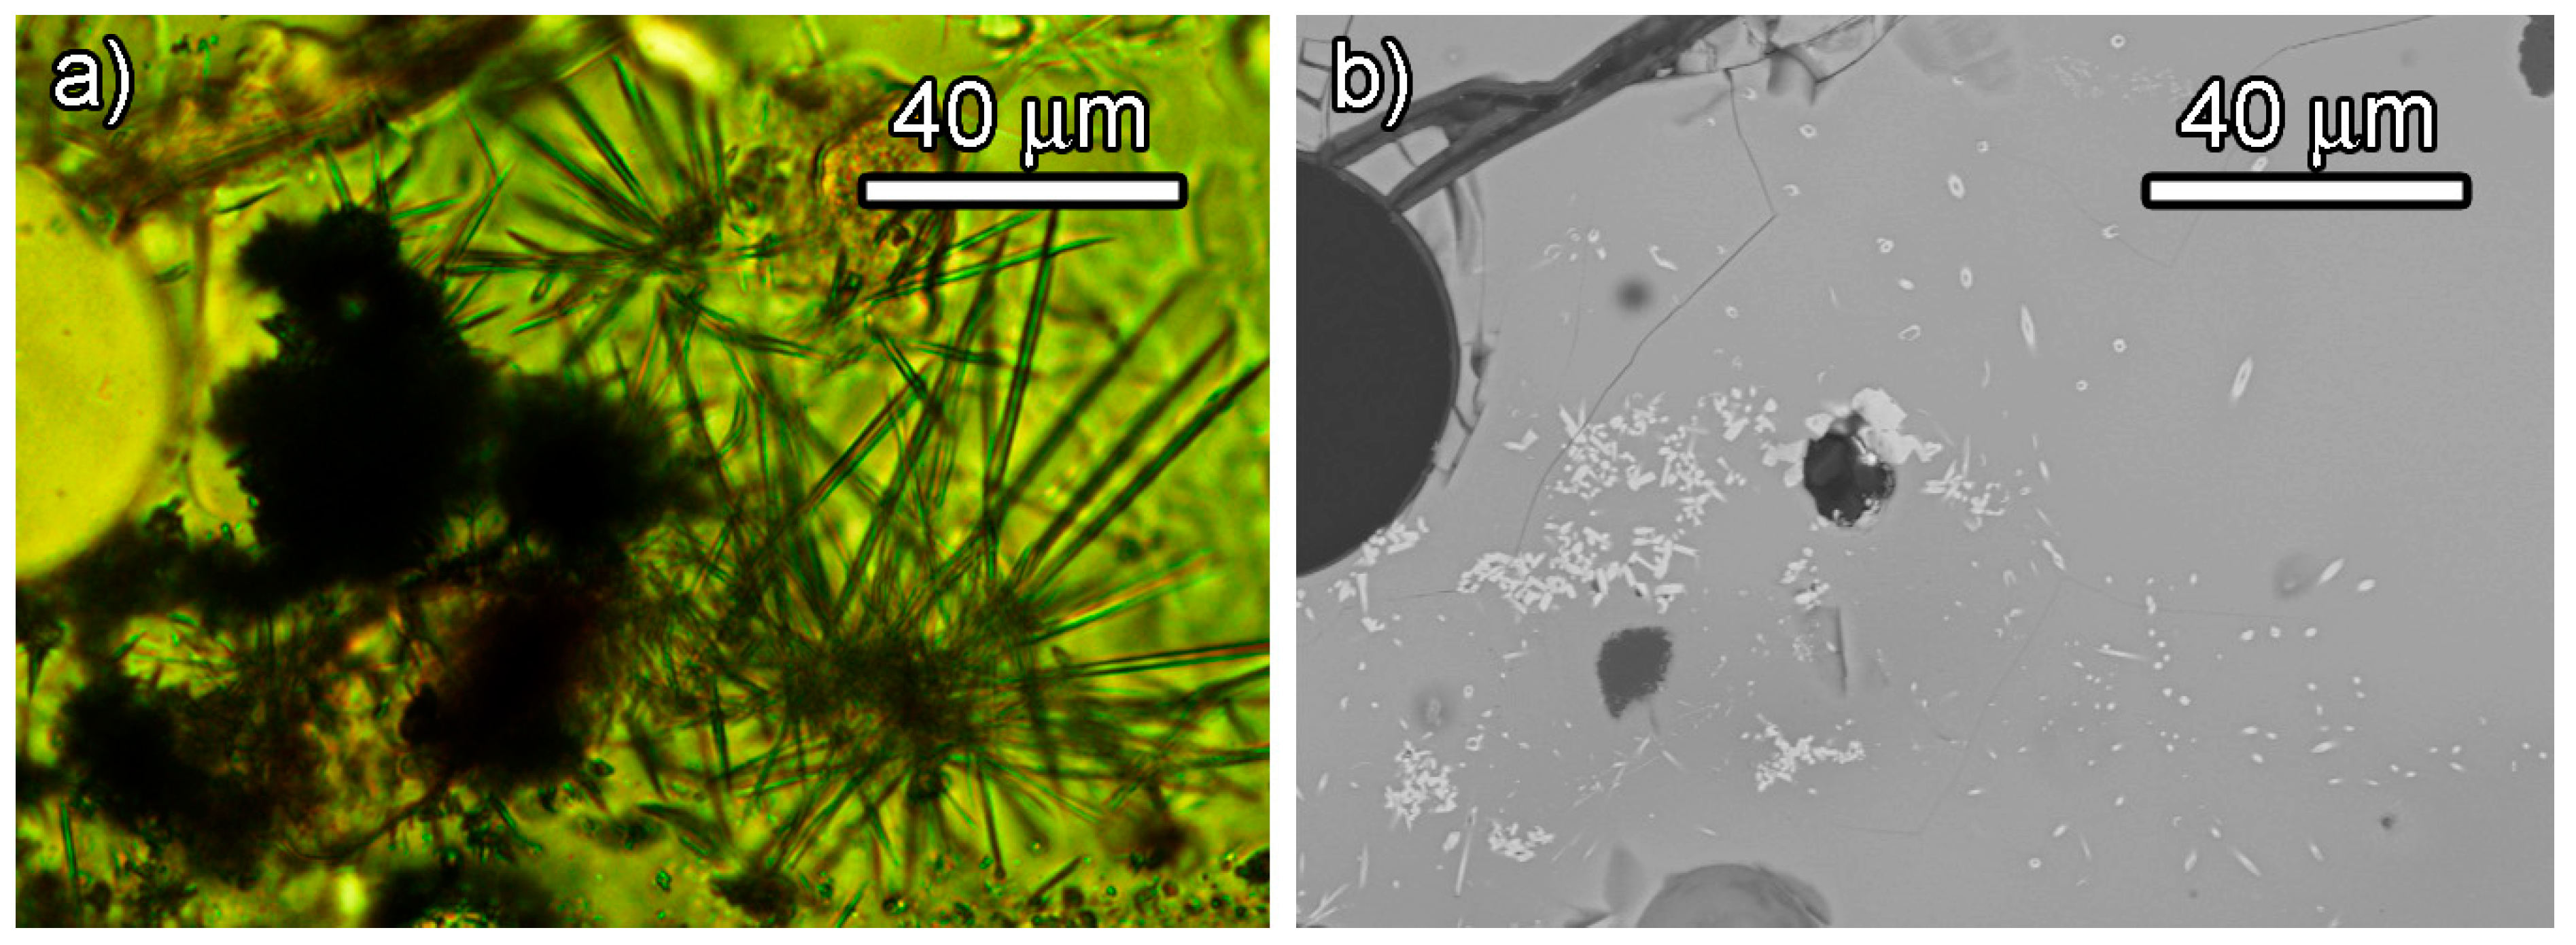
  • Melanotekite (Pb2Fe2Si2O9) and kentrolite (Pb2Mn2Si2O9) associated with some other microcrystallites were two of the most important ceramic markers related to the black-brownish decorations of this type of pottery.
  • Melanotekite (Pb2Fe2Si2O9) can be used to identify imitations from the Jouques workshop (Provence, France) and to recognize them in the other French consumption sites. The presence of this mineral indicates the use of a Fe-rich pigment instead of Mn-rich ones as the original glaze recipe would suggest. Besides that, the acicular morphology of the crystallites indicates quick cooling conditions, and their presence suggests a firing temperature of about 900 °C and below 925 °C [35].
  • Kentrolite (Pb2Mn2Si2O9) is the ceramic marker of the decorations of two specific workshops in Manises and Barcelona (Eastern Spain). This mineral also indicates a firing temperature below 925 °C, while the Mn content is consistent with the original glaze recipe. Kentrolite was found near the glaze-body interface, suggesting an application of the pigment directly on the ceramic body in agreement with the original recipe [38].
  • The original Albisola wares do not contain Mn/Fe precipitated in their decorations. The lack of these crystalline compounds can be explained by a higher firing temperature (>925 °C) compared to the foreign imitations [38].

6. The Next Steps: The Future of the Thin Section Petrography on Ceramic Glaze Microstructures

In conclusion, we are at the crossroads in the traditional studies of ceramic glaze microstructures. Hopefully, we proved the considerable power of TSP applied to ceramic glazes and how the petrography can be used to extract useful information contributing to minimize research time/cost. Although additional data from OM is often encouraged to complement the information obtained from SEM, as a matter of fact, in literature, there are no petrographic data about glaze microstructures. For such a reason, we are convinced that an important development for the future will be the adoption of TSP as the first step of any archaeometric investigation on ceramic glaze microstructures. This will probably be possible only by recognizing TSP for ceramic glaze microstructures as a new discipline. The standardization of the petrographic procedure for the glaze microstructures will allow cross-comparisons and data storage that will turn this approach into an economically sustainable method for an efficient and fast identification of the crystallites. We hope that readers will appreciate the present contribution and, at the same time, that our research will help to promote the use of thin section petrography of glaze microstructures among the archaeological and scientific communities.

Author Contributions

Conceptualization R.D.F. and L.C.; sample and data selection R.D.F.; Measurements and interpretation: R.D.F. and J.C.M. (OM, SEM); R.D.F. and R.T. (µRaman); R.D.F., L.C. and J.R. (µXRD); writing—first draft preparation, R.D.F. and L.C.; writing—review and editing, all authors.

Funding

Financial support from projects CGL2013-42167-P (Spanish Ministerio de Economía y Competitividad), MAT2015-67593-P and “Severo Ochoa” SEV-2015-0496 (MINECO & FEDER) is acknowledged. This study adheres to the objectives of the abovementioned projects and those of the 2017SGR707 group (Generalitat de Catalunya).

Acknowledgments

We thank the University of Barcelona (Systematic Collection of Minerals) for providing the minerals used as a reference for the Raman analyses. The authors are grateful to the anonymous referees for their constructive review of this manuscript.

Conflicts of Interest

The authors declare no conflict of interest.

References

  1. Freestone, I.; Middleton, A. Mineralogical applications of the analytical SEM in archaeology. Mineral. Mag. 1987, 51, 21–31. [Google Scholar] [CrossRef]
  2. Tite, M.S. The impact of electron microscopy on ceramic studies. Proc. Br. Acad. 1991, 77, 111–131. [Google Scholar]
  3. Fouqué, F. Santorini et Ses Eruptions; The Johns Hopkins University Press: Baltimore, MD, USA, 1879. [Google Scholar]
  4. Nordenskiöld, E. Ruiner af Klippboningar I Mesa Verde’s Cañons; PA Norstedt & Söners: Stockholm, Sweden, 1893. [Google Scholar]
  5. Felts, W.M. A petrographic examination of potsherds from ancient Troy. AJA 1942, 46, 237–244. [Google Scholar] [CrossRef]
  6. Shepard, A.O. Rio Grande Glaze-Paint Pottery: A Test of Petrographic Analysis. In Ceramics and Man; Matson, F.R., Ed.; Wenner-Gren Foundation for Anthropological Research: Chicago, IL, USA, 1965; pp. 62–87. [Google Scholar]
  7. Freestone, I.; Johns, C.; Potter, T. (Eds.) Current Research in Ceramics: Thin Section Studies; British Museum Occasional Paper No. 32; British Museum: London, UK, 1982. [Google Scholar]
  8. Middleton, A.; Freestone, I. (Eds.) Recent Developments in Ceramic Petrology; British Museum Occasional Paper No. 81; British Museum: London, UK, 1991. [Google Scholar]
  9. Freestone, I. Ceramic Petrography. AJA 1995, 99, 111–115. [Google Scholar]
  10. Whitbread, I.K. Greek Transport Amphorae: A Petrological and Archaeological Study; The British School at Athens, Fitch Laboratory Occasional Paper 4; The British School at Athens, Fitch Laboratory: Athens, Greece, 1995. [Google Scholar]
  11. Trindade, M.J.; Dias, M.I.; Coroado, J.; Rocha, F. Mineralogical transformations of calcareous rich clays with firing: A comparative study between calcite and dolomite rich clays from Algarve, Portugal. Appl. Clay Sci. 2009, 42, 345–355. [Google Scholar] [CrossRef]
  12. Mckenzie, C. The Supply of Campania made sigillata to the city of Pompeii. Archaeometry 2012, 54, 796–820. [Google Scholar] [CrossRef]
  13. Antonelli, F.; Ermeti, A.L.; Lazzarini, L.; Verità, M.; Raffaelli, G. An archaeometric contribution to the characterization of Renaissance maiolica from Urbino and a comparison with coeval maiolica from Pesaro (the Marches, central Italy). Archaeometry 2014, 56, 784–804. [Google Scholar] [CrossRef]
  14. Alaimo, R.; Bultrini, G.; Fragalà, I.; Giarrusso, R.; Iliopoulos, I.; Montana, G. Archaeometry of sicilian glazed pottery. Appl. Phys. A 2004, 79, 221–227. [Google Scholar] [CrossRef]
  15. Arnold, D.E. Mineralogical analyses of ceramic materials from Quinua, Department of Ayacucho, Peru. Archaeometry 1972, 14, 93–102. [Google Scholar] [CrossRef]
  16. Myer, G.H.; Betancourt, P.P. The composition of Vaselike Ware and the production of the mottled colours of the slip. In Scientific Studies in Ancient Ceramics; Hughes, M.J., Ed.; Brithis Museum: London, UK, 1981; pp. 51–55. [Google Scholar]
  17. Jiazhi, L. The evolution of Chinese pottery and porcelain technology. In Ancient Technology to Modern Science; Kingery, W.D., Ed.; American Ceramic Society: Columbus, OH, USA, 1984; pp. 135–162. [Google Scholar]
  18. Harrison Hall, J. Chinese porcelain from Jingdezhen. In Pottery in the Making: Ceramic Traditions; Freestone, I.C., Gaimster, D., Eds.; Smithsonian Institution Press: Washington, DC, USA, 1997; pp. 182–187. [Google Scholar]
  19. Capelli, C.; Marescotti, P. Caratterizzazione mineralogico-petrografica degli ingobbi delle ceramiche basso-medievali savonesi. In Proceedings of the Primo Congresso Nazionale dell’Associazione Italiana di Archeometria, Patron, Bologna, 2–4 December 2000; pp. 389–400. [Google Scholar]
  20. Berti, G.; Mannoni, T. Rivestimenti vetrosi e argillosi su ceramiche medievali e risultati emersi da ricerche archeologiche e analisi chimiche e mineralogiche. In Scienze e Archeologia; Mannoni, T., Molinari, A., Eds.; All’Insegna del Giglio: Firenze, Italy, 1990; pp. 89–124. [Google Scholar]
  21. Capelli, C.; Mannoni, T. I problemi dei rivestimenti nelle fabbriche italiane del XII secolo. In Atti del XXIX Convegno Internazionale della Ceramica 1996; Centro Ligure per la Storia della Ceramica, All’Insegna del Giglio: Firenze, Italy, 1998; pp. 229–233. [Google Scholar]
  22. Berti, G.; Capelli, C.; Mannoni, T. Ingobbio/ingobbi e gli altri rivestimenti nei percorsi delle conoscenze tecniche medievali. In Atti del XXXIV Convegno Internazionale della Ceramica; Centro Ligure per la Storia della Ceramica, All’Insegna del Giglio: Firenze, Italy, 2001; pp. 9–15. [Google Scholar]
  23. Capelli, C.; Riccardi, M.P. Il contributo delle analisi petrografiche allo studio dei rivestimenti di ceramiche in blu: Alcuni esempi. In Atti del XXXV, Convegno Internazionale Della Ceramica; Centro Ligure per la Storia della Ceramica, All’Insegna del Giglio: Firenze, Italy, 2002; pp. 19–27. [Google Scholar]
  24. Capelli, C.; Cabella, R. Note sulla caratterizzazione dei rivestimenti delle ceramiche medievali. In Medoti e Pratica della Cultura Materiale, Produzione e Consumo dei Manufatti; Giannichedda, E., Ed.; Istituto Internazionale di Studi Liguri: Bordighera, Italy, 2004; pp. 125–132. [Google Scholar]
  25. Capelli, C.; Cabella, R. Il contributo delle analisi archeometriche alla conoscenza della maiolica ligure: Risultati recenti e problemi aperti. In Atti del XLV Convegno Internazionale della Ceramica; Centro Ligure per la Storia della Ceramica, All’insegna del Giglio: Firenze, Italy, 2012; pp. 373–382. [Google Scholar]
  26. Capelli, C.; Carta, F.; Cabella, R. Produzioni locali e importazioni savonesi di maioliche a smalto berettino all’Alhambra di Granada (XVI secolo): Dati archeologici e archeometrici preliminari. In Atti del XLII Convegno Internazionale della Ceramica; Centro Ligure per la Storia della Ceramica, All’insegna del Giglio: Firenze, Italy, 2010; pp. 57–63. [Google Scholar]
  27. Reedy, C. Petrographic and Image Analysis of Thin Sections of Classic Wares of Song Dynasty. In Proceedings of International Symposium on Science and Technology of Five Great Wares of the Song Dynasty; Ningchang, S., Jianmin, M., Eds.; Science Press: Beijing, China, 2016; pp. 381–390. [Google Scholar]
  28. Mason, R.; Tite, M.S. The beginnings of tin opacification of pottery glazes. Archaeometry 1997, 39, 41–58. [Google Scholar] [CrossRef]
  29. Tite, M.S.; Freestone, I.; Mason, R.; Molera, M.; Vendrell-Saz, M.; Wood, N. Lead glazes in antiquity- Methods of production and reasons for use. Archaeometry 1998, 40, 241–260. [Google Scholar] [CrossRef]
  30. Molera, J.; Pradell, T.; Salvadó, N.; Vendrell-Saz, M. Evidence of Tin Oxide Recrystallization in Opacified Lead Glazes. J. Am. Ceram. Soc. 1999, 82, 2871–2875. [Google Scholar] [CrossRef]
  31. Pérez-Arantegui, J.; Larrea, A.; Molera, J.; Pradell, T.; Vendrell-Saz, M. Some aspects of the characterization of decorations on ceramic glazes. Appl. Phys. A 2004, 79, 235–239. [Google Scholar] [CrossRef]
  32. Vendrell-Saz, M.; Molera, J.; Roqué, J.; Pérez-Arantegui, J. Islamic and Hispano-Moresque (múdejar) lead glazes in Spain: A technical approach. In Geomaterials in Cultural Heritage; Maggetti, M., Messiga, B., Eds.; Geological Society of London: London, UK, 2006; pp. 163–173. [Google Scholar]
  33. Tite, M.S. The production technology of Italian maiolica: A reassessment. J. Archaeol. Sci. 2009, 36, 2065–2080. [Google Scholar] [CrossRef]
  34. Di Febo, R. La ceràmica de Barcelona entre els segles XIII i XVIII a través de la seva caracterització arqueomètrica. El paper de l’anàlisi petrográfica. Ph.D. Thesis, University of Barcelona, Barcelona, Spain, 2016. [Google Scholar]
  35. Di Febo, R.; Molera, J.; Pradell, T.; Vallcorba, O.; Capelli, C. Thin-section petrography and SR-μXRD for the identification of micro-crystallites in the brown decorations of ceramic lead glazes. EJM 2017, 29, 861–870. [Google Scholar] [CrossRef]
  36. Di Febo, R.; Molera, J.; Pradell, T.; Vallcorba, O.; Melgarejo, J.C.; Madrenas, J. The production of a lead glaze with galena: Thermal transformations in the PbS-SiO2 system. J. Am. Ceram. Soc. 2017, 1–11. [Google Scholar] [CrossRef]
  37. Di Febo, R.; Molera, J.; Pradell, T.; Vallcorba, O.; Capelli, C. Technological implications of neo-formed hematite crystals in ceramic lead glazes. STAR 2017, 3, 1–10. [Google Scholar] [CrossRef]
  38. Di Febo, R.; Casas, L.; Capelli, C.; Cabella, R.; Vallcorba, O. Catalan imitations of the Ligurian Taches Noires ware in Barcelona (18th–19th century): An example of technical knowledge transfer. Minerals 2018, 8, 183. [Google Scholar] [CrossRef]
  39. Gratuze, B.; Soulier, I.; Blet, M.; Vallauri, L. De l’origine du cobalt: Du verre a la ceramique. Revue d’Archéométrie 1996, 20, 77–94. [Google Scholar] [CrossRef]
  40. Borgia, I.; Brunetti, B.; Mariani, I.; Sgamellotti, A.; Cariati, F.; Fermo, P.; Padeletti, G. Heterogeneous distribution of metal nanocrystals in glazes of historical pottery. Appl. Surf. Sci. 2002, 185, 206–216. [Google Scholar] [CrossRef]
  41. Viti, C.; Borgia, I.; Brunetti, B.; Sgamellotti, A.; Mellini, M. Microtexture and microchemistry of glaze and pigments in Italian Renaissance pottery from Gubbio and Deruta. J. Cult. Herit. 2003, 4, 199–210. [Google Scholar] [CrossRef]
  42. Dell’Aquila, C.; Laviano, R.; Vurro, F. Chemical and mineralogical investigation of majolicas (16th–19th centuries) from Laterza, southern Italy. In Geomaterials in Cultural Heritage; Maggetti, M., Messiga, B., Eds.; Geological Society Special Publications No. 257; Geological Society of London: London, UK, 2006; pp. 151–162. [Google Scholar]
  43. Zucchiatti, A.; Bouquillon, A.; Katona, I.; D’Alessandro, A. The Della Robbia blue: A case study for the use of cobalt pigments in ceramics during the Italian renaissance. Archaeometry 2006, 48, 131–152. [Google Scholar] [CrossRef]
  44. Pérez-Arantegui, J.; Montull, B.; Resano, M.; Ortega, J.M. Materials and technological evolution of ancient cobalt-blue-decorated ceramics: Pigments and work patterns in tin-glazed objects from Aragon (Spain) from the 15th to the 18th century AD. J. Eur. Ceram. Soc. 2009, 29, 2499–2509. [Google Scholar] [CrossRef]
  45. Pradell, T.; Molina, G.; Molera, J.; Pla, J.; Labrador, A. The use of micro-XRD for the study of glaze colour decorations. Appl. Phys. A 2013, 111, 121–127. [Google Scholar] [CrossRef]
  46. Bajnóczi, B.; Nagy, G.; Tóth, M.; Ringer, I.; Ridovics, A. Archaeometric characterization of 17th-century tin-glazed Anabaptist (Hutterite) faience artefacts from North-East-Hungary. J. Archaeol. Sci 2014, 45, 1–14. [Google Scholar] [CrossRef] [Green Version]
  47. Bajnóczi, B.; May, Z.; Ridovics, A.; Szabó, M.; Nagy, G.; Tóth, M. The tin content of the blue-glazed hutterite and haban ceramics-Implications for the production technology based on results of the handheld XRF and electron microprobe analyses. Acta Ethnogr. Hung. 2015, 60, 517–534. [Google Scholar] [CrossRef]
  48. Di Febo, R. Thin-section petrography of decorated lead glazes. In Proceedings of the 6th Annual International Workshop on Higher Education (IWHE 2016), Vic, Spain, 16 June 2016. [Google Scholar]
  49. Dakhai, S.; Orlova, L.A.; Mikhailenko, N.Y. Types and compositions of crystalline glazes. Glass Ceram. 1999, 56, 177–180. [Google Scholar] [CrossRef]
  50. Romero, M.; Rincón, J.; Acosta, A. Development of Mica Glass-Ceramic Glazes. J. Am. Ceram. Soc. 2004, 2, 819–823. [Google Scholar] [CrossRef]
  51. Fraulini, F. Aventurine Glazes. Bachelors’ Theses, Missouri School of Mines and Metallurgy, Rolla, MI, USA, 1933. Available online: http://scholarsmine.mst.edu/bachelors_theses/309 (accessed on 26 September 2014).
  52. Iñañez, J.M.; Madrid-Fernández, M.; Molera, J.; Speakman, R.J.; Pradell, T. Potters and pigments: Preliminary technological assessment of pigment recipes of American majolica by synchrotron radiation micro-X-ray diffraction (Sr-μXRD). J. Archaeol. Sci. 2013, 40, 1408–1415. [Google Scholar] [CrossRef]
  53. Molera, J.; Coll, J.; Labrador, A.; Pradell, T. Manganese brown decorations in 10th to 18th century Spanish tin glazed ceramics. Appl. Clay Sci. 2013, 82, 86–90. [Google Scholar] [CrossRef]
  54. Gómez, A.; Gil, C.; Di Febo, R.; Molera, J. Casa Convalescència (Vic, Osona): Aproximació arqueológica i arqueomètrica a un conjunt de vasos ceràmics del segle XVIII. In Proceedings of the III Jornades d’Arqueologia de la Catalunya Central, Roda de Ter, Spain, 17–18 October 2015; pp. 70–81. [Google Scholar]
  55. Coentro, S.; Da Silva, R.; Relvas, C.; Ferreira, T.; Mirão, J.; Pleguezuelo, A.; Muralha, V. Mineralogical Characterization of Hispano-Moresque Glazes: A µ-Raman and Scanning Electron Microscopy with X-Ray Energy Dispersive Spectrometry (SEM-EDS) Study. Microsc Microanal. 2018, 24, 300–309. [Google Scholar] [CrossRef] [PubMed]
  56. Coentro, S.; Alves, L.C.; Relvas, C.; Ferreira, T.; Mirão, J.; Molera, J.; Pradell, T.; Trindade, R.A.; Da Silva, R.C.; Muralha, V.S.F. The Glaze Technology of Hispano-Moresque Ceramic Tiles: A Comparison between Portuguese and Spanish Collections. Archaeometry 2017, 59, 667–684. [Google Scholar] [CrossRef]
  57. Roisine, G.; Capobianco, N.; Caurant, D.; Wallez, G.; Bouquillon, A.; Majérus, O.; Gerbier, A. The art of Bernard Palissy (1510–1590): Influence of firing conditions on the microstructure of iron-coloured high-lead glazes. Appl. Phys. 2017, 123, 1–9. [Google Scholar] [CrossRef]
  58. Reedy, C.L. Thin Section Petrography of Stone and Ceramic Cultural Materials; Archetype: London, UK, 2008. [Google Scholar]
  59. Quinn, P.S. Ceramic Petrography: The Interpretation of Archaeological Pottery & Related Artefacts in Thin Section; Archaeopress: Oxford, UK, 2013. [Google Scholar]
  60. Leroi-Gourhan, A. Le Geste et la Parole, Volume 1: Technique et Langage; Albin Michel: Paris, France, 1943. [Google Scholar]
  61. Leroi-Gourhan, A. Le Geste et la Parole, Volume 2: La Mémoire et les Rythmes; Albin Michel: Paris, France, 1945. [Google Scholar]
  62. McGovern, P.E.; Notis, M.D.; Kingery, W.D. (Eds.) Cross-Craft and Cross-Cultural Interactions in Ceramics. Ceramics and Civilization IV; American Ceramic Society: Westerville, OH, USA, 1989. [Google Scholar]
  63. Schlanger, N. Mindful technology: Unleashing the chaîne opératoire for an archaeology of mind. In The Ancient Mind. Elements of Cognitive Archaeology; Renfrew, C., Zubrow, E.B.W., Eds.; Cambridge University Press: Cambridge, UK, 1994; pp. 143–151. [Google Scholar]
  64. Pfaffenberger, B. Mining communities, chaînes opératoires and socio-technical systems. In Social Approaches to an Industrial Past. The Archaeology and Anthropology of Mining; Knapp, A.B., Pigott, V., Herbert, E.W., Eds.; Routledge: London, UK, 1998; pp. 291–300. [Google Scholar]
  65. Dobres, M.A. Archaeologies of technology. Camb. J. Econ. 2010, 34, 103–114. [Google Scholar] [CrossRef]
  66. Clark, R.J.H.; Curri, M.L. The identification by Raman microscopy and X-ray diffraction of iron-oxide pigments and of the red pigments found on Italian pottery fragments. J. Mol. Struct. 1998, 440, 105–111. [Google Scholar] [CrossRef]
  67. Smith, G.D.; Clark, R.J.H. Raman microscopy in art history and conservation science. Rev. Conserv. 2001, 2, 92–106. [Google Scholar]
  68. Colomban, P.; Truong, C. Non-Destructive Raman Study of the Glazing Technique in Lustre Potteries and Faience (9th–14th Centuries): Silver Ions, Nanoclusters, Microstructures, and Processing. J. Raman Spectrosc. 2004, 35, 195–207. [Google Scholar] [CrossRef]
  69. Casadio, F.; Daher, C.; Bellot-Gurlet, L. Raman Spectroscopy of cultural heritage Materials: Overview of Applications and New Frontiers in Instrumentation, Sampling Modalities, and Data Processing. Top. Curr. Chem. 2016, 362–374. [Google Scholar] [CrossRef]
  70. Howell, G.; Edwards, M.; Vandenabeele, P. Raman spectroscopy in art and archaeology. Philos. Trans. R. Soc. A 2016, 374. [Google Scholar] [CrossRef]
  71. Zuo, J.; Changsui, W.; Cunyi, X. Non-Destructive In-Situ Study of White and Black Coating on Painted Pottery Sherds from Bancun Site (Henan, China) by Raman Microscopy. Spectrosc. Lett. 1998, 31, 1431–1440. [Google Scholar] [CrossRef]
  72. Wopenka, B.; Popelka, R.; Pasteris, J.D.; Rotroff, S. Understanding the Mineralogical Composition of Ancient Greek Pottery through Raman Microprobe Spectroscopy. Appl. Spectrosc. 2002, 56, 1320–1328. [Google Scholar] [CrossRef]
  73. Tanevska, V.; Colomban, P.; Minceva-Sukarova, B.; Grupce, O. Characterization of pottery from the republic of Macedonia I: Raman analyses of byzantine glazed pottery excavated from Prilep and Skopje (12th–fourteenth century). J. Raman Spectrosc. 2009, 40, 1240–1248. [Google Scholar] [CrossRef]
  74. Leon, Y.; Lofrumento, C.; Zoppi, A.; Carles, R.; Castellucci, E.M.; Sciau, P. Micro-Raman investigation of terra sigillata slips: A comparative study of central Italian and southern Gaul productions. J. Raman Spectrosc. 2010, 41, 1550–1555. [Google Scholar] [CrossRef]
  75. Raskovska, A.; Minceva-Sukarova, B.; Grupce, O.; Colomban, P. Characterization of pottery from Republic of Macedonia II. Raman and infrared analyses of glazed pottery finds from Skopsko Kale. J. Raman Spectrosc. 2010, 41, 431–439. [Google Scholar] [CrossRef]
  76. Holclajtner-Antunović, I.; Bajuk-Bogdanović, D.; Bikić, V.; Marić-Stojanović, M. Micro-Raman and infrared analysis of medieval pottery findings from Braničevo, Serbia. J. Raman Spectrosc. 2012, 43, 1101–1110. [Google Scholar] [CrossRef]
  77. Zuluaga, M.C.; Alonso-Olazabal, A.; Olivares, M.; Ortega, L.; Murelaga, X.; Bienes, J.J.; Sarmiento, A.; Etxebarria, N. Classification of glazed potteries from Christian and Muslim territories (Late Medieval Ages, IX–XIII centuries) by micro-Raman spectroscopy. J. Raman Spectrosc. 2012, 43, 1811–1816. [Google Scholar] [CrossRef]
  78. Medeghini, L.; Mignardi, S.; De Vito, C.; Bersani, D.; Lottici, P.P.; Turetta, M.; Nigro, L. The key role of micro-Raman spectroscopy in the study of ancient pottery: The case of pre-classical Jordanian ceramics from the archaeological site of Khirbet al-Batrawy. EJM 2013, 25, 881–893. [Google Scholar] [CrossRef]
  79. Colomban, P. Polymerization degree and Raman identification of ancient glasses used for jewelry, ceramic enamels and mosaics. J. Non-Cryst. Solids 2003, 323, 180–187. [Google Scholar] [CrossRef]
  80. Colomban, P.; Prinsloo, L.C. Optical spectroscopy of silicates and glasses. In Spectroscopic Properties of Inorganic and Organometallic Chemistry; Yarwood, J., Douthwaite, R., Duckett, S., Eds.; RSC Publishing: Cambridge, UK, 2009; Volume 40, pp. 128–150. [Google Scholar]
  81. Colomban, P.; Slodzyck, A. Raman intensity: An important tool to study the structure and phase transitions of amorphous/crystalline materials. Opt. Mater. 2009, 31, 1759–1763. [Google Scholar] [CrossRef]
  82. Colomban, P. Pottery, glass and enamelled artefacts: How to extract information on their manufacture technology, origin and age? In Analytical Archaeometry: Selected Topics; Edwards, H., Vandenabeele, P., Eds.; The Royal Society of Chemistry: Cambridge, UK, 2012; pp. 247–270. [Google Scholar]
  83. Ricciardi, P.; Colomban, P.; Tournié, A.; Milande, V. Nondestructive on-site identification of ancient glasses: Genuine artefacts, embellished pieces or forgeries? J. Raman Spectrosc. 2009, 40, 604–617. [Google Scholar] [CrossRef]
  84. Caggiani, M.; Colomban, P. Raman microspectroscopy for Cultural Heritage studies. Phys. Sci. Rev. 2018, 1–18. [Google Scholar] [CrossRef]
  85. Kock, L.D.; De Waal, D. Raman analysis of ancient pigments on a tile from the Citadel of Algiers. Spectrochim. Acta Part A Mol. Biomol. Spectrosc. 2008, 71, 1348–1354. [Google Scholar] [CrossRef] [PubMed] [Green Version]
  86. Colomban, P.; Sagon, G.; Faurel, X. Differentiation of antique ceramics from the Raman spectra of their coloured glazes and paintings. J. Raman Spectrosc. 2001, 32, 351–360. [Google Scholar] [CrossRef]
  87. Colomban, P.; Treppoz, F. Identification and differentiation of ancient and modern European porcelains by Raman macro and micro-spectroscopy. J. Raman Spectrosc. 2001, 32, 93–102. [Google Scholar] [CrossRef]
  88. Colomban, P.; Liem, N.Q.; Sagon, G.; Tinh, H.X.; Hoành, T.B. Microstructure, composition and processing of 15th century Vietnamese porcelains and celadons. JCH 2003, 4, 187–197. [Google Scholar] [CrossRef]
  89. Colomban, P.; De Laveaucoupet, R.; Milande, V. On-site Raman spectroscopic analysis of Kutahya fritwares. J. Raman Spectrosc. 2005, 36, 857–863. [Google Scholar] [CrossRef]
  90. Caggiani, M.C.; Colomban, P.; Valotteau, C.; Mangone, A.; Cambon, P. Mobile Raman spectroscopy analysis of ancient enamelled glass masterpieces. Anal. Meth. 2013, 5, 4345–4354. [Google Scholar] [CrossRef]
  91. Caggiani, M.C.; Valotteau, C.; Colomban, P. Inside the glassmaker technology: Search of Raman criteria to discriminate between Emile Gallé and Philippe-Joseph Brocard enamels and pigment signatures. J. Raman Spectrosc. 2014, 45, 456–464. [Google Scholar] [CrossRef]
  92. Ashkenazi, D.; Dvir, O.; Kravits, H.; Klein, S.; Cvikel, D. Decorated floor tiles from the 19th-century Akko Tower shipwreck (Israel): Analysis of pigments and glaze. Dyes Pigment. 2017, 147, 160–174. [Google Scholar] [CrossRef]
  93. Colomban, P.; Maggetti, M.; d’Albis, A. Non-invasive Raman identification of crystalline and glassy phases in a 1781 Sèvres Royal Factory soft paste porcelain plate. J. Am. Ceram. Soc. 2018, 38, 5228–5233. [Google Scholar] [CrossRef]
  94. Ghiribelli, B.; Frezzotti, M.L.; Palmeri, R. Coesite in eclogites of the Lanterman Range (Antarctica): Evidence from textural and Raman studies. EJM 2002, 14, 355–360. [Google Scholar] [CrossRef]
  95. Kaindl, R.; Tropper, P.; Deibl, I. A semi-quantitative technique for determination of CO2 in cordierite by Raman spectroscopy in thin sections. EJM 2006, 18, 331–335. [Google Scholar] [CrossRef]
  96. Fries, M.; Steele, A. Raman Spectroscopy and Confocal Raman Imaging in Mineralogy and Petrography. In Confocal Raman Microscopy; Dieing, T., Hollricher, O., Toporski, J., Eds.; Springer Series in Optical Sciences; Springer: Berlin/Heidelberg, Germany, 2010; Volume 158. [Google Scholar]
  97. Acosta-Maeda, T.E.; Scott, E.R.D.; Sharma, S.K.; Misra, A.K. The pressures and temperatures of meteorite impact: Evidence from micro-Raman mapping of mineral phases in the strongly shocked Taiban ordinary chondrite. Am. Mineral. 2013, 98, 859. [Google Scholar] [CrossRef]
  98. Fenner, C.N. The stability relations of the silica minerals. AJS 1913, 4, 331–338. [Google Scholar] [CrossRef]
  99. Negas, T.; Sorrell, C.A. Silica Transformation in the system PbO-SiO2. J. Am. Ceram. Soc. 1968, 51, 622–625. [Google Scholar] [CrossRef]
  100. Schneider, H.; Flörke, O.W. High-temperature transformation of tridymite single crystals to cristobalite. Zeitschrift für Kristallographie 1986, 175, 165–176. [Google Scholar]
  101. Stevens, S.J.; Hand, R.J.; Sharp, J.H. Polymorphism of silica. J. Mater. Sci. 1997, 32, 2929–2935. [Google Scholar] [CrossRef]
  102. Tarvornpanich, T.; Souza, G.P.; Lee, W.E. Microstructural evolution on firing soda-lime-silica glass fluxed whitewares. J. Am. Ceram. Soc. 2005, 88, 1302–1308. [Google Scholar] [CrossRef]
  103. Artioli, G.; Angelini, I.; Polla, A. Crystals and phase transitions in protohistoric glass materials. Phase Transit. 2008, 81, 233–252. [Google Scholar] [CrossRef]
  104. Tarvornpanich, T.; Souza, G.P.; Lee, W.E. Microstructural evolution in clay-based ceramics, II: Ternary and quaternary mixtures of clay, flux, and quartz filler. J. Am. Ceram. Soc. 2008, 91, 2272–2280. [Google Scholar] [CrossRef]
  105. Bikiaris, D.; Daniilia, S.; Sotiropoulou, S.; Katsimbiri, O.; Pavlidou, E.; Moutsatsou, A.P.; Chryssoulakis, Y. Ochre-differentiation through micro-Raman and micro-FTIR spectroscopies: Application on wall paintings at Meteora and Mount Athos, Greece. Spectrochim. Acta A Mol. Biomol. Spectrosc. 1999, 56, 3–18. [Google Scholar] [CrossRef]
  106. Colomban, P. Lapis lazuli as unexpected blue pigment in Iranian Lâjvardina ceramics. J. Raman Spectrosc. 2003, 34, 420–423. [Google Scholar] [CrossRef]
  107. Froment, F.; Tournié, A.; Colomban, P. Raman identification of natural red to yellow pigments: Ochre and iron-containing ores. J. Raman Spectrosc. 2008, 39, 560–568. [Google Scholar] [CrossRef]
  108. Ospitali, F.; Bersani, D.; Di Lonardo, G.; Lottici, P.P. ‘Green earths’: Vibrational and elemental characterization of glauconites, celadonites and historical pigments. J. Raman Spectrosc. 2008, 39, 1066–1073. [Google Scholar] [CrossRef]
  109. Bacci, M.; Cucci, C.; Del Federico, E.; Ienco, A.; Jerschow, A.; Newman, J.M.; Piccolo, M. An integrated spectroscopic approach for the identification of what distinguishes Afghan lapis lazuli from others. Vib. Spectrosc. 2009, 49, 80–83. [Google Scholar] [CrossRef]
  110. Schmidt, C.M.; Walton, M.S.; Trentelman, K. Characterization of Lapis Lazuli pigments using a multitechnique analytical approach: Implications for identification and geological provenancing. Anal. Chem. 2009, 81, 8513–8518. [Google Scholar] [CrossRef] [PubMed]
  111. Bell, I.M.; Clark, R.J.H.; Gibbs, P.J. Raman spectroscopic library of natural and synthetic pigments (pre- ≈ 1850 AD). Spectrochim. Acta Part A Mol. Biomol. Spectrosc. 1997, 53, 2159–2179. [Google Scholar] [CrossRef]
  112. Caggiani, M.C.; Cosentino, A.; Mangone, A. Pigments Checker version 3.0, a handy set for conservation scientists: A free online Raman spectra database. Microchem. J. 2016, 129, 123–132. [Google Scholar] [CrossRef]
  113. Zoppi, A.; Lofrumento, C.; Castellucci, E.M. Global Raman imaging: A novel tool for compositional analysis. Adv. Laser Technol. 2005, 5850, 5850–5855. [Google Scholar]
  114. Conti, C.; Colombo, C.; Matteini, M.; Realini, M.; Zerbi, G. Micro-Raman mapping on polished cross sections: A tool to define the penetration depth of conservation treatment on cultural heritage. J. Raman Spectrosc. 2010, 41, 1254–1260. [Google Scholar] [CrossRef]
  115. Gradmann, R.; Berthold, C.; Schüssler, U. Composition and colouring agents of historical Islamic glazes measured with EPMA and μ-XRD2. EJM 2015, 27, 325–335. [Google Scholar] [CrossRef]
  116. Rius, J.; Labrador, A.; Crespi, A.; Frontera, C.; Vallcorba, O.; Melgarejo, J.C. Capabilities of through-the- substrate microdiffraction: Application of Patterson-function direct methods to synchrotron data from polished thin sections. J. Synchrotron Rad. 2011, 18, 891–898. [Google Scholar] [CrossRef] [PubMed]
  117. Pradell, T.; Molera, J.; Salvadó, N.; Labrador, A. Synchrotron radiation micro-XRD in the study of glaze technology. Appl. Phys. A 2010, 99, 407–417. [Google Scholar] [CrossRef]
  118. Rius, J.; Vallcorba, O.; Frontera, C.; Peral, I.; Crespi, A.; Miravitlles, C. Application of synchrotron through-the-substrate microdiffraction to crystals in polished thin sections. IUCrJ 2015, 2, 452–463. [Google Scholar] [CrossRef] [PubMed]
  119. Maritan, L.; Piovesan, R.; Dalconi, M.C.; Rius, J.; Crespi, A.; Vallcorba, O.; Casas, L.; Vidale, M.; Olivieri, L. Looking Like Gold: Chlorite and Talc Transformation in the Golden Slip Ware Production (Swat Valley, North-Western Pakistan). Minerals 2018, 8, 200. [Google Scholar] [CrossRef]
  120. Vallcorba, O.; Casas, L.; Colombo, F.; Frontera, C.; Rius, J. First terrestrial occurrence of the complex phosphate chladniite: Crystal-structure refinement by synchrotron through-the-substrate microdiffraction. EJM 2017, 29, 287–293. [Google Scholar] [CrossRef]
  121. Cameirana, A. La ceramica albisolese a “Taches Noires”. In Atti del X Convegno Internazionale della Ceramica; Centro Ligure per la Storia della Ceramica, All’Insegna del Giglio: Firenze, Italy, 1977; pp. 277–293. [Google Scholar]
  122. Capelli, C.; Di Febo, R.; Amouric, H.; Cabella, R.; Vallauri, L. Importazioni e imitazioni locali di ceramica a Taches Noires in Provenza nel XVIII-XIX secolo. Dati archaeologici e archaeometrici. In Atti del XLIX Convegno Internazionale della Ceramica; Centro Ligure per la Storia della Ceramica, All’Insegna del Giglio: Firenze, Italy, 2017; pp. 339–345. [Google Scholar]
  123. Coll Conesa, J.; Pérez, J.; Pradell, T.; Molera, J.; Capelli, C.; Blanes, S.; Caroscio, M.; Di Febo, R. La loza negra de Manises hallada en El barri d’els Obradors. In Actas del XIX Congreso de la Asociación de Ceramología: Obra Negra y Alfarería de Cocina; Museo de la terrissa de Quart: Girona, Spain, 2017. [Google Scholar]
  124. Capelli, C.; Richez, F.; Vallauri, L.; Cabella, R.; Di Febo, R. L’epave du Grand Congloue 4: Caracterisation archeologique et archeometrique d’un lot de ceramiques a Taches Noires de Albisola-Savona. In Atti XLV Convegno Internazionale Della Ceramica; Centro Ligure per la Storia della Ceramica: Firenze, Italy, 2013; pp. 7–16. [Google Scholar]
Figure 1. (a) An optical image of the glaze decoration taken with a digital microscope: A white and a blue glaze layer can be observed. (b) A photomicrograph of the glaze and its decoration (TL): The decoration is made up by a transparent blue glaze over a less transparent (white) glaze. In the interface between both glazes, some acicular neo-formed crystallites can be seen (indicated with a red rectangle). (c) A photomicrograph of the decoration (TL): Detail of the acicular crystallites is arranged as radial aggregates. (d) The same area as in Figure 1b (RL): The radial aggregates of the crystallites are not visible on the polished surface.
Minerals 09 00113 g001
Figure 2. (a) A photomicrograph of the blue glaze decoration under TL: Acicular crystallites of Pb–Ca arsenates are visible in the thin section. (b) A back scattering mode (BSE) image of the same area as Figure 2a: On the polished surface, the acicular crystallites appear as rounded/tabular crystals; some hexagonal sections could be seen with higher magnification.
Minerals 09 00113 g002
Figure 3. (a) A photomicrograph of the brown decoration area (TL): Dark brown bipyramidal crystallites (br1) and brown thin needle-like crystals of braunite (br2) can be observed. The picture in TL clearly shows how the br2 crystallites have grown from br1 and made up aggregates which form a dendritic texture. (b) The detail (red rectangle) of the crystallites in Figure 3a at higher magnification. (c) The same area as Figure 3a in RL: br1 appears as a light spot, while br2 is scarcely visible on the polished surface. In such a way, the process of growth of br2 from br1 cannot be inferred. (d) The detail of br2 crystallites in BSE images (red rectangle from Figure 3c). The images are adapted from Di Febo et. al., 2017 [35] and Di Febo, 2016 [48].
Minerals 09 00113 g003
Figure 4. (a) A photomicrograph of the ceramic glaze (TL): Hexagonal crystallites are visible and widespread all over the glaze along with acicular melanotekite crystallites. (b) A BSE image of the same area as in Figure 4a. As we can see, the microstructural information has gone completely lost: only scarce and very thin grey laminar sections of the hexagonal crystallites are visible (e.g., as indicated by the arrow) along with sections of melanotekite crystals (head arrow shaped crystals in lighter tones). The images are adapted from Di Febo et al., 2018 [37].
Minerals 09 00113 g004
Figure 5. (a) A polished block, which includes three samples of glazed ceramics embedded in an epoxy-resin, is visible. (b) A covered thin section obtained from the same block of Figure 5a. (c) A schematic representation of a sectioned sample exhibiting three different kinds of mineral associations (X1, X2, and X3). The type X3 shape is not exactly the same on both polished surfaces, and it could even be absent in one of them; this could actually occur for any kind of mineral.
Minerals 09 00113 g005
Figure 6. (a) A SEM backscattering image of the ceramic glaze: In the BSE image, the brightest grains (I) correspond to galena, while lanarkite (II) and mattheddleite (III) are darker and cannot be differentiated. (b) The same area as in Figure 6a in reflected light (RL): Galena (I) appears very reflective while lanarkite (II) shows a pronounced negative polishing relief and a lower reflectivity compared to mattheddleite (III); the inset is the hexagonal section of lanarkite under cross-polarized light (XPL). The images are adapted from Di Febo et al. (2017) [32] and Di Febo, 2016 [48].
Minerals 09 00113 g006
Figure 7. The Raman spectra of cristobalite and hematite: Minerals from the “Systematic Collection of Minerals” of the University of Barcelona (UB, Spain) were used as reference patterns for the Raman study. (a) A photomicrograph of cristobalite (lower reflectance) and hematite (higher reflectance) crystallites in a ceramic glaze (RL); the image has been acquired by using a camera coupled to the Raman spectrometer. (b) The Raman spectra acquired on a crystallite of cristobalite. (c) The Raman spectra acquired on a crystallite of hematite.
Minerals 09 00113 g007
Figure 8. The Raman spectra of the crystals from the melanotekite–kentrolite series acquired using polished thin sections (data not published): Minerals from the “Systematic Collection of Minerals” of the University of Barcelona (UB, Spain) were used as reference patterns for the Raman study. (a) A photomicrograph of a melanotekite-type (Pb2Fe1.6Mn0.4Si2O9) crystallite in a ceramic glaze acquired from a Raman camera (RL). (b) The Raman spectra acquired on the crystallite from Figure 8a compared with a reference spectrum of melanotekite. (c) A photomicrograph of a kentrolite-type (Pb2Fe0.6Mn1.4Si2O9) crystallite in a ceramic glaze acquired from a Raman camera (RL). (d) The Raman spectra acquired on a crystallite from Figure 8c compared with a reference spectrum of kentrolite.
Minerals 09 00113 g008
Figure 9. (a) A photomicrograph of crystallite exhibiting a distinguishable hexagonal face (TL). (b) The same image as Figure 9a taken from the microscope coupled to the inVia Qontor Raman system. (c) A focused optical image of one of the layers within the inspected volume. (d) The compositional mapping of the presence of quartz (blue) on the layer seen in Figure 9c. (e) A 3-D mapping of quartz (blue) and cristobalite (red) within the inspected volume along with two Raman spectra from the volume showing the agreement between the measured spectra and the reference spectra for quartz and cristobalite. The measurements were performed using a ×100 objective with a numerical aperture of 0.85 and a laser wavelength of 532 nm that provides a vertical resolution of around 1 μm.
Minerals 09 00113 g009
Figure 10. (a) A photomicrograph of a brown decoration from a ceramic glaze (TL). (b) The same image as Figure 10a taken from the camera coupled to the micro-diffraction apparatus at ALBA Synchrotron Facility: the red dot represents the beam spot size (approx. 15 µm); the inset shows the camera and sample holder showing a mounted thin section. (c) The sum of several 2-D diffraction frames obtained at the point defined by the red dot in Figure 10b. (d) The diffraction pattern obtained from the 2-D diffraction frames after the removal of the background: the diffraction peaks have been indexed according to the quartz and hematite structures; the inset is the raw diffraction pattern without the removal of the background.
Minerals 09 00113 g010

