Article

Representativity of 2D Shape Parameters for Mineral Particles in Quantitative Petrography

by
Edgar Berrezueta
1,*,
José Cuervas-Mons
2,
Ángel Rodríguez-Rey
2 and
Berta Ordóñez-Casado
1
1
Geological and Mining Institute of Spain (IGME), C/Matemático Pedrayes 25, 33005 Oviedo, Spain
2
Department of Geology, University of Oviedo, C/Jesús Arias de Velasco s/n, 33005 Oviedo, Spain
*
Author to whom correspondence should be addressed.
Minerals 2019, 9(12), 768; https://doi.org/10.3390/min9120768
Submission received: 5 November 2019 / Revised: 4 December 2019 / Accepted: 6 December 2019 / Published: 11 December 2019
(This article belongs to the Special Issue Microtexture Characterization of Rocks and Minerals)

Abstract

:
This paper introduces an assessment of the representation of shape parameter measurements on theoretical particles. The aim of the study was to establish a numerical method for estimating sphericity, roundness, and roughness on artificially designed particles and to evaluate their interdependence. The parameters studied included a fractal dimension (FD), solidity (So), Wadell’s roundness (Rw), a perimeter-area normalized ratio (¥), and sphericity (S). The methods of the work included: (a) the design of theoretical particles with different shapes, (b) the definition of optimal analysis conditions for automated measurements, (c) the quantification of particle parameters by computer vision-based image processing, and (d) the evaluation of interdependence between the parameters. The study established the minimum sizes required for analysis of the particle shape. These varied depending on the method used (150 pixels or 50 pixels). Evaluating the relationships between the parameters showed that FD and So are independent of S. Nevertheless, Rw and ¥ are clearly dependent on S and, thus, must be numerically corrected to Rwc and ¥c. FD, So, Rwc, and ¥c were used to establish, mathematically, a new regularity parameter (RBC) that reflects the degree of roundness of a particle. The process was applied to a case study and the evaluation of all parameters corroborated previous petrographic characterizations.

Graphical Abstract

1. Introduction

1.1. Overview

The morphological characteristics of a particle can be considered at different scales including: Shape (medium-scale) and surface texture (small-scale). [1] and [2] proposed that the shape of a rock particle could be expressed in terms of three independent descriptors: form (overall shape), roundness (large scale smoothness), and surface texture. Each of these can vary without changes in the other two. On the other hand, Reference [3] proposed to take into account three aspects of grain morphology to describe the geometrical aspect of a particle: shape, roundness, and sphericity. In addition, [1] and [4] argued that the shape represents spatial variation on a large scale and used terms such as sphericity or elongation. [5] used the term form instead of the shape and introduced the term irregularity. In the present study, we use three independent shape parameters: roundness, sphericity, and roughness.
Roundness and its antonym, angularity, represent a variation on the medium-scale. Surface texture or roughness, and their antonym, smoothness, represent a variation on a small scale. Roundness is concerned with the curvature of the corners of a grain and is defined as the smoothness of the angles or corners of the particle. Six categories of roundness for sediment grains have been established and, for each category, one grain of low and one of high sphericity was introduced [3,6,7,8,9]. The six categories are: Very angular, angular, subangular, sub-rounded, rounded, and well-rounded. Two-dimensional particle shape measurements are particularly applicable when individual particles cannot be extracted from the rock matrix (e.g., thin sections under an optical microscope). Microscopic images are two-dimensional. Therefore, they only show part of the shape of the three-dimensional particle. The assessed image is usually of particles lying on their most stable plane on a flat support, i.e., showing the largest projection area.
Traditionally, roundness indices compare the outline of a 2D projection of the particle to a circle. The first comparison defines the roundness as the ratio ri/R, which was shown in [10] (where ri is the radius of the sharpest corner, and R is the radius of the smallest circumscribing sphere). On the other hand, [11] defined the roundness parameter based on the radius of the curvature of particle corners and the radius of the largest inscribed sphere. [6] and [7] used comparison charts with a class limit table for roundness. Some authors considered angularity to be the opposite of roundness, while others considered the degree of angularity [12] to be a combination of the angular relationship between the planes bounding a corner and the distance of the corner from the center of the particle. The overall particle form heavily influences the method. In addition, [12] presented a chart for visually determining the degree of angularity of particles. Two new factors, based on the segmentation of particles and angles, were proposed by [13], namely: shape factor (defined as the deviation of the global particle outline from a circle) and angularity factor (defined in terms of the number and sharpness of the corners, on the discretized inscribed polygon). Another way to quantify roundness is by the circularity parameter of Cox or the shape factor (Sf) [14], called roundness by [15]. This parameter is based on particle area and perimeter (4πA/P2) and has been applied to shape-fabric analysis of deformed grains in a rock [16]. A variation of this parameter is the perimeter over area normalized ratio (PoA) (¥) [17]. This parameter is the inverse of the square root of the shape factor and has been used to assess pore space in sandstone [18].
The convexity or solidity parameter was studied by [19] and defined as the ratio between the area of the silhouette (or profile) and the convex hull of the silhouette. The authors defined the convex hull as the minimum convex polygon to cover an object. The algorithm used in image analysis processing was developed by researchers from [20]. According to [21] and [22], solidity (So) efficiently characterizes the roundness of particles through its description of their concavity or convexity.
The 2D-sphericity (S) parameter, which is also called 2D-circularity, can be defined using several approaches: (a) based on the perimeter, the degree of circularity (Ø) of Wadell [11,23] considers the ratio of the perimeter of a circle with the same area as the particle and the measured perimeter, (b) sphericity (S) can be defined as the ratio of particle width to particle length [6], the inverse of this parameter is ellipticity or the aspect ratio [16] or elongation [24], (c) visual comparison charts of circularity have been used [6], and (d) sphericity can be defined as the ratio of the diameter of the circle with an area equal to the projection of the particle and the diameter of the smallest circle circumscribed in the particle [25].
Less commonly accepted currently is the idea that roundness is the degree to which the overall outline of a particle approaches circularity (or sphericity in 3D). In this sense, sphericity is a measure of how closely the grain shape approaches that of a sphere (or circle, in 2D).
Surface texture or roughness (a small-scale parameter) is the third independent property that defines the shape of a rock particle. It comprises the small, local deviations of a surface from the perfectly flat ideal. The fractal dimension (FD) was introduced by [26], who defined it, for a given profile, as a measure of roughness. According to [27,28,29,30], FD (the slope of some power-law distributions) can be used to measure the roughness of granular materials according to different calculation methods, such as the box counting method or the Richardson method [31]. However, its independence with respect to size should always be taken into consideration.
The definition, and effective use, of quantitative geometrical parameters that directly reflect the degree of sphericity (from spherical to non-spherical), roundness (from round to angular), and roughness (from smooth to rough) are still pending tasks [32]. Most likely, this is because there exist a wide variety of different definitions because of the use of the same geometric features at different scales [33].

1.2. Shape Parameter Quantification

The implementation of digital images in almost all electron and optical microscopes makes quantification more accessible currently. Furthermore, computer vision-based image processing provides shape measurements of particles or granular materials [17,30,34,35,36,37]. The quantification and analysis of particles’ sizes and shapes, and their distribution, have been successfully addressed through the use of: (i) advanced programming using specialized languages (e.g., C++ and Visual basic) or software (i.e., Matlab) with a specific image processing tool box (i.e., [38,39]), (ii) commercial image processing software (e.g., Image-Pro Plus®, Aphelion) with morphological functions and a programming module (e.g., Visual basic) to automate the procedure [40], and (iii) free and open source image processing programs (e.g., ImageJ: [35,41]). Due to precision image scales and high data density, observations and measurements are capable of combining roundness and roughness.
As mentioned above, although conceptually the three descriptors of particle form (sphericity, roundness, and roughness) are independent of each other [1,2,23], some parameters that define them lose their independence due to the methods by which they are obtained. According to [36], estimation of the roundness value (Rw), by the method proposed by [23], is conditioned by the value of the roughness of the particle. In this case, the quantification of Rw should include the elimination of the roughness effect. Similarly, [42] found a relationship between FD (roughness) and Krumbein’s roundness number (Rk) [43], defined as FD = 1.0541 – 0.335 Rk. [44] suggested a new roundness parameter (R), based on the circularity of Cox [14], and corrected by the aspect ratio or the inverse of sphericity [33]. Thus, it seems logical to propose a single parameter to group and assess roughness and roundness at the same time. Yet, according to [16], the description of grain shape is possible through two complementary parameters: (i) grain ellipticity (1/S), sensitive to the bulk shape of the particle and independent of particle size, and (ii) the classic shape factor or circularity of Cox (Sf), which is sensitive to the detailed shape of particle boundaries. In this way, the arithmetic average of the shape factor and its standard deviation can be used as a number representative of the grain-boundaries map. A compilation of the parameters described in this introduction is presented in Table 1.

1.3. Objectives

The objectives of this work were: (i) to present a critical assessment of a range of selected shape parameters that would allow us to define the deviations, or limitations, of the individual use of some parameters in the study of the particle shape (i.e., mineral particle shape studied in thin sections) while the shape parameters were selected due to their availability in the computer tools being used and their use in scientific works, (ii) to define the appropriate conditions of minimum particle size (in pixels), and the optimal digital resolution (in dots per inch -DPI-), for particle-shape studies in which the latter is due to its great importance in the quantification of particles by means of digital imaging techniques, and (iii) to introduce the term regularity as a parameter reflecting roundness conditioned by roughness because, in petrographic observations under a microscope (e.g., using a 20× objective), the terms roundness and roughness are often used interchangeably when referring to the roundness of a particle. The regularity indicator was based on a combination of the parameters So, FD, Rw, ¥, and S since they are measured by image analysis tools. Regarding FD, we assumed that it is independent of particle size. The use of this methodology allowed us to quantify parameters that reflect the spatial variation, surface texture, and degree of roundness of particles and, by their combination, to quantify the degree of regularity.

2. Materials and Methods

2.1. Design and Development of Type Particles

Eighteen theoretical type particles (objects) were designed, considering a constant, or quasi-constant, surface area of A ± A × 0.005. Type particles were developed starting from a perfect circle that evolved into other shapes by means of variations in terms of sphericity, roundness, and roughness. Specifically, the changes included varying sphericity from high to low (Figure 1a), varying roundness from rounded to angular (Figure 1b), and varying roughness from very smooth to very rough (Figure 1c). The software used for the design and digitization of the particles was Adobe Illustrator® CS6. Particles of an average diameter of 2.54 cm (1 inch) were taken as a base. The objects were scanned with resolutions of 900, 750, 600, 300, 150, and 75 DPI and saved in a raster format (tif, 8 bits, B/W).

2.2. Parameters and Measurement Techniques

The morphological parameters were selected based on the following considerations: (a) their common use in the quantification of roundness and roughness of particles [17,23,28,45], (b) the possibility of being quantified with the available tools, and (c) the conceptual definition of this study’s objectives.
The selected parameters were: Wadell’s roundness (Rw), solidity (So), sphericity (S), normalized perimeter vs. area ratio (¥), and fractal dimension (FD). Descriptions of the main characteristics, mathematical expressions, and software used for each parameter are presented in Table 2.
The Rw parameter was measured using a routine developed by [24] called toolbox Roussillon, based on Wadell’s process [23]. This application was executed using MS DOS. Cuantification of So, S, and ¥ was done by means of open source software, ImageJ® (v. 1.52), which is compatible with Microsoft® OS with Windows 10 and OS El Capitan®. The fractal dimension was calculated using Image-Pro Plus® (v. 7.0) software, in Microsoft OS with Windows 10, by applying the Richardson Method [31].

2.3. Determination of Analysis Conditions

The digital resolution to be used, and the particle sizes (in pixels) to be characterized, are two factors of great importance in the quantification of particles by means of digital imaging techniques [33]. In this section, the relationship between digital resolution and particle size is approached in a simplified way. The study addressed two procedures that allow for the definition of the minimum particle size for particle-shape studies. The first procedure, based on the works of [36,46,47], focused on changes in the values of shape parameters when they are determined under different resolution conditions. The second assessed the behavior of the area and perimeter parameters of the same particle at different sizes. This procedure, which is based on the work of [44], took different resolutions into account in order to establish the minimum particle size that could be used in the comparison of shape parameters and, importantly, the variations of this limit depends on the optimal minimum resolution (OR). For these estimations, Particle 1 was studied with eight different sizes (2.54, 0.84, 0.42, 0.21, 0.14, 0.0425, 0.0169, and 0.0085 cm).

2.4. Data Acquisition and Evaluation

The selected parameters were measured (average of representative resolutions used) for the 18 particles. The measurements obtained were saved in electronic sheets (Microsoft Excel®), with each particle labelled with a specific identifier. Due to the use of three different programs (ImageJ, Image-Pro Plus, and Roussillon Toolbox), it was necessary to generate a file that would group all the measurements obtained for each particle. In order to facilitate the interpretation of the numerical measurements, type particles were arranged into graphic charts organized by increasing parameter values (e.g., particle template according to Rw and S). These charts were supplemented with qualitative information extracted from visual charts used in particle shape descriptions [6,43,48]. Through mathematical analysis of the measured parameters of the designed, theoretical particles, correlation curves and functions were obtained (e.g., Rw vs. FD, Rw vs. S, FD vs. S, etc.). These analyses were conducted in a previous study [49]. In order to limit the influence of S on other parameters, a correction was applied, based on the methodology proposed by [44].

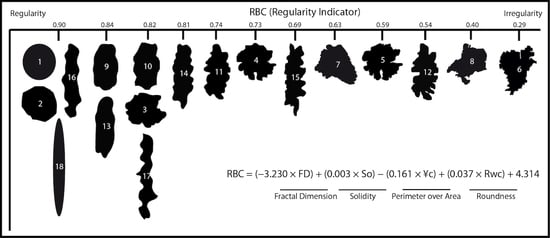
2.5. Estimation of a Regularity Indicator (RBC)

A regularity indicator (RBC) was proposed from the linear combination of the parameters by means of multiple linear regression. The steps comprised: (i) verification of the independence and co-linearity of the variables considered to be independent, to address the development of a polynomial regression, (ii) assignation of a numerical value of the dependent variable (RBC) to each of the 18 particles using published tables and descriptive chart values of particle roundness. This step was carried out by means of estimation by three independent experts in which the values were between 0 and 1, with two decimal places (the numerical estimation was based on a detailed analysis of the work done by various authors [6,7,43,50,51,52]), and (iii) the development of a regularity indicator (RBC) from multiple linear regression.

2.6. Application to A Case Study and Validation

In addition to the analysis of the representativeness of the shape parameters in theoretical particles, the shape parameters (both selected and estimated) were measured on two thin sections. We selected two sandstones with previous petrographic studies available [45,53]. One of them was heterogeneous (SI) and the other was homogeneous (SB). Our goal was to produce an example of the type of information that the proposed methodology could provide when applied to real rock samples. The automated segmentation of quartz particles was carried out in previous studies [40,54] by applying a segmentation algorithm developed in Aphelion 3.2. In addition, the evaluation process proposed by [16] was applied on samples from a case study. In detail, circularity of Cox (Sf), including its arithmetic average and standard deviation, were calculated on quartz particles. It is important to understand that the data obtained under image measurements by optical image analysis (OIA) are representative only of the studied target population (in this study, two thin sections). Measurements by OIA may not be representative of the sedimentary formation unless there is a representative number of samples. The characterization of sedimentary formations was not within the scope of this work.

3. Results

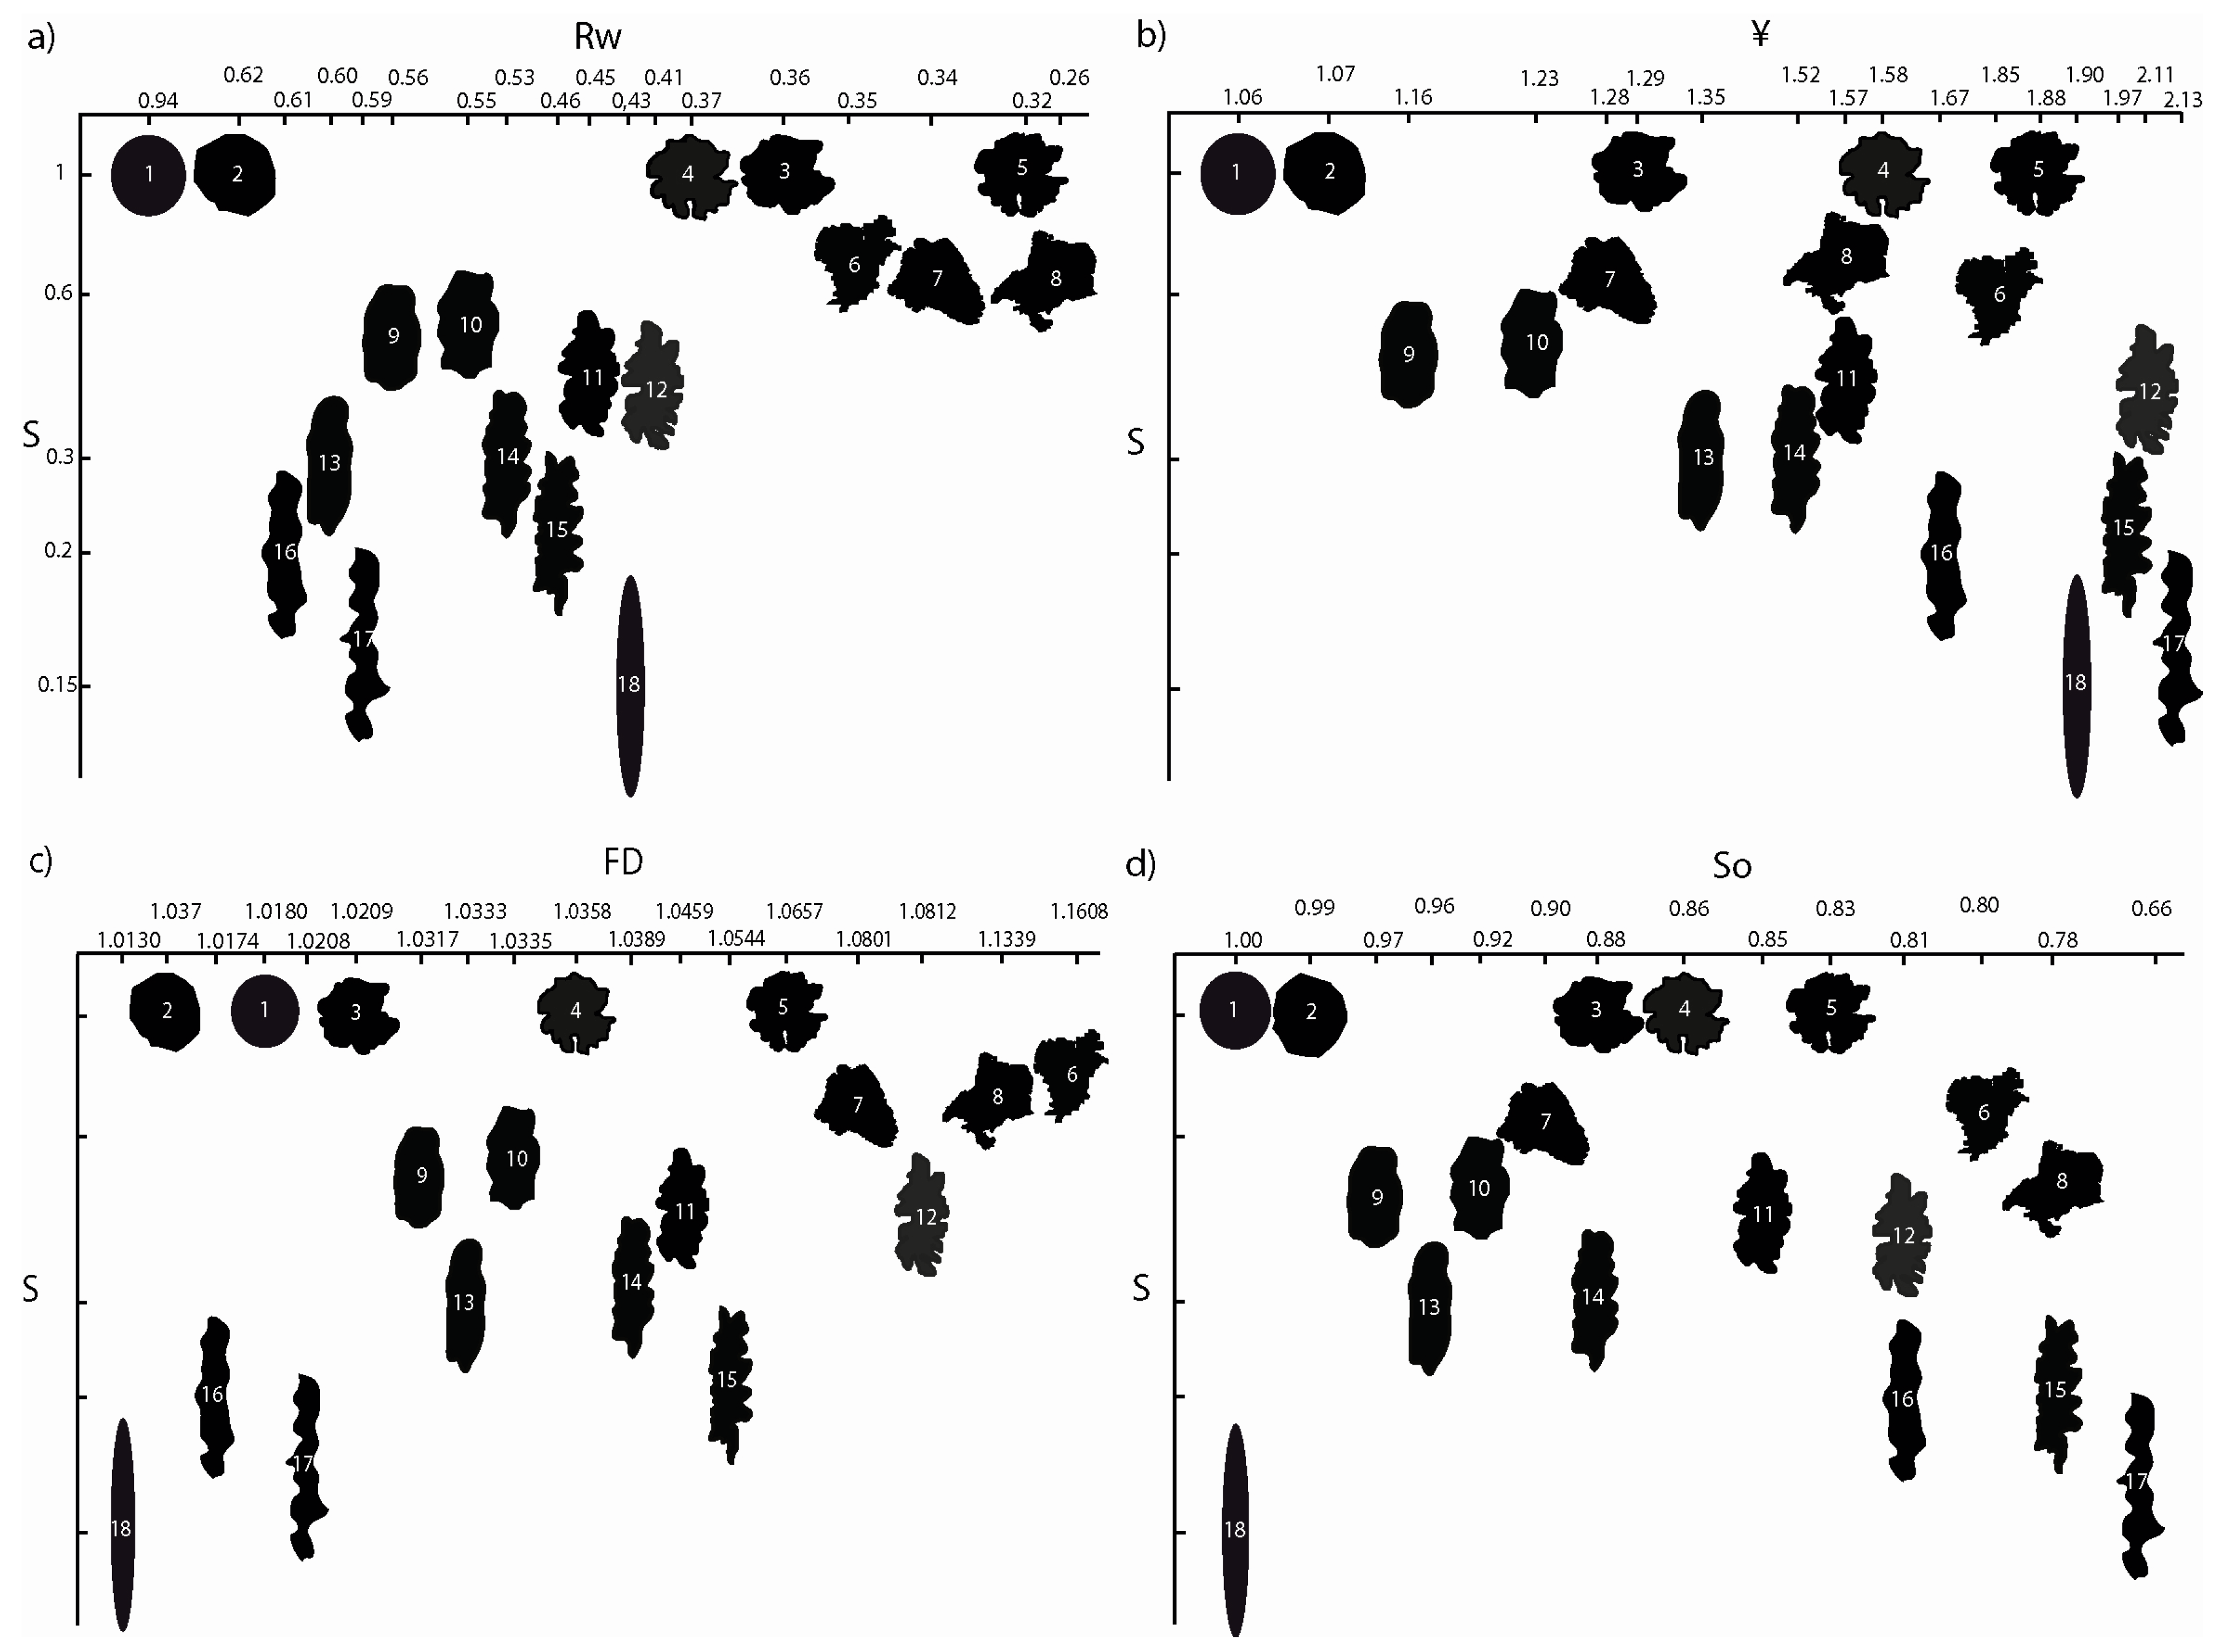
3.1. Description of Type Particles

The 18 designed and digitized particles are represented in Figure 2. In general, the developed particles fulfill the following design criteria: (a) particle 1 is a perfect sphere and is considered to have maximum roundness and no roughness, (b) sphericity is kept constant and equal to that of particle 1 for particles 2, 3, 4, and 5, while their roundness decreases and their roughness increases (from 2 to 5), (c) sphericity is kept constant (but lower than particles 1 to 5) for particles 6, 7, and 8, while their roundness decreases and their roughness increases (from 6 to 8). Thus, particle 8 has the minimum roundness and maximum roughness of all the designed particles. (d) Sphericity is constant (and similar to particles 6 to 8) for particles 9, 10, 11, and 12, while their roundness decreases and their roughness increases (from 9 to 12). (e) Sphericity is constant (and lower than that of particles 6 to 12) for particles 13, 14, and 15, while their roundness decreases and their roughness increases (from 13 to 15). (f) Sphericity is constant (lower than in particles 13 to 15) for particles 16 and 17, while their roundness decreases and their roughness increases (from 16 to 17), and, lastly, (g) particle 18 has the lowest sphericity of all the designed particles. It has high roundness and minimum roughness.

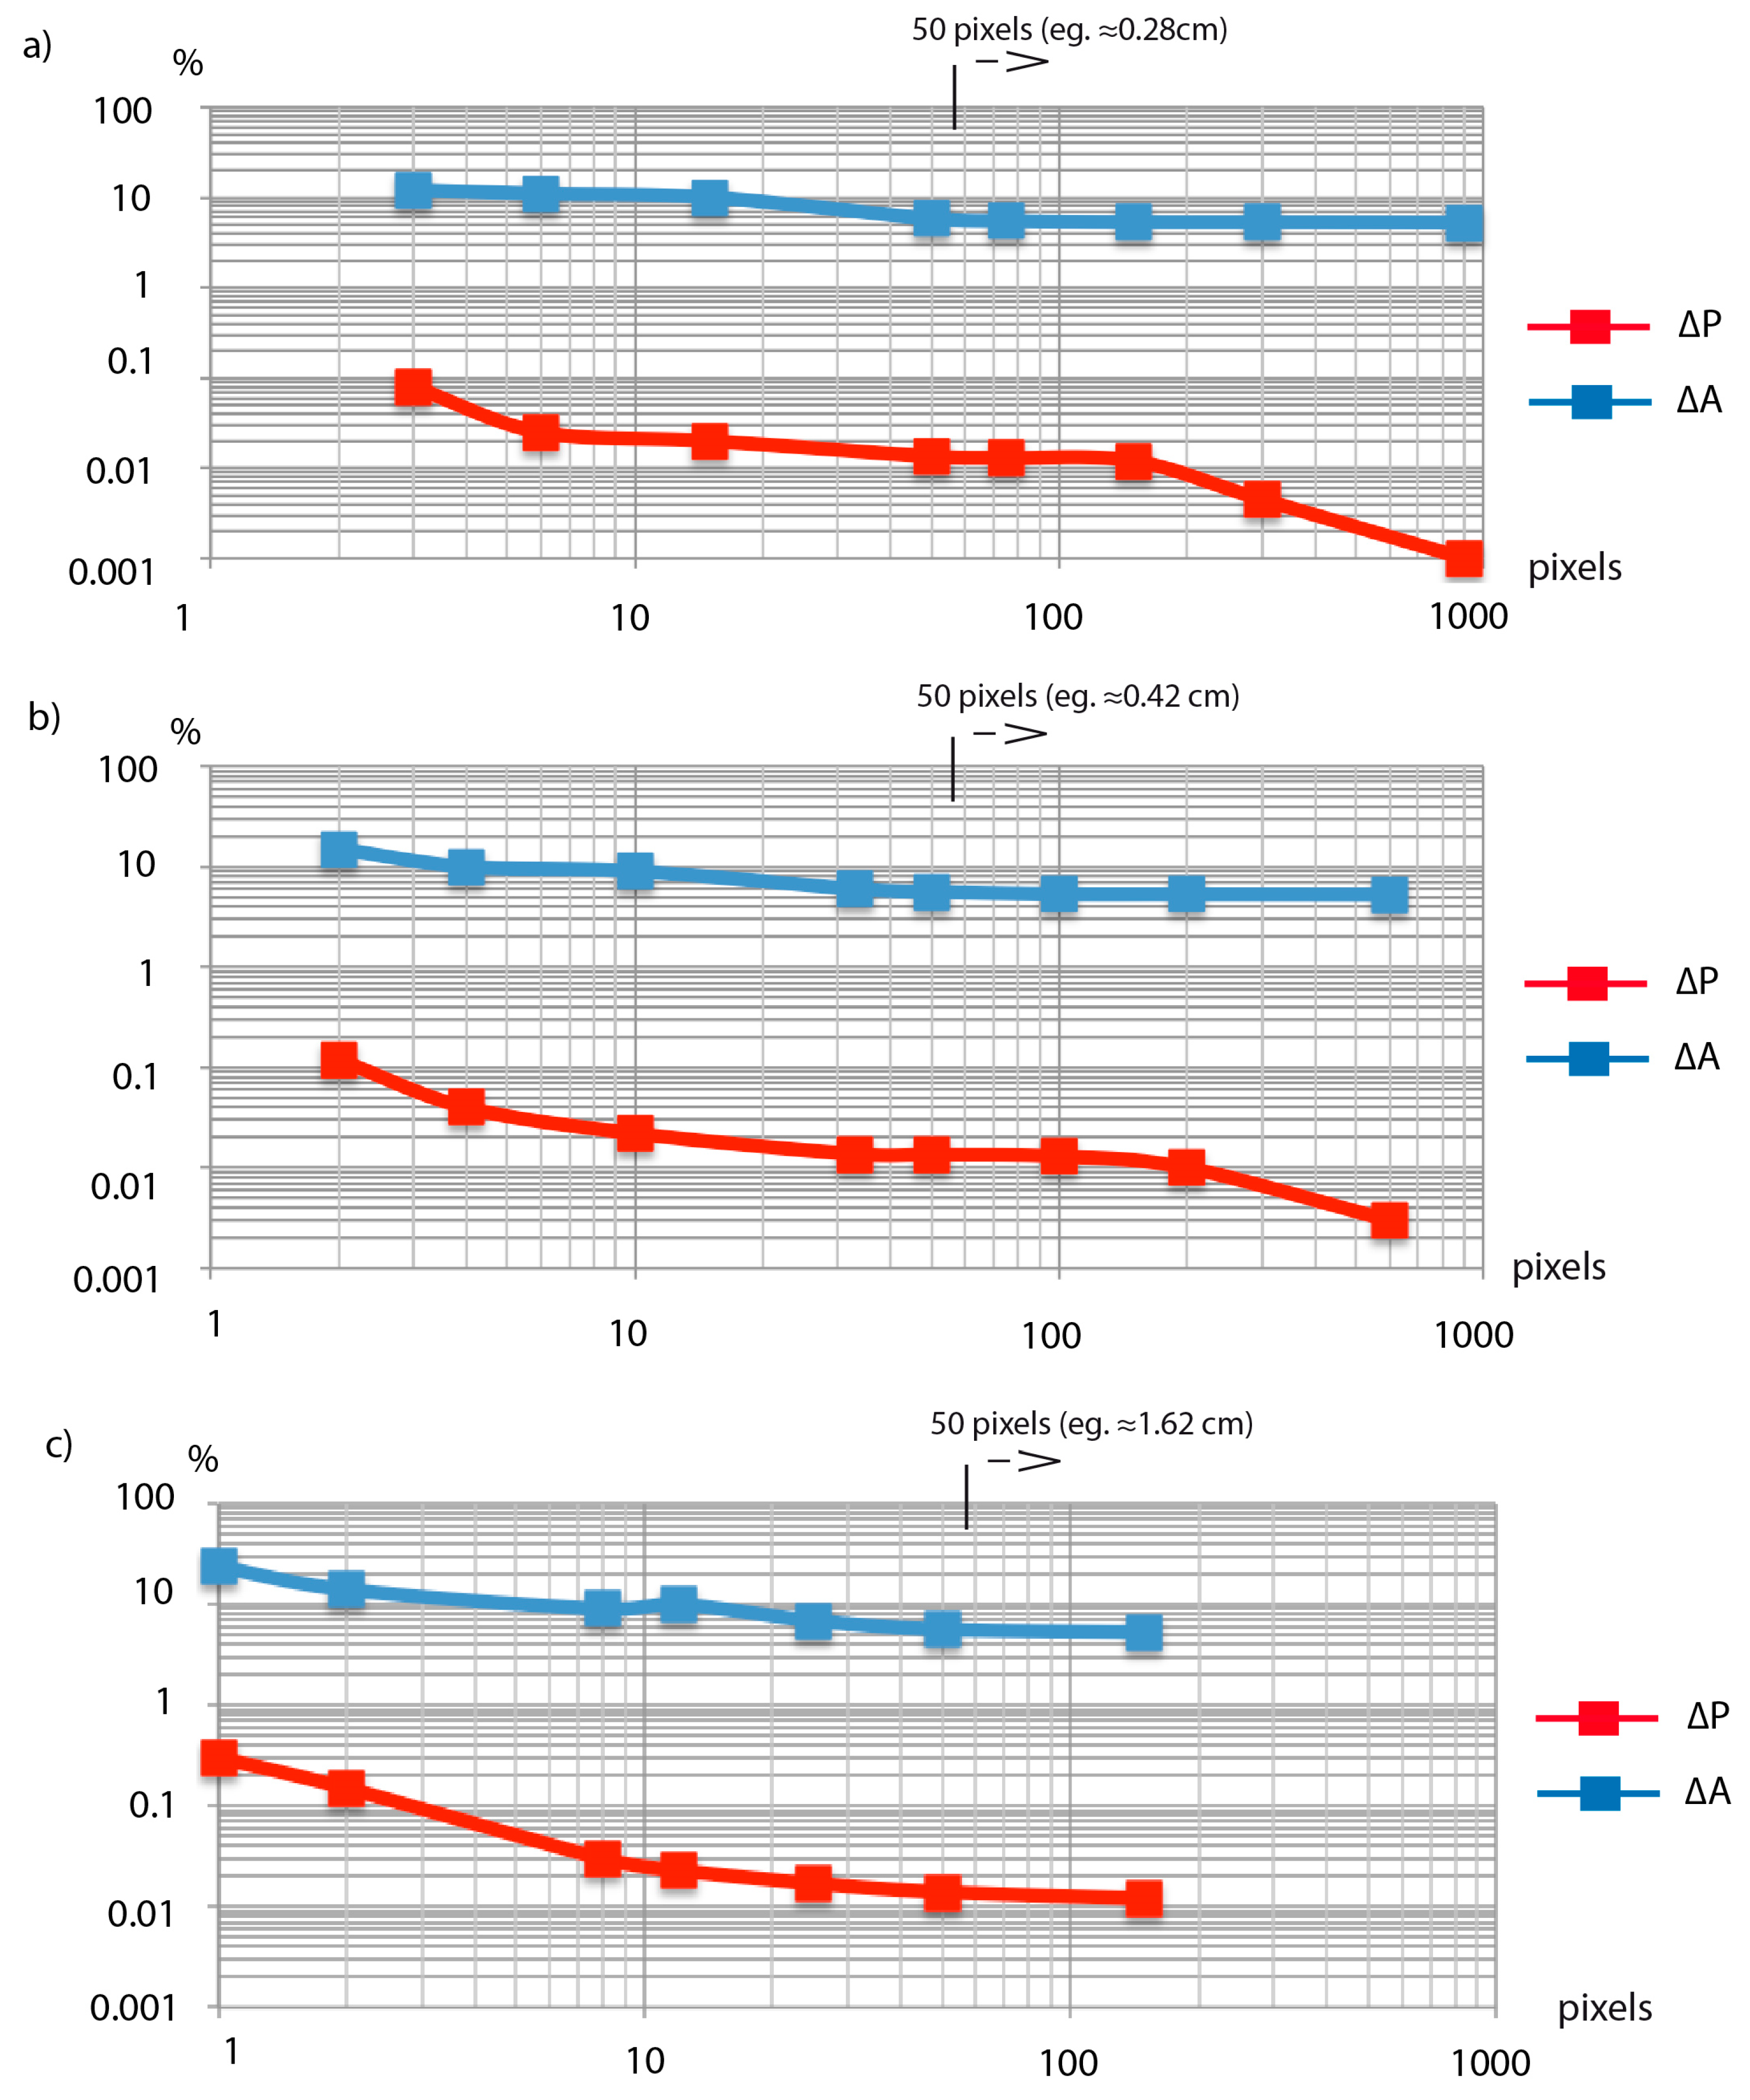
3.2. Optimal Analysis Conditions of Shape Parameters

Morphological parameters obtained for the theoretical type particles (with an average diameter of 2.54 cm (1 inch)) were studied. In particular, the evolution of the values of Rw, So, S, FD, and ¥ was quantified for resolutions of 900, 750, 600, 300, 150, 100, and 75 DPI. Figure 3 shows, in a simplified way, the data of the most significant parameters, specifically FD and Rw, for three different particles. The variations of these morphological parameters tend to stabilize (less than 5% variation) at 150 DPI, which is considered an optimal minimum resolution of work. At the same time, 150 pixels is found to be the minimum size for the study of particle shape, when applying this procedure.
On the other hand, following the procedure published in [44], the measured perimeter and area values were compared to the perimeter and area values calculated from the diameter (Ø), for resolutions of: 900 DPI (where the particle sizes were 900, 300, 150, 75, 50, 15, 6, and 3 pixels), 600 DPI (where the particle sizes were 600, 200, 100, 50, 33, 10, 4, and 2 pixels), and 150 DPI (where the particle sizes were 150, 50, 25, 12, 8, 2, and 1 pixels). The estimated variations of the perimeter and area measurements (ΔP and ΔA) for particle 1 for resolutions of 900, 600, and 150 DPI, are presented in Figure 4. The results for 900, 600, and 150 DPI resolution indicate that, for diameters greater than 50 pixels, the measured values stabilize (ΔP = 5.25% and ΔA = 0.02%). The variations of the perimeter and area measurements, with respect to different particle sizes, are represented as average diameters (Ø) and different digital resolutions, which allowed us to establish the minimum particle size where their variations remain stable. This procedure established 50 pixels as the optimal minimum size (average diameter) to make comparisons between shape parameters (OR).
Through the two proposed procedures, we can establish minimum particle sizes in pixels, which can be translated into metric units (Figure 4). In the case of studying particles obtained with a CCD device coupled to an optical microscope, depending on the used microscope objective and the camera, it is possible to apply the value of 50 or 150 pixels to estimate the minimum particle size. Table 3 presents the minimum particle size (minimum Ø) recommended for comparisons of shape parameters.

3.3. Shape Parameter Evaluation and A New Regularity Indicator (RBC)

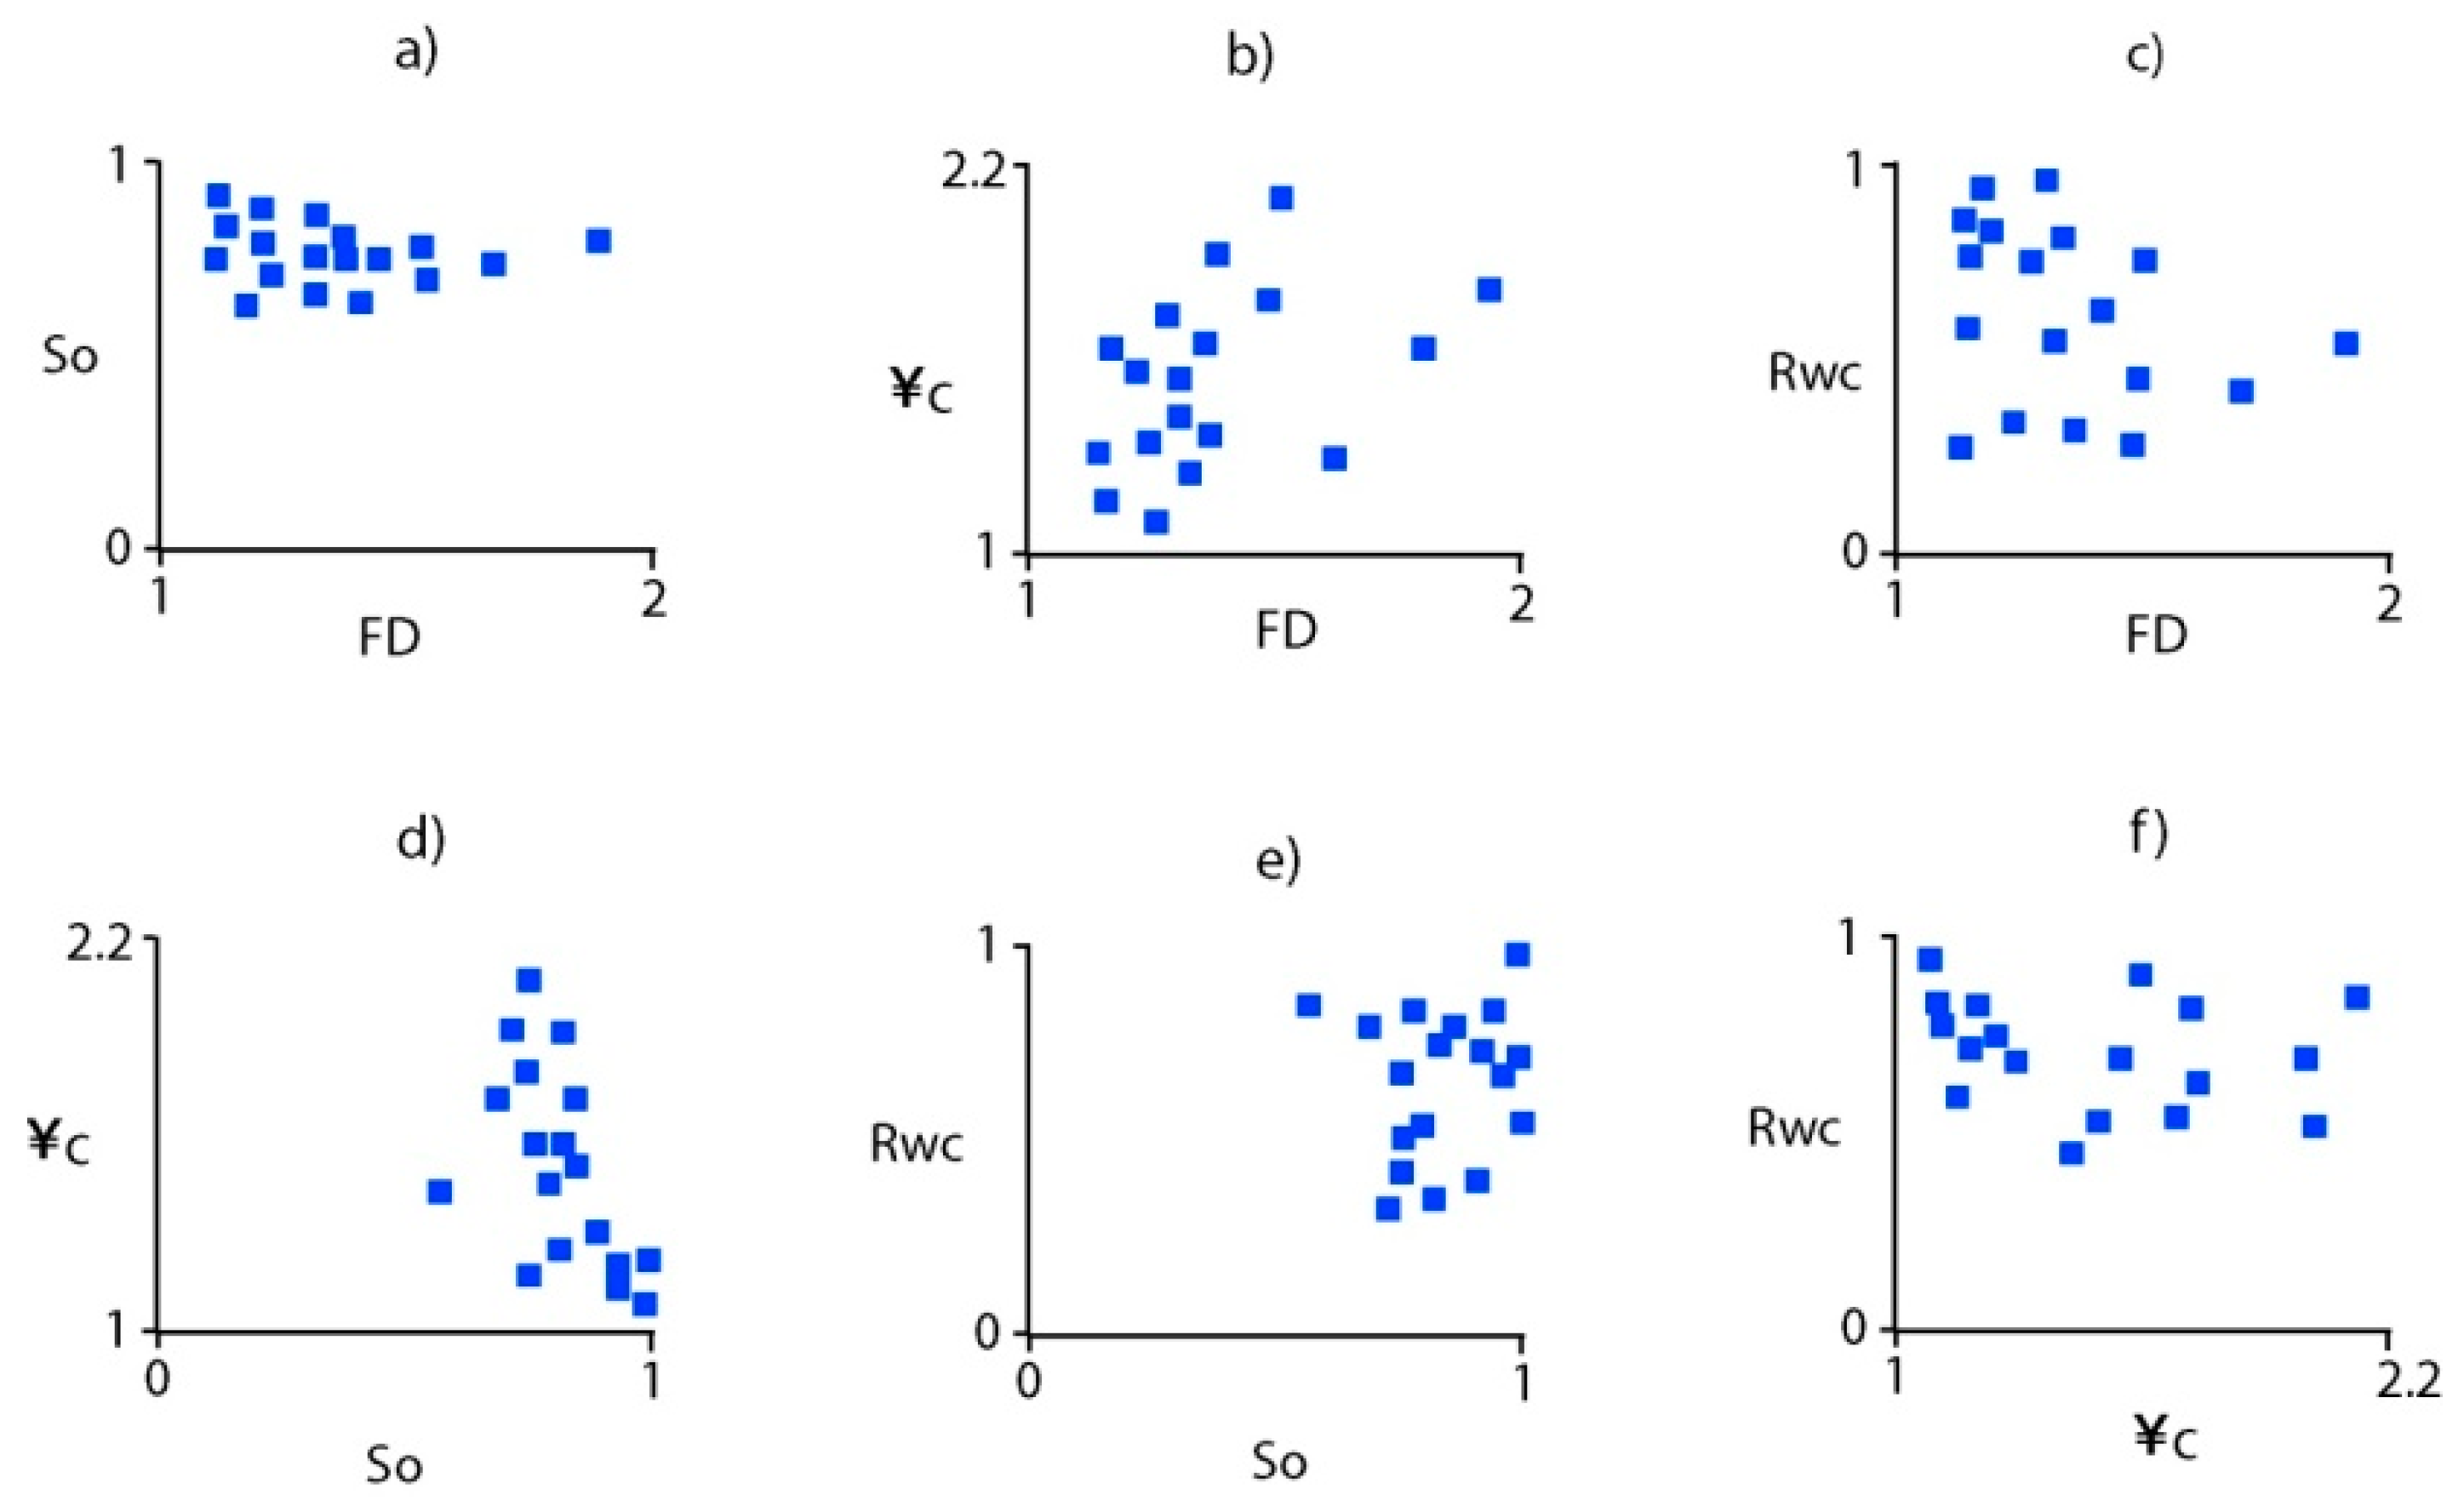
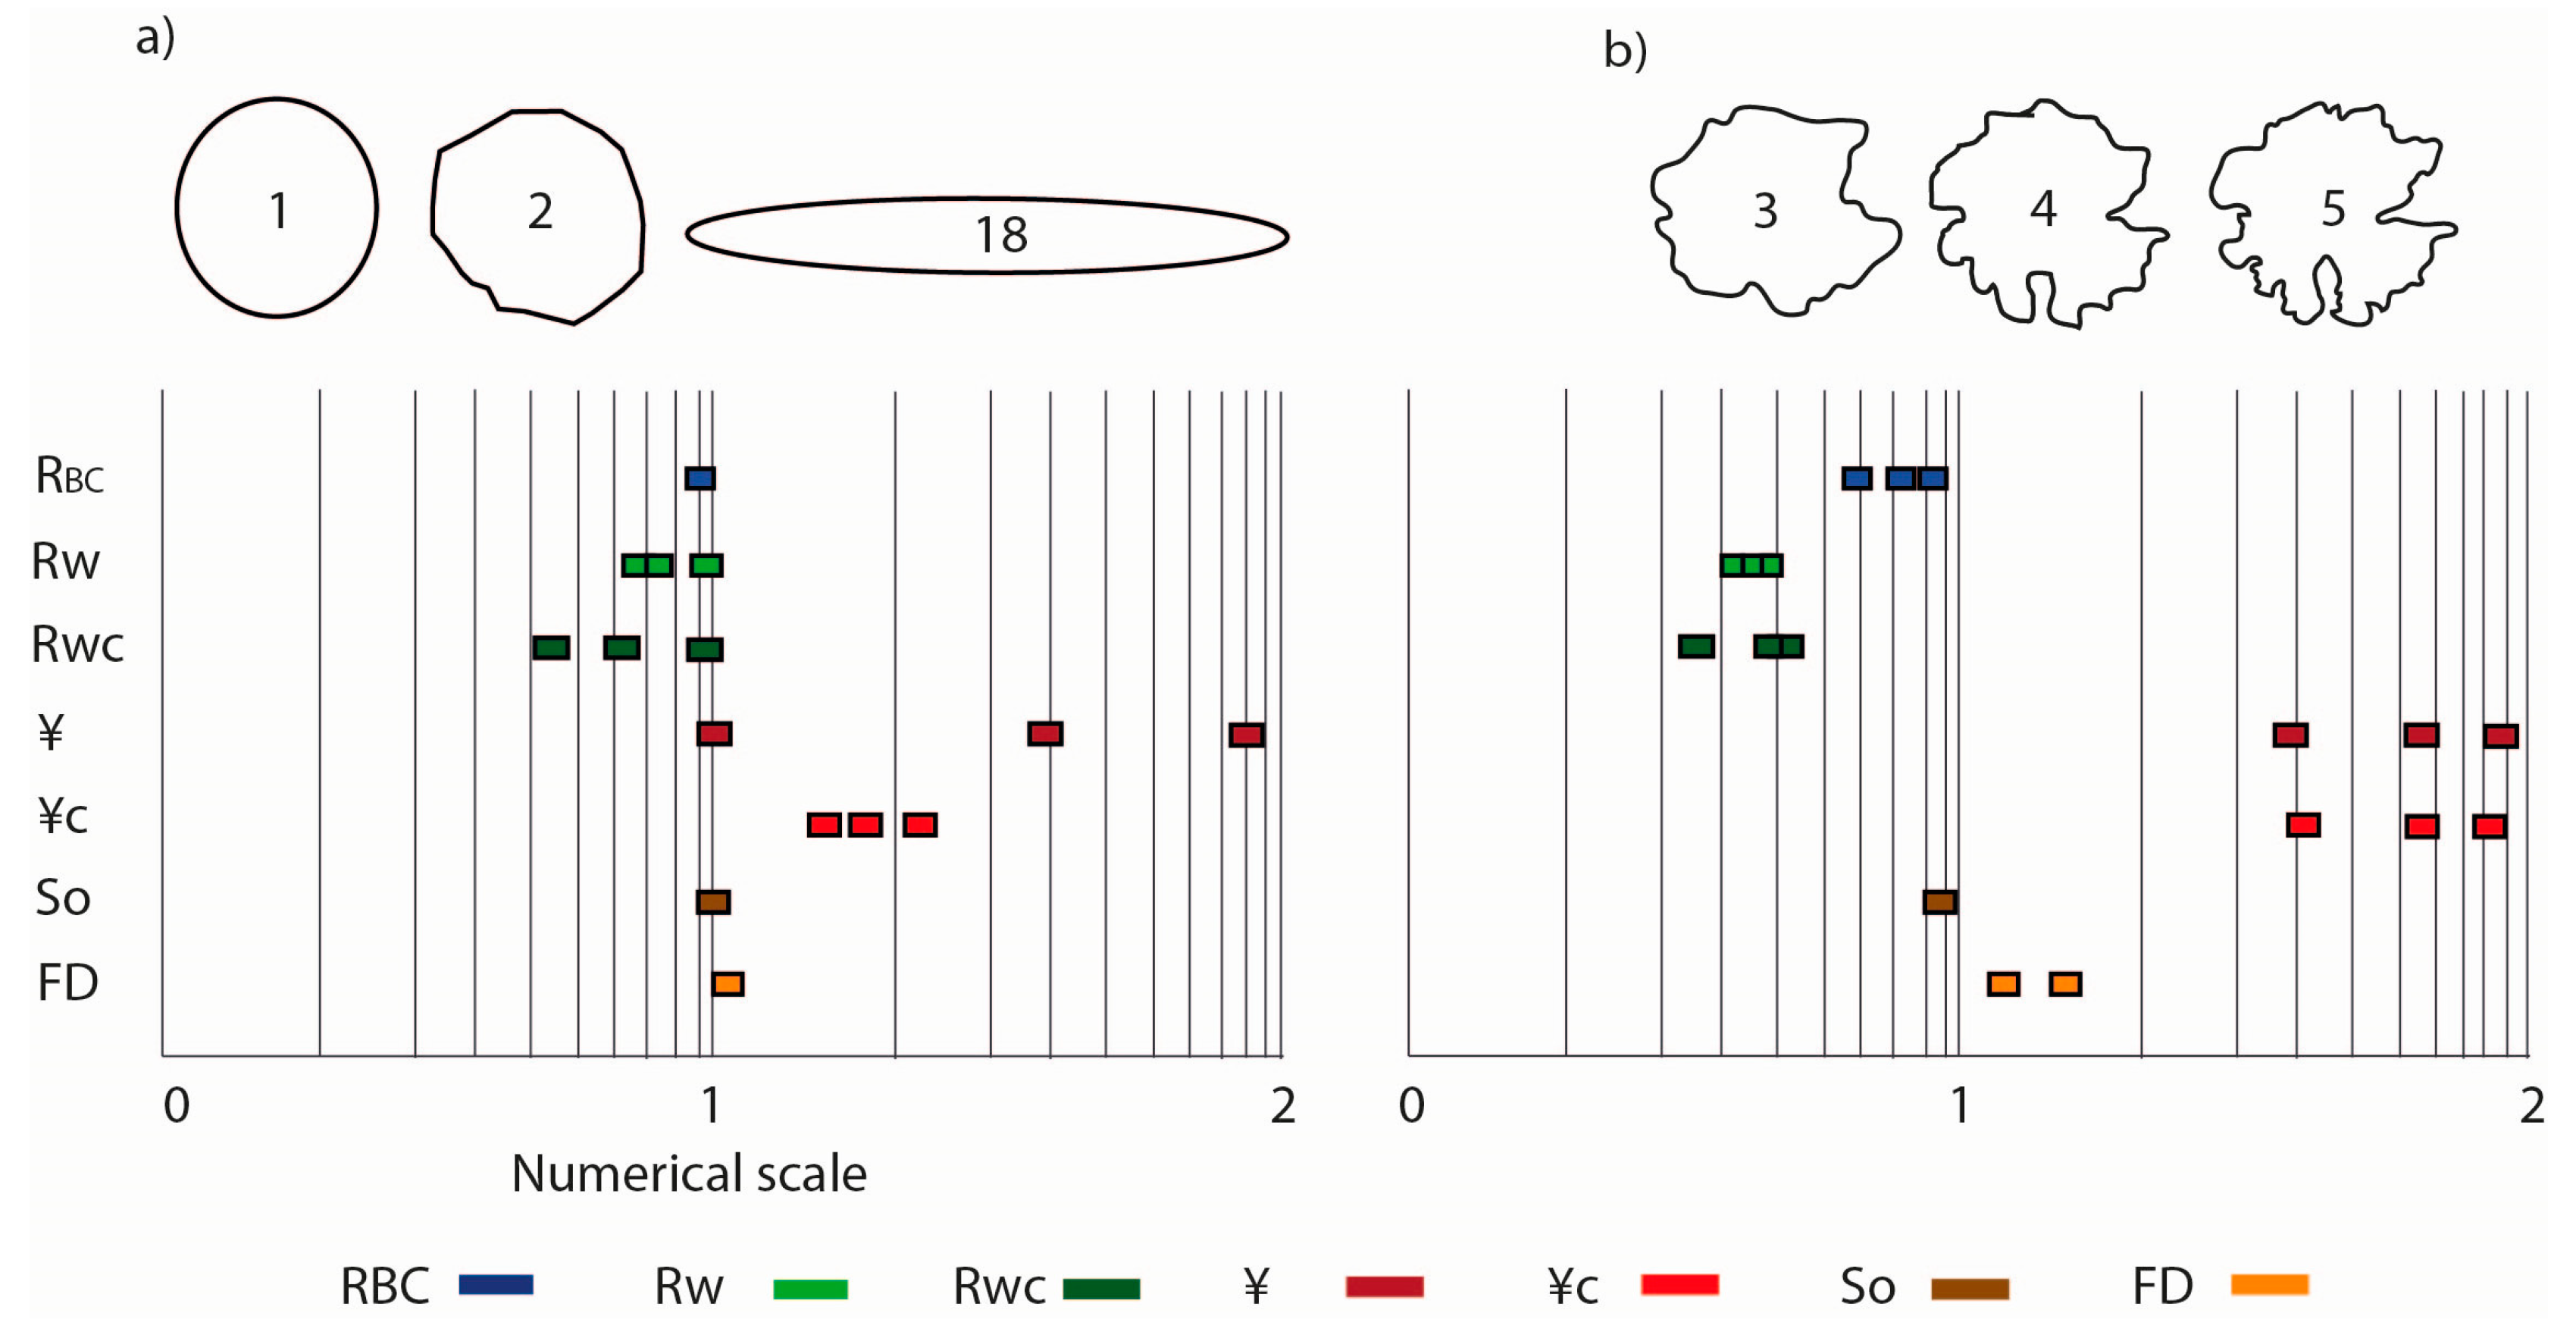
3.3.1. Shape Parameter Evaluation

Data of the morphometric parameters Rw, S, FD, So, and ¥ were produced (average data for 150, 300, 600, 750, and 900 DPI) for the 18 theoretical particles designed (Table 4). Figure 5a shows the raw values obtained. The Rw parameter adequately reflects the roundness of the particles (predefined in design) provided that the comparison is made between particles with the same sphericity (e.g., in particles 1 to 5, the Rw ranges from 0.94 to 0.32). However, when comparing particles with a similar roundness but with different sphericity, the values obtained were not similar (e.g., in particles 1 and 18, the Rw is 0.94 and 0.43, respectively i.e., 54% variation).
Therefore, it adequately reflects the roundness of particles (predefined in design) even though the particles have different sphericity. However, when comparing particles with a similar roundness but with roughness variations, the values obtained were not similar (e.g., in particles 5 to 6, So is 0.83 and 0.80, respectively, i.e., 3.6% variation).
The ¥ parameter adequately reflects the roundness of the particles (predefined in design) provided that the comparison is made between particles with the same sphericity (e.g., in particles 10 to 12, the ¥ values are 1.23 and 2.11, respectively). Although there is an exception in the group of particles 6 to 8 (in particle 7), which is likely due to the influence of the important variation of roughness in these particles. However, when comparing particles with similar roundness, but different sphericity, the values obtained were not similar (e.g., in particles 1 to 18, ¥ is 1 and 1.90, respectively, i.e., 90% variation).
The FD parameter adequately reflects the roughness of the particles (predefined in design) regardless of their sphericity (e.g., in particles 10 to 12, the FD ranges from 1.0335 to 1.0812). However, the values of FD could be conditioned by the variation of particle roundness (e.g., in particles 1 to 2, FD is 1.0180 and 1.0137, respectively, i.e., 0.4% variation).
The graphical comparisons between different parameters are represented in Figure 5b–k. According to a previous study of these theoretical particles [49], Rw, FD, So, and ¥ are independent of each other. However, Rw and ¥ are dependent on S (Figure 6a,b). On the other hand, the independence of parameters FD and So is shown in Figure 6c,d.
In detail, this correction was carried out by applying Equations (2) and (6) based on Equations (1) and (4). Equations (1) and (4) were adaptations of the formula proposed by [44] in the circularity correction of Cox with respect to S. The variables of Equations (1) and (4) are as follows: (a) the parameters Rwn and ¥n represent the values of Rw and ¥ of each of the evaluated particles, (b) the parameters Rwo and ¥o correspond to the value of Rw and ¥ of a perfectly spherical particle (e.g., particle 1 in this work), and (c) the parameters Rws and ¥s (Equations (2) and (3)) represent the corrected values of Rw and ¥ with respect to S of each of the evaluated particles. This correction was made by adapting the proposal of Reference [44] that developed a sixth-grade equation to a quadratic equation (Equations (2) and (3)). The formulas for the correction of Rw and ¥ are presented below.
Rwc = Rwn + (Rwo − Rws)
where Rwn = 1 to 18, Rwo = 0.94
Rws = 1.2606 × S2 − 0.9590 × S + 0.7405
Rwc = Rwn + (0.94 − (1.2606 × S2 − 0.9590 × S + 0.7405))
¥c = ¥n + (¥o − ¥s)
where ¥n: 1 to 18, ¥o: 1.06
¥s = 2.1469 × S2 − 3.2132 × S + 2.2131
¥c = ¥n + (1.06 − (2.1469 × S2 − 3.2132 × S + 2.2131))
The Rwc parameter continues to adequately reflect the roundness of the particles (predefined in design) between particles with the same sphericity (e.g., in particles 1 to 5, the Rwc ranges from 0.94 to 0.26). In addition, when comparing particles with a similar roundness but with different sphericity, the value obtained is close to the expected value (e.g., in particles 1 and 18, the Rwc is 0.94 and 0.73, respectively, 21%). Thus, the variation was reduced from 54% for Rw to 21% for the Rwc.
The ¥c parameter continues to adequately reflect the roundness of the particles (predefined in design) between particles with the same sphericity (e.g., in particles 10 to 12, the ¥c is 1.19 and 1.97, respectively). In addition, when comparing particles with a similar roundness but with a different sphericity, the value obtained is close to the expected value (e.g., in particles 1 to 18, ¥c is 1.06 and 1.12, respectively, 10%). Thus, the variation was reduced from 90% for ¥ to 10% for the ¥c.

3.3.2. New Regularity Indicator (RBC)

The variables selected for regression were FD, So, ¥c, and Rwc, after verifying their independence [49] and co-linearity (Figure 7). Assigning numerical values of the dependent variable (RBC1) to each of the 18 particles is shown in Table 4. The multiple linear regression (Table 4) was based on the Equation (7):
RBC = a × FD + b × So + c × ¥c + d × Rwc + e
The application of the mathematical process of linear regression, using the MiniTab (v 18.1) statistical program, allowed us to formulate the specific equation that defined RBC (Equation (8)) based on the general form (Equation (7)).
RBC = (−3.230 × FD) + (0.003 × So) − (0.161 × ¥c) + (0.037 × Rwc) + 4.314
The parameters a, b, c, and d of Equation (7) are shown in Table 4, including their real and normalized values and typical errors. The mean correlation coefficient between RBC and the parameters FD, So, ¥c, and Rwc is R2 = 0.82, and the equation presents a standard deviation of σ = 0.09. The absolute values of the standardized coefficients, a2 = −0.692 and c2 = −0.252 (Table 4), indicate that the independent variables with higher relative importance in the RBC equation are FD and ¥c (roughness and roundness, respectively). The RBC values of each of the 18 particles calculated from Equation (8) are presented in Table 4 as RBC. Figure 8 shows the 18 types of particles ordered according to the RBC parameter (obtained from the linear regression).

3.4. Application and Validation of Shape Parameters

The parameters FD, So, Sf, ¥c, Rwc, and S were applied to two rock samples (of sandstone) in order to estimate the degree of roundness, roughness, and sphericity of quartz particle outlines. In addition, the proposed RBC indicator was applied to estimate its contribution, significance, and reliability with respect to the numerical estimation of the degree of roundness-smoothness of quartz particle outlines. In addition to comparing the average results of the morphometric parameters for the two sandstone samples, we also analyzed the morphometric parameter variation according to the particle size range for each sample.
The rock samples being studied were immature (sediments located close to their source area, with a short transport distance) greywacke/arkosic Triassic sandstones from References [45,53]: (a) the Guadalquivir basin in SE Spain (Linares-Manuel Fm.) labelled the SI sample and (b) the Iberian Range in N-NE Spain (Tiermes Fm.) labelled the SB sample. The mineralogy of the two sandstones studied was similar. They both contained quartz, K-feldspar, phyllosilicates (e.g., sericite and other clays), carbonates, and, in a minor abundance, biotite, muscovite, plagioclase, apatite, and zircon. According to [45,53], the main difference between the two rocks is the texture. The SI sample is more heterogeneous and less well sorted with higher porosity and permeability produced by an interconnected framework of micro-channels. In contrast, the SB sample is more homogeneous and shows better sorting. Its porosity does not include micro-channel structures and is more evenly distributed.
The parameters (FD, So, Sf, ¥c, Rwc, S, and RBC) were measured for 204 quartz particles identified in thin sections of the two samples. In the first, heterogeneous sandstone (SI) (Figure 9a,c), 105 particles were studied. In the second, homogeneous rock type (SB) (Figure 9b,d), 99 particles were studied. Mineral images were obtained with an objective of 4× and digital resolution of 166 DPI. Previous petrographic studies on the selected samples [45,53] found that: (i) in the SI sample (heterogeneous sandstone, Figure 9a), quartz particles had an angular-sub-rounded shape, with grain sizes between 100 microns and 900 microns, (ii) in the SB sample (homogeneous sandstone, Figure 9b), quartz particles had angularity to a sub-rounded shape, with grain sizes between 20 microns and 200 microns. Each parameter was measured for every particle being studied. According to the optimal particle size determined in this work, only particles greater than 80 µm (50 pixels) were considered. In sample SI, all the particles fulfilled the size requirement. In sample SB, 68% of the particles fulfilled the requirement.
The statistical values of the measured parameters are presented in Table 5. All the values discussed here are from particles larger than 50 pixels. The average value of FD is 1.1124 in sample SB and 1.1353 in sample SI, which shows a variation of 2% between the two sandstones. For So, 0.85 is found to be the average value in sample SB and 0.82 in sample SI (giving a variation of 3.65%). The average value of ¥c is lower in sample SB (1.53) than in sample SI (1.65) (with a variation of 7.27%). The obtained average value of Rwc is 0.70 for particles larger than 50 pixels of sample SB, which is higher than the value of 0.57 obtained for sample SI (with a variation of 18.5%). The average value of S is higher in sample SB (0.62) than in sample SI (0.61) (with a variation of 1.63%). Average RBC is found to be 0.50 in SB and 0.40 in SI, which means a variation of 0.10 in absolute terms, and a variation of 25%, in relative terms. However, for a detailed analysis, it is important to consider the ranges of variation with respect to the average value and standard deviation. Thus, for the SI sample, with a 95% confidence level, the average value would be 0.40 ± 2 × 0.23 and, for the SB sample, the average value would be 0.50 ± 2 × 0.18. The individual interpretation of the RBC parameter, combined with the parameters FD, So, ¥c, and Rwc (Table 5) corroborate the previous petrographic interpretation of the two samples [53] in terms of the roundness of their quartz particles.
In addition to the comparison of the average RBC results of the two sandstones, the RBC values measured for the different particle size ranges were also analyzed for both sandstones. Values of the SI sandstone are presented in Figure 10a. In this case, the quartz particles have lower regularity (RBC = 0.37) in the range of 90 to 205 µm in size, while higher regularity (RBC = 0.69) can be observed in the range of 435 to 550 µm in size. In the case of the SB sample (Figure 10b), the quartz particles show lower regularity (RBC = 0.41) in the size range of 197 to 220 µm, and higher regularity (RBC = 0.71) in the size range of 220 to 243 µm.
Figure 10c,d show the simplified results of the same systematic procedure when applied to the other considered particle size (150 pixels or 240 µm). Due to the particularities of the populations (i.e., in sample SB, there are not enough particles larger than 240 µm for a statistically representative measurement), it is not possible to make a direct comparison between the regularity values of the two samples. However, the observed trend indicates higher values for sample SB with respect to SI (SB = 0.71 and SI = 0.46).
Further analysis, using the methodology proposed by Reference [16], gives the results shown in Table 5. In this case, the Sf values (average and standard deviation) for particles bigger than 50 pixels confirm that the heterogeneity of the SI sandstone (with values of 0.40 and 0.16, respectively) is higher than that of sample SB (0.43, 0.12). The application of the average and standard deviation values of the Sf parameter, according to particle size ranges, is presented in Figure 10. In general, both the estimated RBC and Sf values show a correlation and reflect the variation of regularity.

4. Discussion

4.1. Representativity of the Shape Parameters Studied

The shape parameters selected and analyzed in this work were taken from previous studies: FD [27,29], S, Rw, Sf and So [24], Sf [16], S and Rw [55], and ¥ [18]. Adequate evaluation of the representativeness of these parameters was achieved due to the design of 18 theoretical particles developed for this purpose. The particles design was based on previous works that addressed the same theme [5,24,44,56]. The variation of shape properties [1] (specifically of sphericity, roundness, and roughness) in the 18 types of particles were made possible to control the analyzed shape parameters and, therefore, to identify their qualitative and quantitative limitations, when describing particle morphology since it is observed in two-dimensions.
It is important to note that some of the image analysis tools used in this paper (e.g., ImageJ) did not provide the precise conditions needed for the estimation of parameters such as So. Consequently, we have used the So value directly generated by the analysis tool without knowing if this value takes into consideration any parameters (such as roughness) other than roundness [21,22], since cut off amplitudes for noise and roughness were not selected [47,57]. In the case of Rw, although the Roussillon Toolbox provides the analysis conditions, the technique does not allow for the correction of the influence of roughness, as recommended by [36,37].
Analysis of the parameters measured in this study shows that two of them (FD and So) can be considered independent of S, while the other two (Rw and ¥) are dependent on it [49]. Corrected values (for Rwc and ¥c, respectively) were obtained by a mathematical process, adapting the procedure proposed by Reference [44] to correct the influence of S in the value of the Cox circularity. Given that we were not able to separate out the influence of roughness on the Rw parameter, or to know if the So parameter was measuring roundness or roundness-roughness, the approach adopted by this study focused on developing an indicator that includes both roundness and roughness. This new indicator is based on the combination of FD, So, ¥c, and Rwc parameters using a multiple linear regression.

4.2. Minimum Particle Size for Shape Analysis

Regarding the analysis conditions, the minimum particle size that can be characterized by shape parameters has been addressed by several authors [36,44,46]. In this work, two different procedures were used to estimate the minimum size for particle shape analysis. The first procedure was based on the works of [36,46], and provided a minimum value of 150 pixels for the average diameter (Figure 3). However, in [36], the recommended minimum particle size was 200 pixels (diameter of a circle circumscribed inside the particle) in order to ensure that the shape parameter being measured (e.g., S and Rw) was representative. The second procedure was based on the methodology proposed by [44] and it also provided a minimum value of 50 pixels for the average diameter (Figure 4). In contrast with the first procedure, it gave a minimum particle size of 65 pixels.
The difference between the minimum particle sizes estimated in this work with respect to those described in the literature is likely due to the types of particles being studied and the mathematical criteria (Figure 11a) used to estimate the degree of significant changes in the measured values, which, in this work, was 5% to 10%. This variability in the values of minimum particle size, as described in the literature, emphasizes the need to determine, uniquely, the minimum size value for every separate case study. Logically, it is preferable to use the highest possible minimum pixel value. In the case of microscopic images, the use of objectives of higher magnification can always improve the measurements (Figure 11b). However, a balance should be found, so that even the largest particles remain within the range of the optical field of the microscope.

4.3. Application of the Proposed Indicator of Regularity

Figure 12 shows two examples of how the RBC parameter could contribute to a better characterization of particle shape using two sets of the 18 particles studied in this work. On the left (Figure 12a), particles 1, 2, and 18 show values of Rw and ¥, and of Rwc and ¥c, that do not match either of those described in the literature [3,6,7,8,9] or those obtained by visual estimation using reference tables. However, the estimated values of RBC, which are almost the same for the three particles, correspond better with their visual appearance and tend to reduce the differences in outlines of similar roundness. On the other hand, Figure 12b presents another set of three particles (3, 4, and 5). They show similar values of Rw and ¥, and of Rwc and ¥c, which fail to match those described in the literature [3,6,7,8,9] and the values obtained by visual estimations using reference tables. However, in this case, the RBC values tend to increase the differences of the characteristics of the particle profiles and are more in accordance with their visual appearance.
The application of the RBC indicator to the quartz grains observed in thin sections of the two sandstone samples allows us:
(i) To express numerically the characteristics of roundness and roughness of quartz grains in the two sandstones. In particular, the RBC indicator allows us to quantify and compare the different grain shapes of the two sandstones, while expressing their differences in the RBC values (0.50 for sample SB and 0.40 for sample SI). This fact corroborates the qualitative observations and improves the quantitative description defined in Table 5. For example, variations of So (0.85 for SB and 0.82 for SI), FD (1.1124 for SB and 1.1353 for SI), Rwc (0.70 for SB and 0.57 for SI) and ¥c (1.53 for SB and 1.65 for SI). This information is useful because it allows us to explain, numerically, that the SI samples are more heterogeneous and less well sorted than the SB samples. Furthermore, interpretation of regularity (considering the minimum optimal particle sizes), based on the RBC indicator, agrees with the interpretation of the Sf values obtained following the methodology proposed by [16] (low average and high standard deviation Sf values reflect lower regularity of the particle contour). Both methodologies allow us to establish, numerically, that the heterogeneity of the SI sandstone is greater than that of sample SB.
(ii) To provide quantitative information about the roundness and roughness in different grain size ranges. In both types of sandstone, we are able to demonstrate, quantitatively, that particles of smaller sizes have lower regularity values than larger particles. This suggests that both sandstones are immature rocks (i.e., sediments deposited close to their source after a short distance of transportation).

5. Conclusions

The quantification of shape parameters of particle images, using digital image analysis, constitutes a useful contribution to traditional microscopic petrography techniques. The general procedure described herein (i.e., particle parameter quantification) could be further used on images acquired with different devices and/or processing units.
The optimal digital resolution of images and the minimum particle size in pixels are essential factors in OIA to guarantee reliable results. In this case, 150 DPI was found to be the optimal digital resolution and 50 pixels (case b) or 150 pixels (case a) were established as the minimum particle size.
Qualitative and quantitative analysis of the main shape parameters commonly used in the characterization of the shape of 2D particles allowed us to assess their significance for 18 theoretical particles designed and generated specifically for this purpose. It was possible to establish relationships between the different parameters being measured and to define their limitations when quantitatively expressing the properties of the shape of 2D particles. Furthermore, the parameter RBC was estimated from the combination of the parameters FD, So, Rwc, and ¥c. It was obtained by developing a mathematical model based on the application of multiple linear regression and it provides a single value with which to quantify the degree of regularity (roundness conditioned by roughness) of the outline of mineral particles.
The indicator of particle boundary regularity (RBC) proposed in this work, together with the application of parameters FD, So, Rwc, and ¥c on two real case studies (i.e., quartz grains observed in thin sections), provide an important input to particle shape quantification. In one of the studied samples (SI, a poorly sorted sandstone with high porosity and permeability produced by an interconnected framework of micro-channels), the roughness (FD = 1.1353 ± 0.1014), roundness (Rwc = 0.57 ± 0.28), sphericity (S = 0.61 ± 0.32), and regularity (RBC = 0.40 ± 0.46) obtained for quartz particles larger than 50 pixels (80 microns) clearly reflect its heterogeneous nature. Regarding the other example, which is a homogeneous sandstone (SB, with better sorting, more evenly distributed porosity, and without micro-channel structures), the obtained results of shape parameters were: roughness (FD = 1.1124 ± 0.0090), roundness (Rwc = 0.70 ± 0.36), sphericity (S = 0.62 ± 0.32), and regularity (RBC = 0.50 ± 0.36). Although the study was limited to a couple of thin sections, the values prove that the morphometric properties of particles are key to the interpretation of the conditions and geological processes involved in the origin, transport, and deposition of sedimentary particles. The interpretation of characteristics such as roundness and roughness in mineral particles observed by a petrographic microscope is a complex process that can be simplified using a joint interpretation of the measured parameters by adapting the interpretation process to the specific case studied.

Author Contributions

All authors (E.B., J.C.-M., A.R.-R., and B.O.-C.) wrote the paper and participated in designing and performing the experiments by image analysis, discussion, and conclusion of this research article. Part of the work is based on the Master’s thesis of J.C.-M.

Funding

The Spanish National Plan (CGL2017-86487-P PETROCANTABRICA Project) funded this research.

Acknowledgments

The authors would like to thank Cristian Medina, Luís González, Sergio Llana and Francisco Javier Fernández for their suggestions. Thanks are due also to Timea Kovacs and Marianne Copeland for English editing. We also would like to thank two anonymous reviewers for their constructive comments and the editorial office for the editorial handling.

Conflicts of Interest

The authors declare no conflict of interest.

References

  1. Barrett, P.J. The shape of rock particles, a critical review. Sedimentology 1980, 27, 291–303. [Google Scholar] [CrossRef]
  2. Cho, G.C.; Dods, J.; Santamarina, J.C. Particle shape efects o packing density, stiffness and strength: Natural and crushed sands. J. Geotech. Geoenviron. Eng. 2006, 132, 591–602. [Google Scholar] [CrossRef] [Green Version]
  3. Tucker, M.E. Sedimentary Petrology: An Introduction to the Origin of Sedimentary Rocks, 3rd ed.; Blackwell Publishing Limited: Oxford, UK, 2001; 272p. [Google Scholar]
  4. Mitchell, J.K.; Soga, K. Soil composition and engineering properties. In Fundamentals of Soil Behavior, 3rd ed.; John Wiley & Sons: Hoboken, NY, USA, 2005; pp. 83–106. [Google Scholar]
  5. Blott, S.J.; Pye, K. Particle shape: A review and new methods of characterization and classification. Sedimentology 2008, 55, 31–63. [Google Scholar] [CrossRef]
  6. Krumbein, W.C.; Sloss, L.L. Stratigraphy and Sedimentation; W.H. Freeman and Company: San Francisco, CA, USA, 1951; 497p. [Google Scholar]
  7. Powers, M.C. A new roundness scale for Sedimentology particles. J. Sediment. Petrol. 1953, 23, 117–119. [Google Scholar] [CrossRef]
  8. Pettijohn, F.J.; Potter, P.E.; Siever, R. Sand and Sandstone; Springer: New York, NY, USA; Berlin/Heidelberg, Germany, 1973; 618p. [Google Scholar]
  9. Nichols, G. Sedimentology and Stratigraphy; Wiley-Blackwell: Oxford, UK, 2009; 419p. [Google Scholar]
  10. Wentworth, C.K. The Shapes of Beach Pebbles; US Government Printing Office: Washington, DC, USA, 1919; Volume 131, pp. 75–83. [Google Scholar]
  11. Wadell, H.A. Sphericity and roundness of rock particles. J. Geol. 1933, 41, 310–331. [Google Scholar] [CrossRef]
  12. Lees, G. A new method for determining the angularity of particles. Sedimentology 1964, 3, 2–21. [Google Scholar] [CrossRef]
  13. Sukumaran, B.; Ashmawy, A.K. Quantitative characterisation of the geometry of discrete particles. Geotechnique 2001, 51, 619–627. [Google Scholar] [CrossRef]
  14. Cox, E.P. A method of assigning numerical and percentage values to the degree of roundness of sand grains. J. Paleontol. 1927, 1, 179–183. [Google Scholar]
  15. Janoo, V. Quantification of Shape, Angularity, and Surface Texture of Base Course Materials (No. CRREL-SR-98-1); US Army Corps of Engineers: Washington, DC, USA, 1998; 28p. [Google Scholar]
  16. Fernández, F.J.; Menéndez-Duarte, R.; Aller, J.; Bastida, F. Application of geographical information systems to shape-fabric analysis. Geol. Soc. Lon. Spec. Pub. 2005, 245, 409–420. [Google Scholar] [CrossRef]
  17. Anselmetti, F.S.; Luthi, S.; Eberli, G.P. Quantitative characterization of carbonate pore systems by digital image analysis. AAPG Bull. 1998, 82, 1815–1836. [Google Scholar]
  18. Berrezueta, E.; Kovacs, T. Application of optical image analysis to the assessment of pore space evolution after CO2 injection in sandstones. A case study. J. Pet. Sci. Eng. 2017, 159, 679–690. [Google Scholar] [CrossRef]
  19. Preparata, F.P.; Shamos, M.I. Computational Geometry; Springer: New York, NY, USA, 1985; 390p. [Google Scholar]
  20. Melkman, A.A. On-line construction of the convex hull of simple polygon. Inf. Process. Lett. 1987, 25, 11–12. [Google Scholar] [CrossRef]
  21. Liu, E.J.; Cashman, K.V.; Rust, A.C. Optimizing shape analysis to quantify volcanic ash morphology. GeoResJ. 2015, 8, 14–30. [Google Scholar] [CrossRef] [Green Version]
  22. Chen, S.; Ma, G.; Wang, H.; He, P.; Liu, M.; Wang, H.; Xu, B. Comparison of solidity and fractal dimension of plasma sprayed splat with different spreading morphologies. Appl. Surf. Sci. 2017, 409, 277–284. [Google Scholar] [CrossRef]
  23. Wadell, H.A. Volume, shape and roundness of rock particles. J. Geol. 1932, 40, 443–451. [Google Scholar] [CrossRef]
  24. Roussillon, T.; Piégay, H.; Sivignon, I.; Tougne, L.; Lavigne, F. Automatic computation of pebble roundness using digital imagery and discrete geometry. Comput. Geosci. 2009, 35, 1992–2000. [Google Scholar] [CrossRef]
  25. Rittenhouse, G. A visual method of estimating two-dimensional sphericity. J. Sediment. Petrol. 1943, 13, 79–81. [Google Scholar]
  26. Mandelbrot, B.B. Fractals: Form, Chance and Dimension; W.H. Freeman & Company: San Francisco, CA, USA, 1977; 365p. [Google Scholar]
  27. Vallejo, L.E. Fractal analysis of granular materials. Geotechnique 1995, 45, 159–163. [Google Scholar] [CrossRef]
  28. Vallejo, L.E. Fractals in engineering geology preface. Eng. Geol. 1997, 48, 159–160. [Google Scholar] [CrossRef]
  29. Hyslip, J.P.; Vallejo, L.E. Fractal analysis of the roughness and size distribution of granular materials. Eng. Geol. 1997, 48, 231–244. [Google Scholar] [CrossRef]
  30. Araujo, G.S.; Bicalho, K.V.; Tristao, F.A. Use of digital image analysis combined with fractal theory to determine particle morphology and surface texture of quartz sands. J. Rock Mech. Geotech. Eng. 2017, 9, 1131–1139. [Google Scholar] [CrossRef]
  31. Richardson, L. The problem of contiguity: An appendix to statistics of deadly quarrels. Gen. Syst. Yearb. 1961, 6, 139–187. [Google Scholar]
  32. Santamarina, J.C.; Cho, G.C. Soil Behavior: The Role of Particle Shape. In Proceedings of the Advances in Geotechnical Engineering: The Skempton Conference, London, UK, 29–31 March 2004. [Google Scholar]
  33. Rodríguez, J.; Edeskär, T.; Knutsson, S. Particle shape quantities and measurement techniques: A review. Electron. J. Geotechnique Eng. 2013, 18, 169–198. [Google Scholar]
  34. He, H.; Courard, L.; Pirard, E.; Michel, F. Shape analysis of fine aggregates used for concrete. Image Anal. Stereol. 2016, 35, 159–166. [Google Scholar] [CrossRef] [Green Version]
  35. Igathinathane, C.; Pordesimo, L.O.; Columbus, E.P.; Batchelor, W.D.; Methuku, S.R. Shape identification and particles size distribution from basic shape parameters using ImageJ. Comput. Electron. Agric. 2008, 63, 168–182. [Google Scholar] [CrossRef]
  36. Zheng, J.; Hryciw, R.D. Traditional soil particle sphericity, roundness and surface roughness by computational geometry. Geotechnique 2015, 65, 494–506. [Google Scholar] [CrossRef]
  37. Zheng, J.; Hryciw, R.D. Roundness and sphericity of soil particles in assemblies by computational geometry. J. Comput. Civ. Eng. 2016, 30, 04016021. [Google Scholar] [CrossRef]
  38. Zang, Z.X.; Yan, C.G.; Dong, Z.Y.; Huang, J.; Zang, Y.F. Granger causality analysis implementation on MATLAB: A graphic user interface toolkit for fMRI data processing. J. Neurosci. Methods 2012, 203, 418–426. [Google Scholar] [CrossRef]
  39. Liu, K.; Ostadhassan, M. Multi-scale fractal analysis of pores in shale rocks. J. Appl. Geophys. 2017, 140, 1–10. [Google Scholar] [CrossRef]
  40. Berrezueta, E.; González-Menéndez, L.; Ordóñez-Casado, B.; Olaya, P. Pore network quantification of sandstones under experimental CO2 injection using image analysis. Comput. Geosci. 2015, 77, 97–110. [Google Scholar] [CrossRef]
  41. Schneider, C.A.; Rasband, W.S.; Eliceiri, K.W. NIH Image to ImageJ: 25 years of image analysis. Nat. Methods 2012, 9, 671–675. [Google Scholar] [CrossRef] [PubMed]
  42. Vallejo, L.E.; Zhou, Y. The relationship between the fractal dimension and Krumbein‘s roundness number. Soils Found. 1995, 35, 163–167. [Google Scholar] [CrossRef] [Green Version]
  43. Krumbein, W.C. Measurement and geological significance of shape and roundness of sedimentary particles. J. Sedimentol. Res. 1941, 11, 64–72. [Google Scholar] [CrossRef]
  44. Takashimizu, Y.; Iiyoshi, M. New parameter of roundness R: Circularity corrected by aspect ratio. Prog. Earth Planet. Sci. 2016, 3, 1–16. [Google Scholar] [CrossRef] [Green Version]
  45. Berrezueta, E.; Domínguez-Cuesta, M.J.; Ordóñez-Casado, B.; Medina, C.; Molinero, R. Pore space quantification of sedimentary rocks before-after Supercritical CO2 Interaction by Optical Image Analysis. Energy Procedia 2017, 114, 4382–4393. [Google Scholar] [CrossRef]
  46. Altuhafi, F.; O’Sullivan, C.; Cavarretta, I. Analysis of an image-based method to quantify the size and shape of sand particles. J. Geotech. Geoenviron. Eng. 2013, 139, 1290–1307. [Google Scholar] [CrossRef]
  47. Vangla, P.; Roy, N.; Gali, M.L. Image based shape characterization of granular materials and its effect on kinematics of particle motion. Granul. Mater. 2018, 20, 6. [Google Scholar] [CrossRef]
  48. Krumbein, W.C. The effects of abrasion on the size, shape and roundness of rock fragments. J. Geol. 1941, 49, 482–520. [Google Scholar] [CrossRef]
  49. Cuervas-Mons, J. Estudio de Partículas Minerales Mediante Procesamiento de Imágenes Digitales: Análisis Cualitativo—Cuantitativo de Parámetros de Forma; Trabajo Fin de Máster; Universidad de Oviedo: Oviedo, Spain, 2019; 62p. [Google Scholar]
  50. Russel, R.D.; Taylor, R.E. Roundness and shape of Mississippi river sands. J. Geol. 1937, 45, 225–267. [Google Scholar] [CrossRef]
  51. Pettijohn, F.J. Sedimentary Rocks, 2nd ed.; Harper and Brothers: New York, NY, USA, 1957; 718p. [Google Scholar]
  52. Hawkins, A.E. The Shape of Powder-Particle Outlines; Research Studies Press: Taunton, UK; J. Wiley & Sons: New York, NY, USA, 1993. [Google Scholar]
  53. Berrezueta, E.; González-Menéndez, L.; Breitner, D.; Luquot, L. Pore system changes during experimental CO2 injection into detritic rocks: Studies of potential storage rocks from some sedimentary basins of Spain. Int. J. Greenh. Gas Control 2013, 17, 411–422. [Google Scholar] [CrossRef]
  54. Olaya, P. Caracterización Petrográfica Mineralógica Automatizada de Rocas Con Potencial Para Almacenar CO2. Bachelor’s Thesis, Facultad de Ingeniería en Ciencias de la Tierra (FICT), Escuela Superior Politécnica del Litoral (Espol), Guayaquil, Ecuador, 2011; 110p. [Google Scholar]
  55. Hryciw, R.D.; Zheng, J.; Shetler, K. Particle roundness and sphericity from images of assemblies by chart estimates and computer methods. J. Geotech. Geoenviron. Eng. 2016, 142, 04016038. [Google Scholar] [CrossRef]
  56. Cassel, M.; Piégay, H.; Lavé, J.; Vaudor, L.; Sri, D.H.; Budi, S.W.; Lavigne, F. Evaluating a 2D image-based computerized approach for measuring pebble roundness. Geomorphology 2018, 311, 143–157. [Google Scholar] [CrossRef]
  57. Saint-Cyr, B.; Delenne, J.Y.; Radjai, F.; Sornay, P. Rheology of granular materials composed of nonconvex particles. Phys. Rev. E 2011, 84, 041302. [Google Scholar] [CrossRef] [PubMed]
Figure 1. Criteria for the development of the 18 type particles, according to the evolution of different morphological parameters: (a) decrease in sphericity. (b) decrease in roundness, and (c) increase in roughness.
Minerals 09 00768 g001
Figure 2. Type particles drawn and digitized as a basis for quantifying morphological parameters (Rw, S, So, FD, and ¥) by means of image processing tools. The size of the particles is represented in the graphic scale and corresponds to the size of magnified particles.
Minerals 09 00768 g002
Figure 3. (a) Relationship between FD values of type particles (1, 5, and 10) vs. optical scanning resolution (75, 100, 150, 300, 600, and 900 DPI). (b) Relationship between values of Rw of type particles (1, 6, and 12) vs. optical scanning resolution (75, 100, 150, 300, 600, 750, and 900 DPI). Calculations after [36].
Minerals 09 00768 g003
Figure 4. Log-log relationship of percentage variation of area (A) and perimeter (P) of the type particle 1 vs. particle size (in pixels) with (a) 900 DPI resolution, (b) 600 DPI resolution, and (c) 150 DPI resolution. Calculations after [44].
Minerals 09 00768 g004
Figure 5. (a) Values of the parameters measured for the 18 type particles. (bk) Schematic diagrams of correlation between the different parameters (Based on [49]).
Minerals 09 00768 g005
Figure 6. Representation of the 18 particles according to the obtained values (a) of Rw vs. S. (b) of ¥ vs. S. (c) of FD vs. S. (d) of So vs S.
Minerals 09 00768 g006
Figure 7. Schematic correlation diagrams between the parameters So, FD, Rwc, and ¥c to verify their independence (based on [49]): (a) FD vs. So, (b) FD vs. ¥c, (c) FD vs. Rwc, (d) So vs. ¥c, (e) So vs. Rwc, (f) ¥ c vs. Rwc.
Minerals 09 00768 g007
Figure 8. Type particles sorted according to the RBC parameter calculated by Equation (8).
Minerals 09 00768 g008
Figure 9. Microphotographs of the sandstones studied. Main mineralogy in plane polarized light conditions of: (a) heterogeneous sandstone (SI) and (b) homogeneous sandstone (SB). Segmented quartz particles of (c) SI sandstone and (d) SB sandstone. Images of the SB sample are amplified (3×) to improve visualization.
Minerals 09 00768 g009
Figure 10. Grain size classes (µm) vs. grain area percentages. The average values of RBC (black) and SF (average and standard deviation, in red) are defined for each grain size class: (a) Sample SI with a minimum size of 80 µm, (b) sample SB with a minimum size of 80 µm, (c) Sample SI with a minimum size of 240 µm, and (d) sample SB with a minimum size of 240 µm.
Minerals 09 00768 g010
Figure 11. (a) Schematic representation of the minimum particle size: C1 and C3 (this work), C2 [36], and C4 [44]. (b) Comparison of minimum particle size (in microns) for C1, C2, C3, and C4 with different conditions of objectives and digital resolutions.
Minerals 09 00768 g011
Figure 12. (a) Graphical representation of the values of shape parameters of particles 1, 2, and 18. (b) Graphical representation of the values of shape parameters of particles 3, 4, and 5. X-axis on a logarithmic and dimensionless scale.
Minerals 09 00768 g012
Table 1. Typical shape parameters described in the literature.
PropertiesShape ParametersReferences
Sphericity (form)Wadell’s circularity[11,23]
Sphericity[6]
Ellipticity-aspect ratio-elongation [16,24]
Rittenhouse’s sphericity[25]
RoundnessWentworth’s roundness[10]
Wadell’s roundness[11]
Angularity[12]
Shape Factor[13]
Angularity Factor
Circularity of Cox/ Shape factor[14,15,16]
Perimeter over area normalized ratio[17]
Solidity-convexity[19,20]
Krumbein’s roundness number[43]
Roundness[44]
Roughness (surface texture)Fractal Dimension[26,27,28,29,30]
Table 2. Morphological parameters together with their definition, mathematical expression, and the software tools used.
Morphological ParameterMathematical ExpressionSoftware
Roundness (Rw) [11].
where ri is the radius of curvature of each corner, N is the number of corners, and rins is the radius of the maximum circle inscribed in the particle.
R w = Σ i = 1 N r i N r i n s Custom application in DOS OS
Roussillon Toolbox [24]
Sphericity (S) [6].
where d1 is the length of the particle and d2 is the width.
S = d 2 d 1 ImageJ (v. 1.52)
Solidity-convexity (So) [19,20].
where AT is the area of the particle, and Aconvex is the area defined by the convexity produced by the irregularity of the edge of the particle.
S o = A T A T + A c o n v e x ImageJ (v. 1.52)
Fractal Dimension (FD) [26].Richardson Method [31]Image-Pro Plus® (v.7)
¥ (normalized PoA) [17].
where Pi and Ai are, respectively, the perimeter and the area measured for a particle.
¥ = P i 2 π A i ImageJ (v. 1.52)
Sf (Shape factor) [14].
where Pi and Ai are, respectively, the perimeter and the area measured for a particle.
Sf = 4 π A i   P i 2 ImageJ (v. 1.52)
Table 3. Minimum particle size (case a: 150 pixels and case b: 50 pixels) in metric units on which particle shape analysis is possible. The data was obtained in reference to the objectives and characteristics of a Leica 6000 M microscope.
ObjectiveCamera LensesTotalGeometric Calibration µm/pixelMinimum Ø (µm) Case aMinimum Ø (µm) Case b
400.6325.320.15623.47.80
200.6312.660.31246.815.60
100.636.330.62493.631.20
50.633.171.248187.262.40
40.632.521.564234.678.20
20.631.263.120468156.00
Table 4. Values of parameters FD, So, ¥c, Rwc, and RBC1 (1: estimated by expert criteria). Values of factors a, b, c, and d in the applied lineal regression (2: normalized value and σ: standard deviation). Values of RBC (a regression function applied).
ParticleShape ParametersLinear Multiple Regression
FDSo¥cRwcRBC1a, a2, σab, b2, σbc, c2, σcd, d2, σde, σeRBC
11.01801.001.060.941.00−3.230
−0.692
0.787
0.003
0.001
0.339
−0.161
−0.252
0.15
0.037
0.043
0.129
4.314
0.82
0.90
21.01370.991.080.670.950.90
31.02090.881.310.420.900.82
41.03580.861.570.380.700.73
51.06570.831.830.260.550.59
61.16080.801.850.620.400.29
71.08010.901.320.550.500.63
81.13390.781.630.490.450.41
91.03170.971.100.910.850.84
101.03350.921.190.900.800.82
111.04590.851.410.820.650.74
121.08120.811.970.780.550.54
131.03330.961.060.940.800.84
141.03890.881.150.910.650.81
151.05440.781.550.820.600.69
161.01740.811.090.940.950.90
171.02080.661.430.910.900.82
181.01301.001.120.730.950.90
Table 5. Average values and standard deviations of shape parameters of the quartz particles studied. All particles in the SI sample were larger than 50 pixels (80 microns). Only 68% of the particles in SB were larger than 50 pixels (80 microns).
SamplesStatisticsFDSoSf¥cRwcSRBC
SI sample
105 particles > 50 pixels
Average1.13530.820.401.650.570.610.40
Standard deviation0.05570.090.160.360.140.160.23
SB sample
99 particles
Average1.12130.830.371.500.770.610.48
Standard deviation0.04650.060.130.240.140.170.18
SB sample
68 particles > 50 pixels
Average1.11240.850.431.530.700.620.50
Standard deviation0.00450.050.120.260.180.160.18

