Compositional Variations and Genesis of Sandy-Gravel Ferromanganese Deposits from the Yōmei Guyot (Holes 431, 431A DSDP), Emperor Ridge

 ,
,
Abstract
:1. Introduction
1.1. Background
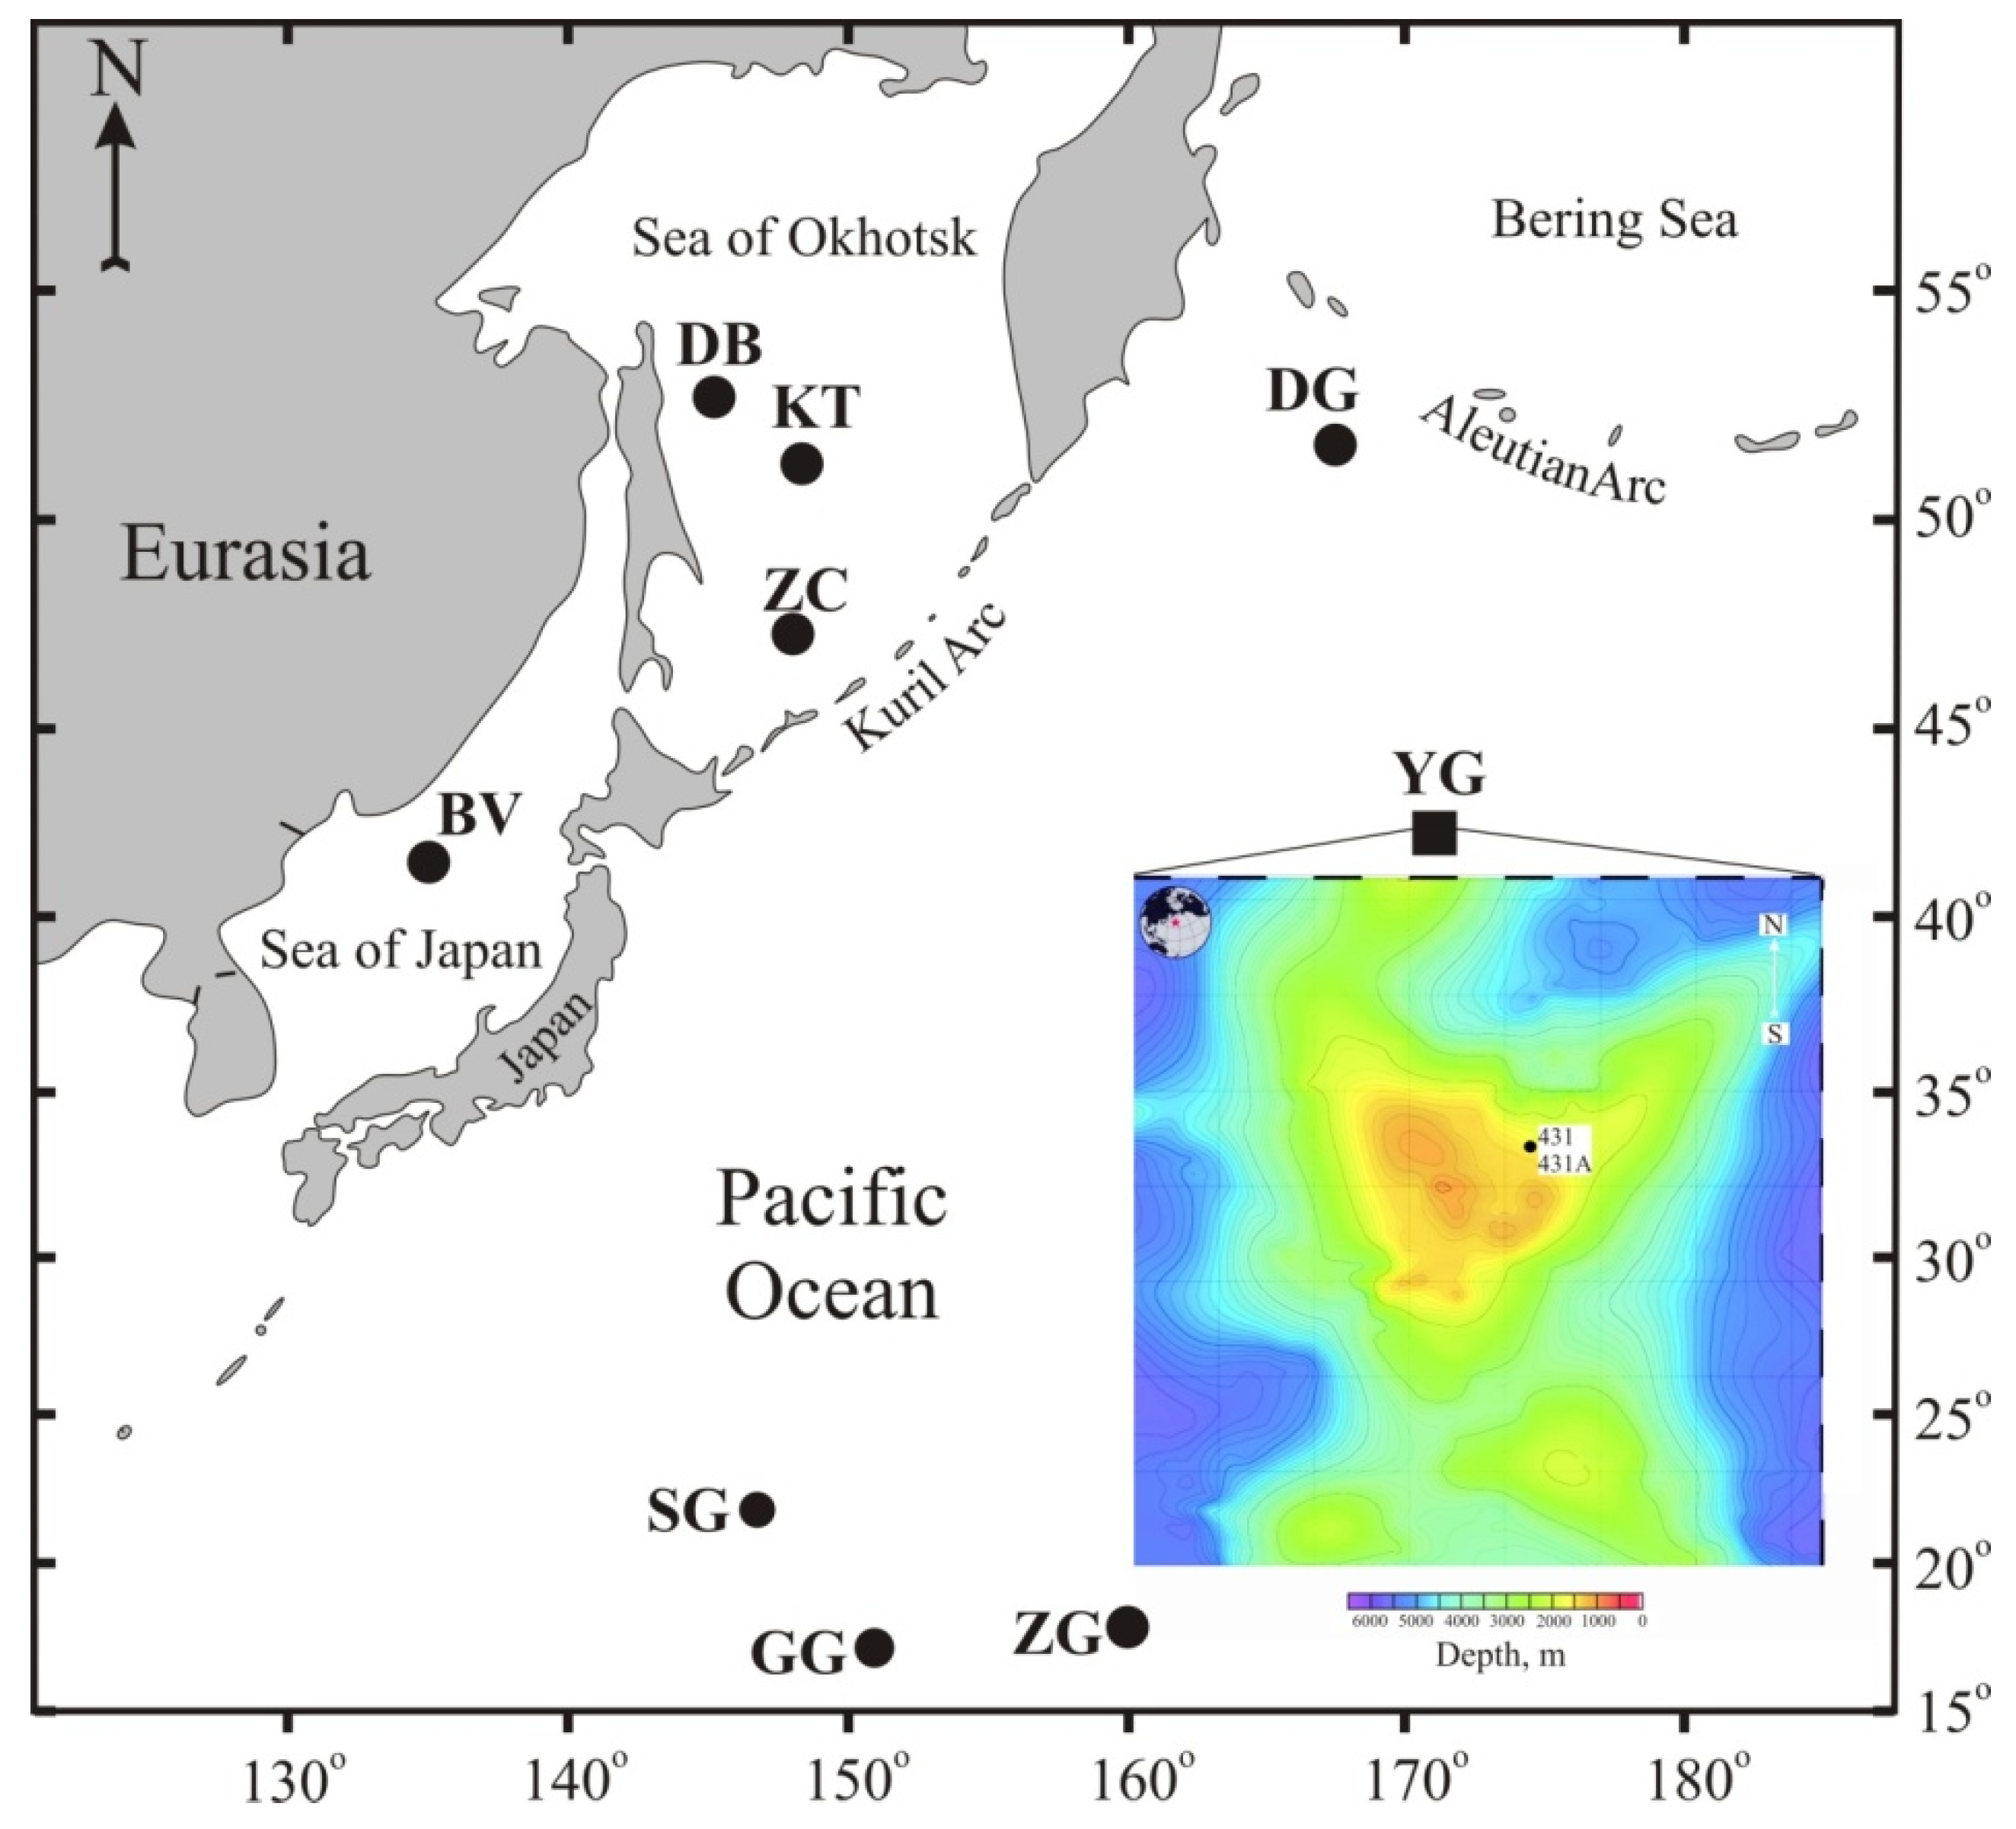
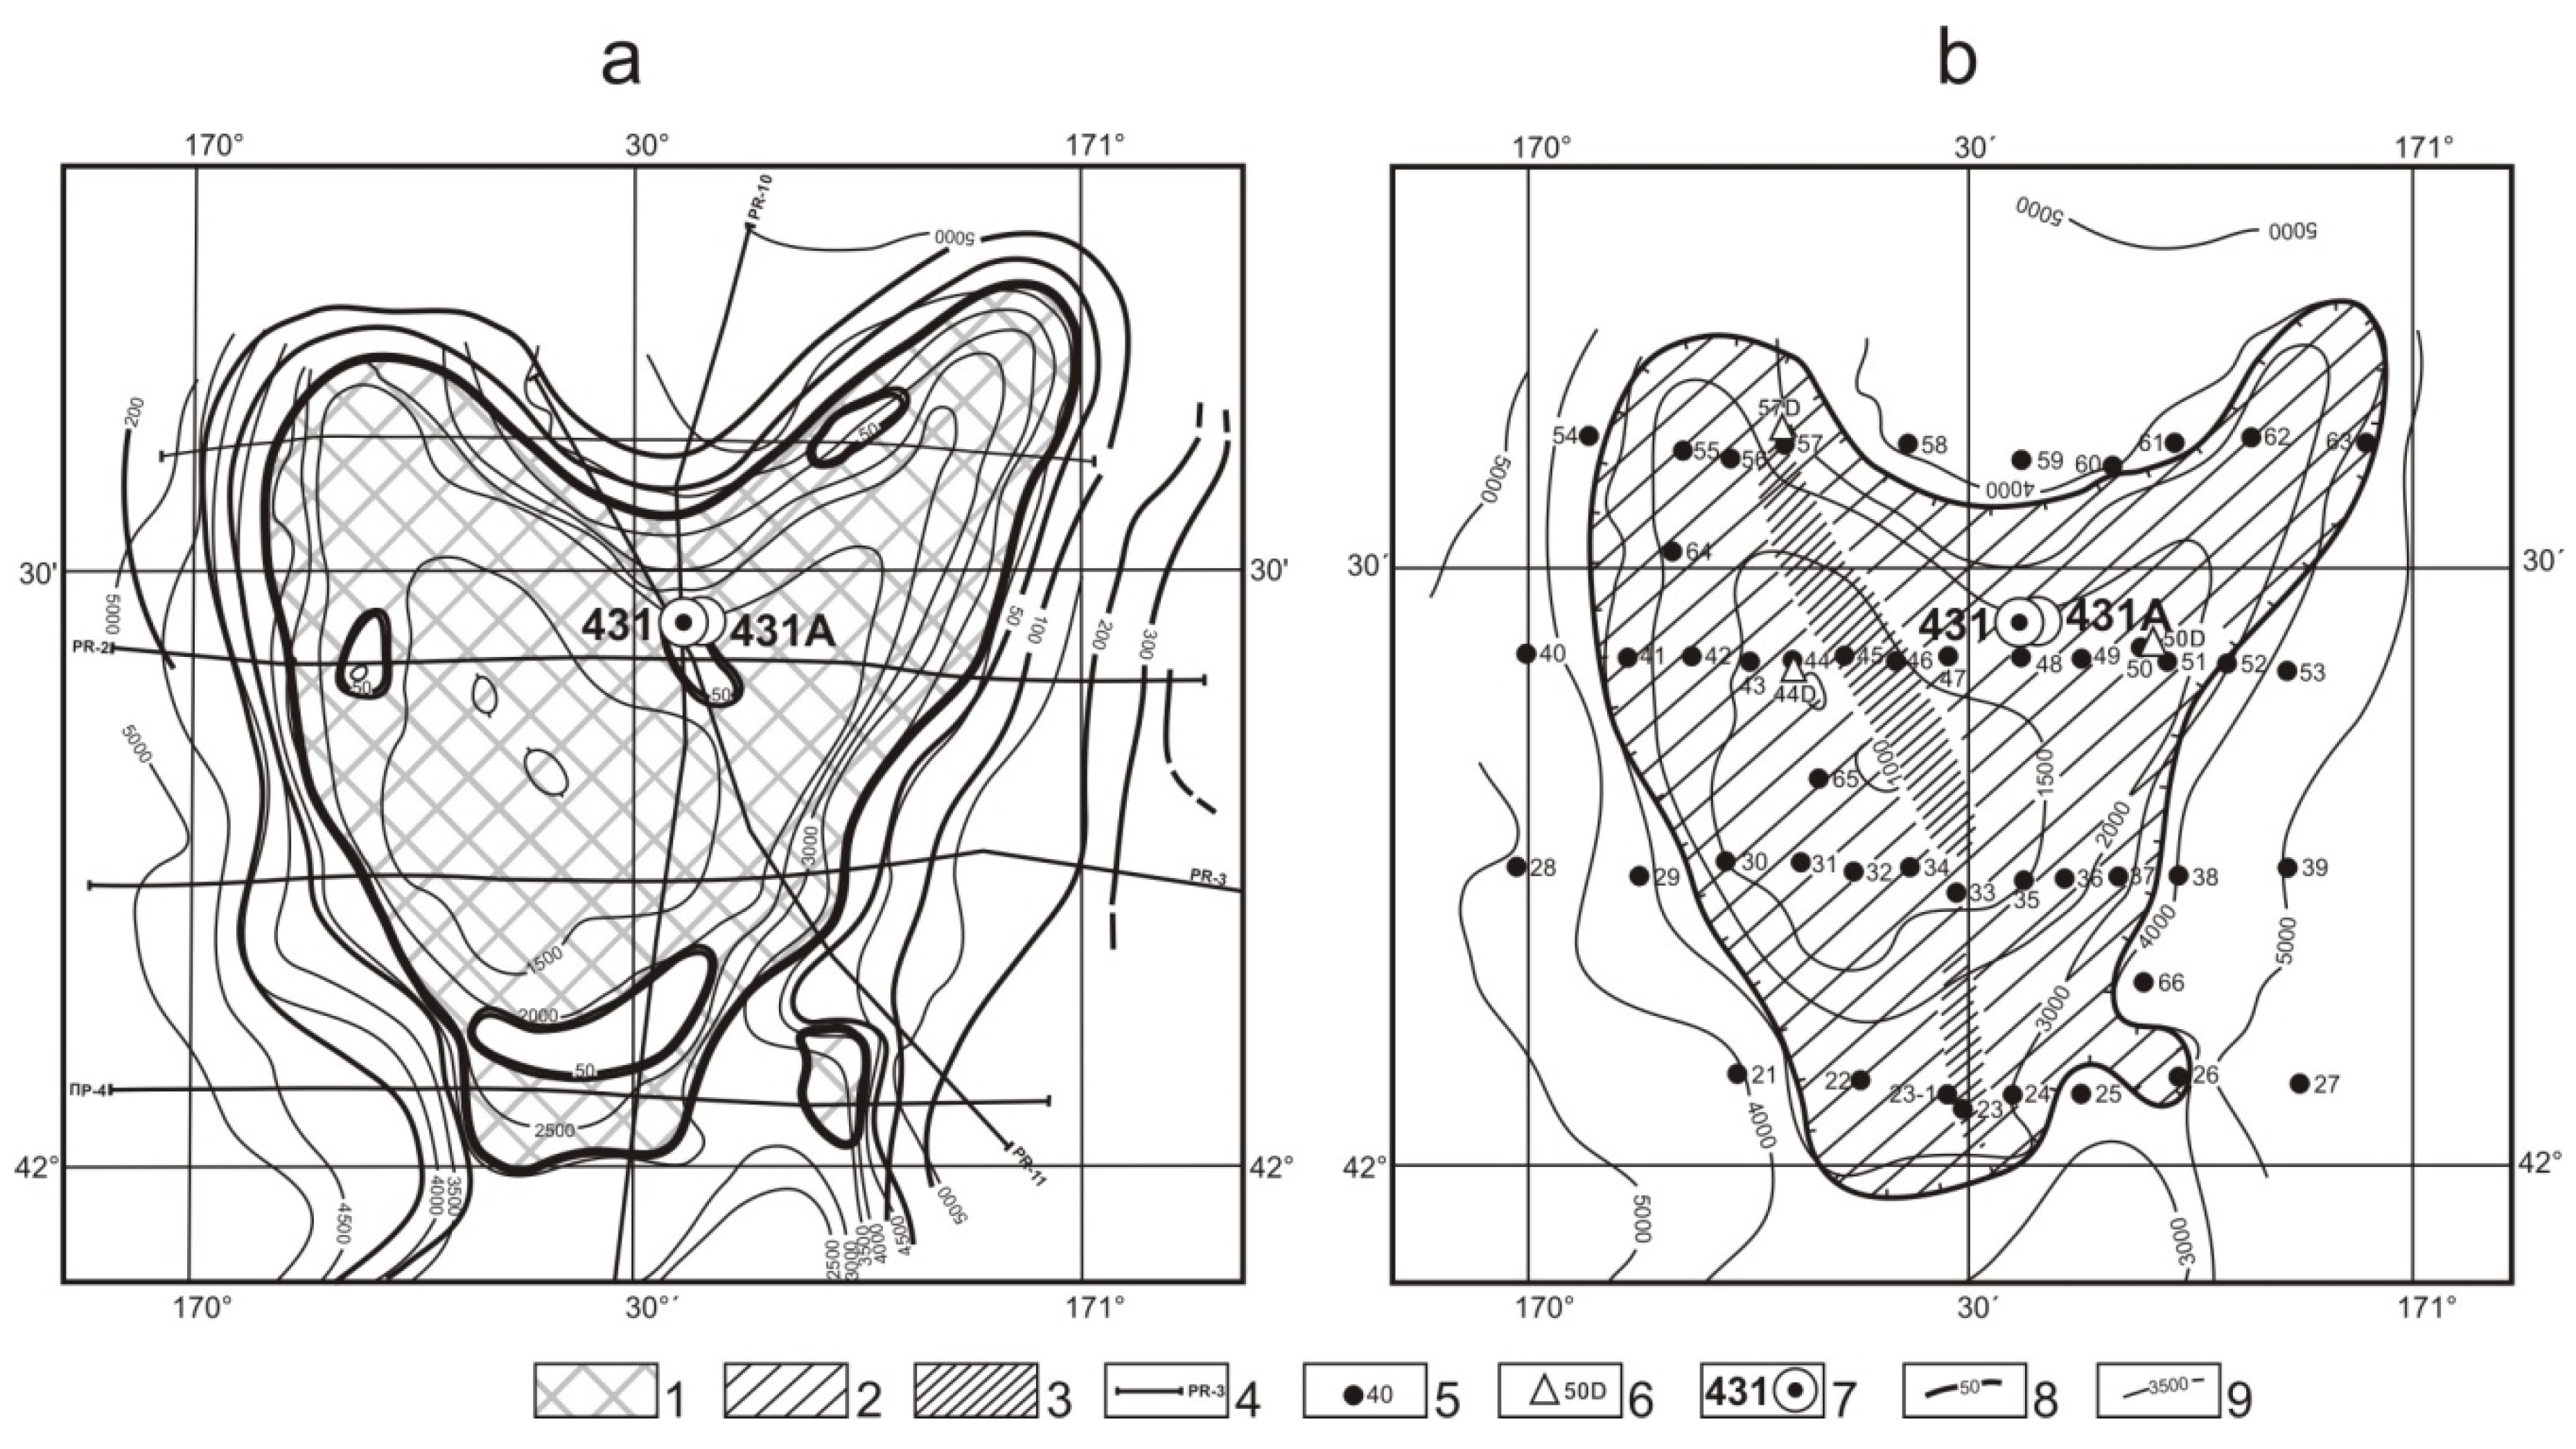
1.2. Geological Setting
2. Materials and Methods
3. Results
4. Discussion
4.1. The Initiation of Growth of the Fe-Mn Deposit
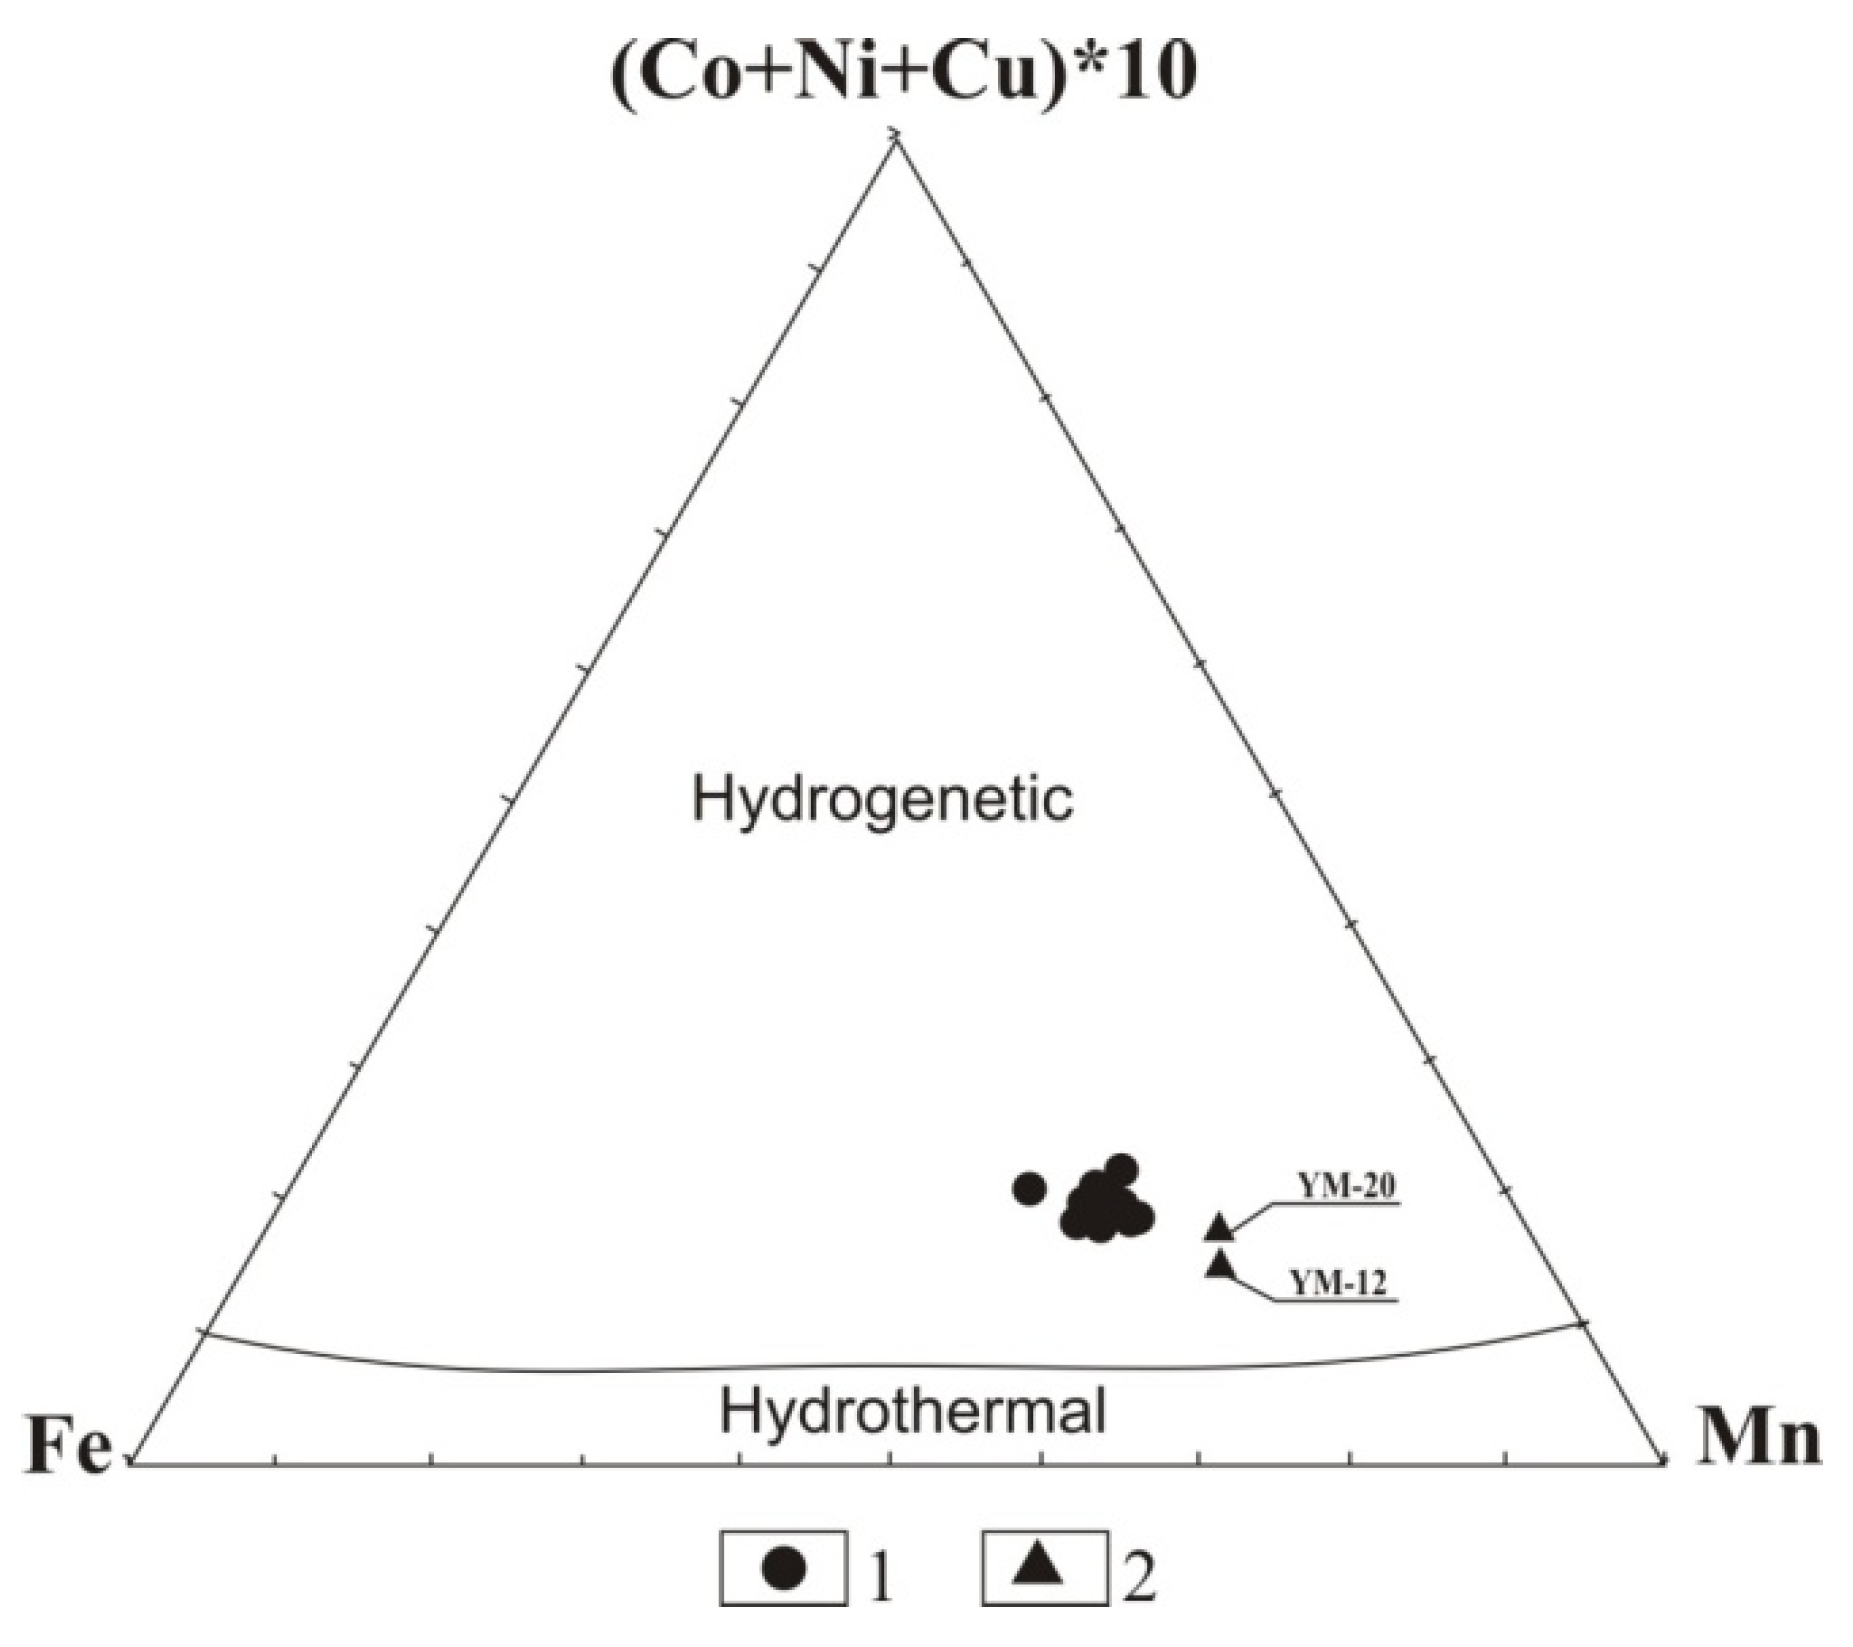
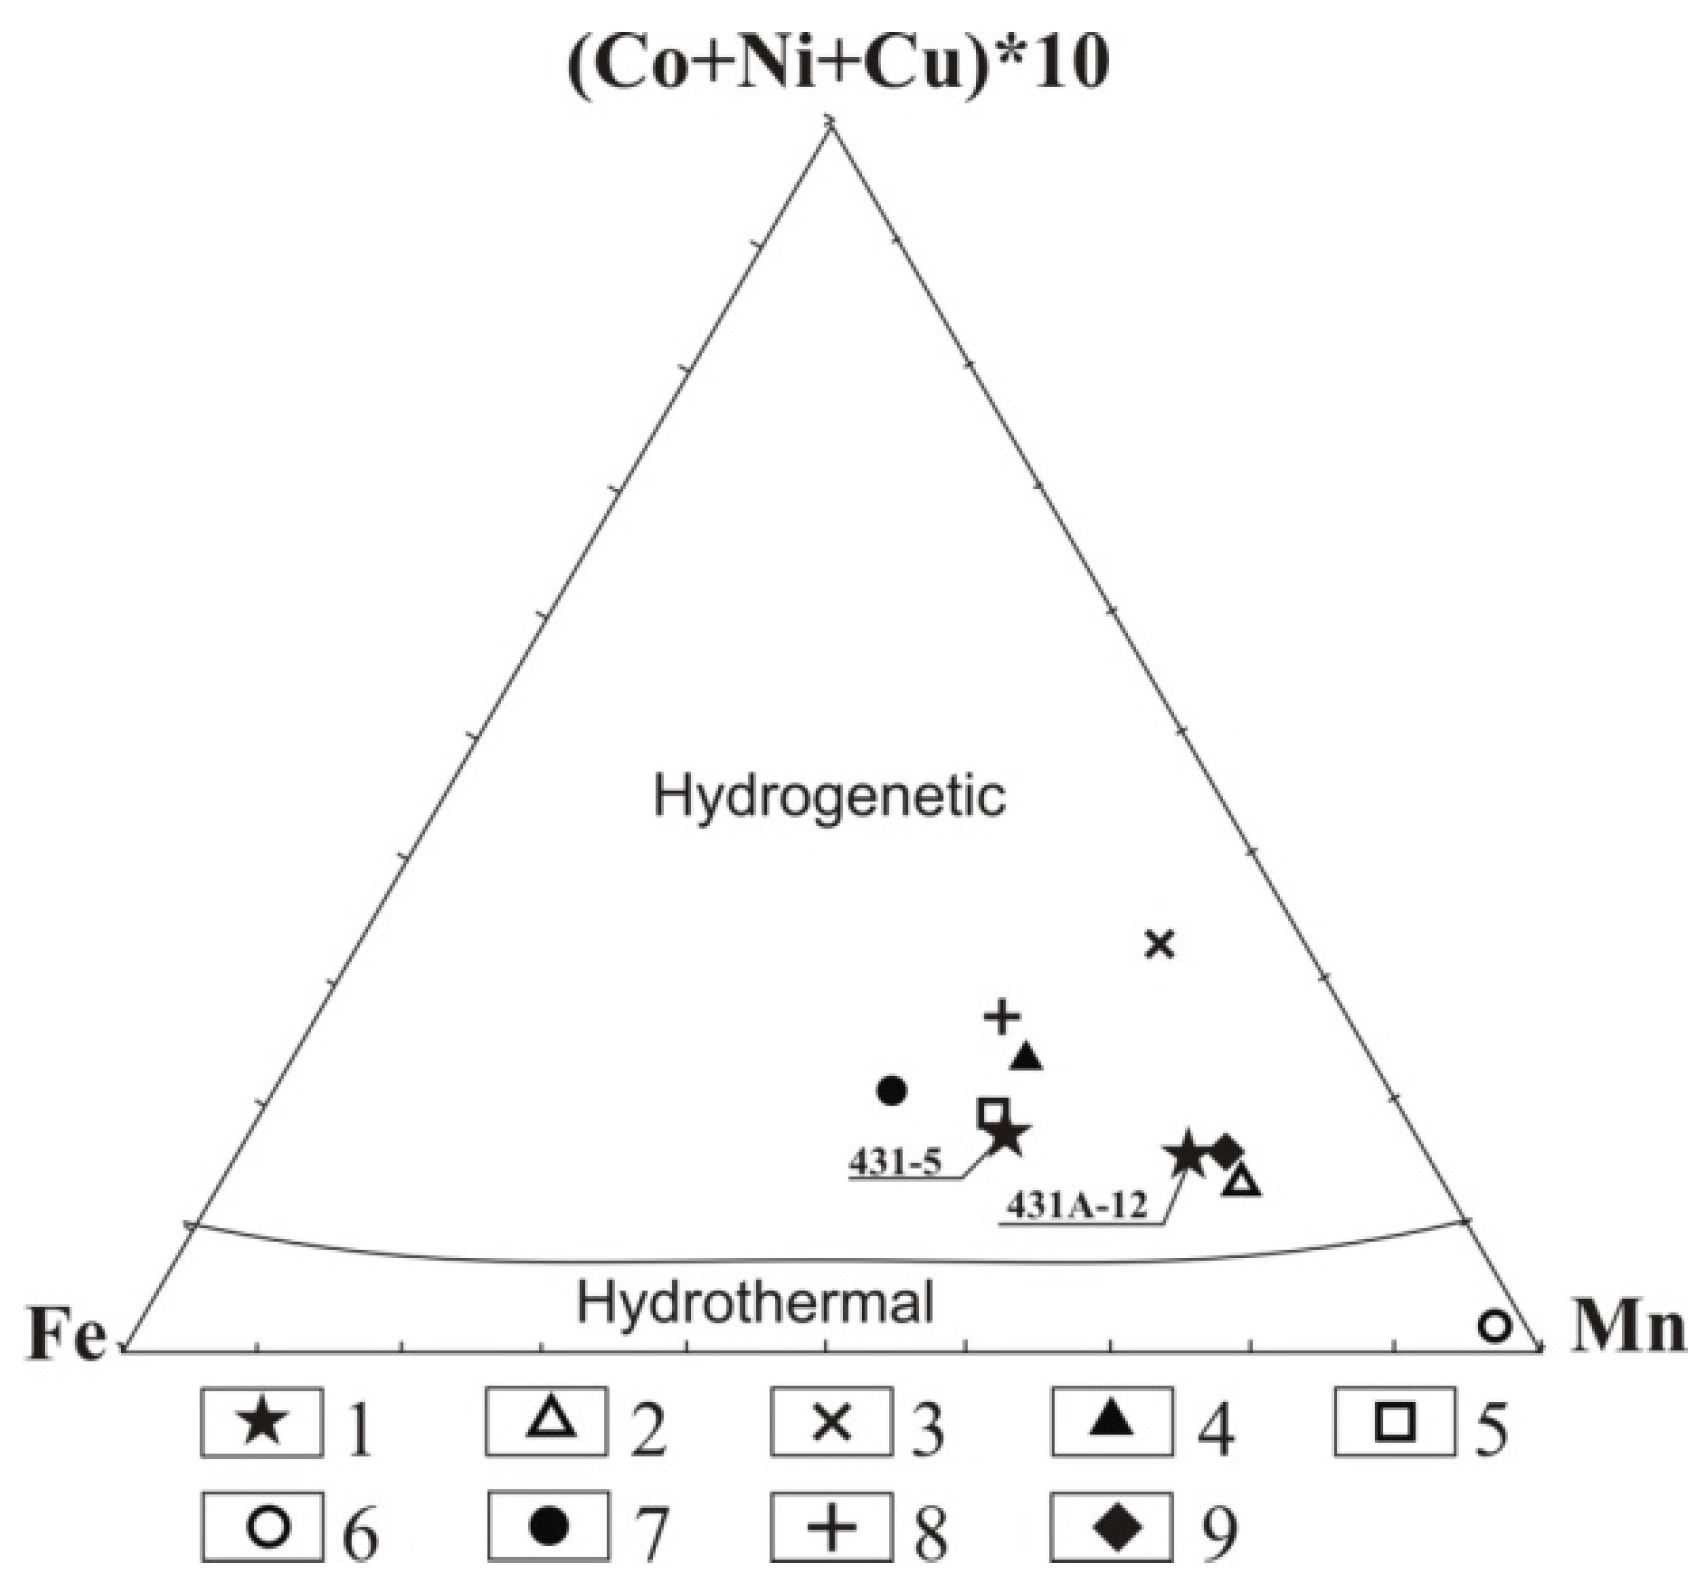
4.2. Genetic Type of the Sandy-Gravel Fe-Mn Deposit
5. Conclusions
Author Contributions
Funding
Acknowledgments
Conflicts of Interest
References
- Bau, M.; Schmidt, K.; Koschinsky, A.; Hein, J.; Kuhn, T.; Usui, A. Discriminating between different genetic types of marine ferromanganese crusts and nodules based on rare earth elements and yttrium. Chem. Geol. 2014, 381, 1–9. [Google Scholar] [CrossRef]
- Hein, J.R.; Koschinsky, A. Deep-ocean ferromanganese crusts and nodules. In Treatise on Geochemistry, 2nd ed.; Scott, S., Ed.; Reference Module in Earth Systems and Environmental Sciences; Elsevier: Amsterdam, The Netherlands, 2014; Volume 13, pp. 273–291. [Google Scholar] [CrossRef]
- Petersen, S.; Krätschell, A.; Augustin, N.; Jamieson, J.; Hein, J.R.; Hannington, M.D. News from the seabed—Geological characteristics and resource potential of deep-sea mineral resources. Mar. Policy 2016, 70, 175–187. [Google Scholar] [CrossRef]
- Dubinin, A.V. Geochemistry of Rare-Earth Elements in the Ocean; Nauka: Moscow, Russia, 2006; p. 360. (In Russian) [Google Scholar]
- Bau, M.; Koschinsky, A. Oxidative scavenging of cerium on hydrous Fe oxide: Evidence from the distribution of rare earth elements and yttrium between Fe oxides and Mn oxides in hydrogenetic ferromanganese crusts. Geochem. J. 2009, 43, 37–47. [Google Scholar] [CrossRef]
- Prakash, L.S.; Ray, D.; Paropkari, A.L.; Mudholkar, A.V.; Satyanarayanan, M.; Sreenivas, B.; Chandrasekharam, D.; Kota, D.; Raju, K.A.K.; Kaisary, S.; et al. Distribution of REEs and yttrium among major geochemical phases of marine Fe-Mn-oxides: Comparative study between hydrogenous and hydrothermal deposits. Chem. Geol. 2012, 312–313, 127–137. [Google Scholar] [CrossRef]
- Mikhailik, P.E.; Mikhailik, E.V.; Zarubina, N.V.; Blokhin, M.G. Distribution of rare-earth elements and yttrium in hydrothermal sedimentary ferromanganese crusts of the Sea of Japan (from phase analysis results). Russ. Geol. Geophys. 2017, 58, 1530–1542. [Google Scholar] [CrossRef]
- Melnikov, M.E. Deposits of Cobalt-Rich Manganese Crusts; FGUGP GNTs “Yuzhmorgeologiya”: Gelendzhik, Russia, 2005; p. 230. (In Russian) [Google Scholar]
- Pulyaeva, I.A.; Hein, J.R. Chronostratigraphy of Fe–Mn crusts from the Pacific Ocean. In Proceedings of the Joint International Conference on Minerals of the Ocean-5 and Deep-Sea Minerals and Mining-2, St. Petersburg, Russia, 28 June–2 July 2010; pp. 38–40. [Google Scholar]
- Bolton, B.R.; Exon, N.F.; Ostwald, J.; Kudrass, H.R. Geochemistry of ferromanganese crusts and nodules from the South Tasman Rise southeast of Australia. Mar. Geol. 1988, 84, 53–80. [Google Scholar] [CrossRef]
- Cronan, D.S. Underwater Minerals; Academic Press: London, UK, 1980; p. 362. [Google Scholar]
- Friedrich, G.; Glasby, G.P.; Thijssen, T.; Plüger, W.L. Morphological and geochemical characteristics of manganese nodules collected from three areas on an equatorial Pacific transect by R.V. Sonne. Mar. Min. 1983, 4, 167–253. [Google Scholar]
- Mikhailik, P.E. Ferromanganese crusts of submarine Belyaevsky & Medvedev volcanoes from the Sea of Japan. In Water-Rock Interaction; Taylor & Francis Group: London, UK, 2007; pp. 523–526. [Google Scholar]
- Hein, J.R.; Fleishman, C.L.; Morgenson, L.A.; Bloomer, S.H.; Stem, R.J. Submarine Ferromanganese Deposits from the Mariana and Volcano Volcanic Arcs, West Pacific; US Geological Survey: Reston, VA, USA, 1987; p. 67.
- Hein, J.R.; Gibbs, A.E.; Clague, D.A.; Torresan, M. Hydrothermal mineralization along submarine rift zones, Hawaii. Mar. Georesour. Geotechnol. 1996, 14, 177–203. [Google Scholar] [CrossRef]
- Lisitsyn, A.P.; Bogdanov, Y.A.; Gurvich, E.G. Hydrothermal Deposits of the Rift Zones of the Ocean; Nauka: Moscow, Russia, 1990; p. 256. (In Russian) [Google Scholar]
- Karpoff, A.M.; Peterschmitt, I.; Hoffert, M. Mineralogy and geochemistry deposits on Emperor Seamounts, site 430, 431, and 432: Authigenesis of silicates, phosphates and ferromanganese oxides. In Initial Reports of the Deep Sea Drilling Project; Shambach, J., Ed.; U.S. Government Printing Office: Washington, DC, USA, 1980; Volume 55, pp. 463–489. [Google Scholar] [CrossRef]
- Melnikov, M.E. Structure and composition of ferromanganese deposits of Yōmei Guyot (Emperor Ridge). In Cobalt-Bearing Ferromanganese Crusts of the Pacific Ocean; Andreev, S.I., Ed.; VNIIOkeangeologiya: St-Petersburg, Russia, 1993; pp. 47–57. (In Russian) [Google Scholar]
- Koschinsky, A.; Hein, J.R. Acquisition of elements from seawater by ferromanganese crusts: Solid phase associations and seawater speciation. Mar. Geol. 2003, 198, 331–351. [Google Scholar] [CrossRef]
- Koschinsky, A.; Halbach, P. Sequential leaching of marine ferromanganese precipitates: Genetic implications. Geochim. Cosmochim. Acta 1995, 59, 5113–5132. [Google Scholar] [CrossRef]
- Dalrymple, G.B.; Greene, H.G.; Ruppel, B.D.; Bear, T.E.; Clague, D.A. Pre-Leg 55 Site survey geophysical data from r/v S.P. Lee cruise Lee8-76-NP. In Initial Reports of the Deep Sea Drilling Project; Shambach, J., Ed.; U.S. Government Printing Office: Washington, DC, USA, 1980; Volume 55, pp. 801–843. [Google Scholar] [CrossRef]
- Greene, H.G.; Clague, D.A.; Dalrymple, G.B. Seismic stratigraphy and vertical tectonics of the Emperor Seamounts, DSDP Leg 55. In Initial Reports of the Deep Sea Drilling Project; Shambach, J., Ed.; U.S. Government Printing Office: Washington, DC, USA, 1980; Volume 55, pp. 759–788. [Google Scholar] [CrossRef]
- Melnikov, M.E.; Popova, T.V.; Mechetin, A.V.; Kurov, V.A. Sedimentary ore-bearing deposits of Yōmei and Nintoku Guyots (Emperor Ridge). In Cobalt-Rich Ferromanganese Crusts of the Pacific Ocean; Andreev, S.I., Ed.; VNIIOkeangeologiya: St. Petersburg, Russia, 1993; pp. 38–46. (In Russian) [Google Scholar]
- Seamount Catalog, Development and Maintenance by the EarthRef.org Database Team. Available online: https://earthref.org/SC/SMNT-423N-1705E (accessed on 14 October 2019).
- Chester, R.; Hughes, M.J. Chemical technique for the separation of ferromanganese minerals, carbonate minerals and adsorbed trace elements from pelagic sediments. Chem. Geol. 1967, 2, 249–262. [Google Scholar] [CrossRef]
- Gordeev, V.V. Hydrogenetic (labile) forms of metals. In Ferromanganese Nodules of the Central Part of the Pacific Ocean; Murdmaa, I.O., Skornyakova, N.S., Eds.; Nauka: Moscow, Russia, 1986; pp. 211–238. (In Russian) [Google Scholar]
- Shipboard Scientific Party. Initial Reports of the Deep Sea Drilling Project; Shambach, J., Ed.; U.S. Government Printing Office: Washington, DC, USA, 1980; Volume 55, pp. 77–94. [CrossRef]
- Bonatti, E.; Kreamer, T.; Rydell, H. Classification and genesis of submarine iron manganese deposits. In Ferromanganese Deposits on the Ocean Floor; Horn, D.R., Ed.; National Science Foundation: Washington, DC, USA, 1972; pp. 149–166. [Google Scholar]
- Mikhailik, P.E.; Derkachev, A.N.; Chudaev, O.V.; Zarubina, N.V. Fe–Mn crusts from underwater rises of the Kashevarov Trough (Sea of Okhotsk). Russ. J. Pac. Geol. 2009, 3, 28–39. [Google Scholar] [CrossRef]
- Hein, J.R.; Mizell, K.; Koschinsky, A.; Conrad, T.A. Deep-ocean mineral deposits as a source of critical metals for high-and green-technology applications: Comparison with land-based resources. Ore Geol. Rev. 2013, 51, 1–14. [Google Scholar] [CrossRef]
- Ivanova, Y.M.; Mikhailik, P.E.; Mikhailik, E.V.; Zarubina, N.V.; Blokhin, M.G. Chemical composition and genesis of ferromanganese crusts from the Sonne Ridge (Kuril Basin, Sea of Okhotsk). Russ. Geol. Geophys. 2019, 60, 1292–1309. [Google Scholar] [CrossRef]
- Konstantinova, N.; Hein, J.R.; Gartman, A.; Mizell, K.; Barrulas, P.; Cherkashov, G.; Mikhailik, P.; Khanchuk, A. Mineral phase-element associations based on sequential leaching of ferromanganese crusts, Amerasia Basin Arctic Ocean. Minerals 2018, 8, 460. [Google Scholar] [CrossRef]
- Mikhailik, P.E.; Khanchuk, A.I.; Mikhailik, E.V.; Ivanov, M.V.; Rashidov, V.A.; Zarubina, N.V.; Blokhin, M.G.; Barinov, N.N.; Pletnev, S.P. Abnormally high mercury contents in hydrogenic ferromanganese crusts from Seth Guyot (Northwestern Pacific). Russ. Geol. Geophys. 2018, 59, 217–225. [Google Scholar] [CrossRef]
- Mikhailik, P.E.; Khanchuk, A.I.; Mikhailik, E.V.; Barinov, N.N.; Zarubina, N.V. Native gold in Fe-Mn crusts of the Detroit guyot (Emperor Ridge, Pacific Ocean). Bull. Far East Branch Russ. Acad. Sci. 2014, 4, 13–24. (In Russian) [Google Scholar]
- Mikhailik, P.E.; Mikhailik, E.V.; Zarubina, N.V.; Barinov, N.N.; S’edin, V.T.; Lelikov, E.P. Composition and distribution of REE in ferromanganese crusts of the Belyaevsky and Medvedev Seamounts in the Sea of Japan. Russ. J. Pac. Geol. 2014, 8, 315–329. [Google Scholar] [CrossRef]
- Chukhrov, F.V.; Gorshkov, A.I.; Dritz, V.A. Manganese Hypergenic Oxides; Nauka: Moscow, Russia, 1989; p. 208. (In Russian) [Google Scholar]
- Haley, B.A.; Klinkhammer, G.P.; McManus, J. Rare earth elements in pore waters of marine sediments. Geochim. Cosmochim. Acta. 2004, 68, 1265–1279. [Google Scholar] [CrossRef]
- Varentsov, I.M.; Dritz, V.A.; Gorshkov, A.I.; Sivtsev, A.V.; Sakharov, B.A. Processes of Mn-Fe-crusts generation in the Atlantic: Mineralogy, geochemistry of the main and minor elements, the Krylov seamount. In Sediment Genesis and Fundamental Problems of Lithology; Kholodov, V.N., Ed.; Nauka: Moscow, Russia, 1989; pp. 58–78. (In Russian) [Google Scholar]
- Hein, J.R.; Stamatakis, M.G.; Dowling, J.S. Trace metal-rich quaternary hydrothermal manganese oxide and barite deposit, Milos Island, Greece. Appl. Earth Sci. 2000, 109, 67–76. [Google Scholar] [CrossRef]
- Usui, A.; Bau, M.; Toshitsugu, Y. Manganese mucrochimneys buried in the Central Pacific pelagic sediments: Evidence of intraplate water circulation? Mar. Geol. 1997, 141, 269–285. [Google Scholar] [CrossRef]
- Anikeeva, L.I.; Kazakova, V.E.; Gavrilenko, G.M.; Rashidov, V.A. Ferromanganese crust deposits of the West Pacific Transition Zone. Bull. Kamchatka Reg. Assoc. Educ. Sci. Cent. Earth Sci. 2008, 1, 10–31. (In Russian) [Google Scholar]
- Chan, L.H.; Hein, J.R. Lithium contents and isotopic compositions of ferromanganese deposits from the global ocean. DeepSea Res. Part II 2007, 54, 1147–1162. [Google Scholar] [CrossRef]
- Jiang, X.; Lin, X.; Yao, D.; Zhai, S.; Guo, W. Geochemistry of lithium in marine ferromanganese oxide deposits. DeepSea Res. Part I 2007, 54, 85–98. [Google Scholar] [CrossRef]
- Rehkämper, M.; Frank, M.; Hein, J.R.; Porcelli, D.; Halliday, A.; Ingri, J.; Liebetrau, V. Thallium isotope variations in seawater and hydrogenetic, diagenetic, and hydrothermal ferromanganese deposits. Earth Planet. Sci. Lett. 2002, 197, 65–81. [Google Scholar] [CrossRef]
- Jackson, E.D.; Koizumi, I.; Dalrymple, G.B.; Clague, D.A.; Kirkpatrick, R.J.; Greene, H.G. Introduction and summary of results from DSDP Leg 55, the Hawaiian-Emperor hot-spot experiment. In Initial Reports of the Deep Sea Drilling Project; Shambach, J., Ed.; U.S. Government Printing Office: Washington, DC, USA, 1980; Volume 55, pp. 5–27. [Google Scholar] [CrossRef]
- Bau, M.; Dulski, P. Comparative study of yttrium and rare-earth element behaviours in fluorine-rich hydrothermal fluids. Contrib. Mineral. Petrol. 1995, 119, 213–223. [Google Scholar] [CrossRef]
- McLennan, S.M. Rare earth elements in sedimentary rocks: Influence of provenance and sedimentary processes. Geochem. Mineral. Rare Earth Elem. Rev. Mineral. 1989, 21, 169–200. [Google Scholar]
- Khanchuk, A.I.; Mikhailik, P.E.; Mikhailik, E.V.; Zarubina, N.V.; Blokhin, M.G. Peculiarities of the distribution of rare earth elements and yttrium in mineral phases of the ferromanganese crusts from the Detroit guyot (Pacific Ocean). Dokl. Earth Sci. 2015, 465, 1243–1247. [Google Scholar] [CrossRef]
- Ren, Y.; Sun, X.; Guan, Y.; Xiao, Z.; Liu, Y.; Liao, J.; Guo, Z. Distribution of rare earth elements plus yttrium among major mineral phases of marine Fe–Mn crusts from the South China Sea and Western Pacific Ocean: A comparative study. Minerals 2019, 9, 8. [Google Scholar] [CrossRef] [Green Version]
- Hein, J.R.; Schwab, W.C.; Davis, A.S. Cobalt and platinum-rich ferromanganese crusts and associated substrate rocks from the Marshall Islands. Mar. Geol. 1988, 78, 255–283. [Google Scholar] [CrossRef]
- Zhang, J.; Nozaki, Y. Rare earth elements and yttrium in seawater: ICP-MS determinations in the EastCaroline, Coral Sea, and South Fiji basins of the western South Pacific Ocean. Geochim. Cosmochim. Acta 1996, 60, 4631–4644. [Google Scholar] [CrossRef]
- Mikhailik, P.E.; Yelovsky, E.V.; Mikhailik, E.V.; Blokhin, M.G. Rare-earth elements as an indicator of sources of manganese in surface sediments of the Deriugin Basin (Sea of Okhotsk). In Proceedings of the International Scientific and Practical Conference “Marine Research and Education: MARESEDU-2016”, Moscow, Russia, 18–21 October 2016; pp. 279–283. (In Russian). [Google Scholar]
- Sverjensky, D.A. Europium redox equilibria in aqueous solution. Earth Planet. Sci. Lett. 1984, 67, 70–78. [Google Scholar] [CrossRef]
- Mikhailik, E.V.; Khanchuk, A.I.; Mikhailik, P.E.; Barinov, N.N.; Zarubina, N.V. The first find of visible gold in ferromanganese crusts of the Pacific Ocean. Dokl. Earth Sci. 2013, 449, 422–426. [Google Scholar] [CrossRef]
- Bogdanov, Y.A.; Sorokhtin, O.G.; Zonenshain, L.P.; Kuptsov, V.M.; Lisitsyna, N.A.; Podrazhansky, A.M. Ferromanganese Crusts and Nodules on Pacific Seamounts; Nauka: Moscow, Russia, 1990; p. 229. (In Russian) [Google Scholar]
- Kennett, J.P.; McBirney, A.R.; Thunell, R.C. Episodes of Cenozoic volcanism in the circum-Pacific region. J. Volcanol. Geotherm. Res. 1977, 2, 145–163. [Google Scholar] [CrossRef]
- Glasby, G.P.; Ren, X.; Shi, X.; Pulyaeva, I.A. Co–rich Mn crusts from the Magellan Seamount cluster: The long journey through time. GeoMar. Lett. 2007, 27, 315–323. [Google Scholar] [CrossRef]
- Ren, X.; Glasby, G.P.; Liu, J.; Shi, X.; Yin, J. Fine-scale compositional variations in a Co-rich Mn crust from the Marcus-Wake Seamount cluster in the western Pacific based on electron microprobe analysis (EMPA). Mar. Geophys. Res. 2007, 28, 165–182. [Google Scholar] [CrossRef]
- Hein, J.R.; Conrad, T.A.; Frank, M.; Christl, M.; Sager, W.W. Copper-nickel-rich, amalgamated ferromanganese crust-nodule deposits from Shatsky Rise, NW Pacific. Geochem. Geophys. Geosyst. 2012, 13, Q10022. [Google Scholar] [CrossRef] [Green Version]
- Ivanova, A.M.; Smirnov, A.N.; Ushakov, V.I. Cenozoic Ore Genesis in the Russia Shelf Areas; VNIIOkeangeologiya: St. Petersburg, Russia, 2005; p. 167. (In Russian) [Google Scholar]
- Khershberg, L.B.; Ryazantsev, A.A.; Chudaev, O.V.; Mikhailik, E.V.; Vachaev, B.I.; Turkin, N.A.; Duglas, V.K.; Shestera, E.N.; Ivanova, A.M.; Pashkovskaya, E.A.; et al. Shelf region of the Sea of Japan. In Geology and Minerageny; VNIIOkeangeologiya: St-Petersburg, Russia, 2006; p. 137. (In Russian) [Google Scholar]
- Kudrass, H. Formation of placer deposits. In Reference Module in Earth Systems and Environmental Sciences; Elsevier: Amsterdam, The Netherlands, 2016; pp. 1–5. [Google Scholar] [CrossRef]


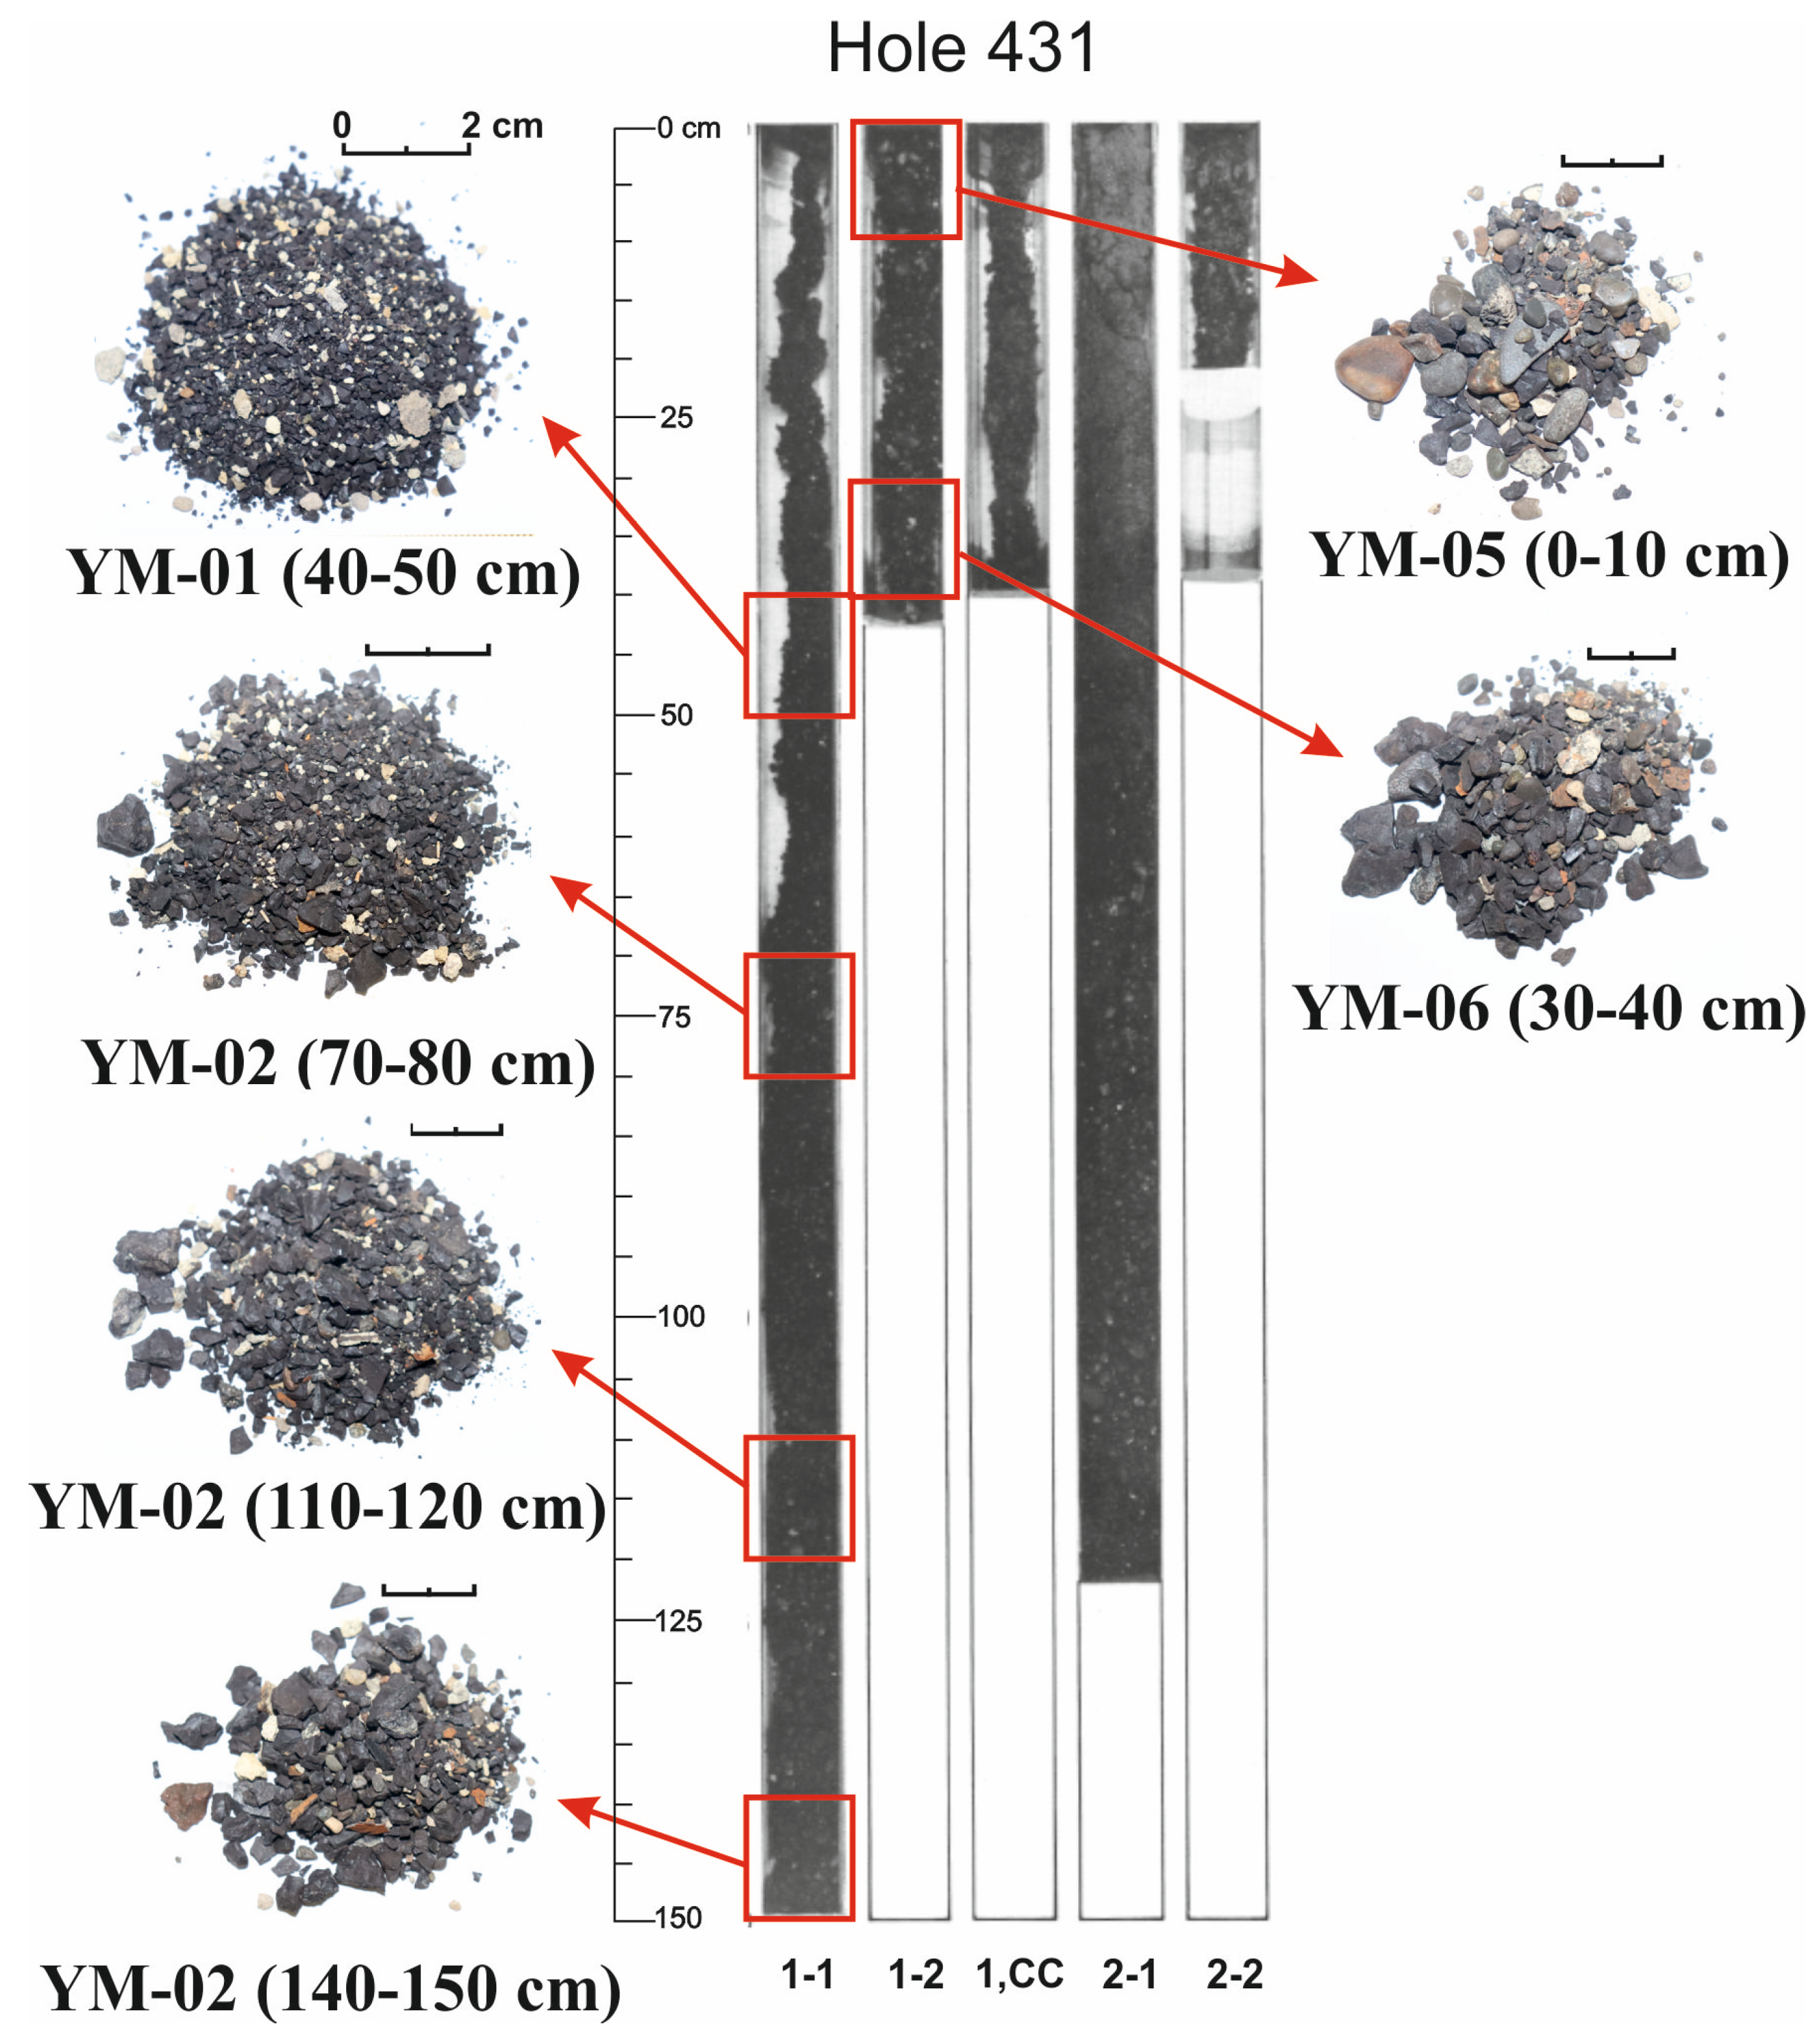
| Hole | Core | Section | Interval, cm | Code |
|---|---|---|---|---|
| 431 | 1 | 1-1 | 40–50 | YM-01 |
| 70–80 | YM-02 | |||
| 110–120 | YM-03 | |||
| 140–150 | YM-04 | |||
| 1-2 | 0–10 | YM-05 | ||
| 30–40 | YM-06 | |||
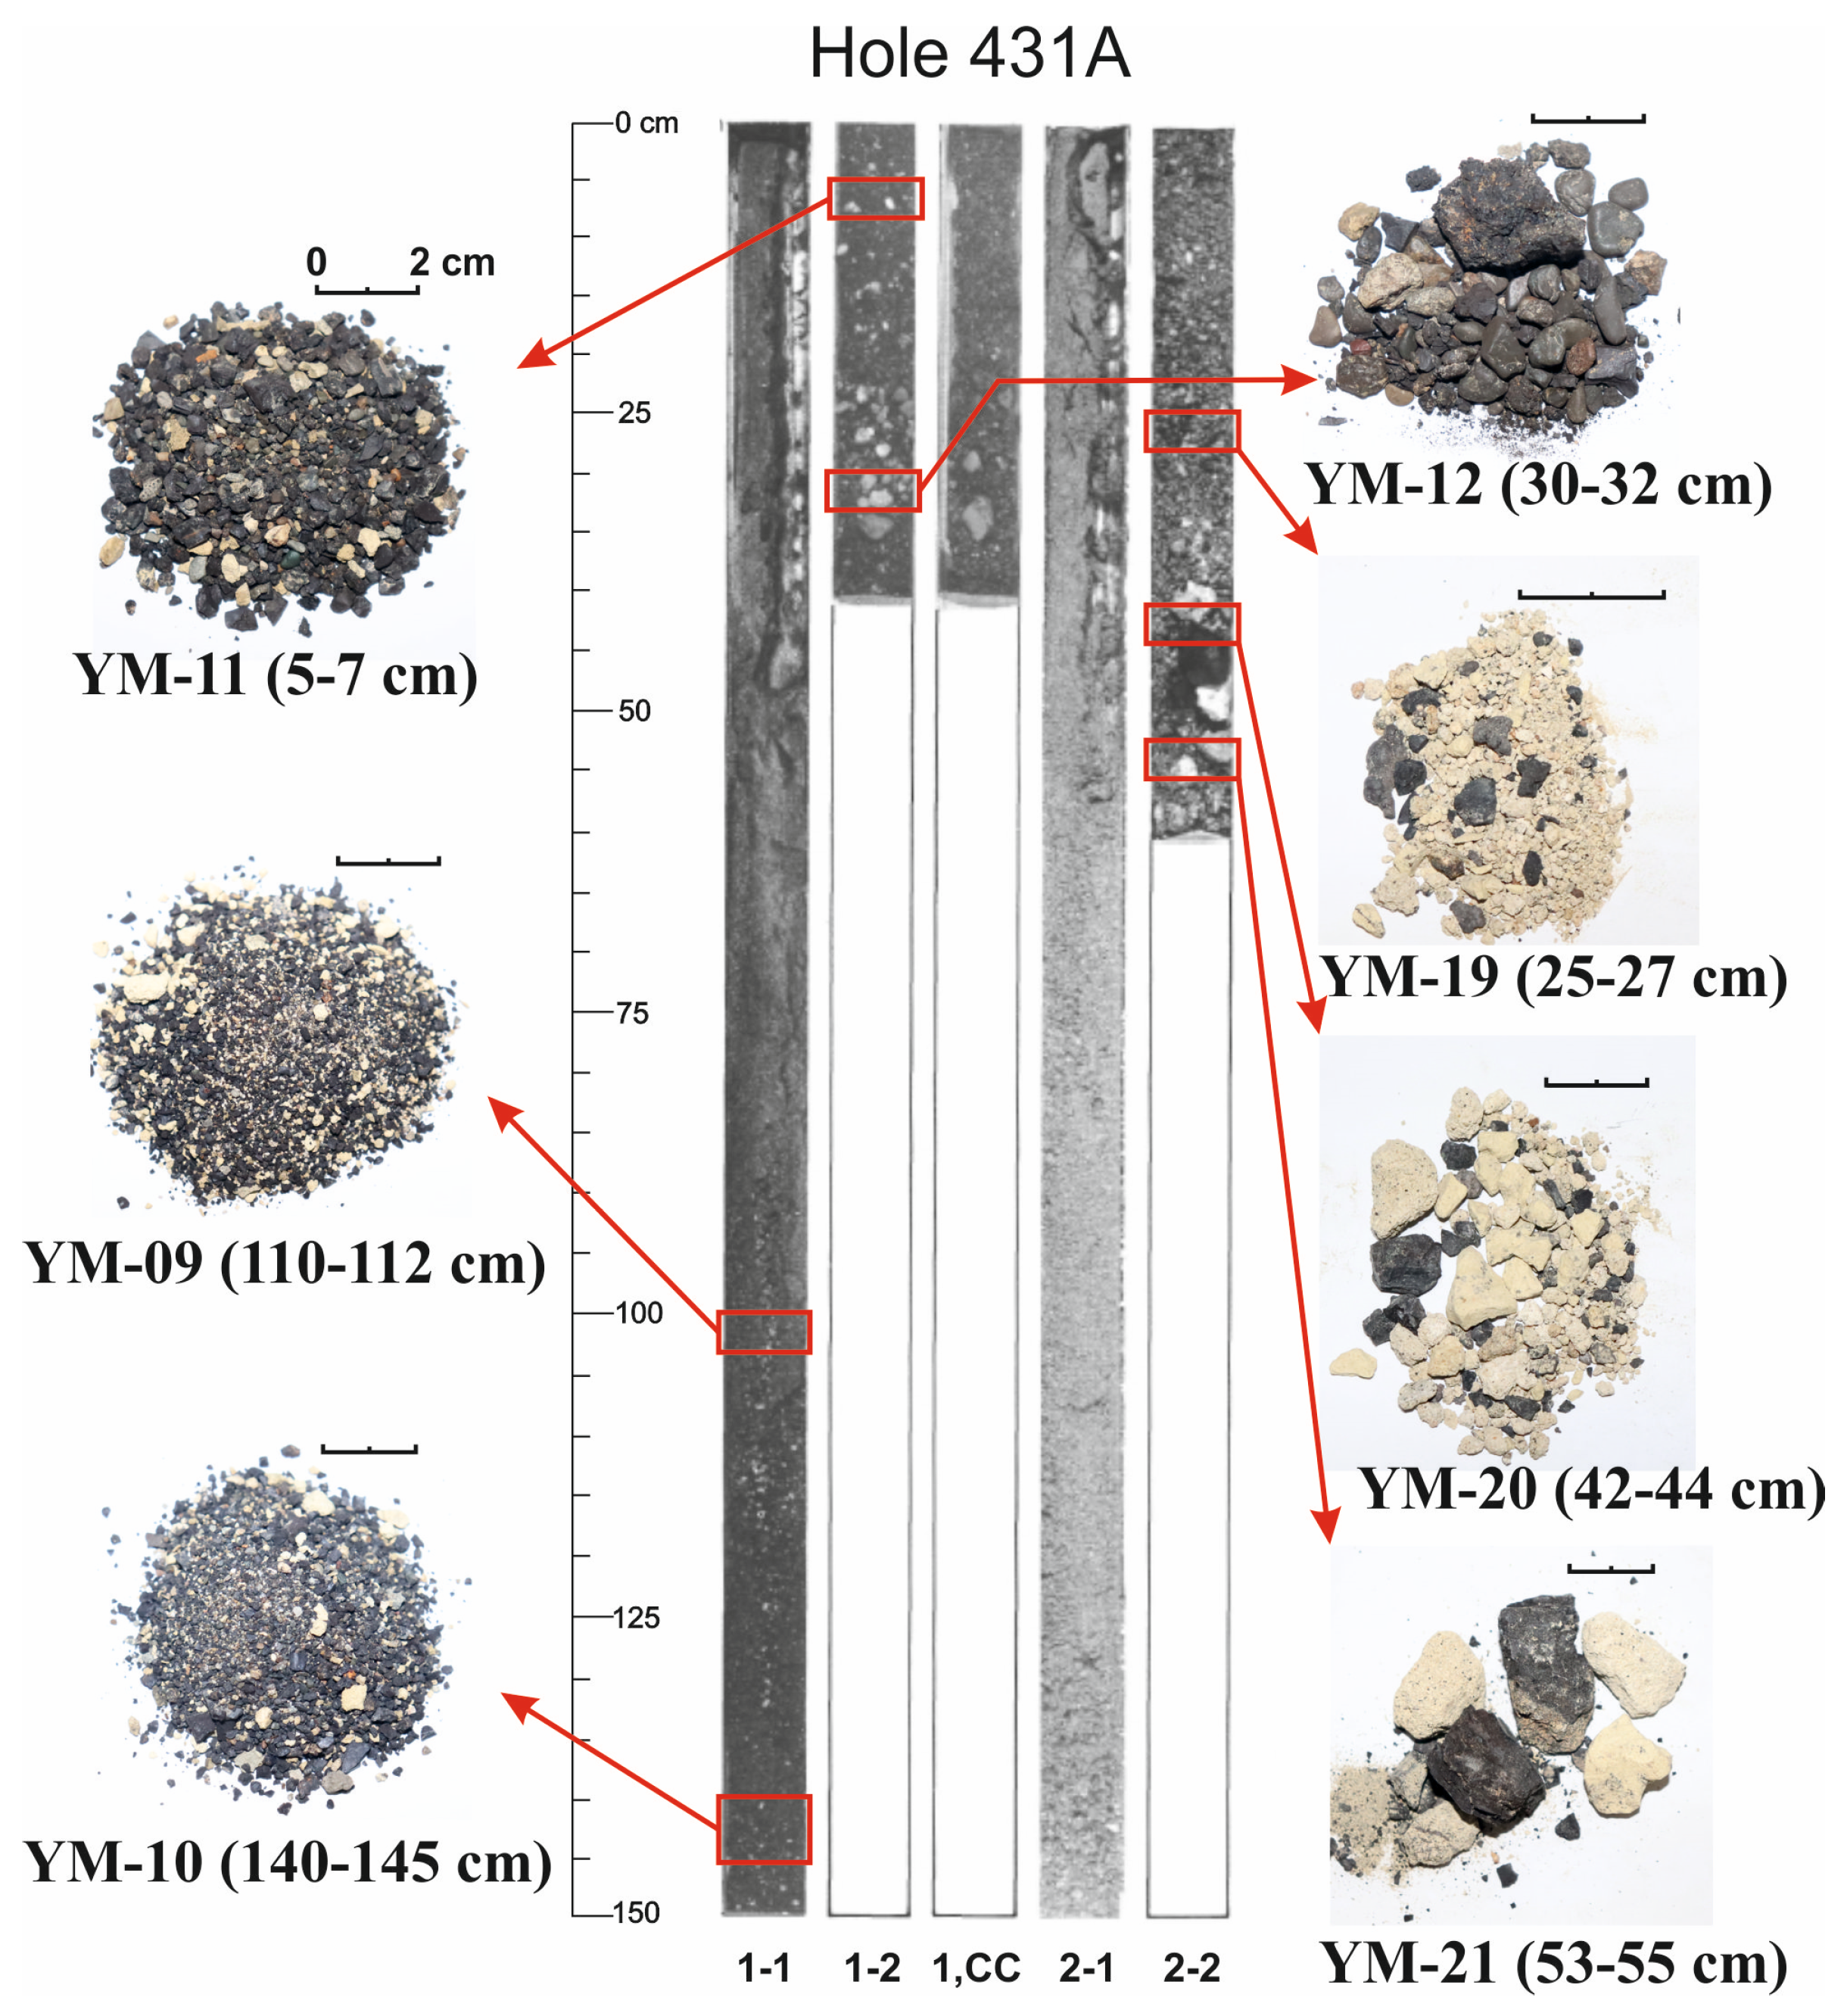
| 431A | 1 | 1-1 | 110–112 | YM-09 |
| 140–145 | YM-10 | |||
| 1-2 | 5–7 | YM-11 | ||
| 30–32 | YM-12 | |||
| 2 | 2-2 | 25–27 | YM-18 | |
| 42–44 | YM-19 | |||
| 53–55 | YM-20 |
| Element | Hole 431 DSDP | Hole 431A DSDP | |||||||||||
|---|---|---|---|---|---|---|---|---|---|---|---|---|---|
| YM-01 | YM-02 | YM-03 | YM-04 | YM-05 | YM-06 | YM-09 | YM-10 | YM-11 | YM-12 | YM-18 | YM-19 | YM-20 | |
| % | |||||||||||||
| Si | 2.10 | 2.15 | 2.61 | 2.05 | 1.54 | 1.59 | 3.36 | 4.11 | 3.59 | 5.09 | 1.82 | 2.57 | 3.36 |
| Al | 0.37 | 0.37 | 0.50 | 0.33 | 0.29 | 0.23 | 0.39 | 0.44 | 0.48 | 0.64 | 0.25 | 0.51 | 0.41 |
| Ca | 2.68 | 2.70 | 2.53 | 2.60 | 2.78 | 2.70 | 2.49 | 2.34 | 2.23 | 1.46 | 2.80 | 2.60 | 1.71 |
| Fe | 13.04 | 13.83 | 13.87 | 14.15 | 13.68 | 13.71 | 12.35 | 12.84 | 12.96 | 10.54 | 14.75 | 15.68 | 10.26 |
| K | 0.48 | 0.48 | 0.54 | 0.46 | 0.50 | 0.46 | 0.56 | 0.65 | 0.64 | 0.97 | 0.41 | 0.41 | 0.84 |
| Mg | 1.11 | 1.10 | 1.14 | 1.10 | 1.14 | 1.17 | 1.20 | 1.42 | 1.21 | 1.68 | 1.11 | 1.34 | 1.48 |
| Mn | 27.67 | 27.87 | 27.88 | 26.48 | 29.45 | 27.85 | 26.83 | 26.65 | 27.27 | 31.38 | 27.12 | 24.23 | 31.13 |
| Na | 2.22 | 2.10 | 2.06 | 2.36 | 2.12 | 2.84 | 2.74 | 3.36 | 2.38 | 1.83 | 2.52 | 2.42 | 2.13 |
| P | 0.38 | 0.40 | 0.48 | 0.40 | 0.39 | 0.41 | 0.39 | 0.35 | 0.38 | 0.24 | 0.38 | 0.48 | 0.22 |
| Ti | 0.75 | 0.72 | 0.70 | 0.66 | 0.72 | 0.68 | 0.70 | 0.62 | 0.71 | 0.24 | 0.64 | 0.60 | 0.38 |
| LOI | 18.10 | 17.60 | 19.60 | 20.40 | 19.40 | 21.60 | 20.80 | 20.90 | 19.80 | 16.20 | 20.30 | 21.00 | 19.00 |
| ppm | |||||||||||||
| Li | 3.33 | 3.09 | 8.84 | 2.58 | 1.8 | 1.28 | 4.81 | 6.1 | 4.91 | 6.84 | 2.47 | 11 | 25.5 |
| Be | 3.24 | 3.41 | 3 | 3.26 | 3.06 | 3.13 | 2.55 | 2.64 | 2.98 | 1.99 | 2.85 | 3.39 | 1.89 |
| Sc | 5.36 | 5.43 | 5.61 | 5.44 | 5.73 | 5.39 | 4.75 | 4.75 | 4.98 | 4.41 | 5.20 | 6.23 | 5.73 |
| V | 756 | 768 | 745 | 761 | 828 | 773 | 621 | 583 | 568 | 522 | 780 | 703 | 629 |
| Cr | 4.34 | 4.85 | 7.42 | 3.00 | 3.38 | 7.52 | 4.65 | 7.22 | 10.1 | 14.4 | 2.84 | 6.67 | 9.67 |
| Co | 4343 | 4210 | 3987 | 4227 | 4527 | 3299 | 4307 | 4203 | 4643 | 3663 | 4013 | 4143 | 3730 |
| Ni | 5275 | 5052 | 5215 | 4582 | 5771 | 5042 | 3995 | 3625 | 4068 | 3335 | 4525 | 5431 | 4588 |
| Cu | 566 | 521 | 608 | 495 | 665 | 383 | 490 | 459 | 488 | 282 | 348 | 507 | 587 |
| Zn | 638 | 597 | 624 | 540 | 651 | 532 | 703 | 716 | 744 | 910 | 479 | 646 | 1109 |
| Ga | 36.8 | 32.1 | 33 | 31.6 | 35.1 | 31.4 | 32.2 | 29.5 | 31 | 26.7 | 32.1 | 29.3 | 27.8 |
| As | 238 | 252 | 221 | 240 | 236 | 244 | 169 | 158 | 169 | 104 | 235 | 251 | 122 |
| Rb | 4.35 | 4.35 | 5.03 | 3.85 | 3.88 | 3.24 | 5.46 | 6.3 | 6.36 | 14.8 | 2.86 | 3.37 | 9.72 |
| Sr | 1481 | 1482 | 1440 | 1471 | 1537 | 1496 | 1483 | 1372 | 1403 | 945 | 1512 | 1350 | 1203 |
| Y | 149 | 157 | 161 | 163 | 154 | 162 | 100 | 94 | 106 | 66 | 166 | 174 | 95 |
| Zr | 419 | 413 | 447 | 424 | 439 | 396 | 409 | 366 | 386 | 178 | 360 | 421 | 357 |
| Nb | 41.9 | 40.3 | 36.9 | 35.5 | 38.8 | 38.2 | 37.8 | 31.6 | 34.9 | 12.5 | 31.8 | 28.2 | 19 |
| Mo | 1016 | 1014 | 925 | 979 | 1186 | 1020 | 896 | 732 | 678 | 447 | 1024 | 750 | 491 |
| Cd | 4.62 | 5.02 | 5.97 | 4.54 | 5.12 | 4.62 | 6.22 | 5.5 | 6.1 | 5.43 | 3.75 | 4.40 | 7.37 |
| Cs | 0.17 | 0.17 | 0.19 | 0.11 | 0.13 | 0.1 | 0.22 | 0.28 | 0.27 | 0.86 | 0.12 | 0.14 | 0.46 |
| Ba | 1836 | 1551 | 1644 | 1423 | 1736 | 1345 | 3019 | 3060 | 2772 | 4362 | 1343 | 1143 | 5645 |
| La | 232 | 235 | 230 | 238 | 223 | 257 | 173 | 166 | 178 | 81 | 254 | 217 | 110 |
| Ce | 2185 | 2000 | 1795 | 1911 | 2145 | 1894 | 2008 | 1654 | 1771 | 429 | 1790 | 1289 | 619 |
| Pr | 53.9 | 53.4 | 51.4 | 53.5 | 53.1 | 60.1 | 39.8 | 36.4 | 39.9 | 16.7 | 55.2 | 49.6 | 21.3 |
| Nd | 224 | 225 | 219 | 228 | 222 | 252 | 165 | 151 | 167 | 71 | 232 | 215 | 93 |
| Sm | 49.1 | 48.7 | 48.5 | 50.6 | 48.8 | 55.7 | 36.1 | 33.6 | 36.5 | 15.6 | 50.6 | 47.6 | 20.2 |
| Eu | 11.6 | 11.8 | 11.8 | 12.1 | 11.8 | 13.0 | 8.8 | 8.1 | 8.8 | 4 | 12.2 | 11.4 | 5.5 |
| Gd | 66.4 | 65.7 | 64 | 65.2 | 64.6 | 69.1 | 49.3 | 44.8 | 48.1 | 20.4 | 64.2 | 59.3 | 27.9 |
| Tb | 7.83 | 8.02 | 8.02 | 8.26 | 7.96 | 9.03 | 5.81 | 5.39 | 5.78 | 2.65 | 8.27 | 7.79 | 3.63 |
| Dy | 44.1 | 45.4 | 46.3 | 46.9 | 45.4 | 51.4 | 32.3 | 29.5 | 32.5 | 15.9 | 47.8 | 45.1 | 22.4 |
| Ho | 8.55 | 9.03 | 9.21 | 9.34 | 8.76 | 9.96 | 6.27 | 5.79 | 6.41 | 3.27 | 9.55 | 8.84 | 4.7 |
| Er | 24.9 | 26.5 | 27.2 | 27.4 | 25.7 | 28.8 | 18.2 | 17.1 | 18.6 | 10 | 28.1 | 25.7 | 13.7 |
| Tm | 3.56 | 3.83 | 3.84 | 3.89 | 3.78 | 4.22 | 2.66 | 2.48 | 2.59 | 1.41 | 3.97 | 3.66 | 1.91 |
| Yb | 23.9 | 25.1 | 25.6 | 25.8 | 24.2 | 27.6 | 17.5 | 16.4 | 17.8 | 9.7 | 26.2 | 23.4 | 13.8 |
| Lu | 3.54 | 3.78 | 3.75 | 3.95 | 3.67 | 4.11 | 2.62 | 2.41 | 2.68 | 1.47 | 3.90 | 3.42 | 2.07 |
| Hf | 7.25 | 7.04 | 7.12 | 5.91 | 7.21 | 6.40 | 6.75 | 5.88 | 6.74 | 2.65 | 4.80 | 5.17 | 5.54 |
| Ta | 0.39 | 0.39 | 0.35 | 0.28 | 0.39 | 0.42 | 0.3 | 0.31 | 0.41 | 0.09 | 0.28 | 0.26 | 0.17 |
| W | 141 | 139 | 135 | 141 | 165 | 133 | 107 | 97 | 94 | 74 | 139 | 97 | 93 |
| Tl | 183 | 176 | 208 | 158 | 192 | 205 | 30 | 24 | 26 | 13 | 203 | 127 | 16 |
| Pb | 1895 | 2051 | 1999 | 2068 | 1982 | 2261 | 1761 | 1561 | 1678 | 773 | 1990 | 1935 | 1190 |
| Th | 27.7 | 28.4 | 28.3 | 32.0 | 27.2 | 22.4 | 27.4 | 24.7 | 25.1 | 7.7 | 26.5 | 34.9 | 12.9 |
| U | 13.3 | 14.1 | 14.2 | 14.3 | 14.4 | 14.4 | 11.4 | 10.1 | 10.2 | 6.2 | 13.7 | 12.7 | 7.8 |
| Σ REY | 3087 | 2919 | 2705 | 2847 | 3042 | 2898 | 2666 | 2267 | 2442 | 748 | 2752 | 2181 | 1054 |
| Element | 431-5 | 431A-12 | ТК | DB | PB | ZC | GG | GZ | GS | GD | VB |
|---|---|---|---|---|---|---|---|---|---|---|---|
| % | |||||||||||
| Si | 2.37 | 5.25 | 7.93 | 12.3 | 4.82 | 12.38 | 2.48 | 4.82 | 4.53 | 3.21 | 0.68 |
| Al | 0.37 | 0.72 | 1.93 | 2.88 | 1.5 | 2.14 | 0.45 | 1.25 | 1.13 | 0.31 | 0.34 |
| Ca | 2.80 | 1.23 | 1.36 | 2.56 | 1.82 | 1.97 | 2.63 | 2.94 | 2.84 | 2.71 | 1.51 |
| Fe | 15.57 | 8.76 | 5.79 | 1.28 | 6.12 | 17.20 | 18.36 | 18.52 | 13.35 | 16.85 | 4.01 |
| K | 0.51 | 1.21 | 1.30 | 1.05 | 0.81 | 0.71 | 0.46 | 0.67 | 0.65 | 0.45 | 0.93 |
| Mg | 1.15 | 1.96 | 1.47 | 1.04 | 1.71 | 0.83 | 1.19 | 1.01 | 1.06 | 1.08 | 1.29 |
| Mn | 28.89 | 34.96 | 32.48 | 31.7 | 34.2 | 15.33 | 25.48 | 22.97 | 25.11 | 28.70 | 52.90 |
| Na | 1.95 | 1.62 | 1.61 | 3.02 | 2.65 | 2.35 | 1.92 | 1.67 | 1.95 | 2.04 | 2.48 |
| P | 0.47 | 0.15 | 0.15 | 0.04 | 0.15 | 0.32 | 0.40 | 0.29 | 0.27 | 0.40 | 0.02 |
| Ti | 0.75 | 0.12 | 0.19 | 0.1 | 0.16 | 0.37 | 1.35 | 1.29 | 1.06 | 0.84 | 0.058 |
| LOI | 19.29 | 16.11 | 11.67 | 11.3 | 16.20 | 10.21 | 21.41 | 16.25 | 13.42 | 14.34 | 14.07 |
| ppm | |||||||||||
| Li | 3.20 | 19.5 | 30.1 | 285 | 311 | 3.12 | 0.99 | 2.19 | 0.56 | 1.61 | 843 |
| Be | 3.67 | 1.34 | 1.39 | 0.5 | 1.4 | 2.76 | 5.29 | 5.33 | 2.41 | 4.31 | 0.23 |
| Sc | 5.62 | 5.16 | 4.27 | 3.94 | 7.58 | 9.55 | 16.4 | 9.44 | 5.45 | 7.71 | 1.03 |
| V | 802 | 617 | 606 | 258 | 431 | 427 | 815 | 637 | 449 | 734 | 266 |
| Cr | 0.68 | 17.10 | 16.7 | 16.2 | 16 | 13.1 | 2.1 | 9.58 | 21.7 | 13.9 | 8.21 |
| Co | 3708 | 4654 | 559 | 47.1 | 475 | 671 | 5876 | 5414 | 4719 | 3828 | 187 |
| Ni | 4561 | 3139 | 5885 | 821 | 13,008 | 2422 | 4162 | 4165 | 6227 | 5130 | 729 |
| Cu | 373 | 611 | 1477 | 74.9 | 5988 | 310 | 1026 | 1340 | 856 | 809 | 93 |
| Zn | 531 | 810 | 986 | 608 | 1845 | 419 | 643 | 639 | 537 | 609 | 243 |
| Ga | 6.77 | 5.24 | 14.7 | 13.1 | 31.7 | 10 | 16.6 | 5.61 | 9.09 | 10.9 | 19.1 |
| As | 310 | 87.5 | 110 | 20.1 | n.d. | 214 | 264 | 215 | 152 | 245 | 47 |
| Sr | 1597 | 968 | 952 | 466 | 687 | 1030 | 1815 | 1564 | 1244 | 1805 | 989 |
| Y | 178 | 53.7 | 78.4 | 18.2 | 69 | 130 | 202 | 165 | 111 | 178 | 14.8 |
| Zr | 455 | 145 | 154 | 23.2 | 325 | 456 | 523 | 746 | 386 | 541 | 7.7 |
| Nb | 43.9 | 7.97 | 10.8 | 1.4 | 13.2 | 26.7 | 47.9 | 73.3 | 47.7 | 47.2 | 1.09 |
| Mo | 1044 | 435 | 752 | 363 | 547 | 350 | 649 | 452 | 379 | 712 | 285 |
| Cd | 5.29 | 8.51 | 23.1 | 11.3 | 18.8 | 3.53 | 3.74 | 3.86 | 4.93 | 5.8 | 7.5 |
| Ba | 1482 | 8287 | 9920 | 2680 | 3158 | 1192 | 1654 | 1743 | 1611 | 1913 | 5493 |
| La | 291 | 66.3 | 103 | 14.9 | 68 | 194 | 349 | 275 | 184 | 304 | 14.1 |
| Ce | 1995 | 199 | 510 | 25 | 110 | 733 | 1058 | 976 | 1116 | 1825 | 20.3 |
| Pr | 66.5 | 13 | 23.5 | 3.68 | 14.1 | 51.4 | 77.3 | 54.7 | 39.9 | 74.1 | 2.7 |
| Nd | 266 | 55.4 | 101 | 16.1 | 63 | 213 | 296 | 219 | 164 | 313 | 11.7 |
| Sm | 58.3 | 12.1 | 21.6 | 3.4 | 14 | 46.8 | 61 | 47.1 | 34.3 | 70 | 2.3 |
| Eu | 13.2 | 2.92 | 5.37 | 0.89 | 3.87 | 11.1 | 15.1 | 10.8 | 8.37 | 16.4 | 0.61 |
| Gd | 58.9 | 13.3 | 23.8 | 4.02 | 15.6 | 49.9 | 68.9 | 47.9 | 38.8 | 72.6 | 2.9 |
| Tb | 9.84 | 2.14 | 3.89 | 0.62 | 2.52 | 7.64 | 10 | 8.08 | 5.96 | 11.4 | 0.43 |
| Dy | 55.5 | 12.6 | 23.7 | 4.02 | 15.8 | 43.6 | 55.5 | 43.4 | 34.5 | 61.3 | 2.8 |
| Ho | 11 | 2.66 | 4.75 | 0.59 | 3.42 | 8.18 | 11.1 | 9 | 6.84 | 11.7 | 0.54 |
| Er | 32.6 | 7.82 | 14.2 | 1.86 | 9.8 | 23.7 | 30.8 | 25.8 | 19.9 | 33.5 | 1.7 |
| Tm | 4.64 | 1.15 | 2.09 | 0.25 | 1.49 | 3.24 | 4.32 | 3.79 | 2.83 | 5.03 | 0.21 |
| Yb | 29.9 | 7.6 | 14 | 2.4 | 10.3 | 21.6 | 27 | 22.9 | 18.9 | 32 | 1.5 |
| Lu | 4.51 | 1.18 | 2.16 | 0.37 | 1.61 | 3.25 | 3.98 | 3.47 | 2.79 | 4.78 | 0.21 |
| Hf | 5.78 | 1.64 | 1.95 | 0.08 | 4.74 | 8.37 | 6.11 | 12.6 | 6.77 | 6.15 | 0.05 |
| Ta | 0.36 | 0.08 | 0.2 | 0.01 | 0.23 | 0.31 | 0.6 | 0.94 | 0.68 | 0.33 | 0.06 |
| W | 139.5 | 95.7 | 136 | 112 | 75 | 57.3 | 89.8 | 71.7 | 70.9 | 128 | 21 |
| Tl | 192.2 | 9.47 | 71.2 | 12.5 | 129 | 71.7 | 167 | 163 | 159 | 56.3 | 3.4 |
| Pb | 2274 | 446 | 405 | 7.37 | 121 | 597 | 1571 | 1349 | 1371 | 1847 | 15.9 |
| Th | 29.6 | 6.19 | 7.35 | 1.57 | 6.9 | 48.3 | 16.5 | 11.9 | 28.8 | 23.3 | 0.41 |
| U | 15 | 4.28 | 5.27 | 7.19 | 4.28 | 9.39 | 13 | 11.8 | 9.19 | 15.4 | 6.4 |
| ΣREY | 3074 | 451 | 931 | 97 | 401 | 1540 | 2270 | 1912 | 1788 | 3013 | 76.8 |
| Ce/Ce* | 3.31 | 1.56 | 2.39 | 0.78 | 0.82 | 1.69 | 1.49 | 1.83 | 3.00 | 2.80 | 0.76 |
| YSN/HoSN | 0.57 | 0.71 | 0.58 | 1.09 | 0.71 | 0.56 | 0.64 | 0.65 | 0.57 | 0.54 | 0.97 |
| Element | 431-5 | ||||||||||
|---|---|---|---|---|---|---|---|---|---|---|---|
| Fraction I | Fraction II | Fraction III | Fraction IV | ∑ | Bulk | R | |||||
| ppm | % | ppm | % | ppm | % | ppm | % | ppm | ppm | % | |
| Si | 398 | 1.68 | 198 | 0.84 | 2775 | 11.71 | 20,325 | 85.77 | 23,697 | 23,697 | 100 |
| Ti | 0.95 | 0.02 | 32.2 | 0.51 | 6118 | 81.95 | 171 | 2.71 | 6323 | 7466 | 85 |
| Al | 18.5 | 0.53 | 262 | 7.47 | 1589 | 42.97 | 1646 | 46.82 | 3517 | 3699 | 95 |
| Fe | 2.26 | 0.00 | 16,484 | 10.72 | 136,616 | 87.76 | 602 | 0.39 | 153,705 | 155,666 | 99 |
| Mn | 20.4 | 0.01 | 275,312 | 97.76 | 5924 | 2.05 | 372 | 0.13 | 281,630 | 288,925 | 97 |
| Mg | 7911 | 78.63 | 1715 | 17.05 | 252 | 2.20 | 181 | 1.81 | 10,061 | 11,495 | 88 |
| Ca | 17,900 | 70.66 | 7289 | 28.78 | 40 | 0.14 | 103 | 0.41 | 25,333 | 27,966 | 91 |
| Na | n.a. | n.a. | 16,076 | 96.98 | 9.62 | 0.05 | 490 | 2.96 | 16,577 | 19,519 | 85 |
| K | 3330 | 66.35 | 1198 | 23.88 | 18.9 | 0.37 | 471 | 9.39 | 5018 | 5112 | 98 |
| P | 16.8 | 0.4 | 5.7 | 0.14 | 4154 | 87.68 | 17.3 | 0.41 | 4194 | 4738 | 89 |
| Y | 5.25 | 2.79 | 98.9 | 52.54 | 44.6 | 25.10 | 39.5 | 20.98 | 188 | 178 | 106 |
| La | 1.81 | 0.64 | 162 | 57.32 | 19.5 | 6.69 | 99.2 | 35.13 | 282 | 291 | 97 |
| Ce | 0.20 | 0.01 | 793 | 40.90 | 172 | 8.64 | 973 | 50.20 | 1938 | 1995 | 97 |
| Pr | 0.42 | 0.66 | 23.8 | 37.38 | 5.03 | 7.56 | 34.4 | 54.05 | 63.6 | 66.5 | 96 |
| Nd | 2.28 | 0.88 | 91 | 35.02 | 19 | 7.14 | 148 | 56.79 | 260 | 266 | 98 |
| Sm | 0.73 | 1.20 | 15.9 | 26.16 | 5.13 | 8.79 | 39.1 | 64.22 | 60.9 | 58.3 | 104 |
| Eu | 0.17 | 1.05 | 3.36 | 21.03 | 1.3 | 9.88 | 11.1 | 69.77 | 15.9 | 13.2 | 121 |
| Gd | 0.85 | 1.23 | 17.6 | 25.56 | 6.15 | 10.45 | 44.3 | 64.29 | 69 | 58.9 | 117 |
| Tb | 0.12 | 1.27 | 2.76 | 29.40 | 1.49 | 15.18 | 5.02 | 53.44 | 9.4 | 9.84 | 96 |
| Dy | 0.65 | 1.26 | 14.9 | 29.13 | 11.1 | 20.09 | 24.6 | 47.93 | 51.4 | 55.5 | 93 |
| Ho | 0.13 | 1.29 | 3.27 | 31.32 | 2.68 | 24.24 | 4.35 | 41.74 | 10.4 | 11 | 94 |
| Er | 0.35 | 1.17 | 9.36 | 31.52 | 9.35 | 28.72 | 10.7 | 35.83 | 29.7 | 32.6 | 91 |
| Tm | 0.04 | 0.92 | 1.28 | 29.38 | 1.76 | 37.91 | 1.27 | 29.19 | 4.35 | 4.64 | 94 |
| Yb | 0.24 | 0.87 | 7.40 | 27.20 | 12.9 | 43.22 | 6.66 | 24.49 | 27.2 | 29.9 | 91 |
| Lu | 0.04 | 0.99 | 1.20 | 29.06 | 1.97 | 43.65 | 0.91 | 22.12 | 4.12 | 4.51 | 91 |
| Σ REY | 13.3 | 0.44 | 1245 | 41.31 | 314 | 10.22 | 1441 | 47.82 | 3014 | 3074 | 98 |
| Ce/Ce* | 0.05 | 2.87 | 4.00 | 3.77 | 3.34 | 3.31 | |||||
| YSN/HoSN | 1.43 | 1.07 | 0.59 | 0.32 | 0.64 | 0.57 | |||||
| 431A-12 | |||||||||||
| Si | <d.l. | n.a. | 173 | 0.33 | 2569 | 4.90 | 49,745 | 94.77 | 52,489 | 52,489 | 100 |
| Ti | 0.49 | 0.05 | 43.9 | 4.28 | 692 | 67.44 | 289 | 28.23 | 1026 | 1186 | 86 |
| Al | 23.7 | 0.35 | 261 | 3.89 | 1579 | 23.45 | 4870 | 72.31 | 6735 | 7163 | 94 |
| Fe | 3.25 | 0.00 | 6758 | 7.80 | 59,954 | 69.17 | 19,964 | 23.03 | 86,680 | 87,583 | 99 |
| Mn | 626 | 0.19 | 329,141 | 98.18 | 5213 | 1.56 | 264 | 0.08 | 335,246 | 349,576 | 96 |
| Mg | 5527 | 29.45 | 8906 | 47.46 | 737 | 3.93 | 3595 | 19.16 | 18,766 | 19,550 | 96 |
| Ca | 7312 | 68.46 | 2877 | 26.94 | 52.9 | 0.50 | 437 | 4.10 | 10,681 | 12,345 | 87 |
| Na | n.a. | n.a. | 14,419 | 96.42 | 26.2 | 0.18 | 508 | 3.40 | 14,954 | 16,167 | 92 |
| K | 3310 | 32.19 | 4399 | 42.79 | 313 | 3.05 | 2259 | 21.97 | 10,282 | 12,066 | 85 |
| P | 19.6 | 1.69 | 7.99 | 0.69 | 1075 | 92.52 | 59.3 | 5.10 | 1162 | 1504 | 77 |
| Y | 2.36 | 4.60 | 24.3 | 47.31 | 23 | 44.78 | 1.7 | 3.31 | 51.3 | 53.7 | 95 |
| La | 0.55 | 0.97 | 30.1 | 53.45 | 17.6 | 31.23 | 8.07 | 14.35 | 56.2 | 66.3 | 85 |
| Ce | 0.15 | 0.09 | 66.4 | 39.05 | 72.1 | 42.46 | 31.3 | 18.40 | 170 | 199 | 85 |
| Pr | 0.12 | 1.17 | 3.74 | 35.62 | 4.32 | 41.19 | 2.31 | 22.02 | 10.5 | 13 | 81 |
| Nd | 0.71 | 1.53 | 12.9 | 27.87 | 22.1 | 47.78 | 10.5 | 22.83 | 46.2 | 55.4 | 84 |
| Sm | 0.22 | 2.10 | 2.94 | 27.40 | 4.91 | 45.71 | 2.66 | 24.80 | 10.7 | 12.1 | 88 |
| Eu | 0.06 | 2.62 | 0.68 | 30.68 | 1.11 | 49.81 | 0.38 | 16.89 | 2.23 | 2.92 | 76 |
| Gd | 0.31 | 3.09 | 3.24 | 32.51 | 4.9 | 49.18 | 1.52 | 15.21 | 9.97 | 13.3 | 75 |
| Tb | 0.04 | 2.43 | 0.52 | 30.90 | 0.91 | 53.87 | 0.22 | 12.80 | 1.69 | 2.14 | 79 |
| Dy | 0.23 | 2.37 | 3 | 30.89 | 5.63 | 58.04 | 0.84 | 8.70 | 9.70 | 12.6 | 77 |
| Ho | 0.05 | 2.45 | 0.69 | 33.36 | 1.21 | 58.08 | 0.13 | 6.11 | 2.08 | 2.66 | 78 |
| Er | 0.14 | 2.28 | 1.97 | 32.94 | 3.6 | 60.21 | 0.27 | 4.56 | 5.97 | 7.82 | 76 |
| Tm | 0.02 | 1.80 | 0.28 | 31.74 | 0.56 | 63.27 | 0.03 | 3.18 | 0.88 | 1.15 | 76 |
| Yb | 0.10 | 1.68 | 1.7 | 29.60 | 3.79 | 66.01 | 0.16 | 2.72 | 5.75 | 7.6 | 76 |
| Lu | 0.02 | 1.90 | 0.29 | 31.52 | 0.58 | 64.03 | 0.02 | 2.55 | 0.90 | 1.18 | 77 |
| Σ REY | 5.07 | 1.32 | 153 | 39.73 | 166 | 43.29 | 60.1 | 15.65 | 384 | 451 | 85 |
| Ce/Ce* | 0.13 | 1.38 | 1.91 | 1.66 | 1.61 | 1.56 | |||||
| YSN/HoSN | 1.67 | 1.25 | 0.67 | 0.46 | 0.87 | 0.71 | |||||
© 2019 by the authors. Licensee MDPI, Basel, Switzerland. This article is an open access article distributed under the terms and conditions of the Creative Commons Attribution (CC BY) license (http://creativecommons.org/licenses/by/4.0/).
Share and Cite
Mikhailik, P.; Khanchuk, A.; Mikhailik, E.; Zarubina, N.; Blokhin, M. Compositional Variations and Genesis of Sandy-Gravel Ferromanganese Deposits from the Yōmei Guyot (Holes 431, 431A DSDP), Emperor Ridge. Minerals 2019, 9, 709. https://doi.org/10.3390/min9110709
Mikhailik P, Khanchuk A, Mikhailik E, Zarubina N, Blokhin M. Compositional Variations and Genesis of Sandy-Gravel Ferromanganese Deposits from the Yōmei Guyot (Holes 431, 431A DSDP), Emperor Ridge. Minerals. 2019; 9(11):709. https://doi.org/10.3390/min9110709
Chicago/Turabian StyleMikhailik, Pavel, Alexander Khanchuk, Evgenii Mikhailik, Nataly Zarubina, and Maksim Blokhin. 2019. "Compositional Variations and Genesis of Sandy-Gravel Ferromanganese Deposits from the Yōmei Guyot (Holes 431, 431A DSDP), Emperor Ridge" Minerals 9, no. 11: 709. https://doi.org/10.3390/min9110709