Article

Polytypism and Polysomatism in Mixed-Layer Chalcogenides: Characterization of PbBi4Te4S3 and Inferences for Ordered Phases in the Aleksite Series

1
School of Chemical Engineering and Advanced Materials, The University of Adelaide, Adelaide SA 5005, Australia
2
College of Zijin Mining, Fuzhou University, Fuzhou 350108, China
3
Adelaide Microscopy, The University of Adelaide, Adelaide SA 5005, Australia
4
Museum Victoria, Melbourne, P.O. Box 666, Melbourne VIC 3001, Australia
5
Department of Earth Sciences, The Natural History Museum, Cromwell Road, London SW7 5BD, UK
*
Author to whom correspondence should be addressed.
Minerals 2019, 9(10), 628; https://doi.org/10.3390/min9100628
Submission received: 9 August 2019 / Revised: 6 October 2019 / Accepted: 7 October 2019 / Published: 12 October 2019
(This article belongs to the Special Issue Minerals Down to the Nanoscale: A Glimpse at Ore-Forming Processes)

Abstract

:
Bi-Pb-chalcogenides of the aleksite series represent homologous mixed-layer compounds derived from tetradymite (Bi2Te2S). Considering tetradymite as composed of five-atom (Bi2Te2S) layers, the named minerals of the aleksite homologous series, aleksite (PbBi2Te2S2) and saddlebackite, (Pb2Bi2Te2S3) have been considered as phases formed by regular stacking of longer seven- and nine-atom layers. High-angle annular dark-field scanning transmission electron microscope (HAADF-STEM) imaging of thinned foils prepared in-situ on domains deemed homogeneous from electron probe microanalysis, STEM energy-dispersive X-ray spectrometry (EDS) element mapping and fast Fourier transforms (FFTs) from the images offer new insights into these structures. The hitherto-unnamed phase, PbBi4Te4S3, previously interpreted as regular intergrowths of five- and seven-atom layers, is characterized in terms of regular repeats of five- and seven-atom layers over distances of at least 350 nm, defining the (57), or 24H polytype. Imaging of other domains in the same lamella with identical composition at the electron microprobe scale reveals the presence of two additional polytypes: (5559), or 48H; and (557.559) or 72H. Unit cell dimensions for all three polytypes of PbBi4Te4S3 can be both measured and predicted from the HAADF STEM imaging and FFTs. STEM EDS mapping of each polytype confirm the internal structure of each layer. Lead and S occur within the centre of the layers, i.e., Te–Bi–S–Pb–S–Bi–Te in the seven-atom layer, Te–Bi–S–Pb–S–Pb–S–Bi–Te in the nine-atom layer, and so on. Polytypism is an intrinsic feature of the aleksite series, with each named mineral or unnamed phase, except the simple five-atom layer, defined by several alternative stacking sequences of different length, readily explaining the differing c values given in previous work. Homology is defined in terms of layer width and the stacking arrangement of those layers. Coherent structures of the same composition need not only be built of layers of adjacent size (i.e., five- and seven-atom layers) but, as exemplified by the (5559) polytype, may also contain non-adjacent layers, a finding not anticipated in previous work. New polysomes remain to be discovered in nature and each potentially exists as multiple polytypes. The present study further emphasizes the utility of HAADF STEM imaging and atomic-scale STEM EDS element mapping as an optimal tool for tracking stacking sequences and characterising structures in mixed-layer compounds.

1. Introduction

Bismuth-lead-chalcogenides of the informally named aleksite series, PbnBi4Te4Sn+2 [1] represent a modular series derived from tetradymite, Bi2Te2S, where n = 0. These phases are reported as minor constituents of several gold-bearing ore deposits [1]. They represent a discrete group of named minerals and as-yet unnamed phases, whose structures are derived from the tetradymite group of bismuth chalcogenides [2,3]. The first named Pb–Bi-tellurosulphide, aleksite (PbBi2Te2S2), was described from the Alekseyev mine, Sutamskii region, Stanovoi Range, Siberia, Russia [4]. A second member of the series, saddlebackite (Pb2Bi2Te2S3), was described from the Boddington gold deposit, Western Australia [5]. Cook et al. [1] provided new paragenetic and microanalytical data for aleksite series minerals in samples from three additional localities: the Clogau mine, Wales, U.K.; the Iilijärvi deposit, Southwest Finland; and from Fragant, Austria. These data indicated the possible existence of several additional, as-yet unnamed phases. These unnamed phases have compositions between that of tetradymite and aleksite, between aleksite and saddlebackite, and in the range Pb5Bi4Te4S7 to Pb7Bi4Te4S9. An additional member of the series, hitachiite (Pb5Bi2Te2S6) has recently been accepted as a new mineral [6]. An overview of named, unnamed and predicted species in the series is given in Table 1.
Cook et al. [1] proposed that each named mineral, as-yet unnamed phase, or predicted phase could be considered in terms of a structure based on regular stacking sequences of odd-numbered units represented by 5-, 7-, 9-, 11- etc. atom layer-thickness. Compositions where n = 2k (where k is an integer value), correspond to single-layer structures, e.g., aleksite (n = 2) or saddlebackite (n = 4), whereas those with n = 2k + 1 integer values are formed by combinations of two units with an incremental number of atoms (Table 1), e.g., n = 1 for a combined five- and seven-atom layer stack (57), representing unnamed PbBi4Te4S3 (informally termed hereafter as “Phase C” following the first reference to such a phase [4]). Based on empirical compositional data for other phases suggesting the presence of longer units, e.g., 11- and 13-atom layers, (Table 1) an accretional homology was inferred in which incremental n accounts for development of higher-order homologues [1].
Aleksite and saddlebackite were included in reviews of sulphosalt systematics where they are considered as homologous “layered sulphosalts related to the tetradymite archetype”, with the general formula Pb(n − 1)Bi2X(n + 2) (X = chalcogen; Te, S, Se) [7]. The recently added member of the series, hitachiite ([6]; Table 1), is acknowledged as a homologue in which either n = 10 or 6, according to the definitions of either [1] or [7].
A different approach to modularity of layered compounds from the PbTe–Bi2Te3 system, directly analogous to compounds in the aleksite series, was introduced as nPbTe.mBi2Te3 (n/m < 1) [8]. Such an approach followed previous work on compounds from the “Bi–Te” series [9], later redefined as the tetradymite group and derived from the same five-layer unit as in the aleksite series, called the “tetradymite” archetype [2]. Imamov and Semiletov [9] suggested that, beside the five-atom layer, a layer of two atoms (Bi–Bi or Bi2) existed, leading to the general formula nBi2.mBi2Te3 (where m and n are integers) for compounds in the Bi–Te system. Metallic bonds, based on band structure calculations, were considered within the Bi-Bi unit, so as to account for charge balance within the Bi-chalcogenide structures [10]. Similar approaches to modularity as given by [9] were followed in more recent studies of phase stability, thermoelectric properties and low phonon thermal conductivity of the infinitely adaptive nBi2.mBi2Te3 chalcogenide series of synthetic compounds (e.g., [11,12,13]). Temperature-dependent changes in the 3D topological insulator Bi2Te3 upon insertion of Pb and PbTe layers have been shown using Raman analysis and Density Function Theory simulations [14].
Based on a high-resolution Transmission Electron Microscopy (HR-TEM) study of synthetic phases of the type M2 + δX3, where M = Bi, Sb, Ge, X = Te, Se and 0 ≤ δ ≤ 0.4), Frangis et al. [15] suggested addition of M–X (instead of M–M layers) to the Bi2X3 archetype and expansion of the series toward δ → 1, where the limiting phase (δ = 1) is considered a hypothetical BiTeccp with NaCl-type cubic closed packed structure. Fractional shift method applied to electron diffraction analysis of Landuyt et al. [16] suggested that a continuous series of one-dimensional superstructures could be constructed from sequences of five- and seven-layer units [15]. A similar HR-TEM approach was followed by Ciobanu et al. [3], who studied natural phases in the range Bi2Te3–Bi8Te3 and considered them as mixed-layer compounds with the formula S′(Bi2kX3)·L′[Bi2(k + 1)X3], where X = chalcogen, and S′ and L′ are the number of short and long modules, respectively. Electron diffraction patterns, displaying two brightest reflections about the middle of d*, are described by monotonic decrease of two modulations relating changes in module size and number to displacements in a basic substructure., a rhombohedral subcell with c/3 = d~2 Å. The study of Ciobanu et al. [3] confirmed the findings of Frangis et al. [15] showing that the tetradymite group consists of continuous one-dimensional N-fold superstructures of the basic subcell, where N is the total number of layers in the stacking sequence.
Mixed-layer compounds are a class of modulated structures in which electron diffraction patterns display characteristics that can be used to underpin the stacking sequences, and therefore, also any variation in chemical composition [20,21]. Based on analogy with the tetradymite group, the aleksite series was proposed to be part of a general chalcogen-rich series of mixed-layer compounds with one-dimensional interface modulated structures that could be expressed by the general formula Mp + ɛXp + 1 (M = Pb, Bi; X = Te, S, Se (where p > 2; ɛ < 1) [3]). Phases with ɛ = 0, including aleksite, consist of a single type of layer, whereas phases with ɛ ≠ 0 can be predicted as combinations of shorter and longer layers, S(MpXp + 1).L(Mp + 1Xp + 2), where S and L are the number of shorter and longer layers, respectively. In such a model, there are no distinct “Bi2Te2S” or “PbS” modules, as implied by the representation of the chemical formula in terms of nPbS.mBi2X3, but rather incremental “strips” (combinations of layers) containing odd numbers of atoms (5, 7, 9, 11, 13, and so on). This formalism can be used to estimate the stacking sequences and cell parameters for each homologue in the series (Table 1).
High-angle annular dark-field scanning TEM (HAADF-STEM) study of samples prepared by Focused Ion Beam, (FIB) is an excellent Z-contrast imaging technique that allows direct visualization of modular structures, e.g., chessboard structures in Pb–Bi–Sb-sulphosalts [22,23], or ordered/disordered stacking sequences in mixed-layer REE-fluorcarbonates of the bastnäsite-synchysite group [24]. The technique offers a visual representation of chemistry at the atomic scale, enabling the assessment of layer combinations (including distinct polytypes, where present) that can represent a certain chemistry, as well as the internal arrangement of atoms within those individual layers. Irrespectively of specific chemistry, in all layered chalcogenides, the building modules (anion–anion bonds) are separated from one another by van der Waals gaps [1,2,8,9] and thus cannot be reconciled with the sensu stricto definition of Bi–Pb-sulphosalts [25]. The five-atom atomic arrangement separated by gaps was confirmed by HAADF STEM imaging of natural tellurobismuthite [26] and its synthetic analogue [27,28,29,30]. High-resolution HAADF STEM images of such compounds has allowed further insight into the role played by atomic interfaces, (0001) basal twin boundaries, dislocations and Bi3Te4 defects in Bi2Te3 in controlling thermoelectric properties.
In this contribution, we use HAADF STEM imaging and STEM energy-dispersive X-ray (EDS) mapping of unnamed homogenous PbBi4Te4S3 (Phase C) in order to validate the crystal structural model for the series and visualize the sequence of atoms within the component layers, particularly the configuration of higher-order, odd-numbered units considered to have a centrosymmetric arrangement with respect to cations and anions, e.g., Te–Bi–S–Pb–S–Bi–Te for the 7-atom layer. Constraining the atom-layer stacking in compounds with mixed-layer units, such as Phase C, will allow a more precise definition of ‘n’ homologue number in terms of a crystal structural factor rather than a purely chemical number corresponding to the number of Pb atoms in the formula if recalculated to ensure a constant four atoms of both Bi and Te. In turn, mixed-layer modularity within the series can provide explanations for phases of similar composition that are reported with variable cell parameters.
As an exemplary homologous series of mixed-layer compounds, much can now be learnt through application of HAADF STEM imaging and mapping about the aleksite series. The prospects for characterization of additional natural minerals within the series remains high, based on predicted structure and composition. This is complemented by the recognition of widespread polytypism in the present study, whereby defined compositions may be represented by more than a single structure. Interest in Bi-chalcogenide structures remains very high, given the value of such compounds and their derivatives for thermoelectric energy conversion and as topological insulators [11,12,13,14,30,31,32], with aleksite series phases singled out for attention in some recent studies [33,34].

2. Materials and Methods

All work reported here was carried out on specimen E.1309 from the collection of the Natural History Museum (UK), corresponding to National Museum of Wales NMW specimen number NMW 90.37 G.M1 and M2a and b [35]. This is a sample from high-grade gold veins at Clogau, Wales, UK ([36] and references therein). In this sample, aleksite and “phase C” occur together with galena and tellurobismuthite. A description of the sample, including reflected light images and electron probe microanalytical data, was given by Cook et al. [1]. This contains lamellar intergrowths of aleksite, PbBi4Te4S3 (phase C), galena, tellurobismuthite, and minor chalcopyrite, with traces of native gold. Back-scatter electron (BSE) imaging at high-magnification emphasizes that many of the coarser lamellae feature fine-scale intergrowths of multiple phases. All work described here was performed on a single lamella, roughly 160 μm across, that appeared homogeneous on BSE images.
Initial examination of the sample and selection of areas for new quantitative mineral compositional data and preparation of foils for TEM study was performed using a FEI Quanta 450 scanning electron microscope (SEM) (FEI, Hillsboro, OR, USA) housed at Adelaide Microscopy, The University of Adelaide, and equipped with energy-dispersive X-ray spectrometry and BSE imaging capabilities. New quantitative mineral compositional data was obtained using a Cameca SX-Five electron probe microanalyser (Cameca SAS, Gennevilliers, France) in the same laboratory. The instrument was operated at 20 kV and 20 nA with a defocussed spot of 5 µm. X-ray lines were as follows: S (Kα), Pb (Mα), Se (Lα), Te (Lα), Bi (Mα). All standards used were from P&H and Associates, including chalcopyrite for S, synthetic Bi2Te3 for Bi and Te, galena for Pb, and synthetic guanajuatite, Bi2Se3, for Se. Count times were 20 s on peak and 10 s off peak, with multipoint backgrounds used for all elements, giving a total count time of ~3 min. Average minimum detection limits (99% C.I. in wt. %) were 0.008 for S, 0.04 for Pb and Bi, 0.03 for Se and 0.024 for Te. Qualitative X-ray mapping utilised the same instrument, operated at 15 kV and 200 nA at a pixel resolution of ~1 µm. Pixel dwell time was set to 2000 ms. Calibration and quantitative data reduction of maps was carried out in ‘Probe for EPMA’ software, distributed by Probe Software Inc. Coloured maps were processed using Surfer 10® software distributed by Golden Software.
Two FIB cuts were made on the sample surface of the selected lamella and slices extracted in-situ. Each was thinned and prepared for TEM study. Preparation of thinned (<100 nm) foils for TEM investigation was performed using a FEI-Helios nanoLab Dual Focused Ion Beam and Scanning Electron Microscope (FIB-SEM; FEI, Hillsboro, OR, USA) in the same laboratory, following procedures outlined in [37]. Each TEM foil was attached to a copper grid. HAADF STEM imaging was performed using an ultra-high resolution, probe-corrected, FEI Titan Themis S/TEM (FEI, Hillsboro, OR, USA) in the same laboratory operated at 200 kV. This instrument is equipped with the X-FEG Schottky source and Super-X EDS geometry. The Super-X EDS detector provides geometrically symmetric EDS detection with an effective solid angle of 0.8 sr. Probe correction delivered sub-Ångstrom spatial resolution, and an inner collection angle greater than 50 mrad was used for HAADF experiments using the Fischione HAADF detector.

3. Results

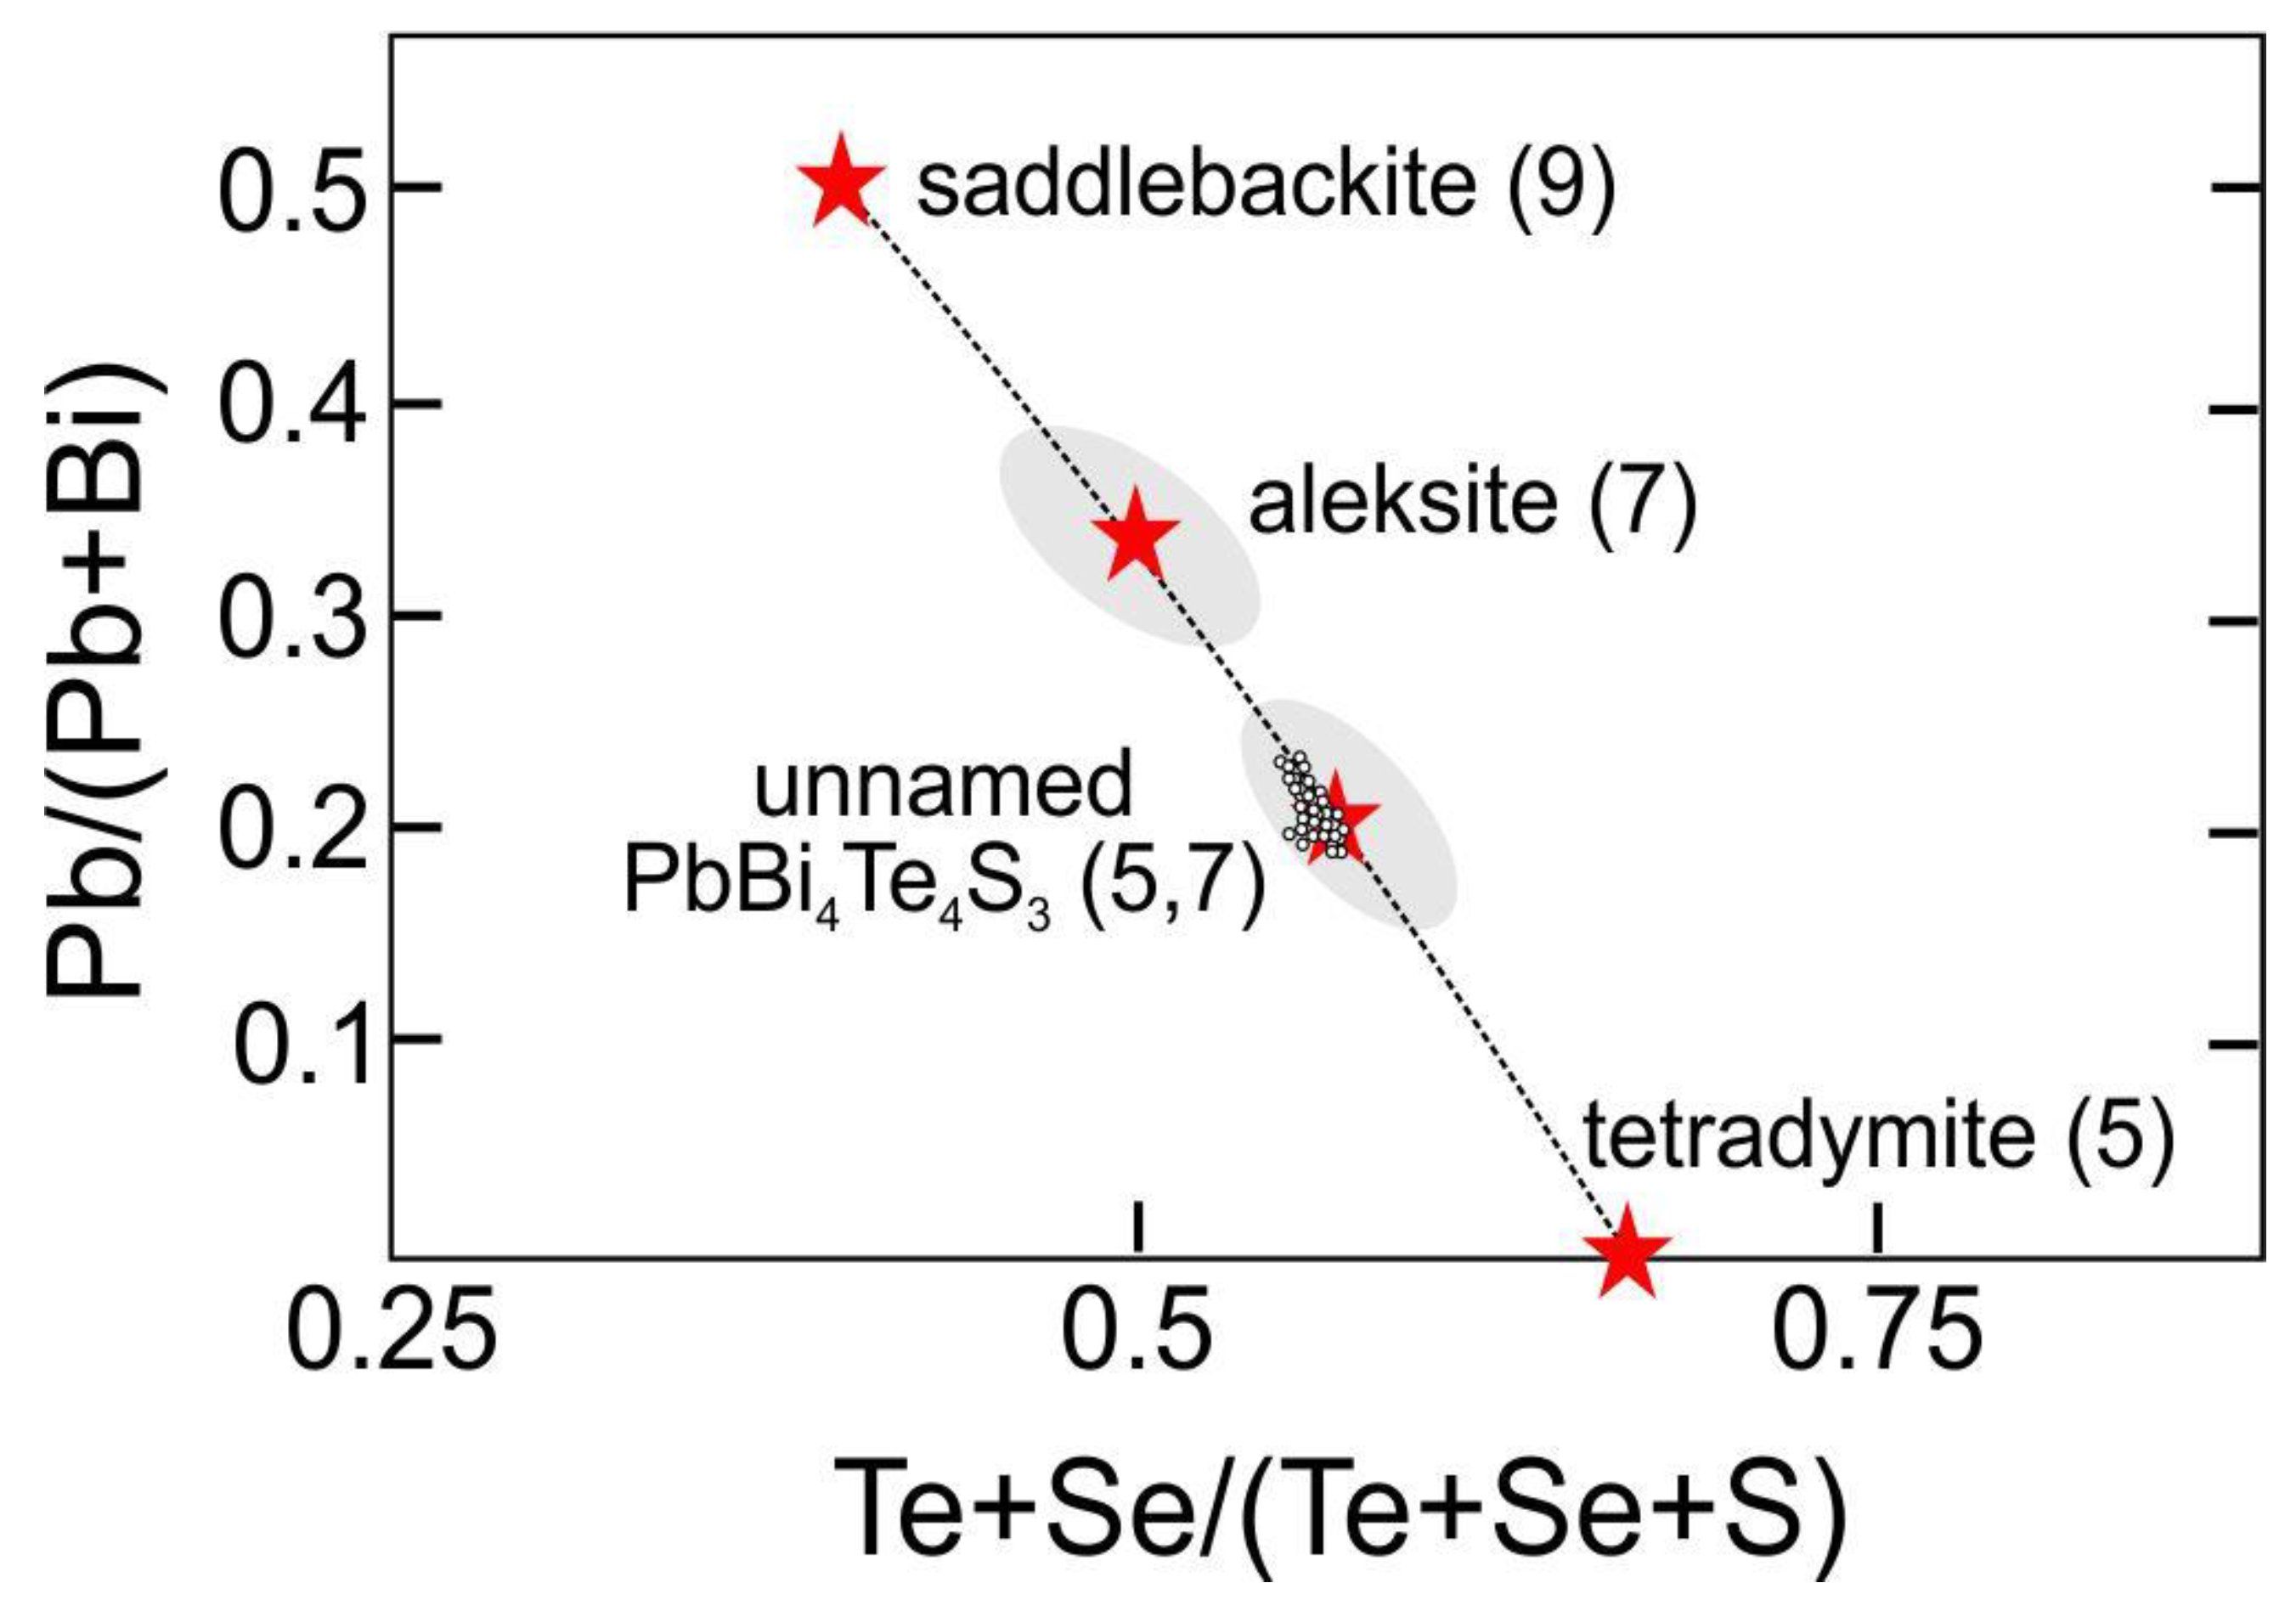
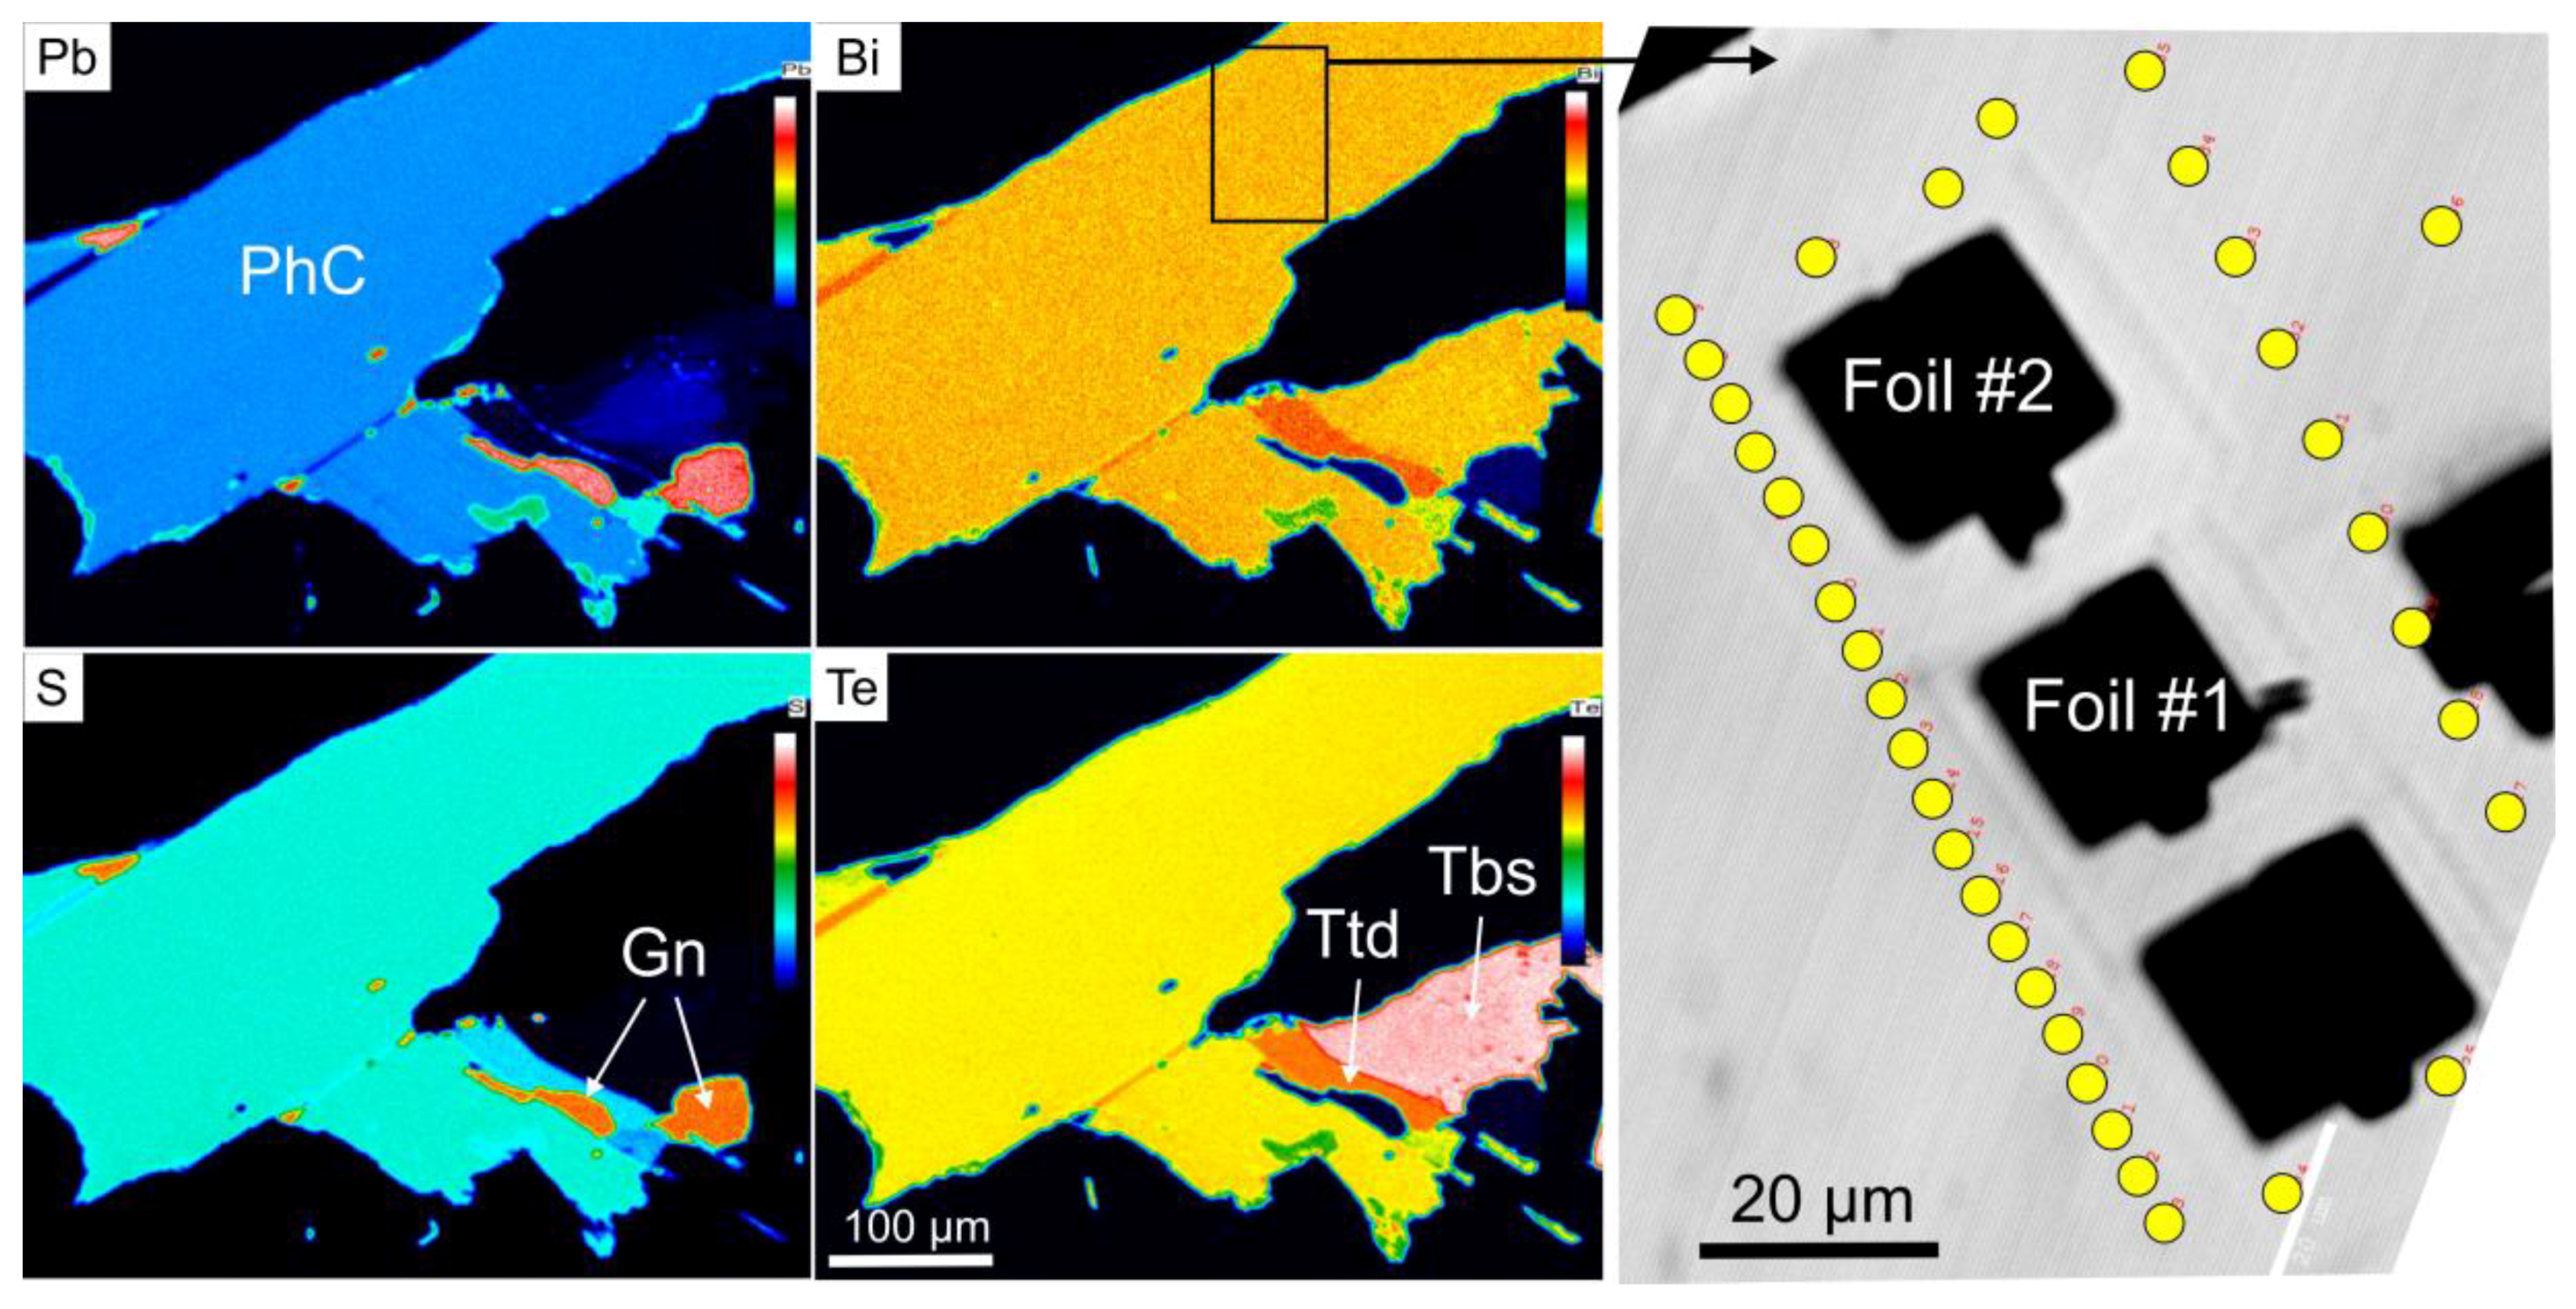
3.1. Compositional Data (EPMA)

EPMA data were collected from the immediate area around the FIB-cuts (Table 2). These reveal a reasonably homogeneous composition approximating to PbBi4Te4S3, albeit with slight excess of S and depletion of Te and Bi relative to ideal stoichiometry. Comparison between the new dataset and microprobe data given previously by Cook et al. [1] show, however, a much tighter cluster (Figure 1), suggesting, in turn, that some areas analysed previously contained disordered, non-stoichiometric domains.
Homogeneity of the lamella was confirmed by EPMA element mapping (Figure 2), contrasting strongly with other grains in the sample.

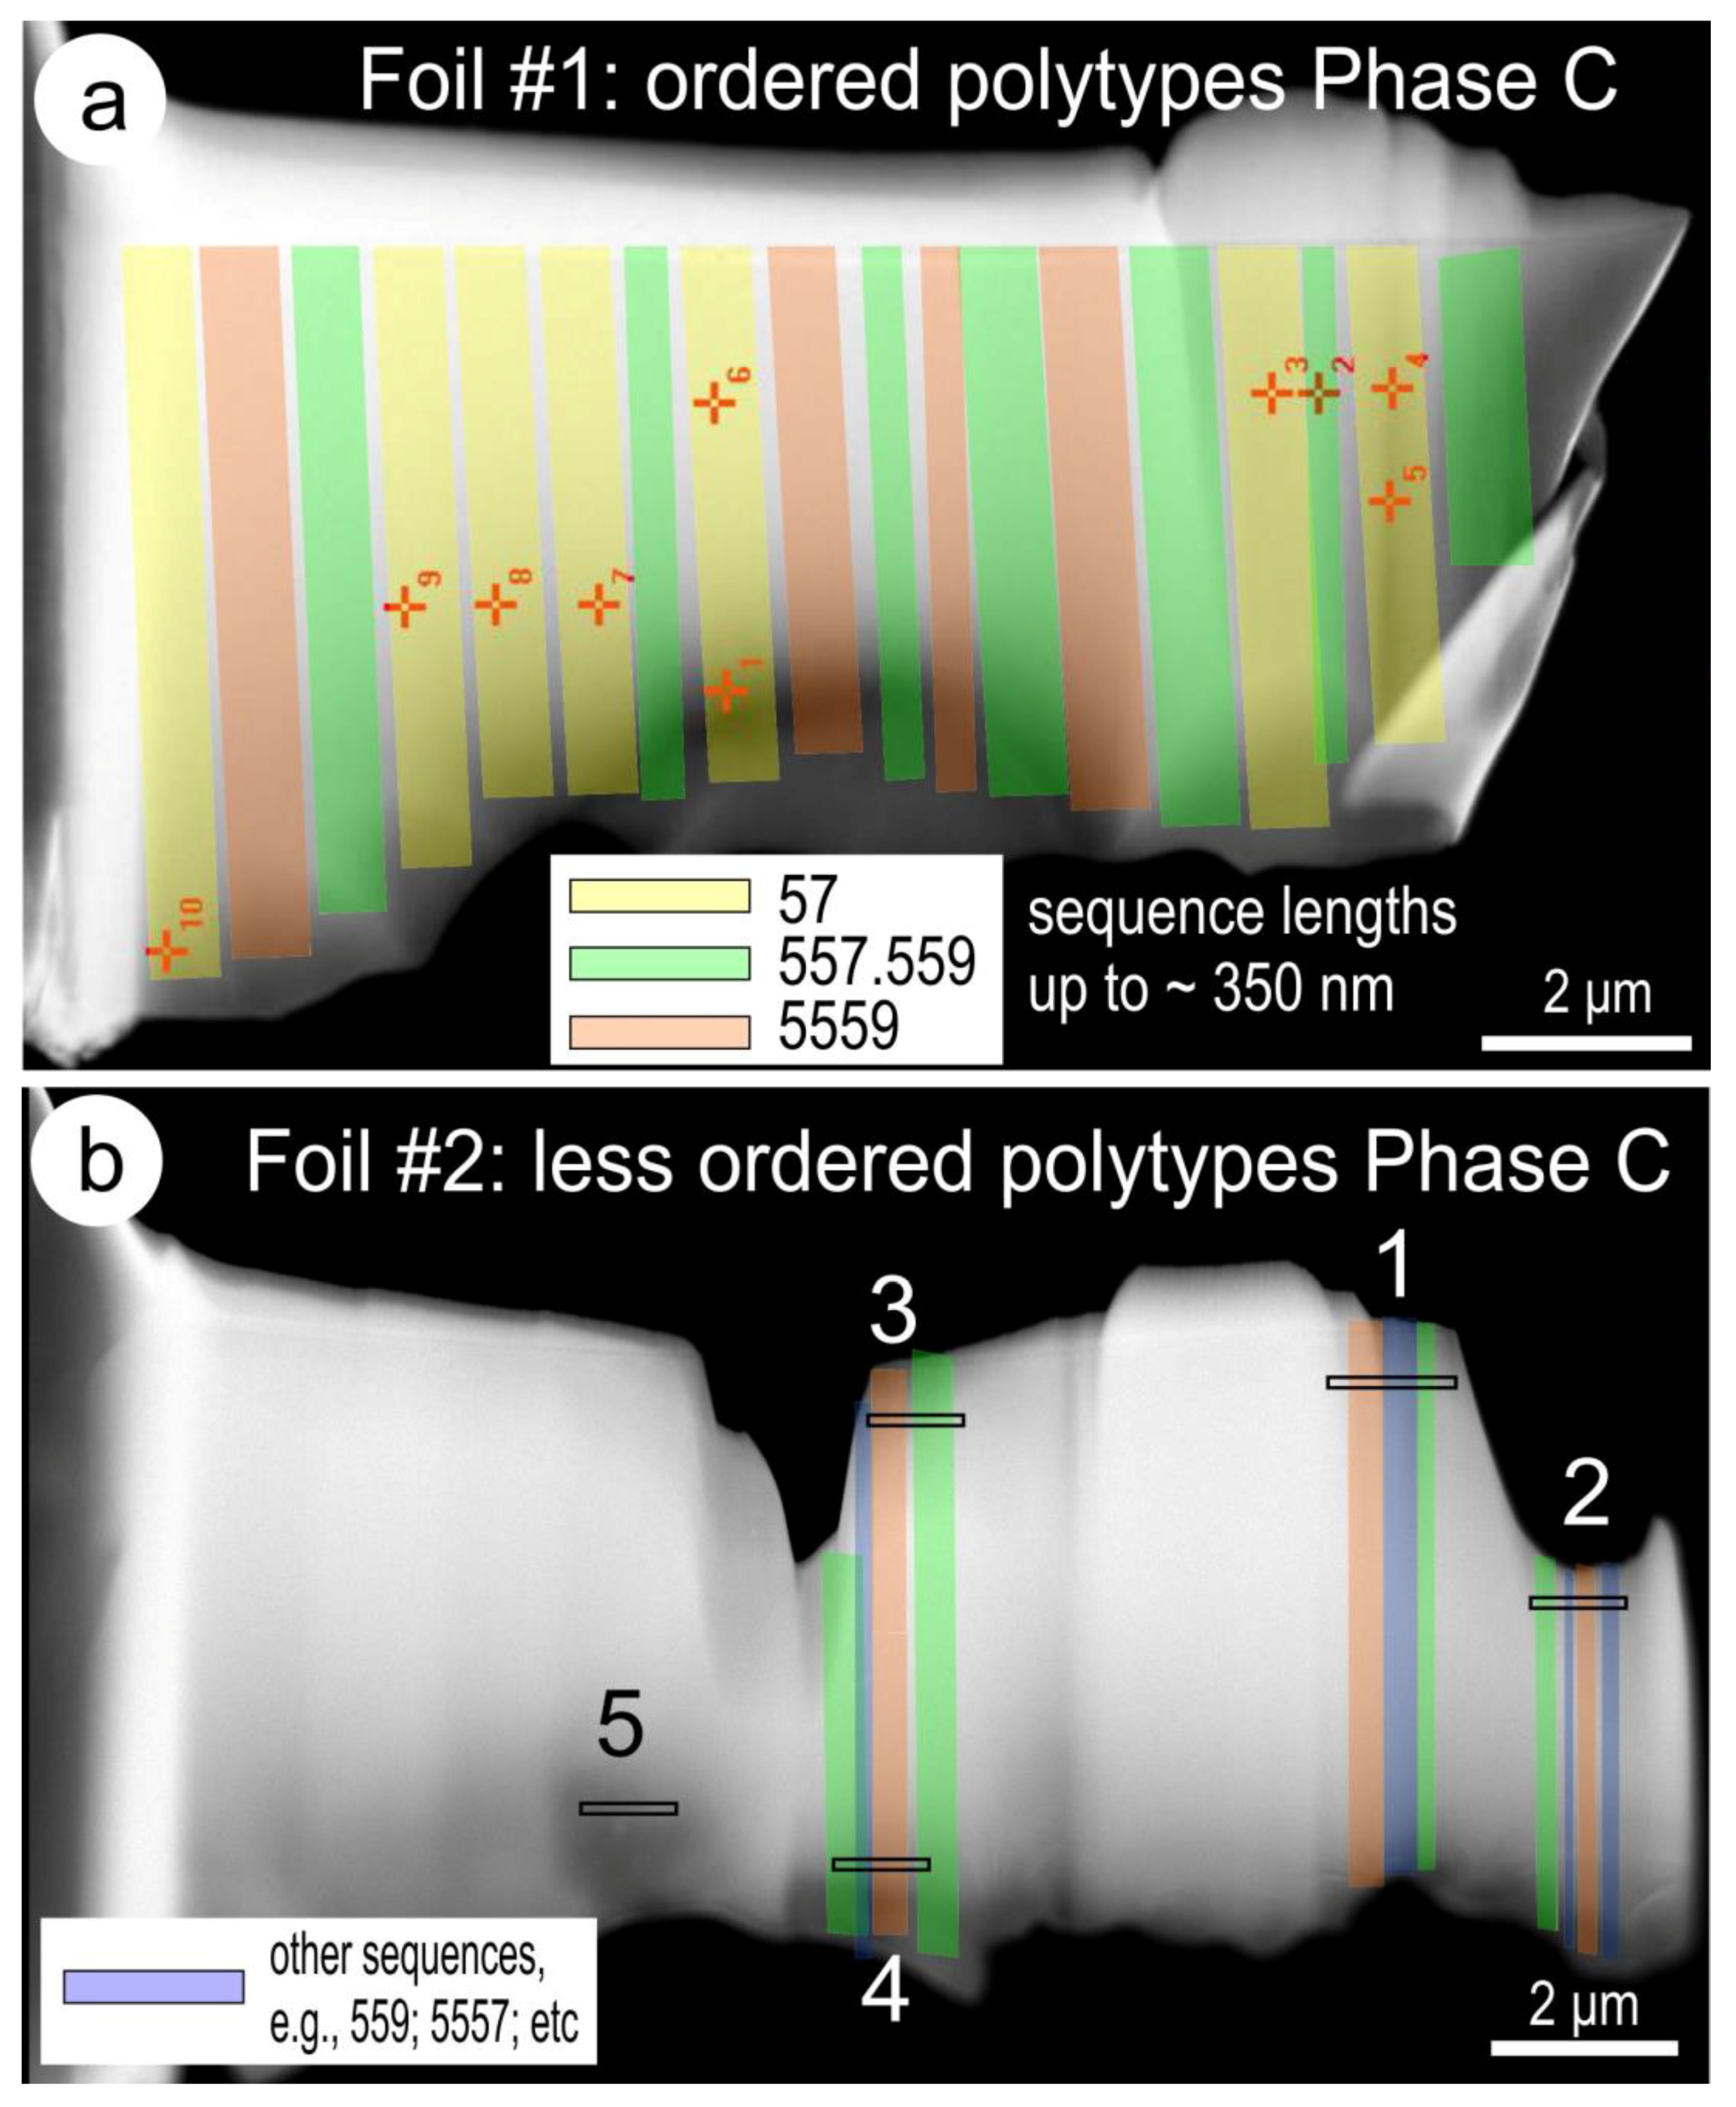
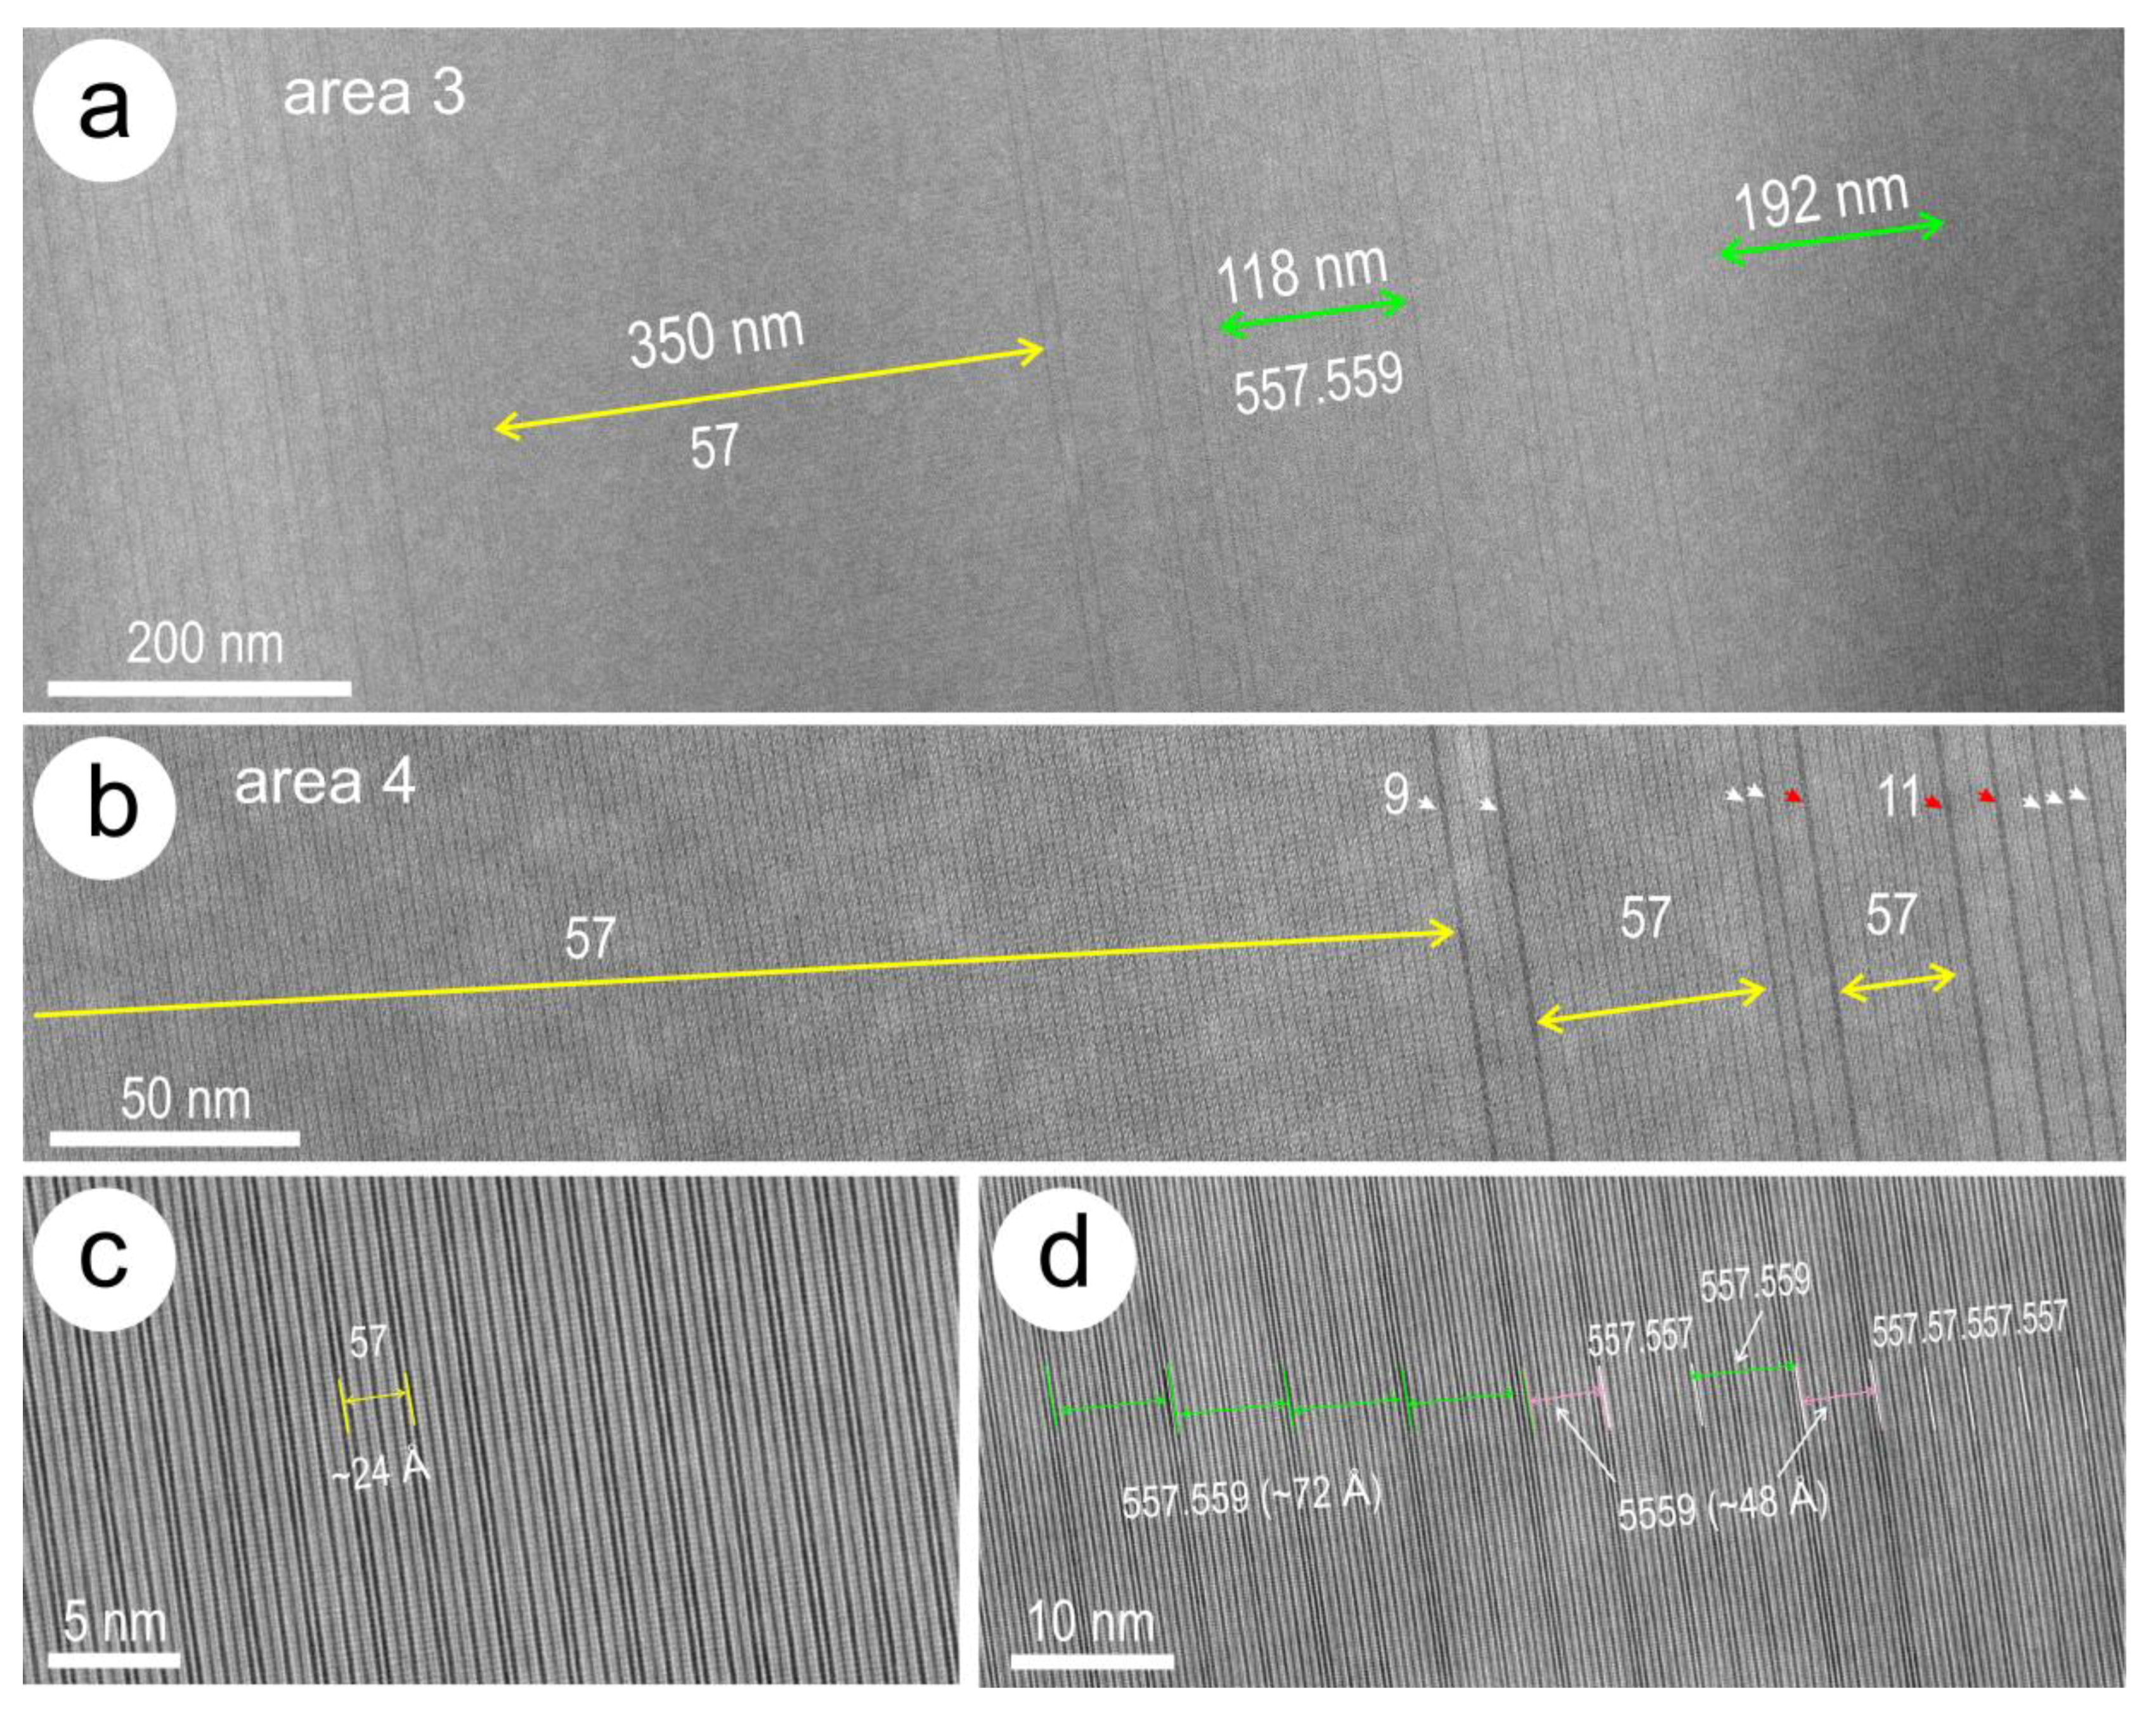
3.2. Stacking Sequences and Their Distributions

Imaging in HAADF STEM mode shows that the foils (Figure 3) are not homogenous in terms of stacking sequences, although the foil obtained from the middle part of the lamella (foil #1) is more ordered than the one obtained at a distance of ~40 microns to one side of the lamella (foil #2). Continuous low-magnification imaging over the ~15 micron-length exposed in foil #1 shows homogenous intervals of hundreds nm (up to ~350 nm) with regular stacking sequences represented by combinations of five-, seven- and nine-atom layers (Figure 3a).
Among the sequences observed, (57) is the two-stack sequence corresponding to M2X3.M3X4 with p = 2 when considering the general formula MpXp + 1.Mp + 1Xp + 2 [3]. This phase has a total number of layers (N = 12) and a polysome formula of M2.14X3 (M = Bi, Pb, Sb, Ge; X = Te, S, Se) characterised by ε = 0.14 [3]. This is the simple, expected stacking sequence that represents the composition of “Phase C”, PbBi4Te4S3 [1] if the shortest five-atom layer is represented by tetradymite, Bi2Te2S.
The other two stacking sequences observed over intervals of hundreds of nm are (5559) and (557.559). Calculation of these four-, and six-stack sequences using the formalism of [3] shows they are polytypes (i.e., different number of layers and stacks of the same polysome) also representing the composition of Phase C (Table 3). The simplest (57) polytype is present throughout the foil and makes up roughly half its length and is interspersed with sequences of both (557.559) and (5559) (Figure 3a). Less ordered sequences comprising (557.559), (5559), as well as other less abundant polytypes, were found instead throughout foil #2 (Figure 3b). No regular repeats of (57) sequences were encountered in foil #2. The stacking sequences were investigated in higher detail from five locations (Figure 3b), both by imaging and EDS-STEM mapping.
The orientation of the lamella is close to the [ 1 ¯ 100 ] zone axis, allowing identification of the polytypes and further details of their distribution across foil #1 (Figure 4). The longest intervals of (57) repeats are surrounded by disordered stacking sequences interspersed with (557.559) and (5559) sequences of variable lengths, from ~100 nm to ~200 nm (Figure 4a).
The boundary of the longest (57) sequences dissipates into shorter (57) intervals interspersed with stacks comprising longer layers of 9- and 11-atoms (Figure 4b). In detail, the ordered and disordered polytypes sequences are recognisable by the presence of 7- and 9-atom layers that are readily identifiable on the HAADF STEM images (Figure 4c,d). The width of the layer stacks for the three polytypes representing the composition of “Phase C” vary from ~24 Å, to ~48 Å and ~72 Å for (57), (5559) and (557.559), respectively (Table 3). Therefore, up to 145, 16 and 40 repeats of the (57), (557.559), and (5559) polytypes, respectively, are present throughout the intervals marked as area 3 in foil #1 (Figure 4a). However, the two longer polytypes, (557.559), and (5559), could also form up to 48 and 72 repeats within any given interval of ~350 nm imaged in foil #1 (Figure 3a).
Imaging of the stacking sequences by tilting the specimen on [ 2 1 ¯ 1 ¯ 0 ] zone axis (Figure 5) shows the individual layers separated by dark bands (van der Waals gaps). Occasional defects, such as single five-atom layers, may occur within longer repeats hosting tens of (57) sequences (Figure 5a). On this zone axis, the number of bright spots correspond to the number of M atoms in each layer, e.g., two, three, and four for five-, seven-, and nine-atom layers, respectively (Figure 5b). Single repeats of the longest (72 nm) polytype, (557.559), may also occur isolated within the (57) matrix. Whereas the former type of disorder slightly alters the composition, no chemical variation is associated with the stacking disorder illustrated in the latter case (Figure 5b).
Examples of stacking sequences imaged from foil #2 show far greater changes in the periodicity of (557.559) and (5559) polytypes over tens rather than hundreds of nm (Figure 6). The intervals outside the two polytypes are dominated by presence of (557) stacks interspersed with 9-atom layers (Figure 6a), or (55559.557) stacks (Figure 6b). Such stacks have ε < 0.14 (Table 3) typical of “Phase C” and would account for compositional variation towards the chalcogen-rich side of the cluster shown on Figure 1. Intervals of ~200 nm in length imaged and mapped from four areas show a good correlation between the stacking sequences and the distributions of Bi, Te, Pb and S (Figure 7 and Figure 8).
The stacking sequences nevertheless show much disorder with short intervals of either (557.559) or (5559) polytypes interspersed with other stacks as listed in Table 3. The only exception is the 10 × (557.559) and 6 × (5559) repeats from intervals in area 4 (Figure 8b). All four maps show remarkable positive correlations between (i) Bi and Te and (ii) Pb and S (Figure 7 and Figure 8). Although characterised by a high degree of short-range stacking disorder, the presence of stacks with both ε > 0.14 and ε < 0.14 indicates that the overall composition is maintained across foil #2. This explains the apparent homogeneity of the lamella mapped at the micron-scale (EPMA maps in Figure 2).

3.3. Polytype Derivation Using the Displacement Vector Model for Interface Modulated Structures

Assessment of the three polytypes corresponding to “Phase C” as interface modulated structures was undertaken by relating the imaging of layer stacks to the distribution and intensity of reflections on Fast Fourier Transform (FFT) patterns. High-resolution HAADF STEM imaging of the polytype sequences from foil #1 on both the [ 1 ¯ 100 ] and [ 2 1 ¯ 1 ¯ 0 ] zone axes show the layer stacks for all three polytypes, albeit with tighter atom arrangements on the first orientation (Figure 9 and Figure 10a–c). Nevertheless, on both zone axes, variation in the intensity of reflections along c* is observed within the d* interval (inset to Figure 9 and Figure 10d–f), corresponding to the rhombohedral subcell as defined for compounds from the tetradymite group [3]. Variation in the intensity of satellite reflections across d* indicates that a primary wave-modulation vector can be considered as a displacement vector (qF*) that links the structural modules to the composition (γF) by the relationship:
qF* = γF × d*
for the three polytypes (Figure 10g). The number of stack layers is observed as the number of divisions (i) across the distance between the brighter two satellites in the centre of d*, corresponding to the modulation vector qF*. The FFT patterns obtained from images of the three polytypes allow measurements of d* and qF*, as well as estimation of i. Values for the smallest distance between two reflections within d* (dN) and the total number of layers within the stack (N) can hence be calculated from:
qF* = i × dN* = (i × d*)/N
leading, in turn, to:
dN = qF/i and N = (i × qF)/d
Measurements on FFTs patterns for the three polytypes (Table 4) give a range of calculated dN values and N integer numbers which correspond to the number of atoms across the stacking sequence, as seen on the high-resolution images (Figure 10a–c). The range of values for γF obtained from the measured d and qF values using formulae resulting from Equation (1) are close to those calculated from basic principles (Table 3). The best fit for the obtained values can be considered for γF = 0.1664 for all three polytypes. The c parameter calculated from measured values is close to theoretical values at the best fit condition in each case (Table 4). We note that the (57) polytype has two solutions for the same γF value of 0.1664. Of these, the value c = 23.2 Å is very similar to c = 23.12 Å obtained for the synthetic analogue of Phase C (Table 1; [18]). Measurements for da from FFTs on the [ 10 1 ¯ 0 ] zone axis are within the range 3.7–3.5 Å, giving parameters for a between 4.27 Å and 4.5 Å when using the formula: a = da/cos30°. The smaller value is close to a = 4.24 Å obtained for the synthetic analogue of Phase C (Table 1; [18]).

3.4. Internal Structure of the Layers—Identity of Atom Layers

The correspondence between the measured and predicted values using the displacement vector model for interface modulated structures following the approach in [3] confirms that the aleksite series is part of the broader class of mixed-layer compounds. This proves that the crystal chemical modularity of the series depends upon the widths of the component modules and their stacks [3] rather than chemically defined units defined in terms of mPbS.nBi2Te2S (Table 1). The identity of each atom within a given layer unit can be seen across profiles obtained from the EDS STEM map 1 (Figure 11). The HAADF signal depicts the number of bright atoms within each layer, i.e., two, three, or four, in the five-, seven- and nine-atom layers, respectively, and the sequence can be directly compared with the images (Figure 11a–d).
The longest (nine-atom) layer observed in the sequence depicted in Figure 11 shows how the signals for Bi, Te, Pb and S map the atomic arrangement within the layer (Figure 11d). This shows that the HAADF signal is reduced in the middle of the nine-atom layer (Figure 11c,d) because the Pb and S atoms are always positioned in the middle of the sequence. This also explains why the brightness of the layers decreases with an increase in the total number of atoms in a given layer on the extended maps (Figure 6, Figure 7 and Figure 8). For example, the five-layers (Te–Bi–S–Bi–Te) are the brightest, followed by the seven-atom layers (Te–Bi–S–Pb–S–Bi–Te), but these are still less dark than the nine-atom (Te–Bi–S–Pb–S–Pb–S–Bi–Te) or 11-atom (Te–Bi–S–Pb–S–Pb–S–Pb–S–Bi–Te) layers. The atomic layers are also shown as overlays on high-resolution HAADF STEM images comprising the layer types identified in the stacks for the three polytypes (Figure 12).

4. Discussion

4.1. The Identity of PbBi4Te4S3 and Polytypism among Pb–Bi Chalcogenides

The crystal-structural similarity between the chalcogen- and metal-rich series, i.e., aleksite series and tetradymite group [1,2], predicted by [3], is confirmed in this study. The close similarity in the unit cell parameters, within measurement errors, between the data here for the (57) polytype and those obtained for synthetic PbBi4Te4S3–Phase C [18] indicates that this is likely to be more stable than either of the longer polytypes, (5559) or (557.559). Moreover, the (57) polytype of PbBi4Te4S3 is characterized by electron diffraction/FFT patterns as being directly comparable with analogous (57)-phases from the tetradymite group, e.g., tsumoite, BiTe [3], whereby displacement shifts introduced by a modulation vector underpin the stacking sequence and, implicitly, their composition. However, apart from hedleyite, Bi7Te3, in the tetradymite group [2], which would correspond to (9.11) stacks [3], no other double- or multi-layer stack species are previously known from either of the two series.
The studied compound PbBi4Te4S3 (Phase C) is, therefore, illustrative for understanding the identity of naturally occurring multi-layer compounds. The presence of nanoscale intergrowths between polytypes with variable c but with narrow ranges of γF values (close to the ideal 0.1667 for PbBi4Te4S3; Table 3), and thus representing compositionally homogenous material (Figure 1 and Figure 2), may be a wider phenomenon intrinsic to natural assemblages. The c parameter for the studied material can be estimated as a weighted average of the c parameters of the three polytypes which represent multiples of one another, i.e., 48 Å for (5559) and 72 Å for (557.559) are a doubling and tripling, respectively, of the 24 Å parameter for (57), by taking various proportions among them. The effect of high-stacking disorder at the boundaries between the various polytypes and the exact proportions across several micron-wide areas cannot, however, be accounted for from the present nanoscale study.
High-precision, X-Ray synchrotron microdiffraction is considered to understand the exact identity of the lamella discussed here with implication for assessing the influence of small-scale disorder in other natural Bi–Pb-chalcogenides. Recognition of the three polytypes, of which one is likely to be dominant in any given sample, provides a ready explanation for the discrepancy between the c dimensions given in [1] for Clogau material (69.73 Å) and the analogous synthetic in [18], 23.12 Å (Table 1).
Imaging in HAADF STEM mode has proven a powerful technique for recognition of nanoscale intergrowths among distinct polymorphs and/or polytypes in a series of mixed-layer compounds, as shown for the bastnäsite-synchysite group of REE-fluorcarbonates (e.g., [16]). Polytypism among phases in the aleksite series is, however, documented here for the first time. Such polytypes forming lamellae of Phase C composition are present in the same polished block as lamellae comprising associations of various other species, including tellurobismuthite, the simplest five-atom layer structure in the tetradymite group (Figure 13a). Furthermore, the presence of higher-order layers, with 11-, 13- and 17-atoms, can be seen in parts of lamellae with margins displaying replacement by galena (Figure 13b–d; see also [1]). The role played by the van der Waals gaps in attracting dislocations [28] is illustrated here by the insertion of an extra atom layer at the boundary between two five-atom layers, leading to formation of a single 11-atom layer (Figure 13b). The sequence is thus converted from regular five-atom stacks into (55.11) stacks.
Stacking sequences with “jumps” between the smallest, five-atom layer (S; p = 2) and longer layers (L; p, integer values > 2) could, in principle, form shorter, two-stack sequences such as (59); (5.11), (5.13), (5.15), (5.17), (5.19), (5.21), etc. Among these, those with N multiple of prime odd numbers (7, 9, 11,…) are polytypes of single layers with incremental p > 2, e.g., N = 14 = 2 × (7) for (5.9), N = 18 = 2 × (9) for (5.13), and so on. Those for which N is a multiple of even numbers represent polytypes of two-stack layers with consecutive p increment, e.g., N = 16 = (1 × 7) + (1 × 9) for (5.11) or N = 20 = (1 × 9) + (1 × 11) for (5.15), etc. The same single L layers could, nonetheless, also be represented by sequences with longer, n x S layers (n > 1), each associated with a single L layer. For example, N = 27 could be represented by (4 × 5) + (1 × 7) = (3 × 9); N = 36 by (5 × 5) + (1 × 11) = (4 × 9); N = 55 by (8 × 5) + (1 × 15) = (5 × 11); N = 104 by (17 × 5) + (1 × 19) = (8 × 13). However, no integer N can be fitted to a (n × 5.23) sequence representing a polytype for the (1 × 15) layer. Such sequences are most likely feasible if irrational fractional shifts are considered within the “d” interval, as discussed by [15].
Although the upper limit on the size of individual layers is unknown at present, an infinity of polytypes, either with rational or irrational shifts, would theoretically be possible for each infinitesimal composition within the aleksite series, as is the case for any continuous series of one-dimensional structures derived from the same structural archetype [15]. Their probability should, however, decrease with the increase in the number of stacks, and probably also in the complexity of those stacks. For example, insertion of 27- or 35-layers within (15 × 5) and (14 × 5) stacks, instead of regular repeats of 17- and 21-layer stacks, respectively, seems unlikely.
The stacking disorder discussed here for PbBi4Te4S3, i.e., nanoscale intergrowths of three different polytypes, suggests that polysomes with ordered sequences may be the exception rather than the rule in natural assemblages. The question of why crystallization of longer rather than shorter polytypes appears thermodynamically stable under certain conditions (e.g., the preference for periodic dominance of (557.559) and (5559) polytypes over (57)) is beyond the scope of the present work. If we assume equilibrium during crystallization, nm-scale atom ordering is implicitly controlled by sharp chemical gradients allowing successive layers with “jumps”, e.g., from five- to nine-atom layers. At the micron-scale, however, compositions are averaged out for a certain species. The nm-scale heterogeneity might also indicate the role of overprinting processes leading to higher degrees of nanoscale disorder towards the lamella margins (Figure 3).

4.2. Homology in the Aleksite Series

Expression of the aleksite series in terms of nPbS.mBi2Te2S correctly defines the chemical derivation of the series but suggests, incorrectly, that crystal structural layers of phases in the aleksite series are “PbS” and “Bi2Te2S”, which the present study shows they are not. Instead, the series is represented by odd-numbered layers derived from tetradymite (Te–Bi–S–Bi–Te), with insertion of paired Pb and S atoms in the centre of the layer, such that seven-atom layers are represented by Te–Bi–S–Pb–S–Bi–Te, the nine-atom layer by Te–Bi–S–Pb–S–Pb–S–Bi–Te and so on. Examples of higher-order layers in other chalcogenide lamellae from the same specimen of Clogau gold ore are shown in Figure 13c,d.
The recently approved mineral hitachiite, Pb5Bi2Te2S6 [6] would, for example, represent regular repeats of a 15-atom layer (Te–Bi–S–Pb–S–Pb–S–Pb–S–Pb–S–Pb–S–Bi–Te). Our work suggests, however, that hitachiite, like aleksite, or saddlebackite, may actually occur as multiple polytypes. For example: aleksite exists as (7) and (59) stacking sequences, corresponding to 21R and 42R polytypes (Table 1). Saddlebackite can be (9), (7.11), and (77.11.77.15) sequences, corresponding to 9H, 18H and 54H polytypes, with a fourth, 27H polytype (77.13) was also predictable. Although the hitachiite defined by [6] is the 15H polytype with (15) sequence, other polytypes, e.g., (13,17), (13.13.13.21), (55555.35), or (11.11.11.27) can be readily predicted. As for Phase C above, different c values have been given for both aleksite and saddlebackite in previous studies (see Table 1), a finding fully concordant with the presence of multiple polytypes in various proportions.
Further work on suitable materials from existing and new occurrences, incorporating characterization at scales of observation from atomic- to micron-scales, is thus recommended. This may also allow characterization of, for example, the Pb3Bi4Te4S5 phase, which has been observed in nature [38], as being represented by either (79) and (777.11).
The work described here proves that homology in the aleksite series can be defined in terms of layer width and the stacking arrangement of those layers. This study has also shown that polytypism appears to be a feature of this series and that coherent structures of the same composition need not only be built of layers of adjacent size (i.e., five- and seven-atom layers) but, as exemplified by the (5559) polytype, may also contain non-adjacent layers. Such an ‘overstep’ was not anticipated in previous work. Apparent disorder at the micron-scale can be readily reconciled with repeats of various length containing preferred polytypes. The phase with composition PbBi4Te4S3 can be expressed structurally in at least three different ways: as the long-range five- to seven-atom repeat; and as shorter repeats of two other polytypes. This raises the possibility that multiple, alternate polytypes may exist for all other phases in the series, except from the simple five-atom layer.
Defining homology within a series of mixed-layer compounds is important for distinguishing primary sequences relative to superimposed sequences formed during interaction with other fluids or distinct geological events. For example, assuming an ideal solid solution along the Bi-Bi2Te3 solvus, monotonic decrease of modulation with increase of Bi that underpins the continuous compositional–structural changes that define the homology in the tetradymite group [3]. The simplest stacking sequences describing the infinitesimal compositional changes are defined by layers with incremental width rather than “jumps” as those reported here for regular (5559) stacking sequences in the aleksite series. The presence of such polytypes does, however, not modify the homology relative to an assumed continuous solvus since these have the same composition as the simplest (57) sequence in which the layers have incremental width. The implication is that observation of “erratic” stacking sequences, such as those illustrated in Figure 13b–d, implies the impact of superimposed processes rather than co-crystallization. Indeed, sequences with random 11-, 13- and 17-atom layers within a matrix of regular five-atom layers (Figure 13c,d) are observed only in lamellae where there is clear replacement of sulphotellurides by galena (see also textural aspects of the sample [1]). Such adaptability of mixed-layer compounds to physicochemical changes in the local environment has also been pointed out for chalcogenide thermoelectric materials, the synthetic equivalents of tetradymite [29]. The absence of basal (0001) twin boundaries in the studied natural assemblages, for example, located at flips between (557.559) and (559.557), is, however, one of the marked differences compared to the synthetic mixed-layer chalcogenides [27]. It may be that the natural assemblages, with far slower kinetic ordering, are driven by long-range elastic interactions, unlike in the synthetic analogues.
Additional natural polytypes are likely to be found in future, including those with non-integer homologue numbers, e.g., the n = 2.5 homologue listed in Table 1. Potentially, the same methods can be applied to extended repeats of other, relatively simple members of the series positioned compositionally between known phases, such as the predicted (557) member, PbBi6Te6S4 (n = 0.667). Accurate prediction of a and c for additional members of the series will assist structural determinations.

5. Conclusions and Further Work

Modularity in the aleksite series is defined by layers of increasing number of atoms in agreement with the crystal-structural formulae given by Ciobanu et al. [3]. However, the presence of Pb and S in the species targeted as aleksite species shows that the series is derived from the tetradymite module (Bi2Te2S) rather than the equivalent five-layer tellurobismuthite (Bi2Te3) as suggested previously [1]. Other series comparable to aleksite may, however, be derived from tellurobismuthite.
Although unit cell dimensions for PbBi4Te4S3 can be both measured and predicted based on HAADF STEM imaging, single crystal X-ray analysis will now be carried out on homogeneous material to validate the crystal structure, and, if successful, complete the characterization of PbBi4Te4S3 as a new mineral species.
The present study further emphasizes the utility of HAADF STEM imaging as an optimal tool for tracking stacking sequences and characterising structures in mixed-layer compounds.

Author Contributions

N.J.C. and C.L.C. conceived this contribution and wrote the paper. A.S. assisted with collection of the HAADF STEM images. W.L. conducted the electron probe microanalysis, assisted by B.P.W., and undertook the FIB-SEM preparation of thinned foils for TEM analysis during a postdoctoral visit to the University of Adelaide. Sample material and background information was provided by C.J.S. S.J.M. provided guidance.

Funding

C.J.S. acknowledges Natural Environment Research Council grant NE/M010848/1 “Tellurium and Selenium Cycling and Supply”.

Acknowledgments

Animesh Basak (Adelaide Microscopy) kindly assisted with the preparation of the FIB-SEM-prepared foils. We gratefully acknowledge comments from three reviewers that assisted us to clarify the results and conclusions presented.

Conflicts of Interest

The authors declare no conflicts of interest.

References

  1. Cook, N.J.; Ciobanu, C.L.; Stanley, C.J.; Paar, W.; Sundblad, K. Compositional data for Bi-Pb tellurosulfides. Can. Miner. 2007, 45, 417–435. [Google Scholar] [CrossRef]
  2. Cook, N.J.; Ciobanu, C.L.; Wagner, T.; Stanley, C.J. Minerals of the system Bi-Te-Se-S related to the tetradymite archetype: Review of classification and compositional variation. Can. Miner. 2007, 45, 665–708. [Google Scholar] [CrossRef]
  3. Ciobanu, C.L.; Pring, A.; Cook, N.J.; Self, P.; Jefferson, D.; Dima, G.I.; Melnikov, V. Chemical-structural modularity in the tetradymite group: A HRTEM study. Am. Miner. 2009, 94, 517–534. [Google Scholar] [CrossRef]
  4. Lipovetskiy, A.G.; Borodaev, Y.S.; Zav’yalov, Y.N. Aleksite, PbBi2Te2S2, a new Miner1. Int. Geol. Rev. 1979, 21, 1223–1228. [Google Scholar] [CrossRef]
  5. Clarke, R.M. Saddlebackite, Pb2Bi2Te2S3, a new mineral species from the Boddington gold deposit, Western Australia. Aust. J. Miner. 1997, 3, 119–124. [Google Scholar]
  6. Kuribayashi, T.; Nagase, T.; Nozaki, T.; Ishibashi, J.; Shimada, K.; Shimizu, M.; Momma, K. Hitachiite, Pb5Bi2Te2S6, a new mineral from the Hitachi mine, Ibaraki Prefecture, Japan. Miner. Mag. 2019, 1–7. [Google Scholar] [CrossRef]
  7. Moëlo, Y.; Makovicky, E.; Mozgova, N.N.; Jambor, J.L.; Cook, N.; Pring, A.; Paar, W.; Nickel, E.H.; Graeser, S.; Karup-Møller, S.; et al. Sulfosalt systematics: A review. Report of the sulfosalt sub-committee of the IMA Commission on Ore Mineralogy. Eur. J. Miner. 2008, 20, 7–62. [Google Scholar] [CrossRef]
  8. Shelimova, L.E.; Karpinsky, O.G.; Kosyakov, V.I.; Shestakov, V.A.; Zemskov, V.S.; Kuznetsov, F.A. Homologous series of layered tetradymite-like compounds in Bi-Te and GeTe-Bi2Te3 systems. J. Struct. Chem. 2000, 41, 81–87. [Google Scholar] [CrossRef]
  9. Imamov, P.M.; Semiletov, S.A. The crystal structure of the phases in the system Bi-Se, Bi-Te, and Sb-Te. Sov. Phys. Crystallogr. 1971, 15, 845–850. [Google Scholar]
  10. Gaudin, E.; Jobic, S.; Evain, M.; Brec, R.; Rouxel, J. Charge balance in some BixSey phases through atomic structure determination and band structure calculations. Mater. Res. Bull. 1995, 30, 549–561. [Google Scholar] [CrossRef]
  11. Bos, J.W.G.; Zandbergen, H.W.; Lee, M.-H.; Ong, N.P.; Cava, R.J. Structures and thermoelectric properties of the infinitely adaptive series (Bi2)m(Bi2Te3)n. Phys. Rev. B 2007, 75, 195203. [Google Scholar] [CrossRef]
  12. Bos, J.W.G.; Faucheux, F.; Downie, R.A.; Marcinkova, A. Phase stability, structures and properties of the (Bi2)m(Bi2Te3)n natural superlattices. J. Solid State Chem. 2012, 193, 13–18. [Google Scholar] [CrossRef]
  13. Sharma, P.A.; Lima Sharma, A.L.; Medlin, D.L.; Morales, A.M.; Yang, N.; Barney, M.; He, J.; Drymiotis, F.; Turner, J.; Tritt, T.M. Low phonon thermal conductivity of layered (Bi2)m-(Bi2Te3)n thermoelectric alloys. Phys. Rev. B 2011, 83, 235209. [Google Scholar] [CrossRef]
  14. Mal, P.; Bera, G.; Turpu, R.; Srivastava, S.R.; Gangan, A.; Chakraborty, B.; Das, B.; Das, P. Vibrational spectra of Pb2Bi2Te3, PbBi2Te4, and PbBi4Te7, topological insulators: Temperature-dependent Raman and theoretical insights from DFT simulations. Phys. Chem. Chem. Phys. 2019, 21, 15030–15039. [Google Scholar] [CrossRef] [PubMed]
  15. Frangis, N.; Kuypers, S.; Manolikas, C.; Van Tendeloo, G.; Van Landuyt, J.; Amelinckx, S. Continuous series of one-dimensional structures in compounds based on M2X3 (M = Sb, Bi, X = Se, Te). J. Solid State Chem. 1990, 84, 314–334. [Google Scholar] [CrossRef]
  16. Van Landuyt, J.; De Ridder, R.; Gevers, R.; Amelinckx, S. Diffraction effects due to shear structures: A new method for determining the shear vector. Mater. Res. Bull. 1970, 5, 353–362. [Google Scholar] [CrossRef]
  17. Pauling, L. The formula, structure, and chemical bonding of tetradymite, Bi14Te13S8, and the phase Bi14Te15S6. Am. Miner. 1975, 60, 994–997. [Google Scholar]
  18. Liu, H.; Chang, L.L.Y. Lead and bismuth chalcogenide systems. Am. Miner. 1994, 79, 1159–1166. [Google Scholar]
  19. Spiridonov, E.M. Mineralogy of the metamorphosed plutonogenic gold–quartz Kochar deposit, South Urals. 1. Gold–telluride ores. Zap. Vses. Miner. Obshchest. 1995, 124, 24–39. (In Russian) [Google Scholar]
  20. Amelinckx, S.; Van Tendeloo, G.; Van Dyck, D.; Van Landuyt, J. The study of modulated structures, mixed layer polytypes and 1-D quasi-crystals by means of electron microscopy and electron diffraction. Phase Transit. 1989, 16, 3–40. [Google Scholar] [CrossRef]
  21. van Tendeloo, G.; van Dyck, D.; Kuypers, S.; Amelinckx, S. Electron diffraction in mixed layer compounds I. Theoretical Considerations. Phys. Stat. Sol. A 1987, 101, 339–354. [Google Scholar] [CrossRef]
  22. Ciobanu, C.L.; Cook, N.J.; Maunders, C.; Wade, B.P.; Ehrig, K. Focused Ion Beam and Advanced Electron Microscopy for Minerals: Insights and Outlook from Bismuth Sulphosalts. Minerals 2016, 6, 112. [Google Scholar] [CrossRef]
  23. Li, W.; Ciobanu, C.L.; Slattery, A.; Cook, N.J.; Liu, W.; Wade, B.P.; Xie, D.Q. Chessboard structures: Atom-scale imaging of homologues from the kobellite series. Am. Miner. 2019, 104, 459–462. [Google Scholar] [CrossRef]
  24. Ciobanu, C.L.; Kontonikas-Charos, A.; Slattery, A.; Cook, N.J.; Wade, B.P.; Ehrig, K. Short-range stacking disorder in mixed-layer compounds: A HAADF STEM study of bastnäsite-parisite intergrowths. Minerals 2017, 7, 227. [Google Scholar] [CrossRef]
  25. Makovicky, E. Modular aspects of sulfides and sulfosalts. In EMU Notes in Mineralogy: Modular Aspects of Minerals; Merlino, S., Ed.; European Mineralogical Union: Jena, Germany, 1997; Volume 1, pp. 237–271. [Google Scholar]
  26. Cook, N.J.; Ciobanu, C.L.; Ehrig, K.; Slattery, A.; Verdugo-Ihl, M.R.; Courtney-Davies, L.; Gao, W. Advances and Opportunities in Ore Mineralogy. Minerals 2017, 7, 233. [Google Scholar] [CrossRef]
  27. Medlin, D.L.; Ramasse, Q.M.; Spataru, C.D.; Yang, N.Y.C. Structure of the (0001) basal twin boundary in Bi2Te3. J. Appl. Phys. 2010, 108, 043517. [Google Scholar] [CrossRef]
  28. Medlin, D.L.; Yang, N.; Spataru, C.D.; Hale, L.M.; Mishin, Y. Unraveling the dislocation core structure at a van der Waals gap in bismuth telluride. Nat. Comms. 2019, 10, 1820. [Google Scholar] [CrossRef] [Green Version]
  29. Medlin, D.L.; Snyder, G.J. Atomic-scale interfacial structure in rock salt and tetradymite chalcogenide thermoelectric materials. JOM 2013, 65, 390–400. [Google Scholar] [CrossRef]
  30. Medlin, D.; Erickson, K.; Limmer, S.; Yelton, W.; Siegal, M.P. Dissociated ⅓ <0111> dislocations in Bi2Te3 and their relationship to seven-layer Bi3Te4 defects. J. Mater. Sci. 2014, 49, 3970–3979. [Google Scholar] [CrossRef]
  31. Chen, Y.L.; Analytis, J.G.; Chu, J.-H.; Liu, Z.K.; Mo, S.-K.; Qi, X.L.; Zhang, H.J.; Lu, D.H.; Dai, X.; Fang, Z.; et al. Experimental realization of a three-dimensional topological insulator, Bi2Te3. Science 2009, 325, 178–181. [Google Scholar] [CrossRef]
  32. Heremans, J.; Cava, R.; Samarth, N. Tetradymites as thermoelectrics and topological insulators. Nat. Rev. Mater. 2017, 2, 17049. [Google Scholar] [CrossRef]
  33. Silkin, I.V.; Menshchikova, T.V.; Otrokov, M.M.; Eremeev, S.V.; Koroteev, Y.M.; Vergniory, M.G.; Kuznetsov, V.M.; Chulkov, E.V. Natural sulfur-containing minerals as topological insulators with a wide band gap. JETP Lett. 2012, 96, 322–325. [Google Scholar] [CrossRef]
  34. Gehring, P.; Vaklinova, K.; Hoyer, A.; Benia, H.M.; Skakalova, V.; Argentero, G.; Eder, F.; Meyer, J.C.; Burghard, M.; Kern, K. Dimensional crossover in the quantum transport behaviour of the natural topological insulator Aleksite. Sci. Rep. 2015, 5, 11691. [Google Scholar] [CrossRef] [PubMed]
  35. Bevins, R.E.; Stanley, C.J. Aleksite, a lead bismuth sulfotelluride: A second world occurrence from the Dolgellau Gold belt, Gwynedd, Wales. J. Russell Soc. 1990, 3, 67–69. [Google Scholar]
  36. Dominy, S.; Platten, I.M. Gold mineralisation and ore controls at the Clogau mine, Dolgellau, North Wales, United Kingdom. Appl. Earth Sci. IMM Trans. 2012, B121, 12–28. [Google Scholar] [CrossRef]
  37. Ciobanu, C.L.; Cook, N.J.; Utsunomiya, S.; Pring, A.; Green, L. Focussed ion beam–transmission electron microscopy applications in ore mineralogy: Bridging micro- and nanoscale observations. Ore Geol. Rev. 2011, 42, 6–31. [Google Scholar] [CrossRef]
  38. Cepedal, A.; Martínez-Abad, I.; Fuertes-Fuente, M.; Lima, A. The presence of plumboan ingodite and a rare Bi-Pb tellurosulfide, Pb3Bi4Te4S5, in the Limarinho gold deposit, Northern Portugal. Can. Miner. 2013, 51, 643–651. [Google Scholar] [CrossRef]
Figure 1. EPMA data for unnamed PbBi4Te4S3 plotted in terms of Pb/(Pb + Bi) vs. (Te + Se)/(Te + Se + S) and with proposed stacking sequences for each mineral/phase marked (modified from [1]). Grey shaded areas are a field of microprobe analyses of unnamed PbBi4Te4S3 and aleksite on the same specimen as given in [1]. Red stars—ideal stoichiometric compositions.
Minerals 09 00628 g001
Figure 2. EPMA element maps (Pb, Bi, S and Te) of the selected lamella and location of EPMA spot analysis data and FIB cuts (box on Bi map). The BSE image on the right shows the location of foils #1 and #2 and the points (yellow circles) from which EPMA spot data in Table 2 and Figure 1 were taken. Gn—galena; PhC—“Phase C”; Tbs—tellurobismuthite; Ttd—tetradymite.
Minerals 09 00628 g002
Figure 3. Low-magnification HAADF STEM images showing foils #1 (a) and foil #2 (b). Domains within the foils with regular repeated sequences are indicated. Numbers 1–10 on (a) refer to areas that were imaged at high magnification. Numbers 1–5 on (b) refer to areas of the foil imaged at high magnification and for areas 1–4, also mapped by EDS STEM.
Minerals 09 00628 g003
Figure 4. HAADF STEM images of “Phase C” in foil #1 with specimen tilted on [ 1 ¯ 100 ] zone axis showing intergrowths between the three polytypes as marked. Colour code as in Figure 3. (a) Longest, ~350 nm, interval of polytype (57) and shorter, ~100–200 nm intervals of the polytype (557.559) interspersed with more disordered stacking sequences. (b) Margin of ordered (57) sequence showing how this dissipates into shorter intervals. Higher-order nine- and 11-atom layers are marked by yellow and red arrowheads, respectively. (c,d) Higher-resolution images showing the widths of the (57), (557.559) and (5559) polytypes. Other, irregular sequences are marked in (d).
Minerals 09 00628 g004
Figure 5. HAADF STEM images showing (57) polytype in foil #1 with specimen tilted on [ 2 1 ¯ 1 ¯ 0 ] zone axis. (a) Longer sequences of 26 and 10 repeats of the (57) polysome interrupted by the presence of an erratic five-atom layer. (b) Higher-resolution image showing five-, seven- and nine-atom layers in the sequences readily identifiable by columns of two, three, and four brighter spots, respectively, corresponding to heavier (Bi, Pb) metal atoms. Colour code as in Figure 3.
Minerals 09 00628 g005
Figure 6. HAADF STEM images showing stacking sequences in foil #2 with specimen tilted on [ 2 1 ¯ 1 ¯ 0 ] zone axis. Areas 1 and 5 in (a) and (b) as marked on Figure 3b. Colour code as in Figure 3. (a) Typical, up to 10 x, repeats of (557.559) and (5559) polytypes interspersed with disordered sequences. (b) Detail of (5559) repeats interrupted by other stacks as marked. Note, the shorter-range stacking disorder in foil #2 relative to foil #1 and the absence of (57) regular repeats.
Minerals 09 00628 g006
Figure 7. Extended STEM EDS maps (Bi, Te, Pb and S) indexed by layers over lengths of ~200 nm in area 1 (a) and area 2 (b) from foil #2. Note, positive correlations between Bi and Te, and between Pb and S. Colour code as in Figure 3.
Minerals 09 00628 g007
Figure 8. Extended STEM EDS maps (Bi, Te, Pb and S) indexed by layers over lengths of ~200 nm in area 3 (a) and area 4 (b) from foil #2. Note, positive correlations between Bi and Te, and between Pb and S. Colour code as in Figure 3. Note 10 x regular repeats of (557.559) polytype, dominant throughout foil #2.
Minerals 09 00628 g008
Figure 9. (a) High-resolution HAADF STEM image and FFT (inset) of the (57) polytype on [ 1 ¯ 100 ] zone axis. Note the tightly packed atoms on ( 11 2 ¯ 0 ) direction. (b) Stacking sequences for (557.559) and (5559) polytypes. Colour code as in Figure 3. Note that the five-, seven- and nine-atom layers are characterised by the presence of one-, two- and three-dark bands, respectively, on this zone axis.
Minerals 09 00628 g009
Figure 10. (ac) High-resolution HAADF STEM images of the (57), (5559) and (557.559) polytypes, respectively, on [ 2 1 ¯ 1 ¯ 0 ] zone axis. (df) Fast Fourier Transform (FFT) patterns of each of the three polytypes showing d* and qF* intervals with measurements listed in Table 4. (g) Details of d*~2 A intervals showing the three polytypes are N superstructures of a d*subcell. Explanations to the right side. Whereas the number of equal divisions defined by the satellite reflections (yellow spots) and their intensity variation across d* are not well-defined, the number of divisions (i) within the middle part of d* (between the brightest two reflections; red spots) corresponding to the modulation vector qF* are visible on the FFT patterns. The distances between two satellite reflections is dN (example d12) and represent the c parameter for phases with hexagonal symmetry.
Minerals 09 00628 g010
Figure 11. (a,b) Details of stacking sequence from map 5 (Figure 5b) containing the five-, seven- and nine-atom units as marked. (c,d) Profiles across the stacking sequences in (a) and (b) as marked by rectangles on (a) showing the layers in terms of HAADF signal intensity (black, top) and S, Pb, Te, Bi signals (coloured, bottom). Variation in HAADF signal depicts the sequence by the heavier atoms, i.e., double, triple, and quadruple peaks for the five-, seven-, and nine-atom units. A five-atom unit is highlighted on (c), and a nine-atom unit on (d), confirming the layer sequences Te–Bi–S–Bi–Te and Te–Bi–S–Pb–S–Pb–S–Bi–Te, respectively.
Minerals 09 00628 g011
Figure 12. Atomic-scale resolution image of (57) layer (a) and (5559) layer (b) on [ 10 1 ¯ 0 ] zone axis, showing identity and sequence of constituent atoms (overlays) in agreement with EDS profiles in Figure 11. Grey bars represent van der Waals gaps separating the layer units.
Minerals 09 00628 g012
Figure 13. Atomic-scale HAADF STEM images showing other layer sequences of relevance to this contribution within other lamellae from the Clogau sample. (a) Ordered five-atom stack representing tellurobismuthite. (b) Package of (5,11) layers (top) abutting a domain comprising regular five-atom layers. Note, defects (arrowed) occurring in the van der Waals gaps where insertion of an extra atom layer allows transformation of two five-atom layers into a single 11-atom layer. Note also, the darkening of the middle part of the 11-layer. (c,d) Random 11-, 13- and 17-layer atom layers within a matrix of five-atom layer stacks.
Minerals 09 00628 g013
Table 1. Named minerals, unnamed natural, synthetic and predicted phases of the aleksite series.
PhaseFormulana (Å)c (Å)ZMxX3Stacking SequenceNγFFNRef(s)
Unit Archetype
TetradymiteBi2Te2S0#4.2381#29.589#3M2.X3(5)50.200015R[17]
Named minerals
AleksitePb2Bi4Te4S42#4.23
#4.238
#4.24
*#39.83
#79.76
#79.64
#3
#6
#6
M2.25X3(7)
(59)
7
14
0.142921R
42R
[18]
[4]
[1]
SaddlebackitePb4Bi4Te4S64#4.23
#4.23
#4.247
*16.71
#33.4
#97.97
#1
#2
#6
M2.4X3(9); 9
(7.11); 18
(77.11.77.15)
9
18
54
0.11119H
18H
54H
[18]
[5]
[19]
HitachiitePb10Bi4Te4S1210#4.22#27.02#1M2.63X3(15)150.066715H[6]
Unnamed and predicted phases
Unnamed
(“Phase C”)
PbBi4Te4S314.24*#23.122M2.14X3(57) 120.166712H[18]
4.25#69.716 (557.559) 36 36H[1]
SyntheticPb2.5Bi4Te4S4.52.54.23**602M2.29X3(7779)300.133330H[18]
PredictedPb3Bi4Te4S53 ~963M2.33X3(79)160.125048R[1]
UnnamedPb5Bi4Te4S75 ~1203M2.45X3(9.11)200.100060R[1]
UnnamedPb6Bi4Te4S86 ~663M2.5X3(11)110.090933R[1]
UnnamedPb7Bi4Te4S97 ~481M2.54X3(11.13)240.083324H[1]
PredictedPb8Bi4Te4S108 ~783M2.57X3(13)130.076939R[1]
n—homologue number; MxX3—metal:chalcogen ratio expressed to three chalcogen atoms, where M = Bi, Pb, and X = Te, S, Se; Stacking sequence—as defined in this contribution; N—total number of atoms in stacking sequence; γF—(S + L1 + L2 + L3 + L4 + L5)/N; S = five-layer; L1-5 = seven-, nine-, 11-, 13-, 15-layer. FN—polytype identification, using notation of [15]; # data published by the cited authors, other data is the interpretation (or estimation—in italics) of the present authors; * synthetic material. All rhombohedral (R) phases are R 3 ¯ m; all hexagonal (H) phases are P 3 ¯ m1. ** Data given in [18] for Pb3Bi4Te4S5 does not fit to our calculated structure for that homologue (n = 3) but rather to a distinct, compositionally close phase, Pb2.5Bi4Te4S4.5 (n = 2.5).
Table 2. EPMA data for unnamed PbBi4Te4S3.
Wt. %Formula (apfu, 12 Atoms)
PbBiTeSSeTotalPbBiTeSSe
Mean (n = 57)12.5649.4530.626.420.1299.180.983.843.893.260.02
S.D.0.591.120.270.100.02 0.050.080.040.040.00
Minimum11.5647.4029.836.200.0798.010.913.693.803.170.01
Maximum14.4852.1131.096.640.20100.811.144.023.963.350.04
Table 3. Polytype nomenclature, stacking sequences and structural formulae with predicted unit cell dimensions for PbBi4Te4S3 polytypes and related structures.
1 FNSequenceStackM:X Ratio2 Formula
M(2 + ε)X3
p3 N4 γF5c
(Å)
12H57(1 × 5).(1 × 7)M5X7M2.14X32120.166724
24H5559(3 × 5).(1 × 9)M10X14M2.14X32240.166748
36H557.559(4 × 5).(1 × 7).(1 × 9)M15X21M2.14X32360.166772
48H5557.555.11(6 × 5).(1 × 7).(1 × 11)M20X28M2.14X32480.166796
120R559.55.11(4 × 5).(1 × 9).(1 × 11)M17X23M2.22X32400.150080
78R555.11(3 × 5).(1 × 11)M11X15M2.2X32260.153852
57R559(2 × 5).(1 × 9)M8X11M2.18X32190.157938
87R55559(4 × 5).(1 × 9)M12X17M2.12X32290.172458
51R557(2 × 5).(1 × 7)M7X10M2.1X32170.176534
66R5557(3 × 5).(1 × 7)M9X13M2.08X32220.181844
1 Polytype using notation of Frangis et al. [15]; H = hexagonal; R = rhombohedral; 2 Formula at X = 3; M = Bi, Pb; X = Te, S, Se; 3N = total number of layers = S(2p + 1) + L1(2p + 3) + L2(2p + 5) + L3(2p + 7); 4γF = (S + L1 + L2 + L3)/N; S = five-layer; L1–3 = seven-, nine- and 11-layer. 5c = dxN (d=2Å) = dx(S + L1 + L2 + L3)/γF. Refer to [3] for further explanation.
Table 4. Measured values of d, qF and i values for each of the three PbBi4Te4S3 polytypes, with calculated N, γF and c parameters.
Polytyped (Å) qF (Å) i 1 dN (Å) 2 N 3 γF4c (Å)
571.9011.4222.7120.167322.7
* 571.9311.6223.2120.166423.2
* 571.9811.9223.8120.166423.8
T 57 2.0012.0224.0120.166724.0
55591.9011.2444.8240.169644.8
55591.9711.8447.2240.166947.2
* 55591.9811.9447.6240.166447.6
T 5559 2.0012.0448.0240.166748.0
557.5591.9011.4668.4360.166768.4
557.5591.9411.6669.6360.167269.6
557.5591.9611.8670.8360.166170.8
* 557.5591.9811.9671.4360.166471.4
T 557.559 2.0012.0672.0360.166772.0
* best fit values; T calculated with d = 2 Å; (see Table 3); 1 dN = qF/i; 2 N = (i x qF)/d; 3 γF = d/qF; 4 c = d x N = dN.

