Case Report

Multi-Stage Flotation for the Removal of Ash from Fine Graphite Using Mechanical and Centrifugal Forces

1
School of Chemical Engineering and Technology, China University of Mining and Technology, Xuzhou 221116, China
2
Key Laboratory of Coal Processing and Efficient Utilization (Ministry of Education), China University of Mining and Technology, Xuzhou 221116, China
3
Bakuang Coal Preparation Plant, Pingdingshan Shenma Group Coal Industry Co., Ltd., Pingdingshan 467000, China
*
Authors to whom correspondence should be addressed.
Minerals 2018, 8(1), 15; https://doi.org/10.3390/min8010015
Submission received: 5 December 2017 / Revised: 7 January 2018 / Accepted: 10 January 2018 / Published: 11 January 2018
(This article belongs to the Special Issue Flotation Chemistry)

Abstract

:
Graphite ore collected from Hunan province, south China was characterized by chemical analysis, X-ray diffraction, and optical microscopy. Rougher and multi-stage flotation tests using a mechanical flotation cell and a flotation column containing an additional centrifugal force field were carried out to promote its grade and economic value. In rougher flotation, both the mechanical flotation cell and flotation column reduced the ash content of the graphite ore from 15.43% to 10.8%, while the yield of the flotation column (91.41%) was much higher than that of the mechanical flotation cell (50%). In the presence of hydrophobic graphite, the seriously entrained gangue restricted further improvement in the quality and economic value of the graphite ore. Therefore, multi-stage flotation circuits were employed to diminish this entrainment. Multi-stage flotation circuits using the two flotation devices further decreased the ash content of the graphite ore to ~8%, while the yield when using the flotation column was much higher than that obtained from the mechanical flotation cell employed. On the other hand, the ash removal efficiency of the flotation column was 3.82-fold higher than that observed for the mechanical flotation cell. The Cleaner 3 flotation circuit using the flotation column decreased the ash content in graphite from 15.43% to 7.97% with a yield of 77.53%.

Graphical Abstract

1. Introduction

Graphite, the most common polymorph of naturally occurring crystalline carbon, is employed in many different applications such as batteries, refractories, electrical products, and pencils [1]. The grade of some European deposits is ~55%, while that of some microcrystalline graphite deposits in China is 50%–70%. These microcrystalline graphite ores should be concentrated to fixed carbon contents >80% to expand their application and economic value [2].
Chemical methods (alkali roasting, hydrofluoric acid treatment, and chlorination roasting) are more effective in purifying graphite ores than physical metFhods (froth flotation, gravity separation, film flotation, and two-liquid separation). However, they easily result in severe environmental problems. On the other hand, compared to chemical purification and other physical methods, froth flotation is a relatively effective and environment-friendly method [3].
The beneficiation mechanism of minerals by froth flotation is based on the difference in their hydrophobicity. The separation efficiency between hydrophobic and hydrophilic particles depends on the degree of entrainment [4]. Graphite exhibits strong hydrophobicity that leads to the serious entrainment of hydrophilic particles inside the formed hydrophobic aggregates, thereby resulting in poor selectivity in graphite ore flotation. The occurrence of entrainment is closely related to the froth structure. Hydrophobic particles have a strong effect on the structure of the froth, which in turn influences the drainage of hydrophilic particles in the froth [5]. During the flotation tests, the froth which was stabilized by fine hydrophobic graphite particles became very tenacious, the froth could last for many days [2]. An excessively stable froth which has fewer coalescence and bursting events increases the amount of material that is recovered by entrainment [6]. Due to non-selective entrainment, mechanical flotation displays poor separation efficiency that results in the loss of large quantities of valuable minerals to tailings as well as low grade concentrates in the mechanical flotation cells [7,8]. Column flotation with a thick froth layer is an alternative approach to minimizing the entrainment of gangue materials [9]. Column flotation affords superior performance over mechanical flotation cells by reducing the number of stages of operation and improving grade and recovery. Flotation columns can upgrade fine concentrates in a single step, while mechanical flotation cells require several sequential steps (Table 1).
Centrifugal force, as in air-sparged hydrocyclones, has been widely used for the separation of fine particles by Miller’s group [10,11,12,13,14]. Air-sparged hydrocyclone (ASH) minimizes the entrainment of gangue materials via an increase in the fine particle flotation rate and froth drainage in the presence of a centrifugal force [12,14,15]. A cyclonic microbubble flotation column, featuring rough beneficiation, primary separation, and scavenging processes in a single unit, is characterized by a specially designed external bubble generator and the integration of a centrifugal field [16]. The bubble generator used in the flotation column, taking advantage of the Venturi principle, is the most widely used hydrodynamic cavitation device [17]. The generation of nanobubbles by hydrodynamic cavitation increases the probability of collision and attachment and decreases the probability of detachment compared with conventional-size bubbles [18]. In other words, cyclonic microbubble flotation column can extend the lower particle size limits for effective flotation due to the combination of nanobubbles and centrifugal force separation [11,19]. In a rougher flotation process, this flotation column usually presents better separation efficiency in the beneficiation of coal fines [20,21], siliceous phosphate ores [22], magnetite ores [23], and oil-in-water emulsions [24] compared to mechanical flotation cells or dissolved air flotation column.
However, it is observed that the literature regarding the cyclonic microbubble flotation column (combining centrifugal force and hydrodynamic cavitation) lacks emphasis on the graphite flotation performance. The objective of this study was to upgrade graphite ore by rougher and multi-stage flotation circuits using a mechanical flotation cell and flotation column. The flotation performances of the different flotation circuits were compared to determine a proper flotation flowsheet for the graphite ore. The different steps used in this study to upgrade the quality of the graphite ore are (1) characterization of the graphite ore; (2) mechanical flotation cell and flotation column tests; and (3) comparisons of the flotation separation efficiency.

2. Materials and Methods

2.1. Materials

The graphite ore was received from Hunan province, south China. For chemical analysis and X-ray diffraction (XRD) measurements, the sample was ground and milled to pass through a 320-mesh screen. Polished thin-sections and block samples were prepared for optical microscopy. Following analysis, the sample was crushed and ground to a size fraction with 90% of the material being <74 μm. The ground sample was then used in the flotation experiments.
Kerosene and sec-octyl alcohol (analytical reagent, Sinopharm Group Co., Ltd., Hong Kong, China) were used as collector and frother reagents for each flotation test, respectively. Kerosene has been widely used in graphite flotation studies [2,3,26,27,29]. Previous literature has also revealed that the combination of kerosene and sec-octyl alcohol is applicable to graphite flotation [29].

2.2. Size and Chemical Analyses

The size distribution of the crushed and ground graphite ore was determined by a Microtrac S3500 device using a laser diffraction method (Microtrac Inc., Montgomeryville, PA, USA). The calculated d50, d80, and d90 values for the graphite sample were determined as 25.52 µm, 43.65 µm, and 55.57 µm, respectively. Water, volatile, ash, and carbon content analyses were performed according to a previously described method for chemical analysis of graphite (air-dried basis; State Standard of the People’s Republic of China: GB/T 3521-2008).

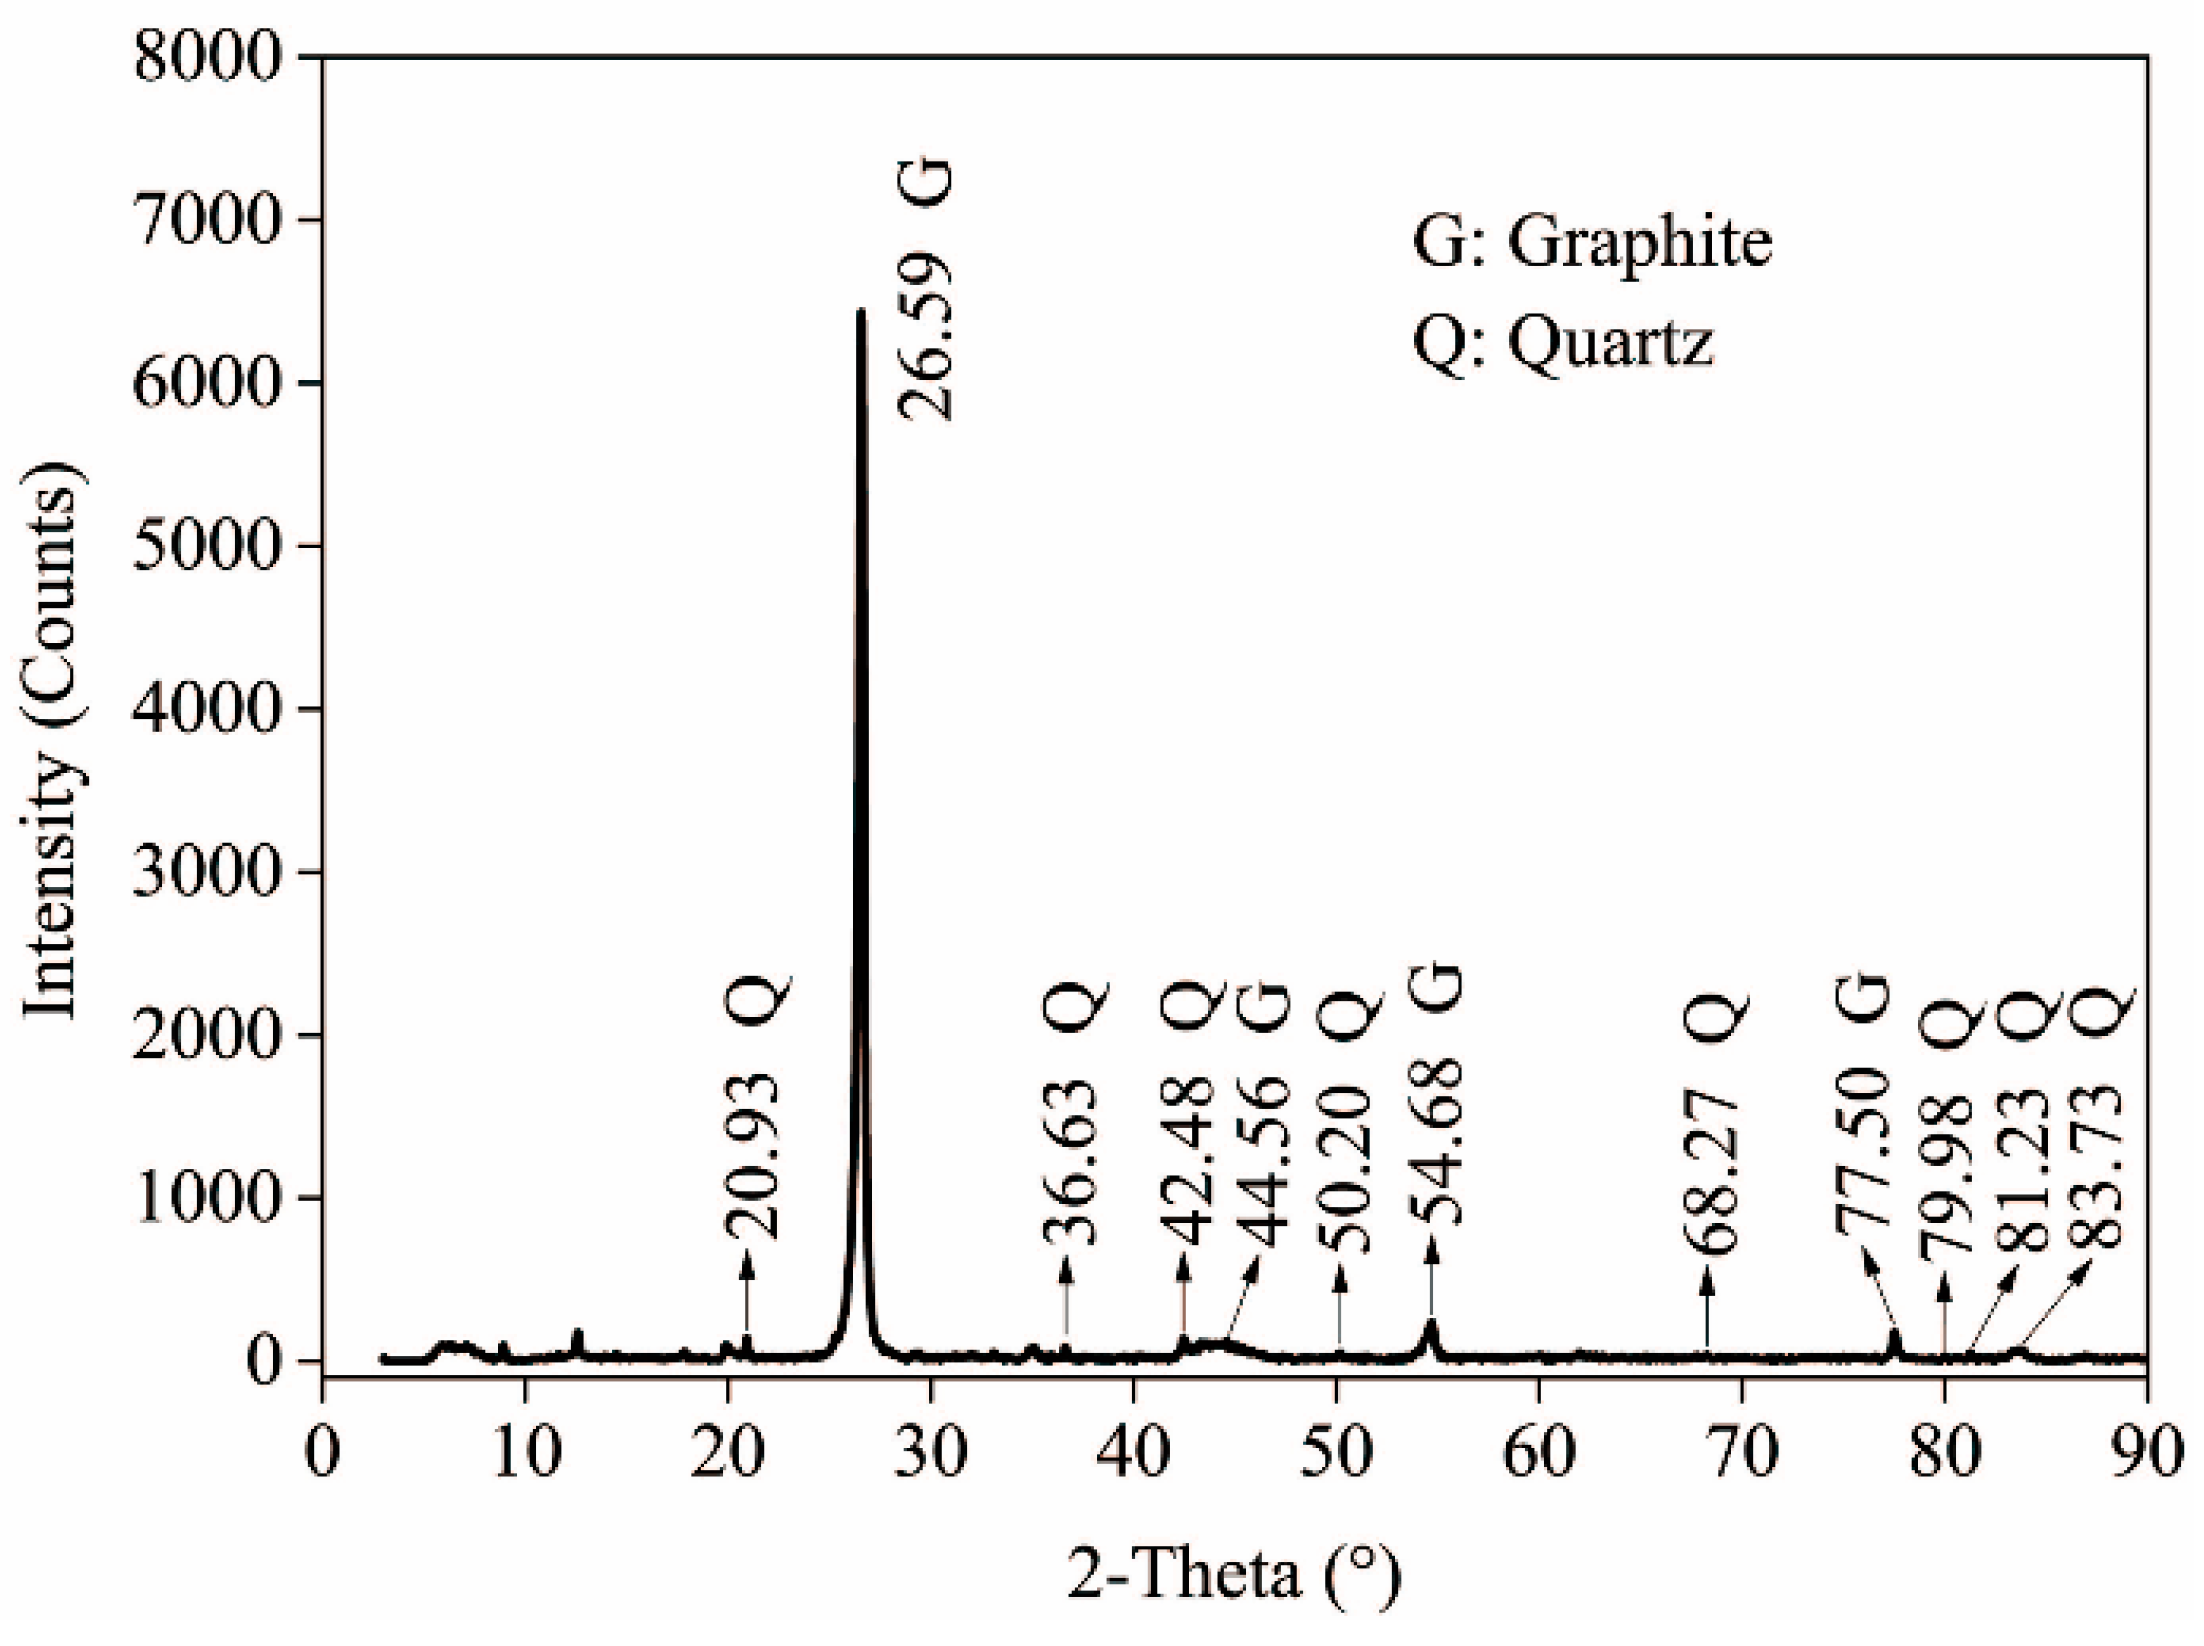
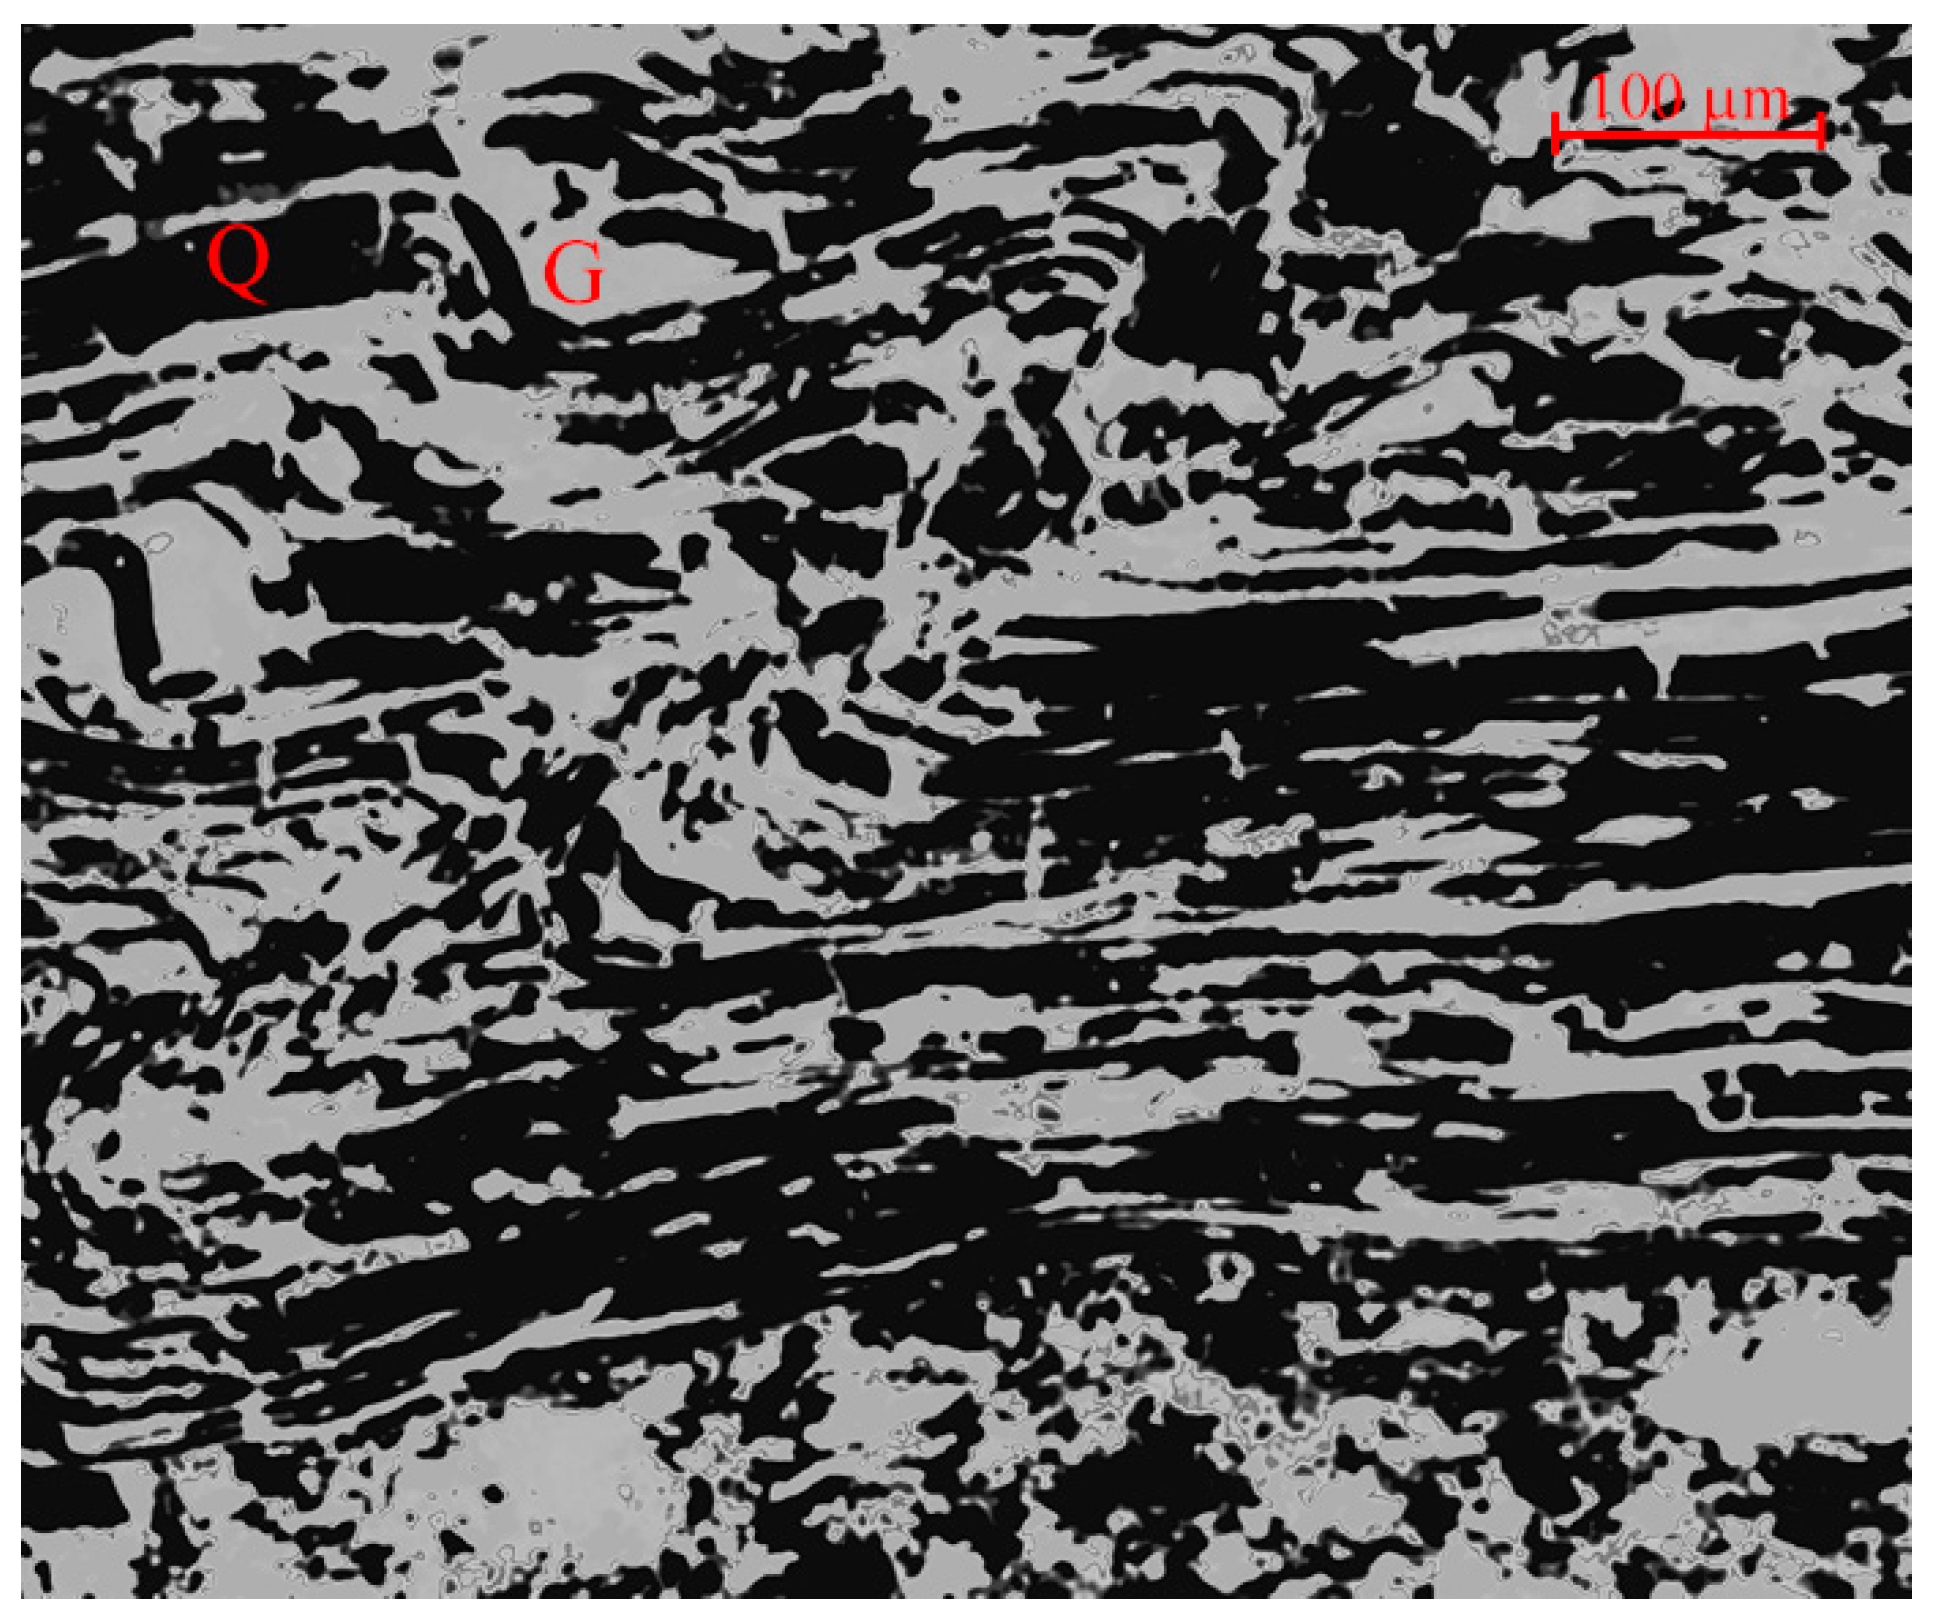
2.3. Mineralogy of the Ore

The mineralogical phase was investigated by XRD analysis (Bruker D8 Advance, Karlsruhe, Germany). The detailed operating process of the XRD measurements has been described in the literature [30]. The petrographic characterization of the graphite ore was determined by Leica DM2700P optical microscopy (Leica Microsystems, Wetzlar, Germany).

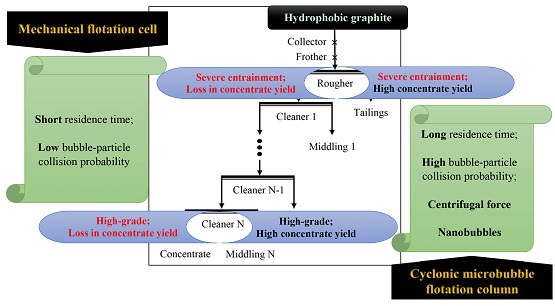
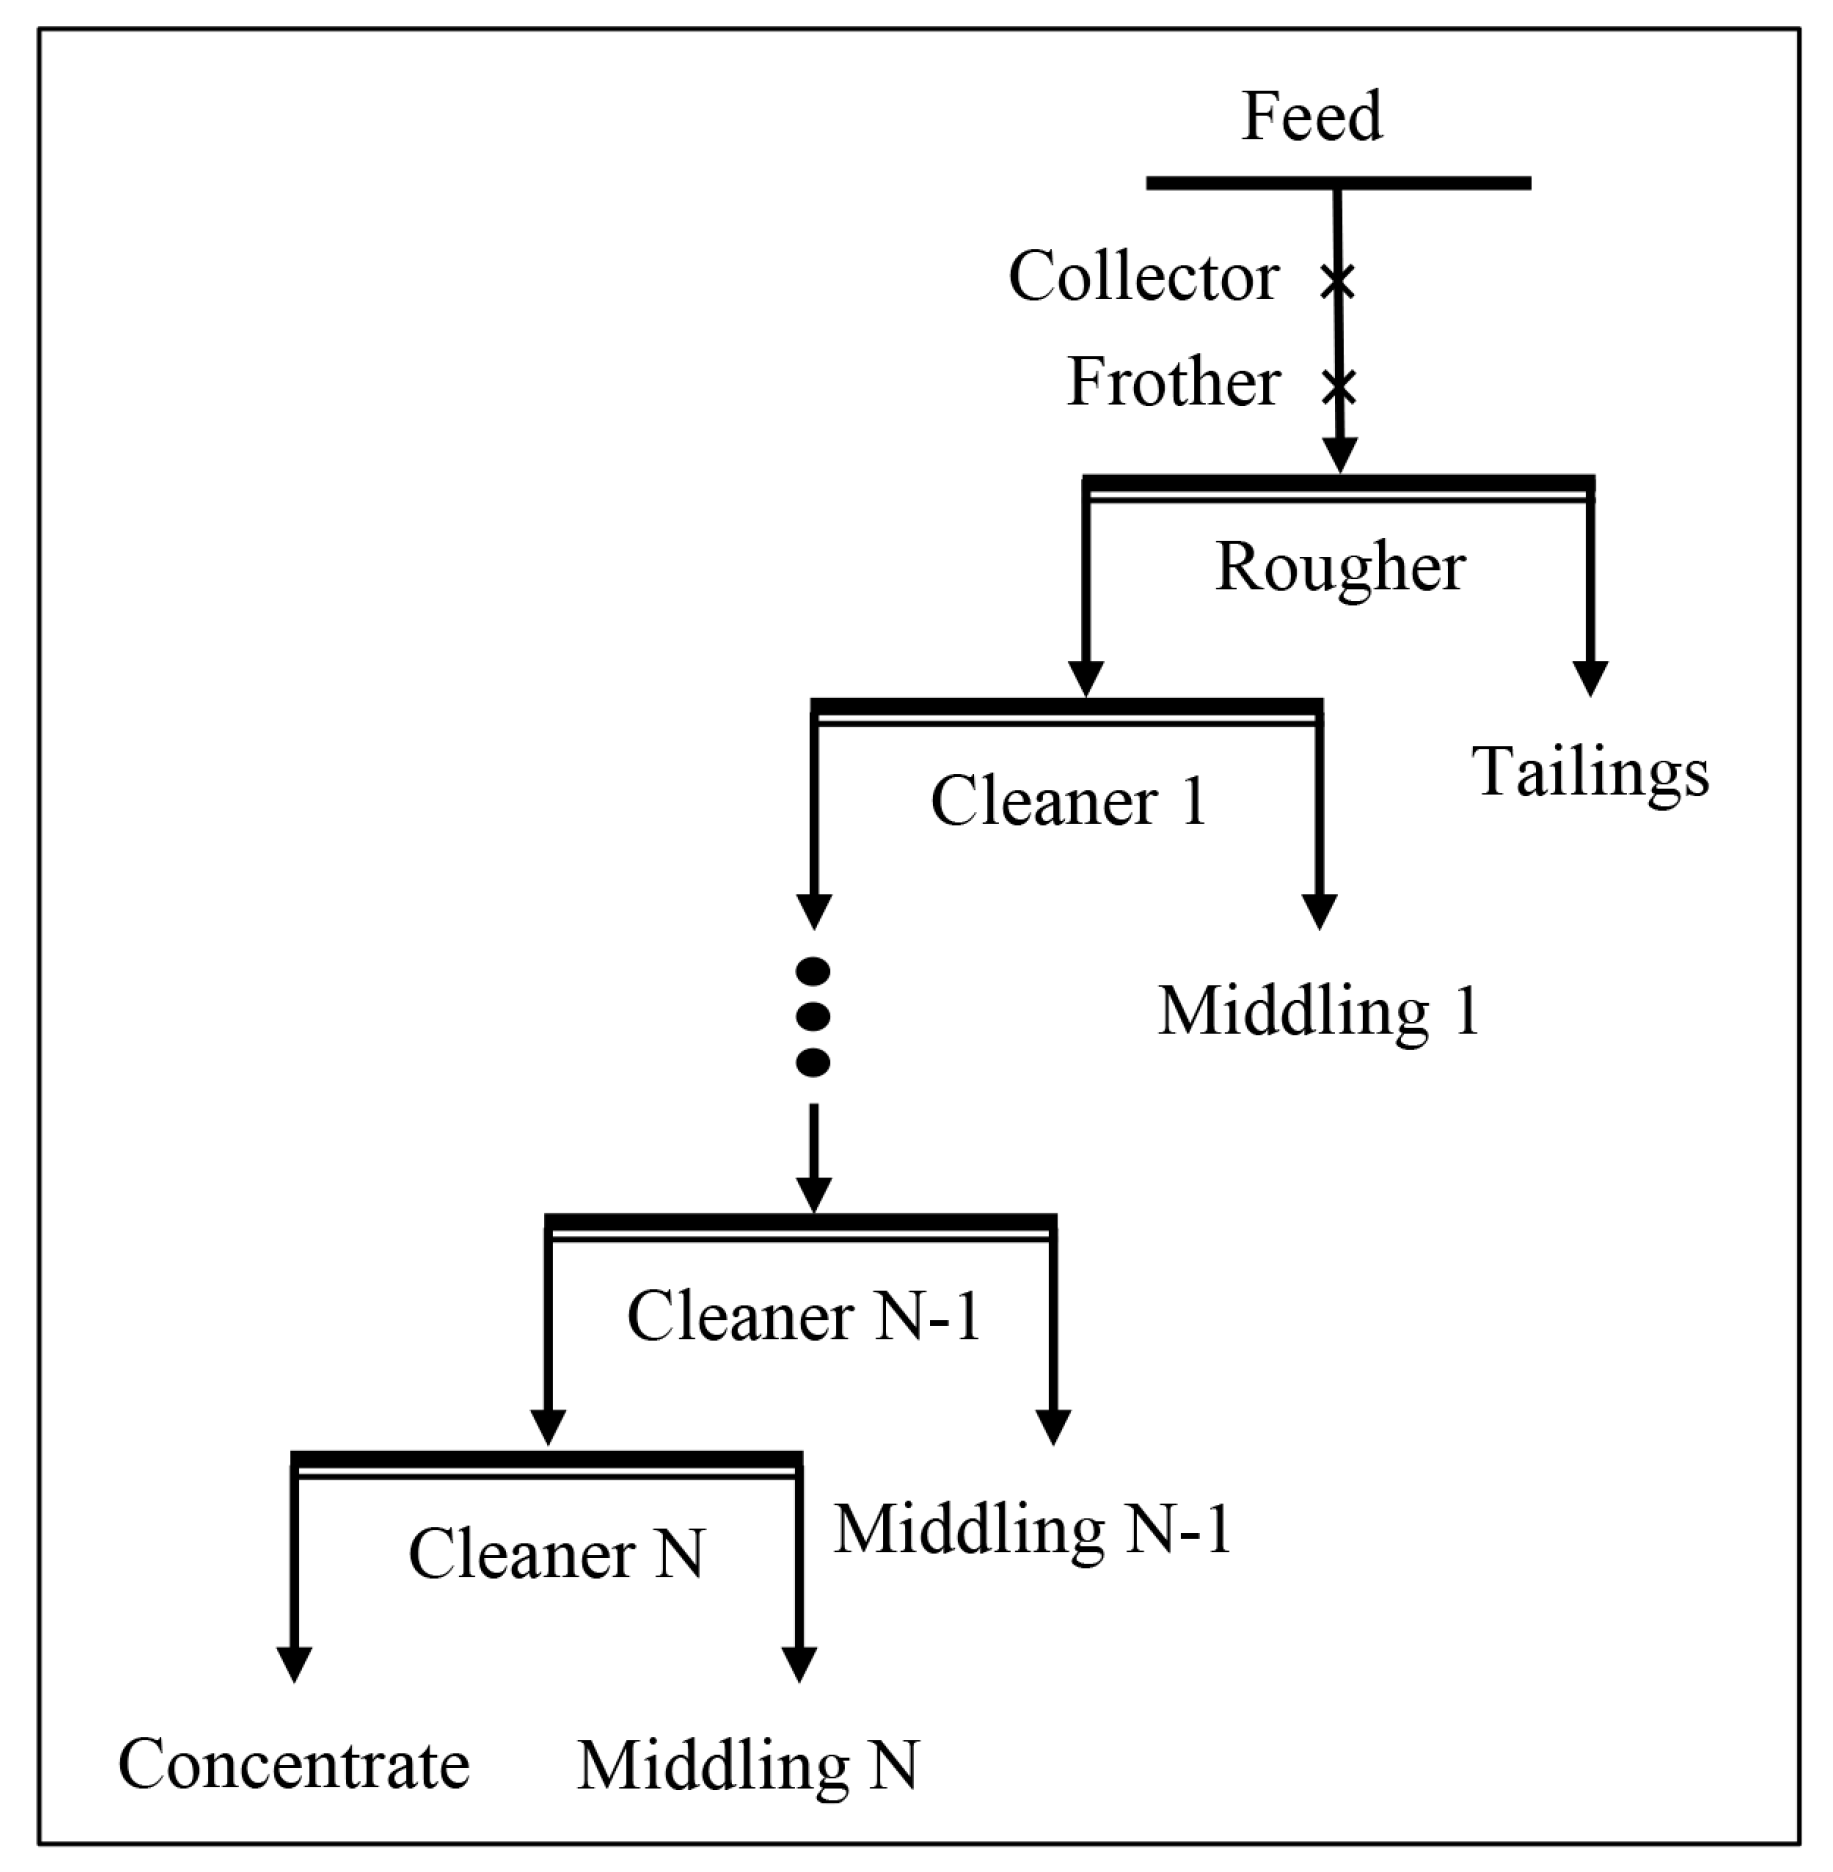
2.4. Mechanical Flotation Tests

A standard laboratory RK/FD-II sub-aeration flotation cell (volume = 1.5 L) was used in the flotation tests. The air flow rate and impeller and impeller speed were maintained at 4.17 L/min and 1900 rpm, respectively. The superficial gas rate (Jg) was 0.70 cm/s, which defined as the volumetric air flow rate per unit cross-section. In each flotation test, tap water was added to maintain a constant pulp level and a froth layer of 1 cm. Kinetic study was carried out to select suitable flotation time. Following a flotation kinetic study where a maximum plateau was reached at 3-min flotation, the pulp was floated for 3 min. A detailed description of the working process of the mechanical flotation cell is reported in the literature [31]. User-Defined Design (Expert-design 8.0, Stat-Ease Inc., Minneapolis, MN, USA) software was employed. Experimental conditions, including the collector dosage (Factor A), frother dosage (Factor B), and pulp density (Factor C) of the mechanical flotation cell are presented in Table 2.
After the flotation tests were performed, the rougher flotation froth product was re-fed into the mechanical flotation device to undergo a re-cleaning process. The circuit configuration of this process is displayed in Figure 1. There were no additional flotation reagents from the Cleaner 1 flotation to the Cleaner N flotation. The froth product collected from the rougher flotation was diluted to different pulp concentrations (150 g/L, 100 g/L, 50 g/L, and 25 g/L) to create the feed slurry of the Cleaner 1 flotation. Thereafter, the feed slurry volume of the next stage flotation was constant at 1.5 L and comprised the froth product of the preceding stage flotation and additional water.

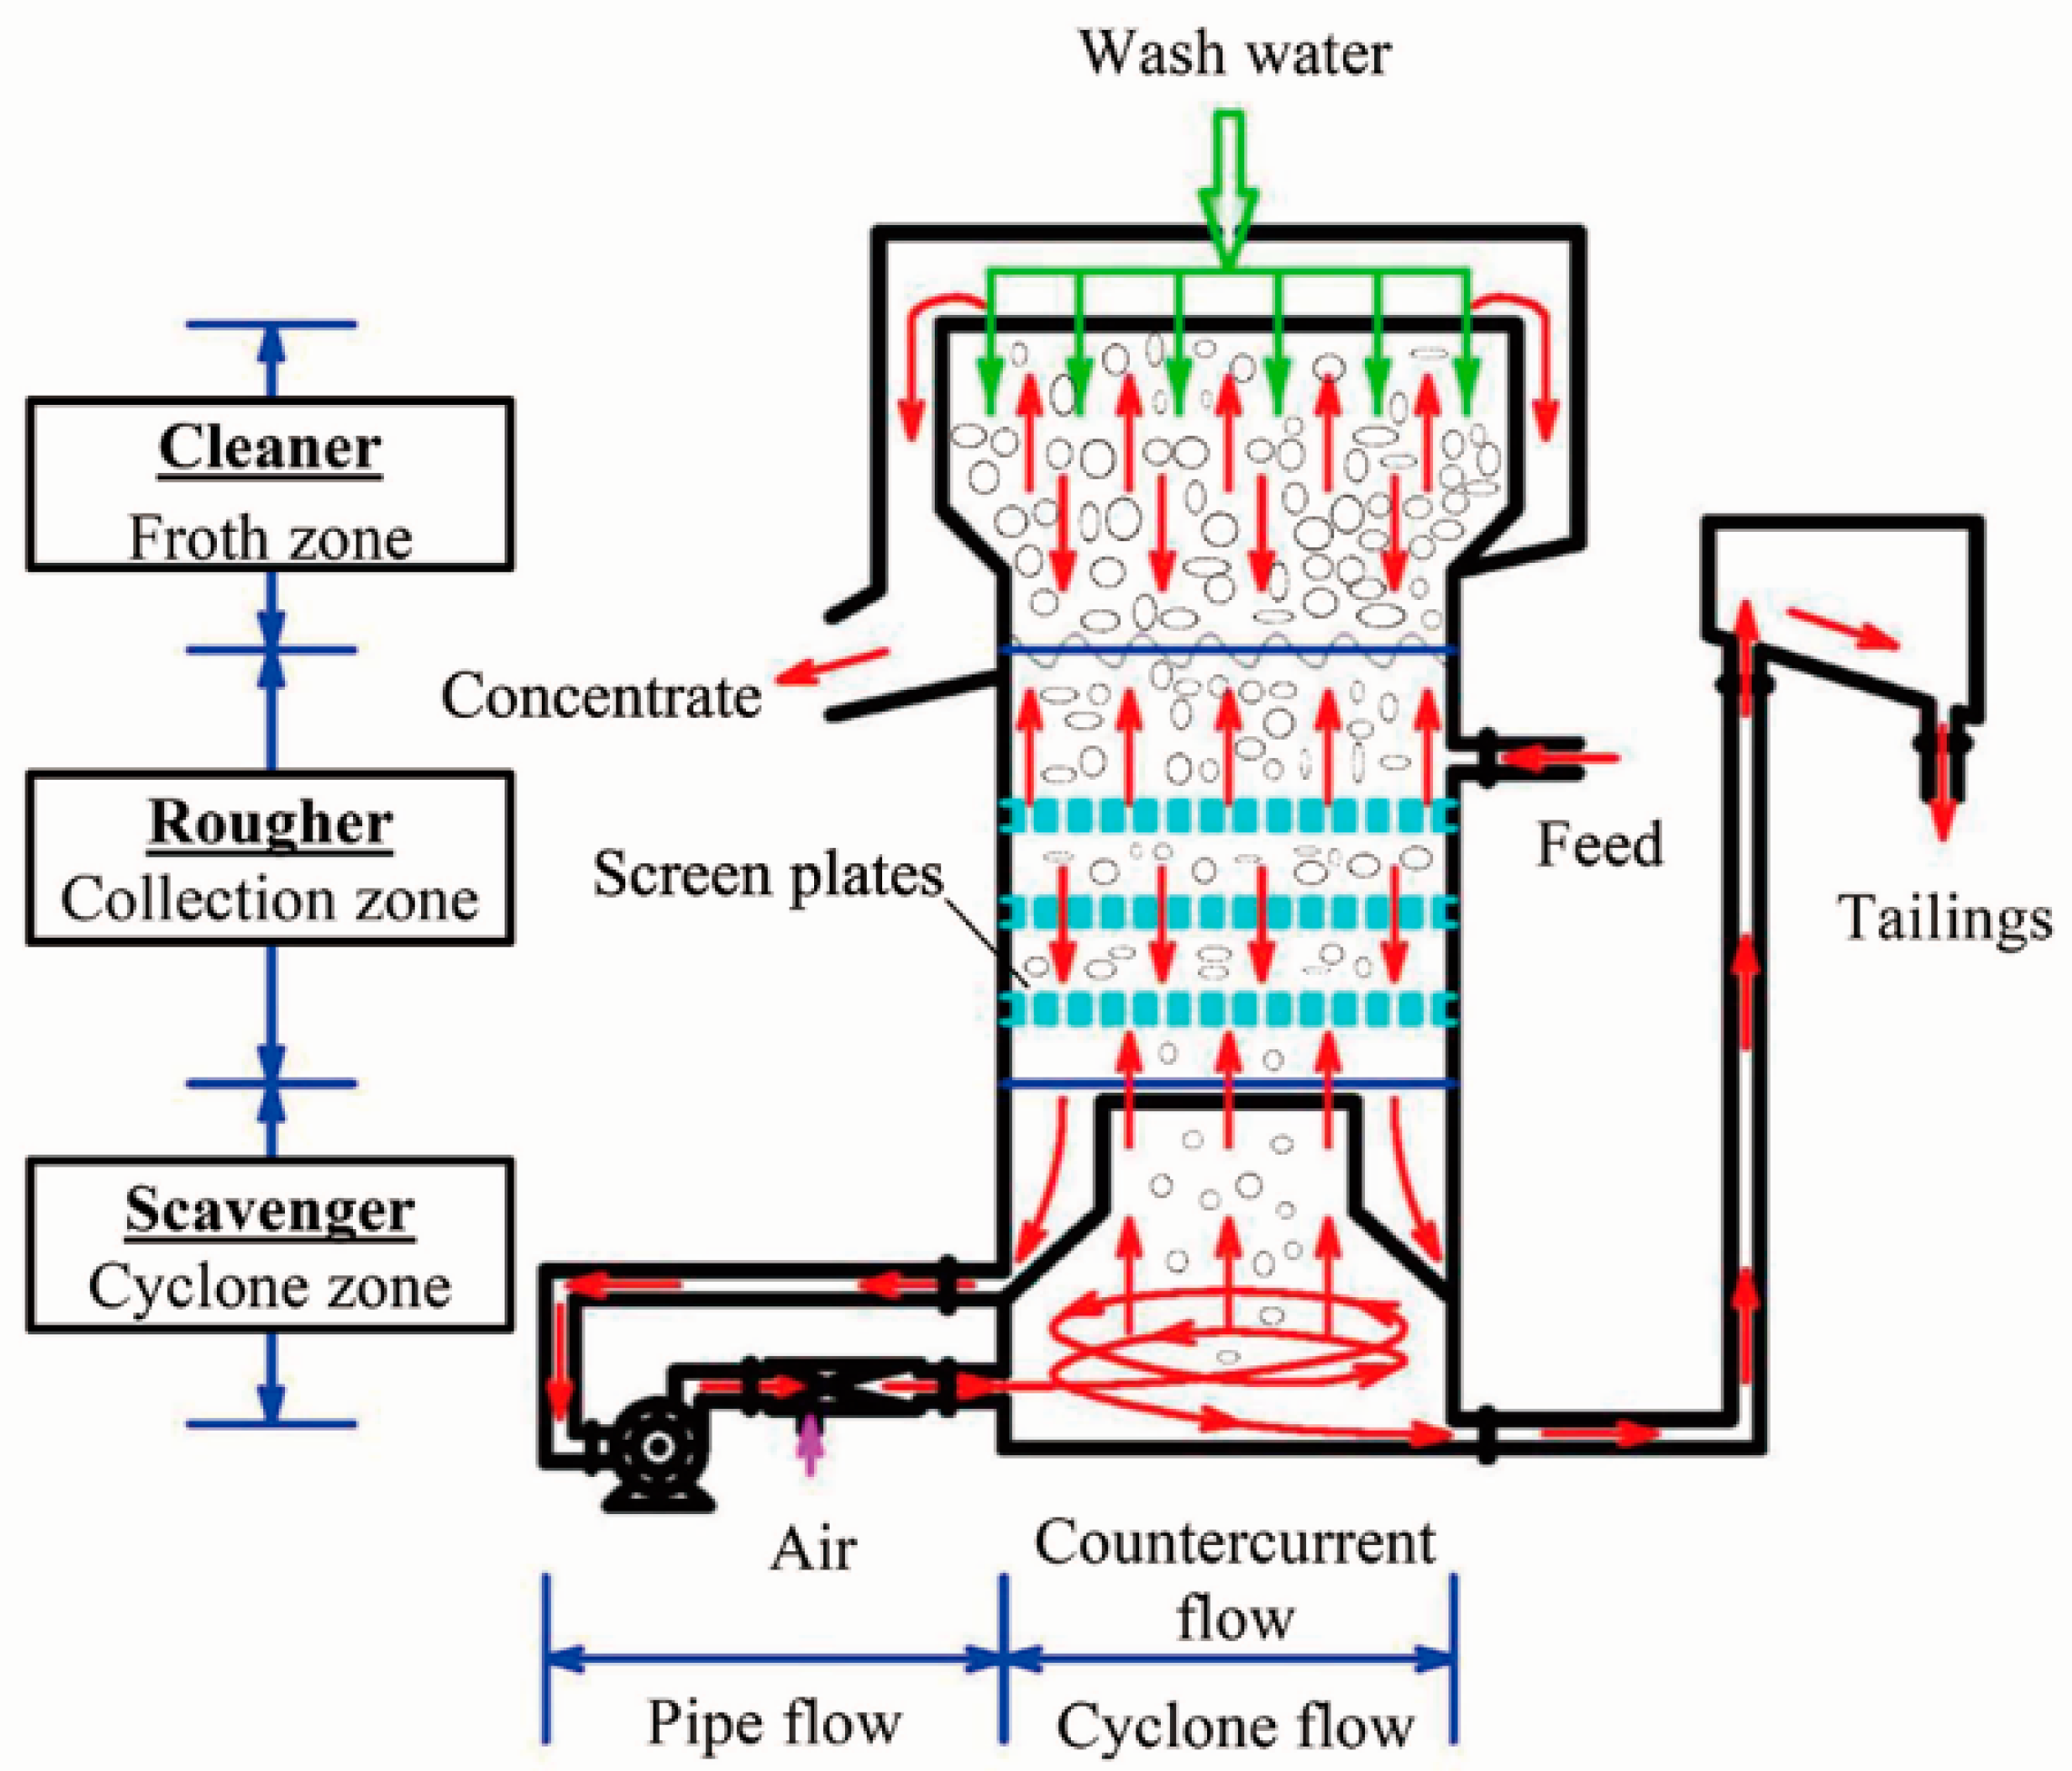
2.5. Column Flotation Tests

Column flotation tests were carried out using a laboratory-scale flotation column (diameter = 100 mm, height = 1800 mm). The schematic diagram of the flotation column is depicted in Figure 2.
The circulating middling pulp was pumped into the bubble generator and discharge tangentially at high speed. This creates a centrifugal force field close to the bottom of the column. Air was sucked into the bubble generator by the created negative air pressure and then torn apart into fine bubbles (average diameter = 0.2 mm) by the high-speed flow of the slurry. The relationship between the superficial gas rate and circulation pressure is depicted in Appendix B (Table A2). The procedure of the flotation column test is described in previous literature [16]. The flotation column was operated continuously to reach a steady state, confirmed by the constant flow of tailings and froth. The concentrate and tailings were collected simultaneously after a fixed time (2 min) in each test. Multi-stage flotation tests using the flotation column were subsequently carried out according to the flotation circuit configuration in Figure 1. The rougher flotation froth product was diluted to pulp densities of 60 g/L and 30 g/L and re-treated as the feed slurry of the Cleaner 1 flotation. The feed slurry volume of the subsequent stage flotation remained constant at 20 L and comprised the froth product of the preceding stage flotation and additional water.

3. Results and Discussion

3.1. Characterization

The results from the chemical analysis of the graphite ore sample are tabulated in Table 3. The fixed carbon and volatile matter (air-dried basis) are 80.90% and 15.43%, respectively. The X-ray diffractogram is presented in Figure 3. The sample predominantly consists of graphite with a minor quartz fraction. A graphite ore content of 83.49% was calculated from the chemical analysis and XRD pattern results. Petrographic characterization (Figure 4) using optical microscopy indicated that quartz grains in the sample formed both fine and thick flakes (<60 μm). Moreover, a minute quantity of graphite particles in microns/sub-microns (<10 μm) were embedded in the quartz grains. Therefore, most of the quartz particles was sufficiently liberated from graphite at a grind size of d90 of 56 µm.

3.2. Mechanical Flotation Cell Tests

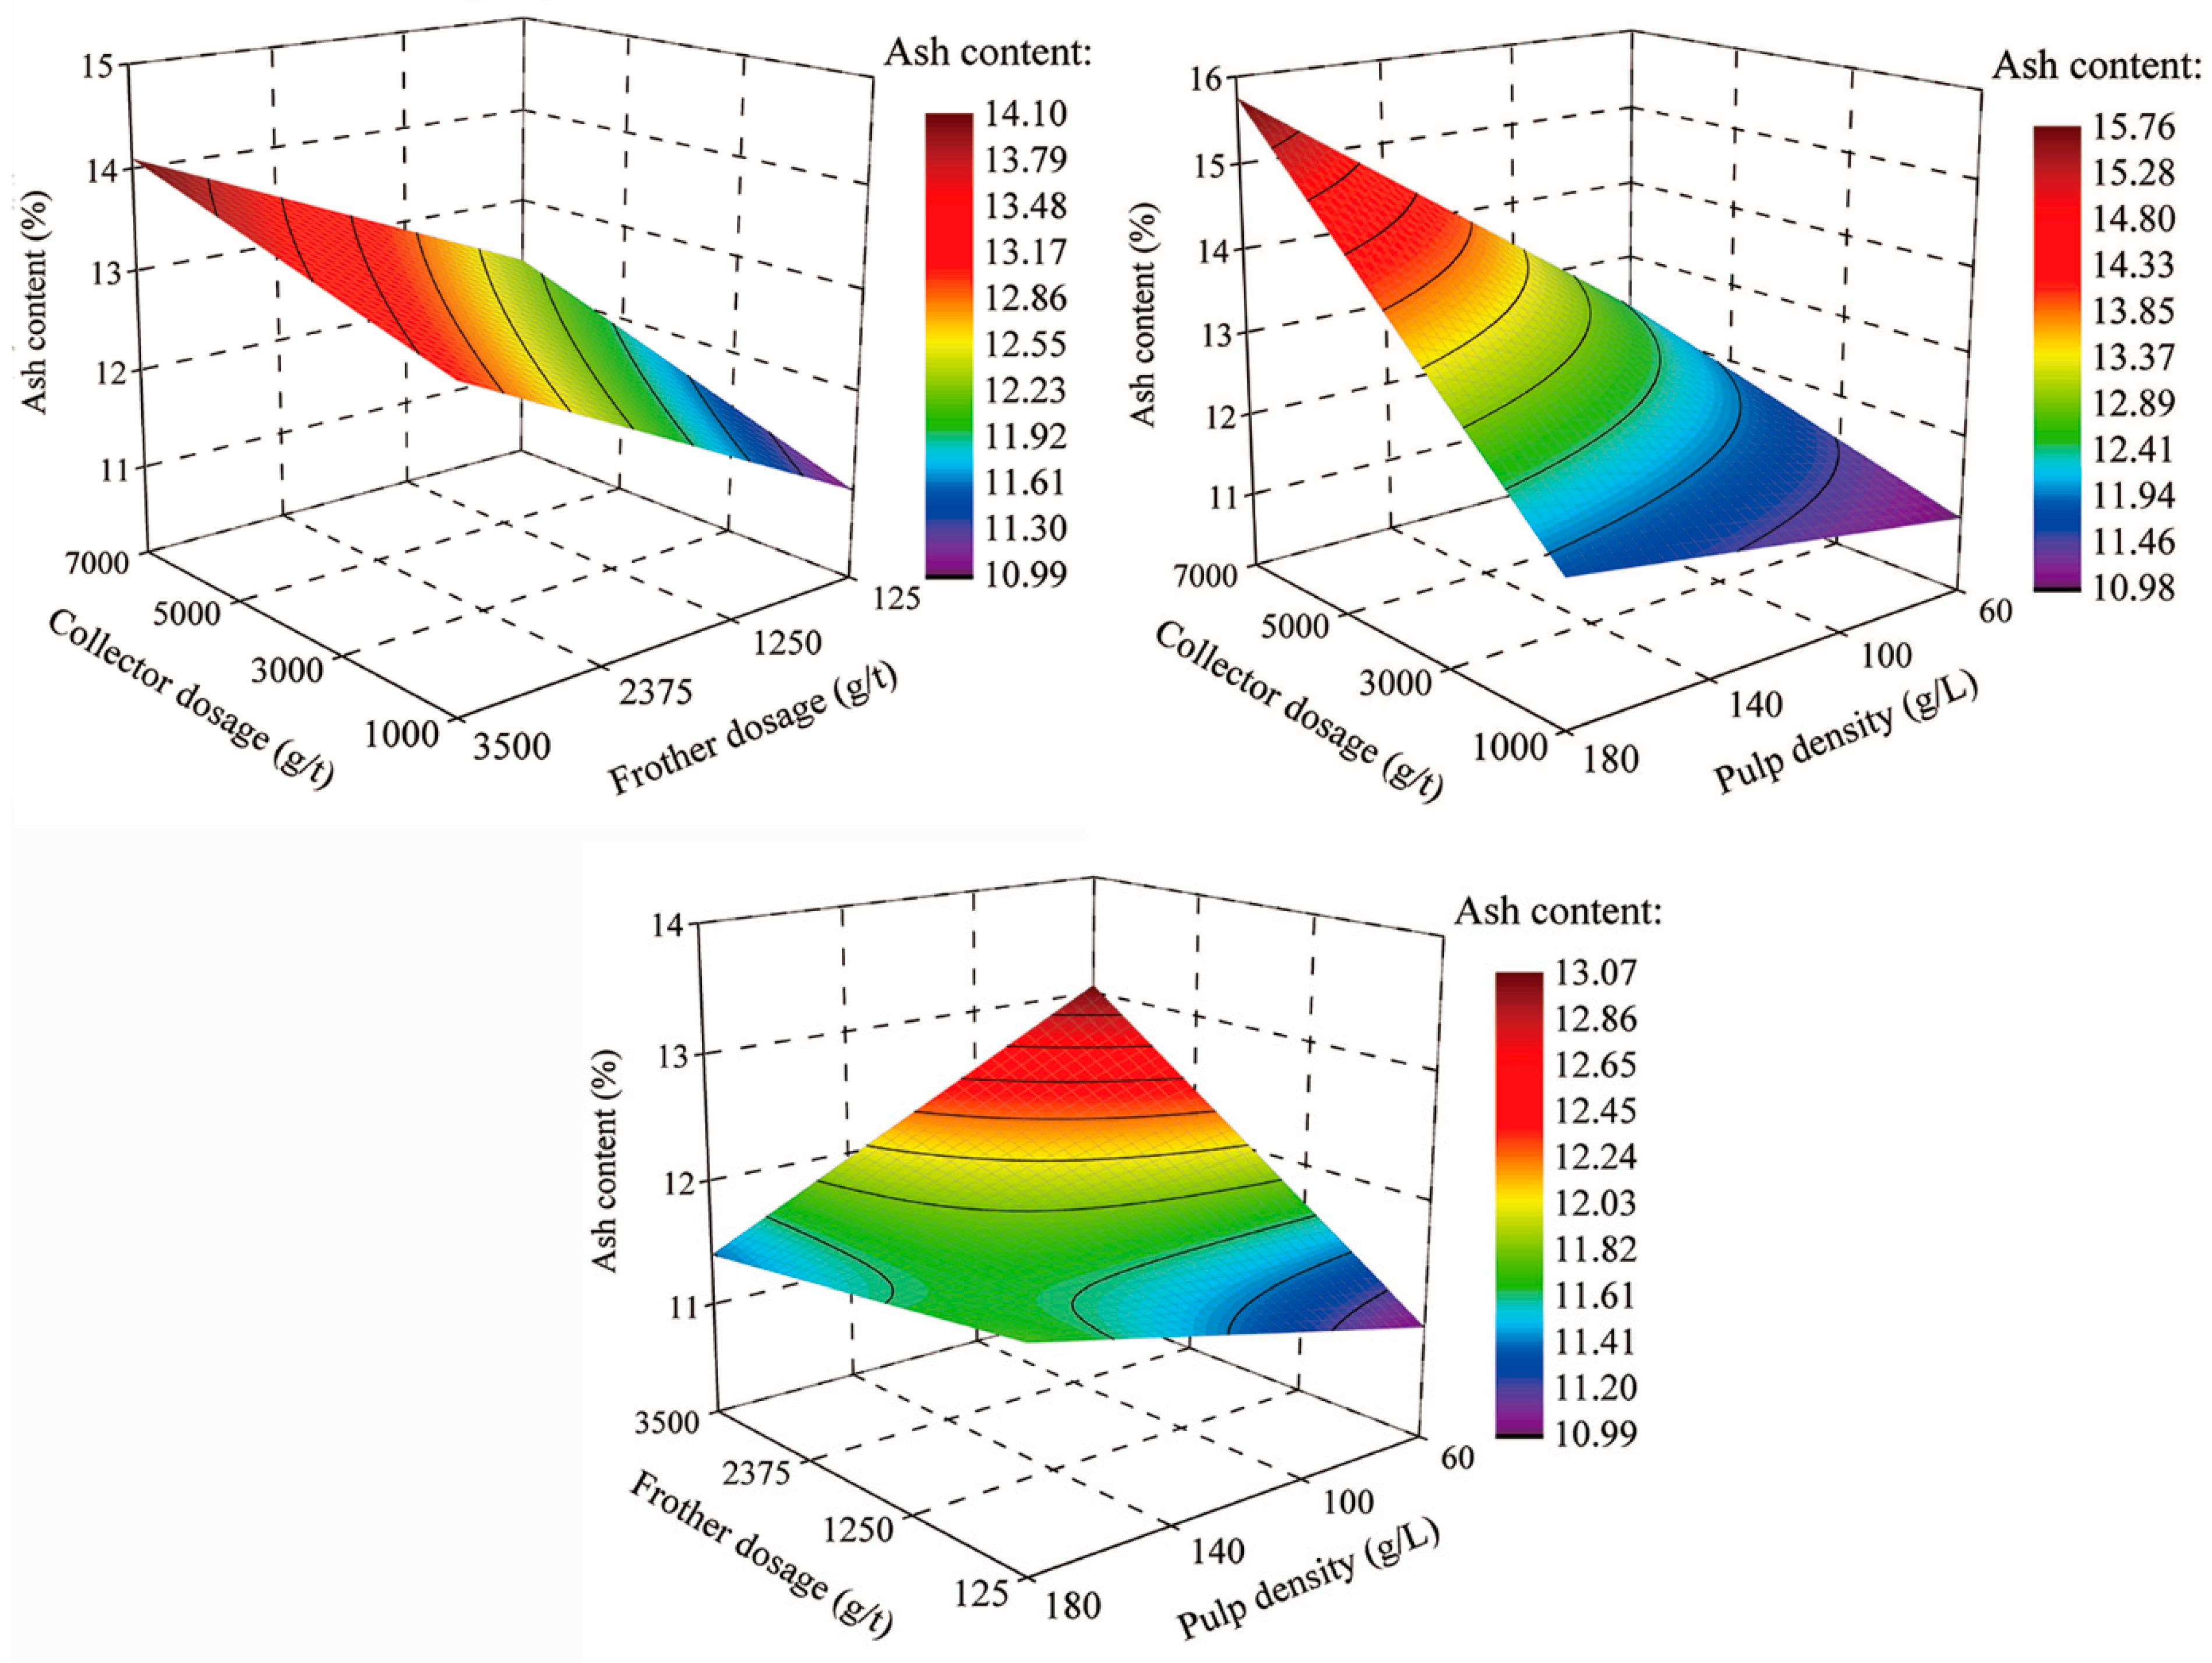
3.2.1. Rougher Flotation

The experimental results of the rougher flotation process using a mechanical flotation cell are summarized in Table 2. Analysis of variance (ANOVA) was performed using the Design Expert 8.0.0 software package (Version 8.0, Stat-Ease Inc., Minneapolis, MN, USA). Summaries of ANOVA are presented in Appendix A.
The response surfaces of the dual interactions for the ash content are presented in Figure 5. The rest variable was set at the lowest level. The ash content of the concentrate could only be reduced to ~11% from 15.43%. The optimal process parameters were determined as: a collector dosage of 500 g/t, a frother dosage of 125 g/t, and a pulp density of 90 g/L for a predicted ash content of 10.87%. The experimental yield and ash content at the optimal conditions were determined as 50.00% and 10.86%, respectively. The lowest ash content of the concentrate was obtained at the lowest flotation reagents and solids concentration. This is due to a low amount of water that was transferred to the froth [32,33]. The increase in the amount of flotation reagents and solids concentration resulted in a significant increase of entrainment. The froth becomes very tenacious due to the presence of frother and fine hydrophobic graphite particles [2,5,34,35]. A more stable froth has fewer coalescence and bursting events, which leads to the increase in the amount of material recovered by entrainment. However, the excessively low collector and frother dosage and solids concentration led to the poor hydrophobicity and froth stability, thus resulting in the lowest yield.

3.2.2. Multi-Stage Flotation

The froth product from rougher flotation (5000 g/t collector dosage, 1667 g/t frother dosage, and 180 g/L pulp density) was re-cleaned using multi-stage flotation circuits of the mechanical flotation cell to further improve the grade. The effect of the pulp density of the Cleaner 1 flotation on the concentrate of the multi-stage flotation circuits is presented in Table 4. Compared to rougher flotation, the ash content of the concentrate in the multi-stage circuit was further reduced to ~8% at ~40% yield. However, loss of valuable materials still occurred in these circuits.
Table 4 reveals that the pulp density significantly affected the reduction in gangue entrainment in graphite flotation. Thus, a significant increase in the number of re-cleaning stages was required for the highest pulp density of the Cleaner 1 flotation process.

3.3. Flotation Column Tests

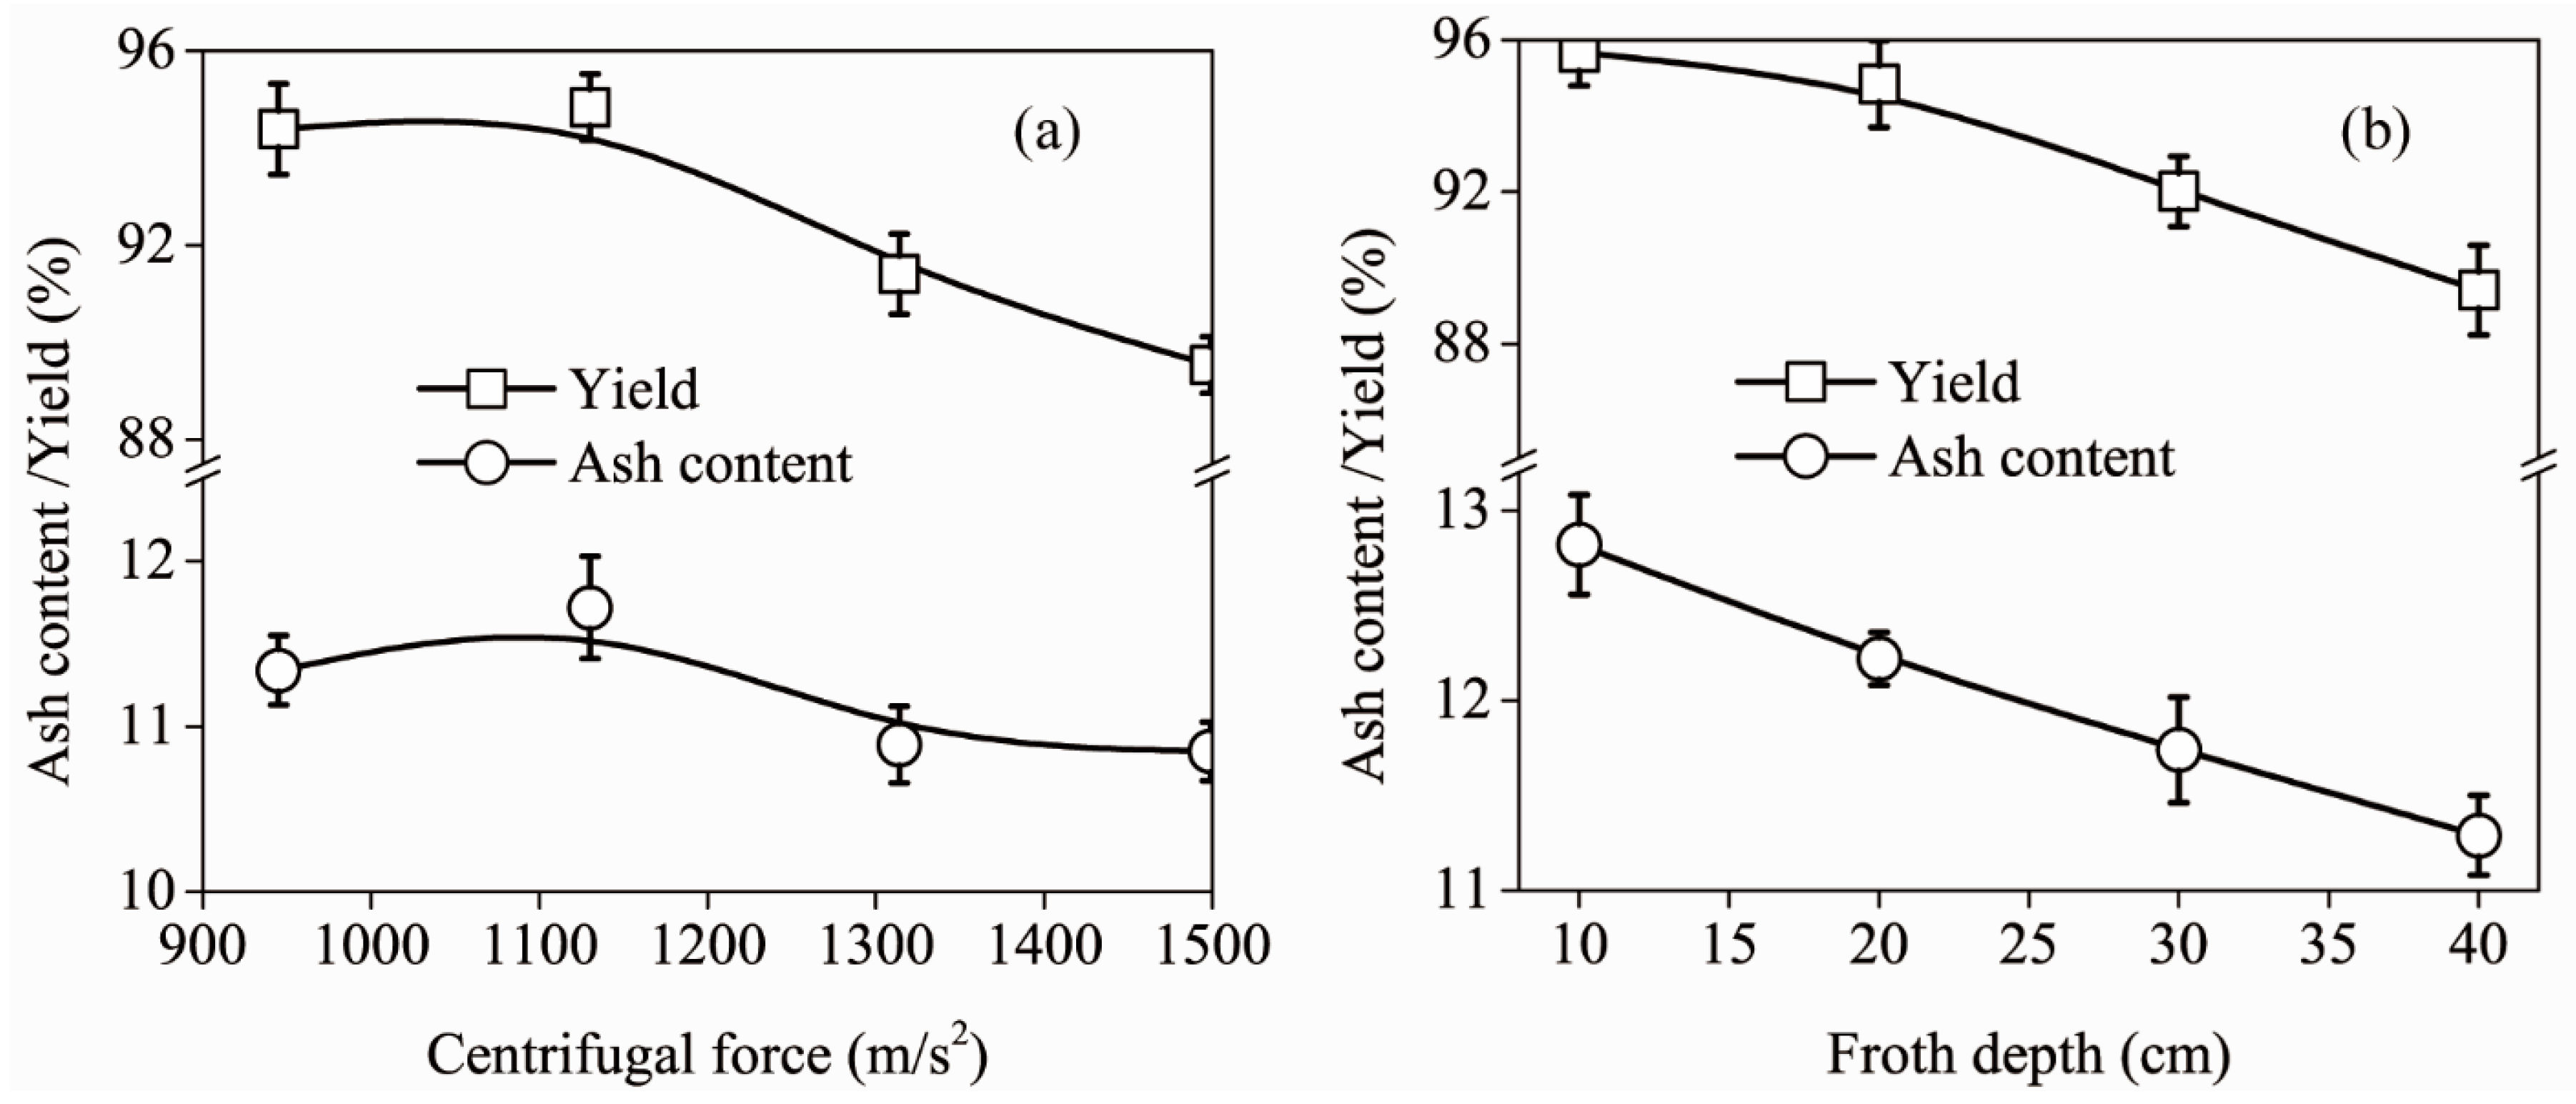
3.3.1. Rougher Flotation

Compared to mechanical flotation cells, column flotation is more efficient in inhibiting the entrainment of ash materials at the highest reagent dosage [27]. Moreover, the recovery of valuable materials from column flotation is much higher than that from mechanical flotation under the lowest pulp density [20]. Hence, rougher flotation column tests were carried out at a collector dosage of 5000 g/t, a frother dosage of 1667 g/t, and a pulp density of 60 g/L. The relationship between the circulation pressure and centrifugal acceleration at the entrance of the centrifugal force field is presented in Appendix B, while the effects of the centrifugal acceleration and froth depth on the flotation performance are illustrated in Figure 6.
Figure 6a illustrates that both the yield and ash content of the concentrate exhibited a decreasing trend with an increase in centrifugal acceleration. These findings were attributed to the increase in relative velocity between the mineralized bubble (aggregate of valuable materials and bubbles) and gangue particles under a centrifugal force field [22]. This increase in centrifugal force also increases the collision probability between fine particles and bubbles [24]. This phenomenon is in good agreement with observations for ASH [11,12,14]. Furthermore, the use of the Venturi principle in the flotation column can enhanced hydrophobic particle aggregation and bubble–particle collision probability in the occurrence of nanobubbles produced by hydrodynamic cavitation [18,36,37]. Nanobubbles were more preferably generated on hydrophobic particle surface rather than on hydrophilic particle surface [17]. Those nanobubbles play an important role in bridging particles to form aggregates, which can enhance ultra-fine particles flotation [38]. With the increase in the separation efficiency, a large amount of gangue materials reports to the tailings, resulting in the decrease of the yield.
Figure 6b also reveals that with increasing froth depth, the yield of the concentrate decreased from 95.67% to 89.41%, while the ash content of the concentrate decreased from 12.32% to 10.79%. At a higher froth depth, the froth residence time is longer so that the recovery of the ash materials decreases more significantly than that of the valuable materials [20].
In rougher flotation, the yield of the mechanical flotation cell concentrate (10.86% ash content) was 50% under optimal conditions (see Table 2). In comparison, when a flotation column is employed, the yield of the concentrate could be further increased to 91.41% at 10.89% ash content. Thus, a good recovery of fine graphite could be guaranteed by applying a centrifugal force and nanobubbles in the rougher flotation process using a flotation column. However, the relatively high ash content in the concentrate was not mitigated.

3.3.2. Multi-Stage Flotation

The froth product of the rougher flotation process at 20 cm froth depth and 1130 m/s2 centrifugal force was re-cleaned in multi-stage flotation circuits using a flotation column. The effects of the pulp density of the Cleaner 1 flotation process on the concentrate of the multi-stage flotation circuits are listed in Table 5.
The yield of the concentrate from Cleaner 3 flotation circuit (flotation column: 7.97% ash content and 90.09% fixed carbon) was 77.53% when the pulp density of the feed to the Cleaner 2 flotation was 30 g/L. On the other hand, at the same ash content level, the yield of the concentrates from the multi-stage circuits of the mechanical process was 44% at similar pulp density of the Cleaner 2 flotation (25 g/L). The short residence time of the fine particles in the mechanical flotation cell resulted in a large loss of valuable particles in the multi-stage flotation circuits. Conversely, the long collection zone and centrifugal force field in the flotation column provided a long residence time and scavenging process for fine particles in multi-stage flotation circuits.
Although the tested flotation column showed better performance than multi-stage mechanical flotation, the relative contributions from centrifugal forces and hydrodynamic cavitation in the column flotation remain to be further explored.

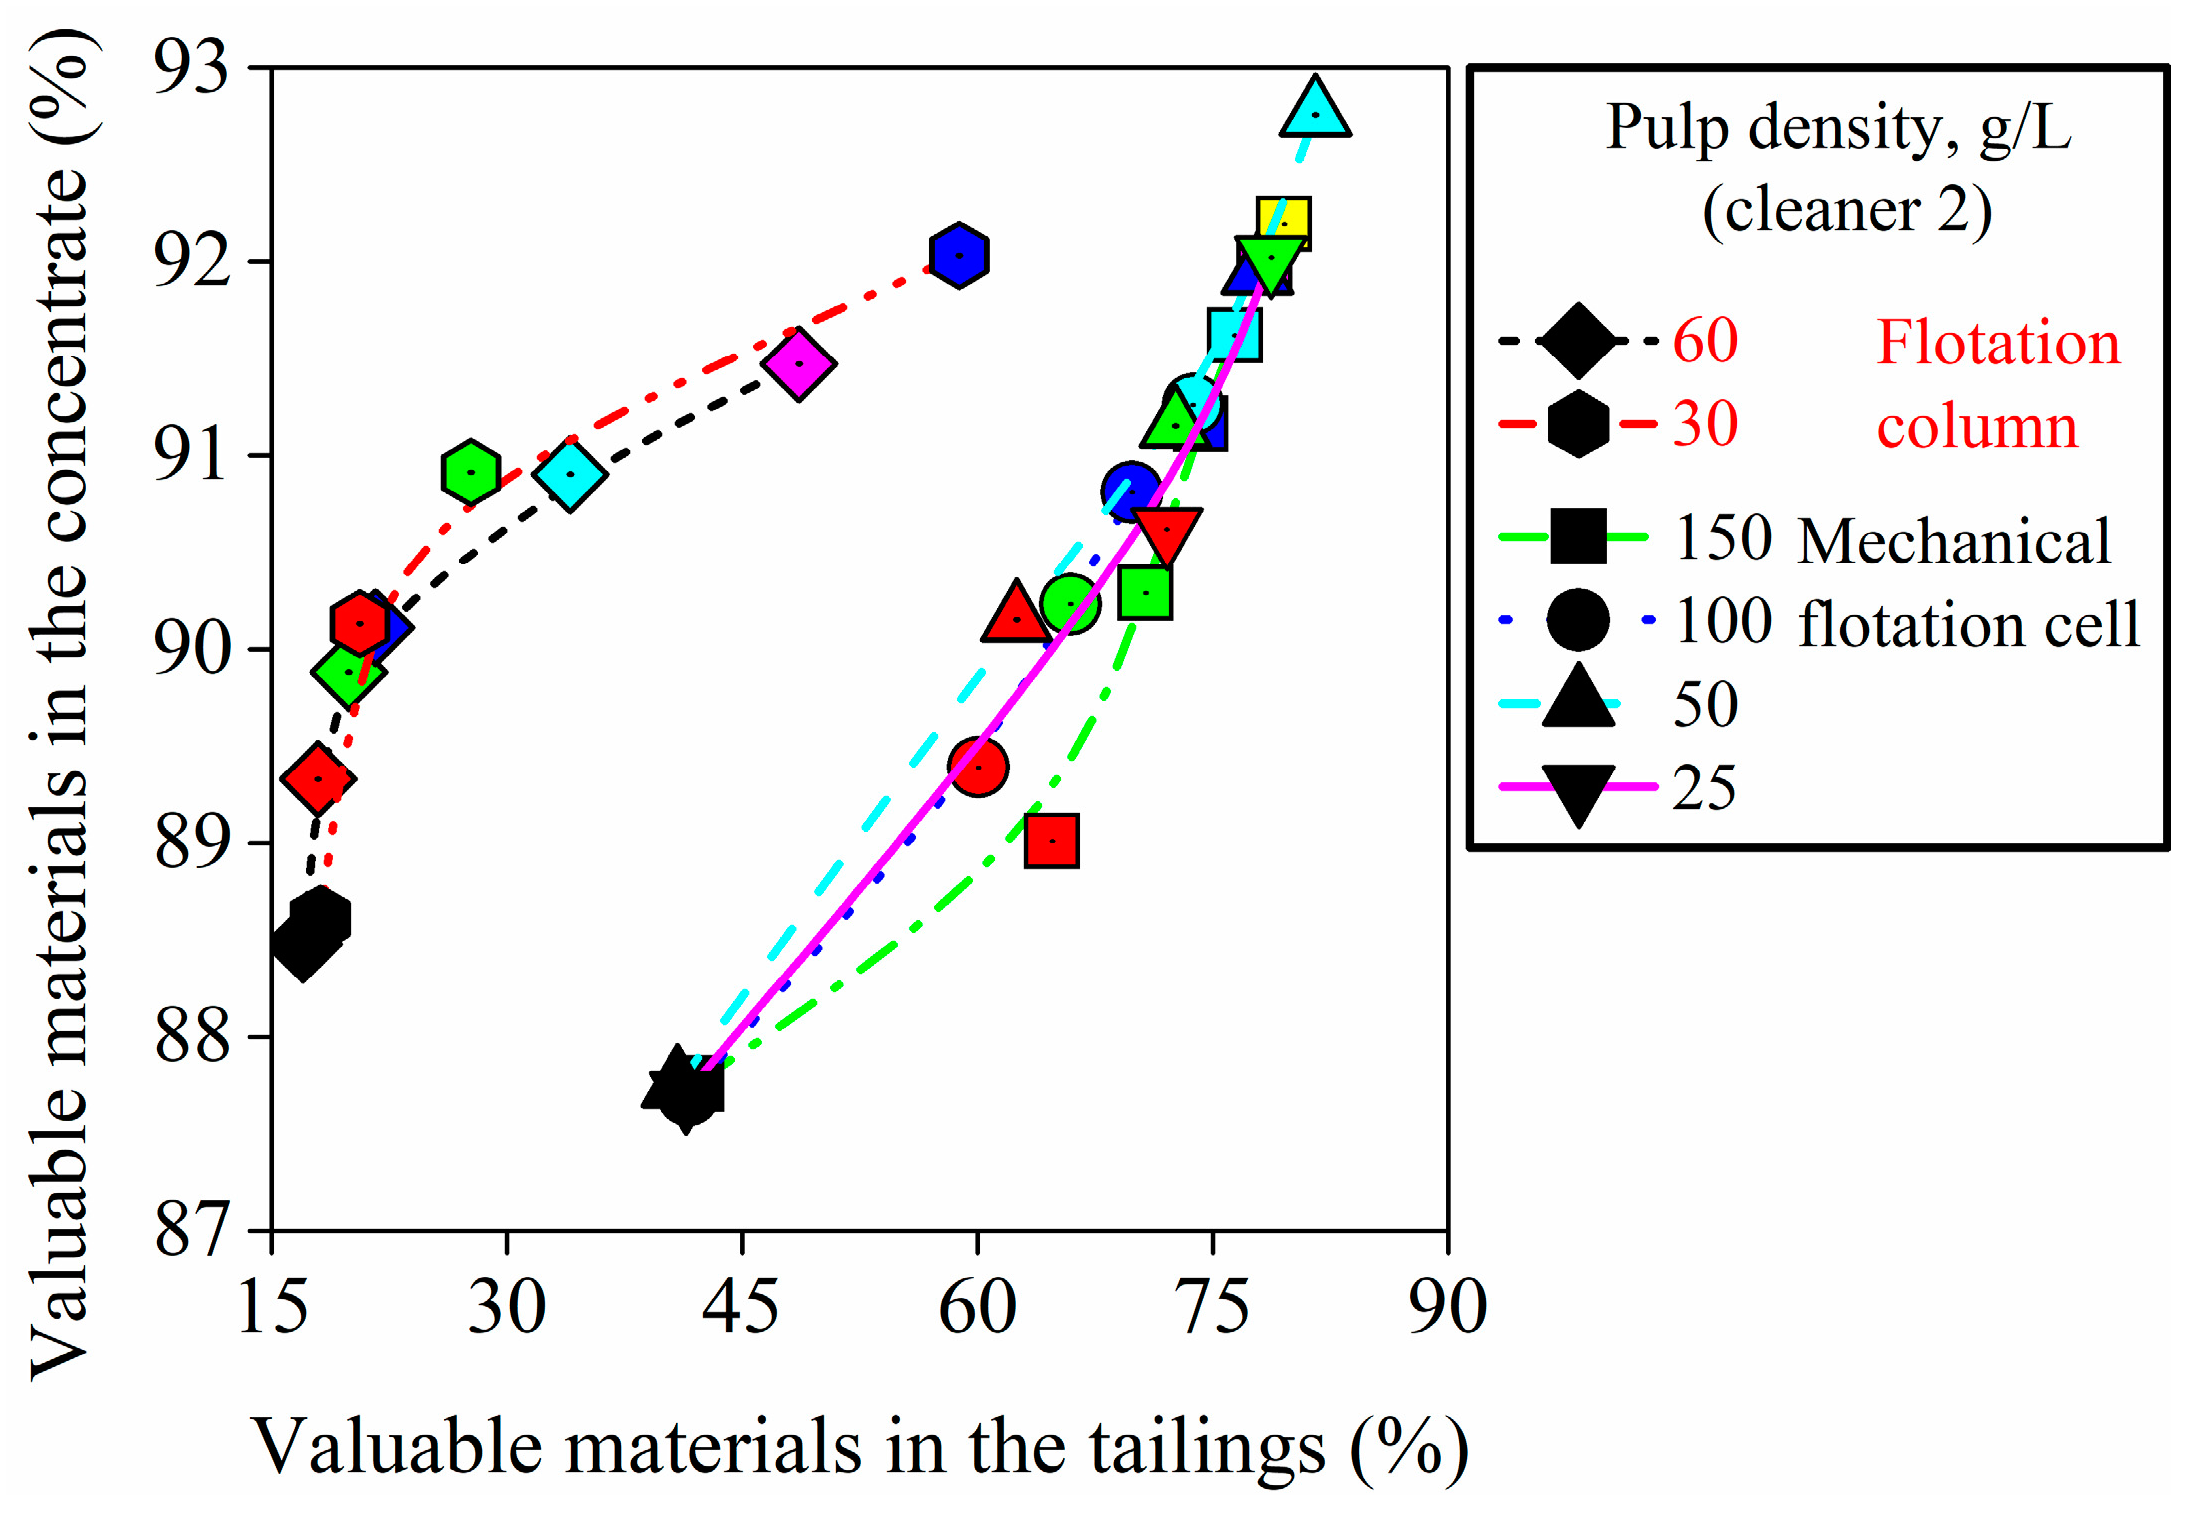
3.4. Comparison of Flotation Separation Efficiencies

A comparison between the flotation performance of the mechanical flotation cell and the flotation column on the basis of Neethling and Cillers’s model is presented in Figure 7. The black, red, green, blue, cyan, magenta, and yellow symbols are the concentrates from Rougher-, Cleaner 1, Cleaner 2, Cleaner 3, Cleaner 4, Cleaner 5, and Cleaner 6 flotation processes, respectively.
The grade of valuable material reporting to the concentrate, GC is as follows [39]:
G C = ( G Max G NF ) b + 1 ( G Max G NF ) b ( G T G NF ) + 1 + G NF
where: GC is the grade of valuable material reporting to the concentrate; GMax is the mass fraction of valuable material in the floatable component; GNF is the mass fraction of valuable material in the non-floating component; GT is the grade of valuable material in the tank (or in the tailing from the tank); b is a dimensionless parameter.
The expression b is the ratio of the effects of entrainment and of true flotation. It is thus the rate at which a floatable particle will be recovered to the concentrate by entrainment vs. that by true flotation. The values for GMax, GNF, and b were determined from fitting Equation (1) to the experimental results of the mechanical flotation cell and flotation column.
It can be observed from Table 6 that the grade of the floating component (GMax) and the grade of the non-floating component (GNF) were virtually identical for the two flotation devices. It is expected that the type of flotation device does not have an impact on the flotability of the ore. The ratio of entrainment to true flotation (b) when using the flotation column (0.0014–0.0018) was much smaller than that obtained when a mechanical flotation cell was employed (0.0291–0.0409) at the similar level of the pulp density of the Cleaner 1 flotation process. Hence, it was concluded that the use of the flotation column exhibited a reduction of entrainment and enlargement of true flotation compared with the mechanical flotation cell.
The multi-stage flotation circuit is a continual process of pulp density reduction that results in the continual improvement of the flotation separation selectivity in fine graphite ore. The non-selective detachment process of multi-stage flotation circuits using the mechanical flotation cell led to a large loss of valuable materials. Conversely, the separation selectivity of the multi-stage circuits in the flotation column was much higher than that of the mechanical flotation cell. This was attributed to a combination of the centrifugal force, nanobubbles, and the thicker froth layer.

4. Conclusions

(1) Quartz grains (<60 μm) were the major impurity mineral in the investigated graphite ore. The degree of mineral liberation in quartz was assured by crushed and ground samples having a d90 value of 55.57 µm.
(2) In the rougher flotation tests, the presence of the centrifugal force, nanobubbles, and the thicker froth layer enhanced the separation performance of the flotation column over that of the mechanical flotation cell. The serious entrainment of hydrophilic materials due to the strong hydrophobicity of graphite was a critical problem for further enrichment of graphite in the rougher flotation process.
(3) Multi-stage flotation circuits created a continual process of pulp density reduction that inhibited the entrainment of hydrophilic materials. The scavenging process of the centrifugal force field also ensured the recovery of valuable materials from middling products.

Acknowledgments

This work was supported by the Fundamental Research Funds for the Central Universities (Grants No. 2017BSCXA07) and Postgraduate Research and Practice Innovation Program of Jiangsu Province, China (Grants No. KYCX17_1511).

Author Contributions

Xiangning Bu and Guangyuan Xie conceived and designed the experiments; Tuantuan Zhang performed the experiments; Erdong Wu and Yaoli Peng analyzed the data; Tuantuan Zhang contributed reagents/materials/analysis tools; Xiangning Bu wrote the paper.

Conflicts of Interest

The authors declare no conflict of interest.

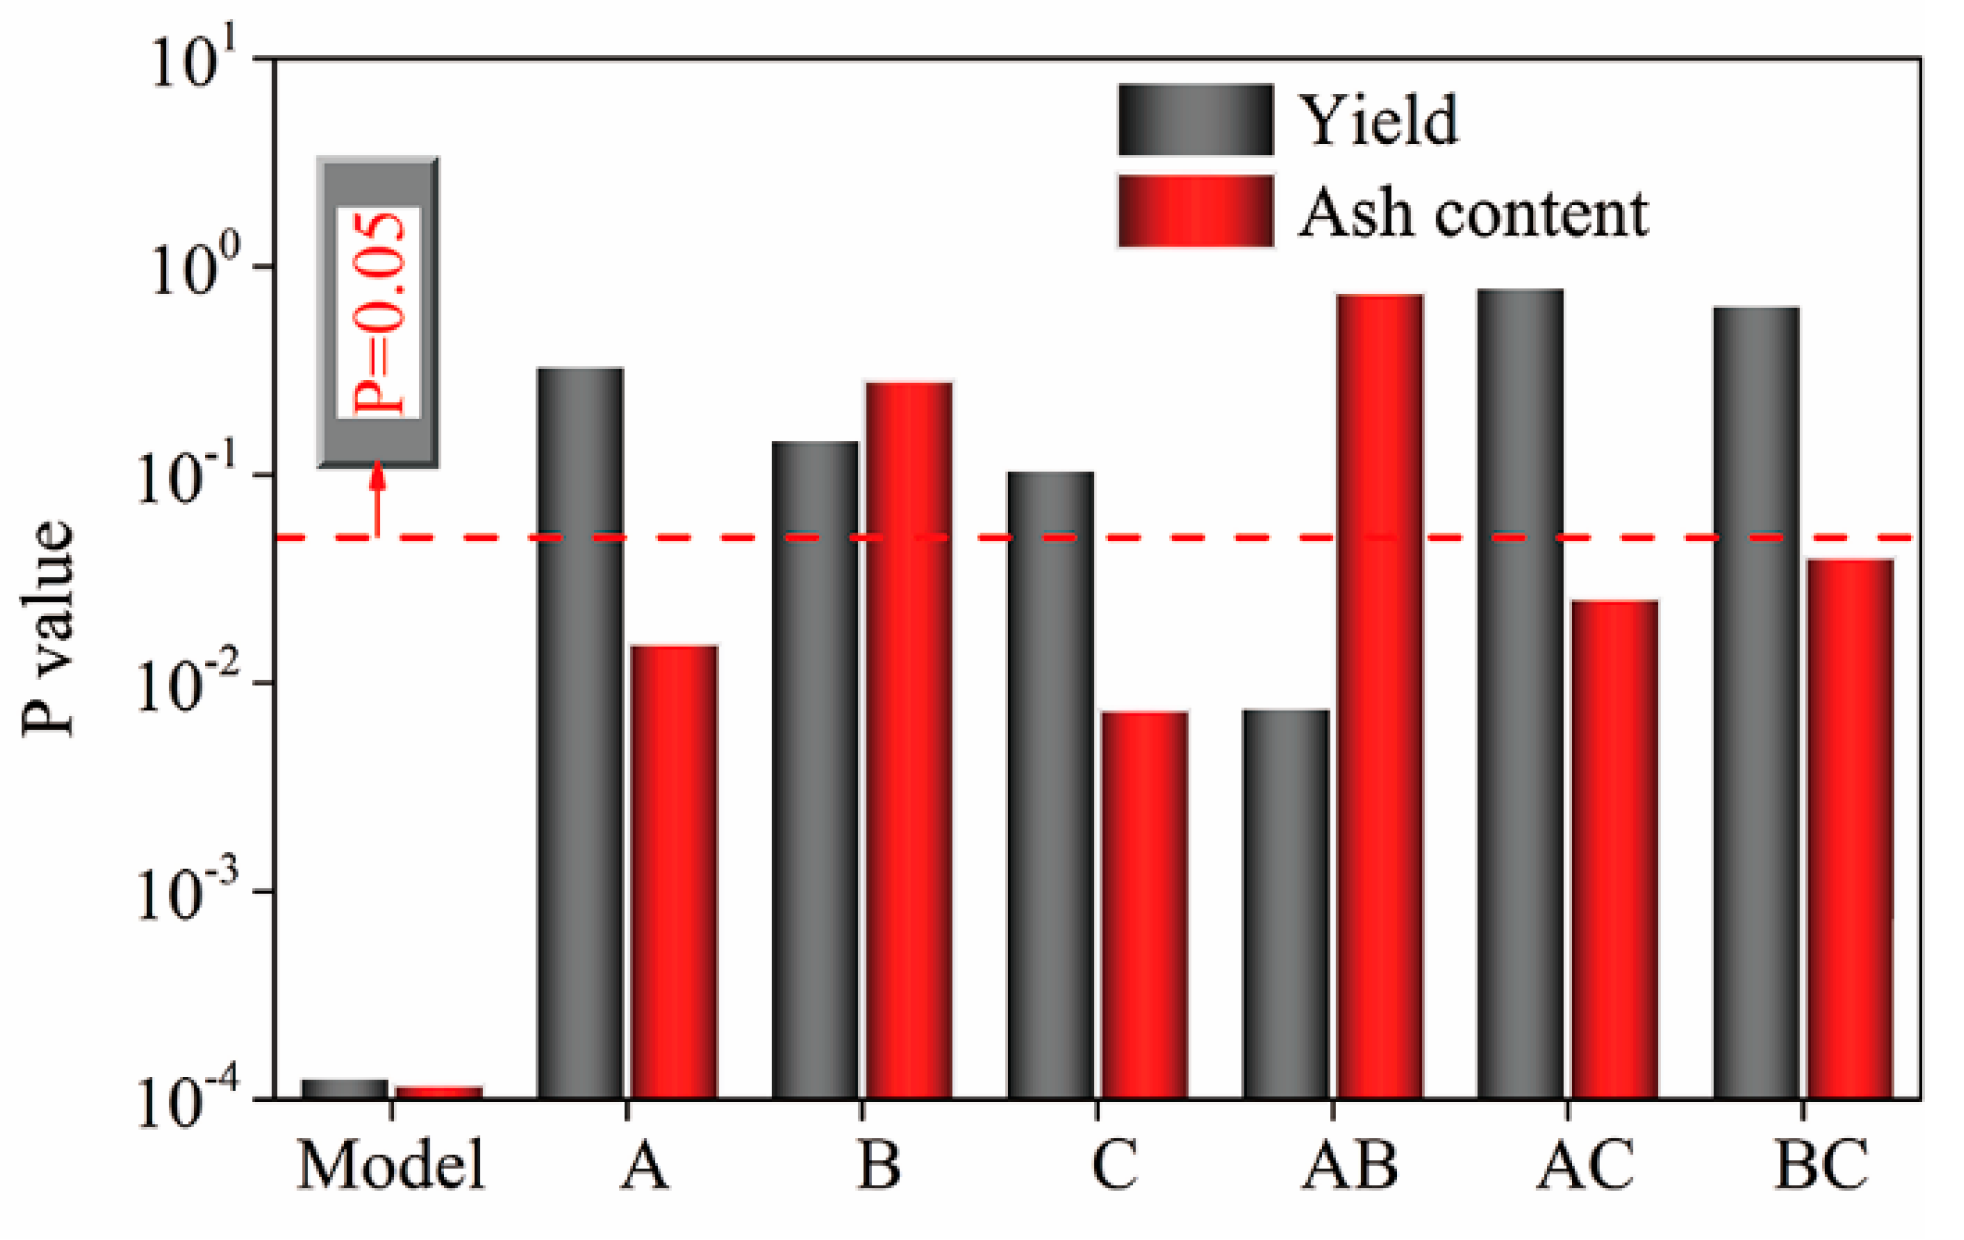
Appendix A. Analysis of Variance (ANOVA)
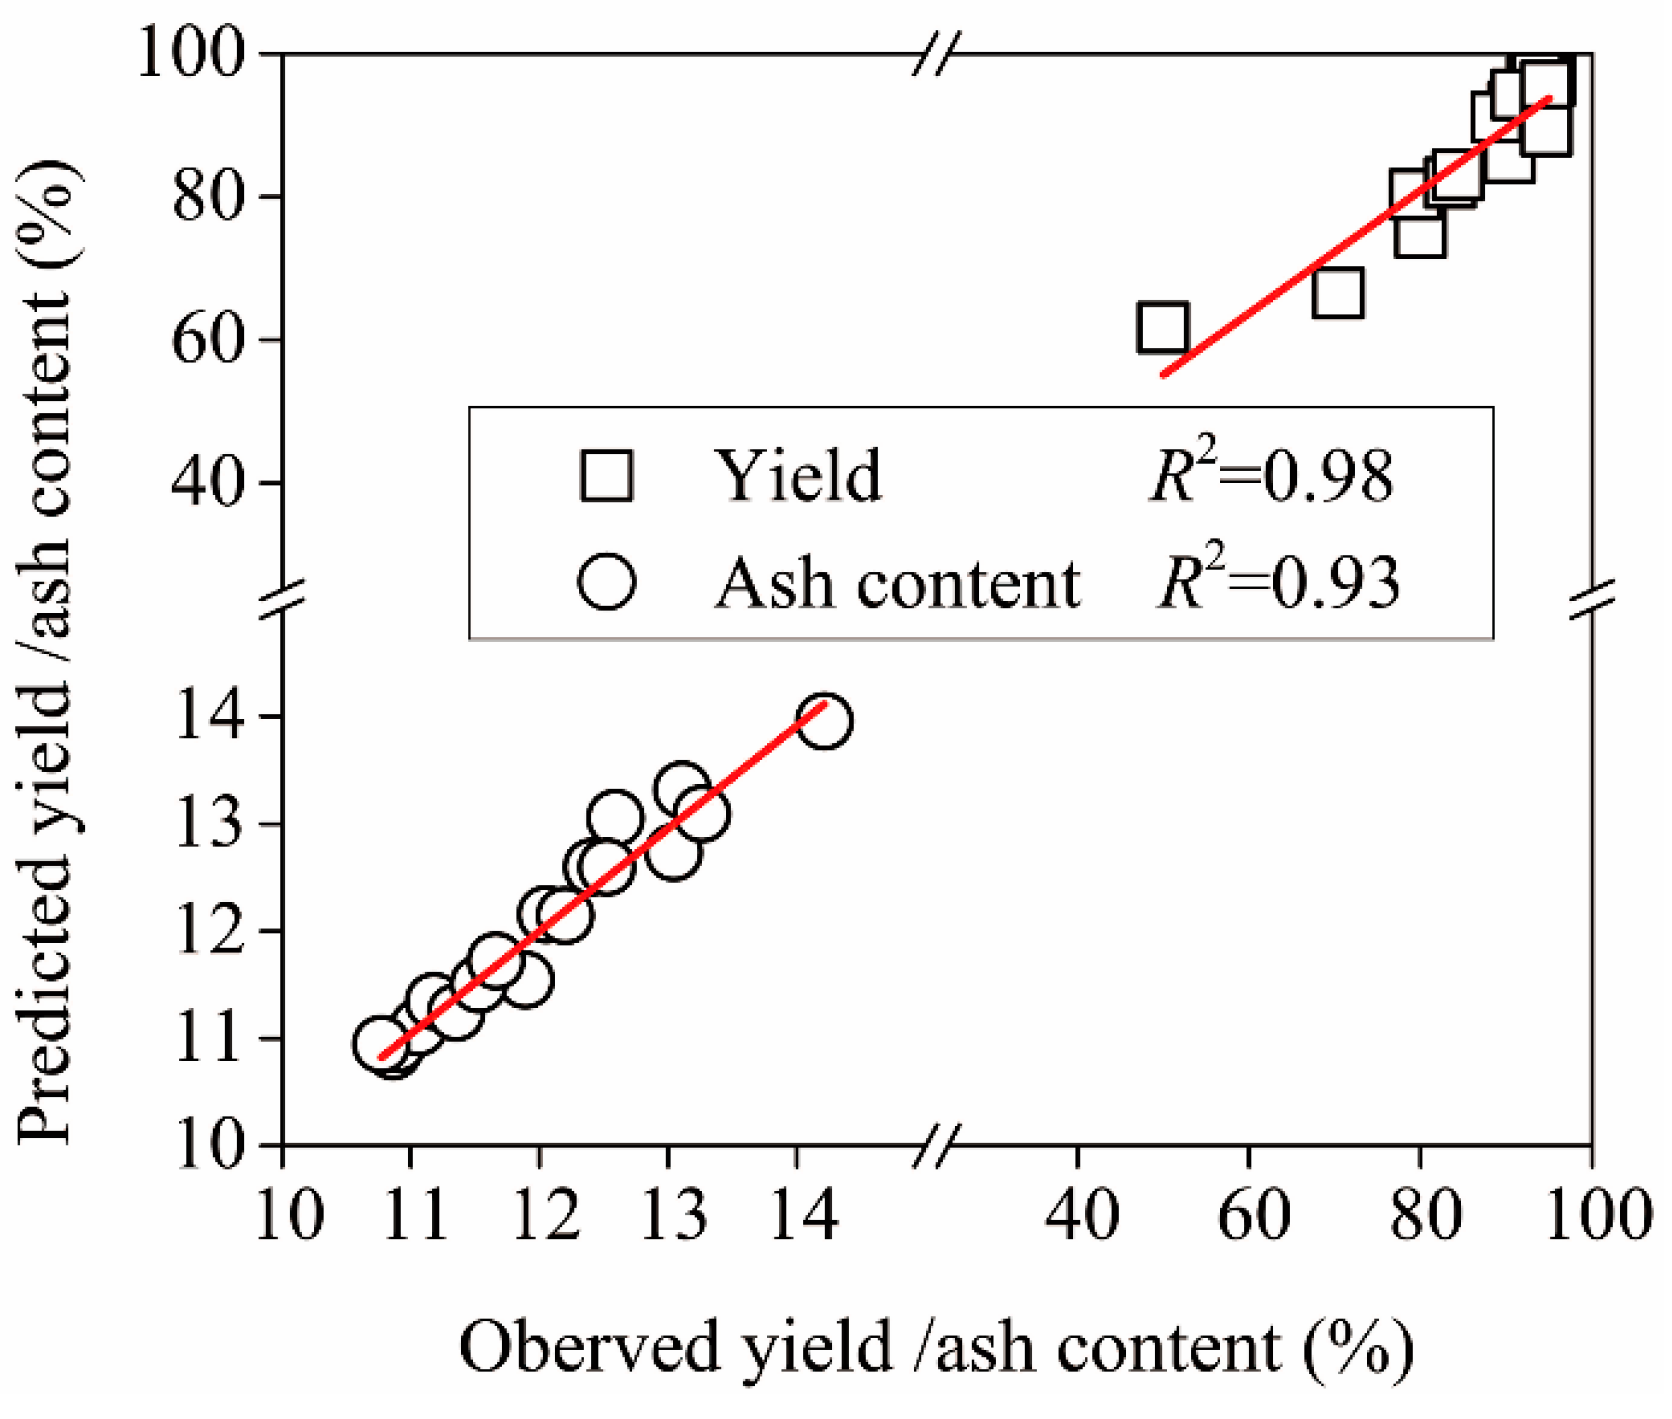
The experimental results of the rougher flotation process using the mechanical flotation cell were inserted into the Design Expert 8.0.0 software package and regression models were built to predict the ash content and yield of the concentrate from rougher mechanical flotation. The models in terms of the coded factors, developed to determine the yield and ash content of the concentrate, are listed below:
Ash content = 11.97 + 0.61 · A + 0.21 · B + 0.29 · C − 0.08 ·A · B + 0.54 · A · C − 0.46 · B · C
Yield (%) = 92.57 + 5.14 · A + 6.89 · B + 4.34 · C − 25.26 · A · B − 1.75 · A · C + 3.73 · B · C
Analysis of Variance (ANOVA) was carried out to evaluate the adequacy of the whole model. The sum of squares for the model is described as:
Model   sum   of   square = Σ i = 1 j y i 2 ( Σ i = 1 n y i ) 2 n
where yi is the model prediction for the ith observation and n is the number of observations. The model mean square is the average squared error for the observation data or the sum-of-squares divided by the number of observations:
Model mean sum of squares = Model sum of squares/Degree of freedom.
The F-test for the model indicates the level of significance of the model prediction. The F-value is the ratio of mean model sum of squares to mean error sum of squares and is expressed as:
F-test = Estimate model variance/Estimate of residual variance.
The overall significance of both models is presented in Table A1. The F-values of the yield and ash content were 13.26 and 48.72, respectively, at a >95% confidence level. The model p-value <0.0001 indicated that the developed models were significant. The relationship between the observed and predicted values is displayed in Figure A1. The plots are approximately linear for the yield and the ash content with R2 values of 0.98 and 0.93, respectively. Joglekar and May [40] suggested that for a good model fit, the coefficient of determination should be ≥0.8. Therefore, we concluded that the predicted values fitted the observed values reasonably well and thus, that Equations (A1) and (A2) fitted the experimental data listed in Table 2.
Table A1. Statistical significance of the whole model for yield and ash content of the concentrate.
StatisticsYieldAsh Content
Sum of square1882.8916.07
Degree of freedom66
Mean sum of square313.822.68
R20.980.93
F-value13.2648.72
Prob > F<0.0001<0.0001
The results from the significance analysis (Figure A2) reveal that the interaction between the collector and frother dosages was the significant model term for the yield. The significant model terms of the ash content were A, C, AC, and BC.
Figure A1. Actual and predicted values of the response variables.
Minerals 08 00015 g0a1
Figure A2. Significance analysis of parameters on the response variables.
Minerals 08 00015 g0a2

Appendix B. Calculation of the Centrifugal Acceleration in the Flotation Column

The centrifugal acceleration (acen) in the centrifugal force field is described as:
a cen = V t 2 ( r ) r
where Vt(r) represents the tangential speed at column radius r. The tangential speed was calculated from:
V t   ( r = D 2 ) = ( P cir P hydro ρ g S L ) 0.5   ·   4 π D pipe 2
where D is the diameter of the column; Dpipe is the inside diameter of the circulating pipe; Pcir is the measured circulation pressure; Phydro is the hydrostatic pressure of the entrance to the centrifugal force field; ρ is the density of the slurry; S is resistance coefficient of the circulation pipe; L is the length of the pipe between the measuring point and the outlet of the pipe in the centrifugal field; and g is the gravitational acceleration. The resistance coefficient of the pipe is evaluated by Manning’s formula [41]:
S = 10.3 n 2 D pipe 5.33
where n is the pipe roughness. The calculated values of the centrifugal acceleration at the entrance of the centrifugal force field under various circulation pressures are listed in Table A2. The values of the centrifugal acceleration were between 100- to 200-fold greater than that of gravity. This is in a reasonable acceleration range in the order of 2–200 g units according to the literature of Miettinen et al. [42]. Fine particles typically follow the liquid streamlines due to the lack of energy for inertial collision between fine particles and air bubbles in the conventional flotation process. In the presence of a strong centrifugal acceleration, the inertial collision is strengthened to achieve thin film rupture and the formation of a three-phase contact line for a fine particle to attach to an air bubble.
Table A2. Centrifugal force values under various circulation pressures.
Pcir (106 Pa)Jg (cm/s)Vt (r = D/2) (m/s)acen (m/s2)Values of Parameters
0.120.716.87945D (mm)Phydro (Pa)L (m)
0.140.997.52113010017,6400.5
0.161.168.111314Dpipe (mm)ρ (g/cm3)n (µm)
0.181.458.661499131.512

References

  1. Zheng, Z.; Zhang, J.; Huang, J.Y. Observations of microstructure and reflectivity of coal graphites for two locations in China. Int. J. Coal Geol. 1996, 30, 277–284. [Google Scholar] [CrossRef]
  2. Li, H.; Feng, Q.; Yang, S.; Ou, L.; Lu, Y. The entrainment behaviour of sericite in microcrystalline graphite flotation. Int. J. Miner. Process. 2014, 127, 1–9. [Google Scholar] [CrossRef]
  3. Chelgani, S.C.; Rudolph, M.; Kratzsch, R.; Sandmann, D.; Gutzmer, J. A review of graphite beneficiation techniques. Miner. Process. Extr. Metall. Rev. 2015, 37, 58–68. [Google Scholar] [CrossRef]
  4. Ross, V.E. Flotation and entrainment of particles during batch flotation tests. Miner. Eng. 1990, 3, 245–256. [Google Scholar] [CrossRef]
  5. Ata, S.; Ahmed, N.; Jameson, G.J. The effect of hydrophobicity on the drainage of gangue minerals in flotation froths. Miner. Eng. 2004, 17, 897–901. [Google Scholar] [CrossRef]
  6. Li, H.Q.; Ou, L.M.; Feng, Q.M.; Chang, Z.Y. Recovery mechanisms of sericite in microcrystalline graphite fotation. Physicochem. Probl. Miner. Process. 2015, 51, 387–400. [Google Scholar]
  7. Weng, X.; Li, H.; Song, S.; Liu, Y. Reducing the entrainment of gangue fines in low grade microcrystalline graphite ore flotation using multi-stage grinding-flotation process. Minerals 2017, 7, 38. [Google Scholar] [CrossRef]
  8. Bu, X.; Xie, G.; Peng, Y. Interaction of fine, medium, and coarse particles in coal fines flotation. Energy Sour. Part A Recov. Util. Environ. Effects 2017, 39, 1276–1282. [Google Scholar] [CrossRef]
  9. Yianatos, J.B.; Espinosa-Gomez, R.; Finch, J.A.; Laplante, A.R.; Dobby, G.S. Effect of column height on flotation column performance. Miner. Metall. Process. 1988, 5, 11–14. [Google Scholar]
  10. Das, A.; Miller, J.D. Swirl flow characteristics and froth phase features in air-sparged hydrocyclone flotation as revealed by X-ray CT analysis. Int. J. Miner. Process. 1996, 47, 251–274. [Google Scholar] [CrossRef]
  11. Miller, J.D.; van Camp, M.C. Fine coal flotation in a centrifugal field with an air sparged hydrocyclone. Min. Eng. 1982, 34, 1575–1580. [Google Scholar]
  12. Hupka, J.; Dabrowski, B.; Miller, J.D.; Halbe, D. Air-sparged hydrocyclone (ASH) technology for cyanide recovery. Miner. Metall. Process. 2005, 22, 135–139. [Google Scholar]
  13. Miller, J.D.; Kinneberg, D.J. Fast flotation with an air-sparged hydrocyclone. In Proceedings of the MINTEK 50, International Conference on Recent Advances in Mineral Science and Technology, Johannesburg, South Africa, 26–30 March 1984; pp. 337–338. [Google Scholar]
  14. Yalamanchili, M.R.; Miller, J.D. Removal of insoluble slimes from potash ore by air-sparged hydrocyclone flotation. Miner. Eng. 1995, 8, 169–177. [Google Scholar] [CrossRef]
  15. Tils, H.M.G.C.; Tels, M. A study into fine particle flotation separation characteristics with application to centrifugal force field flotation cells. Int. J. Miner. Process. 1992, 36, 201–217. [Google Scholar] [CrossRef]
  16. Bu, X.; Xie, G.; Peng, Y.; Chen, Y. Kinetic modeling and optimization of flotation process in a cyclonic microbubble flotation column using composite central design methodology. Int. J. Miner. Process. 2016, 157, 175–183. [Google Scholar] [CrossRef]
  17. Fan, M.; Tao, D.; Rick, H.; Luo, Z. Nanobubble generation and its application in froth flotation (part I): Nanobubble generation and its effects on properties of microbubble and millimeter scale bubble solutions. Int. J. Min. Sci. Technol. 2010, 20, 1–19. [Google Scholar]
  18. Tao, Y.; Liu, J.; Yu, S.; Tao, D. Picobubble enhanced fine coal flotation. Sep. Sci. Technol. 2006, 41, 3597–3607. [Google Scholar] [CrossRef]
  19. Rahman, A.; Ahmad, K.D.; Mahmoud, A.; Fan, M. Nano-microbubble flotation of fine and ultrafine chalcopyrite particles. Int. J. Min. Sci. Technol. 2014, 24, 559–566. [Google Scholar]
  20. Bu, X.; Zhang, T.; Chen, Y.; Xie, G.; Peng, Y. Comparative study of conventional cell and cyclonic microbubble flotation column for upgrading a difficult-to-float China coking coal using statistical evaluation. Int. J. Coal Prep. Util. 2017. [CrossRef]
  21. Li, B.; Tao, D.; Ou, Z.; Liu, J. Cyclo-microbubble column flotation of fine coal. Sep. Sci. Technol. 2003, 38, 1125–1140. [Google Scholar] [CrossRef]
  22. Li, G.; Cao, Y.; Liu, J.; Wang, D. Cyclonic flotation column of siliceous phosphate ore. Int. J. Miner. Process. 2012, 110–111, 6–11. [Google Scholar] [CrossRef]
  23. Zhang, H.; Liu, J.; Wang, Y.; Cao, Y.; Ma, Z.; Li, X. Cyclonic-static micro-bubble flotation column. Miner. Eng. 2013, 45, 1–3. [Google Scholar] [CrossRef]
  24. Li, X.; Xu, H.; Liu, J.; Zhang, J.; Li, J.; Gui, Z. Cyclonic state micro-bubble flotation column in oil-in-water emulsion separation. Sep. Purif. Technol. 2016, 165, 101–106. [Google Scholar] [CrossRef]
  25. Misra, V.N. Recent advances in mineral processing technologies. In Role of Chemical Engineering in Processing of Minerals and Materials; Mohanty, J.N., Biswal, S.K., Sita Rama Reddy, P., Misra, V.N., Eds.; Allied Publishers: Bhubaneswar, India, 2003; pp. 58–70. [Google Scholar]
  26. Abd El-Rahiem, F.H. Application of Column Flotation for Egyptian Graphite. Tens. Surfactants Detergents 2004, 41, 104–108. [Google Scholar] [CrossRef]
  27. Acharya, B.C.; Rao, D.S.; Prakash, S.; Reddy, P.S.R.; Biswal, S.K. Processing of low grade graphite ores of orissa, India. Miner. Eng. 1996, 9, 1165–1169. [Google Scholar] [CrossRef]
  28. Vasumathi, N.; Vijaya Kumar, T.V.; Ratchambigai, S.; Subba Rao, S.; Bhaskar Raju, G. Flotation studies on low grade graphite ore from eastern India. Int. J. Min. Sci. Technol. 2015, 25, 415–420. [Google Scholar] [CrossRef]
  29. Jin, M.; Xie, G.; Xia, W.; Peng, Y. Flotation optimization of ultrafine microcrystalline graphite using a box-behnken design. Int. J. Coal Prep. Util. 2016. [CrossRef]
  30. Bu, X.; Evans, G.; Xie, G.; Peng, Y.; Zhang, Z.; Ni, C.; Ge, L. Removal of fine quartz from coal-series kaolin by flotation. Appl. Clay Sci. 2017, 143, 437–444. [Google Scholar] [CrossRef]
  31. Bu, X.; Xie, G.; Chen, Y.; Ni, C. The order of kinetic models in coal fines flotation. Int. J. Coal Prep. Util. 2016, 37, 113–123. [Google Scholar] [CrossRef]
  32. Bedekovic, G. A Study of the Effect of Operating Parameters in Column Flotation Using Experimental Design. Physicochem. Probl. Miner. Process. 2016, 52, 523–535. [Google Scholar]
  33. Akdemir, Ü.; Sönmez, İ. Investigation of coal and ash recovery and entrainment in flotation. Fuel Process. Technol. 2003, 82, 1–9. [Google Scholar] [CrossRef]
  34. Nguyen, A.V.; Evans, G.M. Attachment interaction between air bubbles and particles in froth flotation. Exp. Therm. Fluid Sci. 2004, 28, 381–385. [Google Scholar] [CrossRef]
  35. Rahman, R.M.; Ata, S.; Jameson, G.J. Study of froth behaviour in a controlled plant environment—Part 2: Effect of collector and frother concentration. Miner. Eng. 2015, 81, 161–166. [Google Scholar] [CrossRef]
  36. Calgaroto, S.; Azevedo, A.; Rubio, J. Flotation of quartz particles assisted by nanobubbles. Int. J. Miner. Process. 2015, 137, 64–70. [Google Scholar] [CrossRef]
  37. Xu, M.; Zhou, Z.; Xu, Z. Pre-Aeration of Feed, in: Flotation—Encyclopedia of Separation Science; Academic Press: London, UK, 2000; pp. 1556–1562. [Google Scholar]
  38. Zhou, W.; Chen, H.; Ou, L.; Shi, Q. Aggregation of ultra-fine scheelite particles induced by hydrodynamic cavitation. Int. J. Miner. Process. 2016, 157, 236–240. [Google Scholar] [CrossRef]
  39. Neethling, S.J.; Cilliers, J.J. Grade-recovery curves: A new approach for analysis of and predicting from plant data. Miner. Eng. 2012, 36–38, 105–110. [Google Scholar] [CrossRef]
  40. Joglekar, A.M.; May, A.T. Product excellence through design of experiments. Cereal Foods World 1987, 32, 857–868. [Google Scholar]
  41. Powell, R.W. The origin of manning’s formula. J. Hydraul. Div. 1968, 94, 1179–1181. [Google Scholar]
  42. Miettinen, T.; Ralston, J.; Fornasiero, D. The limits of fine particle flotation. Miner. Eng. 2010, 23, 420–437. [Google Scholar] [CrossRef]
Figure 1. Schematic representation of the multi-stage flotation circuit.
Minerals 08 00015 g001
Figure 2. Schematic illustration of the flotation column.
Minerals 08 00015 g002
Figure 3. XRD patterns of the graphite ore.
Minerals 08 00015 g003
Figure 4. Petrographic image of the graphite ore (Q-quartz, G-graphite).
Minerals 08 00015 g004
Figure 5. Response surface plots illustrating the interaction effects of the parameters on the ash content of the concentrate during rougher flotation in the mechanical flotation cell.
Minerals 08 00015 g005
Figure 6. Effects of centrifugal acceleration (a) 20 cm froth depth and froth depth (b) 1130 m/s2 centrifugal force on rougher flotation performance of the flotation column.
Minerals 08 00015 g006
Figure 7. Comparisons of flotation separation efficiency between the mechanical flotation cell and flotation column.
Minerals 08 00015 g007
Table 1. Graphite flotation tests using a mechanical flotation cell and flotation column.
SampleSize (µm)Concentrate FCad (%)Flotation MachineNo. of StagesReference
Chotanagarpur (India)<14488.30C-I5[25]
88.00C-II2
Um Qureia (Egypt)>4579.60C-I4[26]
78.60C-II2
<4545.20C-I4
46.10C-II2
Rajunagfena (India)<21079.00C-I6[27]
80.10C-II2
Jharkhand (India)<18639.45C-I1[28]
<14489.65C-II3
Note: C-I and C-II represent the mechanical flotation cell and flotation column, respectively; FCad (%) = % fixed carbon in the concentrate (air-dried basis).
Table 2. Levels of factors A, B, and C together with experimental and predicted results of the mechanical flotation cell.
RunLevel of FactorsYield (%)Aad (%)
A (g/t)B (g/t)C (g/L)Observed (S.D.)PredictedObserved (S.D.)Predicted
15001259050.00 (1.24)61.7310.86 (0.16)10.88
210002509070.46 (0.24)66.5310.90 (0.24)10.95
320005009080.03 (1.91)74.9811.06 (0.27)11.10
4300010009079.34 (0.51)80.3010.77 (0.08)10.94
5300015009083.41 (1.44)81.9011.18 (0.21)11.34
6300075027083.41 (0.73)81.9011.35 (0.27)11.24
7300030009083.41 (0.88)81.9011.35 (0.11)11.24
8300075036084.37 (0.32)83.0811.35 (0.28)11.24
9300075018090.31 (0.13)86.6811.89 (0.25)11.54
1030007506090.37 (0.70)85.4612.05 (0.22)12.15
1130007509090.81 (0.67)92.5912.2 (0.16)12.14
1230007509093.74 (0.28)91.4712.59 (0.06)13.05
1330007509094.97 (0.96)96.2614.21 (0.07)13.95
145000250018088.86 (2.24)91.1311.53 (0.04)11.5
155000250018093.02 (0.48)96.0312.41 (0.14)12.59
165000166718093.57 (0.67)96.7012.52 (0.21)12.59
17500012509093.60 (1.57)96.7013.04 (0.16)12.73
187000350018091.25 (1.85)94.2211.66 (0.12)11.72
197000233318094.65 (1.54)95.4713.11 (0.15)13.31
20700017509094.67 (0.83)89.2413.26 (0.04)13.09
Note: Factor A—collector dosage (g)/mass of dry sample (metric tonne); Factor B—frother dosage (g)/mass of dry sample (metric tonne); Factor C—mass of dry sample (g)/pulp volume (L); S.D.—standard deviation.
Table 3. Chemical analysis results of the graphite ore (air-dried basis; %).
Fixed CarbonAshWaterVolatile Matter
80.9015.430.433.42
Table 4. Effect of pulp density of the Cleaner 1 flotation process on the concentrate of the multi-stage flotation circuits using a mechanical flotation cell (%).
Flotation CircuitPulp Density of the Cleaner 1 Flotation Process (g/L)
1501005025
Yield (S.D.)Aad (S.D.)Yield (S.D.)Aad (S.D.)Yield (S.D.)Aad (S.D.)Yield (S.D.)Aad (S.D.)
Rougher93.02 (3.92)12.24 (0.22)93.22 (3.11)12.30 (0.06)93.22 (2.75)12.25 (0.09)93.22 (0.54)12.29 (0.18)
Cleaner 181.7 (3.96)10.99 (0.04)83.56 (0.3)10.61 (0.23)79.83 (0.30)9.85 (0.16)67.39 (2.18)9.38 (0.06)
Cleaner 270.78 (3.4)9.71 (0.09)76.72 (5.5)9.77 (0.14)64.50 (5.3)8.85 (0.29)43.92 (2.95)7.98 (0.14)
Cleaner 361.08 (0.57)8.84 (0.24)70.26 (4.41)9.19 (0.29)47.70 (1.21)8.06 (0.01)
Cleaner 453.66 (5.49)8.38 (0.01)61.78 (1.64)8.74 (0.17)26.83 (3.21)7.24 (0.20)
Cleaner 545.83 (1.62)8.01 (0.09)
Cleaner 639.63 (2.00)7.81 (0.20)
Table 5. Flotation performance of multi-stage flotation circuits of the flotation column (%).
Flotation CircuitPulp Density of the Cleaner 1 Flotation Process (g/L)
6030
YieldAadYieldAad
Rougher94.53 (2.10)11.52 (0.15)94.27 (0.37)11.39 (0.28)
Cleaner 193.33 (0.92)10.67 (0.02)92.00 (2.17)9.87 (0.25)
Cleaner 292.41 (4.62)10.12 (0.28)89.97 (1.49)9.09 (0.02)
Cleaner 391.91 (1.60)9.89 (0.25)77.53 (1.99)7.97 (0.29)
Cleaner 488.87 (0.52)9.10 (0.27)
Cleaner 583.90 (1.05)8.53 (0.05)
Table 6. Summary of the parameters from Equation (1) as fitted to the data in Figure 7.
ParameterPulp Density of the Cleaner 1 Flotation Process (g/L)
Mechanical Flotation CellFlotation Column
15010050256030
GMax0.970.960.940.960.920.92
GNF<0.001<0.001<0.001<0.0010.130.14
b0.04540.03870.02910.04090.00140.0018
R20.800.940.600.950.980.99

