Silica Colloid Ordering in a Dynamic Sedimentary Environment


Institut für Geologische Wissenschaften, Freie Universität Berlin, Malteserstrasse 74-100, 12249 Berlin, Germany
*
Author to whom correspondence should be addressed.
Minerals 2018, 8(1), 12; https://doi.org/10.3390/min8010012
Submission received: 1 December 2017
/
Revised: 4 January 2018
/
Accepted: 4 January 2018
/
Published: 7 January 2018
(This article belongs to the Special Issue Mineralogy of Quartz and Silica Minerals)
Abstract
:The formation of ordered particle arrays plays an essential role in nanotechnology, biological systems, and inorganic photonic structures in the geosphere. Here, we show how ordered arrays of amorphous silica spheres form in deeply weathered lithologies of the Great Artesian Basin (central Australia). Our multi-method approach, using optical and scanning electron microscopy, X-ray microdiffraction, Raman spectroscopy, and electron probe microanalysis, reveals that particle morphologies trace the flow of opal-forming colloidal suspensions and document syn- and post-depositional deformation. The micromorphology of amorphous silica pseudomorphs suggests that the volume-preserving replacement of non-silicate minerals proceeds via an interface-coupled dissolution precipitation process. We conclude that colloid flow and post-depositional shearing create but also destroy natural photonic crystals. Contrary to previous studies, our results indicate that purely gravitational settling/ordering is the exception rather than the rule during the formation of three-dimensional periodic sphere arrays in the highly dynamic colloidal suspensions of chemically weathered clastic sediments.
1. Introduction
The hydrated mineralogical assemblages of the Great Artesian Basin (central Australia) record the acidic oxidative weathering of volcaniclastic sediments on a multimillion-year time scale [1]. Chemical weathering of the silicate rocks induces the in situ formation of amorphous silica at silicate mineral surfaces [2] and the release of silica into solution, followed by amorphous nanoparticle precipitation through inorganic processes [3]. Scanning electron microscopy shows that nanosphere-based amorphous silica (opal-A) in central Australia consists of subparticles tens of nanometers in size, indicating aggregative particle growth [4,5,6,7]. Ordering of the final silica spheres leads to the formation of a natural photonic crystal that modulates visible light due to Bragg diffraction. In precious opal-A, uniform spheres form a regular three-dimensional array that diffracts visible light, giving the characteristic play-of-color [8,9], which is absent in common opal-A. So far, the formation of ordered sphere lattices in fractures and pores of the host rocks and during mineral replacement has been attributed to gravitational sphere settling [1,4,5,10,11]. All of these models agree that gravity and short-range particle interaction potentials create structural order when uniform spheres form in a gel and sediment from or through it at quiescent conditions in sealed environments. This classical theory contrasts considerably with the abundant presence of opal-bearing hydraulic fractures, viscous colloid flow textures, opal reactivation structures, and nanoscale replacement processes in the subsurface precious opal deposits [1,6,7,11]. These characteristics demonstrate the highly dynamic environment that produces ordered arrays of uniform, X-ray amorphous silica spheres. In this study, we use a multi-method analytical approach to identify the mineralogical and micromorphological characteristics of these ordered arrays in two different contexts: fracture infilling and replacement. These new data allow us to provide a coherent interpretation of particle ordering processes that are consistent with the dynamic environment. Our results contradict the classical theory of gravitational sphere settling at quiescent conditions in sealed environments.
2. Materials and Methods
2.1. Sample Material
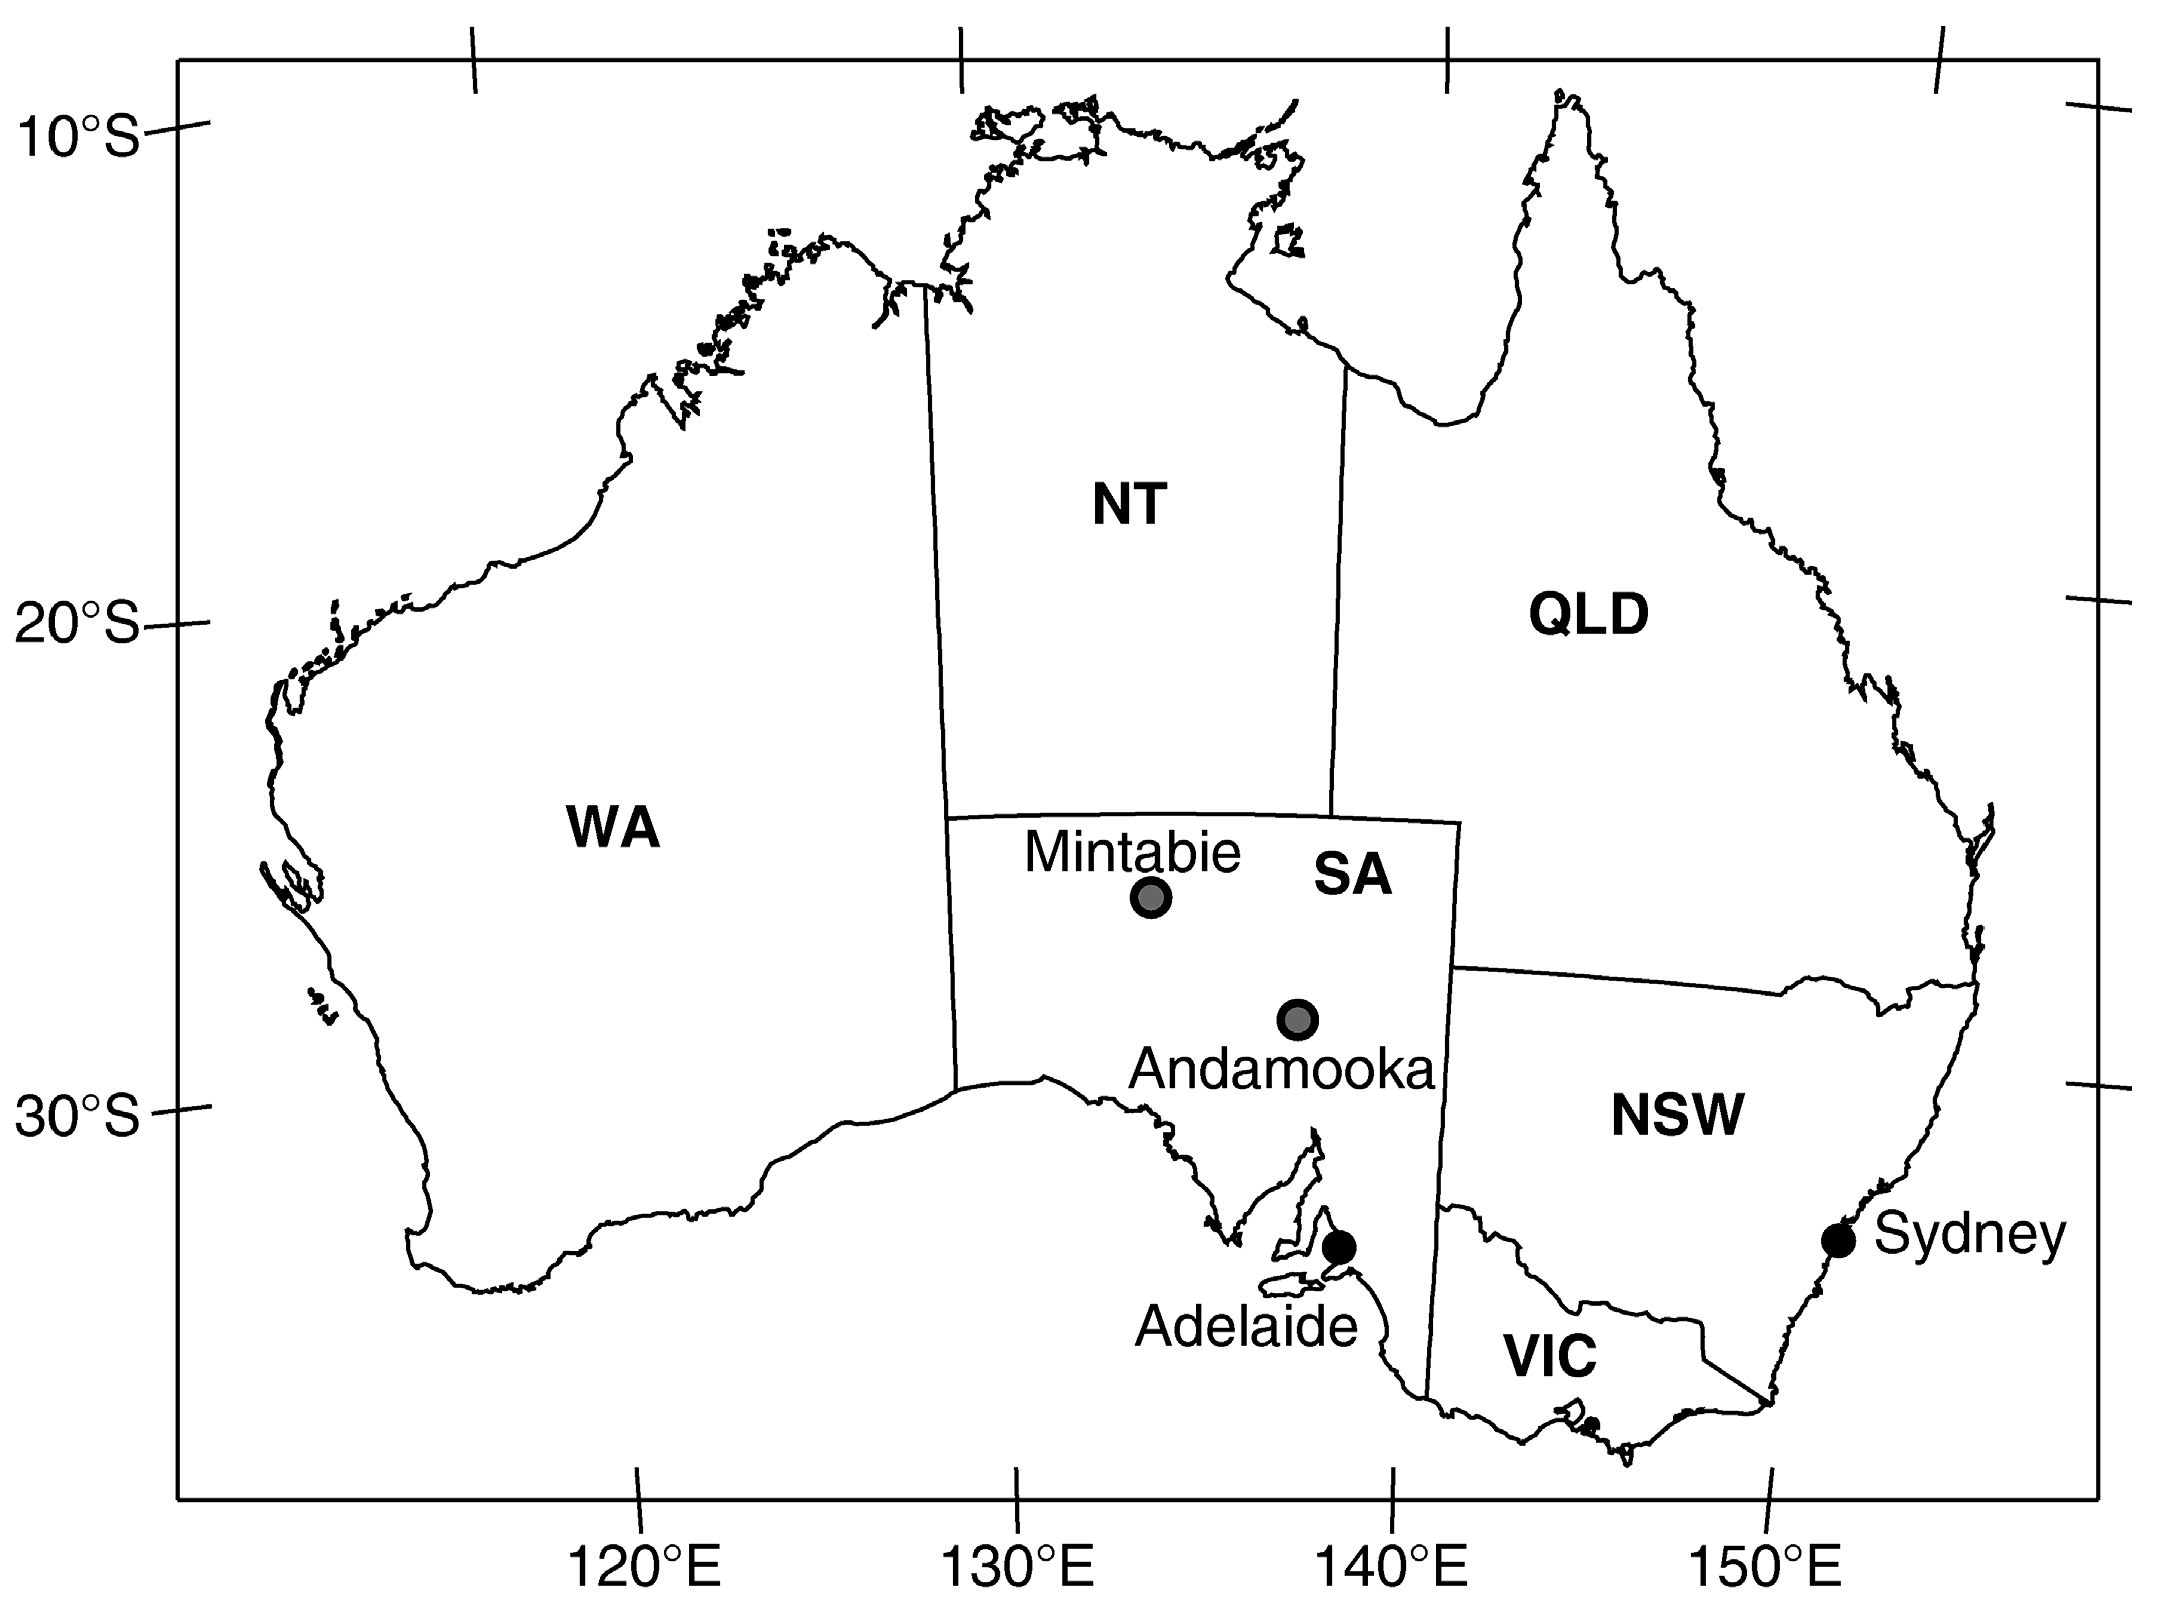
Australian opals and their host rocks were collected from the precious opal fields (Figure 1) at Andamooka and Mintabie (South Australia) and analyzed using petrographic microscopy, X-ray microdiffraction, Raman spectroscopy, scanning electron microscopy, and electron probe microanalysis. From a total of 82 samples from Andamooka and 13 samples from Mintabie, we selected 22 and 6 samples, respectively, based on textural and mineralogical characteristics, for in-depth analyses. Andamooka opal samples are associated with the deeply weathered early Cretaceous sediments of the Marree Subgroup [1,12]. Samples were extracted from the bleached Early Cretaceous Bulldog Shale (~20 m beneath the surface) in the Teatree Flat field, which is located about 15 km northwest of the Andamooka Township.
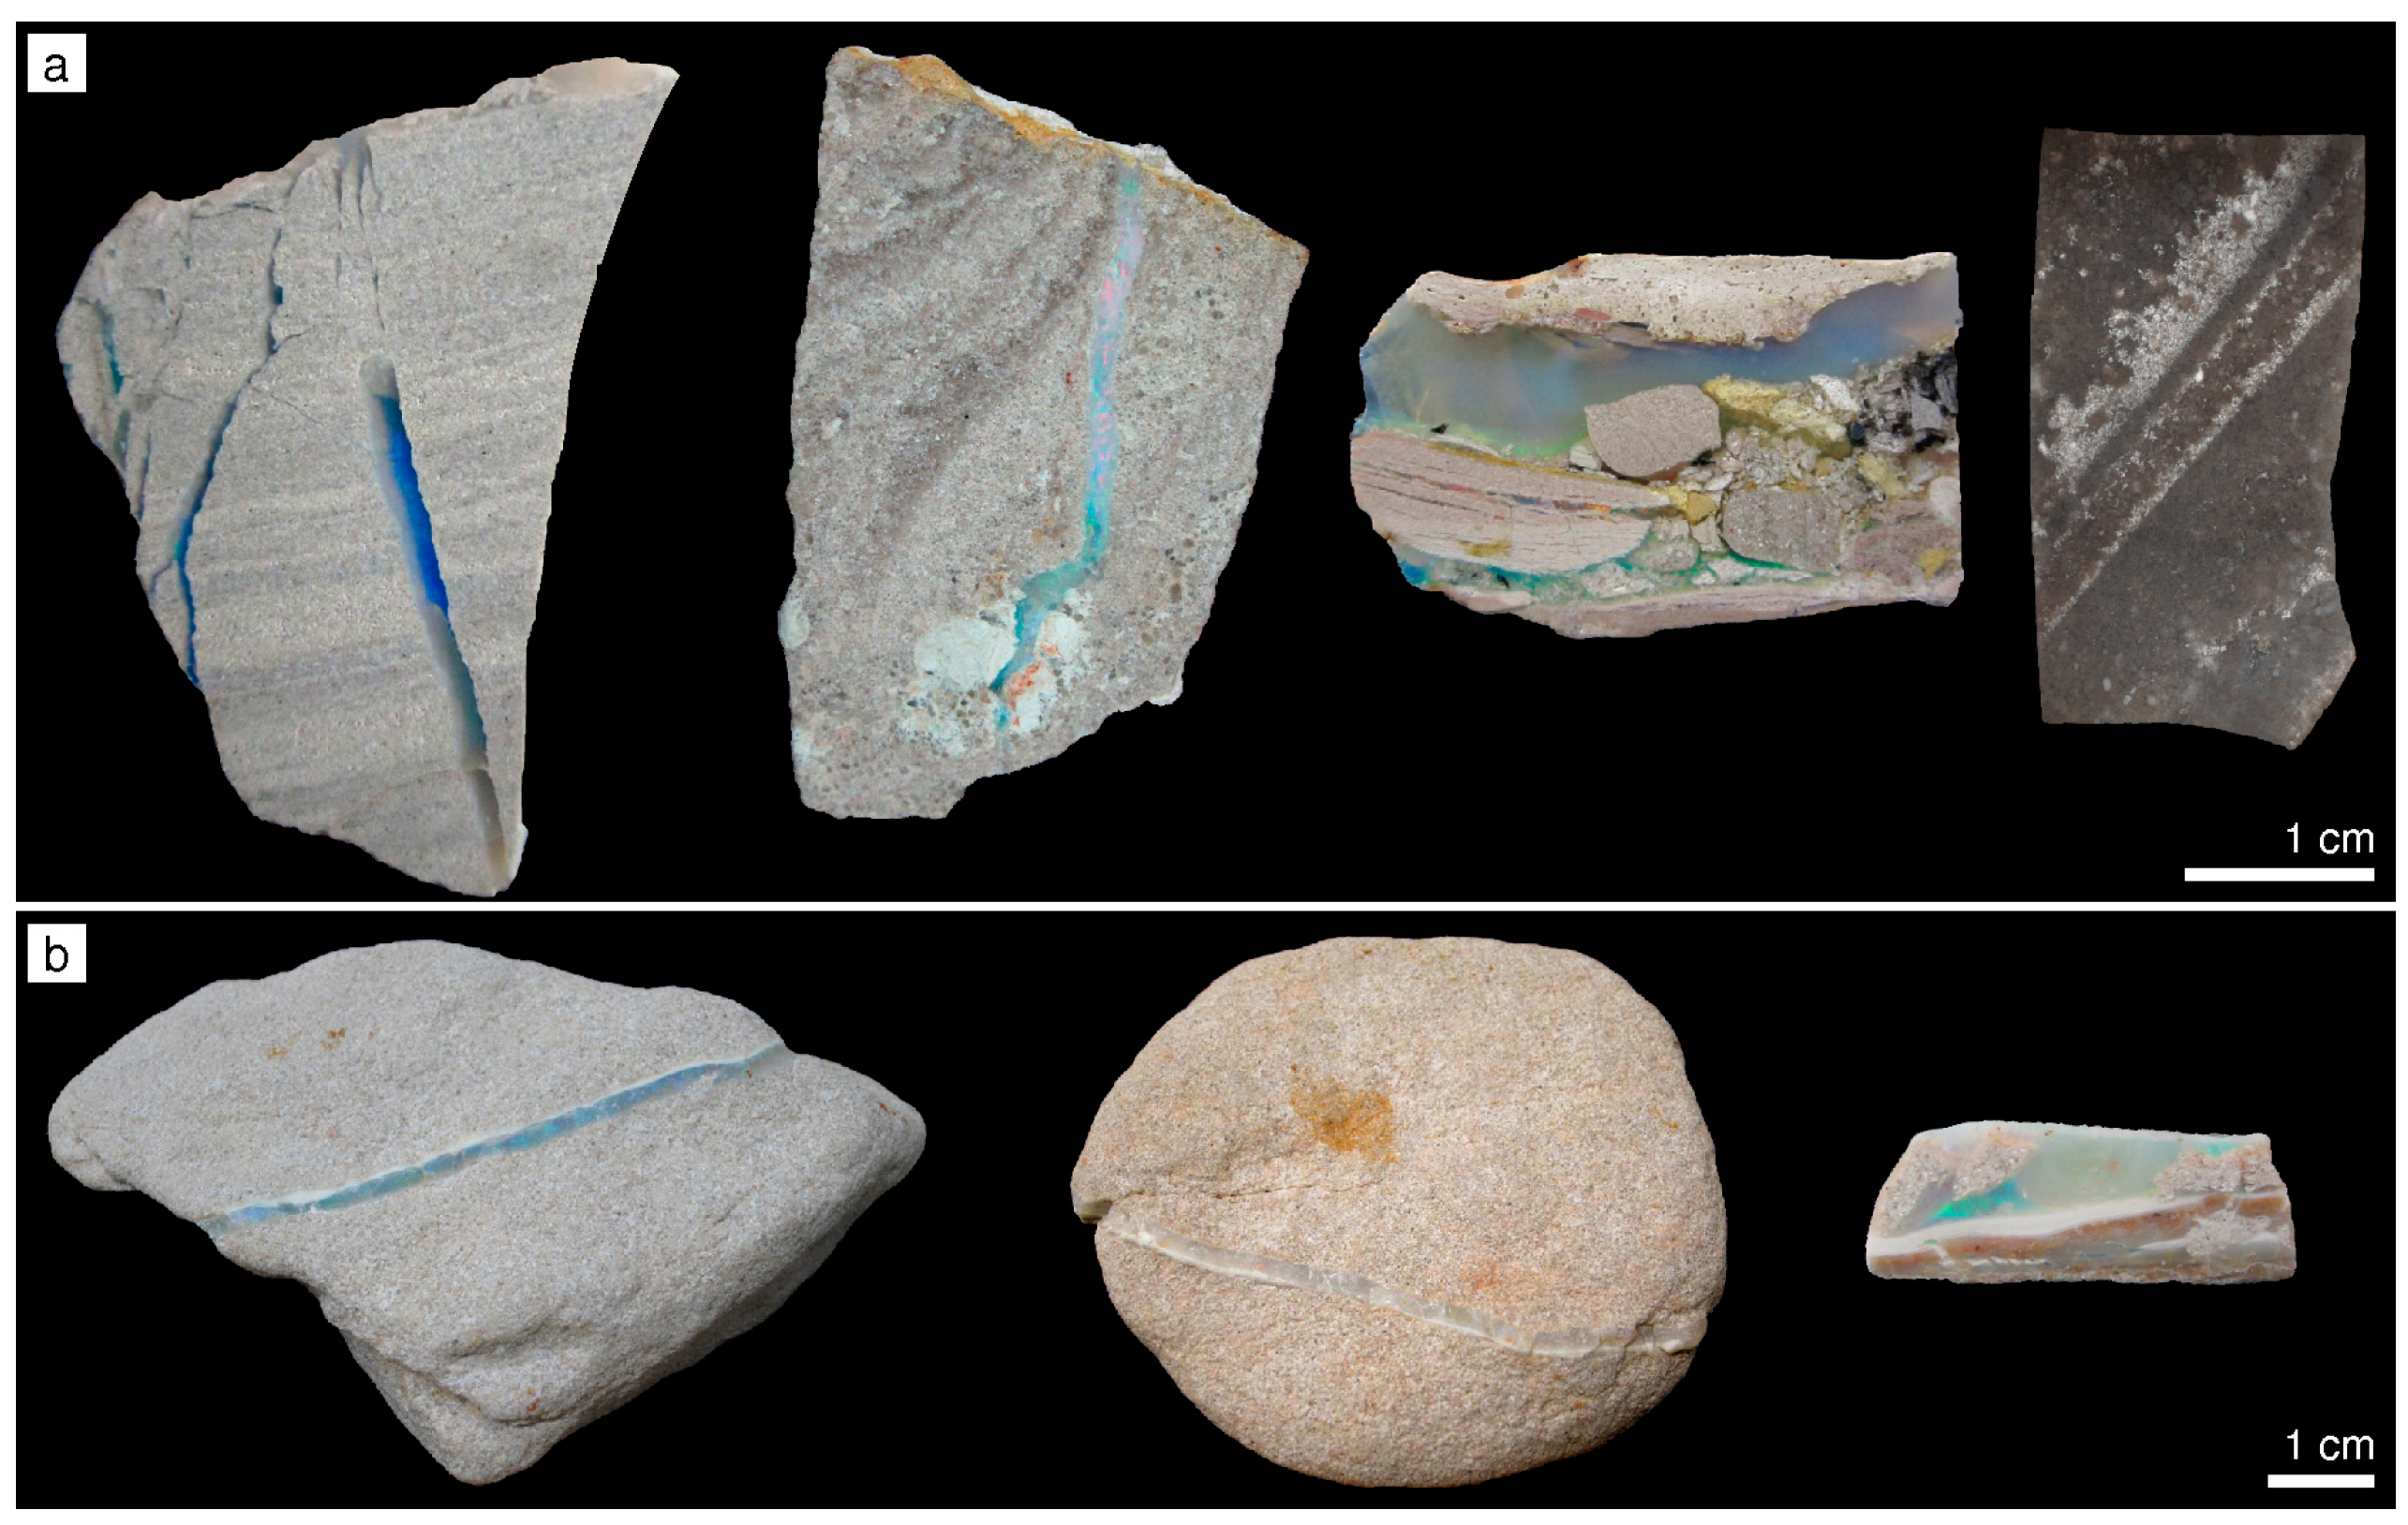
Silicified sample material from Andamooka comprises silt- and sandstones, conglomerates, and cherts with oolitic structures (Figure 2a). Opaline material fills extensional fractures and pseudomorphically replaces rhombohedral and twinned crystals. The fracture-filling opals from Mintabie are exceptional because they are hosted by tightly cemented, microcline-rich Ordovician sandstone of the Mintabie beds (Figure 2b; [2]). These samples are typical for the deepest parts of the opal-bearing profiles in the Mintabie field [2]. Opals analyzed in this study include gray, milky, white, brown, and transparent samples. Precious opals are transparent with a play-of-color covering the visible spectrum.
2.2. Analytical Methods
Diamond-polished thin sections (30 µm thick) and thick sections were prepared using standard procedures. For polarized light microscopy, a Zeiss Axio Lab.A1 petrographic microscope (Carl Zeiss, Jena, Germany) was used. At least 40 intersection angles between thin straight lines in single photonic crystals were measured digitally and averaged.
The micromorphology of opals and their host rocks was investigated on the surfaces of thin and thick sections and freshly fractured material by SEM. Specimens were etched in 10 vol % hydrofluoric acid (HF) solution for 15 s, dried, and sputter-coated with ~15 nm W. Secondary electron (SE) images were obtained in a Zeiss Supra 40 VP Ultra SEM instrument (Carl Zeiss, Jena, Germany), at an acceleration voltage of 5 kV and a beam current of 10 nA. Sphere diameters were determined by sizing over 1000 particles from secondary electron images. The sphere diameter dispersity has been calculated as relative standard deviation.
Quantitative element concentrations were determined on carbon-coated, polished thin sections using a JEOL JXA 8200 Superprobe operated at 15 kV accelerating voltage, 20 nA beam current, and a beam diameter of 10 μm. For each opal specimen, 30 point analyses were measured. The acquisition time for Na analysis was 5 s on peak and 5 s on background. The peak and background of other elements were measured for 10 s each. The instrument was internally calibrated using natural silicate, oxide, and basalt (VG-2) and rhyolite (VG-568) glass. Elemental maps were acquired using the wavelength dispersive spectrometer (WDS) detectors. The operating conditions were a 15 kV accelerating voltage and a 20 nA beam current (on Faraday cup), with a beam diameter of 1 µm and a 60 ms counting time per 0.5–1 µm pixel size.
Non-destructive X-ray microdiffraction was used on polished thick sections, at the Eberhard Karls Universität Tübingen (Tübingen, Germany), with a Bruker AXS micro-X-ray diffractometer D8 Discover (Bruker AXS GmbH, Karlsruhe, Germany) with focusing X-ray optics (IfG Berlin, Berlin, Germany; incidence angle of 10°), a HOPG-monochromator, and a large VÅNTEC-500 2D-detector (µ-XRD2). Diffractograms were recorded for 300 s at a beam diameter of 50 µm in the 2θ range of 7–67°, using CoKα radiation (λα1 = 1.78897 Å) at 30 kV and a tube current of 30 mA. The step size of the diffractogram was 0.05° 2θ. We analyzed X-ray diffraction patterns with PeakFit 4 (Systat Software, San Jose, CA, USA). After a manual baseline subtraction, we used a five-point Savitzky–Golay moving filter [13] to smooth the diffraction pattern and minimize human bias in peak maxima determination. Diffractograms, peak positions, and the full width at half the maximum intensity (FWHM) are expressed as d-spacing (in Å) calculated from the diffraction angles (° 2θ) to facilitate the comparison of diffractograms recorded with different anode material.
Raman spectroscopy analyses were conducted on a Horiba Jobin Yvon LabRAM HR 800 instrument (Horiba Jobin Yvon, Bensheim, Germany) coupled to an Olympus BX41 microscope (Olympus, Hamburg, Germany) at the Museum für Naturkunde (Berlin, Germany). A 785 nm air-cooled diode laser was used to excite the sample with a 100× objective, a spectral integration time of 60 s, and three accumulations. With the Peltier-cooled charge-coupled device (CCD) detector (1024 × 256 pixels), a spectral resolution of ~0.2 cm−1/pixel is achieved. Scattered Raman light was collected in backscattering geometry and dispersed by a grating of 600 grooves/mm after passing through a 100 µm entrance slit. The confocal hole size was set to 1000 µm. Unpolarized spectra were collected with the Labspec 6 software over a range from 100 to 1200 cm−1. An internal intensity correction (ICS, Horiba) was used to correct detector intensities. The instrument was calibrated using the Raman band of silica at 520.7 cm–1.
3. Results
3.1. Opal Mineralogy
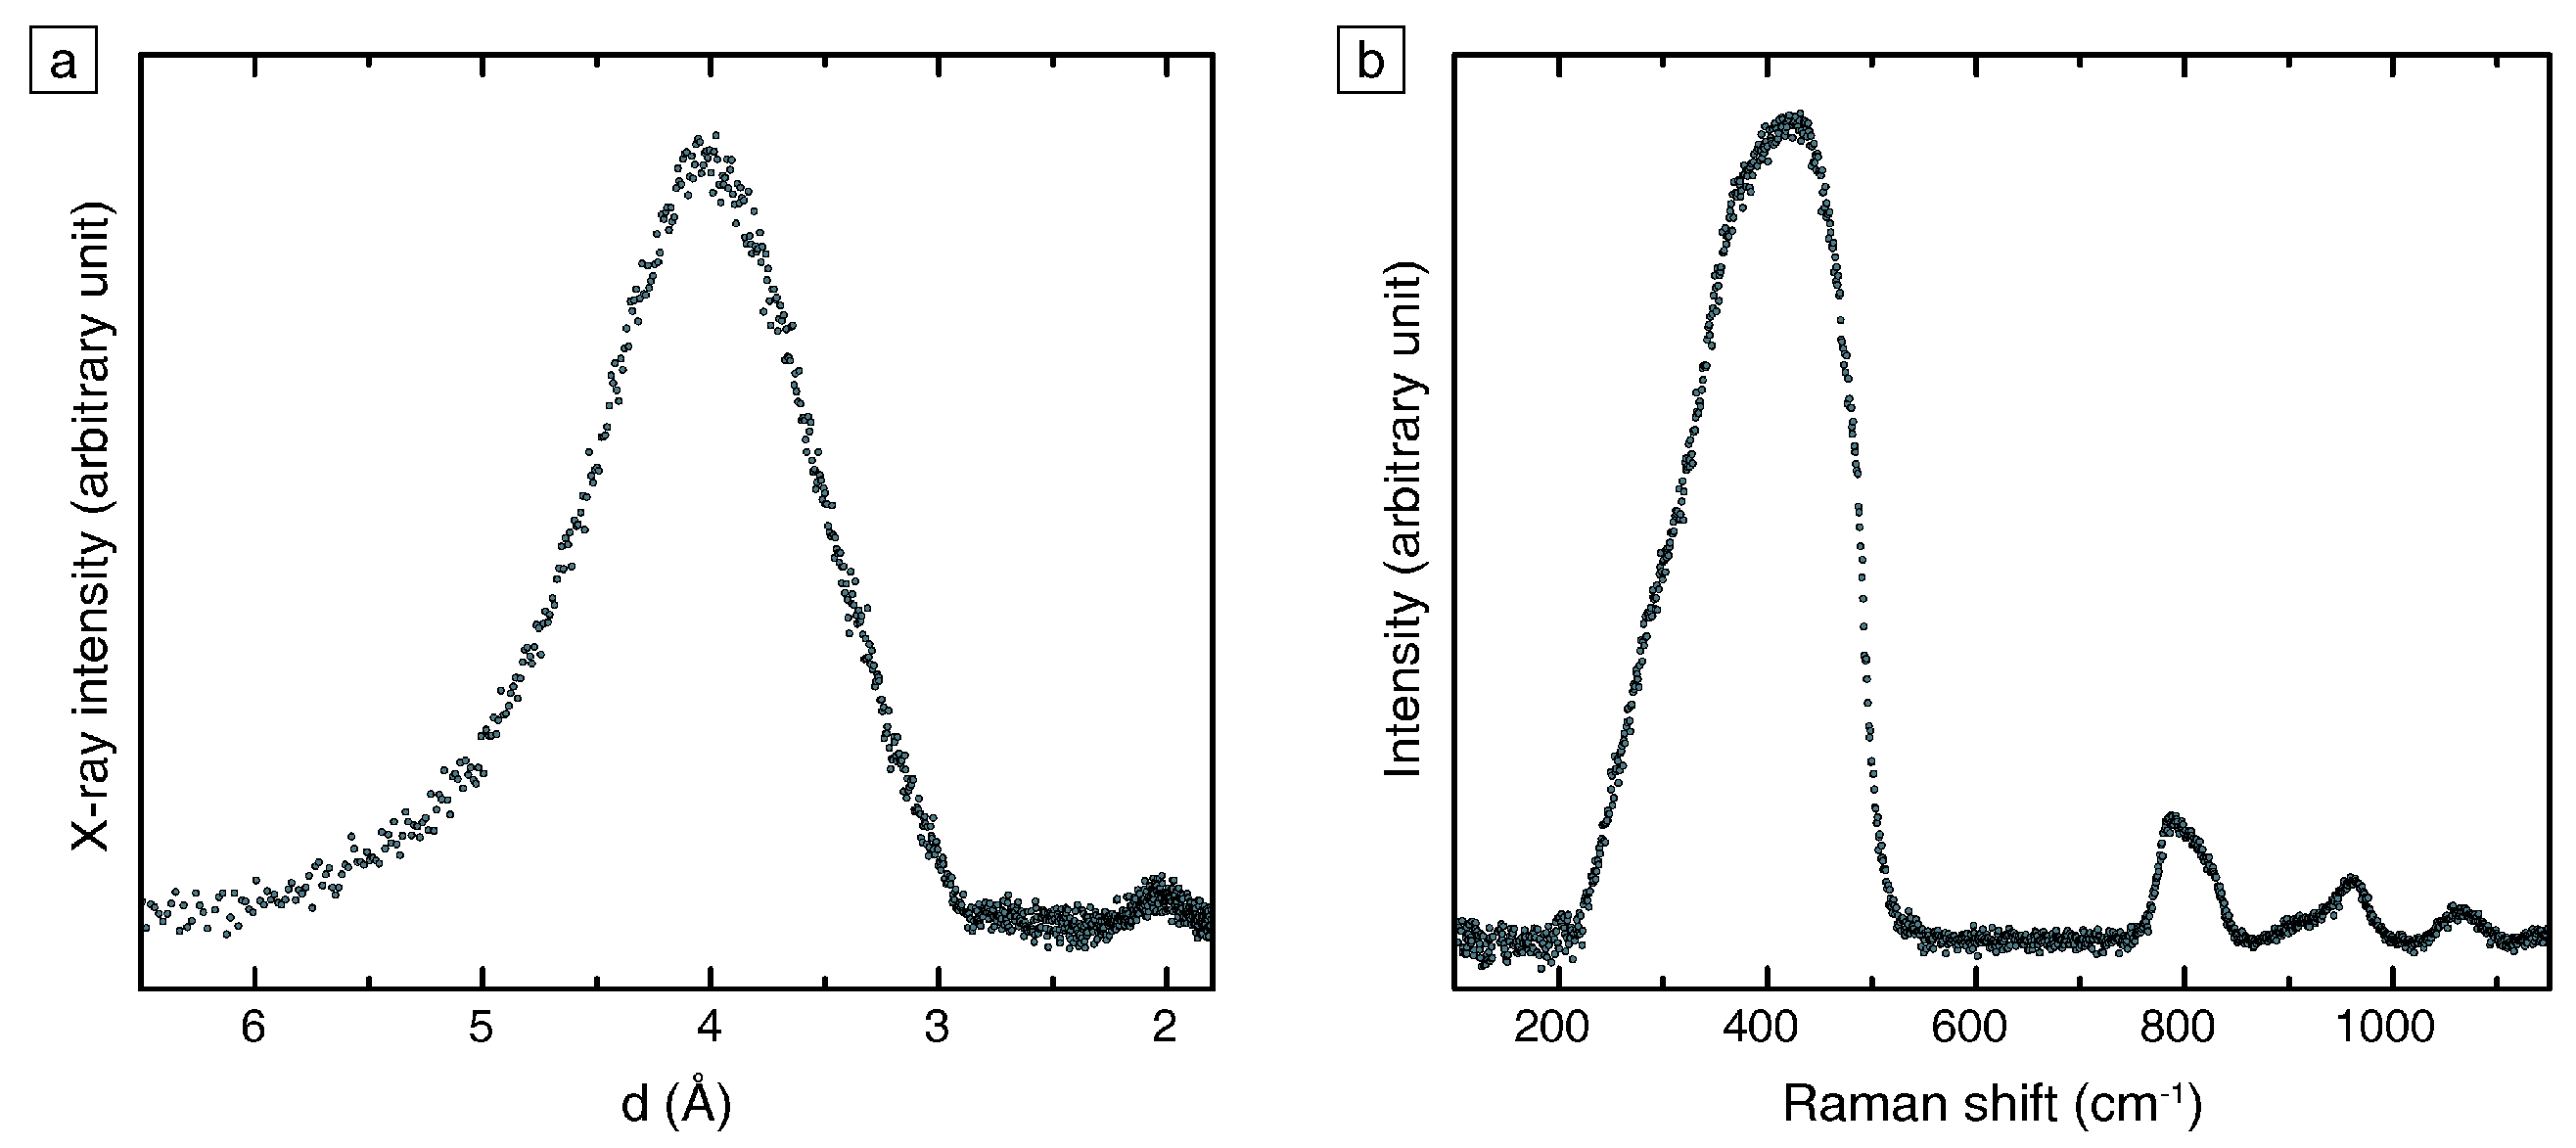
We used X-ray microdiffraction and Raman spectroscopy to identify the mineralogy of fracture-filling and replacive opals. The typical X-ray microdiffraction pattern of the studied opals is shown in Figure 3a. The diffractograms, expressed as a function of d-spacing, generally show a broad asymmetric peak with a maximum ranging between 3.97 and 4.06 Å and a high d-spacing side shoulder. A secondary broad reflection of low intensity occurs at ~2 Å. The full width at half-maximum intensity (FWHM) of all samples scatters unsystematically from 1.07 to 1.19 Å and is independent of the main peak position. The maximum intensity of the main peak varies unsystematically by less than 5% between samples. According to the Jones and Segnit [14] opal classification scheme, the diffractograms of all samples are consistent with those of opal-A. The peak shapes and positions are uniform within individual samples, including those composed of intermingled composites of precious and common opal. Overall, we found no co-variation between peak shapes/positions and the visual appearance, micromorphology, or chemical aspects of the studied material.
Figure 3b shows a typical Raman spectrum of the studied opals. The spectra and band maximum positions of opals at all sites are similar and display a prominent band at 425 ± 3 cm−1 and bands of lower intensity at 791 ± 1, 961 ± 2, and 1067 ± 3 cm−1. The bands at 425 and 961 cm−1 show a positive skewness, while the band at 791 cm−1 shows a negative skewness. These asymmetries are likely due to the superposition of separate bands with different shapes and positions. Previous studies assigned the Raman bands at ~425, 791, and 1067 cm−1 to fundamental vibrations of the SiO amorphous silica framework [15]. The band at ~961 cm−1 indicates a Si-OH stretching mode due to silanol groups [16]. The Raman spectra of all samples are consistent with those of opal-A [17] and lack a correlation between chemical composition, micromorphological features, and peak shapes and positions obtained from the X-ray diffraction analyses.
3.2. Colloid Flow Structures in Fractures
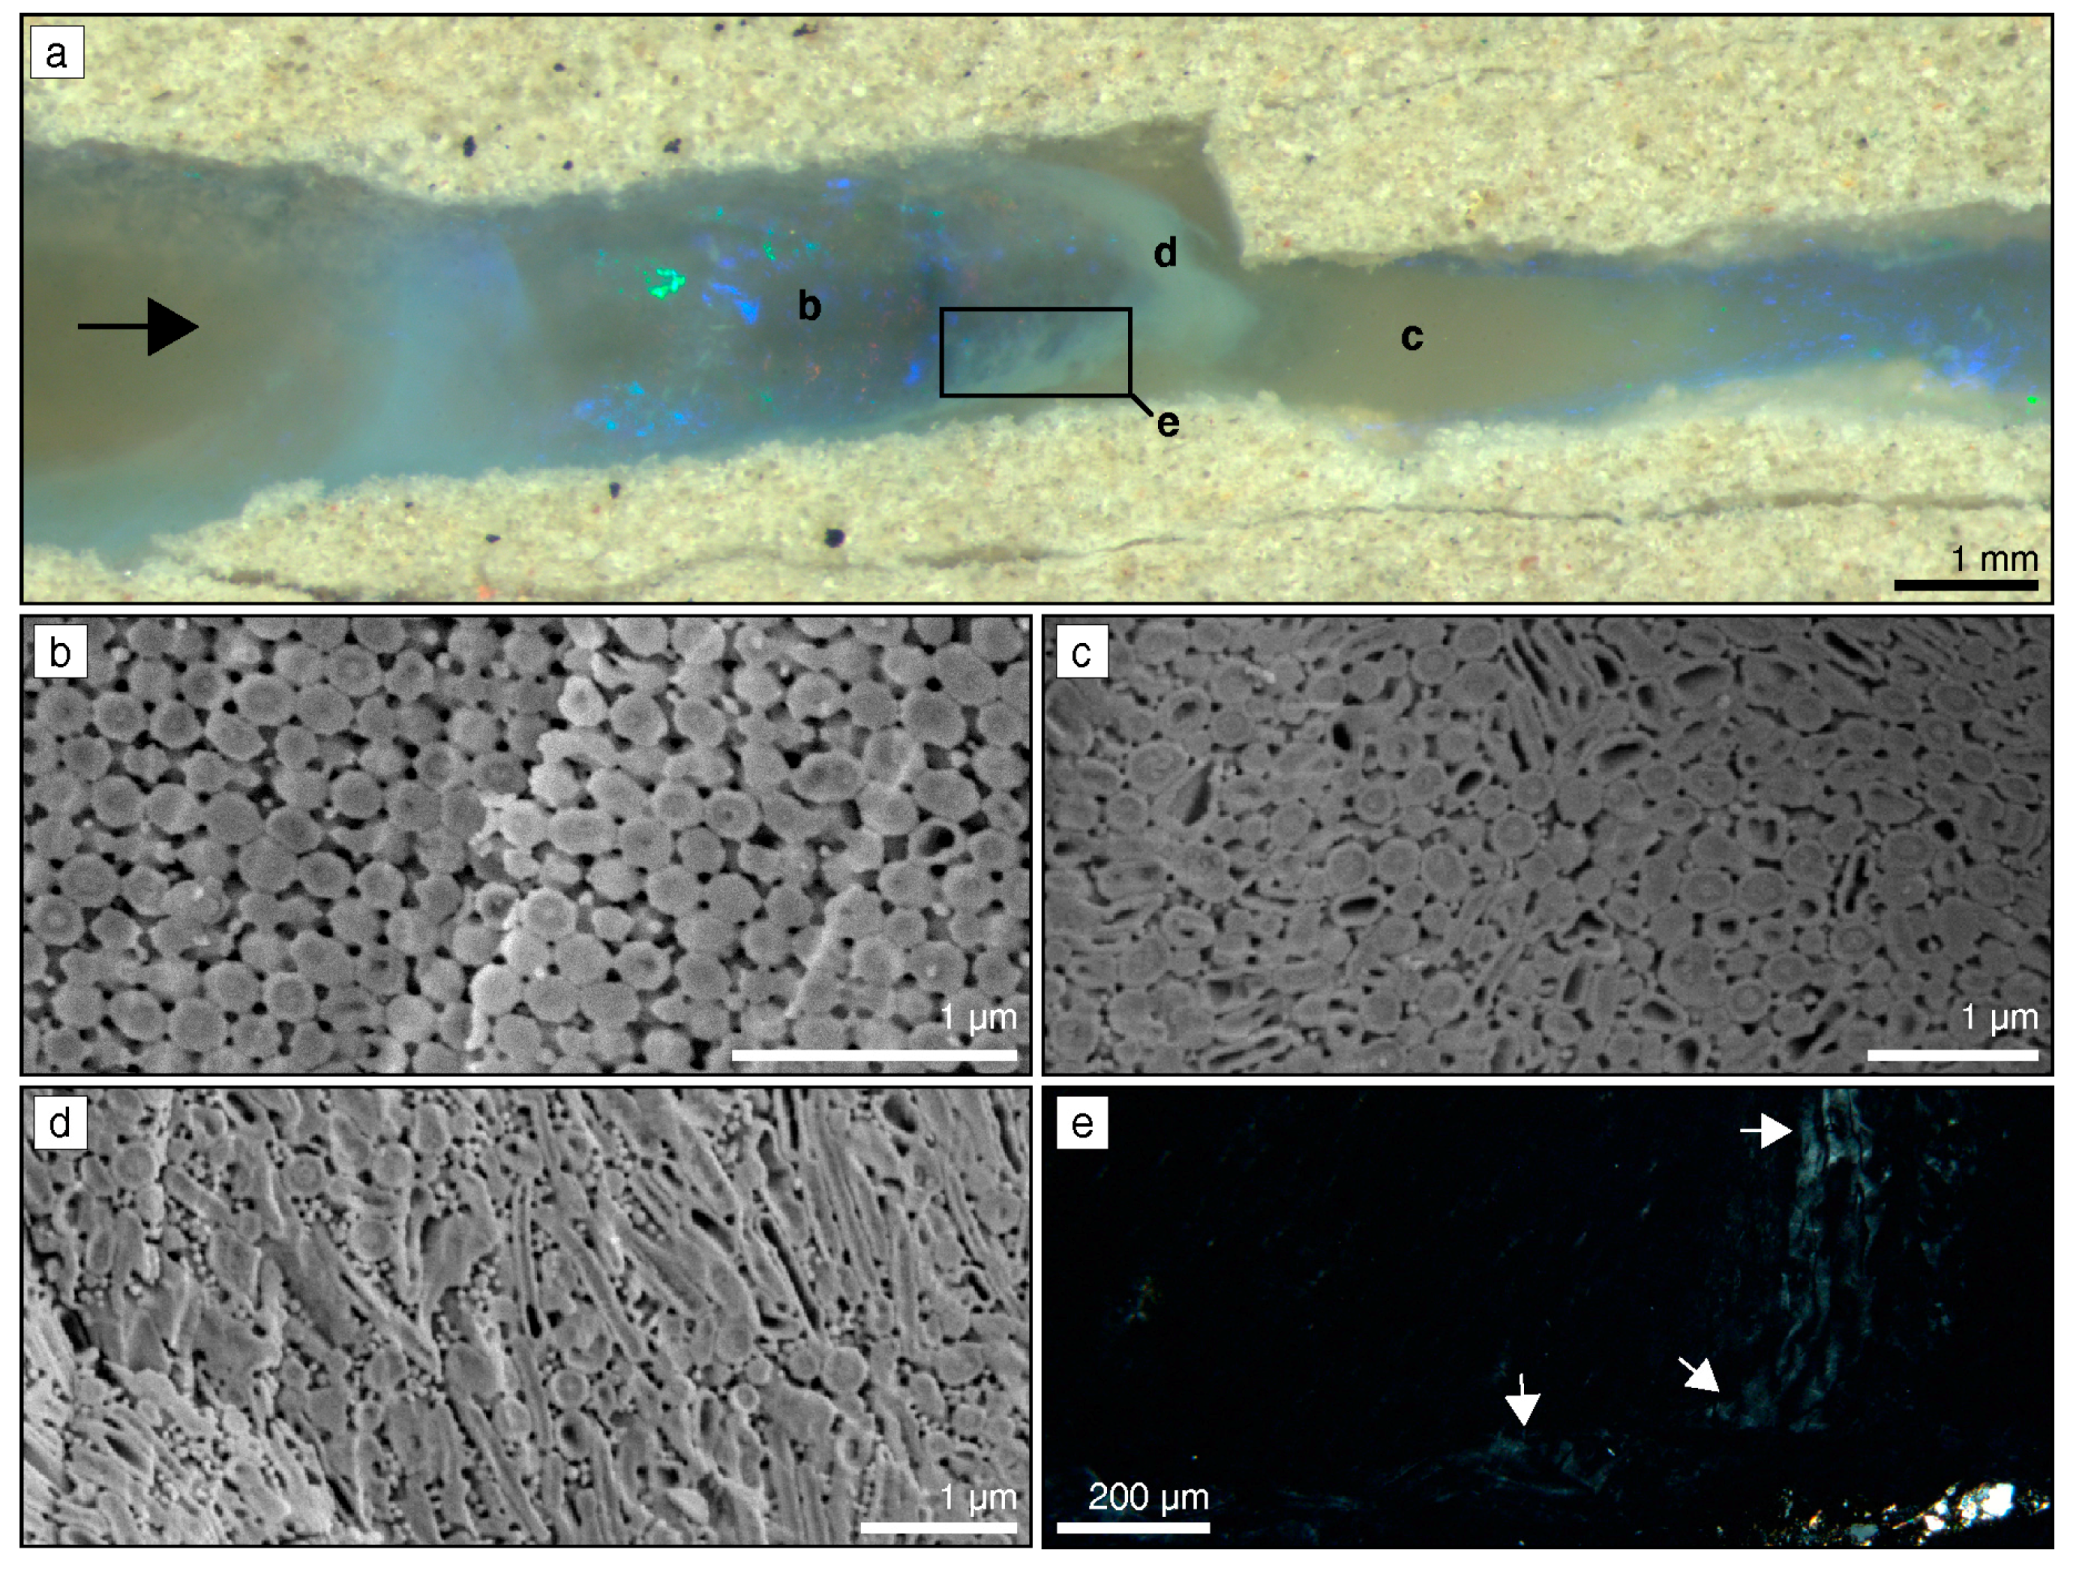
SEM images of vein-filling opal-A show that macroscopic opal characteristics directly link to micromorphological features (Figure 4). Hydraulic extensional fractures contain alternating zones of precious and common opal with variable color and parabolic interfaces pointing toward fracture tips. In these geometries, transparent opals with a play-of-color consist of regularly arranged, uniform spheres ranging in size from 160 to 440 nm. Irregularly arranged spheres with a size of 100–300 nm and minor nonspherical particles form the adjacent translucent common opals. The sphere diameters in translucent common and transparent precious opal are similar (±10 nm) within each sample. The white and milky common opal consists of non-uniform, round to ellipsoidal particles up to 1 µm in length, with a maximum aspect ratio of 0.25. These particles are elongated parallel to the fracture surfaces and parabolic interfaces between adjacent opals. Areas with accumulated, oriented ellipsoidal particles frequently display a moderate first-order grey birefringence between crossed polarizers (Figure 4d). The sequences of vein-filling opal with parabolic interfaces lack chemical or structural (determined by X-ray microdiffraction and Raman spectroscopy) gradients.
The fractures in opal-indurated sandstones of the Mintabie field commonly contain veins of transparent opal intermingled with wave-shaped, layered white opal (Figure 5). These wave features are concentric and resemble unflattened roll-up structures [18]. Minute-sized (<1 µm) kaolinite flakes are embedded in the material and remnants of the host rock are located on its surface. The white opal consists of irregularly arranged, non-uniform spheres <300 nm in diameter and contains randomly scattered, sphere-lined pores, ~0.4 to 3.5 µm in diameter (Figure 5b). These pore architectures are also widespread in the white opal from Andamooka. Wedge-shaped photonic crystals with thin parallel striations and spindle-shaped extensional fractures are located between roll-up structures (Figure 5c). A sharp interface separates the regularly ordered regions from transparent opal composed of dominantly uniform but irregularly arranged spheres (Figure 5d). The chemical composition of the white and transparent opal and the host rock cement varies insignificantly (Table 1).
3.3. Carbonate Replacement Structures
Transmitted light microscopy reveals that fractures in silicified siltstones contain an- to subhedral, randomly oriented, optical photonic crystals up to 1.5 mm in size (Figure 6a). Observation between crossed polarizers reveals parallel striations (3 to 180 µm wide) that mimic polysynthetic twin lamellae on trigonal {018} indicative of recrystallized calcite. The twinned condition of the lamellae is visible as a periodic color variation that changes both color and intensity upon rotation on the microscope stage. The color variations arise from Bragg diffraction effects from close-packed, uniform silica spheres and air-filled pores with rhythmically changing orientation (Figure 6b). The average sphere diameter varies between samples from 200 to 320 nm (size dispersion <4%). X-ray microdiffraction, Raman spectroscopy, and elemental mapping confirm the amorphous nature of the opaline material and indicate the absence of crystalline precursor remnants.
Randomly oriented, opal-filled rhombohedra (<120 µm) are abundant in quartz- and opal-cemented cherts containing round to ellipsoidal oolitic structures (Figure 6c–e). These samples are likely reworked fragments of Cambrian age Andamooka Limestone [19]. The ooids range in size between 200 and 600 µm and are composed of a uniform mosaic of up to 20 µm-sized, interlocked quartz crystals. Small (<2 µm), anhedral dolomite crystals (Ca1.1Mg0.9(CO3)2 on average) randomly scatter through the quartz mosaic. In transmitted light, opal rhombohedra resembling dolomite rhombs consist of inclusion-free transparent to brown opal-A with variable micromorphology. A homogeneous amorphous silica veneer (~60 nm) covers the inner surface of the rhombs (Figure 6d). Transparent common opal inside the rhombohedra consists of 200–300 nm large, uniform spheres in a predominantly irregular arrangement. Precious opal is composed of similar-sized, but close-packed spheres. Dark brown rhombohedra consist of inverse opal with a regular arrangement of spherical void spaces surrounded by solid walls of opal-A (Figure 6e).
The sandstones of the Mintabie field contain abundant microperthitic microcline partially or entirely altered to translucent opal and/or kaolinite flakes (Figure 5e,f). Aggregates of submicrometer-sized kaolinite platelets and non-uniform silica spheres 120 to 270 nm in diameter fill the dissolution cavities in relictic feldspar grains. The opal-replaced cavity walls resemble fused spheres and occasionally contain subparticles ~50 nm in diameter.
3.4. Polyhedral Particle Shapes and Crystal Bending
Opal-A from all sample localities consists of silica particles with variable size, shape, ordering, internal structure, and degree of cementation. Close-packed particle arrays often consist of grains with a polyhedral shape (Figure 7a). A mild HF etching of these polyhedral spheres reveals a concentric structure composed of subparticles 20–40 nm in diameter. This subparticle structure is common to all opals studied here, irrespective of their fracture-filling or replacive nature, shape, or chemical composition.
Vein-filling common opal frequently contains anhedral photonic regions with uniform color between crossed polarizers. These crystals often display two sets of intersecting thin black lines less than 1 µm wide (Figure 7b). Straight lines form diamond shapes and intersect at an angle of 70.2 ± 1.1°. However, in most grains, these lines are bent to a variable degree. Locally, the photonic crystals display extensional fractures filled with irregularly arranged spheres.
4. Discussion
Scattering of visible light on the microstructurally diverse opal-A studied here creates color profiles that coincide with micromorphological characteristics, e.g., particle ordering and shape. Several authors have suggested that opal forms from a gel [1,4,5,10,11]. At quiescent conditions in sealed environments, uniform spheres are expected to grow inside this gel and settle gravitationally to form a regular sphere array, i.e., precious opal. However, such a gel matrix strongly immobilizes particles [20], impeding sphere growth, mobility, and arrangement into ordered arrays. Additionally, later particle mobility requires extensive breaking of interparticle bonds [21]. These restrictions equally apply to fracture-filling and replacive opal. In fact, the textural properties of the opals studied here and the aggregative grown single-particle structure point to precipitation and growth of spheres as free units in a sol rather than a gel. After sphere arrangement, dissolved silica from bulk solution or subparticle breakdown precipitates on the available surfaces and acts as a cementing agent [9,22].
4.1. Flow-Induced Ordering
The uniform direction of parabolic fronts in the vein opal indicates that fluid flow directs particles along a pressure gradient toward the fracture tip. The parabolic shape of the opal fronts resembles turbulent non-Newtonian flow velocity profiles [23] and indicates a strong coupling between colloid flow and structural ordering. This observation agrees well with non-Newtonian fluid flow textures preserved in vein opals in previous studies [1,11]. Apparently, colloid flow results in a hierarchy of particle packing, orientation, and deformation.
The uniform diameter of spherical particles in individual vein opal samples indicates that deformation occured when the spheres grew to their final size but were still deformable. The similar chemical composition, microdiffraction and Raman spectroscopic properties, and size of spherical particles point to a pre-existent reservoir of uniform spheres that entered the fracture upon opening. Nonspherical particle morphologies would form within this reservoir only under highly localized, substantially different physicochemical conditions [24]. During colloid ingress into the opening fracture, the pressure gradient forces the particles toward the fracture tip. The increase in particle number within the spatially restricted volume results in a local increase of the fluid’s viscosity and jamming of the particles without fusion of the spheres. The flow leads to structuring of the concentrated colloidal suspension and directional ordering of nonspherical particles. The birefringent character of parabolic fronts between crossed polarizers results from the flow-induced uniform orientation of flattened but regularly ordered particles [25].
The texture of Mintabie vein opals illustrates how a flowing colloidal suspension reactivates and deforms opaline structures. It is probable that the concentric roll-ups reflect re-orientation of earlier-formed opal by the current activity of the colloidal suspension. The structure of the reactivated opaline material suggests that the viscosity of this suspension was high enough to induce roll-up structures in cohesive material and keep ripped-up material suspended. Wedge-shaped photonic structures between roll-up structures (Figure 5) contradict a gravitational sphere settling and ordering process, because gravitational settling likely results in horizontally layered photonic structures with a similar orientation. Previous studies have suggested that composite gels with ordered and unordered domains migrate under differential pressure and preserve their structural order [1]. Accordingly, ordered domains should initially possess a complex wedge shape and orientation that fit its final position. However, ordered sphere lattices with a comparable shape are absent from all fracture-filling opal in the present study. This might indicate that the sphere lattice of wedge-shaped photonic regions results from a flow-induced sphere ordering process, analogous to the shear-induced ordering of a disordered colloidal suspension [26,27]. Thus, fluid flow locally transports the spheres into the correct position to create ordered lattices.
4.2. Mineral Replacement
Apart from the textural similarities of vein opals, the highly selective replacement of carbonate and clay minerals, wood, gypsum, fossils, and organic material by opal-A is frequently reported [1,6,12,28]. To date, the replacement of silicates and carbonate fossils by precious opal-A has been attributed to the infilling of cavities, resulting from partial or bulk dissolution, by a silica-rich gel [1,10]. This gel matrix inhibits particle growth and requires considerable bond breaking, analogous to the sphere-forming processes in fractures. Additionally, the pseudomorphs studied here lack evidence for the shrinkage or layering that may indicate gel desiccation or changes in gel composition [10], respectively. These restraints imply that another process induces structural order during pseudomorphic replacement.
The twinned photonic crystals evidence that carbonate replacement is intimately coupled to the precursor crystallographic orientations. Replacement along lattice planes of the precursor crystal ensures the constant physicochemical conditions that are required for uniform sphere sizes, shapes, and arrays [7]. The dissolution reaction creates a sharp localized pH and salinity increase [29] that gradually decreases toward the bulk fluid. This local change lowers the amorphous silica solubility, induces supersaturation and precipitation [21], and confines particle nucleation close to the moving calcite dissolution front. In this interface-coupled dissolution-precipitation process [7,30], the precursor dissolution and silica deposition fronts advance synchronously. During the replacement process, silica nanoparticles continuously nucleate, aggregate, and form close-packed planes parallel to the most stable lattice planes of the crystalline template (Figure 8). The particle size increases at increasing distance from the dissolution front. The nanoporous close-packed sphere geometry (~26% porosity) is permissive and enables mass transport and permanent fluid access to the calcite dissolution front. The textures and random orientation of the crystal pseudomorphs indicate that gravitational settling is negligible in this case. Our observations further show that carbonate precipitation in extensional fractures locally precedes precious opal formation.
Generally, the microstructure differs between pseudomorphs after silicate minerals (e.g., feldspar) and non-silicates (e.g., carbonate and sulfate minerals). While close-packed sphere arrays replace carbonates and sulfates [2,7], pseudomorphs after feldspar consist of non-uniform spheres in dissolution cavities (Figure 5f). These pseudomorphs are the porous products of the short distance transport and polymerization of dissolved silica. This silicate replacement process does not produce precious opal, due to the small volume fraction of spheres, unless an external source provides additional silica in solution.
Preservation of twin structures in photonic crystal assemblies appears to be a reliable indicator for a replacive interface-coupled dissolution-precipitation mechanism, but the replacement of untwinned crystals is not as straightforward. We observe that randomly oriented rhombohedra consist of ordered uniform spheres. Gravitational sphere settling may fill pseudomorphs but will result in irregular rim structures, horizontal layering, and a late, disordered horizontal region due to limited late-stage particle mobility. Partial infilling of pore space may indicate bulk dissolution of the precursor material. Precious opal in the rhombohedral pseudomorphs studied here lacks all these microstructural features. More likely, close-packed sphere arrays in pseudomorphs predominantly form by an interface-coupled dissolution-precipitation process. This process creates the structural perfection of replacive precious opal compared to those formed by sphere sedimentation.
4.3. Post-Depositional Lattice Deformation
Dislocations and polyhedral particle shapes in ordered sphere arrays indicate post-depositional deformation (Figure 7). At a small shear force, the deformation of soft, ordered spheres into polyhedra decreases pore space and induces a blue-shift of the diffracted light [31]. Therefore, sheared sphere arrays may preserve their long-range order but lose their optical photonic character. At higher shear forces, colloidal crystals can form dislocations or break [32]. Previous studies have shown that dislocations in face-centered cubic (fcc) sphere arrays are visible as permanently extinct lines between crossed polarizers [1,7]. This microscopic observation results from isotropic light scattering on the locally imperfect structure. In the present study, straight, extinct lines intersect at an angle of 70.2 ± 1.1° in untwinned photonic crystals. This intersection angle compares closely with those of ideal fcc {111} planes at 70.53°. Apparently, fcc {111} planes are the preferred slip planes in the natural fcc crystals. Further deformation induces bending and partial disintegration of the crystals. As the wavelength of diffracted light depends on crystal orientation [33], deformation may result in lattice re-orientation and an undulose color of the crystal.
Acknowledgments
Funding for this research was provided by the German Research Council (DFG), grant number MI1205/5-1. We thank Jürgen Ganzel, Berlin, for supplying the samples. Christoph Berthold (Eberhard Karls Universität Tübingen, Tübingen, Germany) provided access to µ-X-ray facilities. Tanja Mohr-Westheide (Naturkundemuseum, Berlin, Germany) provided access to the Raman spectrometer. The authors wish to thank the three anonymous reviewers for their thoughtful comments.
Author Contributions
Moritz Liesegang and Ralf Milke conceived and designed the study. Moritz Liesegang collected and analyzed all data and wrote the paper. All authors discussed the results and commented on the manuscript.
Conflicts of Interest
The authors declare no conflict of interest.
References
- Rey, P.F. Opalisation of the Great Artesian Basin (central Australia): An Australian story with a Martian twist. Aust. J. Earth Sci. 2013, 60, 291–314. [Google Scholar] [CrossRef]
- Thiry, M.; Milnes, A.R.; Rayot, V.; Simon-Coinçon, S. Interpretation of palaeoweathering features and successive silicifications in the Tertiary regolith of Inland Australia. J. Geol. Soc. 2006, 163, 723–736. [Google Scholar] [CrossRef]
- Williams, L.A.; Crerar, D.A. Silica diagenesis, II, General mechanisms. J. Sediment. Res. 1985, 55, 312–321. [Google Scholar] [CrossRef]
- Darragh, P.; Gaskin, A.; Terrell, B.; Sanders, J. Origin of precious opal. Nature 1966, 209, 13–16. [Google Scholar] [CrossRef]
- Gaillou, E.; Fritsch, E.; Aguilar-Reyes, B.; Rondeau, B.; Post, J.; Barreau, A.; Ostroumov, M. Common gem opal: An investigation of micro- to nano-structure. Am. Mineral. 2008, 93, 1865–1873. [Google Scholar] [CrossRef]
- Liesegang, M.; Milke, R. Australian sedimentary opal-A and its associated minerals: Implications for natural silica sphere formation. Am. Mineral. 2014, 99, 1488–1499. [Google Scholar] [CrossRef]
- Liesegang, M.; Milke, R.; Kranz, C.; Neusser, G. Silica nanoparticle aggregation in calcite replacement reactions. Sci. Rep. 2017, 7, 14550. [Google Scholar] [CrossRef] [PubMed]
- Flörke, O.W.; Graetsch, H.; Röller, K.; Martin, B.; Wirth, R. Nomenclature of micro-and non-crystalline silica minerals, based on structure and microstructure. Neues Jahrbuch für Mineralogie Abhandlungen 1991, 163, 19–42. [Google Scholar]
- Sanders, J.V. Colour of precious opal. Nature 1964, 204, 1151–1153. [Google Scholar] [CrossRef]
- Pewkliang, B.; Pring, A.; Brugger, J. The formation of precious opal: Clues from the opalisation of bone. Can. Mineral. 2008, 46, 139–149. [Google Scholar] [CrossRef]
- Pecover, S.R. Australian Opal Resources: Outback Spectral Fire. Rocks Miner. 2007, 82, 102–115. [Google Scholar] [CrossRef]
- Barnes, L.C.; Townsend, I.J.; Robertson, R.S.; Scott, D.C. Opal: South Australia’s Gemstone (Handbook No. 5); Department of Mines and Energy, Geological Survey of South Australia: Parkside, Australia, 1992; pp. 19–26, 37–51. ISBN 978-0730817093. [Google Scholar]
- Savitzky, A.; Golay, M.J. Smoothing and differentiation of data by simplified least squares procedures. Anal. Chem. 1964, 36, 1627–1639. [Google Scholar] [CrossRef]
- Jones, J.B.; Segnit, E.R. The nature of opal I. Nomenclature and constituent phases. J. Geol. Soc. Aust. 1971, 18, 37–41. [Google Scholar] [CrossRef]
- McMillan, P. Structural studies of silicate glasses and melts-applications and limitations of Raman spectroscopy. Am. Mineral. 1984, 69, 622–644. [Google Scholar]
- Hartwig, C.M.; Rahn, L.A. Bound hydroxyl in vitreous silica. J. Chem. Phys. 1977, 67, 4260–4261. [Google Scholar] [CrossRef]
- Smallwood, A.G.; Thomas, P.S.; Ray, A.S. Characterisation of sedimentary opals by Fourier transform Raman spectroscopy. Spectrochim. Acta A 1997, 53, 2341–2345. [Google Scholar] [CrossRef]
- Eriksson, P.G.; Simpson, E.L.; Eriksson, K.A.; Bumby, A.J.; Steyn, G.L.; Sarkar, S. Muddy roll-up structures in siliciclastic interdune beds of the c. 1.8 Ga Waterberg Group, South Africa. Palaios 2000, 15, 177–183. [Google Scholar] [CrossRef]
- Carr, S.G.; Olliver, J.G.; Conor, C.H.H.; Scott, D.C. Andamooka Opal Fields: The Geology of the Precious Stones Field and the Results of the Subsidised Mining Program; Report of Investigations 51; Department of Mines and Energy, Geological Survey of South Australia: Adelaide, Australia, 1979; pp. 17–18. ISBN 0724354980.
- Dickinson, E. Structure and rheology of colloidal particle gels: Insight from computer simulation. Adv. Colloid Interface Sci. 2013, 199, 114–127. [Google Scholar] [CrossRef] [PubMed]
- Iler, R.K. The Chemistry of Silica: Solubility, Polymerization, Colloid and Surface Properties, and Biochemistry; Wiley: New York, NY, USA, 1979; pp. 222–239. ISBN 978-0471024040. [Google Scholar]
- Carcouët, C.C.M.C.; van de Put, M.W.P.; Mezari, B.; Magusin, P.C.M.M.; Laven, J.; Bomans, P.H.H.; Friedrich, H.; Esteves, A.C.C.; Sommerdijk, N.A.J.M.; van Benthem, R.A.T.M.; et al. Nucleation and growth of monodisperse silica nanoparticles. Nano Lett. 2014, 14, 1433–1438. [Google Scholar] [CrossRef] [PubMed]
- Peixinho, J.; Nouar, C.; Desaubry, C.; Théron, B. Laminar transitional and turbulent flow of yield stress fluid in a pipe. J. Nonnewton. Fluid Mech. 2005, 128, 172–184. [Google Scholar] [CrossRef]
- Ding, T.; Long, Y.; Zhong, K.; Song, K.; Yang, G.; Tung, C.H. Modifying the symmetry of colloidal photonic crystals: A way towards complete photonic bandgap. J. Mater. Chem. C 2014, 2, 4100–4111. [Google Scholar] [CrossRef]
- Hong, S.H.; Shen, T.Z.; Song, J.K. Flow-induced alignment of disk-like graphene oxide particles in isotropic and biphasic colloids. Mol. Cryst. Liq. Cryst. 2015, 610, 68–76. [Google Scholar] [CrossRef]
- Wu, Y.L.; Derks, D.; van Blaaderen, A.; Imhof, A. Melting and crystallization of colloidal hard-sphere suspensions under shear. Proc. Natl. Acad. Sci. USA 2009, 106, 10564–10569. [Google Scholar] [CrossRef] [PubMed]
- Vermant, J.; Solomon, M.J. Flow-induced structure in colloidal suspensions. J. Phys. Condens. Matter 2005, 17, R187–R216. [Google Scholar] [CrossRef]
- Scurfield, G.; Segnit, E. Petrifaction of wood by silica minerals. Sediment. Geol. 1984, 39, 149–167. [Google Scholar] [CrossRef]
- Molins, S.; Trebotich, D.; Yang, L.; Ajo-Franklin, J.B.; Ligocki, T.J.; Shen, C.; Steefel, C.I. Pore-scale controls on calcite dissolution rates from flow-through laboratory and numerical experiments. Environ. Sci. Technol. 2014, 48, 7453–7460. [Google Scholar] [CrossRef] [PubMed]
- Putnis, A.; Putnis, C.V. The mechanism of reequilibration of solids in the presence of a fluid phase. J. Solid State Chem. 2007, 180, 1783–1786. [Google Scholar] [CrossRef]
- Sun, Z.Q.; Chen, X.; Zhang, J.H.; Chen, Z.M.; Zhang, K.; Yan, X.; Wang, Y.F.; Yu, W.Z.; Yang, B. Nonspherical colloidal crystals fabricated by the thermal pressing of colloidal crystal chips. Langmuir 2005, 21, 8987–8991. [Google Scholar] [CrossRef] [PubMed]
- Imhof, A.; van Blaaderen, A.; Dhont, J.K.G. Shear melting of colloidal crystals of charged spheres studied with rheology and polarizing microscopy. Langmuir 1994, 10, 3477–3484. [Google Scholar] [CrossRef]
- Monovoukas, Y.; Gast, A.P. A study of colloidal crystal morphology and orientation via polarizing microscopy. Langmuir 1991, 7, 460–468. [Google Scholar] [CrossRef]
Figure 1.
Location map of the sample sites in Andamooka and Mintabie (South Australia, Australia).

Figure 2.
Photographs of polished thick sections of samples from Andamooka (a) and raw, unprepared sample material from Mintabie (b). (a) Andamooka samples, from left to right: opal-filled extensional fractures crosscut the bedding in a bleached sandstone; precious opal in an extensional fracture in sandstone with clay clasts; conglomerate with abundant opal cement and large clasts containing pseudomorphs after carbonates; laminated chert sample with oolitic structures and opal pseudomorphs after rhombohedral crystals. (b) Mintabie samples, from left to right: bleached sandstone with precious and common (white) vein opal; bleached sandstone with predominantly common (white and translucent) vein opal; sandstone fragments in a sample composed of varicolored common opal with minor precious opal domains.

Figure 3.
A typical X-ray diffractogram (a) and Raman spectrum (b) of the studied samples. (a) X-ray diffraction patterns (plotted as a function of d-spacing calculated from diffraction angles) generally show a broad asymmetric peak with a maximum ranging between 3.97 and 4.06 Å. A smaller, secondary reflection occurs at ~2 Å. (b) The Raman spectra of opals studied here show broad asymmetric bands with a maximum at 425 ± 3, 791 ± 1, and 961 ± 2 cm−1, respectively. A more symmetrical band exists at 1067 ± 3 cm−1. All spectra are consistent with opal-A [17].

Figure 4.
Textures and microstructural features of Andamooka vein opal. The SE images (b,d) were obtained after hydrofluoric acid (HF) etching. (a) Photograph of alternating zones of transparent precious and translucent to milky common opal. The parabolic interfaces point toward the fracture tip (arrow). (b) SE image of precious opal composed of ordered uniform spheres. (c) SE image of irregularly arranged spheres and minor nonspherical particles in translucent common opal. (d) White to milky common opal composed of ellipsoidal particles with a preferred orientation ~N–S and a maximum aspect ratio of 0.25. (e) Microphotograph (crossed polarizers) of the area highlighted in (a) depicting the faint grey birefringence of ellipsoidal, ordered particles in white to milky common opal-A.

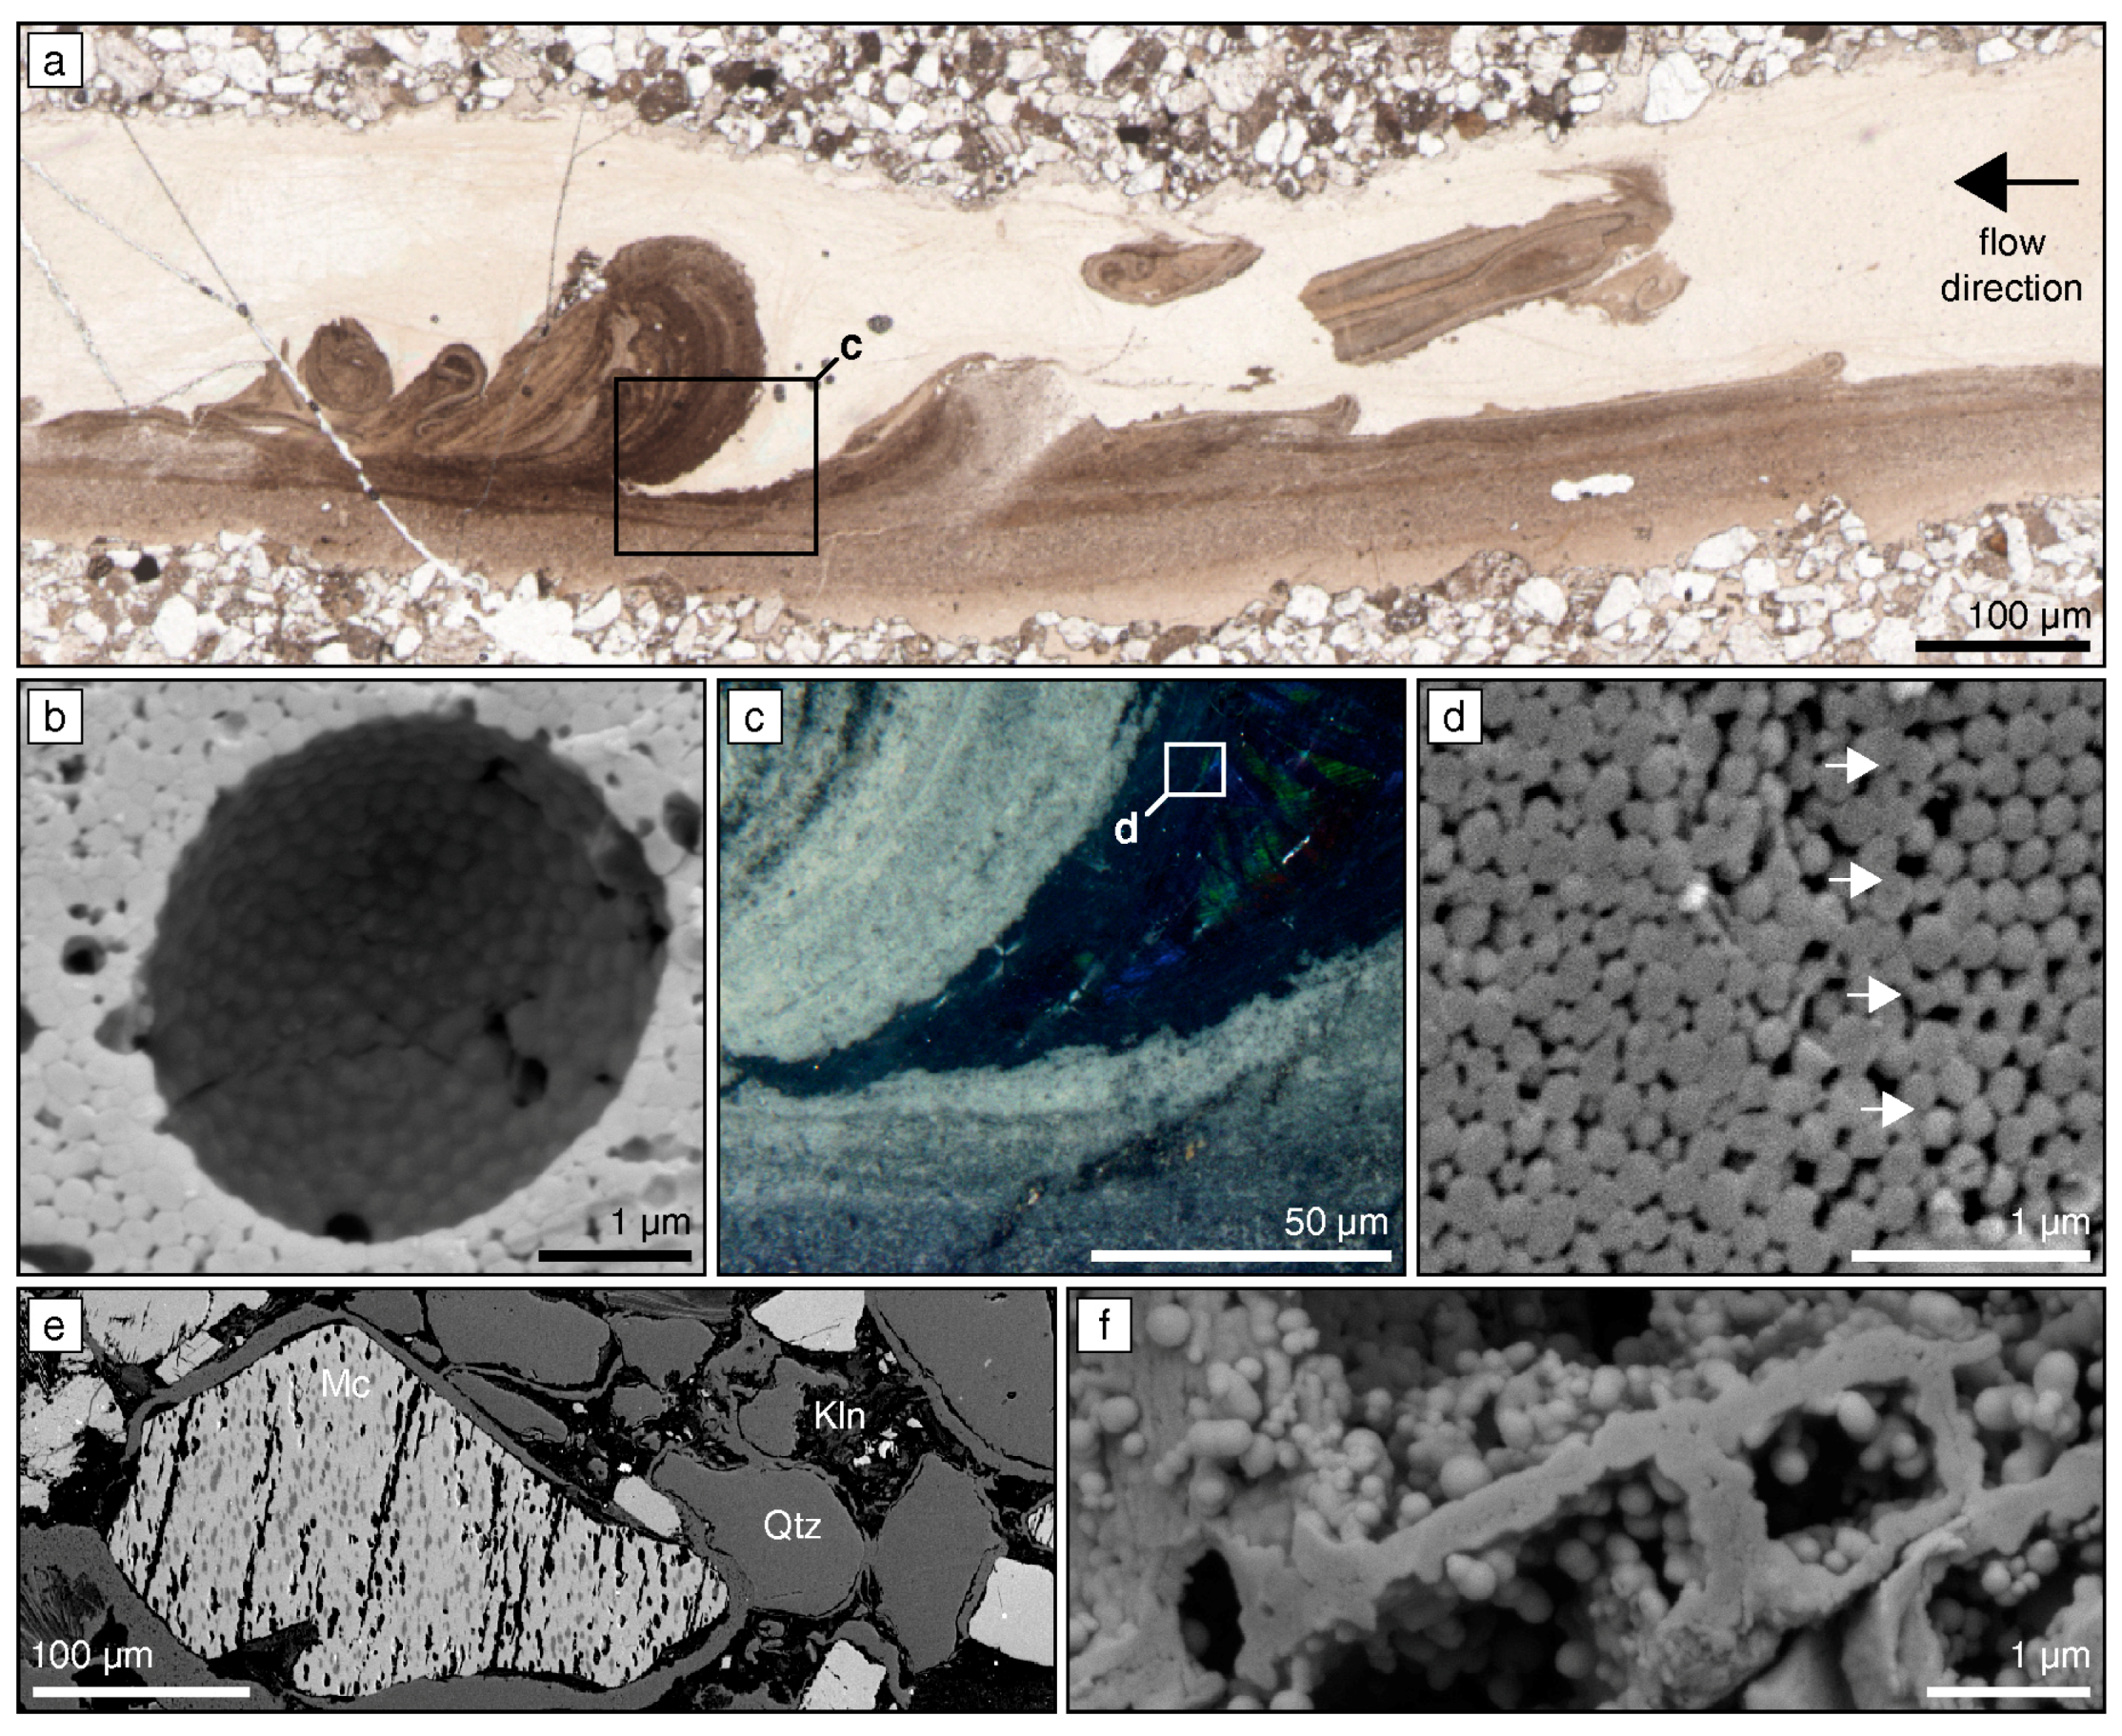
Figure 5.
Textures and microstructural features of Mintabie vein opal (a–d) and its bleached sandstone host rock (e–f). (a) Microphotograph of a partially fragmented, brown opal (white in hand specimen) with roll-up structures overlain by transparent common and precious opal. The arrow indicates the flow direction of the concentrated colloid solution that deformed the brown opal. (b) SE image of sphere-lined pore space in the brown opal, typical of white opal at Mintabie and Andamooka. The sample was HF-etched prior to imaging. (c) Microphotograph of the area highlighted in (a), showing a wedge-shaped photonic crystal embedded in transparent common opal, between crossed polarizers. (d) SE image on HF-etched material of the area highlighted in c, showing the contact between transparent common and precious opal. Arrows emphasize the interface between disordered (left) and ordered (right) regions of similar-sized spheres. (e) Backscattered electron image of bleached Mintabie sandstone with microcline (Mc), quartz (Qtz), and kaolinite (Kln) in their typical spatial context. Microcline and quartz grains are surrounded by an opal-A cement. Na-rich regions (dark) in microcline dissolve preferentially during alteration. (f) SE image of an opal-A pseudomorph after microcline with dissolution cavities containing non-uniform spheres <300 nm in diameter. The opal-replaced cavity walls trace microcline cleavage planes.

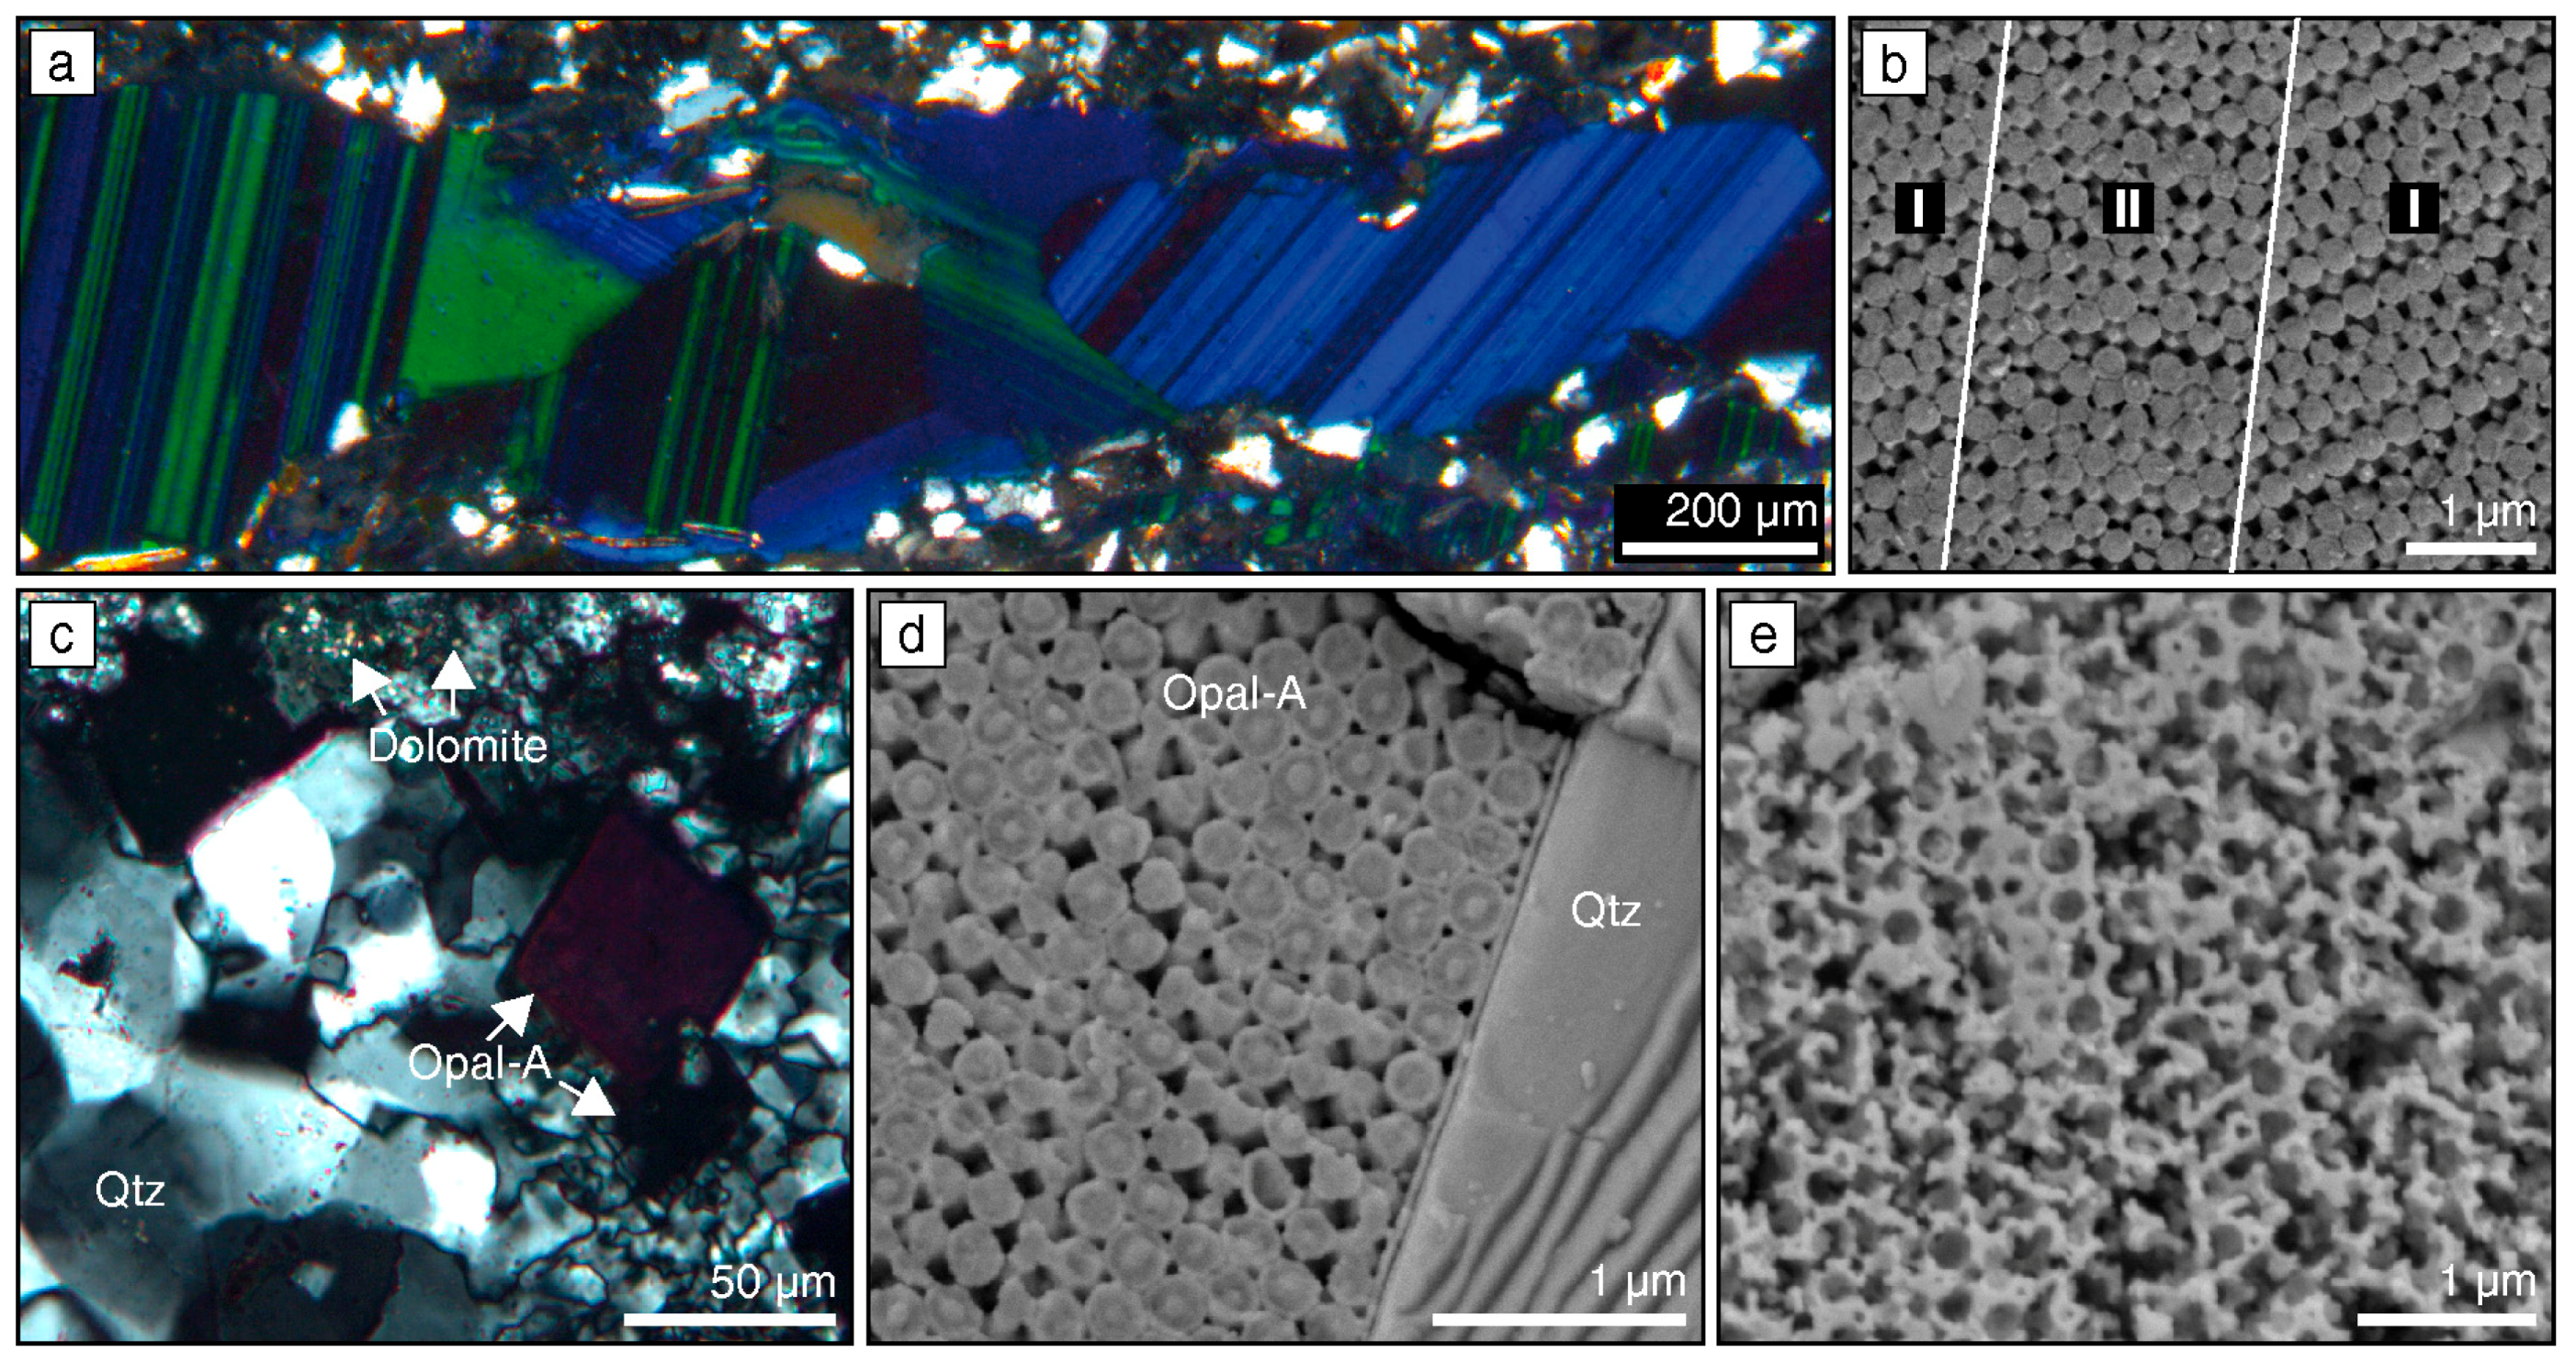
Figure 6.
Optical photonic crystal pseudomorphs with precursor preservation from Andamooka. The images (b) and (d) were captured on HF-etched samples. (a) Microphotograph of fracture-filling striated photonic crystals with different colors and orientations between crossed polarizers. (b) SE image of the polished surface of a twinned crystal with alternating sphere array orientation in an I-II-I pattern. White lines highlight the interface between sphere stacks with different orientation. (c) Microphotograph of opal-A-filled rhombs in a quartz-cemented sample with ooids replaced by a mosaic of interlocked quartz crystals and dolomite. (d) SE image of the interface between precious opal-A inside rhombs and quartz on the outside as in (c). (e) SE image of inverse opal-A in rhombohedral pseudomorphs.

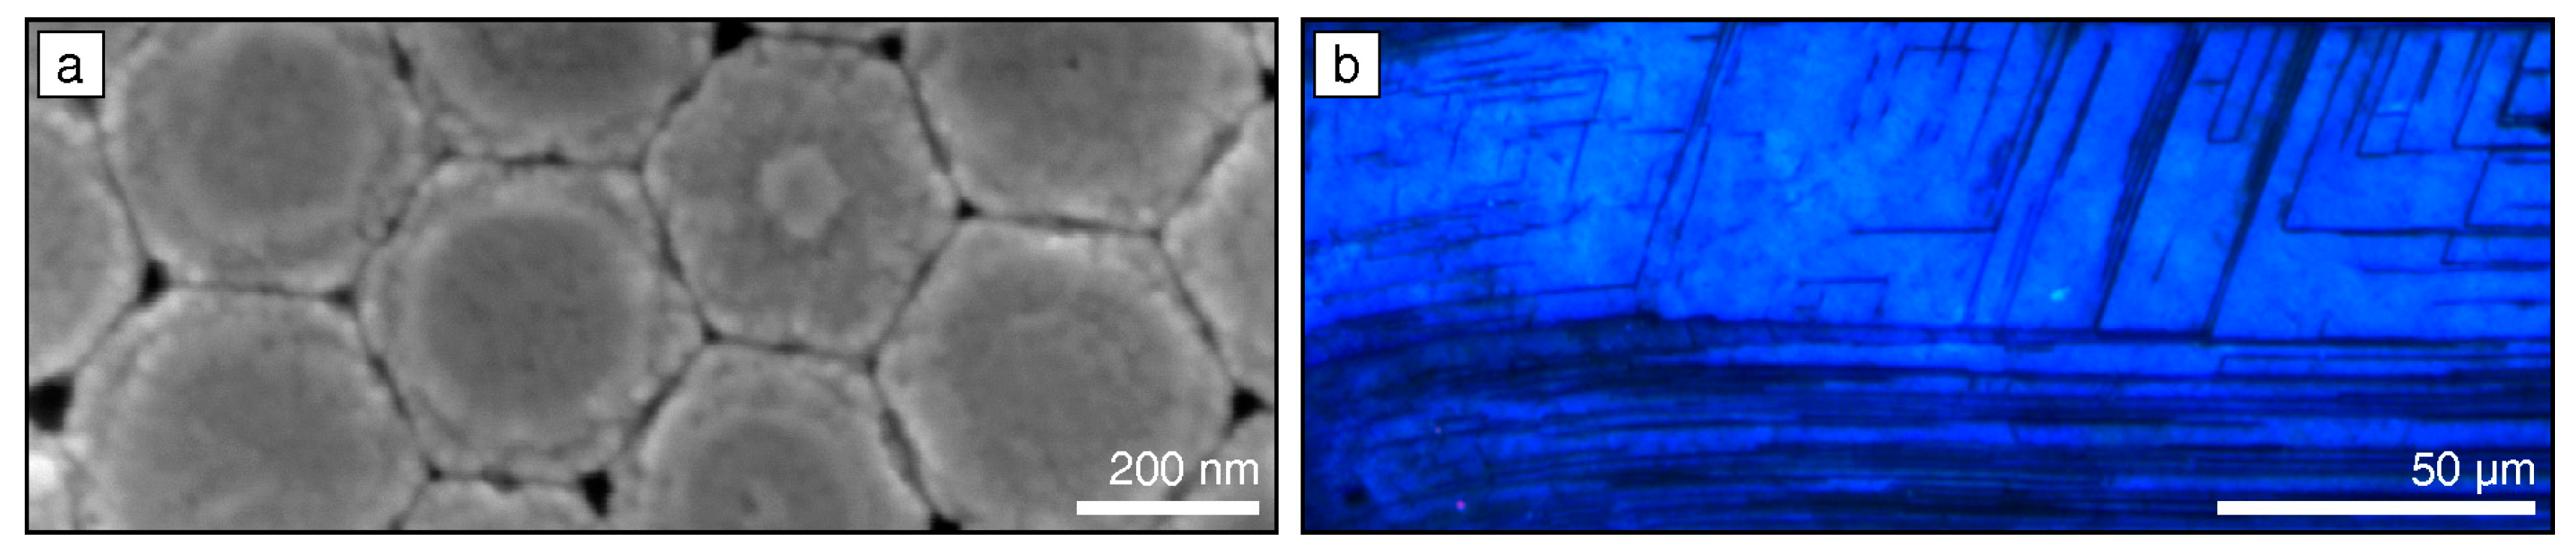
Figure 7.
Post-depositional deformation features in precious opal from Andamooka. (a) Secondary electron image of HF acid-etched, hexagonal particles with concentric layering and subparticle structure. The pore space is significantly reduced compared to close-packed, ideal spheres. (b) Microphotograph of an opal-A photonic crystal between crossed polarizers showing thin black lines indicative of lattice displacement. Black lines on the right side intersect at an angle of ~70°. The lines are continuously bent toward the left side.

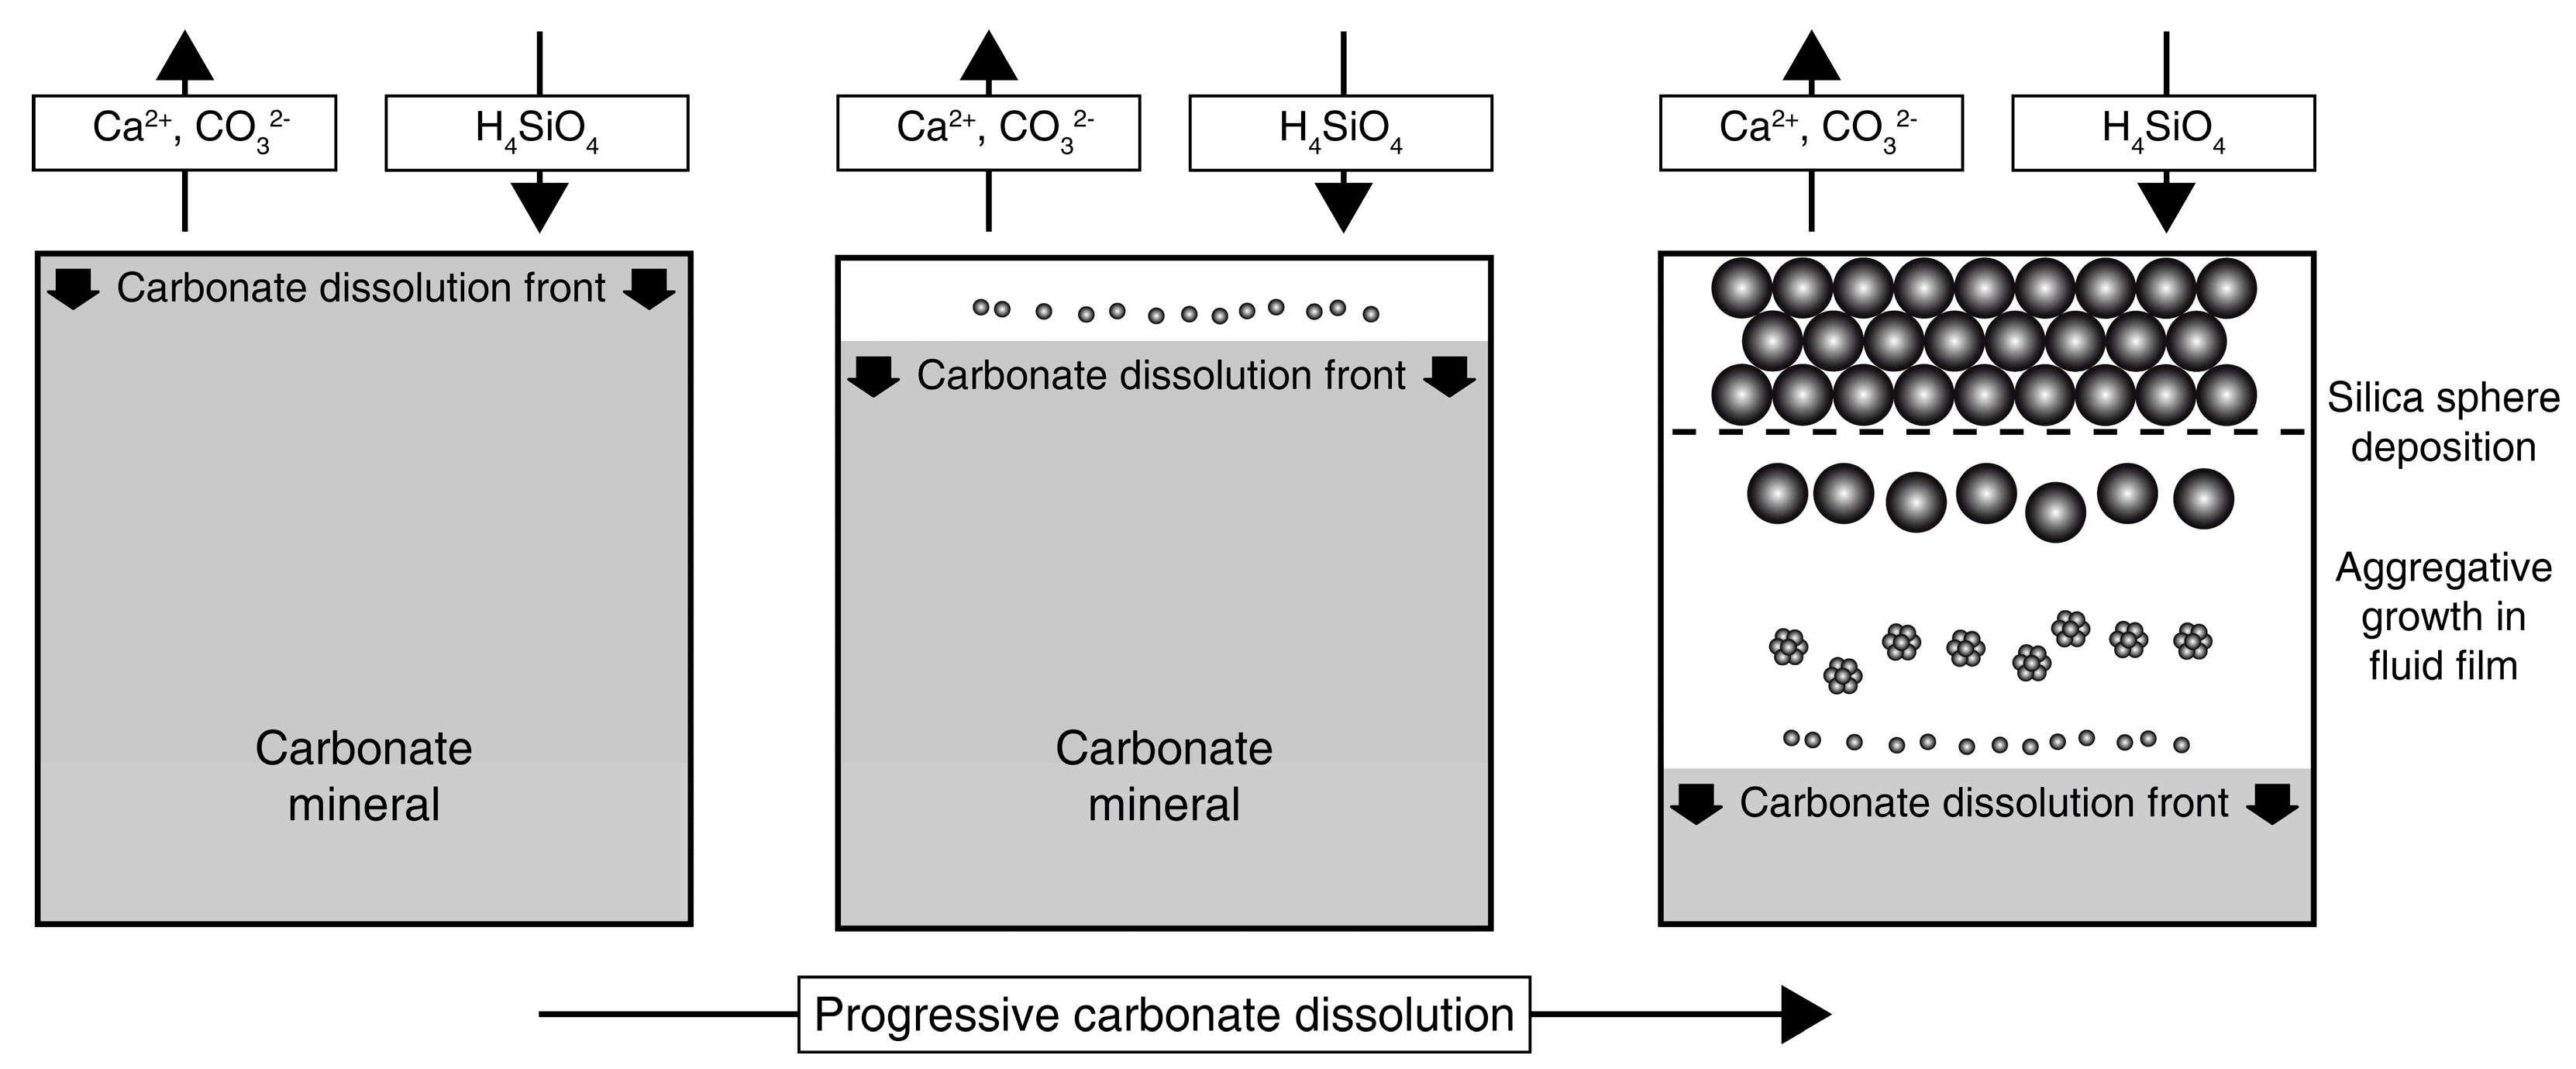
Figure 8.
Schematic representation of the volume- and texture-preserving replacement process of a carbonate mineral by amorphous silica nanospheres. Carbonate chemical components are constantly removed into the bulk solution, while dissolved silica (H4SiO4) reaches the carbonate surface. Amorphous silica nanoparticles continuously nucleate close to the carbonate surface, aggregate into larger particles in the interfacial fluid film, and self-assemble into close-packed, hexagonal planes. The particle diameter increases at increasing distance from the dissolution front until they reach their final size. The carbonate dissolution and silica deposition fronts advance synchronously during the interface-coupled dissolution-precipitation process. The final spheres form a long-range ordered photonic crystal.


Table 1.
Chemical composition of opal-A samples shown in Figure 4, Figure 5 and Figure 6 analyzed by electron probe microanalysis (EPMA) (in wt %). The data are averaged from 30 point analyses per sample. LLD denotes lower limit of detection. Vein opal from Andamooka refers to Figure 4. Mintabie opals are shown in Figure 5. Replacement opal-A from Andamooka comprises twinned and untwinned crystals shown in Figure 6.
| Oxide | Andamooka | Mintabie | |||||
|---|---|---|---|---|---|---|---|
| Vein Opal | Twinned Crystal 1 | Rhombs 1 | Inverse Opal | Cement | Transparent | White Roll-Ups | |
| SiO2 | 90.60 | 92.63 | 87.90 | 84.45 | 90.25 | 90.72 | 89.98 |
| TiO2 | 0.05 | 0.06 | <LLD | <LLD | 0.01 | 0.03 | 0.03 |
| Al2O3 | 0.93 | 1.23 | 1.40 | 1.42 | 1.17 | 1.13 | 1.18 |
| Fe2O3-total | 0.09 | 0.29 | 0.10 | 0.09 | 0.04 | 0.07 | 0.08 |
| MgO | 0.04 | 0.08 | 0.04 | 0.04 | 0.01 | 0.04 | 0.04 |
| CaO | 0.06 | 0.12 | 0.09 | 0.08 | 0.14 | 0.12 | 0.13 |
| SrO | 0.03 | 0.03 | 0.02 | 0.02 | 0.04 | 0.03 | 0.03 |
| BaO | 0.09 | 0.10 | 0.08 | 0.06 | 0.10 | 0.08 | 0.09 |
| Na2O | 0.10 | 0.13 | 0.29 | 0.30 | 0.18 | 0.17 | 0.18 |
| K2O | 0.09 | 0.12 | 0.09 | 0.05 | 0.27 | 0.26 | 0.32 |
| SUM Total | 92.08 | 94.79 | 90.01 | 86.50 | 92.21 | 92.65 | 92.07 |
| SUM impurities | 2.19 | 2.16 | 2.11 | 2.06 | 1.96 | 1.93 | 2.08 |
| (H2O + OH) 2 | 10.73 | 5.21 | 9.99 | 13.50 | 7.79 | 7.35 | 7.93 |
1 Precious opal, 2 Calculated by balance of SUM total with 100 wt %.
© 2018 by the authors. Licensee MDPI, Basel, Switzerland. This article is an open access article distributed under the terms and conditions of the Creative Commons Attribution (CC BY) license (http://creativecommons.org/licenses/by/4.0/).
Share and Cite
MDPI and ACS Style
Liesegang, M.; Milke, R. Silica Colloid Ordering in a Dynamic Sedimentary Environment. Minerals 2018, 8, 12. https://doi.org/10.3390/min8010012
AMA Style
Liesegang M, Milke R. Silica Colloid Ordering in a Dynamic Sedimentary Environment. Minerals. 2018; 8(1):12. https://doi.org/10.3390/min8010012
Chicago/Turabian StyleLiesegang, Moritz, and Ralf Milke. 2018. "Silica Colloid Ordering in a Dynamic Sedimentary Environment" Minerals 8, no. 1: 12. https://doi.org/10.3390/min8010012
Note that from the first issue of 2016, this journal uses article numbers instead of page numbers. See further details here.