Article

Synthesis of Novel Ether Thionocarbamates and Study on Their Flotation Performance for Chalcopyrite

College of Chemistry and Chemical Engineering, Central South University, Changsha 410083, China
*
Authors to whom correspondence should be addressed.
Minerals 2016, 6(3), 97; https://doi.org/10.3390/min6030097
Submission received: 26 July 2016 / Revised: 30 August 2016 / Accepted: 6 September 2016 / Published: 21 September 2016

Abstract

:
Novel ether thionocarbamates, O-butoxy isopropyl-N-ethoxycarbonyl thionocarbamate (BIPECTC) and O-(2-butoxy-1-methylethoxy) isopropyl-N-ethoxycarbonyl thionocarbamate (BMIPECTC), were synthesized in this study. Their collecting efficiencies in the flotation of chalcopyrite were investigated using flotation tests, adsorption measurements, ultraviolet spectra (UV) and Fourier transform-infrared spectroscopy (FT-IR) and density functional theory (DFT) calculations. The synthesized ether thionocarbamates showed better frothing properties than methyl-isobutyl-carbinol (MIBC) and stronger affinity to chalcopyrite compared with O-isopropyl-N-ethyl thionocarbamate (IPETC) and O-isobutyl-N-ethoxycarbonyl thionocarbamate (IBECTC). UV spectra analysis showed that the ether thionocarbamates react with Cu2+, with the exception of Fe2+, Ni2+, Zn2+ and Pb2+. Additionally, it was further confirmed by FTIR spectra that a chemical reaction occurs between copper ion and BIPECTC and BMIPECTC. The adsorption capacity measurements revealed that chalcopyrite exhibits good adsorption ability for ether thionocarbamates at an approximate pH of 8–10, which agrees with the flotation tests. The quantum chemistry calculation results indicated that the ether thionocarbamates exhibit stronger collecting ability for copper mineral in terms of frontier molecular orbital analysis, binding model simulation with copper ions and the molecular hydrophobicity compared with IPETC and IBECTC. The computational results are in very good agreement with the experimental results.

1. Introduction

Chalcopyrite (CuFeS2) is the primary, economically important and most abundant copper-bearing mineral, accounting for approximately 70% of the current global copper reserves [1,2]. While depletion of high-grade copper resources is of serious concern for the mineral processing industries, its judicious utilization to meet the ever-growing demand of copper has great significance. Xanthates are most commonly used as collectors for separating copper sulfide minerals from gangue minerals using froth flotation. However, because an evident disadvantage of xanthates is their poor selectivity, thionocarbamates are considered more effective collectors for sulfide ores; they also have good selectivity, low dosage and toxicity and are extensively applied worldwide [3,4]. As a result, the preparation, modification and performance of thionocarbamates have gained increasing attention since their use in mineral flotation [5,6,7,8,9]. Glembotskii [10] reported that the collecting ability of thionocarbamate is directly influenced by the electron density of the reactive center (sulfur atom) such that it is enhanced when the electron density of the reactive center is raised by the electron-donating group. Conversely, the collecting ability is reduced as for the electron-withdrawing group. Furthermore, a growing number of studies have supported the point of view that different substituted groups influence the collecting ability of thionocarbamates. Some work found that the collecting power of thionocarbamates is improved when with increases in the total carbon atom numbers of substituted alkyl groups adjacent to the O and N atoms of the collector. They also concluded that the O-alkyl group influences the hydrophobicity of the collector and the N-alkyl group controls the degree of the reactive center approaching the mineral surface [11]. Sheridana et al. [12] performed a contrasting study on the performance of O-alkyl-N-allyl thionocarbamate (ATC) compared with O-isobutyl-N-ethoxycarbonyl thionocarbamate (ECTC) and n-butyl ethoxycarbonyl thiourea (ECTU) in the flotation of porphyry copper ore. O-isobutyl-N-allyl thionocarbamate (C4 ATC) was found to be optimal with respect to both chain length and froth characteristics. At optimal flotation conditions, a copper concentrate with 97% recovery and 33% grade could be obtained by C4 ATC, and its collecting efficiency was equivalent to that of the ECTC collector and superior to that of the ECTU collector.
Computational methods, such as ab initio and density functional theory (DFT), are valuable tools for us to understand chemical reactivity systems, and they are also adopted to investigate the structural properties and chemical reactivities of collectors [13,14,15]. In recent years, studies about quantum chemistry calculations of the relationship between structure and activity of thionocarbamates were also reported. Liu et al. [16] studied the flotation efficiency of O-isooctyl-N-ethoxycarbonyl thionocarbamate (IOECTC) for chalcopyrite. The net charge of sulfur and frontier orbital eigenvalues and compositions of collectors were calculated by the DFT method to analyze the structure–activity relationship of IOECTC. According to the computational results, the conjugate –O–(C=O)–N–(C=S)–O– group endows the IOECTC collector with a stronger collecting ability for copper minerals and improved selectivity against iron sulfide minerals compared with butyl xanthate and O-isopropyl-N-ethyl thionocarbamate (IPETC). In their further studies, Liu et al. [17] investigated the effect of N-substituents on the performance of thionocarbamates as copper sulfides collectors by ab initio calculations. The energies, compositions of frontier molecular orbitals and atomic charges were used to discuss the reactive behavior of thionocarbamates. The N-substituent groupings have significant effect on the flotation performance of thionocarbamates as selective collectors for copper sulfide minerals. Quantum chemical calculations are useful tools for exploring the structure–activity relationship of collectors, which was also adopted in our research to discuss the reactivity of the synthesized thionocarbamates in the flotation of chalcopyrite.
According to previous reports, modifications to thionocarbamate molecules are mainly focused on the N-substituents. Meanwhile, the substituted groups on the O atom are alkyl groups. In the present work, we try to introduce a newly substituted group on the O atom to construct novel thionocarbamate collectors for copper flotation. Ether alcohol is a by-product in the petrochemical industry with extensive sources, and it is considered a member of frothers [18,19]. By considering ether alcohol, instead of aliphatic alcohol, as reactant in the preparation of thionocarbamates, we believe that the introduction of the alkoxyl group for thionocarbamates may improve their frothing ability and decrease the dosage of frother in predictable applications. Their collecting efficiencies for chalcopyrite were evaluated by micro and batch flotation tests along with adsorption tests. Moreover, the adsorption mechanism was also investigated using UV and FTIR spectra. Quantum chemistry calculations were used to investigate the structure–activity relationship of the synthesized ether thionocarbamates for copper flotation.

2. Materials and Methods

2.1. Preparation of Ether Thionocarbamates

The ether thionocarbamates are prepared through reacting ethoxycarbonyl isothiocyanate with ether alcohol. Ethoxycarbonyl isothiocyanate is produced from sodium thiocyanate and ethyl chloroformate with N, N-dimethylaniline (DMA) as a phase-transfer catalyst. All reactions are performed in flask with magnetic stirring in water bath with distilled water, unless otherwise noted.

2.1.1. Synthesis of Ethoxycarbonyl Isothiocyanate

In this procedure, ethyl chloroformate was added dropwise to the aqueous solution of sodium thiocyanate in the presence of DMA. The mixture was stirred for 4 h, and the reaction temperature was kept at approximately 0–5 °C. The product was extracted using icy water, and ethoxycarbonyl isothiocyanate was obtained after removing the solvent. The reaction is shown in Equation (1) [20].
Minerals 06 00097 i001

2.1.2. Synthesis of Ether Thionocarbamates

The reaction was performed in a three-neck round bottom flask (25 mL) equipped with a magnetic stirrer (stirring speed of 300 rpm) and reflux condenser. The ether thionocarbamates were prepared from the reaction of ethoxycarbonyl isothiocyanate and corresponding ether alcohols (1-butoxy-2-propanol and 1-(2-butoxy-1-methylethoxy)-2-propanol), as shown in reaction Equation (2) [20].
Minerals 06 00097 i002
R = (–CH2CH2CH2CH3), n = 1 for O-butoxy isopropyl-N-ethoxycarbonyl thionocarbamate (BIPECTC) and n = 2 for O-(2-butoxy-1-methylethoxy)-isopropyl-N-ethoxycarbonyl thionocarbamate (BMIPECTC).

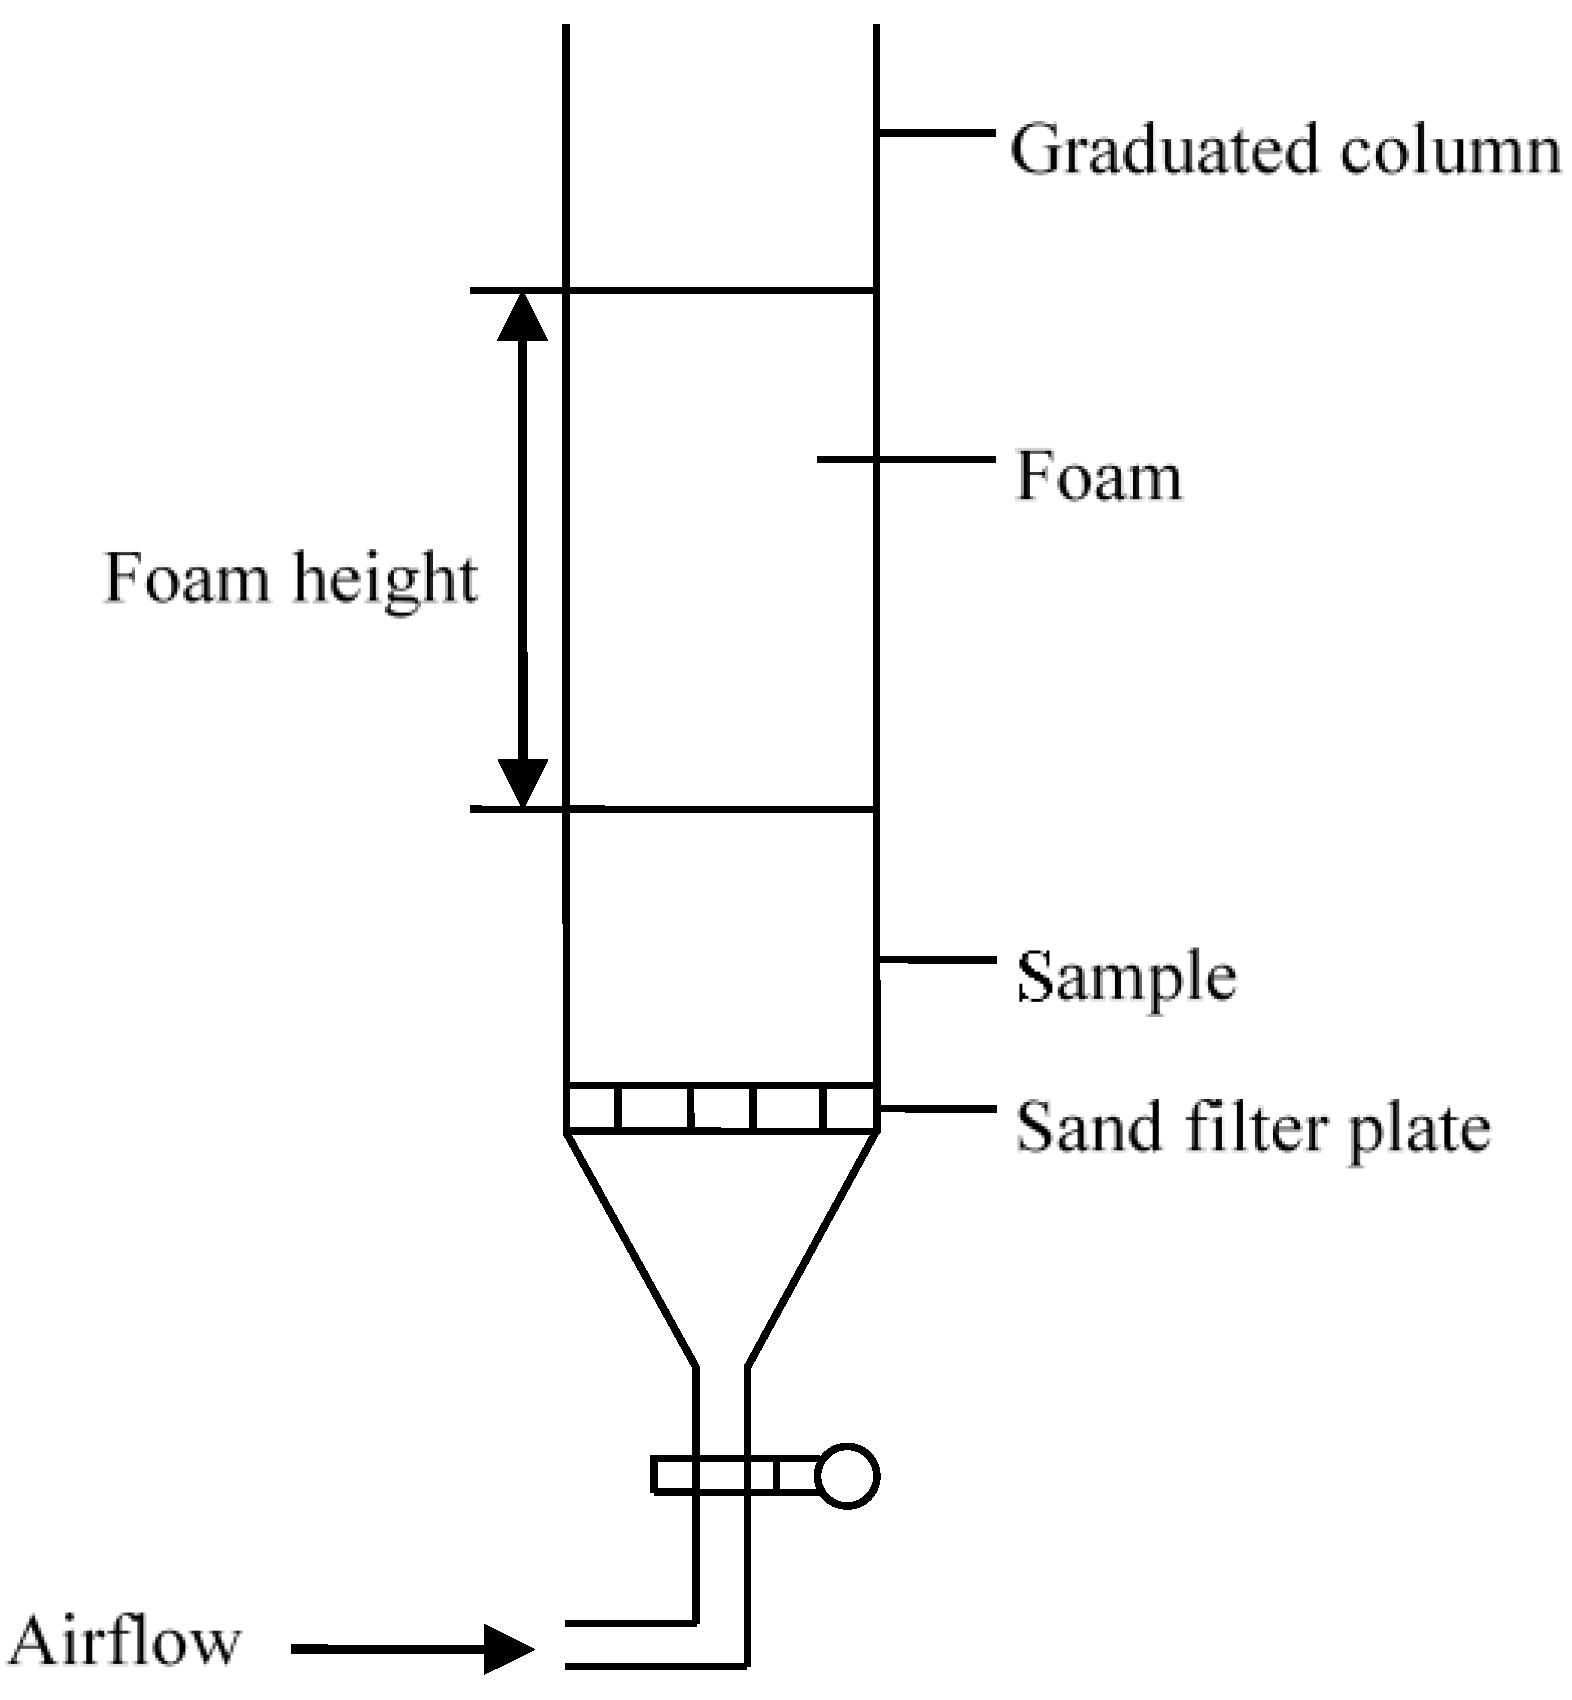
2.2. Determination of the Frothing Properties

Frothing properties were measured using the airflow method to help gas move across the sand filter plate on which a solution or slurry was to be tested; then, the foam height was measured after foaming in the container [21,22]. The foam half-life was recorded as the time for the foam height to attenuate by half after aeration. Tests were performed at room temperature (25 ± 3 °C) from a low concentration solution to a high concentration solution for one reagent. The foam tester must be washed with distilled water before further testing. Each test was repeated three times, and the mean value was adopted. The diagrammatic sketch of the frothing property test is shown in Figure 1.

2.3. Micro Flotation Experiments

The micro flotation experiments for pure mineral were performed in an XFG type laboratory flotation cell (Jilin Prospecting Machinery Factory, Changchun, China) with a volume of 40 mL. In each test, 2.0 g of sample was dispersed in the cell with distilled water for 1 min. The pH was adjusted using a pH regulator (hydrochloric acid or sodium hydroxide) for 2 min. Then, the collector was introduced and the pulp was conditioned for 3 min, which was followed by flotation for 6 min.

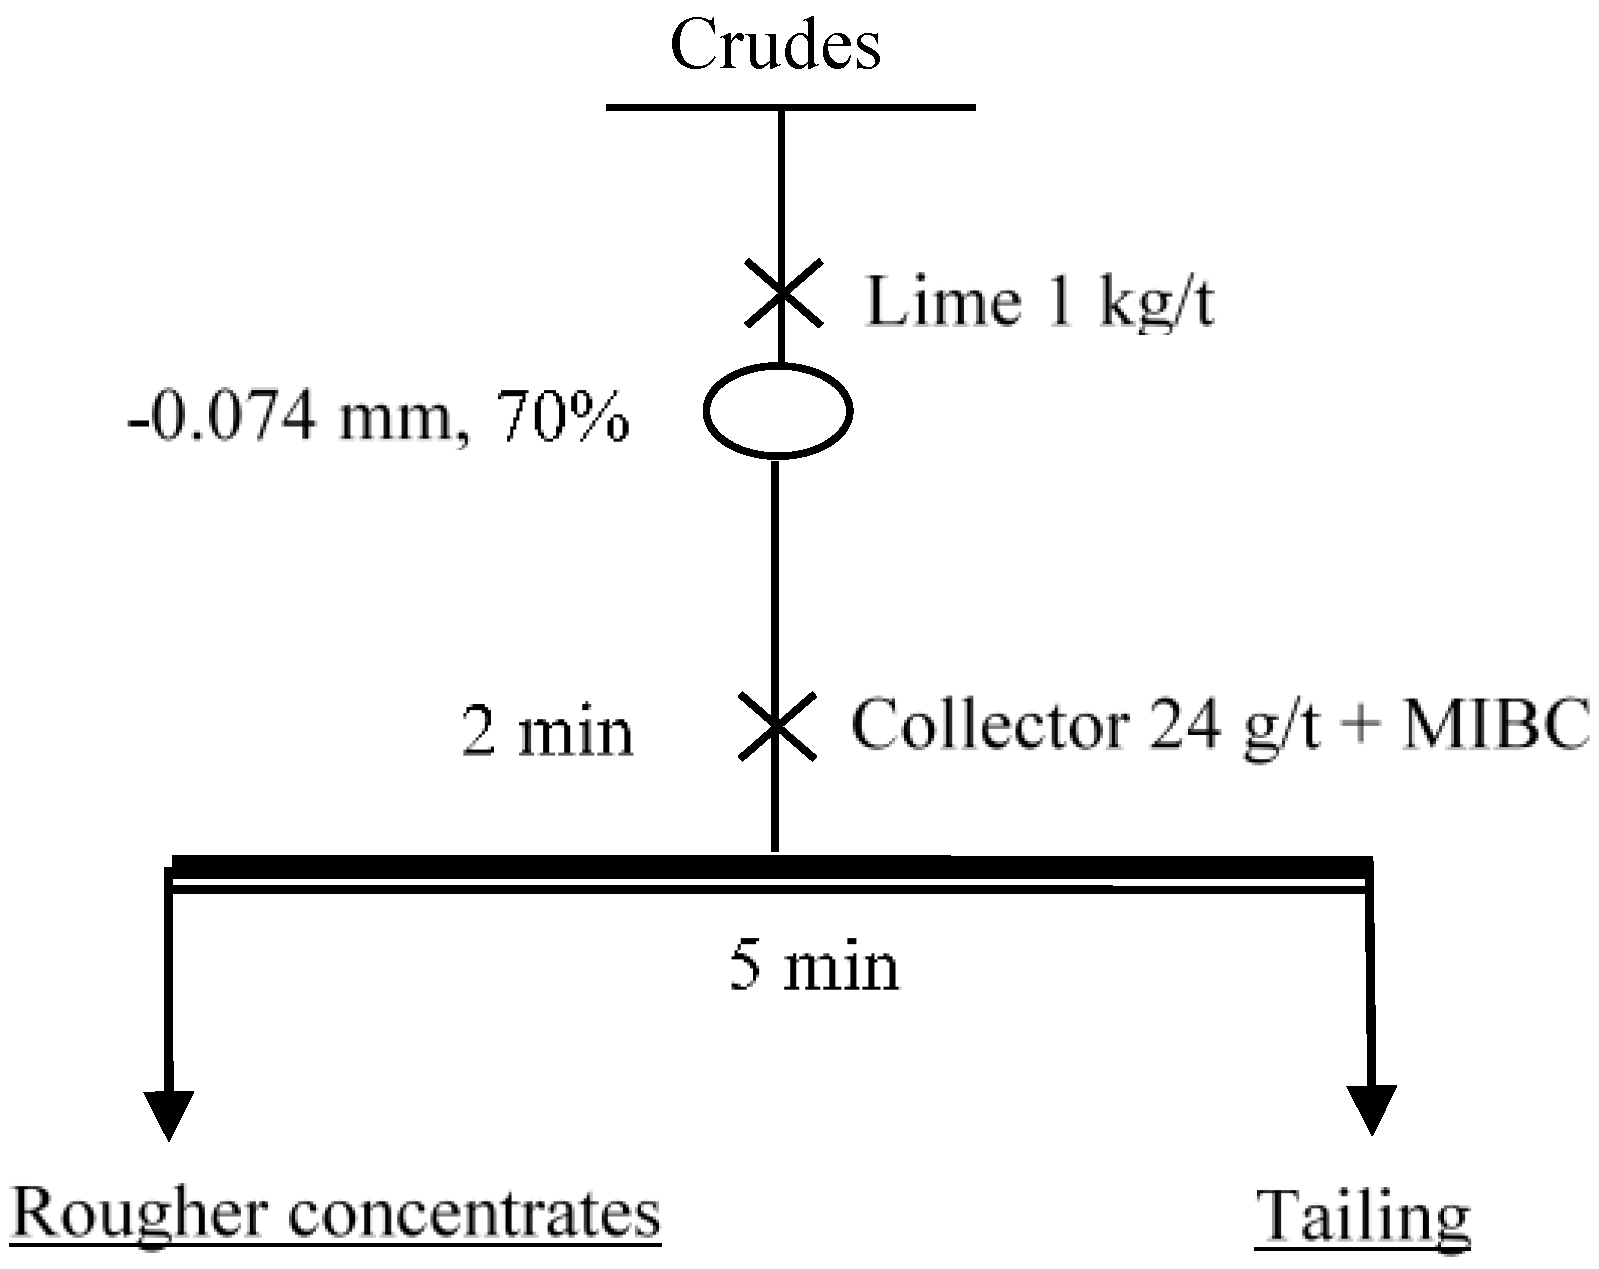
2.4. Batch Flotation Tests

Laboratory experiments were conducted for a porphyry copper-molybdenum ore from different deposits of Dexing Copper Mine (Dexing, China). Results of Chemical Analysis and X-ray Diffraction are shown in Table 1 and Table 2, respectively.
In each test, one sample of 1000 g was ground in a conical ball mill, and the concentration of ore pulp was 62.5%. An XFD type flotation machine (Jilin Prospecting Machinery Factory, Changchun, China) with a volume of 3 L was used in flotation, and one-step rougher flotation was employed. The ore flotation tests were conducted as in the flow sheet shown in Figure 2.

2.5. Adsorption Capacity Measurement

The adsorption quantity of collectors on the pure mineral surface was measured by ultraviolet spectrophotometry. The mineral sample (0.5 g) with collectors of different concentrations was oscillated at 30 °C for 10 h. The pH was adjusted by hydrochloric acid or sodium hydroxide. The concentration of supernatant was measured after centrifugation. Finally, the adsorption quantity of collectors on chalcopyrite was calculated with the following Equation (3):
Q = ( c 1 c 2 ) V / m
Q is the adsorption quantity (mol/g); m is the mass of mineral sample (g); V is solution volume (L); and c1 and c2 are the solution concentrations before and after adsorption, respectively (mol/L).

2.6. UV Spectra

Various levels of the collector solution were mixed with the metal ion solution, and the concentrations of two solutions were both 1 × 10⁻⁴ mol/L. Then, the mixture was sufficiently oscillated. Absorption spectra between 220 and 320 nm were recorded for the supernatant using an Ultraviolet Spectrometer (UV-1750, Shimadzu, Kyoto, Japan).

2.7. FTIR Spectra

The FTIR spectra were obtained with AVATAR360 FTIR (Nicolet Corporation, Madison, WI, USA) to characterize the nature of the interaction between the collectors and minerals. The sample for testing was prepared as follows. The collector and chalcopyrite (<2 µm) were mixed in aqueous solution. The precipitate was obtained after oscillation and set quietly for a while before it was washed 2–3 times using clean water and then dried in a vacuum.

2.8. Computation

Density Functional Theory (DFT) computations with the hybrid exchange-correlation functional B3LYP [23] were performed using Gaussian 09 [24] package. Initial molecular structures of the title products were drawn and pre-optimized by MM2 (a modified version of Allinger’s MM2 force field) and PM3 (Parameterized Model Revision 3) methods. The molecular geometry was further optimized with the basis set 6-31 + g* [25,26]. The binding model and molecular energy were calculated with the same basis set. The IEF-PCM model (the integral equation formalism for the polarizable continuum model) was adopted to calculate the properties of molecules in aqueous solution. ChemBioOffice 2010 was employed for predicting the clogP of molecules.

3. Results and Discussion

3.1. Characterization of the Products

Product Characterization:

O-butoxy isopropyl-N-ethoxycarbonyl thionocarbamate (BIPECTC): a light yellow viscous liquid, yield 79.93%. 1H NMR (400 Hz, CDCl3)δ: 0.88 (t, J = 6, CH3, 3H), 1.12 (d, J = 4.8, CH3, 3H), 1.27 (t, J = 8, CH3, 3H), 1.32–1.37 (m, CH2, 2H), 1.49–1.58 (m, CH2, 2H), 3.38–3.65 (m, CH, CH2, 5H), 4.16–4.21 (m, CH2, 2H) and 8.52 (s, NH, H).
O-(2-butoxy-1-methylethoxy) isopropyl-N-ethoxycarbonyl thionocarbamate (BMIPECTC): a light yellow viscous liquid, yield 79.55%. 1H NMR (400 Hz, CDCl3)δ: 0.85 (t, J = 8, CH3, 3H), 1.07 (dd, J = 3.6, CH3, 3H), 1.22 (m, J = 8, CH3, 3H), 1.29 (dd, J = 3.6, CH3, 3H), 1.42–1.52 (m, CH2, 4H), 3.25–3.70 (m, CH, 3CH2, 7H), 4.10–4.18 (m, CH2, 2H), 5.56–5.62 (m, CH, H) and 8.70 (s, NH, H).

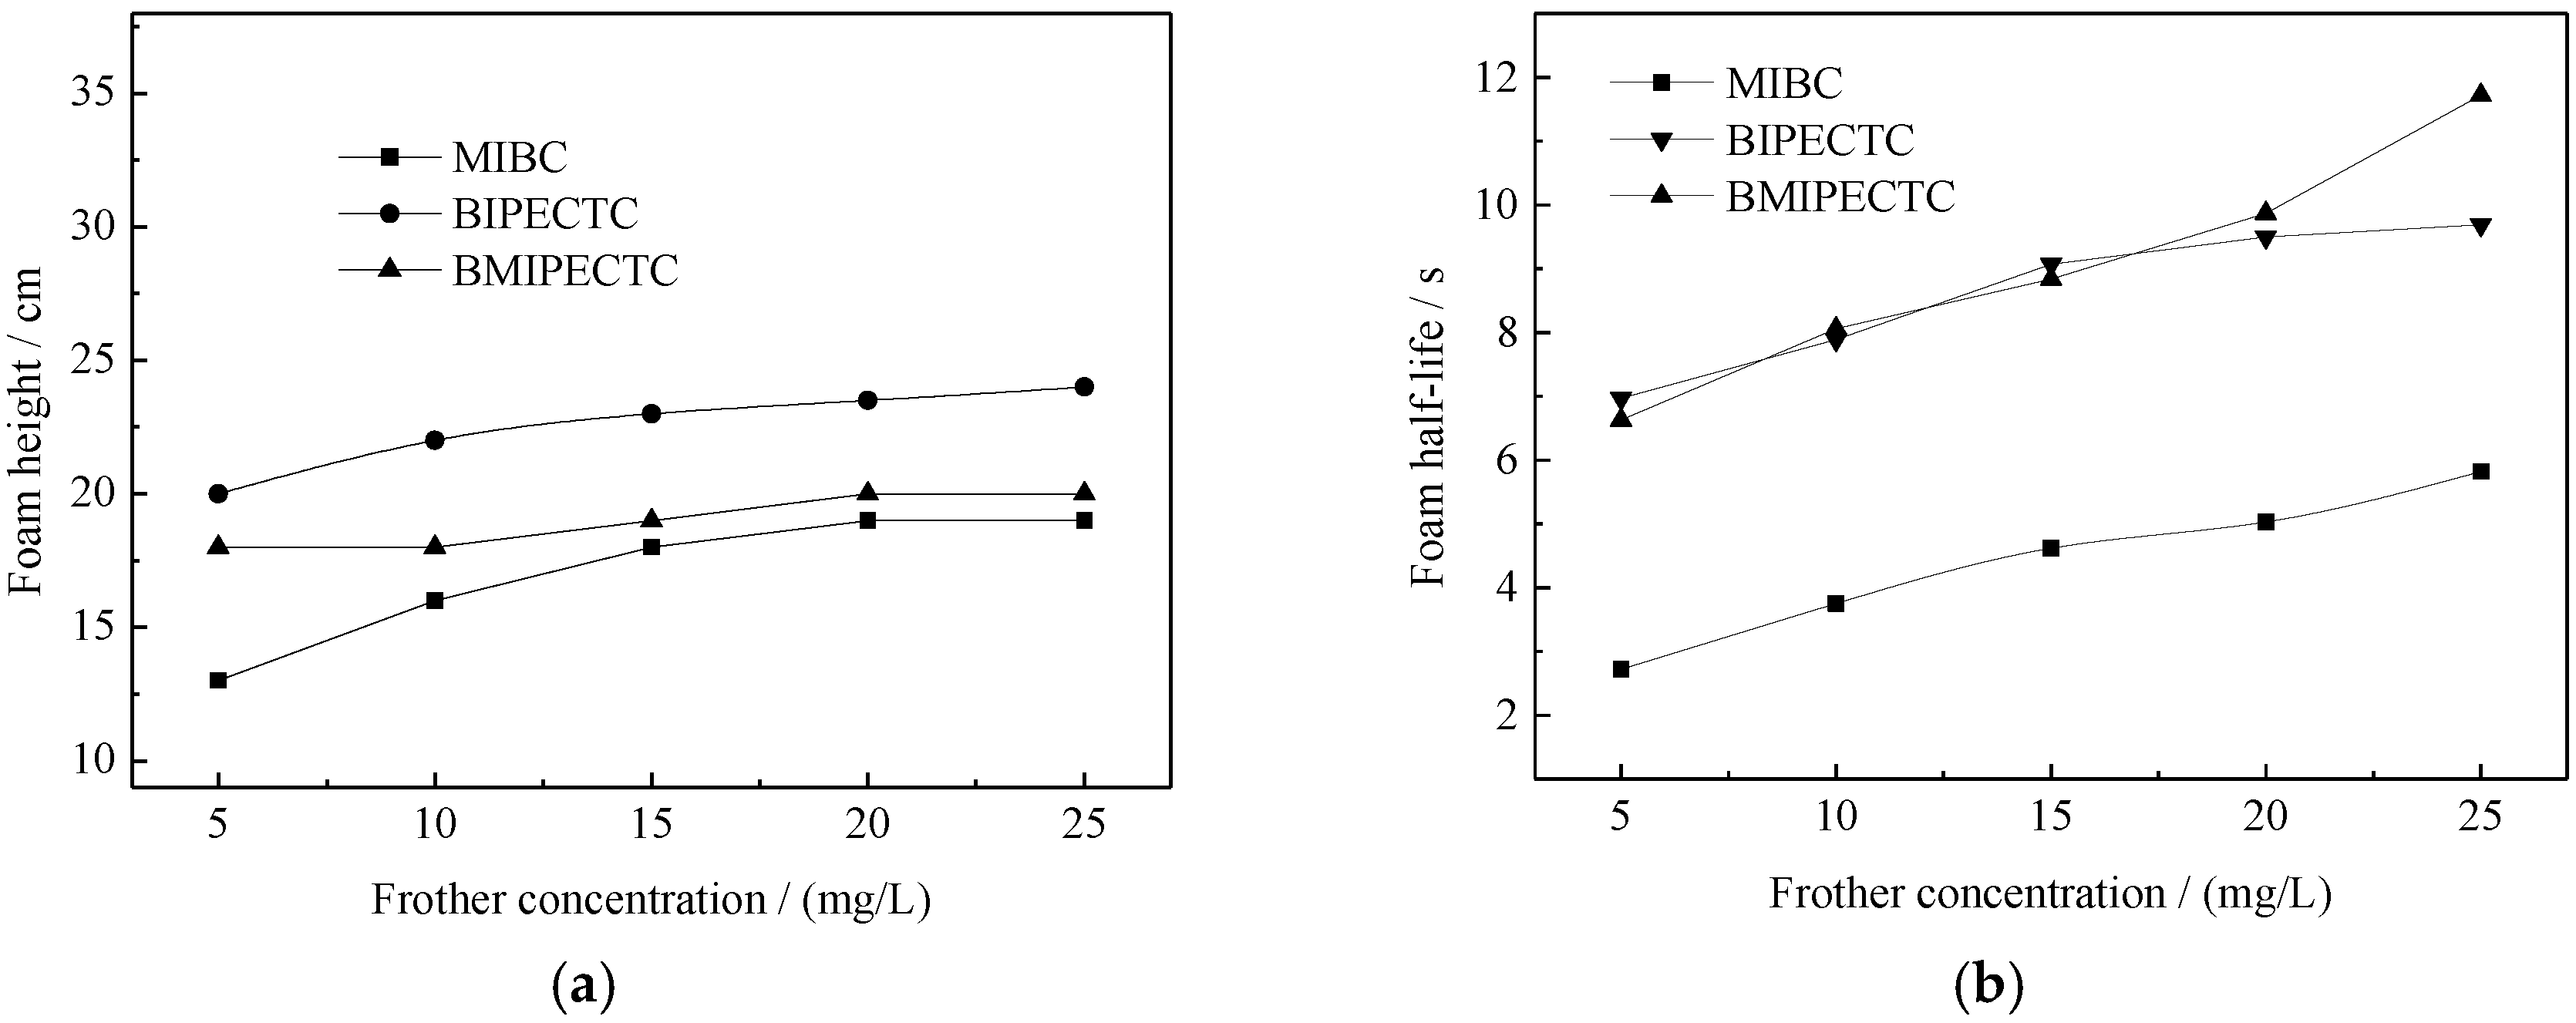
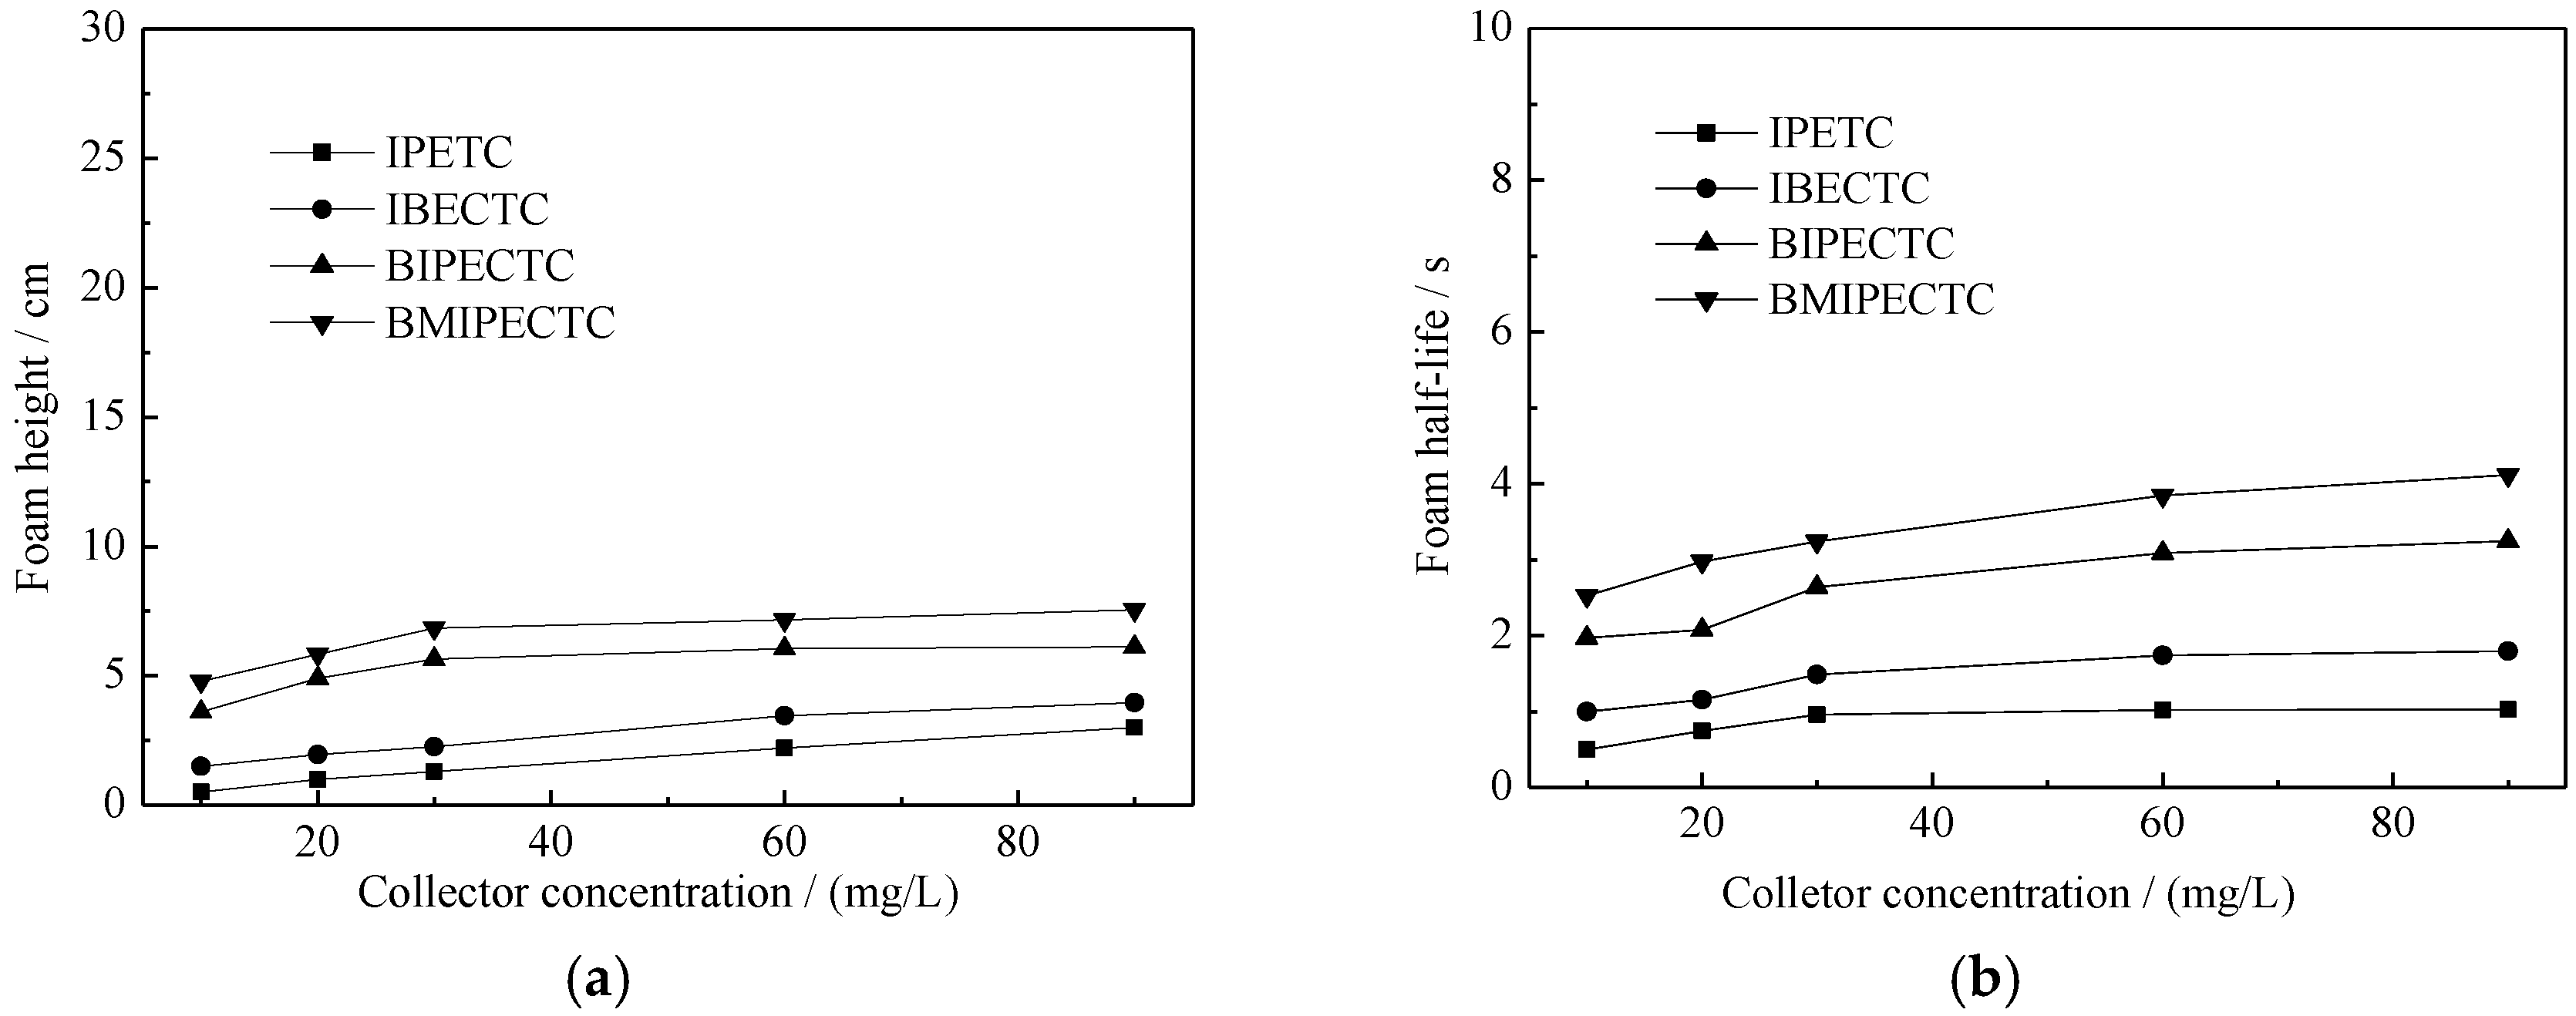
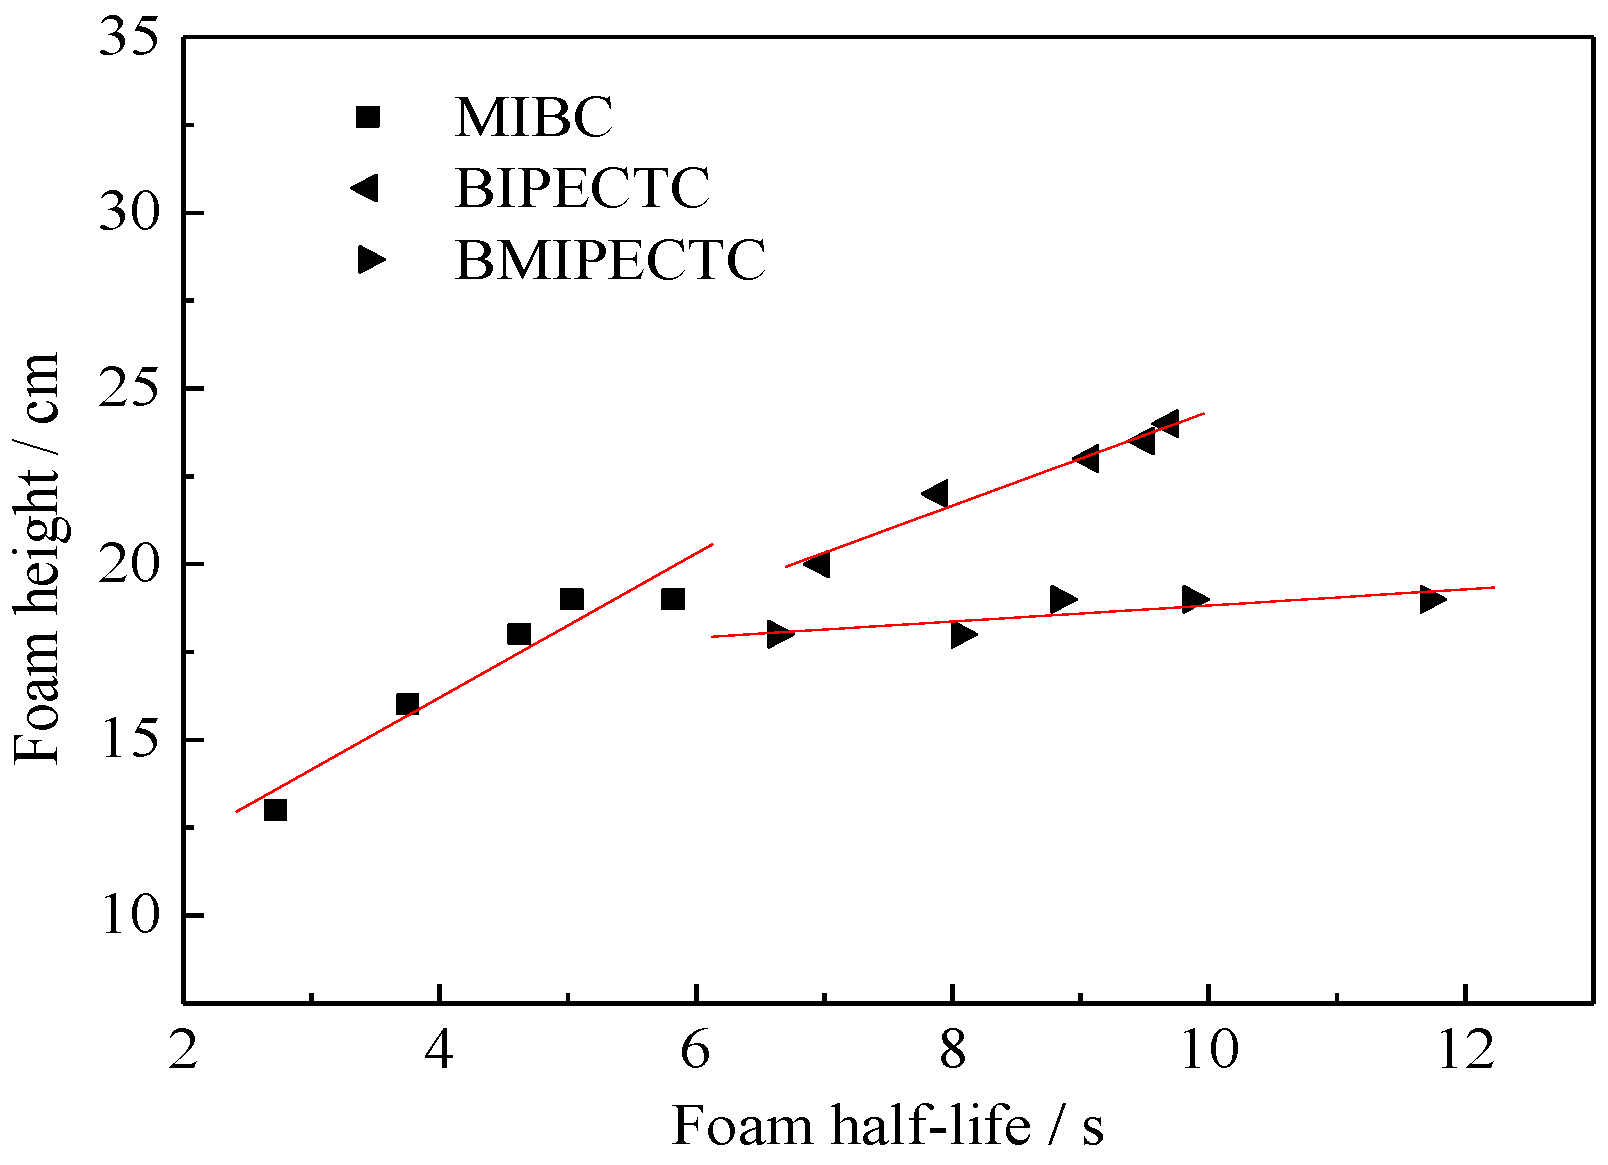
3.2. Frothing Performance of Ether Thionocarbamates

Frothing properties of the ether thionocarbamate solution were evaluated by characterizing the frothing ability and foam stability through recording the height and half-life, which were compared with those for methyl-isobutyl-carbinol (MIBC). To evaluate frothing characteristics in practical flotation, the frothing properties of the ether thionocarbamates in slurry were also determined. The foam height and half-life at different reagent concentrations are shown in Figure 3 and Figure 4.
In general, the foam height and half-life reflect the frothing ability and foam stability, respectively. As seen in Figure 3, compared with the traditional frother MIBC, the synthesized ether thionocarbamates have a higher foam height and longer half-life, indicating they have a stronger frothing ability and better stability. Additionally, the frothing ability of BMIPECTC is stronger than that of BIPECTC. At a lower concentration, the foam half-lives of BIPECTC and BMIPECTC are almost the same; however, when the collector concentration is higher than 20 mg/L, the foam half-life of BMIPECTC is longer than that for BIPECTC. From Figure 4, the frothing characteristics of the ether thionocarbamate decreases in the slurry. This may be due to the reaction with minerals. The frothing properties of the synthesized ether thionocarbamates are better than that for IPETC and IBECTC, which are used for comparison. As a result, in practical flotation, less frother is required when using BIPECTC and BMIPECTC as the collectors.
The relationship between the foam height and half-life was fit to compare the foam properties, as shown in Figure 5.
Figure 5 indicated that the foam height is linearly correlated with the foam half-life. We can easily compare the foam properties by the gradient of the fitting lines. The foam stability is better when the gradient is smaller. In this way, the foam stabilities conform to the following sequence: BMIPECTC > BIPECTC > MIBC.

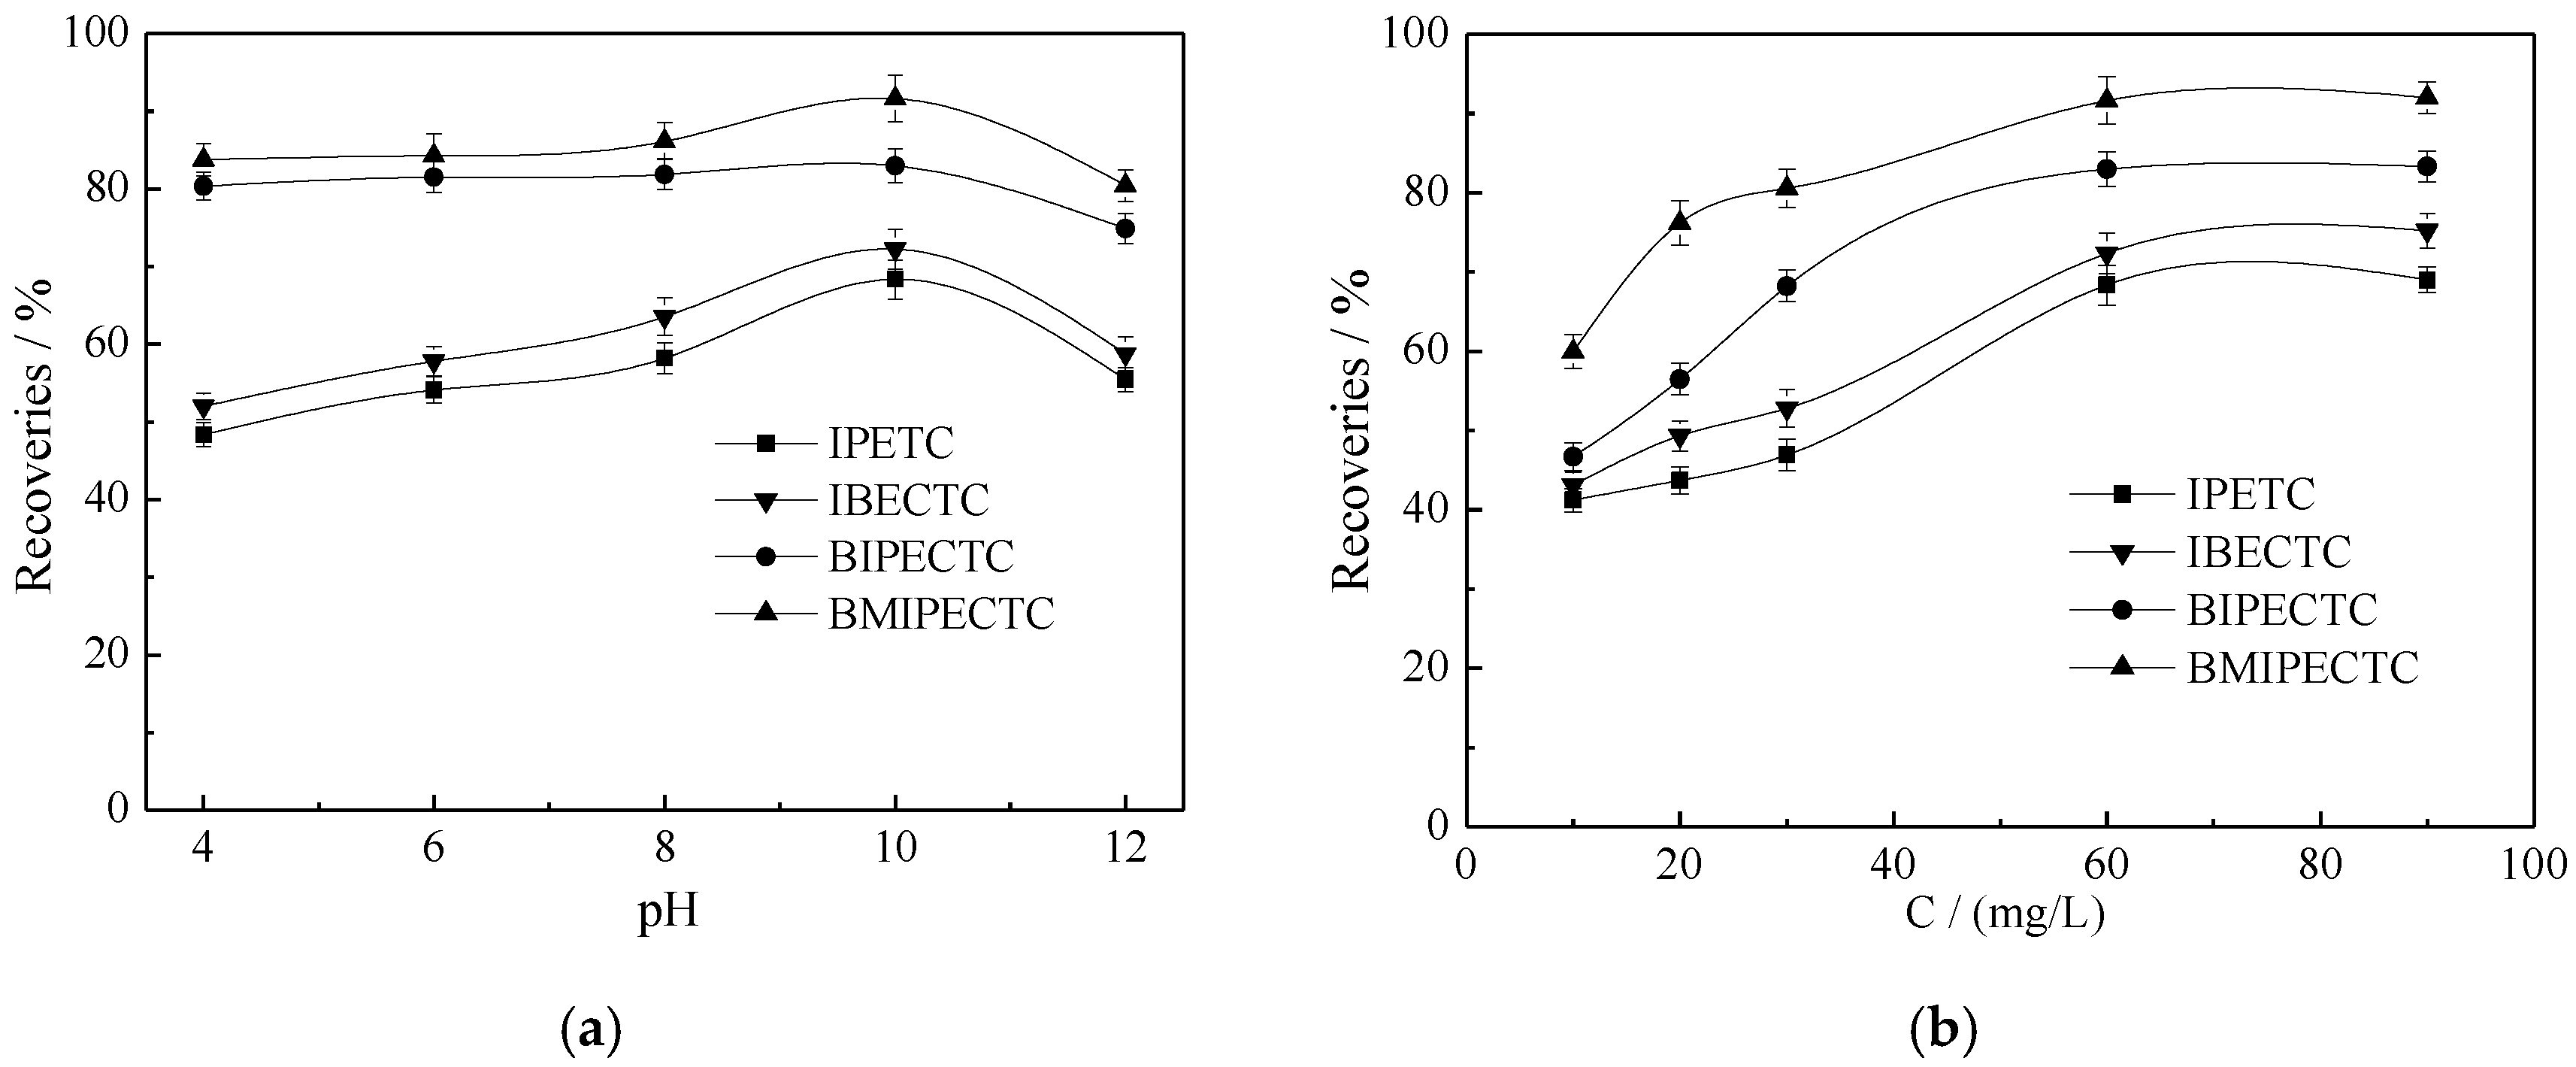
3.3. Micro Flotation

Compared with IPETC and IBECTC, the influences of the pH and collector dosage on the collecting ability of ether thionocarbamates to chalcopyrite were investigated, as shown in Figure 6. In Figure 6a, the collector dosage is 60 mg/L and in Figure 6b, pH = 10.
As shown in Figure 6, the flotation performances of the synthesized ether thionocarbamates for chalcopyrite are obviously better than with IPETC and IBECTC. Additionally, Figure 6a shows that the recovery of chalcopyrite increases with increasing pH when pH < 10, and the recoveries reach a maximum at pH = 10. Figure 6b indicates that the recovery of chalcopyrite gradually increases as the collector dose increases from 10 to 60 mg/L. At the same concentration, the collecting ability to chalcopyrite conforms to the following sequence: BMIPECTC > BIPECTC > IBECTC > IPETC.
To evaluate the recovery changes with changes in both the pH and dosage levels, their response surface plots with both the pH level and dosage as the axes were drawn for BIPECTC and BMIPECTC, as shown in Figure 7.
The effects of the slurry pH and collector dosage on the mineral recovery are more straightforward in the surface plots. In Figure 7, the dark red region represents the higher copper recovery and the dark blue region represents the lower one. From Figure 7, the slurry pH has a weak influence on the recovery of chalcopyrite, however, the copper recovery is better at pH = 8–10 with low collector dosage (less than 20 mg/L) for both BIPECTC and BMIPECTC; meanwhile, the effect of the collector dosage is significant until it exceeds 60 mg/L. The recovery of chalcopyrite increased little when collector dosage is more than 60 mg/L.

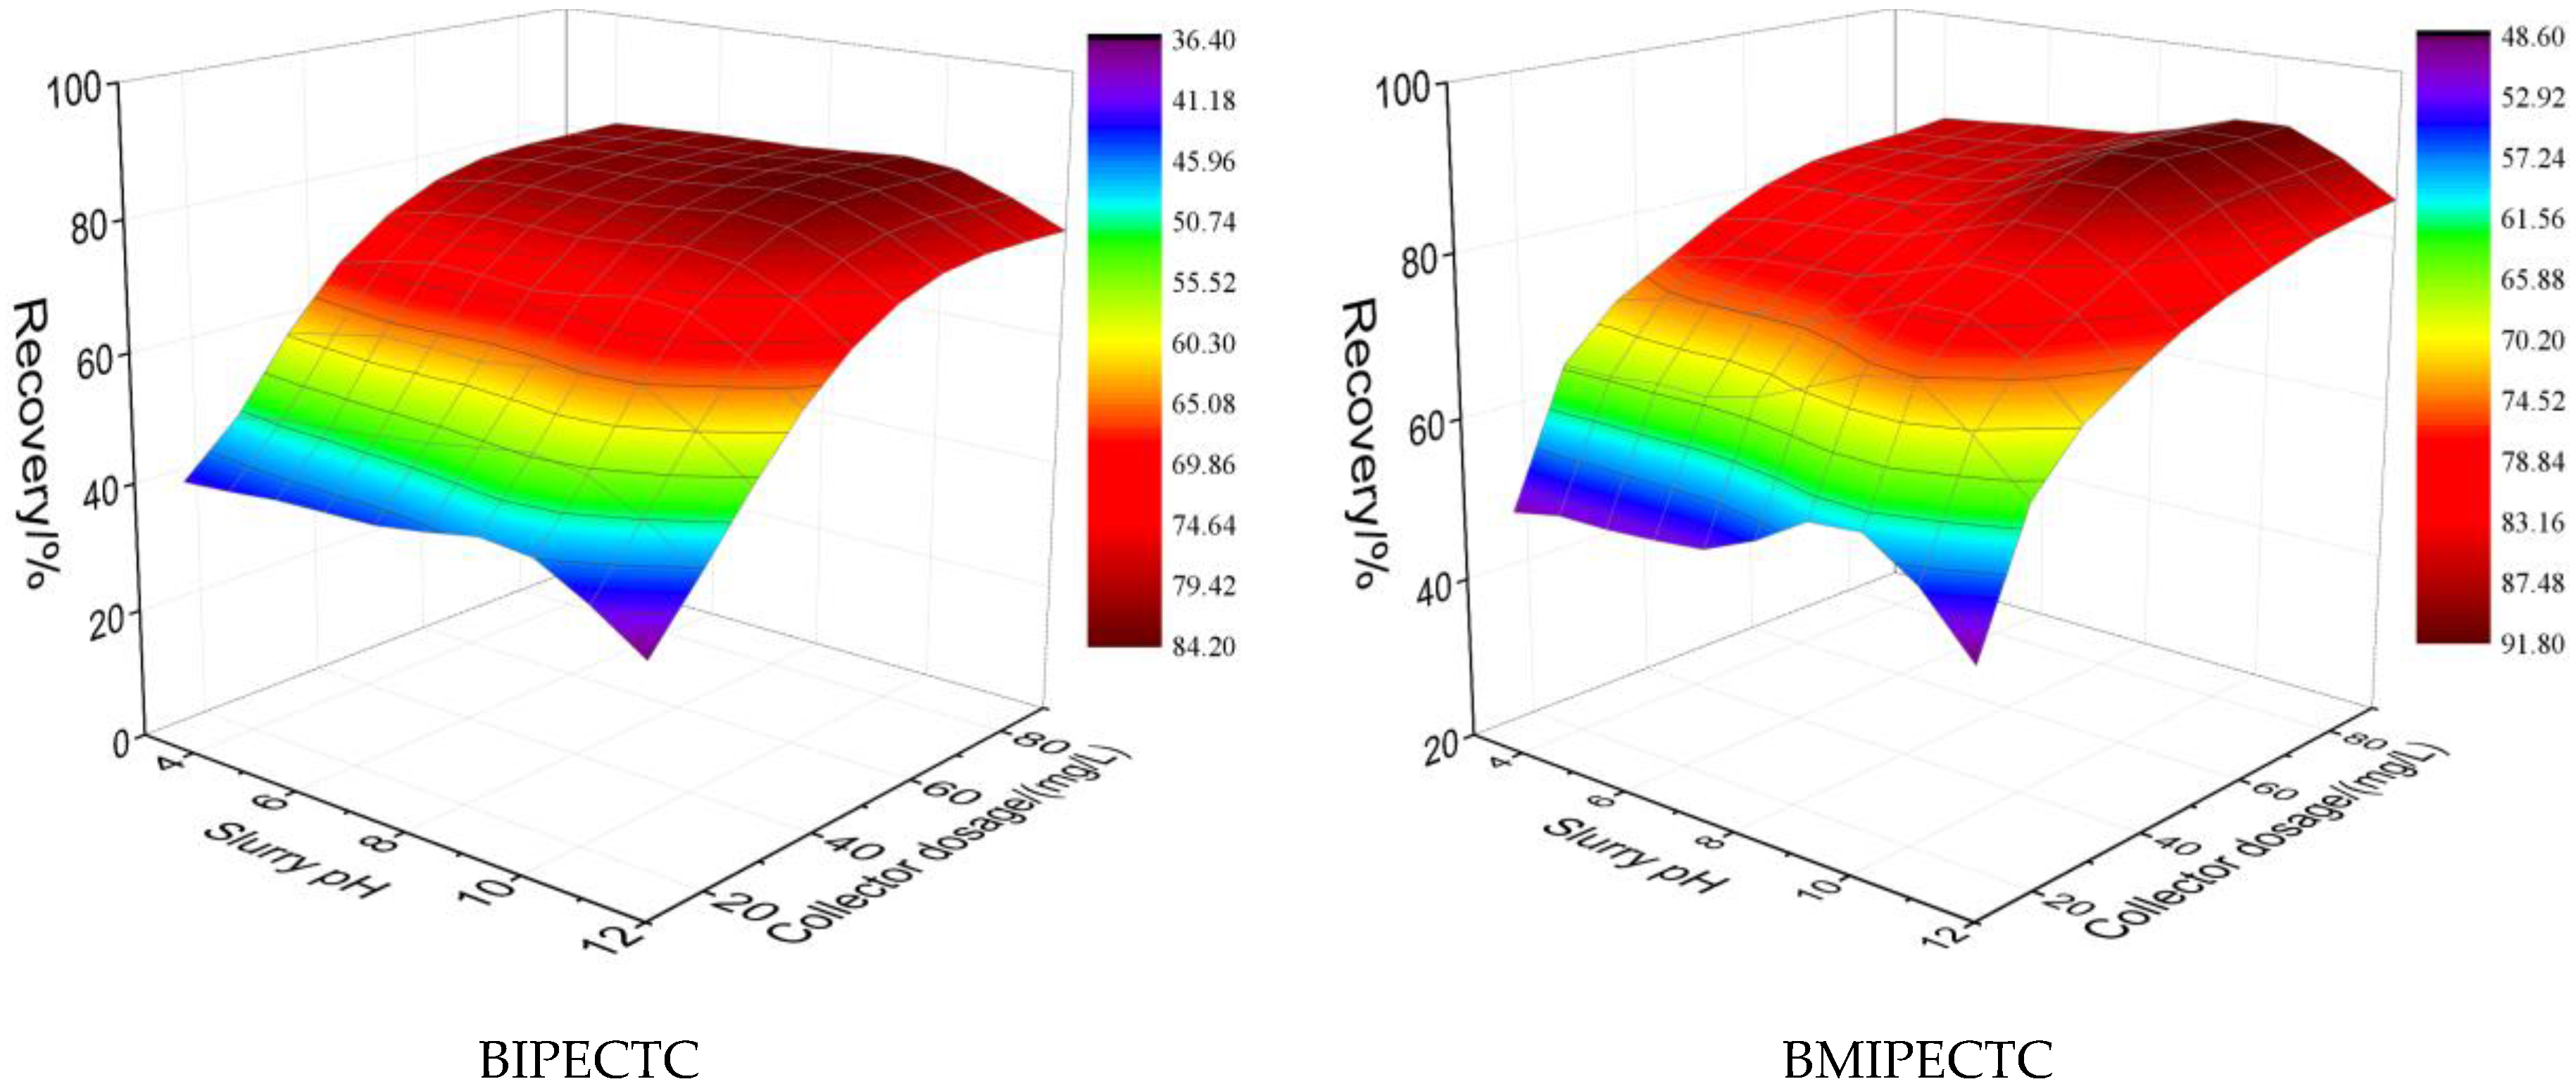
3.4. Batch Flotation Tests

Batch flotation tests were used to investigate the behavior of the synthesized ether thionocarbamates for the porphyry copper–molybdenum ore. The yields of rough concentrate, copper grade and recovery are listed in Table 3, where RSD is the relative standard deviation.
Table 3 indicates that the copper recoveries are improved by the synthesized ether thionocarbamates compared with IPETC and IBECTC, even with fewer MIBC, which serves as frother. The results are consistent with the pure mineral flotation experiments. Furthermore, the assumption was confirmed that the introduction of alkoxyl group endows the thionocarbamates with good frothing properties. We can also conclude that the collecting ability of ether thionocarbamates for copper increases with increasing carbon chains.

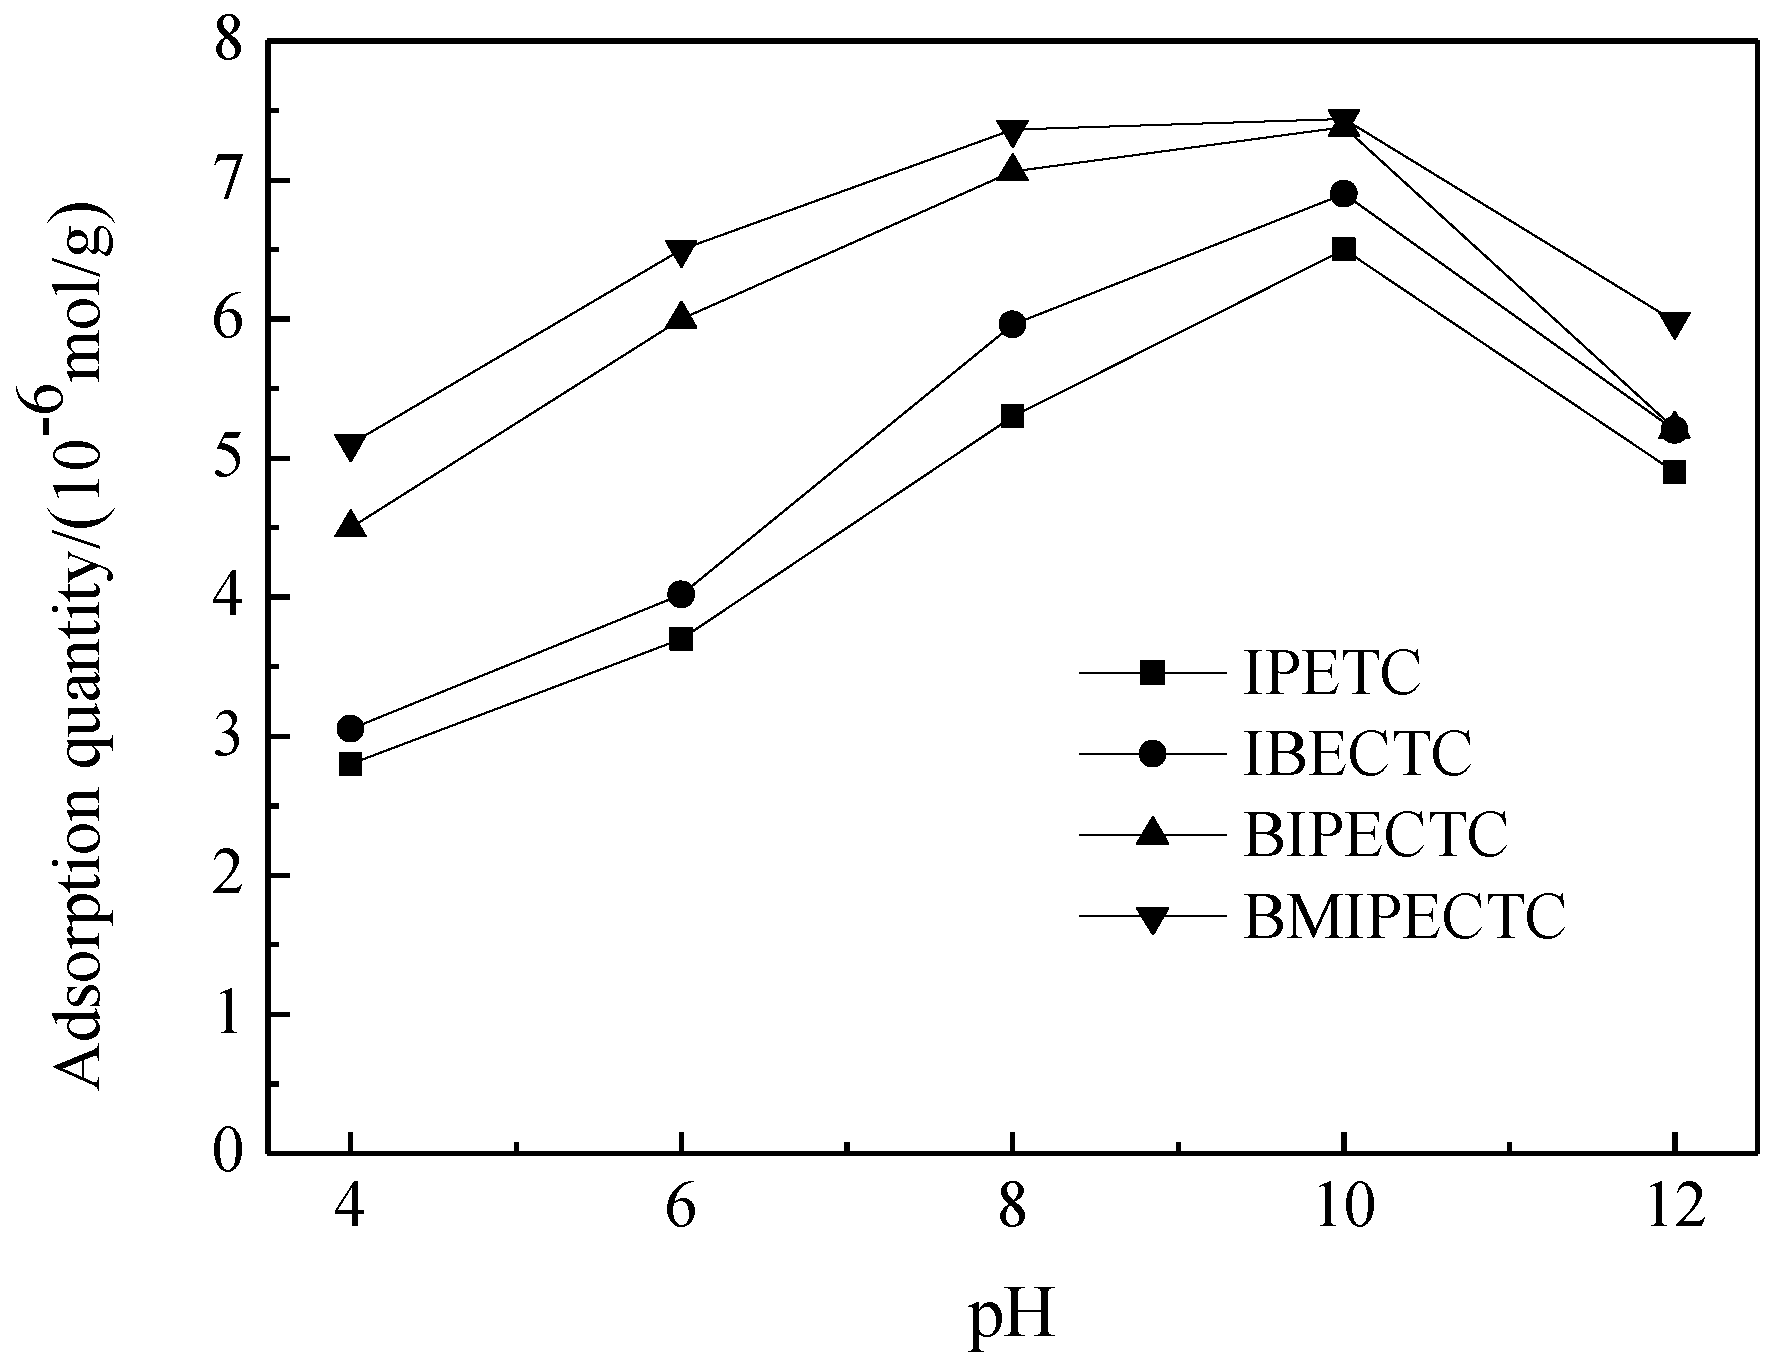
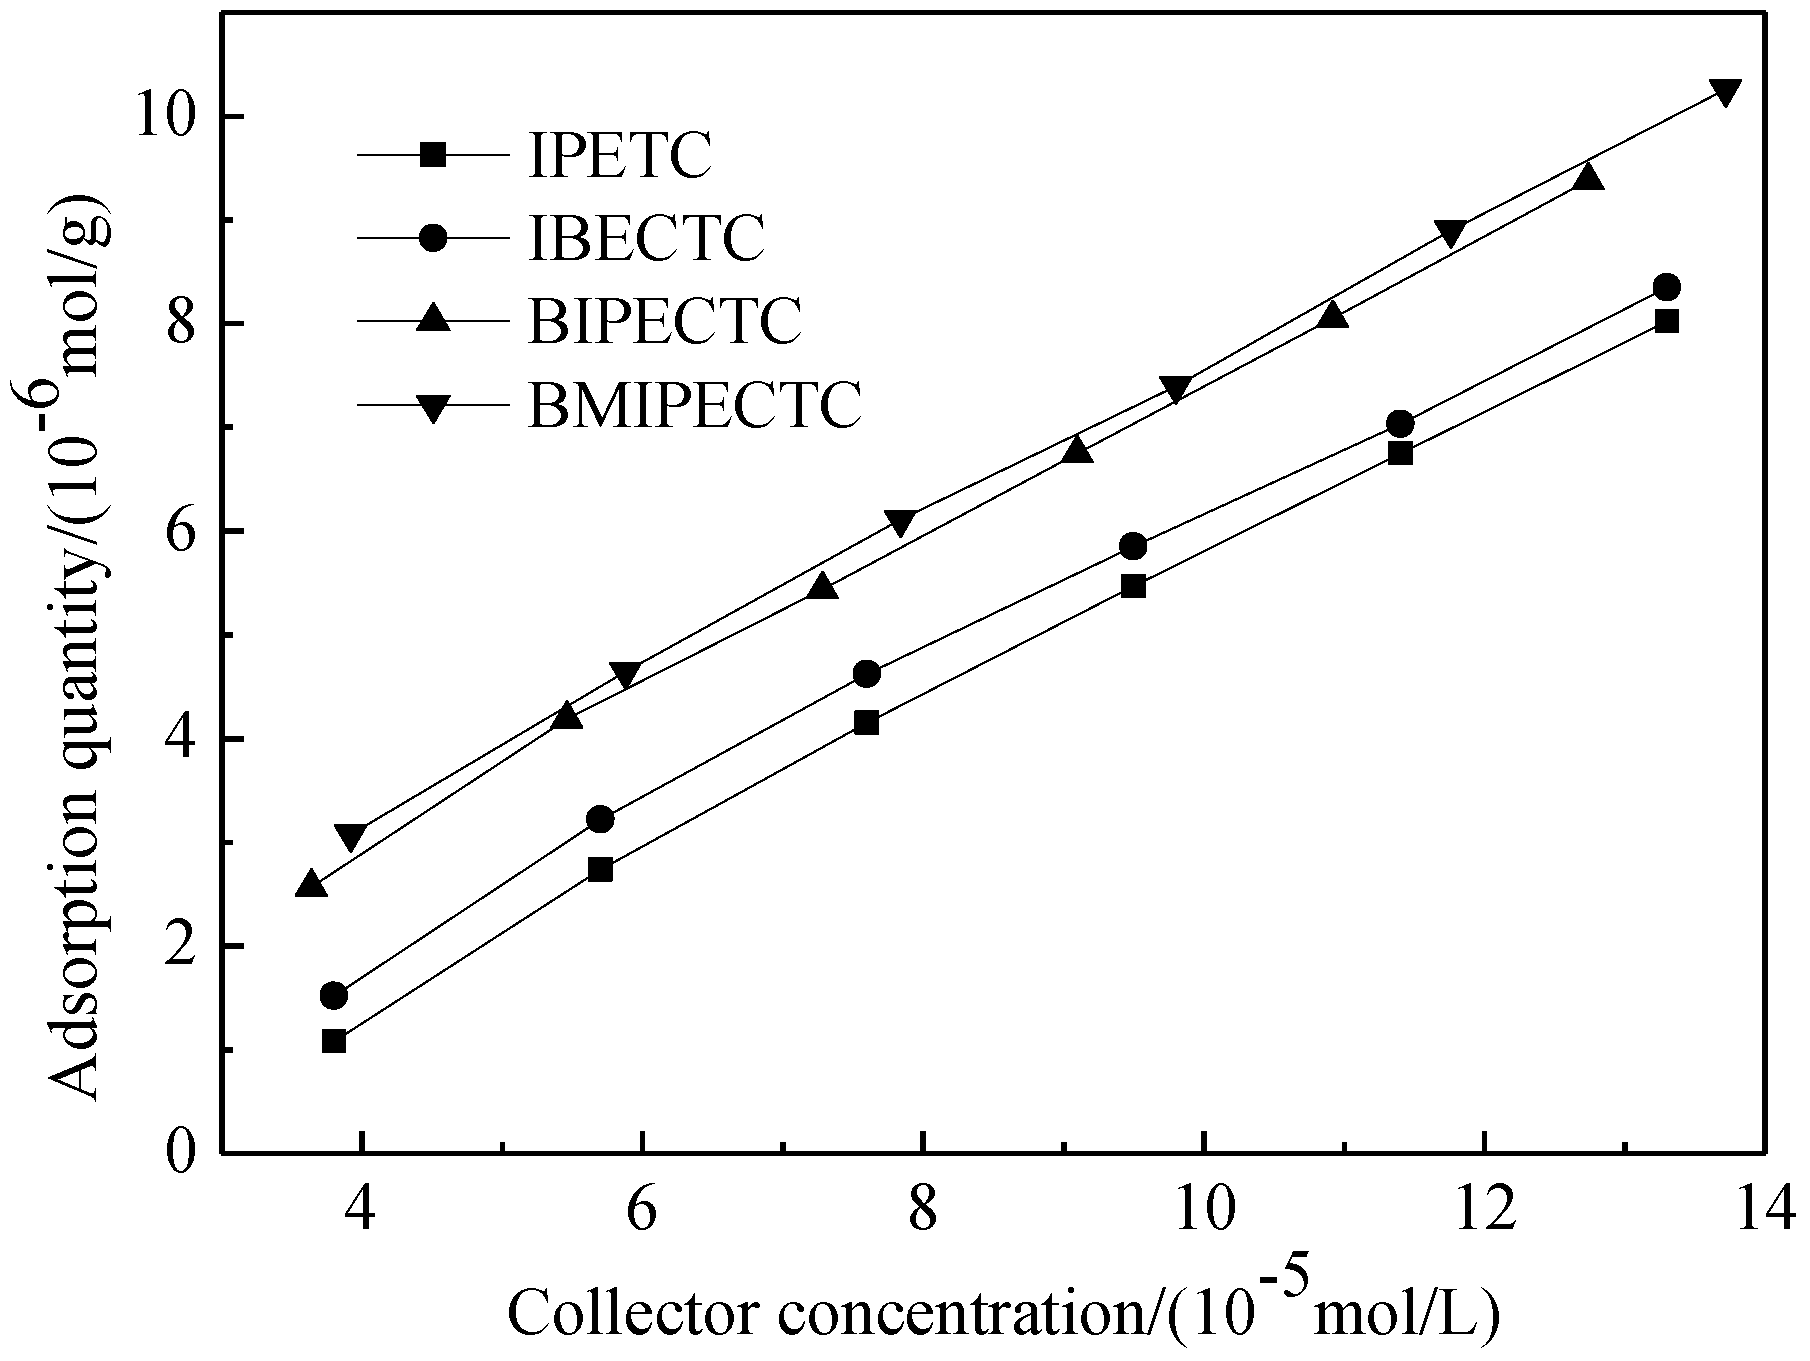
3.5. Adsorption Tests

The adsorption capacity of a collector is known to affect the mineral floatability. The adsorptive capacity for chalcopyrite was measured by the solution pH and initial concentration of collectors. The influence of the solution pH on the adsorptive capacity of chalcopyrite for ether thionocarbamates is shown in Figure 8. At an approximate pH of 8–10, chalcopyrite exhibited better adsorption ability for ether thionocarbamates compared with other pH values. Additionally, the adsorption quantities of the synthesized ether thionocarbamates are stronger than those of IPETC and IBECTC, which is also in agreement with the micro flotation experiments. The adsorptive capacities of chalcopyrite for ether thionocarbamates with different concentrations were measured at pH 9, as shown in Figure 9. The adsorptive capacities for ether thionocarbamates significantly increased with their concentrations. It can be concluded that the adsorptive capacity of chalcopyrite for BMIPECTC is better than for BIPECTC.

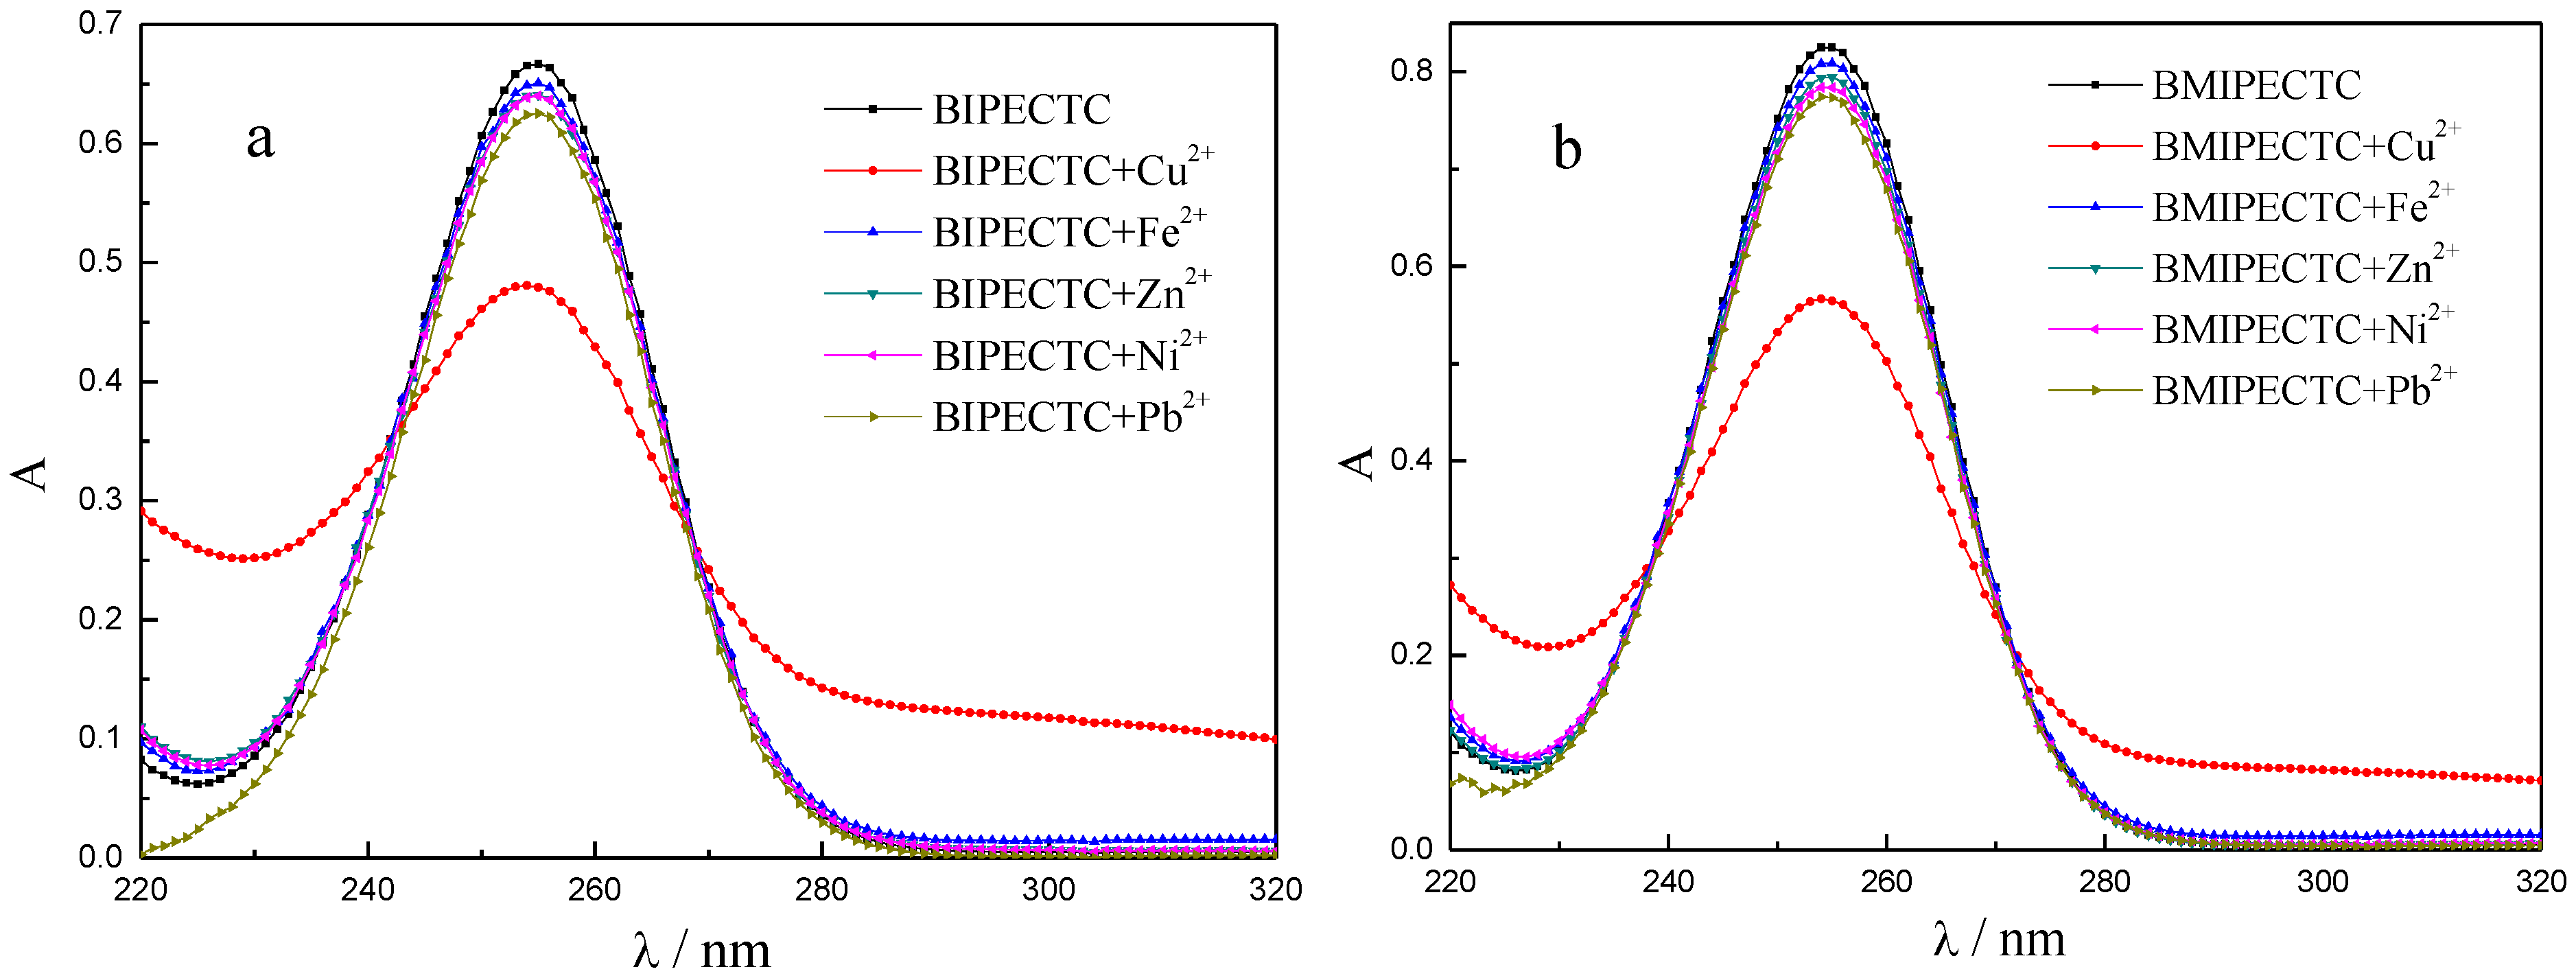
3.6. UV Spectra of Collectors and Metal Ions

UV spectra of the synthesized ether thionocarbamates have been adopted to evaluate the interaction between the collectors and Cu2+, Fe2+, Ni2+, Zn2+ or Pb2+ ions, as shown in Figure 10.
As seen in Figure 10, the absorption peaks for both BIPECTC and BMIPECTC are located at approximately 255 nm. It is apparent that their UV spectrum intensities significantly decreased after they mixed with Cu2+ solution compared with other metal ion solutions. The results indicated that the title products have stronger affinity to copper ion than to other metal ions.

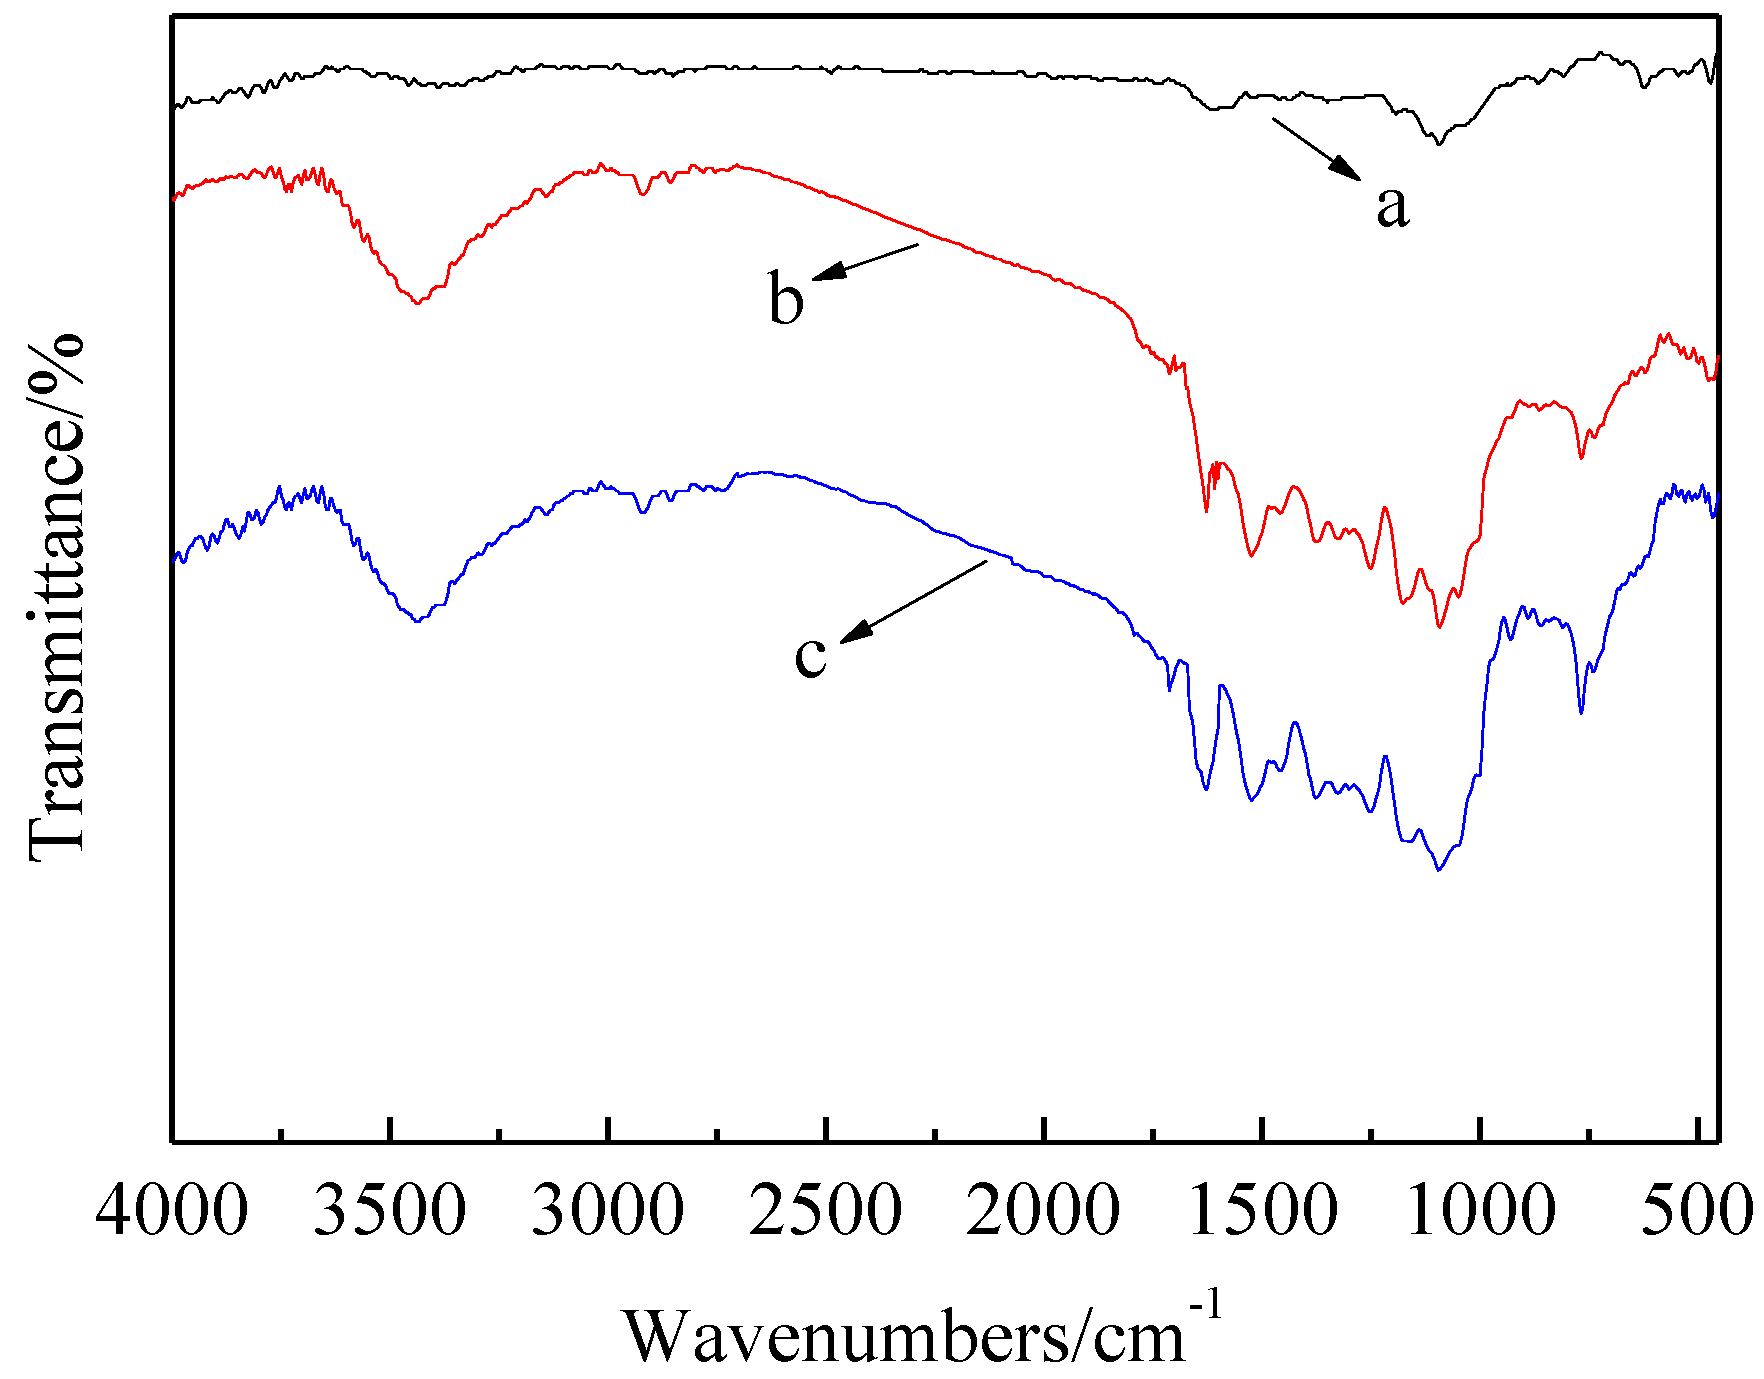
3.7. FTIR Spectra of Chalcopyrite

The FTIR spectra of chalcopyrite and chalcopyrite adsorbed by BIPECTC and BMIPECTC are shown in Figure 11.
In the FTIR spectra of chalcopyrite adsorbed by BIPECTC or BMIPECTC, the absorption peak of C=O stretching vibration was observed at 1627 cm−1. At about 1500 cm−1, the conjunction vibration of C–O and C–N was observed. The C=S stretching vibration was found at 1095 cm−1. The stretching vibration of N–H appeared at around 3400 cm−1. It can be concluded that chemical adsorption occurred on the surface of chalcopyrite.

3.8. Quantum Chemistry Calculation

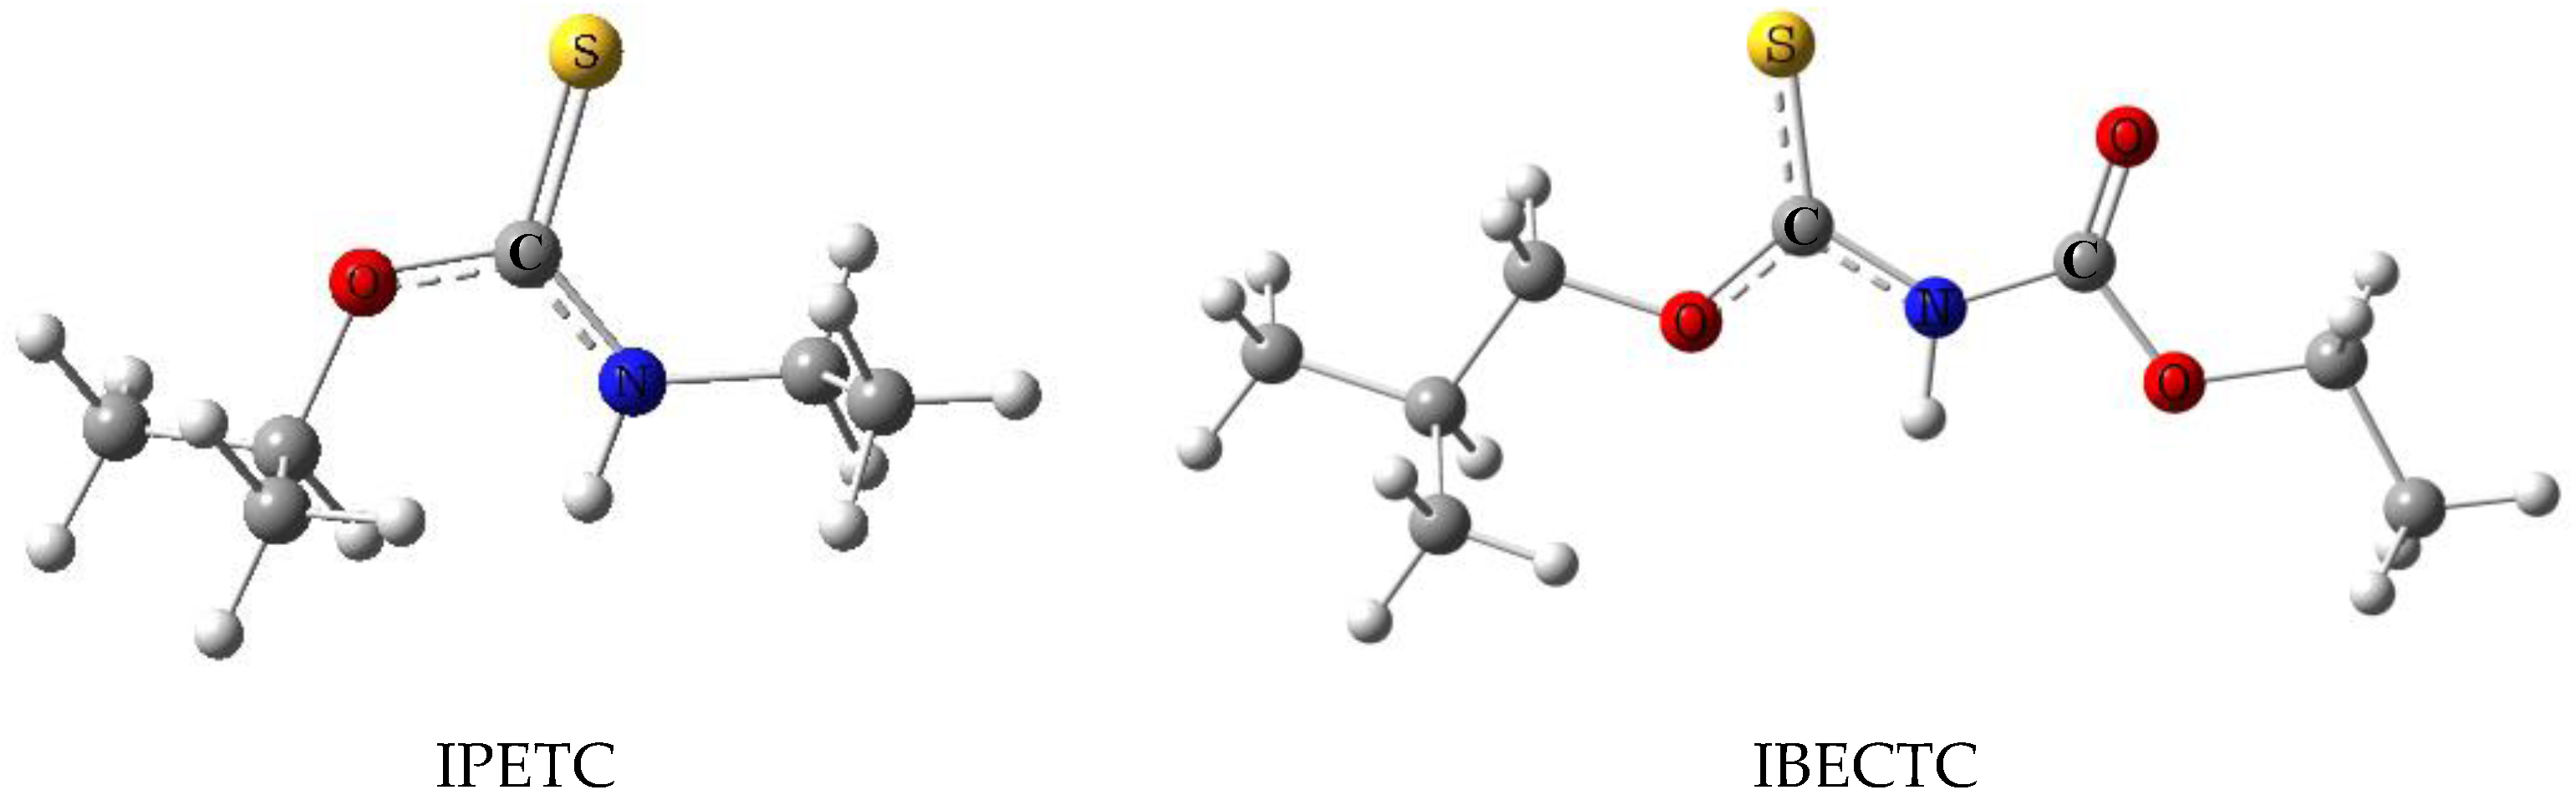
3.8.1. Molecular Geometry

The optimized molecular structures of IPETC, IBECTC and ether thionocarbamates in water are shown in Figure 12 and labeled with the element symbols for C, N, O and S.
As shown in Figure 12, IBECTC and the ether thionocarbamates contain –C(=S)–N–(O=)C– group, and the conjugate –C(=S)–N–(O=)C– group improves the electron delocalization itself, which may result in a stronger ability to accept the back donation electron from mineral metals, such as copper. The dihedral angles of the –C(=S)–N–(O=)C– group in ether thionocarbamates were −0.77987° and 0.57394° for BIPECTC and BMIPECTC, respectively. In other words, it is preferential to form a six-membered ring with a copper ion for the molecular structure. From this point of view, IBECTC may also have a stronger chelating ability for copper ion than IPETC.

3.8.2. Molecular Electrostatic Potential

The molecular electrostatic potential (MEP) describes the electron density in the target molecule, and it is a very useful descriptor to predict the reactive sites for electrophilic or nucleophilic attacks in various reactions [27,28]. The MEP is a plot of the electrostatic potential mapped onto the constant electron density surface. The advantage of the MEP lies in the fact that it simultaneously and visually displays a molecular size and shape as well as positive, negative and neutral electrostatic potential regions in terms of color grading. In the majority of the MEP maps, red and blue represent the regions with the most negative and most positive electrostatic potentials, respectively. The color coding of these maps is in the range between −0.05 (deepest red) and 0.05 a.u. (deepest blue) in compounds. In the present study, 3D plots of MEP for IPETC, IBECTC, BIPECTC and BMIPECTC are shown in Figure 13.
From the MEP maps, it is evident that the negative charge covers the C=S and C=O groups, and the positive region is mainly over the hydrogen that is adjacent to the N atom for IBECTC, BIPECTC and BMIPECTC. As for IPETC, a similar situation is observed without the C=O group. The value of the electrostatic potential is largely responsible for the binding sites of a substrate to its receptor because the receptor and corresponding ligand recognize each other at their molecular surfaces. Consequently, the higher electronegativity in the C=S and C=O groups makes them the most reactive parts in the molecule for denoting electrons to the receptor (such as minerals), forming six-membered chelate rings [16]. Furthermore, the atom net charge obtained from NBO (natural bond orbital) analysis revealed that the S and O atoms in BIPECTC (S −0.212, O −0.651) and BMIPECTC (S −0.213, O −0.651) possess a more negative charge than IBECTC (S −0.200, O −0.641). In other words, BIPECTC and BMIPECTC have stronger affinity to copper ion than IBECTC.

3.8.3. Frontier Molecular Orbitals

Frontier molecular orbitals (FMO), the highest occupied molecular orbital (HOMO) energy and the lowest unoccupied molecular orbital (LUMO), and their properties, such as energy, are very useful and important parameters for quantum chemistry [29]. The energy gap, ΔEHOMO–LUMO is an important value that serves as a stability index. In fact, a large HOMO–LUMO energy gap implies high molecular stability in terms of its lower reactivity in different chemical reactions [30,31,32]. The HOMO represents the ability to donate an electron. The LUMO, as an electron acceptor, represents the ability to obtain an electron. The collecting ability of a collector consists of donating electrons to mineral and accepting feedback electrons from mineral. The calculated energies of HOMO and LUMO are listed in Table 4. As shown in Table 4, the energy gap of BMIPECTC is the smallest, indicating that the chemical reactivity of BMIPECTC is strongest among the four collectors, which is followed by BIPECTC.

3.8.4. Binding Model

The reactivity of a collector to metal ion can reflect its collecting ability to the corresponding mineral to a certain degree [33,34,35]. Accordingly, the binding model between collectors and copper ions is simulated to discuss their collecting ability to chalcopyrite. The optimized geometries of binding model are shown in Figure 14.
To obtain more evidence for the formation of complexes between copper ions and collectors, the bond order is adopted to discuss the bond variation. The bond order is the number of chemical bonds between a pair of atoms, which gives an indication of the stability and strength of a bond. Because the bond order is not a quantum-mechanical observable and this term is not semantically precise, there are many different quantum-chemical definitions of this descriptor among which the Wiberg bond index is useful and extensively used in bond order analysis and is provided by the Gaussian package [36,37,38].
The concerned bonds are shown in Figure 15, and the atom numbers are labeled.
As displayed in Table 5, the Wiberg bond indices of S–Cu are approximately 0.50 and those of O–Cu are approximately 0.23, indicating that new bonds formed between copper ion and the four collectors, which can also be clearly observed from the binding model shown in Figure 14. After IBECTC, BIPECTC and BMIPECTC interact with copper ion, the Wiberg bond indices of C=S and C=O became smaller from the electron transfer to copper ion. Consequently, the N atom and other O atoms in the functional group offer their electrons to compensate for the vacant position in the C=S and C=O groups. As a result, the bond orders for other bonds become slightly larger, as shown in Table 5. In summary, the electrons are better distributed in the functional group after interacting with copper ion. With respect to IPETC, although the bond order of S–Cu is a little larger than that of the corresponding bonds for IBECTC, BIPECTC and BMIPECTC, its binding with copper ion may be not as strong as IBECTC, BIPECTC or BMIPECTC because the combination between IPETC and copper only occurs through the C=S group, while the C=S and C=O groups are both involved in the combination for the latter. Moreover, the combination between copper and BIPECTC or BMIPECTC is stronger than with IBECTC due to the larger Wiberg bond indices of S–Cu and O–Cu.
Furthermore, the energies involved in the binding model were calculated to compare the binding ability of collectors to copper ion. The total energy of binding models, denoted by the system energy, and the binding energy were listed in Table 6. The binding energy of collectors with Cu2+ is calculated according to the following equation: EB = ES − (ECu + EC), where EB is the binding energy; ES is the system energy of the binding model; and ECu and EC are the energy of Cu2+ and collectors, respectively, where ECu = −1639.7966 a.u.
As listed in Table 6, all binding energies are negative such that the reaction between the four collectors and copper ion is spontaneous. Furthermore, the absolute values of the binding energy followed the sequence: BMIPECTC > BIPECTC > IBECTC > IPETC. As a result, the combination between ether thionocarbamates and copper ions is stronger, and the collecting ability of ether thionocarbamates is stronger than that for IPETC and IBECTC.

4. Conclusions

The novel ether thionocarbamates were synthesized from ethoxycarbonyl isothiocyanate and ether alcohol. The introduced alkoxyl group enriched the thionocarbamates with stronger frothing ability and better foam stability than the traditional frother MIBC. The frother dosage may be lowered when using BIPECTC and BMIPECTC as collector, which can be beneficial to the flotation practice. The introduction of alkoxyl group has also improved the performance of thionocarbamates in the flotation of chalcopyrite according to both experimental and theoretical studies. The collecting ability follows the sequence: BMIPECTC > BIPECTC > IBECTC > IPETC from both micro and batch flotation tests. The adsorption capacity measurement also proved this point. FTIR spectra confirmed that chemical adsorption occurred between ether thionocarbamates and chalcopyrite surface. The DFT calculation results revealed that the ether thionocarbamates have higher chemical reactivity and stronger interaction with copper ions than for IPETC and IBECTC according to molecular geometry, MEP, FMO energy and binding model analysis. The computational results are in good accordance with the experimental results, and they are helpful to explain the interaction mechanism between collectors and chalcopyrite.

Acknowledgments

The authors would like to acknowledge the financial support from the National High Technology Research and Development Program of China (863 Program, No. 2013AA064101). This project was also supported by High Performance Computing Center of CSU, China. All calculations were performed on this platform.

Author Contributions

Hong Zong and Jing Peng conceived and designed the experiments; Gang Zhao and Jing Peng performed the experiments and analyzed the data; Shuai Wang and Hong Zong contributed reagents/materials/analysis tools; Gang Zhao wrote the paper. Gang Zhao, Shuai Wang and Guangyi Liu refined the English usage.

Conflicts of Interest

The authors declare no conflict of interest.

References

  1. Acres, R.G.; Harmer, S.L.; Beattie, D.A. Synchrotron XPS, NEXAFS, and ToF-SIMS studies of solution exposed chalcopyrite and heterogeneous chalcopyrite with pyrite. Miner. Eng. 2010, 23, 928–936. [Google Scholar] [CrossRef]
  2. Kalegowda, Y.; Chan, Y.L.; Wei, D.H.; Harmer, S.L. X-PEEM, XPS and ToF-SIMS characterization of xanthate induced chalcopyrite flotation: Effect of pulp potential. Surf. Sci. 2015, 635, 70–77. [Google Scholar] [CrossRef]
  3. Liu, G.Y.; Zhong, H.; Dai, T.G. Investigation of the selectivity of ethoxylcarbonyl thionocarbarbanmetes during the flotation copper sulfides. Miner. Metall. Proc. 2008, 25, 19–24. [Google Scholar]
  4. Qin, W.Q.; Wei, Q.; Jiao, F.; Yang, C.R.; Liu, R.Z.; Wang, P.P.; Ke, L.F. Utilization of polysaccharides as depressants for the flotation separation of copper/lead concentrate. Int. J. Min. Sci. Technol. 2013, 23, 179–186. [Google Scholar] [CrossRef]
  5. Nagaraj, D.R. Development of new flotation chemicals. Trans. Indian Inst. Metall. 1997, 50, 355–363. [Google Scholar]
  6. Bogdanov, O.S.; Vainshenker, I.A.; Podnek, A.K. Trends in the search for effective collectors. Tsvetn. Met. 1976, 9, 72–80. [Google Scholar]
  7. Milosavljević, M.M.; Marinković, A.D.; Veljković, V.B.; Milenković, D.D. Syntheses of N-alkyl, N,N-dialkyl, and N-(4-substituted phenyl) O-ethyl thioncarbamates: A kinetic study. Monatshefte Chem. 2012, 143, 43–49. [Google Scholar] [CrossRef]
  8. Wang, S.S.; Magliocco, L.G. Process of Alkoxy and Aryloxy Isothiocyanate Preparation. U.S. Patent 5,194,673, 16 March 1993. [Google Scholar]
  9. Buckley, A.N.; Hope, G.A.; Lee, K.C.; Petrovic, E.A.; Woods, R. Adsorption of O-isopropyl-N-ethyl thionocarbamate on Cu sulfide ore minerals. Miner. Eng. 2014, 69, 120–132. [Google Scholar] [CrossRef]
  10. Glembotskii, A.V. Theoretical principles of forecasting and modifying collector properties. Tsvetn. Met. 1978, 51, 86–89. [Google Scholar]
  11. Ackerman, P.K.; Harris, G.H.; Klimpel, R.R.; Aplan, F.F. Effect of alkyl substituents on performance of thionocarbamates as copper sulphides and pyrite collectors. In Reagents in the Minerals Industry; Jones, M.P., Oblatt, R., Eds.; Publishing House of the Institution of Mining and Metallurgy: London, UK, 1984; pp. 251–264. [Google Scholar]
  12. Sheridana, M.S.; Nagaraj, D.R.; Fornasiero, D.; Ralston, J. The use of a factorial experimental design to study collector properties of N-allyl-O-alkyl thionocarbamate collector in the flotation of a copper ore. Miner. Eng. 2002, 15, 333–340. [Google Scholar] [CrossRef]
  13. Porento, M.; Hirva, P. Theoretical studies on the interaction of anionic collectors with Cu+, Cu2+, Zn2+ and Pb2+ ions. Theor. Chem. Acc. 2002, 107, 200–205. [Google Scholar] [CrossRef]
  14. Yekeler, M.; Yekeler, H. Reactivities of some thiol collectors and their interactions with Ag (+1) ion by molecular modeling. Appl. Surf. Sci. 2004, 236, 435–443. [Google Scholar] [CrossRef]
  15. Yekeler, M.; Yekeler, H. A density functional study on the efficiencies of 2-mercaptobenzoxazole and its derivatives as chelating agents in flotation processes. Physicochem. Eng. Asp. 2006, 286, 121–125. [Google Scholar] [CrossRef]
  16. Liu, G.Y.; Zhong, H.; Dai, T.G. The separation of Cu/Fe sulfide minerals at slightly alkaline conditions by using ethoxycarbonyl thionocarbamates as collectors: Theory and practice. Miner. Eng. 2006, 19, 1380–1384. [Google Scholar] [CrossRef]
  17. Liu, G.Y.; Zhong, H.; Dai, T.G.; Xia, L.Y. Investigation of the effect of N-substituents on performance of thionocarbamates as selective collectors for copper sulfides by ab initio calculations. Miner. Eng. 2008, 21, 1050–1054. [Google Scholar] [CrossRef]
  18. Bulatovic, S.M. Handbook of Flotation Reagents: Chemistry, Theory and Practice, 1st ed.; Elsevier: Amsterdam, The Netherlands, 2007. [Google Scholar]
  19. Gupta, A.K.; Banerjee, P.K.; Mishra, A.; Satish, P.; Pradip. Effect of alcohol and polyglycol ether frothers on foam stability, bubble size and coal flotation. Int. J. Miner. Process. 2007, 82, 126–137. [Google Scholar] [CrossRef]
  20. Yuan, L.; Zhong, H. Synthesis and reaction with metal ions of a new thionocarbamate. Res. Chem. Intermed. 2012, 38, 903–909. [Google Scholar] [CrossRef]
  21. Gu, Y.L.; Feng, Q.M.; Ou, L.M.; Lü, P.C. A new method of testing frother performance. Trans. Nonferr. Met. Soc. China 2013, 23, 2776–2780. [Google Scholar] [CrossRef]
  22. Lomolino, G.; Vincenzi, S.; Gazzola, D.; Crapisi, A.; Curioni, A. Foaming properties of potato (Solanum tuberosum) proteins: A study by the gas sparging method. Physicochem. Eng. Asp. 2015, 475, 75–83. [Google Scholar] [CrossRef]
  23. Becke, A.D. Density-functional thermochemistry. III. The role of exact exchange. J. Chem. Phys. 1993, 98, 5648. [Google Scholar] [CrossRef]
  24. Frisch, M.J.; Trucks, G.W.; Schlegel, H.B.; Scuseria, G.E.; Robb, M.A.; Cheeseman, J.R.; Scalmani, G.; Barone, V.; Mennucci, B.; Petersson, G.A.; et al. Gaussian 09, Revision A. 02; Gaussian, Inc.: Wallingford, CT, USA, 2009. [Google Scholar]
  25. Gece, G.; Bilgiç, S. A theoretical study of some hydroxamic acids as corrosion inhibitors for carbon steel. Corros. Sci. 2010, 52, 3304–3308. [Google Scholar] [CrossRef]
  26. Liu, G.Y.; Zeng, H.B.; Lu, Q.Y.; Zhong, H.; Choi, P.; Xu, Z.H. Adsorption of mercaptobenzoheterocyclic compounds on sulfide mineral surfaces: A density functional theory study of structure–reactivity relations. Physicochem. Eng. Asp. 2012, 409, 1–9. [Google Scholar] [CrossRef]
  27. Scrocco, E.; Tomasi, J. Electronic molecular structure, reactivity and intermolecular forces: An euristic interpretation by means of electrostatic molecular potentials. Adv. Quantum Chem. 1978, 11, 115–193. [Google Scholar]
  28. Luque, F.J.; López, J.M.; Orozco, M. Perspective on “Electrostatic interactions of a solute with a continuum. A direct utilization of ab initio molecular potentials for the prevision of solvent effects”. Theor. Chem. Acc. 2000, 103, 343–345. [Google Scholar] [CrossRef]
  29. Fukui, K. Role of Frontier Orbitals in Chemical Reactions. Science 1982, 218, 747–754. [Google Scholar] [CrossRef] [PubMed]
  30. Padmaja, L.; Ravikumar, C.; Sajan, D.; Joe, I.H.; Jayakumar, V.S.; Pettict, G.R.; Nielson, O.F. Density functional study on the structural conformations and intramolecular charge transfer from the vibrational spectra of the anticancer drug combretastatin-A2. J. Raman Spectrosc. 2009, 40, 419–428. [Google Scholar] [CrossRef]
  31. Arjunan, V.; Devi, L.; Subbalakshmi, R.; Rani, T.; Mohan, S. Synthesis, vibrational, NMR, quantum chemical and structure-activity relation studies of 2-hydroxy-4-methoxyacetophenone. Mol. Biomol. Spectrosc. 2014, 130, 164–177. [Google Scholar] [CrossRef] [PubMed]
  32. El-Gammal, O.A.; Rakha, T.H.; Metwally, H.M.; Abu El-Reash, G.M. Synthesis, characterization, DFT and biological studies of isatinpicolinohydrazone and its Zn(II), Cd(II) and Hg(II) complexes. Mol. Biomol. Spectrosc. 2014, 127, 144–156. [Google Scholar] [CrossRef] [PubMed]
  33. Bag, B.; Das, B.; Mishra, B.K. Geometrical optimization of xanthate collectors with copper ions and their response to flotation. Miner. Eng. 2011, 24, 760–765. [Google Scholar] [CrossRef]
  34. Zhao, G.; Zhong, H.; Qiu, X.Y.; Wang, S.; Gao, Y.D.; Dai, Z.L.; Huang, J.P.; Liu, G.Y. The DFT study of cyclohexyl hydroxamic acid as a collector in scheelite flotation. Miner. Eng. 2013, 49, 54–60. [Google Scholar] [CrossRef]
  35. Deng, J.S.; Lei, Y.H.; Wen, S.M.; Chen, Z.X. Modeling interactions between ethyl xanthate and Cu/Fe ions using DFT/B3LYP approach. Int. J. Miner. Proces. 2015, 140, 43–49. [Google Scholar] [CrossRef]
  36. Wiberg, K.B. Application of the pople-santry-segal CNDO Method to the cyclopropylcarbinyl and cyclobutyl cation and to bicyclobutane. Tetrahedron 1968, 24, 1083–1096. [Google Scholar] [CrossRef]
  37. Szczepanik, D.W.; Mrozek, J. Ground-state projected covalency index of the chemical bond. Comput. Theor. Chem. 2013, 1023, 83–87. [Google Scholar] [CrossRef]
  38. Sizova, O.V.; Sokolov, A.Y.; Skripnikov, L.V.; Baranovski, V.I. Quantum chemical study of the bond orders in the ruthenium, diruthenium and dirhodium nitrosyl complexes. Polyhedron 2007, 26, 4680–4690. [Google Scholar] [CrossRef]
Figure 1. Diagrammatic sketch of the frothing property determined by the airflow method.
Minerals 06 00097 g001
Figure 2. The flow sheet of rougher flotation for chalcopyrite.
Minerals 06 00097 g002
Figure 3. Maximum foam height and half-life as a function of the frother concentrations in aqueous solution. (a) Foam height; (b) Foam half-life.
Minerals 06 00097 g003
Figure 4. Maximum foam height and half-life as a function of the collector concentrations in slurry. (a) Foam heigh; (b) Foam half-life.
Minerals 06 00097 g004
Figure 5. Relationship between the foam height and half-life.
Minerals 06 00097 g005
Figure 6. Effects of the pH and collector dosage on copper recoveries. (a) Slurry pH (collector dosage: 60 mg/L); (b) Collector dosage (pH = 10)
Minerals 06 00097 g006
Figure 7. Recovery response surface plots with both the slurry pH and collector dosage.
Minerals 06 00097 g007
Figure 8. Adsorption quantity function of pH.
Minerals 06 00097 g008
Figure 9. Adsorption quantity as a function of the collector concentration (pH = 9).
Minerals 06 00097 g009
Figure 10. UV spectra of collectors and their complexes with Cu2+, Fe2+, Ni2+, Zn2+ or Pb2+ ions: (a) BIPECTC; and (b) BMIPECTC.
Minerals 06 00097 g010
Figure 11. FTIR spectra of: (a) chalcopyrite; (b) chalcopyrite + BIPECTC; (c) chalcopyrite + BMIPECTC.
Minerals 06 00097 g011
Figure 12. Optimized geometries of IPETC, IBECTC, BIPECTC and BMIPECTC.
Minerals 06 00097 g012aMinerals 06 00097 g012b
Figure 13. MEP maps for IPETC, IBECTC, BIPECTC and BMIPECTC.
Minerals 06 00097 g013
Figure 14. The binding model between copper ion and BIPECTC, BMIPECTC and IPETC.
Minerals 06 00097 g014
Figure 15. Atom numbers in the functional groups of IPETC, IBECTC, BIPECTC and BMIPECTC.
Minerals 06 00097 g015
Table 1. Chemical analysis of the ore. All percentages are given as weight percentage of the total.
ElementsCu (%)Mo (%)S (%)Fe (%)Au (g/t)Ag (g/t)
Compositions0.3850.0081.2124.0710.2860.950
Table 2. Ore type for copper minerals.
SpeciesSulfidesOxidesTotal Cu
Mass Fraction (%)0.3340.0510.385
Distribution Ratio (%)86.7513.25100.00
Table 3. Comparative Cu recoveries by IPETC, IBECTC and the synthesized products.
Collector and Dosage (g/t)ProductsYields (%)Cu Grades (%)Cu Recoveries (%)
IPETC(24) + MIBC(12)rough concentrate5.545.7382.88
tail94.460.06917.12
crude100.000.383100.00
RSD-2.130.35
IBECTC(24) + MIBC(12)rough concentrate5.765.5883.26
tail94.240.06916.74
crude100.000.386100.00
RSD-2.450.38
BIPECTC(24) + MIBC(8)rough concentrate6.235.1284.39
tail93.770.06315.61
crude100.000.378100.00
RSD-1.870.15
BMIPECTC(24) + MIBC(8)rough concentrate6.575.0685.02
tail93.430.06314.98
crude100.000.391100.00
RSD-2.010.24
Table 4. Calculated energies of HOMO and LUMO (a.u.).
SpeciesHOMOLUMOΔEHOMO–LUMO
IPETC−0.23145−0.025260.20619
IBECTC−0.23961−0.058550.18106
BIPECTC−0.23890−0.058660.18024
BMIPECTC−0.23845−0.058380.18007
Table 5. Wiberg bond indices of the bonds in functional groups of IPETC, IBECTC, BIPECTC, BMIPECTC and the corresponding complexes.
SpeciesC1–S3C1–O2C1–N4S1–Cu----
IPETC1.43451.07771.3048-----
IPETC–Cu1.07841.22521.46710.5393----
SpeciesC1–S7C1–O3C1–N6C2–N6C2–O4C2–O5S7–CuO4–Cu
IBECTC1.61641.08441.12741.04861.67781.0432--
IBECTC–Cu1.35151.24101.17451.09991.39491.21620.46570.2286
BIPECTC1.61121.07721.13581.04711.67761.0447--
BIPECTC–Cu1.35381.22801.18071.10191.40011.20870.47730.2347
BMIPECTC1.61231.07711.13521.04731.67741.0446--
BMIPECTC–Cu1.35321.22921.18101.10161.39991.20890.47780.2344
Table 6. Calculated energies in the binding models.
EnergiesIPETCIBECTCBIPECTCBMIPECTC
Collectors/(a.u.)−764.6715−992.5607−1185.7237−1378.8811
Complexes/(a.u.)−2404.6498−2632.5428−2825.7229−3018.8804
Binding/(kJ/mol)−477.0428−486.8878−532.0930−532.3246

