
Restraining Na-Montmorillonite Delamination in Water by Adsorption of Sodium Dodecyl Sulfate or Octadecyl Trimethyl Ammonium Chloride on the Edges


Abstract
:1. Introduction
2. Experimental
2.1. Sample Preparation
2.2. Pre-Adsorption of SDS and 1831 on the MMT Surface
2.3. Detection of Adsorption Position of SDS and 1831 on MMT Surface
2.3.1. Adsorption of [Cu(tetren)]2+ on the Plant Surface of MMT
2.3.2. Concentration Measurement of SDS and 1831
2.3.3. Adsorption Position of SDS and 1831 on the MMT Surface
3. Results and Discussion
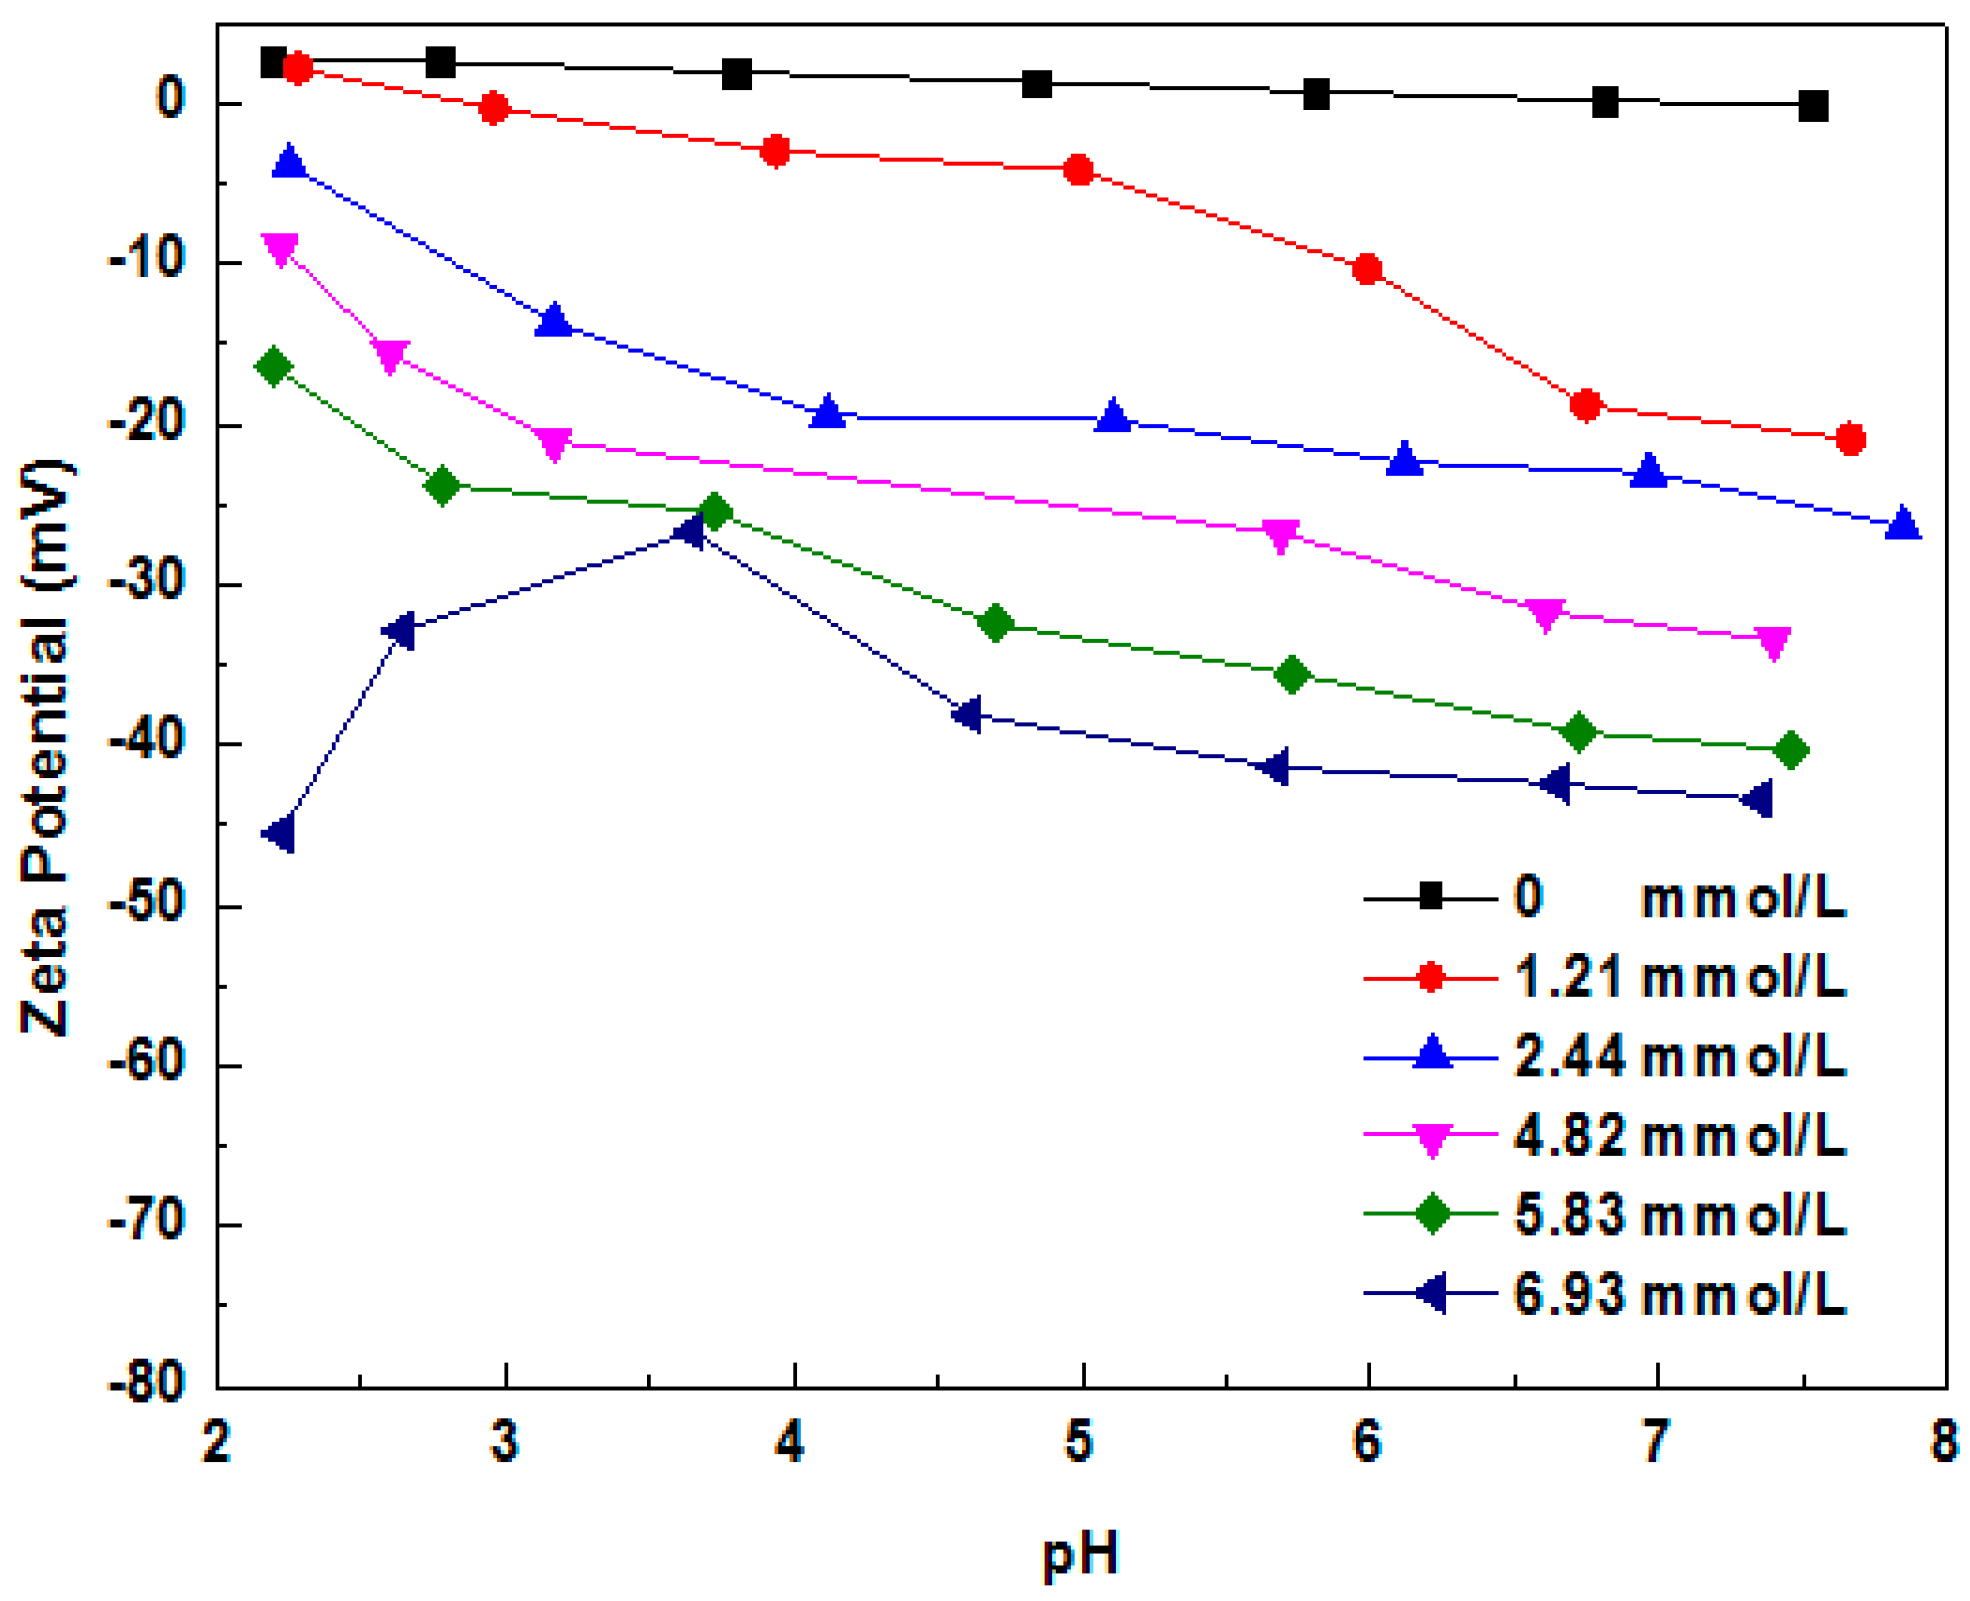
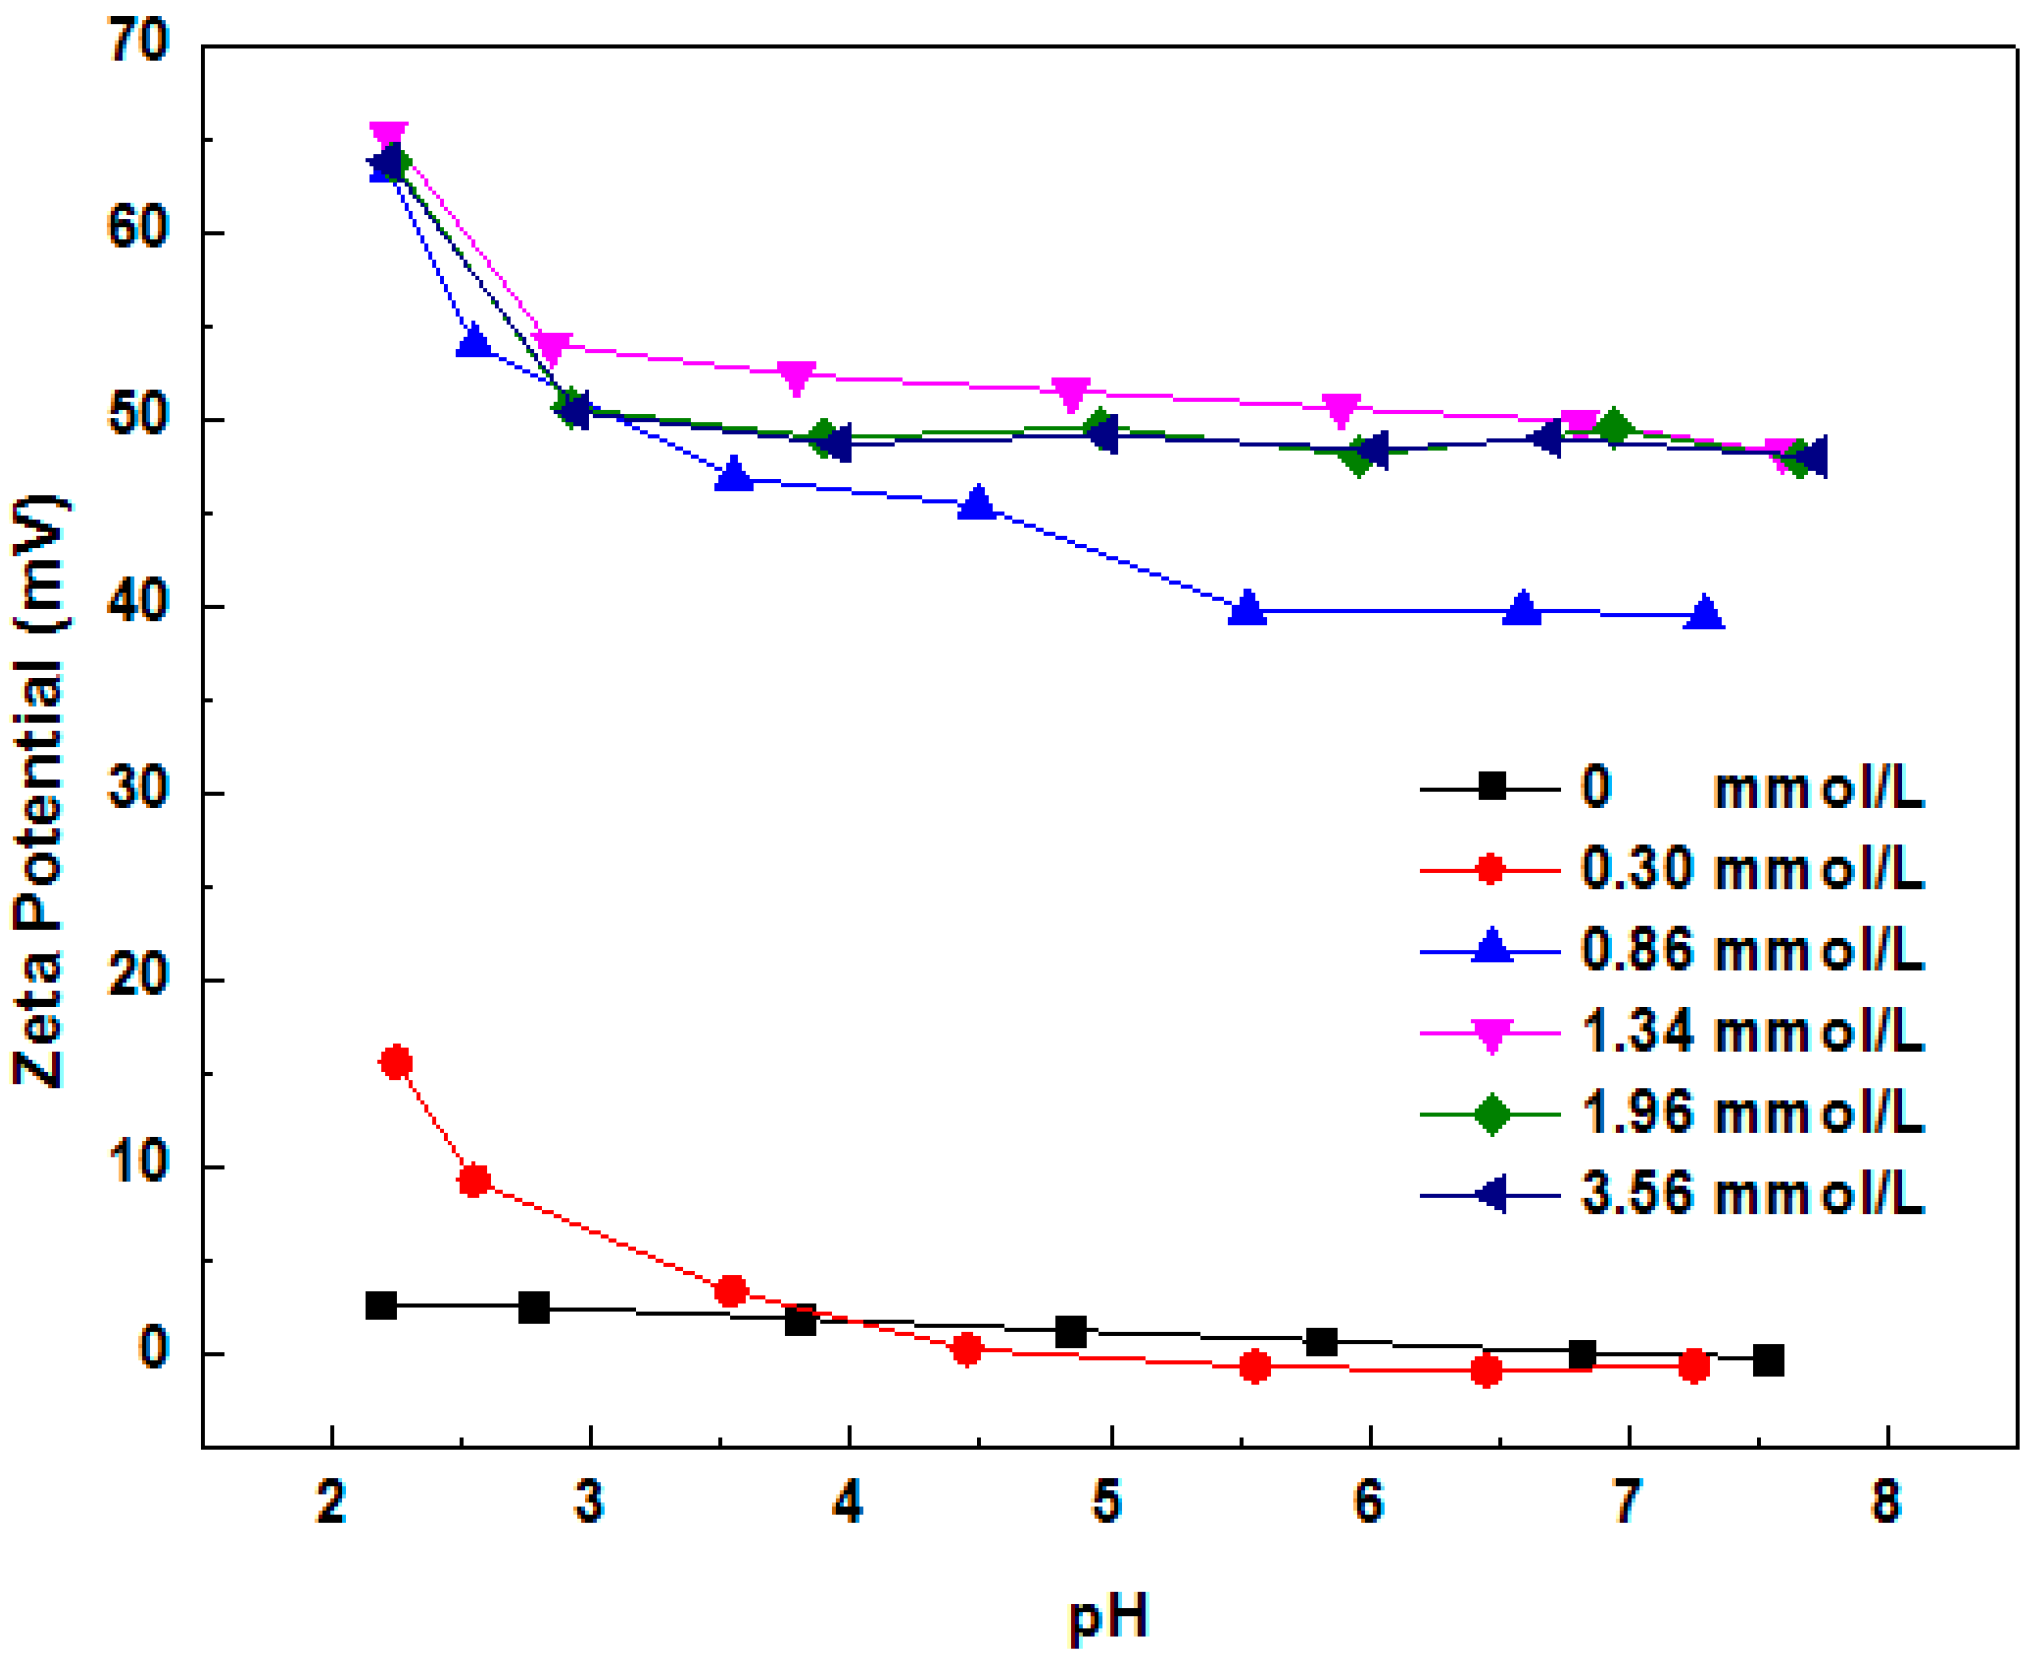
3.1. Restraining Montmorillonite Delamination
3.2. Adsorption Position of SDS and 1831 on the Surface of MMT
4. Conclusions
Acknowledgments
Author Contributions
Conflicts of Interest
References
- Skipper, N.T.; Sposito, L.G.; Chou Chang, F.R. Monte Carlo simulation of interlayer molecular structure in swelling clay minerals. 2. Monolayer hydrates. Clays Clay Miner. 1995, 43, 294–303. [Google Scholar] [CrossRef]
- Güven, N. Molecular aspects of clay-water interactions. In Clay-Water Interface and Its Rheological Implications; Güven, N., Pollastro, R.M., Eds.; CMS Workshop Lectures; The Clay Minerals Society: Chantilly, VA, USA, 1992; Volume 4, pp. 1–80. [Google Scholar]
- Malikova, N.; Cadene, A.; Dubois, E.; Marry, V.; Durand-Vidal, S.; Turq, P.; Breu, J.; Longeville, S.; Zanotti, J.M. Water diffusion in a synthetic hectorite clay studied by quasi-elastic neutron scattering. J. Phys. Chem. C 2007, 111, 17603–17611. [Google Scholar] [CrossRef]
- Johnston, C.T.; Sposito, G.; Erickson, C. Vibrational probe studies of water interactions with montmorillonite. Clays Clay Miner. 1992, 40, 722–730. [Google Scholar] [CrossRef]
- Swenson, J.; Bergman, R.; Longeville, S. A neutron spin-echo study of confined water. J. Chem. Phys. 2001, 115, 11299–11305. [Google Scholar] [CrossRef]
- Sposito, G.; Grasso, D. Electrical double layer structure, forces, and fields at the clay water interface. In Interfacial Forces and Fields: Theory and Applications; Hsu, J.P., Ed.; Marcel Dekker: New York, NY, USA, 1999; pp. 207–249. [Google Scholar]
- Bussière, B. Hydrogeotechnical properties of hard rock tailings from metal mines and emerging geoenvironmental disposal approaches. Can. Geotech. J. 2007, 44, 7–40. [Google Scholar] [CrossRef]
- Biggs, S. Aggregate structures and solid-liquid separation processes. KONA Powder Part. J. 2006, 24, 41–53. [Google Scholar] [CrossRef]
- Jergensen, G.V. Copper Leaching, Solvent Extraction, and Electrowinning Technology; SME: Littleton, CO, USA, 1999. [Google Scholar]
- Gorakhki, M.H.; Bareither, C.A. Salinity effects on sedimentation behavior of kaolin, bentonite, and soda ash mine tailings. Appl. Clay Sci. 2015, 114, 593–602. [Google Scholar] [CrossRef]
- Norrish, K. The swelling of montmorillonite. Discuss. Faraday Soc. 1954, 18, 120–134. [Google Scholar] [CrossRef]
- Norrish, K.; Rausell-Colom, J.A. Low-angle X-ray diffraction studies of the swelling of montmorillonite and vermiculite. In Proceedings of the 10th National Conference on Clays and Clay Minerals, Austin, TX, USA, 14–18 October 1961; Shineford, A., Franks, P.C., Eds.; Pergamon Press: New York, NY, USA, 1963; pp. 123–149. [Google Scholar]
- Cebula, J.D.; Thomas, R.K.; White, J.W. Small angle neutron scattering from dilute aqueous dispersions of clay. J. Chem. Soc. Faraday Trans. 1 Phys. Chem. Condens. Phases 1980, 76, 314–321. [Google Scholar] [CrossRef]
- Schramm, L.L.; Kwak, J.C.T. Influence of exchangeable cation composition on the size and shape of montmorillonite particles in dilute suspension. Clays Clay Miner. 1982, 30, 40–48. [Google Scholar] [CrossRef]
- Nadeau, P. The physical dimensions of fundamental particles. Clay Miner. 1985, 20, 499–514. [Google Scholar] [CrossRef]
- Avery, R.G.; Ramsay, J.D.F. Colloidal properties of synthetic hectorite clay dispersions. III. Light and small angle neutron scattering. J. Colloid Interface Sci. 1986, 109, 448–454. [Google Scholar] [CrossRef]
- Sposito, G. The diffuse-ion swarm near smectitic particles suspended in 1:1 electrolyte solutions: Modified Gouy-Chapman theory and quasicrystal formation. In Clay-Water Interface and Its Rheological Implications; Güven, N., Pollastro, R.M., Eds.; CMS Workshop Lectures; The Clay Minerals Society: Chantilly, VA, USA, 1992; Volume 4, pp. 128–155. [Google Scholar]
- Jasmund, K.; Lagaly, G. Tonminerale und Tone. Struktur, Eigenschaften, Anwen-Dung und Einsatz in Industrie und Umwelt; Steinkopff: Darmstadt, Germany, 1993; pp. 10–20. (In German) [Google Scholar]
- Lagaly, G. From clay mineral crystals to colloidal clay mineral dispersions. In Coagulation and Flocculation. Theory and Applications; Dobias, B., Ed.; Marcel Dekker: New York, NY, USA, 1993; pp. 427–494. [Google Scholar]
- Lagaly, G. From clay minerals to clay mineral dispersions. In Coagulation and Flocculation, 2nd ed.; Stechemesser, H., Dobias, B., Eds.; Taylor and Francis: Boca Raton, FL, USA, 2005; pp. 519–600. [Google Scholar]
- Morodome, S.; Kawamura, K. In situ X-ray diffraction study of the swelling of montmorillonite as affected by exchangeable cations and temperature. Clays Clay Miner. 2011, 59, 165–175. [Google Scholar] [CrossRef]
- Brigatti, M.F.; Galan, E.; Theng, B.K.G. Chapter 2: Structure and minerlaogy of clay minerals. In Hand Book of Clay Science; Elsevier: Amsterdam, The Netherlands, 2012; p. 42. [Google Scholar]


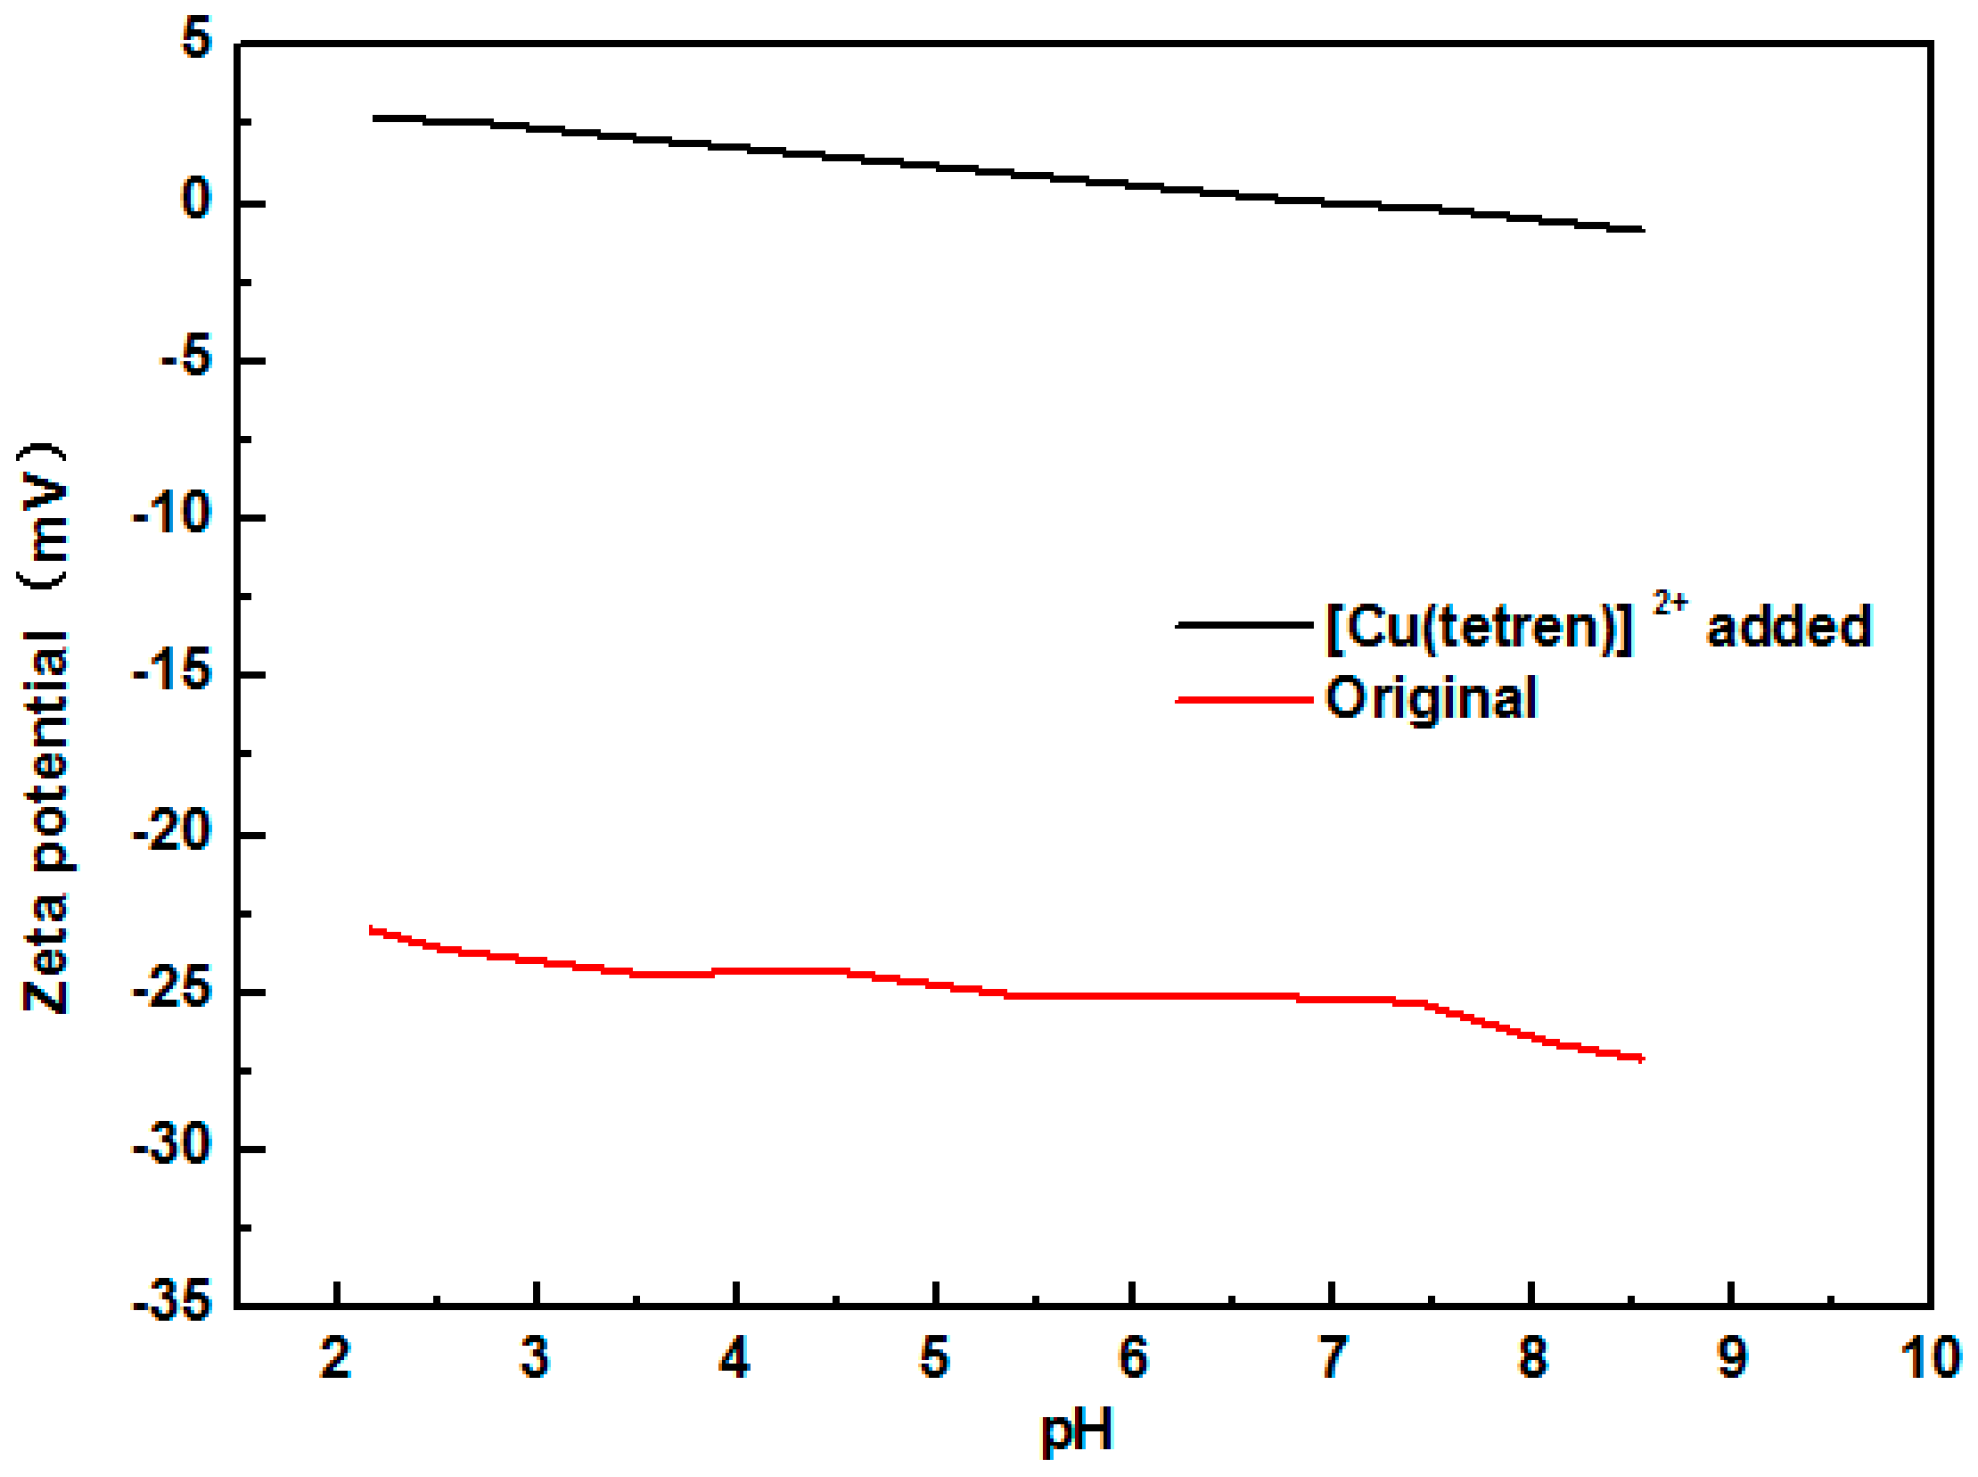
 : [Cu(tetren)]2+;
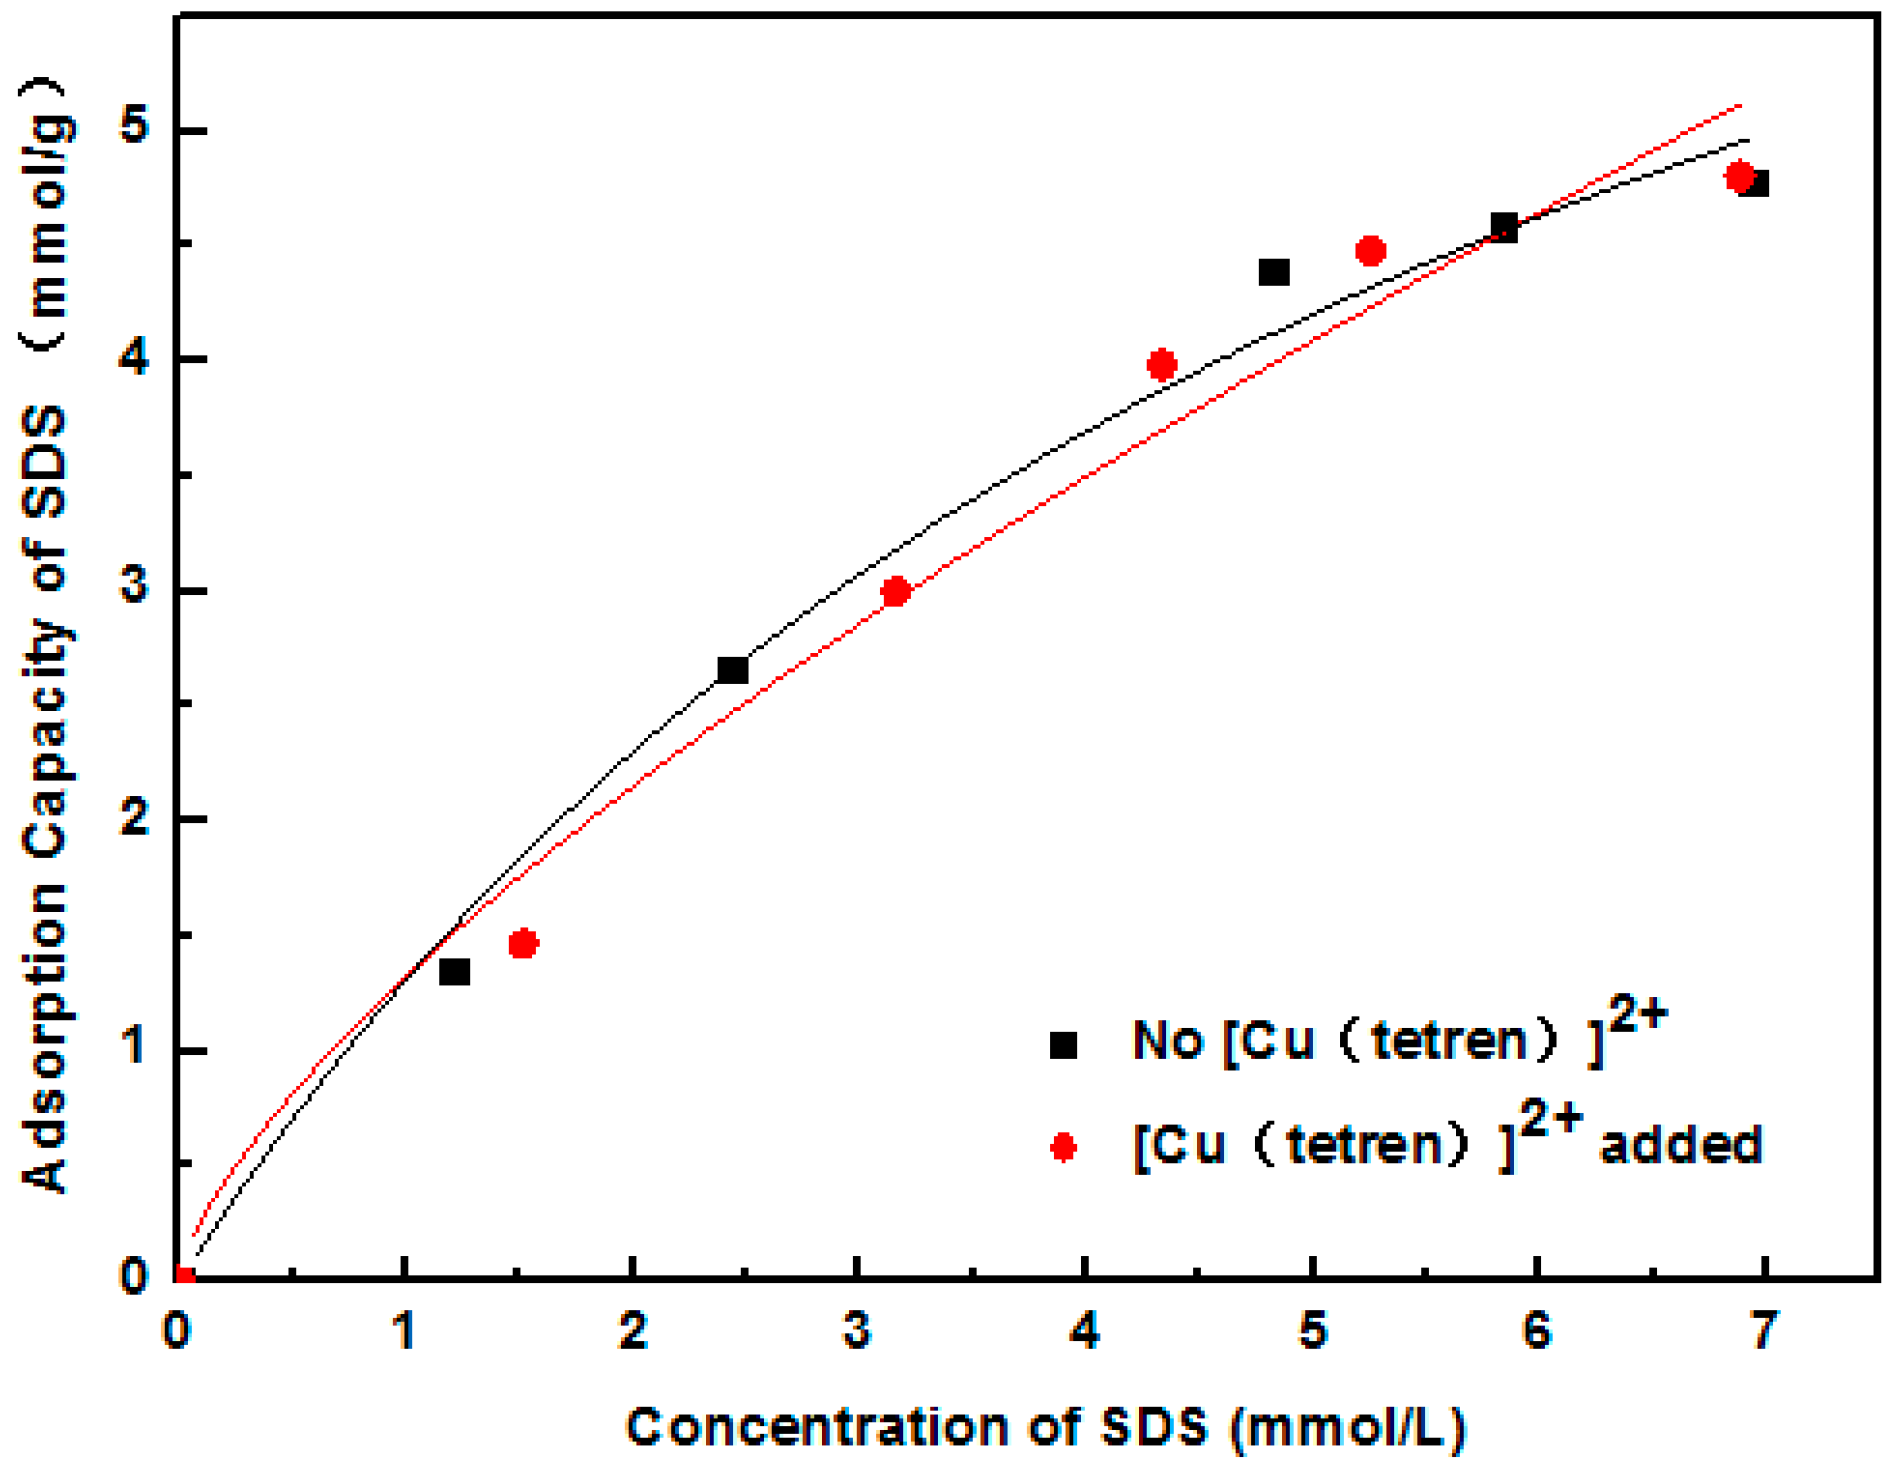
  : SDS;
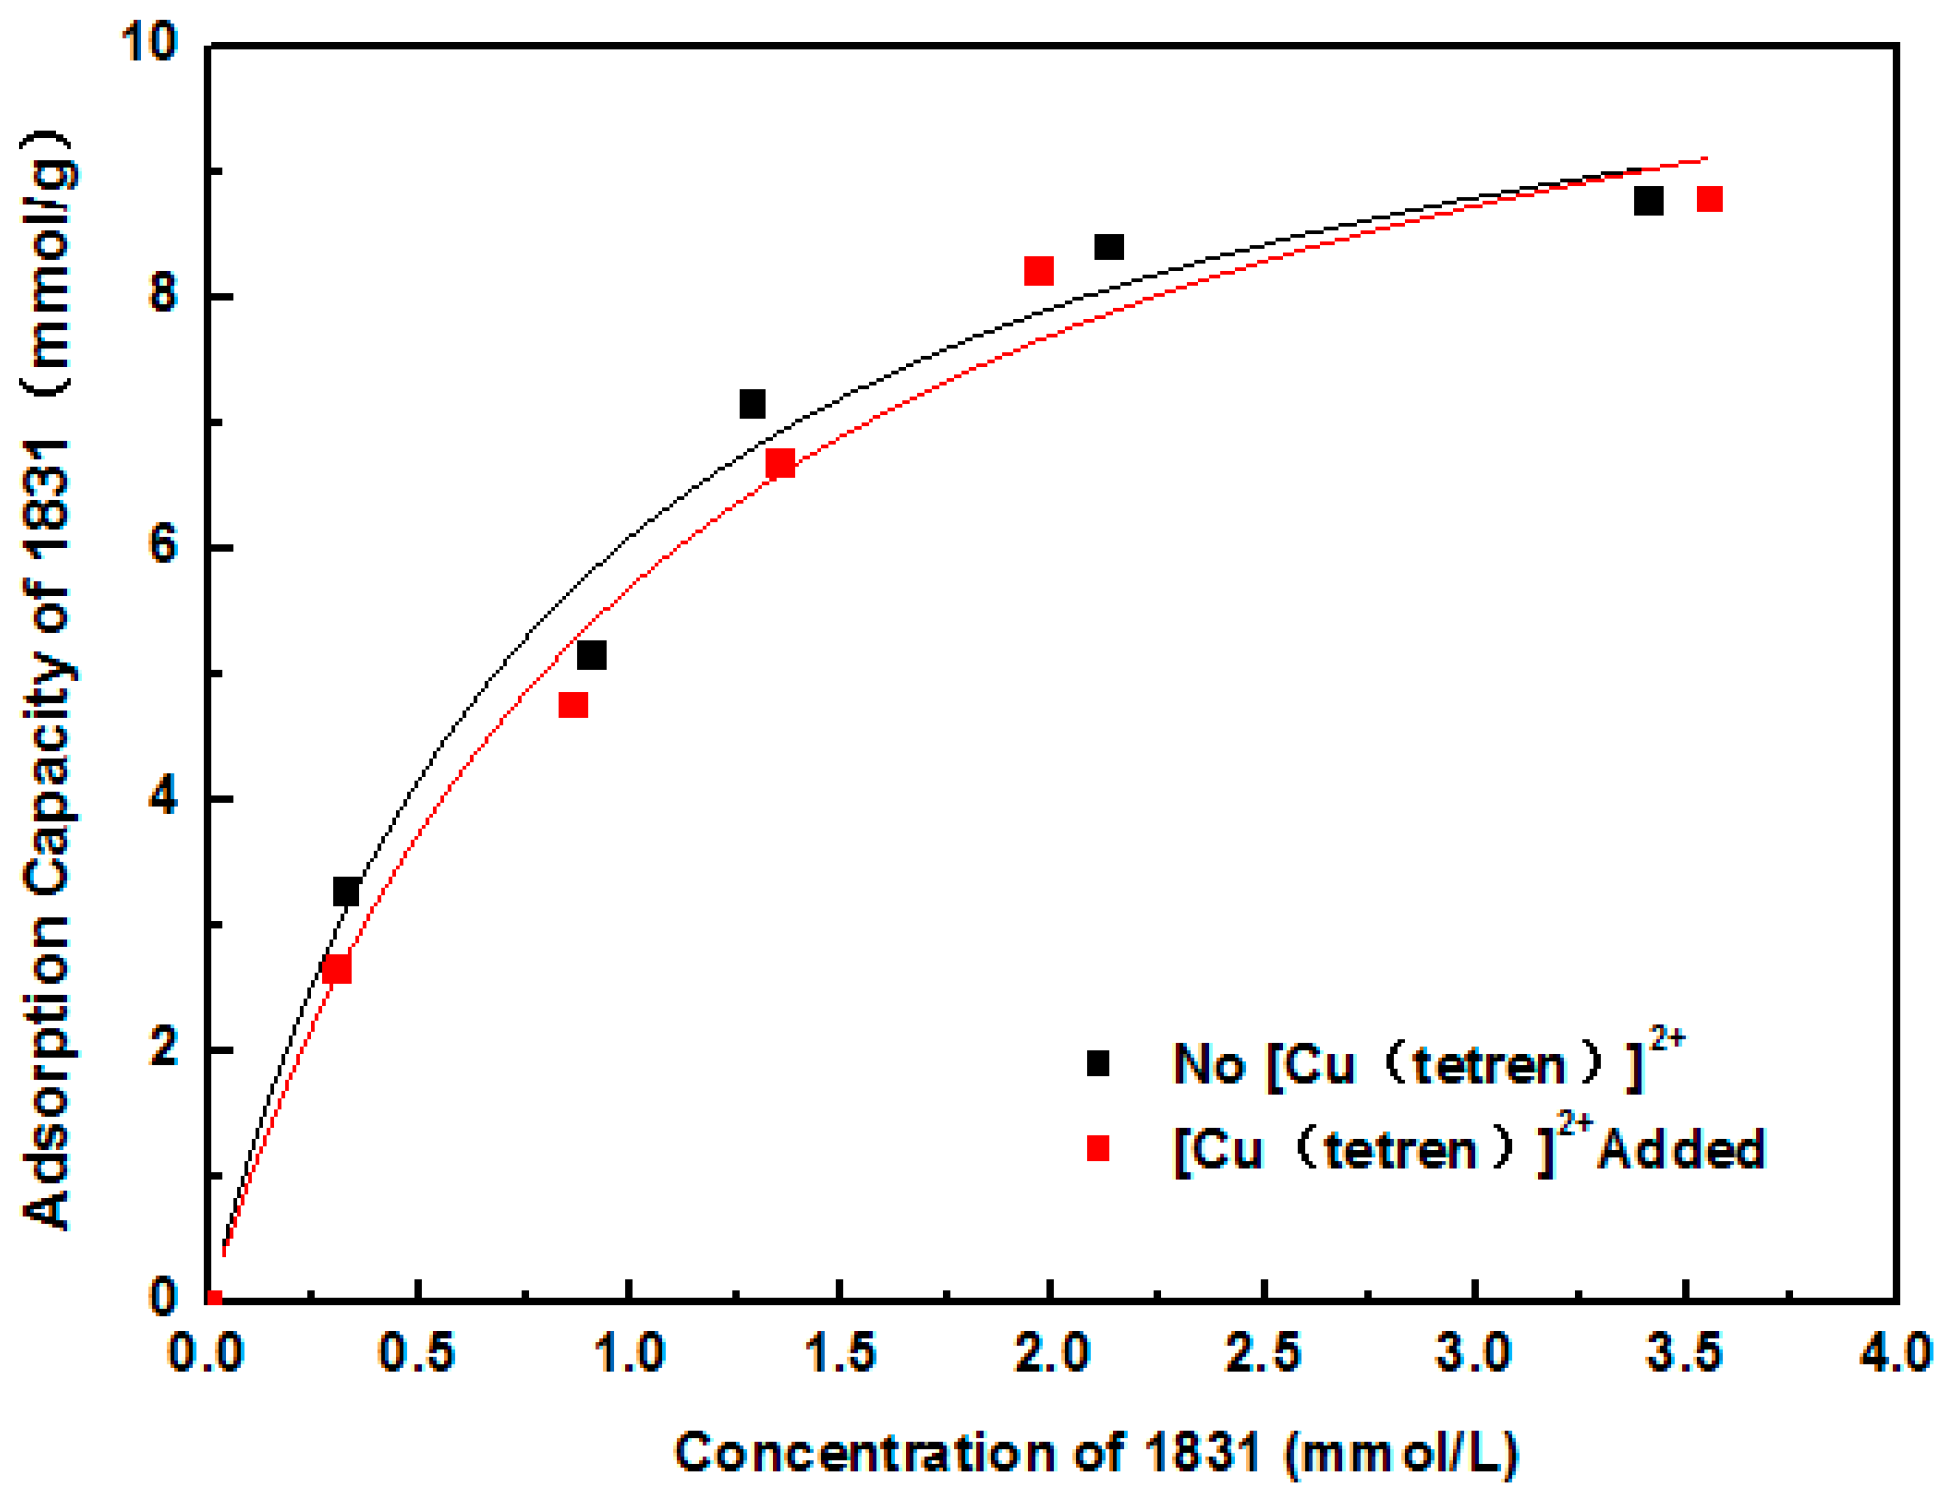
  : 1831).
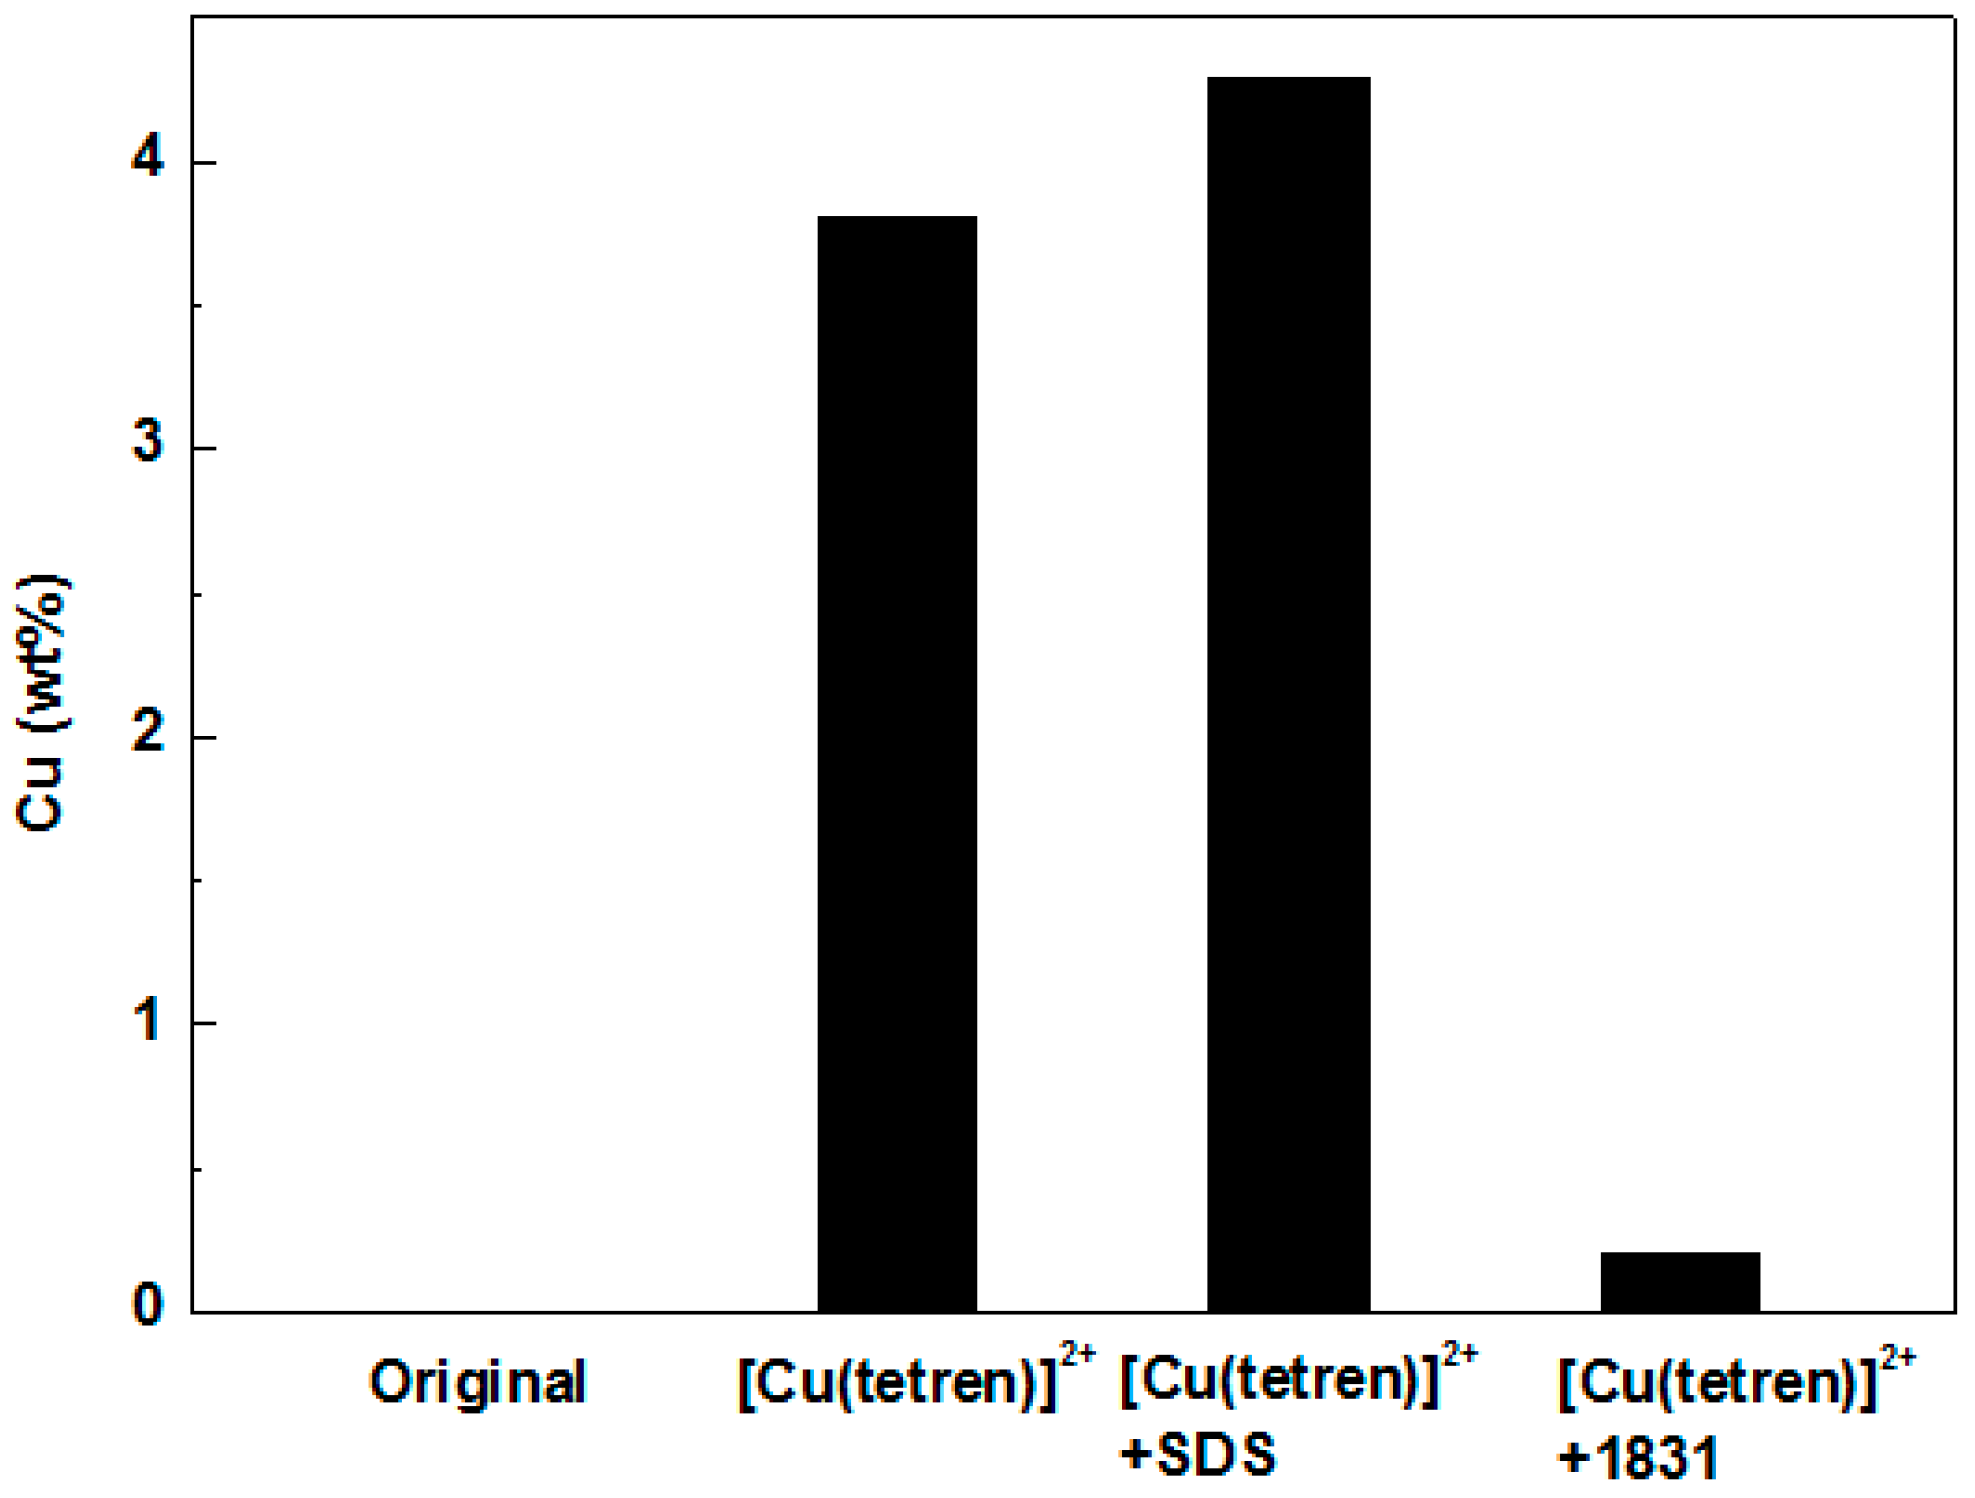
: [Cu(tetren)]2+; : SDS; : 1831).
: 1831).
: [Cu(tetren)]2+; : SDS; : 1831).
© 2016 by the authors; licensee MDPI, Basel, Switzerland. This article is an open access article distributed under the terms and conditions of the Creative Commons Attribution (CC-BY) license (http://creativecommons.org/licenses/by/4.0/).
Share and Cite
Li, H.; Zhao, Y.; Chen, T.; Nahmad, Y.; Song, S. Restraining Na-Montmorillonite Delamination in Water by Adsorption of Sodium Dodecyl Sulfate or Octadecyl Trimethyl Ammonium Chloride on the Edges. Minerals 2016, 6, 87. https://doi.org/10.3390/min6030087
Li H, Zhao Y, Chen T, Nahmad Y, Song S. Restraining Na-Montmorillonite Delamination in Water by Adsorption of Sodium Dodecyl Sulfate or Octadecyl Trimethyl Ammonium Chloride on the Edges. Minerals. 2016; 6(3):87. https://doi.org/10.3390/min6030087
Chicago/Turabian StyleLi, Hongliang, Yunliang Zhao, Tianxing Chen, Yuri Nahmad, and Shaoxian Song. 2016. "Restraining Na-Montmorillonite Delamination in Water by Adsorption of Sodium Dodecyl Sulfate or Octadecyl Trimethyl Ammonium Chloride on the Edges" Minerals 6, no. 3: 87. https://doi.org/10.3390/min6030087