Article

Kinetics and Mechanisms of Chalcopyrite Dissolution at Controlled Redox Potential of 750 mV in Sulfuric Acid Solution

1
School of Resources and Environmental Engineering, Wuhan University of Technology, Wuhan 430070, China
2
Natural and Built Environments Research Centre, School of Natural and Built Environments, University of South Australia, Mawson Lakes, SA 5095, Australia
3
Blue Minerals Consultancy, 13 Mill Terrace, Middleton, SA 5213, Australia
*
Authors to whom correspondence should be addressed.
Minerals 2016, 6(3), 83; https://doi.org/10.3390/min6030083
Submission received: 18 June 2016 / Revised: 21 July 2016 / Accepted: 30 July 2016 / Published: 10 August 2016

Abstract

:
To better understand chalcopyrite leach mechanisms and kinetics, for improved Cu extraction during hydrometallurgical processing, chalcopyrite leaching has been conducted at solution redox potential 750 mV, 35–75 °C, and pH 1.0 with and without aqueous iron addition, and pH 1.5 and 2.0 without aqueous iron addition. The activation energy (Ea) values derived indicate chalcopyrite dissolution is initially surface chemical reaction controlled, which is associated with the activities of Fe3+ and H+ with reaction orders of 0.12 and −0.28, respectively. A surface diffusion controlled mechanism is proposed for the later leaching stage with correspondingly low Ea values. Surface analyses indicate surface products (predominantly Sn2− and S0) did not inhibit chalcopyrite dissolution, consistent with the increased surface area normalised leach rate during the later stage. The addition of aqueous iron plays an important role in accelerating Cu leaching rates, especially at lower temperature, primarily by reducing the length of time of the initial surface chemical reaction controlled stage.

Graphical Abstract

1. Introduction

Chalcopyrite is the Earth’s most abundant Cu-bearing mineral [1]. Improved knowledge of chalcopyrite dissolution kinetics and mechanisms is of both geochemical and industrial interest [2,3,4,5]. Chalcopyrite is one of the most difficult minerals to process economically [6] with Cu primarily produced pyrometallurgically. However, a great deal of attention has been paid to the development of hydrometallurgical processing routes [5,6,7,8,9,10,11,12,13,14,15,16,17] due to the potentially attractive economics, especially when chalcopyrite is present at a low grade, and reduced environmental impact [18,19]. However, the extremely slow dissolution rate continues to limit implementation of hydrometallurgical extraction strategies [20,21]. Chalcopyrite is frequently associated with pyrite (FeS2), the predominant contributor to the serious environmental issue of acid and metalliferous drainage (AMD), but understanding of the contribution of chalcopyrite to AMD is incomplete.
Most previous studies have concluded that chalcopyrite leaching is surface chemical reaction controlled on the basis of derivation of high activation energies ( E a ) [3,4,22,23,24,25]. However, a few studies have reported that chalcopyrite leaching is surface diffusion controlled with commensurately small E a values [26]. Surface products formed during leaching may be important to the surface diffusion controlled leaching e.g., elemental sulfur (S0) [27,28,29,30,31,32,33], polysulfide (Sn2−) [31,32,34,35] and Fe oxyhydroxide [36,37]. Saxena and Mandre [27] reported that chalcopyrite dissolution was initially surface chemical reaction controlled, followed by surface diffusion control ( E a of 16 kJ·mol−1) through the S0 layer formed. Sokic, Markovic and Zivkovic [19] reported a high value of E a (83 kJ·mol−1) for chalcopyrite leaching and ascribed this to surface chemical reaction control when the fraction extent leached was below 0.6; surface diffusion control through the S0 layer formed was proposed to occur subsequently.
Elevated temperatures, 65–75 °C, can be achieved for industrial Cu extraction in the absence of external heating by application of thermophilic microbial heap leaching via approaches such as Geocoat™ [38,39]. Li, et al. [40] investigated the effect of solution redox potential from 650 to 850 mV (all solution redox potentials, Eh, are reported relative to the standard hydrogen electrode, SHE) and observed maximum dissolution rates at 750 mV, the Eh condition adopted here. Li, et al. [2] found that in the absence of added aqueous iron, Fe3+ and H+ activities played positive and negative roles, respectively, in chalcopyrite leaching at 750 mV and 75 °C. This trend also held for selected examples with added aqueous iron but leach data were not compared directly across the cases with and without added iron.
Although there has been considerable focus on understanding chalcopyrite leaching, the resulting surface chemistry is still not well understood. No universal agreement has been achieved as to the mechanisms resulting in the variable surface layers observed and the role of the new surface species. Eh, pH, temperature and pulp concentration have all been reported to play a role in chalcopyrite dissolution [5,41,42,43]. Hence, the aim of this study was to observe chalcopyrite leaching at controlled potential of 750 mV with both solution and surface speciation being examined to develop a comprehensive rate law and mechanism. To achieve this aim, investigations of the leaching kinetics and evolution of surface species with and without the addition of 4 mmol iron have been conducted at fixed Eh (750 mV), pH 1.0–2.0 and 35–75 °C.

2. Methodology

2.1. Chalcopyrite Sample

The chalcopyrite used was from Sonora, Mexico. A chunk of the chalcopyrite was crushed and rod milled to obtain a size fraction of 38–75 µm via wet sieving. The resulting sample was then sonicated, to remove clinging fines, and dried in an oven purged with N2, at 70 °C. Brunauer, Emmett and Teller (BET) analysis gave a surface area of 0.24 ± 0.04 m2·g−1. Each 4 g sub-sample was placed into a plastic tube which was subsequently sealed after being filled with N2 gas to minimise surface oxidation by air. All the samples were stored in a freezer prior to use.
X-ray powder diffraction Rietveld analysis indicated that this final sample contained 92 ± 5 wt % chalcopyrite, 2 ± 1 wt % quartz, 1 ± 1 wt % pyrite, 0.8 ± 0.9 wt % sphalerite with another 4 ± 2 wt % of unknown component(s) (uncertainty estimates to the 95% level are based on χ0.35, where χ is the wt %, as per Geelhoed, et al. [44]). Inductively coupled plasma atomic emission spectroscopy (ICP-AES, carried out by Rio Tinto Technology and Innovation, Melbourne, Australia, Table 1) resulted in a commensurate mineralogical assessment giving rise to a stoichiometry of 95.9 wt % Cu0.96Fe0.99S2.00.

2.2. Leaching Conditions

Glass reactor vessels (1.2 L) were used for the batch leaching experiments. Each leach experiment used 1 L of H2SO4 solution. The 5-port lid provided access to the leach solution and was used to house a thermometer, Teflon impeller, high temperature Eh probe, hydrogen peroxide (H2O2) inlet and a reflux condenser. The four blade Teflon impeller (supplied by Southern Cross Science, Adelaide, Australia) was driven by a digitally controlled stirrer at a constant agitation speed of 500 rpm. Heating was provided by a thermostatically controlled silicone oil bath.
The leaching experiments were carried out in pH 1.0, 1.5 and 2.0 H2SO4 leach media. The Eh of the leaching solution was adjusted and equilibrated to 750 mV at 25 °C, with the temperature being subsequently raised to the designated temperatures (35 to 75 °C) for another 12 h for equilibration. The equilibrated Eh at the increased temperature was then maintained during leaching through auto-titration (EUTECH pH 200 series with a Master Flex pump, EUTECH Instruments Pte Ltd, Singapore) of the leach liquor using a 7.5 wt % H2O2 solution. Eh measurement was carried out with an EUTECH, ECFC7960205B ORP probe combined with an Ag/AgCl reference which was fully immersed in the leach solution at the temperature of leaching.
The pH was checked during each sampling and was maintained by addition of 5 M H2SO4. The maximum variations in pH were 0.05, 0.10 and 0.20 pH units for pH 1.0, 1.5 and 2.0, respectively. For leaching with iron addition at pH 1.0, 4 mmol FeSO4·7H2O was added into the solution and allowed to equilibrate prior to chalcopyrite addition. At greater pH, i.e., pH 1.5 and 2.0, with high temperature, iron hydroxide precipitation occurred during the equilibrium stage prior to chalcopyrite addition. This precipitation results in significantly reduced iron solution concentrations and lack of comparability between experiments. Hence, we did not pursue these measurements.

2.3. Bulk and Surface Analyses

A 10 mL aliquot of the reaction solution was sampled periodically and filtered using a 0.22 µm membrane for analysis of aqueous Fe, Cu and S using ICP-AES. The reaction solution in the vessel was then replenished with a fresh 10 mL of lixiviant to maintain the original volume. The geochemical equilibrium-solving program PHREEQC Interactive (Version 2.18.5570) and Lawrence Livermore National Laboratory (LLNL) database [45,46,47] were used for calculating both the equilibrium concentrations and activities of solution speciation (more than 40 species in total) with the input of temperature, pH, Eh, Fe2+/Fe3+ redox pair and Fe, Cu and S concentrations [48].
At the end of each experiment, a portion of the leach residue was rinsed three times using perchloric acid (at the same pH as the leach lixiviant) to remove any species surface adsorbed from the lixiviant. These solids were then immediately snap-frozen using liquid N2 to minimise post-leaching oxidation. The frozen samples were used for X-ray photoelectron spectroscopy (XPS) surface analyses. The remaining solids were washed with distilled water and dried in an oven at 35 °C for XRD and scanning electron microscopy (XL30 SEM made by FEI, Hillsboro, OR, USA) measurements. A Phillips XL30 field emission SEM equipped with energy dispersive spectrometers (for energy dispersive spectroscopy (EDS)) was employed to record images, using both backscattered and secondary electron modes, and for elemental quantification. The XRD methodology is described in Li, et al. [20].
XPS analyses were conducted using a Kratos Axis Ultra (Kratos, Manchester, UK). The X-ray source was a monochromatic aluminium cathode running at 225 W with a characteristic energy of 1486.6 eV. Pass energies of 160 and 20 eV were used for survey and high-resolution scans, respectively. The charge neutraliser was utilised to compensate for surface static charging resulting from X-ray photoemission. Each area of analysis (Iris aperture) was a 0.3 mm × 0.7 mm slot; the analysis depth was less than 15 nm. The analysis vacuum was 5 × 10⁻⁷ Pa. To minimise the sublimation of S0 [35,49] the samples were kept cool using liquid N2 via a cold stage (≈−100 °C). The method for XPS data analysis is described in Li, et al. [20]. The S 2p3/2 peak arising from bulk S2− was aligned to 161.1 eV [50] as the noise within the adventitious C 1s spectra precluded accurate alignment.

3. Results and Discussion

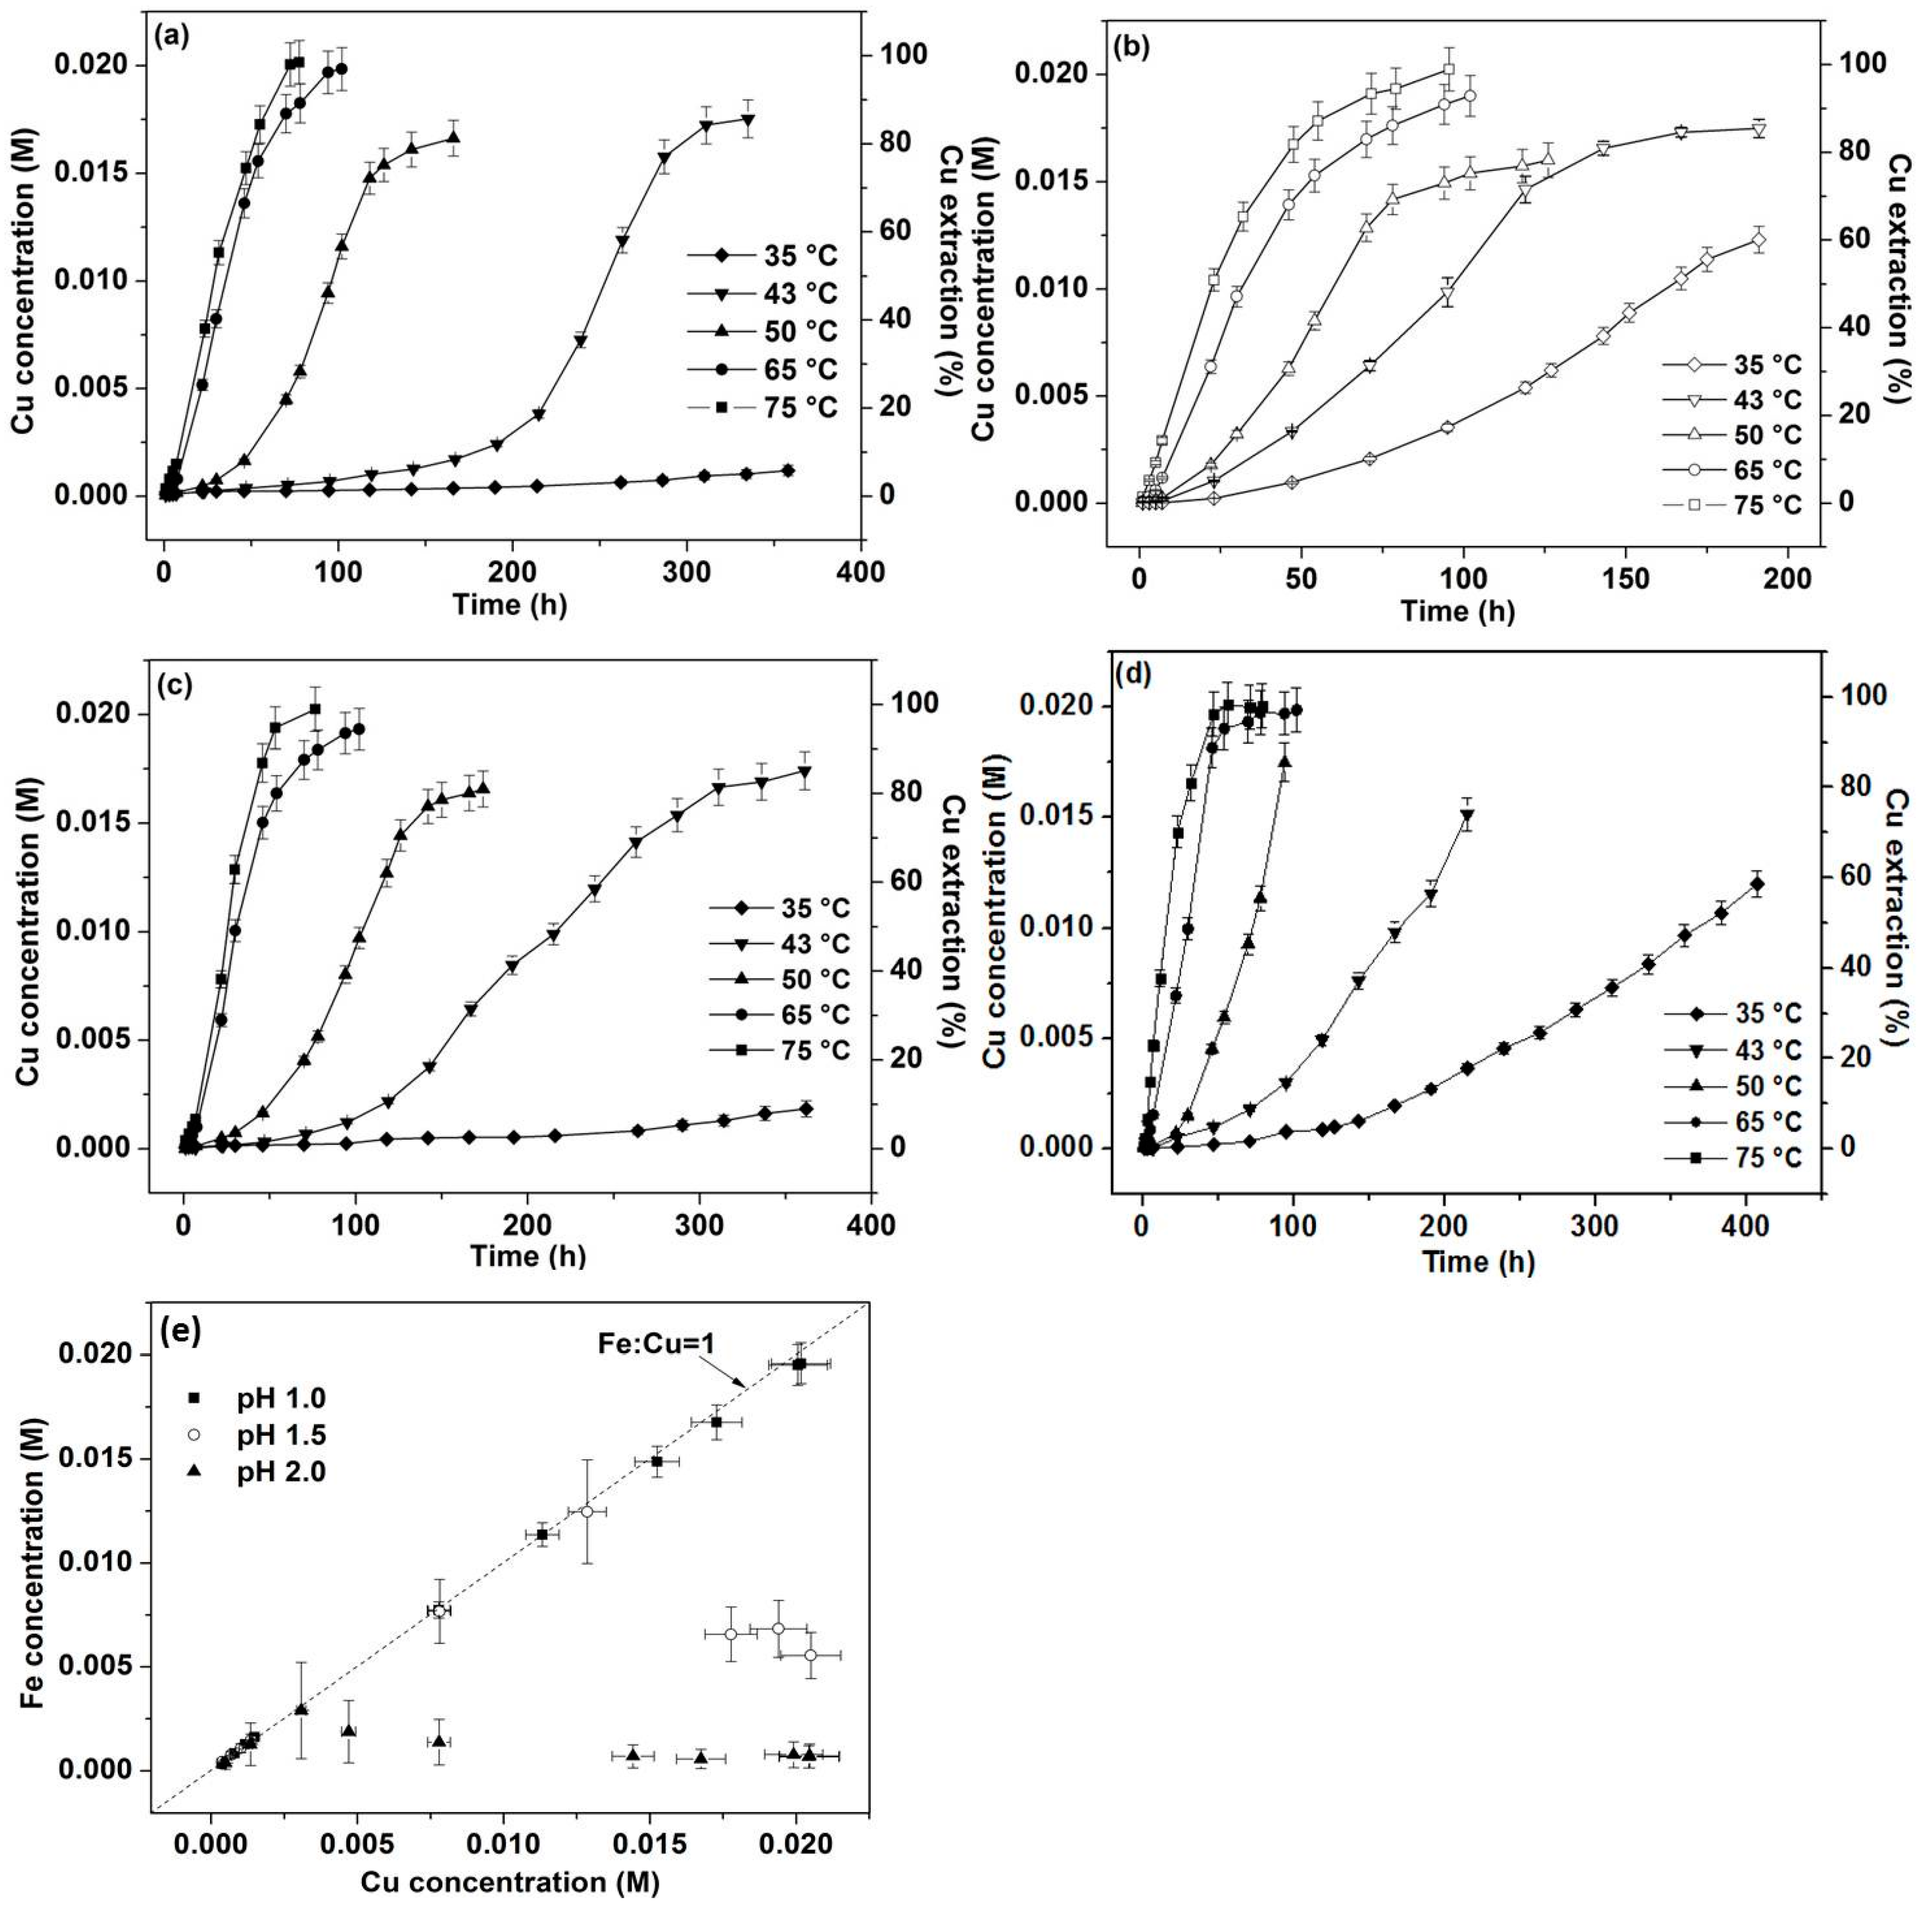
3.1. Effect of Temperature and pH (No Iron Addition)

For leaching at pH 1.0 without iron addition (Figure 1a) Cu was nearly completely extracted within 80 h at 75 °C, whilst the Cu yield reached over 90% at around 100 h at 65 °C. The variation of the extent of leaching as a function of time at 65 °C as compared to 75 °C is insignificant, relative to lower temperatures. This is consistent with the observation by Mahajan, et al. [51] who found that no improvement in Cu leach rates occurred between 65 and 75 °C. Compared to the Cu leaching rates at 65 and 75 °C, the initial Cu extraction percentage within the first 25 h at 50 °C was distinctly reduced; however, it increased rapidly in the subsequent leach period, reaching around 85% Cu extraction at 180 h. A similar trend was observed for leaching at 43 °C for which a longer “induction” period was observed. After 200 h, the Cu dissolution rate increased rapidly, resulting in approximately 85% extraction at the end of 340 h. At 35 °C less than 10% Cu was extracted at 360 h.
Figure 1a, c, d shows the effect of pH ranging from 1.0–2.0 (with no aqueous iron addition) with the greatest Cu extraction rate being obtained at pH 2.0 although iron hydroxide precipitation was observed when the temperature was 65 °C or greater at pH 1.5 and 50 °C or greater at pH 2. Leaching at pH 2.0 at low temperatures (35 and 43 °C, Figure 1d) is much faster than at lower pH with otherwise identical conditions, resulting in significantly greater Cu extraction at around 400 h.

3.2. Effect of 4 mmol Iron Addition

The similar rates observed at 75 and 65 °C with (Figure 1b) and without iron addition (Figure 1a) are different in nature to those at lower temperatures where the addition of 4 mmol iron increased the Cu extraction rates distinctly. At 43 and 50 °C, 80%–85% Cu was extracted within 190 and 130 h, respectively, which is 150 and 60 h shorter in duration than the respective leaches without iron addition for equivalent Cu extractions. The most significant enhancement in Cu extraction derived from the addition of iron was observed at 35 °C with approximately 60% Cu released into solution at around 190 h. It is likely that the amount of Fe3+ extracted from chalcopyrite within the initial stage of leaching at high temperatures is sufficient to improve subsequent leaching, effectively minimising the impact of iron addition.
While the leach curves without iron addition at low temperatures (35–50 °C) have long induction stages, once the curves take off, the Cu extraction percentages versus time display similar “S” shapes to those with 4 mmol iron added at the same temperature. Hence, it appears that the addition of 4 mmol aqueous iron shortens the induction period. For leaching at 43 °C (without iron addition), around 75% Cu was extracted from 170 h (around 10% Cu) to 340 h (approximately 85% Cu) (Figure 1a, pH 1) whilst for leaching with 4 mmol iron addition, the same percentage of Cu (10%–85%) was extracted from 20 to 190 h. It seems therefore that the addition of 4 mmol iron plays a positive effect in accelerating Cu extraction only in the initial stage.
Iron hydroxide precipitation was observed to occur at pH 1.5 and 2.0 at high temperatures (65 and 50 °C and over, respectively). This was not accompanied by decreased Cu extraction rates also suggesting that leaching occurring in the later stage might be controlled by factors other than surface chemical reactions associated with Fe3+/Fe2+ activities.

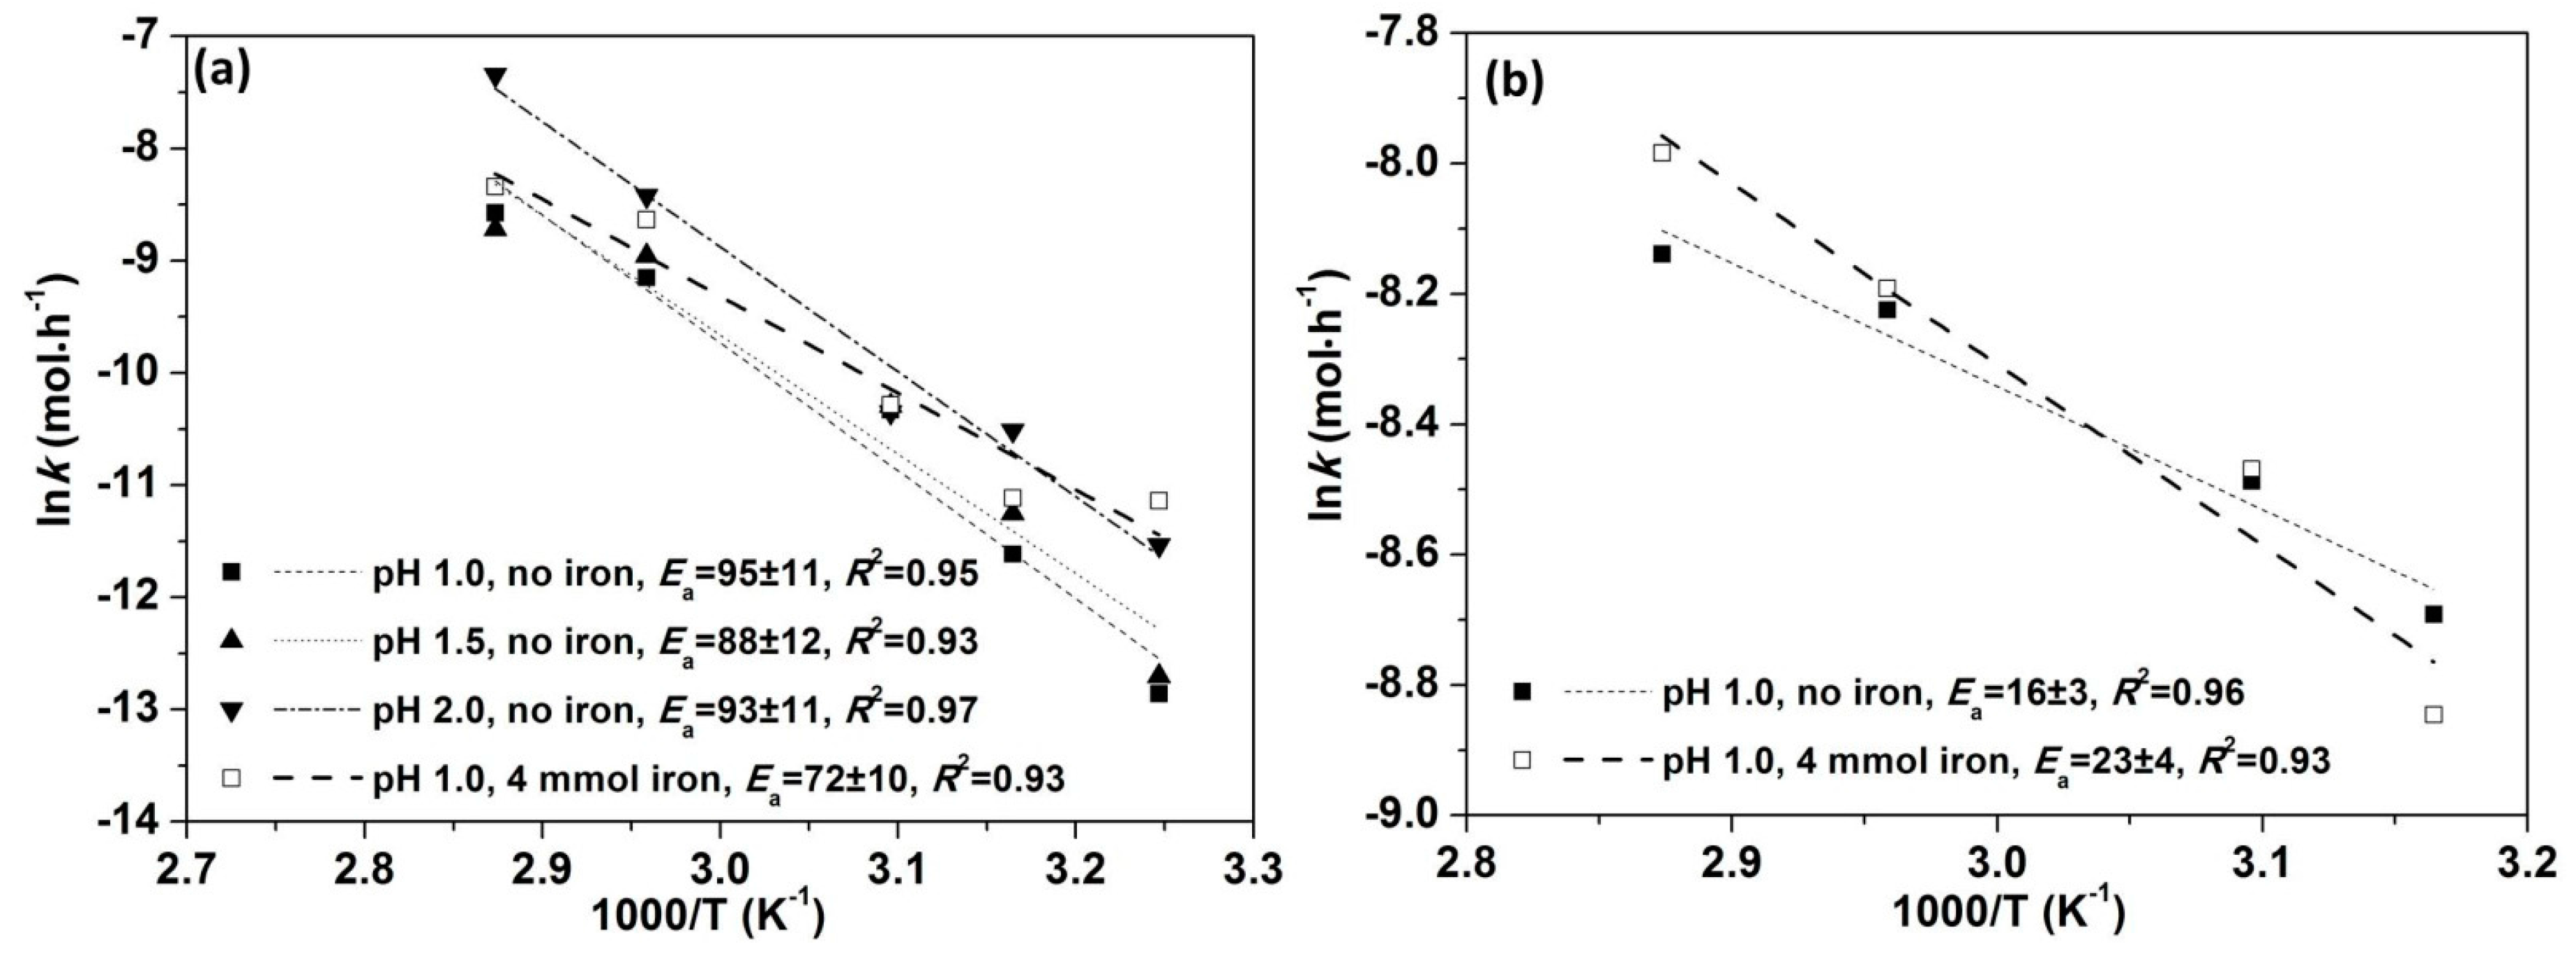
3.3. Kinetics of Dissolution

3.3.1. Kinetic Analysis by Apparent Rate (<10% Cu Extraction)

To be able to interpret the kinetics of the early stage of dissolution, knowledge of the solution activities of Fe2+ and Fe3+ is critical. To verify the application of PHREEQC calculations for solution activity simulation, Equations (1) and (2) were applied as described below.
E = E 0 + R T z F ln [ Fe 3 + ] [ Fe 2 + ]
E = E 0 + R T z F ln { Fe 3 + } { Fe 2 + }
E is the redox potential, E0′ is the formal potential, E0 is the standard potential, R is the universal rate constant (R = 8.314 472(15) J·K−1·mol−1), T is the absolute temperature (K), z is the number of moles of electrons transferred in the cell reaction, F is the Faraday constant, the number of coulombs per mole of electrons and is equal to 9.64853399 × 10⁴ C·mol−1 and { Fe 3 + } and { Fe 2 + } are the free Fe3+ and Fe2+ activities whereas [ Fe 3 + ] and [ Fe 2 + ] are their concentrations [12]. Both E0 and E0′ vary as a function of temperature.
Using Equation (1) and the E0′ value of 0.67 [12] the total Fe3+/Fe2+ concentration ratio at 25 °C and 750 mV is found to be approximately 22, in good agreement with the ratio suggested from experimental data (Figure 7 from [52]). It should be noted that E0′ values at temperatures other than 25 °C are not available so that the ratio of concentrations of Fe3+/Fe2+ as per Equation (1) cannot be calculated for other temperatures. The value of E at each temperature may be calculated using Equation (13) from [51], which requires input of only the “nominal” Fe3+/Fe2+ concentration ratio at 25 °C for which we used the value of 22. Via regression analysis an expression ([52], Equation (11)) enabling the calculation of E0 (Equation (2)) in acid iron sulfate systems as a function of temperature has been derived. By applying this expression, E0 values of 770, 793, 806, 817, 841, 849 and 857 mV are calculated for 25, 35, 43, 50, 65, 70 and 75 °C, respectively. As both E0 and E values for each temperature are then available, the free Fe3+/Fe2+ activity ratio may then be calculated using Equation (2). In contrast to the Fe3+/Fe2+ concentration ratio of 22 derived using Equation (1), using Equation (2) and the E0 value of 770 mV for 25 °C and Eh of 750 mV, the free Fe3+/Fe2+ activity ratio is found to be only 0.46. Comparison of the ratio of free Fe3+/Fe2+ activities calculated using PHREEQC and Equation (2) (Figure 2) indicates close similarity suggesting the reliability of the PHREEQC calculations for simulation of free ferrous and ferric activities and the on-going use of this method of solution speciation prediction.
Table 2 shows the calculated activities of the predominant solution species for leaching at pH 1.0 and 75 °C with and without iron addition for 1 and 30 h. Cu2+ is the predominant Cu species while Cu+ species are insignificant. Fe2+, FeSO4, Fe3+, FeSO4+ are the major iron containing species. Even though Fe3+ tends to form various complexes such as iron sulfate, the calculated total of the activities of Fe3+ containing species is less than that of the sum of the activities of all the Fe2+ containing species for all our leach conditions.
Assuming chalcopyrite leaching follows a shrinking sphere model [2,22,53], when Cu extraction is less than 10%, the radius of the shrinking chalcopyrite sphere is still greater than 96% as compared to the original radius. Hence, the relative surface area [2,53] can be regarded as unchanged. Thus, by examining leach rates at less than 10% Cu extraction the complicating factor of surface area variation can reasonably be ignored and the role of Fe3+ in the initial leach stage can be readily examined.
As indicated in Figure 1, the Cu concentration versus leach time follows a linear trend, for all cases, when Cu extraction is less than 10%. The apparent rate constant k may therefore be estimated from the slope using Equation (3):
d C d t = k
where C is the concentration of Cu in solution (M), t is the leach time (h). The Arrhenius equation (Equation (4)) can then be applied to estimate Ea using the rate constants derived for each temperature.
k = k 0 e E a / R T
R is the universal gas constant and T is the temperature in kelvin. k0 is the rate constant. Linear trends and good regressions (coefficient of determination R2 > 0.92) are obtained.
High E a values obtained (Figure 3a) indicate the initial stage of chalcopyrite leaching is controlled by surface chemical reaction [4,22,23,25,43]. The E a values derived from leaching at pH 1.0 (with and without iron addition), 1.5 and 2.0 (without aqueous iron addition) are within the error range.

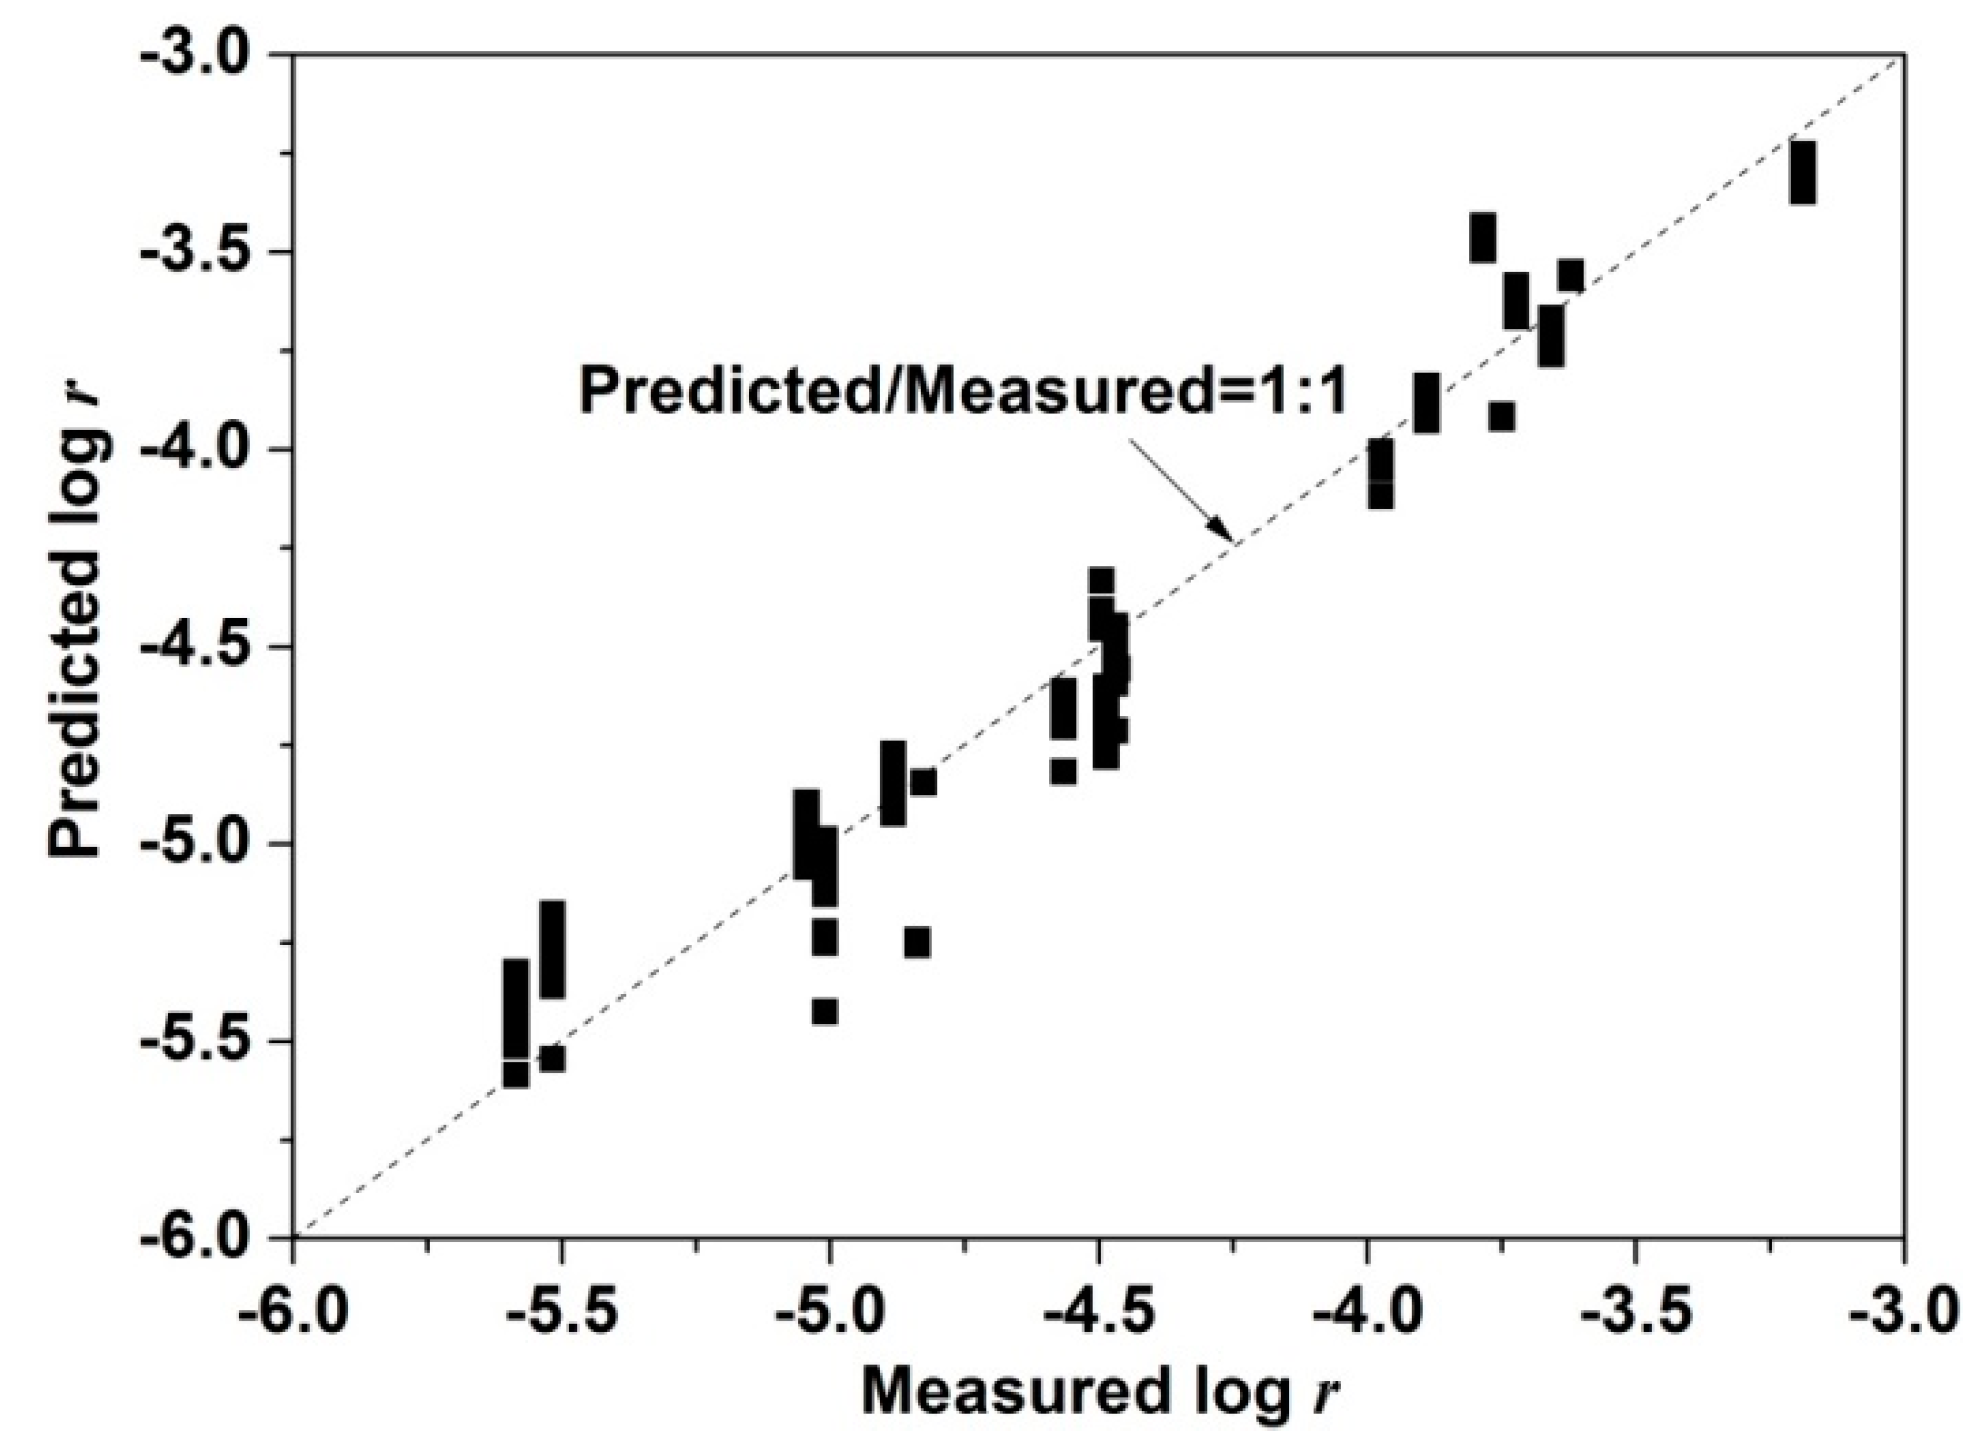
3.3.2. Kinetic Analysis by Multiple Linear Regression (<10% Cu Extraction)

Ferric iron has been used frequently in chalcopyrite leaching processes under oxidising conditions to increase leach rates [2,3,4,5,6,7,31,33,42,54,55,56,57]. Fe3+ can also form via oxidation of Fe2+ by iron-oxidising microorganisms [4,5,58,59,60,61,62,63,64,65,66,67,68] or due to the presence of other oxidants such as H2O2 [23,24,69]. Previous publications have discussed factors affecting chalcopyrite leaching with effects from temperature, pH and Fe3+ having been considered [2,5,11,19,24,26,33,70]. The empirical dissolution rate law applied by Kimball et al. [4] for the relative surface area normalised leach rates is shown in Equation (5) which can be converted to Equation (6) when a log scale is applied.
r = 1 S · d C d t = A ( e E a / R T ) Π m i n i
log r = log ( 1 S · d C d t ) = log A E a 2.303 R 1 T + n i log ( m i )
S is the relative surface area [2,53], which is regarded as unchanged in this study when Cu extraction is less than 10%, C is the Cu concentration in solution (M), t is leach time (h), m i is the activities of solution species. Values of A , E a , n i can be obtained by using multiple linear regression. All the predominant solution species listed in Table 2, as well as 1/T, have been examined. As leaching experiments were always conducted under atmospheric conditions, relatively constant dissolved O2 concentration was expected throughout leaching. Furthermore, once Fe3+ is present or H2O2 was added into the leaching solution, chalcopyrite oxidation by O2 will be negligible [71]. Hence, the effect from dissolved O2 was not included into the rate law.
Regressors have a significant effect on the response when the significance level (p-value) is less than 0.0001 and any regressor with a p-value > 0.0001 should be excluded [4]. Multiple linear regression analysis of all the data points collected in the initial stages (both without and with added iron) yielded Equation (7):
log r = 10.72 ( ± 0.42 ) 4870 ( ± 130 ) / T + 0.12 ( ± 0.02 ) log [ a Fe 3 + ] 0.28 ( ± 0.04 ) log [ a H + ]
where the numbers in parentheses are one standard error. The R2 of the fitting is 0.92 with p-values for E a , log [ a Fe 3 + ] and log [ a H + ] smaller than 10−70, 10−7 and 10−9, respectively. The rate law (Equation (7)) can be re-written as Equation (8).
r = 10 10.72 ( ± 0.42 ) e 93200 ( ± 2500 ) / R T a Fe 3 + 0.12 ( ± 0.02 ) / a H + 0.28 ( ± 0.04 )
Hence, the E a for all the data examined is around 93 ± 3 kJ·mol−1 with positive and negative effects on leaching rates derived for a Fe 3 + and a H + , respectively. Due to the small variation of pH ranging from 1.0 to 2.0 ( a H + from 0.1 to 0.01) and the uncertainty inherent in the exponent (0.04) the variation in the effect due to a H + is very small as compared to that due to a Fe 3 + . The E a calculated by multiple linear regression is very close to those calculated by the apparent rate method for leaches without iron addition, but is slightly greater than that calculated for leaches with iron addition at pH 1.0 (Figure 3a). Figure 4 shows that the ratio of predicted to measured log   r is close to 1:1, validating this analysis.

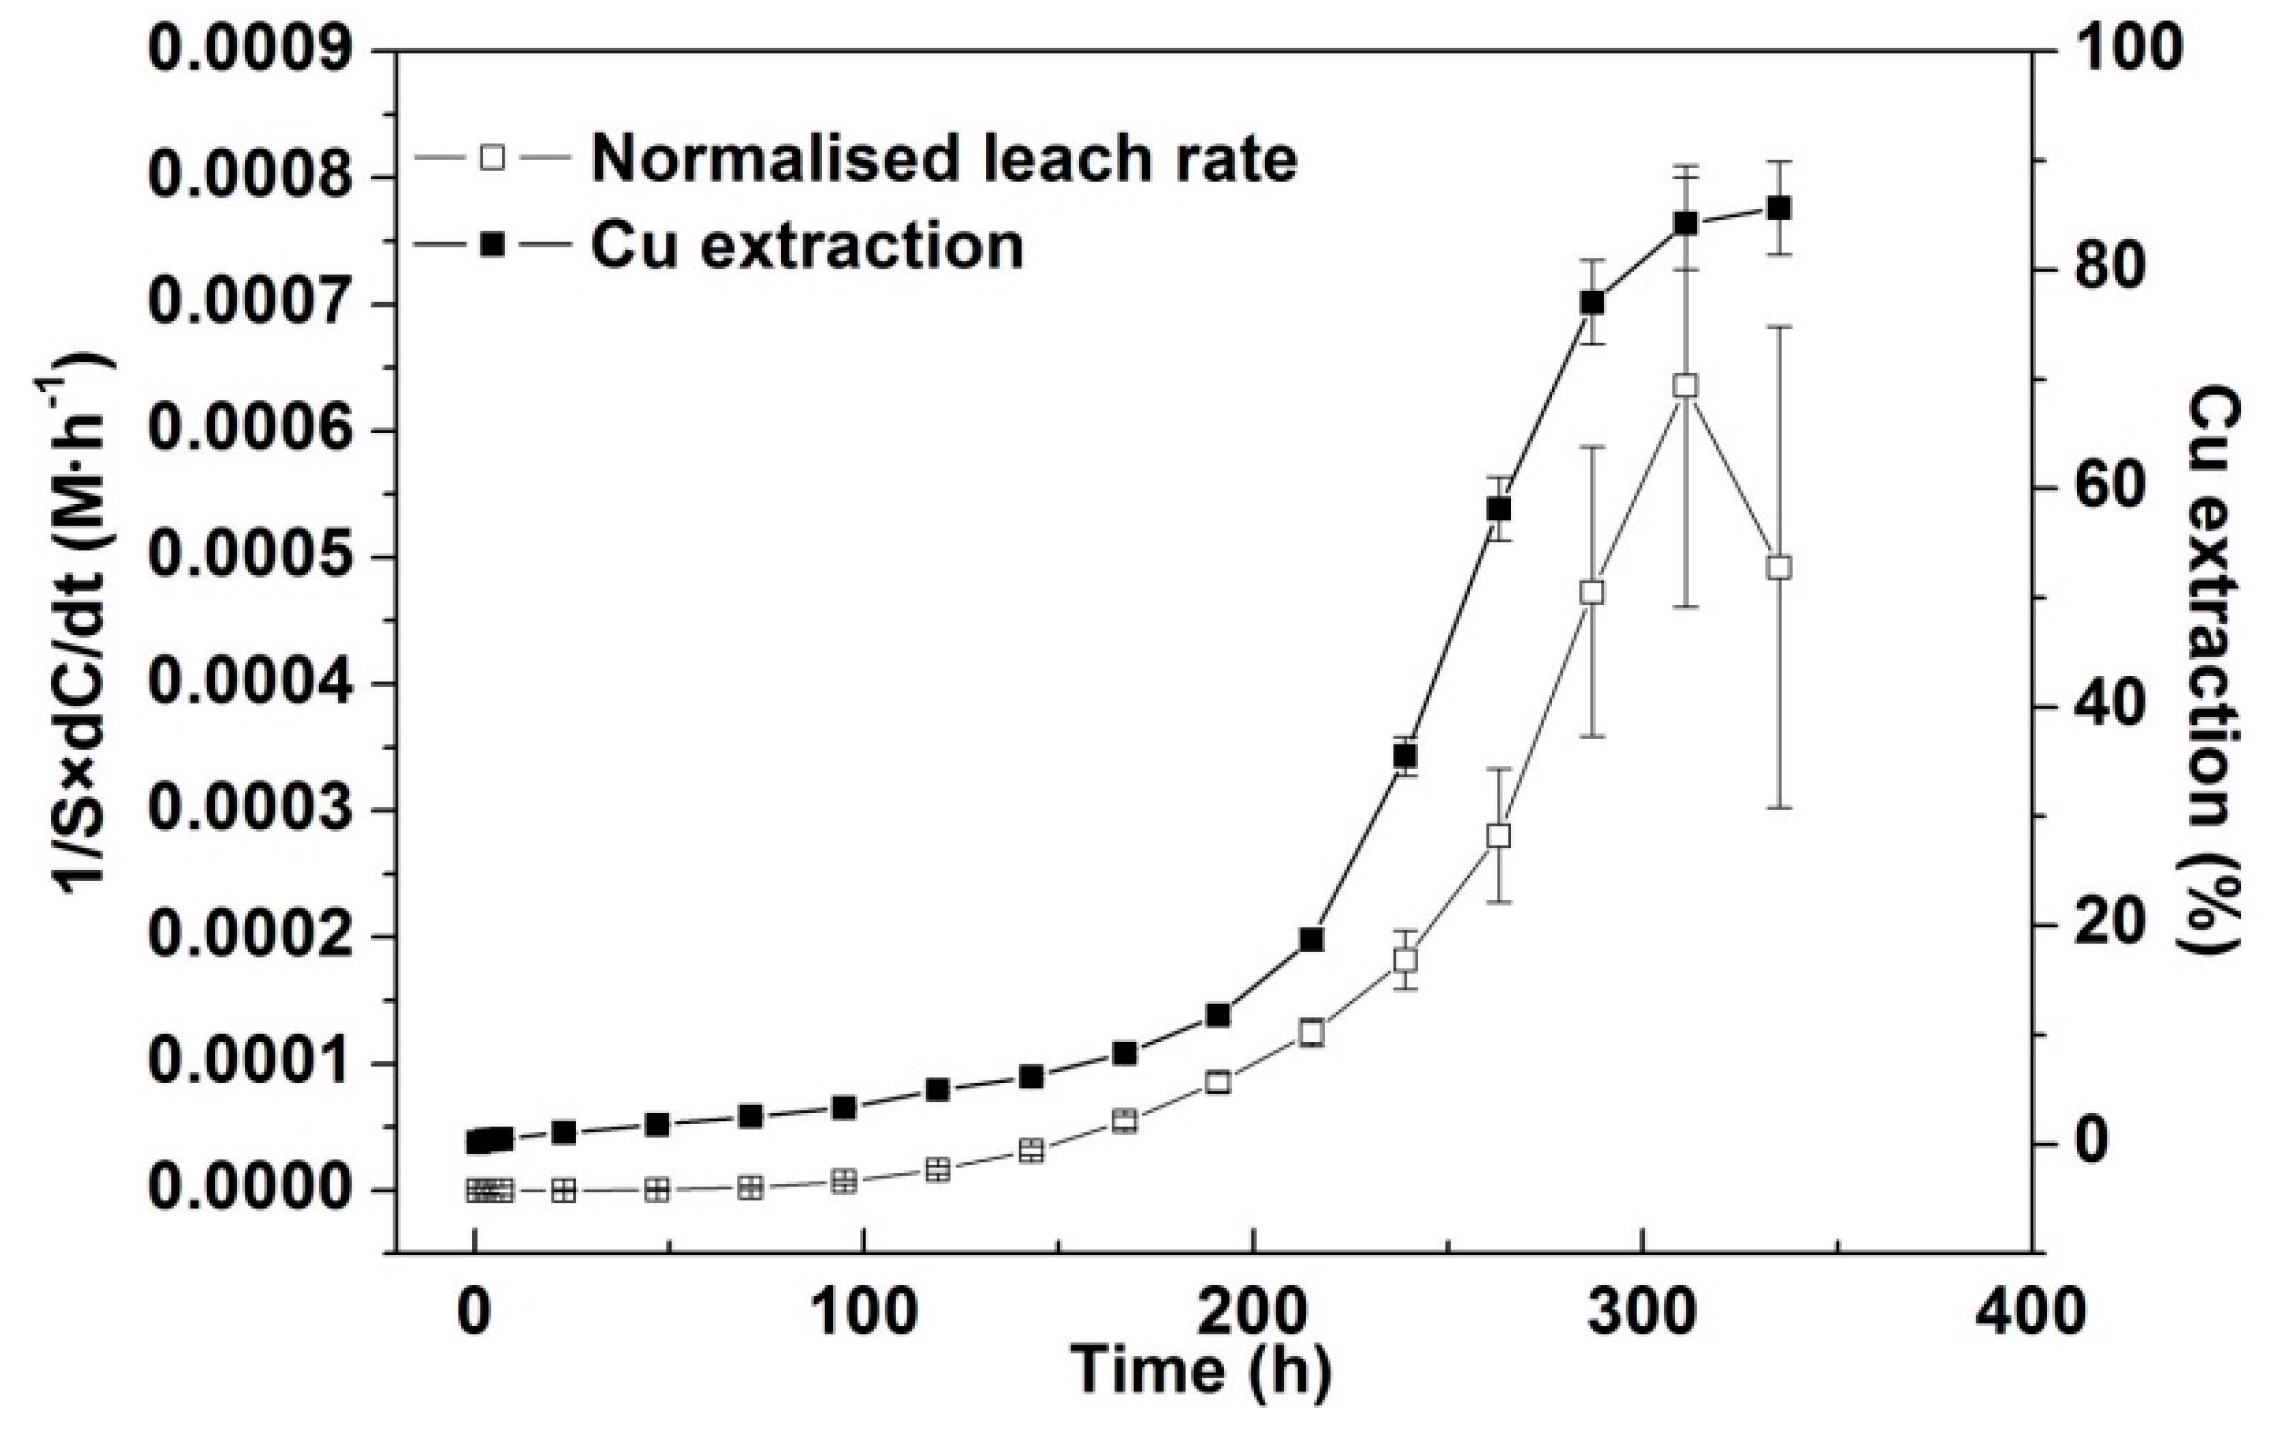
3.3.3. Kinetic Analysis for Cu Extraction > 10%

The same approach (that is dc/dt = k and k = k 0 e E a R T ) for derivation of E a as for Section 3.3.1 has been applied to the leach data over the region of 20%–80% Cu extraction where the curves of Cu versus leach time (e.g., Figure 1a) present the fastest leaching rates and are nearly linear. Using this approach an assumption is made that variations in surface area do not present an issue as it is assumed that the variation is the same regardless of leach conditions, as long as the same range of Cu extraction is chosen. Significantly smaller E a values were derived for the later leach stages as compared to the initial stages (16 ± 3 and 23 ± 4 kJ mol−1 for 20%–80% Cu extraction cf 95 ± 11 and 72 ± 10 kJ·mol−1 for pH 1.0 without and with iron addition for <10% Cu extraction). These low values indicate a surface diffusion controlled mechanism [4,26,72]. Ea for the latter leach stages at pH 1.5 and 2.0 are not considered as these leach data are confounded by less reliable Eh control during the periods of iron hydroxide precipitation.
Smaller pre-exponential factors ( k 0 , interpreted as the total number of effective collisions) have been derived for the later stages as compared to the initial leach stages (6.9 × 10⁻² and 1.0 mol·h−1, respectively for 20%–80% Cu extraction for pH 1.0 without and with iron addition cf 4.2 × 10¹⁰ and 1.5 × 10⁷ mol·h−1 for <10% Cu extraction). In spite of the decreased pre-exponential factor the apparent leach rate is greater in the later stage as compared to the initial stage, indicating the number of effective collisions does not control the leach rate. This observation is consistent with that found by Kaplun, et al. [3].

3.3.4. Unleached Chalcopyrite Particles

The relative surface area normalised leach rate [2] has been calculated for all leach cases discussed above. A selected example is presented in Figure 5 which shows that at pH 1.0, 43 °C and 750 mV without iron addition 85% Cu extraction was achieved at 311 h with a final Cu extraction of 90% at 335 h. The remaining chalcopyrite particles (Figure 8b, approx. 10% Cu) were collected and leached for another 300 h under the same conditions but did not dissolve until the temperature was increased to 75 °C. Examination of the reason(s) for this behaviour is continuing; however as a result the calculation of S as applied by Li, et al. [2] (as Equation (9) therein) has been modified to ( 0.9 F Cu ( aq ) ) 0.66 for Figure 5. The increasing coverage by Sn2− and S0 on the leached chalcopyrite surfaces (see Section 3.4) clearly did not inhibit leaching. Similar results have also been observed at other temperatures and pH conditions (e.g., 118 h for 50 °C). This observation is consistent with previous studies [2,37]. Fe-hydroxide precipitation that occurred at pH 1.5 and 2.0 at high temperature also did not lead to passivation [73].

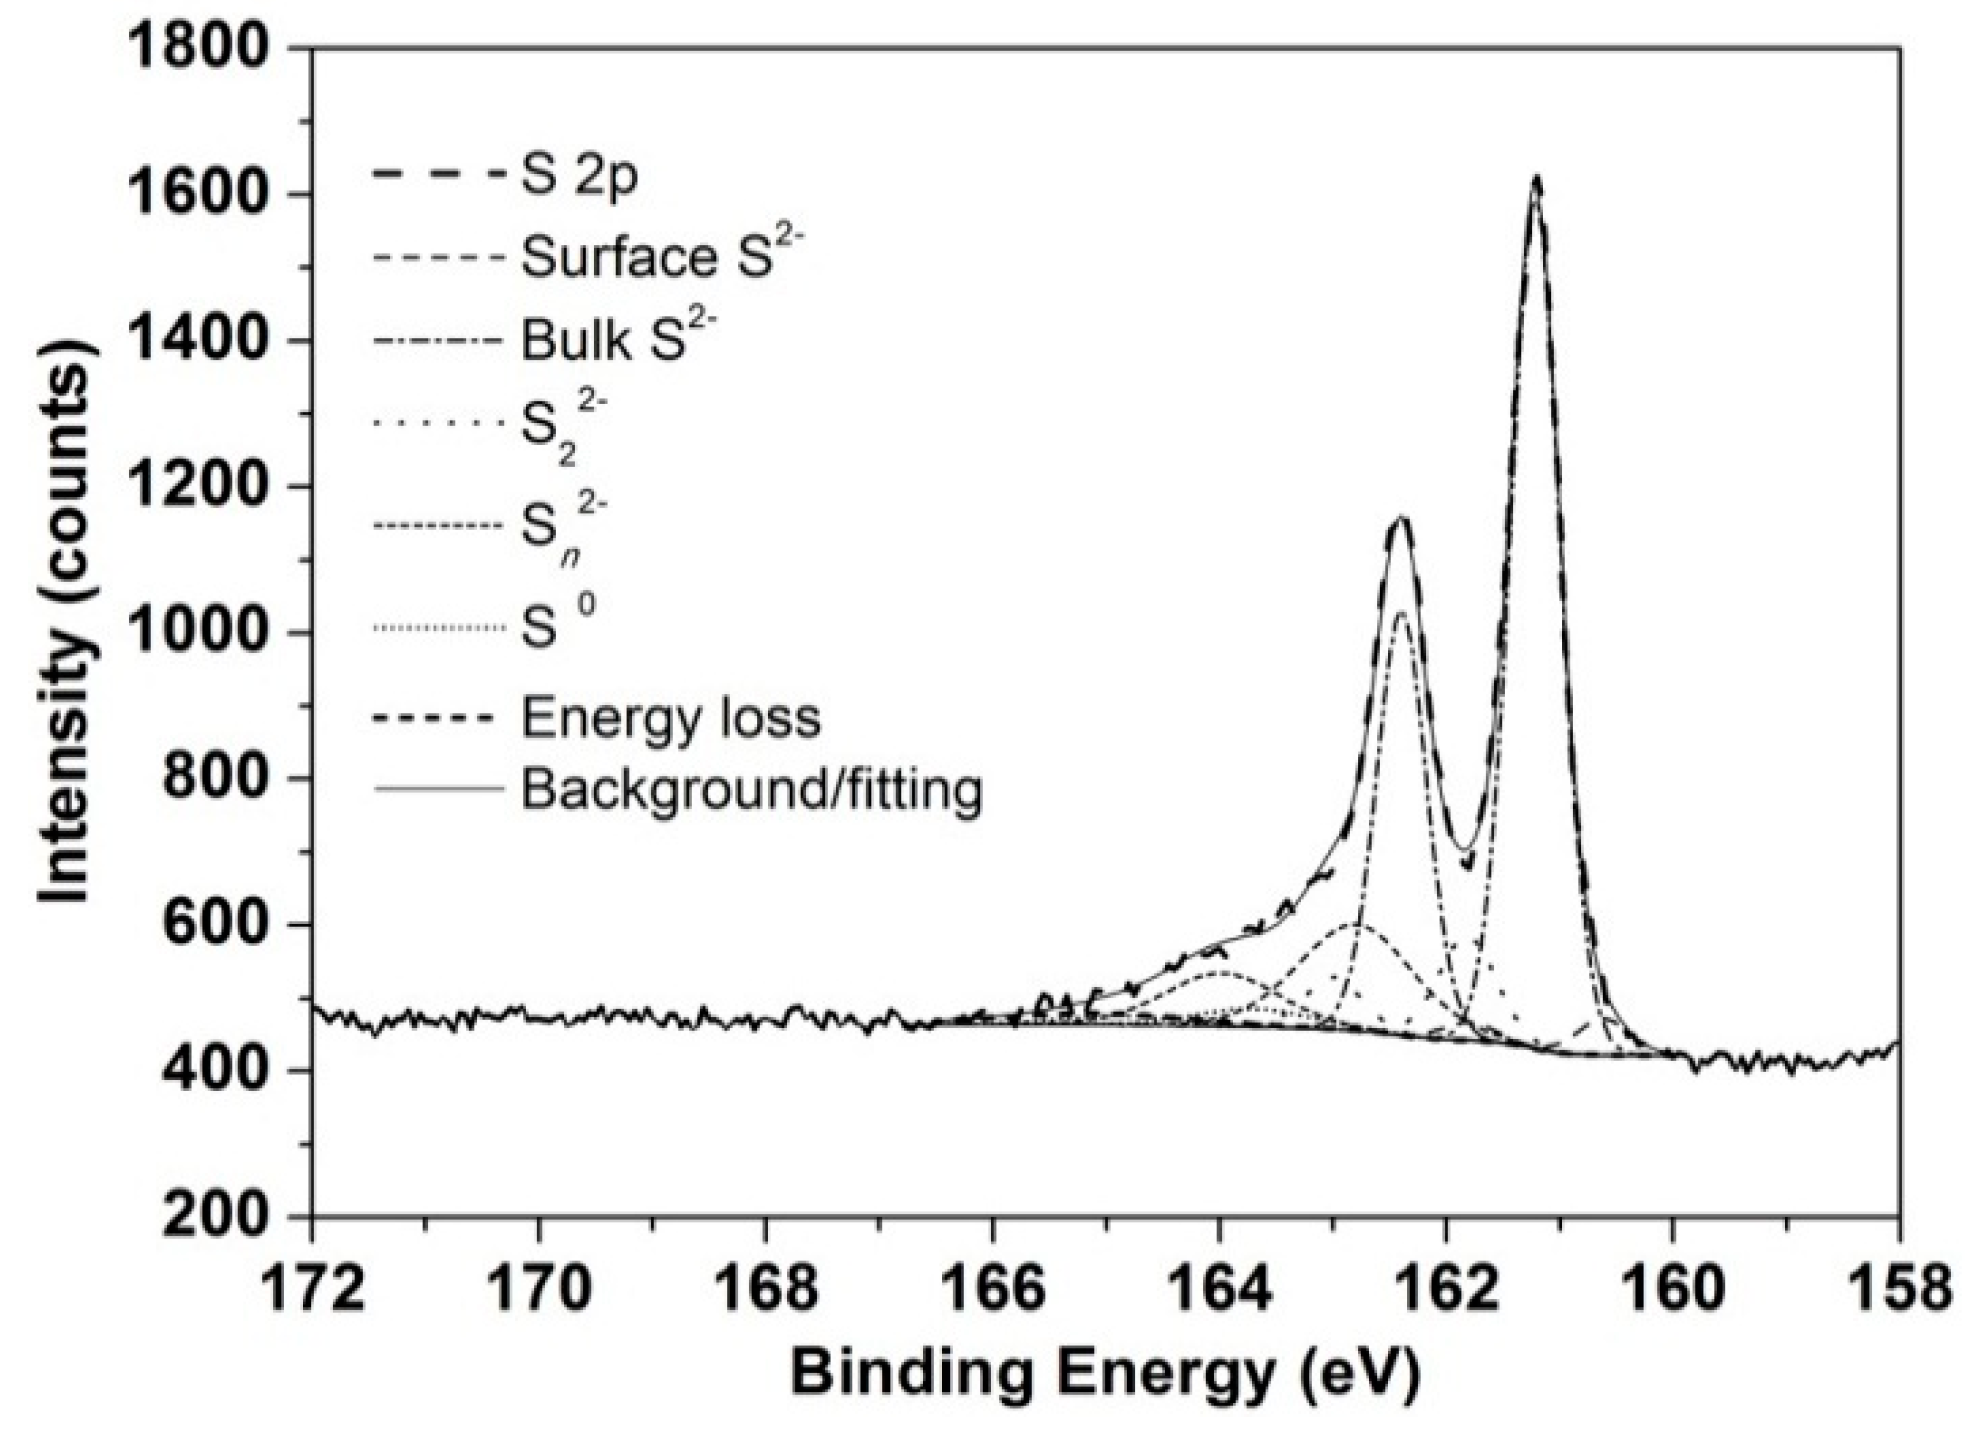
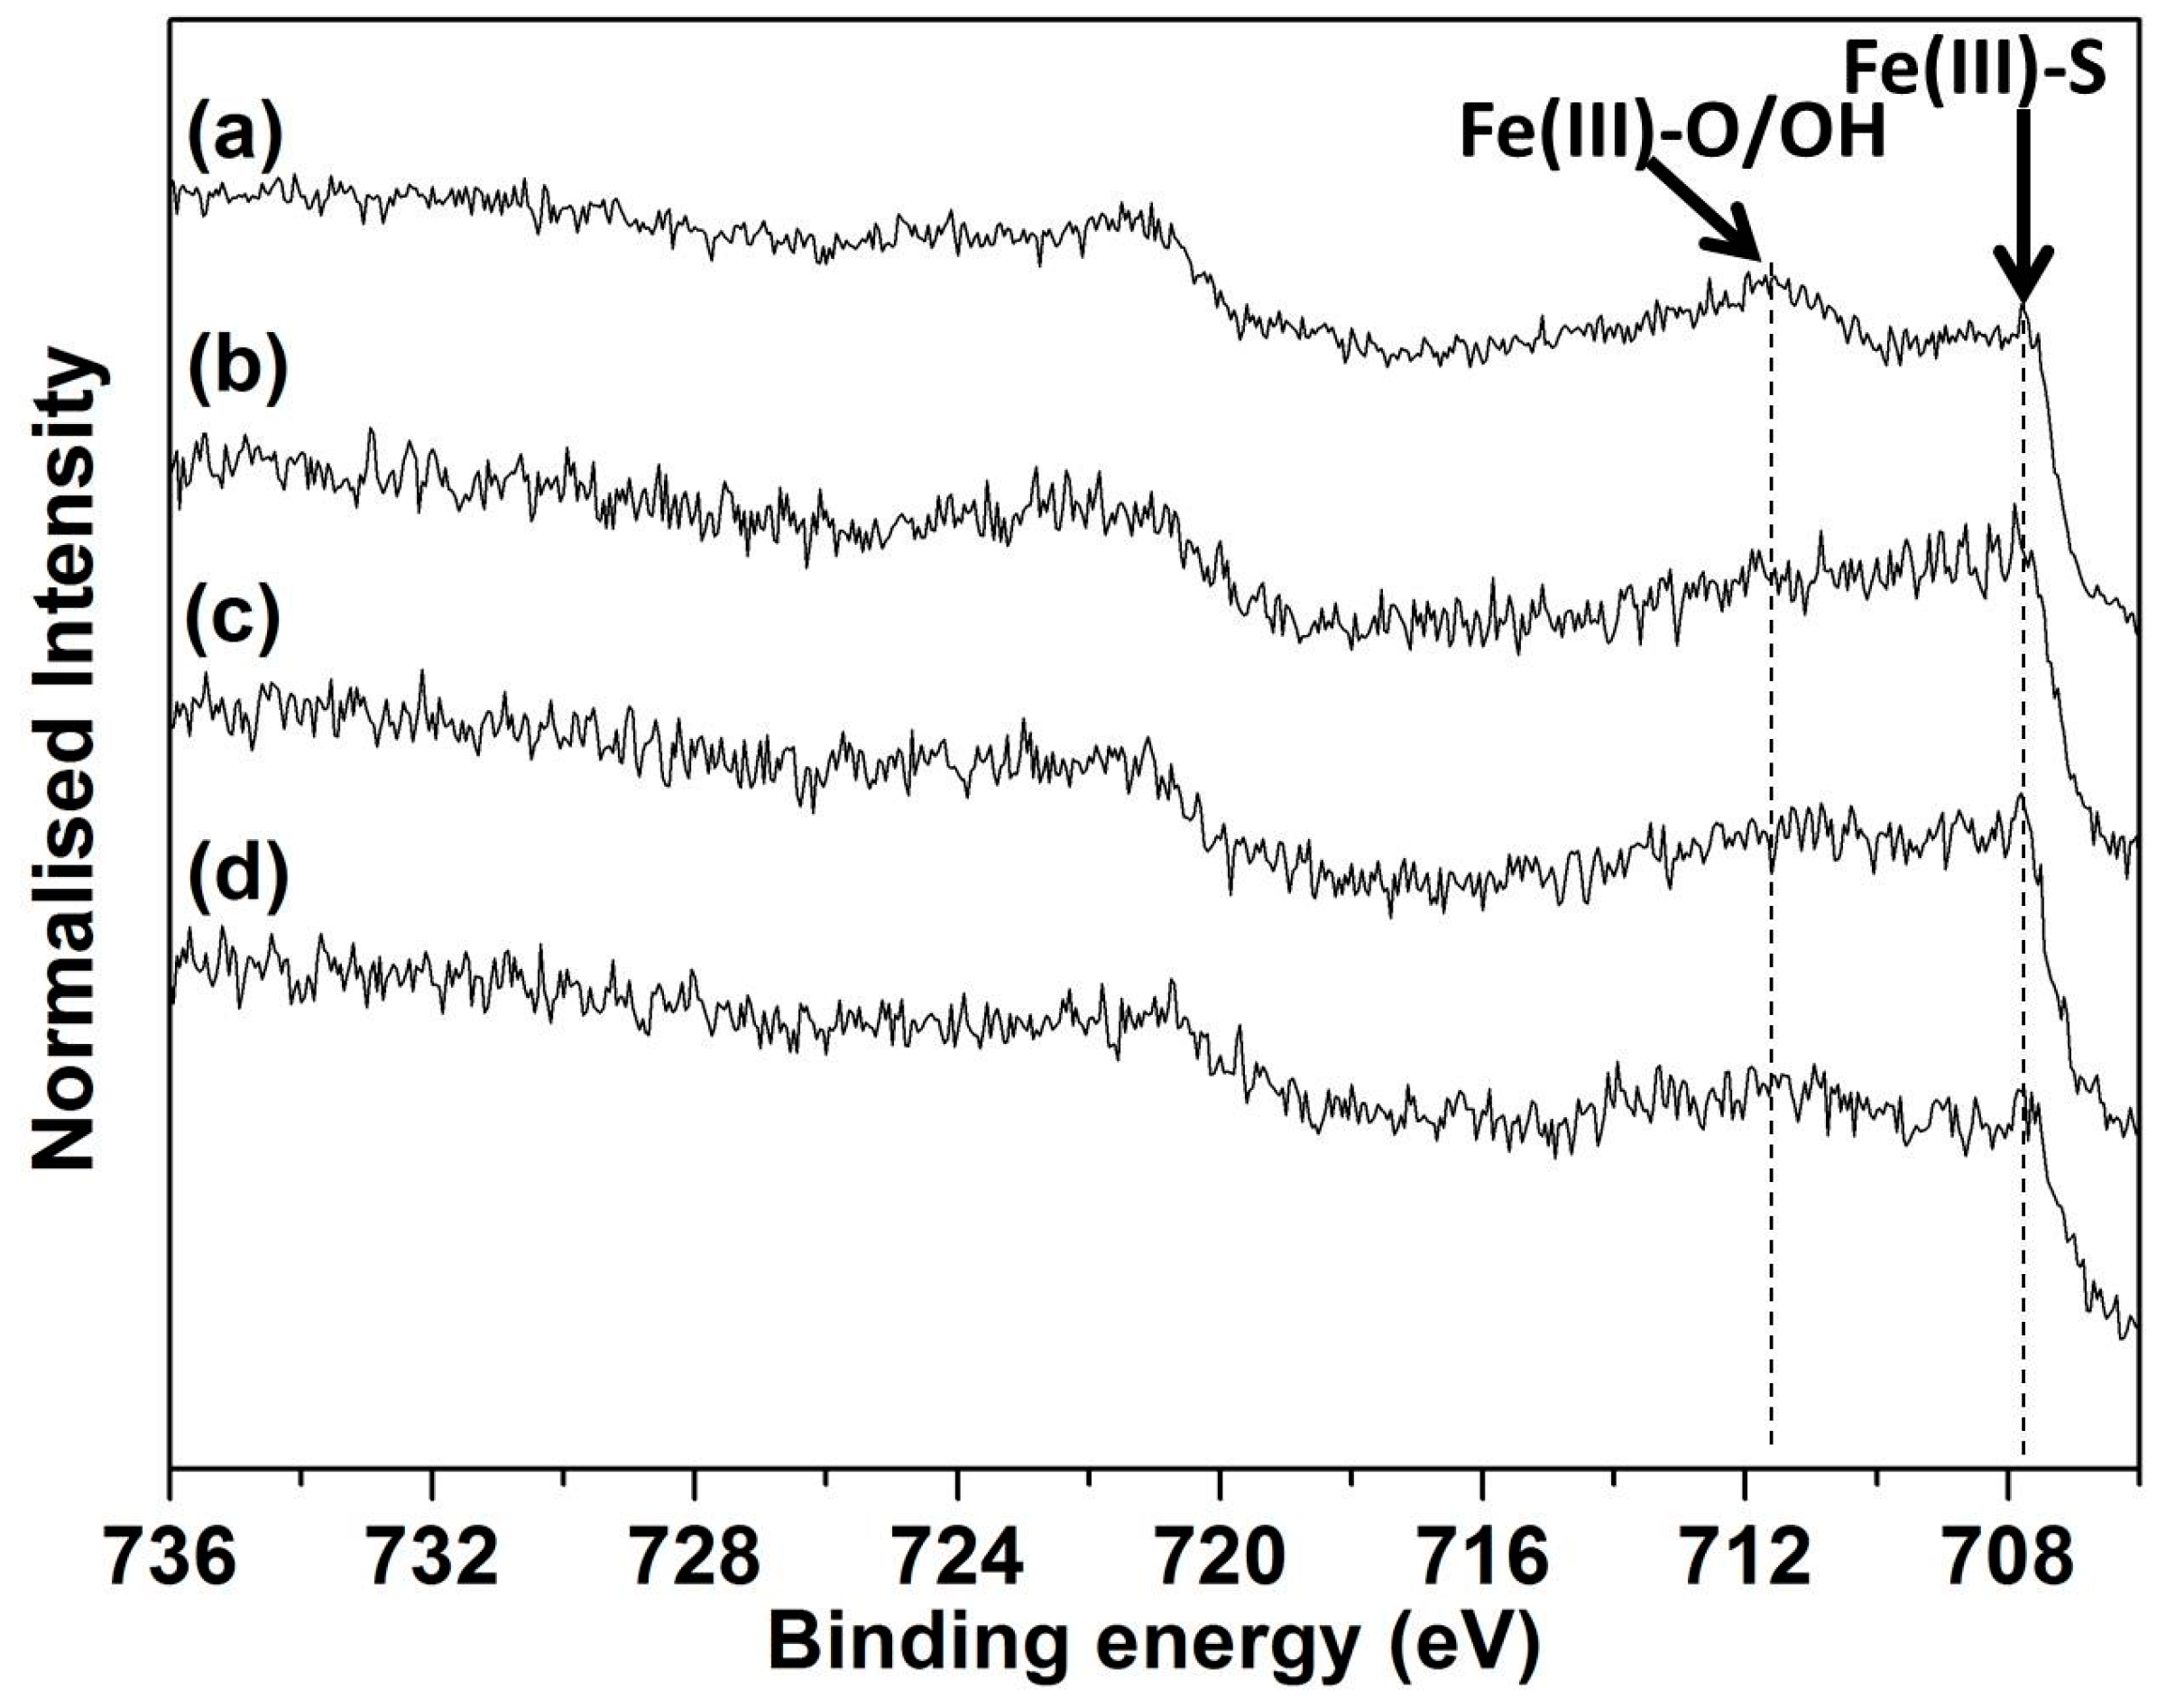
3.4. XPS Analyses for 1 and 30 h Leach Residues from pH 1 Lixiviant
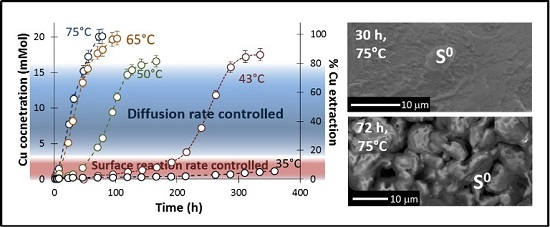
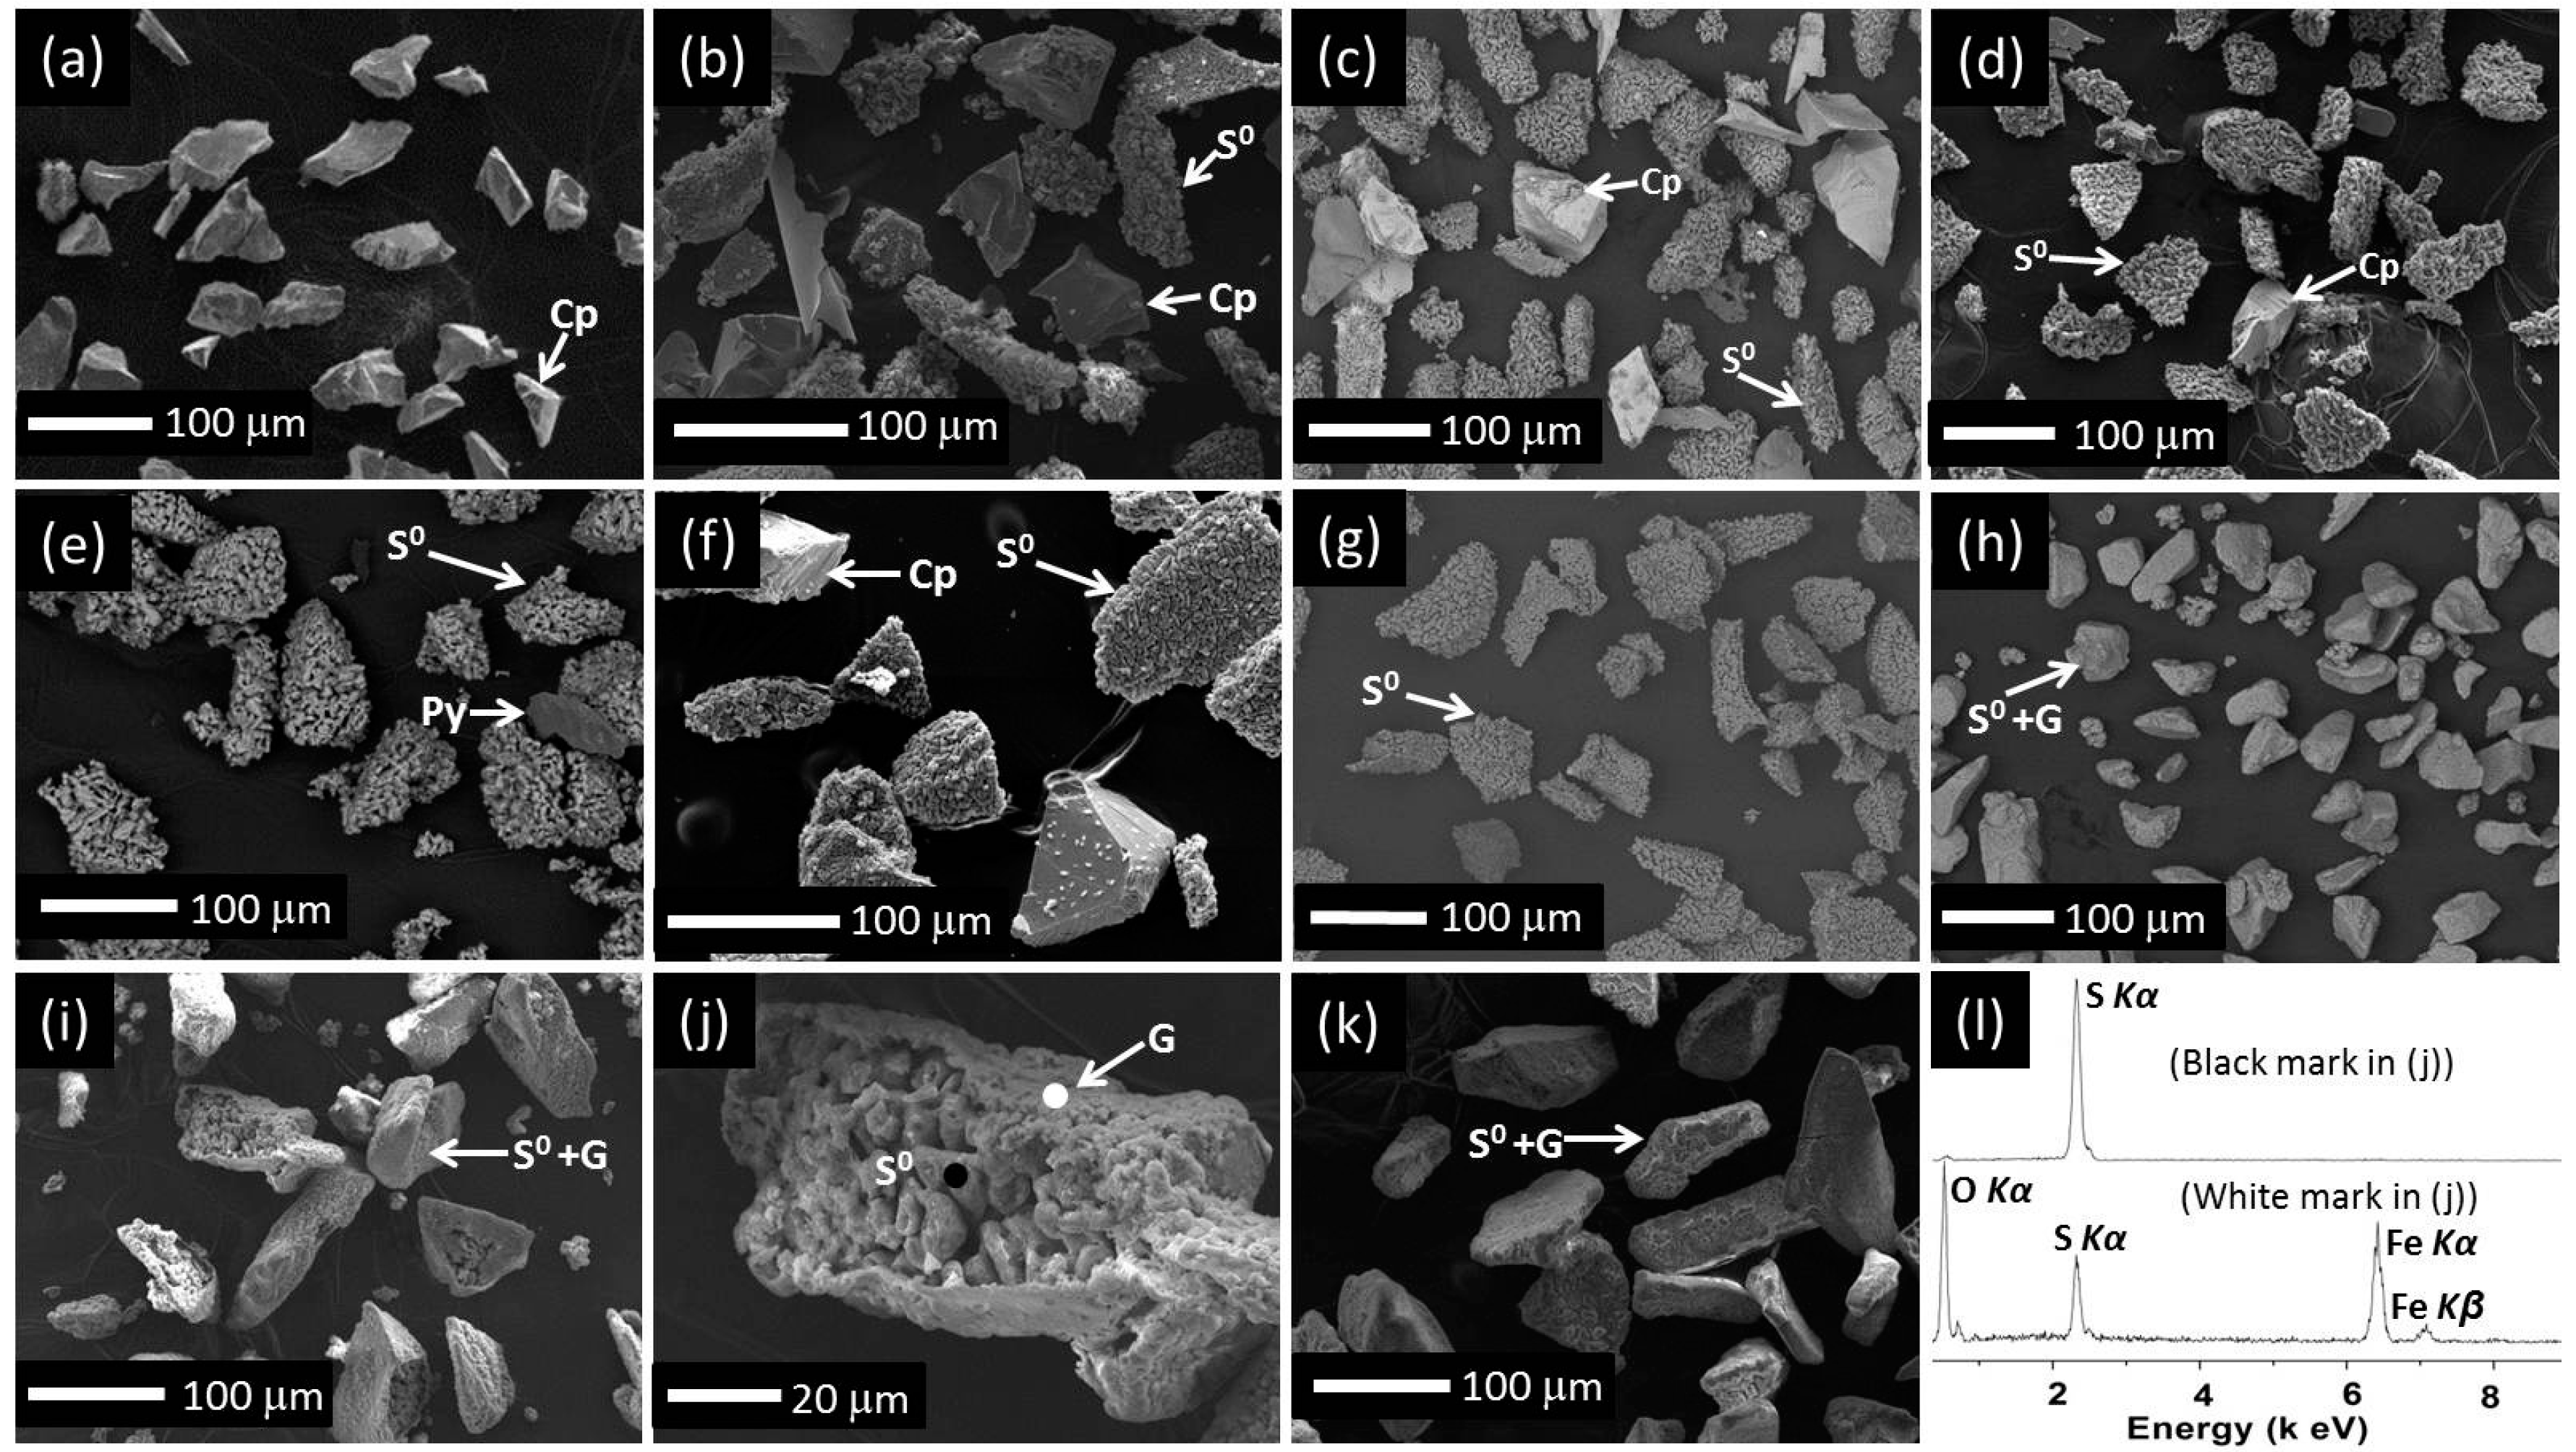
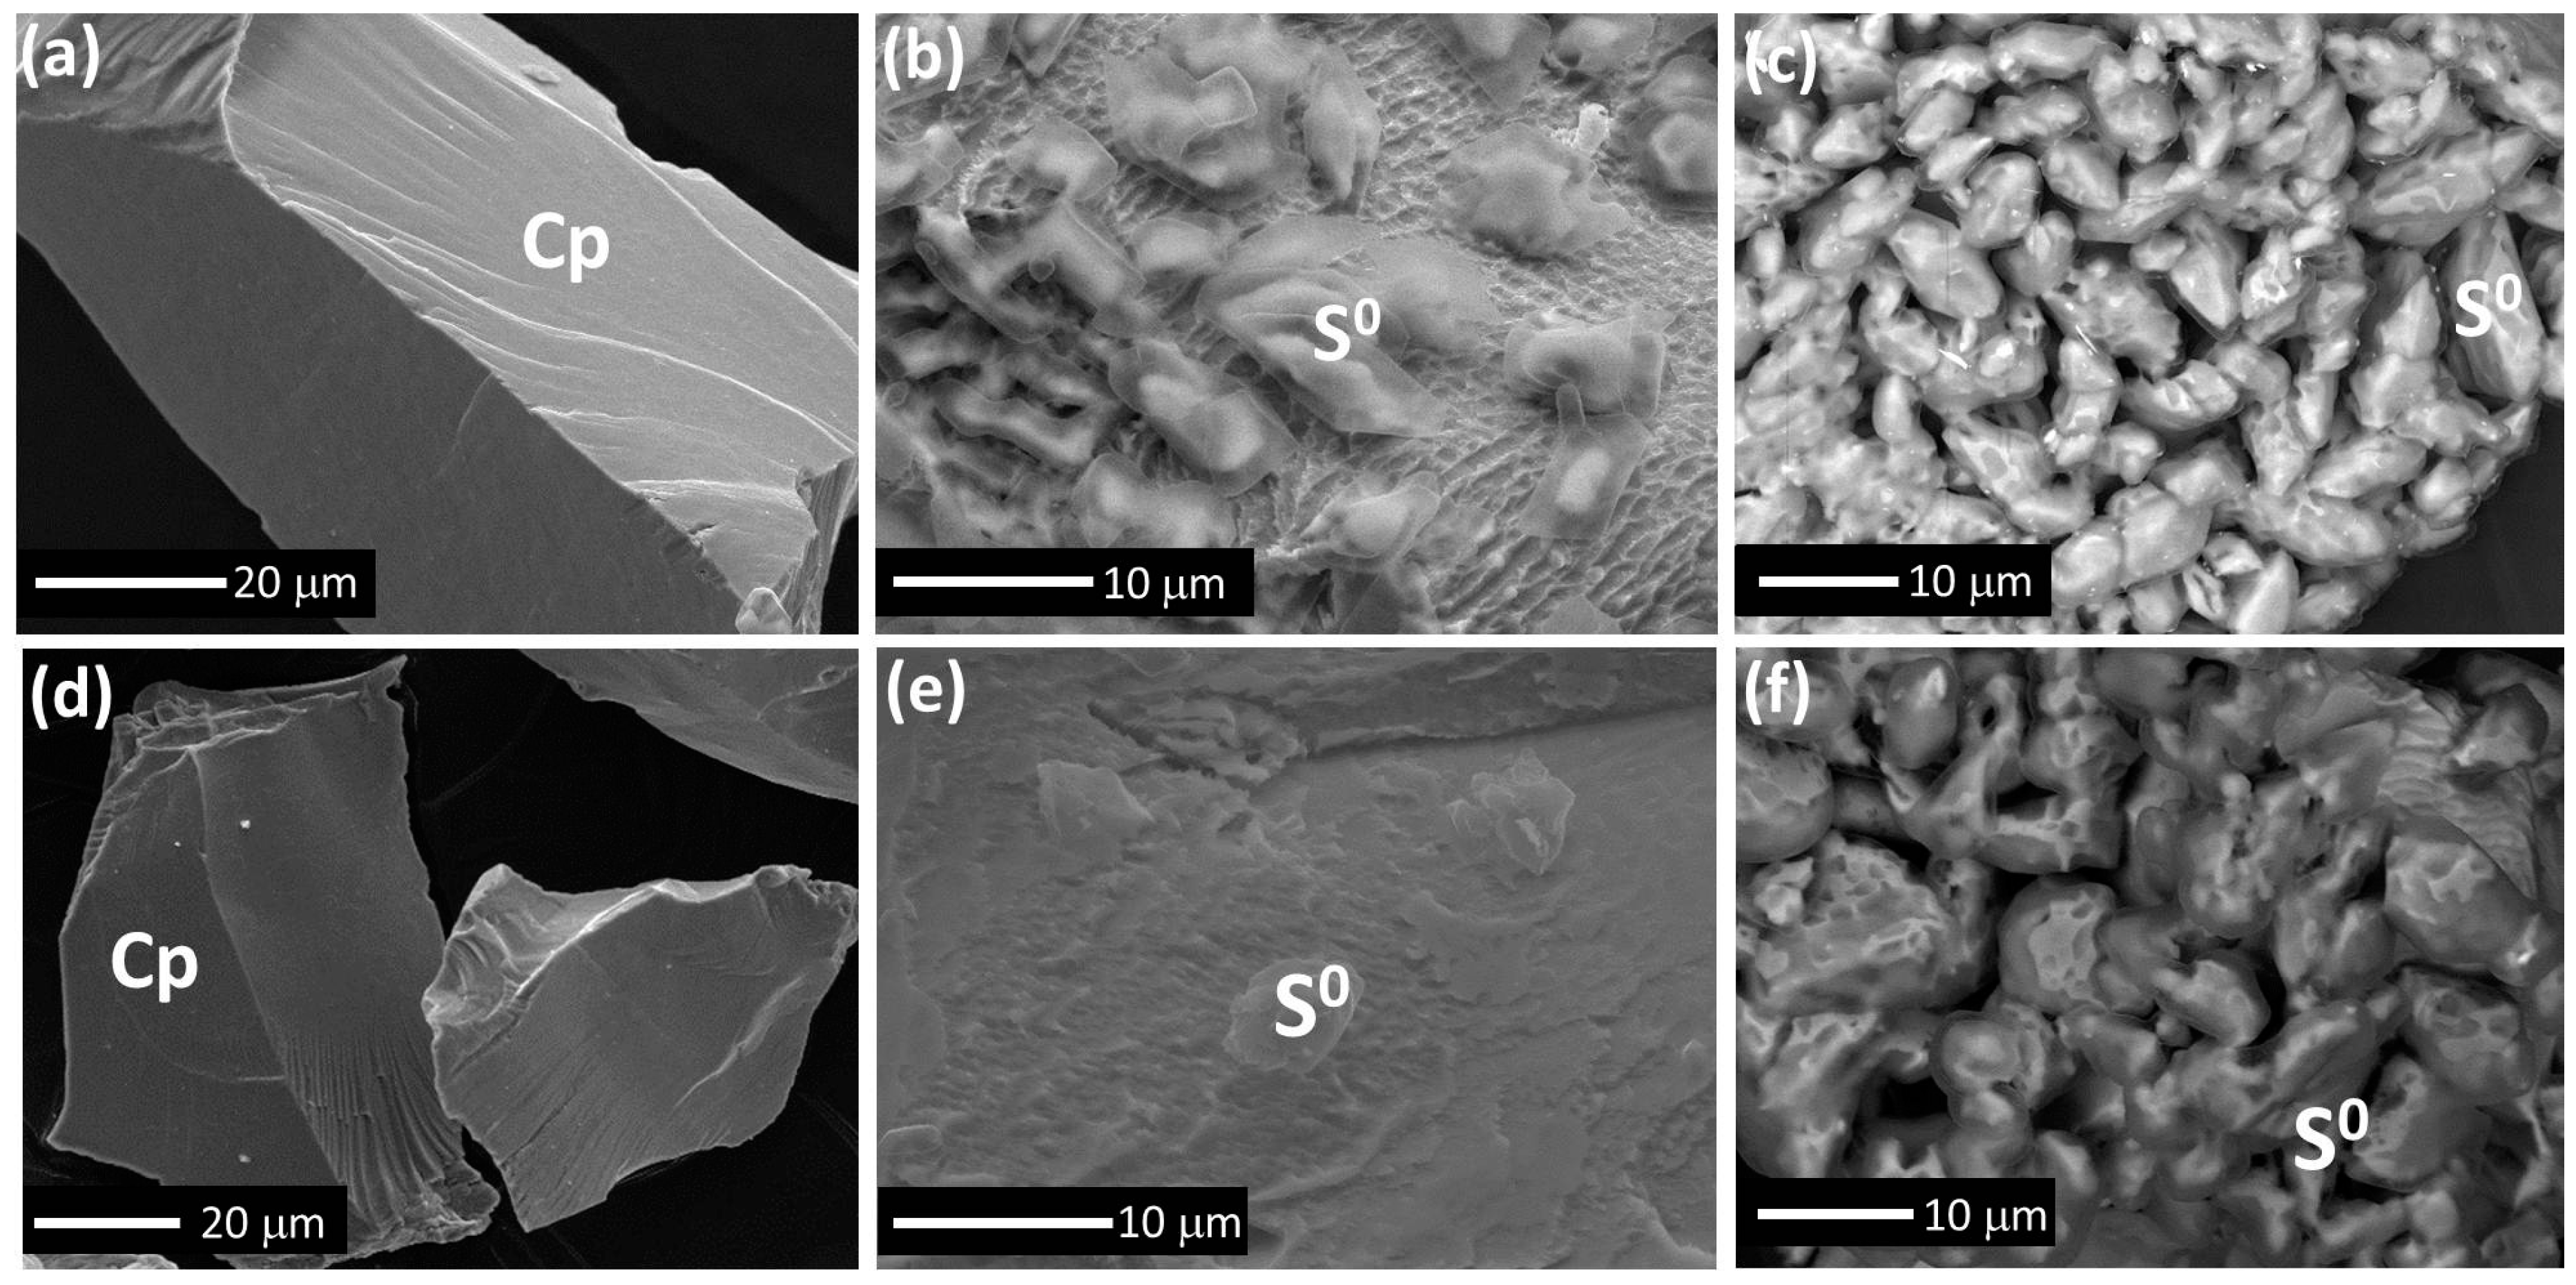
To investigate the evolution of surface species, time-resolved XPS spectra have been collected on samples leached for 1 and 30 h at 750 mV, 75 °C and pH 1.0 with and without iron addition. Elemental quantification derived from the survey spectra is provided in Table 3. The contributions from C 1s and O 1s have been normalised out as carbon containing species most likely arise from adsorption during transfer in air (adventitious carbon) while most of the oxygen containing species are likely due to surface adsorbed H2O.
The resulting S speciation quantification and associated binding energies are provided in Table 4. Figure 6 shows a selected high-resolution S 2p spectrum collected from chalcopyrite leached for 1 h at 750 mV, 75 °C and pH 1.0 without iron addition. The 80 at.% S on the feed sample (Table 3) may be due to surface reconstruction, resulting in significant surface concentrations of S22− and Sn2− [20], which were subsequently partially removed from the surface on leaching for 1 h (Table 4). As the leach proceeded to 30 h, more S and less Cu and Fe were present in the surface layer regardless of iron addition. The S concentrations on the chalcopyrite surfaces leached with iron addition were greater than those without iron addition until at least 30 h.
No SO42− was observed on any of the leached surfaces although this species was present on the surface of the feed. Bulk S2− on the feed accounted for 41% S, significantly less than on the chalcopyrite leached for 1 h regardless of iron addition. These observations also indicate that the uppermost surface oxidation products on the feed sample were removed rapidly during the first 1 h of leaching presenting relatively “fresh” surfaces with greater bulk S2− concentration. However, no morphological changes are observed in SEM images (Figure 9a,d).
For the sample leached for 1 h without iron addition, bulk S2− accounted for 64% S while less than 20% S was observed in the form of Sn2−, with another 3% S as S0. In the subsequent 29 h, bulk S2− diminished by 20% and Sn2− doubled, indicating considerable oxidation. However, in comparison, after 1 h, less bulk S2− but more Sn2− was detected on the surface leached in the presence of added iron due to the greater initial oxidation/leaching rate. More significant changes were observed on longer leaching (30 h) with Sn2− (71% S) predominating and bulk S2− being a minor component (3% S).
The binding energy of Fe(III)–S is generally accepted to be 707–708 eV while 711–712 eV is indicative of Fe(III)–O/OH [74,75,76]. Li, et al. [20] reported that synchrotron XPS Fe 2p spectra collected from a freshly fractured chalcopyrite surface showed a strong peak around 708 eV arising from fully coordinated Fe(III) bonded to S in the bulk chalcopyrite, in accord with other literature reports [5,36,77,78,79,80]. No peak has been observed on freshly fractured surfaces at 710–714 eV suggesting the absence of Fe(III)–O/OH/SO [5,36,37,77,78,81,82].
Figure 7 shows the Fe 2p spectra collected from chalcopyrite leached for 1 h and 30 h at 750 mV, 75 °C and pH 1.0 with and without iron addition. Two peaks located at 707.6–708.2 and 710–713 eV were observed on the chalcopyrite surface leached for 1 h without iron addition (Figure 7a), with the intensity of the latter being stronger than the former. The presence of Fe(III)–O/OH (710–713 eV) might arise from the chalcopyrite feed having been air oxidised for several hours (due to grinding, sieving, sonication). No SO42− was observed on the leached surface (Table 4), indicating Fe(III)–SO42−, if formed, was dissolved quickly due to its high solubility at low pH. As the leach proceeded to 30 h the peak representing Fe(III)–O/OH (Figure 7b) decreased significantly, indicating reduction in the surface concentration of this species.
Less Fe(III)–O/OH was observed on the chalcopyrite surface leached for 1 h in the presence of 4 mmol added iron (Figure 7c) as compared to the leach without added iron. This observation is in agreement with the previous discussion that leaching within the initial 1 h involves the removal of the oxidised surface products and that leaching was enhanced by the addition of 4 mmol iron.
No significant changes in the Cu spectra were observed as a function of leach conditions or duration. For all the samples examined, most of O species are chemisorbed, physisorbed and OH. No significant changes were observed in O2−/OH species during 30 h regardless of iron addition.

3.5. SEM Analysis

Figure 8 shows SEM images and EDS results from the residues removed at the end of leaching at pH 1.0 and 2.0 without iron addition at various temperatures. For leaching at pH 1.0 and 35 °C no evidence of S0 was observed as less than 10% Cu was extracted (Figure 8a). It is apparent that fewer unleached chalcopyrite particles remained in the residues at greater temperatures (Figure 8b–e), which is consistent with data shown in Figure 1a.
S0 clusters (phase identified by XRD, not shown), in addition to chalcopyrite particles, were observed in the residue collected at 35 °C at pH 2.0 with no equivalent observation for pH 1.0 (Figure 8f cf. Figure 8a) due to greater Cu extraction (Figure 1d). As compared to 35 °C at pH 2.0 (Figure 8f), less chalcopyrite but more S0 agglomerates were observed at 43 °C (Figure 8g). The S0 agglomerates formed at pH 2.0 were covered by a layer when the temperature was greater than 43 °C (Figure 8h–k). EDS (Figure 8l) indicated that this layer contained Fe, O and S while XRD showed the presence of goethite (FeOOH). The S signal derived from the particle surface containing goethite in Figure 8j is likely to be derived from the underlying S0 layer (Figure 8l). The size of the S0 clusters formed in the residues is nearly the same as the original chalcopyrite particles.
To understand the effect of added iron on the evolution of surface morphology, SEM images (Figure 9) were taken of the solids after leaching for 1, 30 and 72 h at pH 1.0, 75 °C with and without 4 mmol iron addition. Figure 9a,d shows that the chalcopyrite surfaces were very smooth and no evidence of oxidation products at the micro-scale were observed in the first 1 h. However, more S0 was formed on the chalcopyrite surface leached for 30 h with added iron (Figure 9b) as compared to without iron addition (Figure 9e), indicating the formation of S0 was enhanced by the addition of iron. Moreover, the roughness of the surface shown in Figure 9b appears greater than that shown in Figure 9e. However, no difference was observed in the final products of these two leach residues as the majority of the solids remaining is S0 (Figure 9c,f).

3.6. Identification of Reactions and Mechanisms

After decades of debate, the most accepted stoichiometric reaction to describe chalcopyrite dissolution (Equation (9)) is via oxidation by Fe3+ [8,11,13,28,83] although the actual dissolution mechanism remains controversial:
CuFeS 2 ( s ) + 4 Fe 3 + Cu 2 + + 5 Fe 2 + + 2 S 0
Equation (9) indicates that Fe3+ is involved as an oxidant in chalcopyrite leaching, consistent with the enhanced (initial) leach rate at 750 mV, especially for the leaches at low temperatures, upon the addition of iron. This has long been recognised with increased Cu extraction rates observed on increased Fe3+ concentration from 0.0001 to 0.1 M [11]. In particular, at low Fe3+ concentrations, free Fe3+ activity plays a positive role in chalcopyrite leaching [33]. The outcomes from these previous investigations support our derived rate law (Equation (8)) for the initial leaching stage.
Many investigators [4,84,85,86] have pointed out that Equation (10) is also relevant to both acid mine drainage and heap leaching:
CuFeS 2 ( s ) + 16 Fe 3 + + 8 H 2 O Cu 2 + + 17 Fe 2 + + 2 SO 4 2 + 16 H +
As both Equations (9) and (10) indicate a positive effect due to the presence of Fe3+, it is worth trying to use the product(s) of these reactions to determine which of the above two reactions is the most important for the conditions applied in this study. The oxidised S species on chalcopyrite surfaces have been widely investigated both by bulk assay [9,28] and at near-surface interfaces [2,3,35,78] using laboratory and synchrotron-based technologies, e.g., Dutrizac [28] reported that about 94% of the S oxidation product was S0 while the remaining 6% of the reacted S was in the form of SO42− at 95 °C. Similarly, Kametani and Aoki [6] found that S2− was oxidised to S0 regardless of the solution potential under 900 mV.
In this study, assuming chalcopyrite dissolution proceeds only via Equation (10), complete Cu extraction (20 mmol chalcopyrite dissolved in the experiments described herein) would produce 40 mmol SO42− in solution. As compared to the S concentration in the fresh H2SO4 solution prior to leaching (around 10 mmol total S in 1 L pH 2.0 H2SO4 solution) such an increase in S concentration would have been observed by ICP-AES. However, ICP-AES results indicated no significant increase in S concentration for any of the leach experiments. In contrast, a large amount of S0 was observed, via SEM and XRD, within the final residues (except leaches at pH 1.0 and 1.5 and 35 °C without iron addition where less than 10% Cu was extracted) further indicating that the chalcopyrite leaching reaction at 750 mV, 75 °C and pH 1.0–2.0, regardless of the addition of iron, occurred predominantly via Equation (9).
The negative effect from H+ activity, as indicated by Equation (8), should also be considered. As pH has been controlled throughout each experiment, the calculation of Fe3+ activity is based on a fixed H+ activity. Therefore, H+ activity is not an experimental variable within any specific experiment. The negative effect from a H + is consistent with other studies [2,33,86], and may be due to the reduced competition between Fe3+ and H+ on the chalcopyrite surface at greater pH. PHREEQC calculations show that if the Fe concentration is the same, the activity of free Fe3+ (in H2SO4 solution) at greater pH is greater than that at smaller pH due to reduced ion pairing with SO42−. This combined with the reduced H+ activity results in the greater leach rate at pH 2 as compared to 1.5 and 1.0.
The consumption of H+, as well as the oxidation of Fe2+ to Fe3+ by addition of H2O2 can be expressed by Equation (11):
2 Fe 2 + + 2 H + + H 2 O 2 ( aq ) 2 Fe 3 + + 2 H 2 O
Oxidative chalcopyrite leaching by reaction with O2 and H+ (Equation (12)) may also consume protons during the initial stages of dissolution when Fe3+ concentration/activity is low.
CuFeS 2 + O 2 + 4 H + Cu 2 + + Fe 2 + + 2 S 0 + 2 H 2 O
The occurrence of acid consuming reactions was apparent in that the pH would have increased with leaching if H2SO4 had not been added. Non-oxidative chalcopyrite leach mechanisms [4,5,19], which involve the consumption of H+ can be neglected due to the oxidising conditions applied here. Hence, H+ consumption is likely to occur primarily in conjunction with Fe2+ oxidation (Equation (11)) when significant aqueous iron is present in solution.
Despite iron oxide/hydroxide precipitation occurring at pH 1.5 and 2.0 at high temperatures in the later leach stages (Figure 1e), a reduction in leach rates does not take place. This indicates that the leach rate is largely independent of free Fe3+ activity during this leach stage at which time the leach process appears to be diffusion controlled as indicated by the low E a derived. Hence, the rate law established for the initial stage (Equation (8)) cannot be extended to later stages. Moreover, after precipitation takes place the iron concentration remains largely stable regardless of further chalcopyrite dissolution whereas the rate of leaching can continue to increase. This suggests that the diffusion control is across the surface layers formed on the chalcopyrite, but there is currently no definitive evidence to support this proposal. It is clear that the relationship between solution speciation and the Cu dissolution during the later leach stages requires further investigation to determine the specific nature of the diffusion event(s) occurring.

4. Conclusions and Future Work

Chalcopyrite dissolution has been conducted at 750 mV, 35–75 °C and pH 1.0 (with and without iron addition) and pH 1.5 and 2.0 without iron addition. The rate law (Equation (8)) for initial Cu leaching confirms the effects of pH, temperature and Fe3+ activity, all of which have been discussed widely by other investigators but rarely incorporated together into a rate law.
The E a values derived indicate that chalcopyrite dissolution is initially controlled by surface chemical reaction which is associated with the activities of solution speciation of Fe3+ and H+ with reaction orders of 0.12 and −0.28. The negative role of a H + may be due to increased competition between Fe3+ and H+ for available reaction sites on chalcopyrite surface at lower pH. The activity of Fe3+, for the same iron concentration, decreases as the pH decreases due to the increased ion pairing with the increased sulfate concentration. No direct relationship was observed between Cu extraction rates and these two species during subsequent leaching (20%–80% Cu extraction) which appears to be diffusion-controlled. Importantly, the addition of iron can significantly shorten the initial “induction” period, especially at low temperatures, e.g., 35 °C (Figure 1a cf Figure 1b).
Analysis of the leached chalcopyrite surfaces, both in the initial and later stages indicates the surface products (predominantly S0 within the final leach residues) covering the chalcopyrite surface did not passivate the chalcopyrite from further leaching. In some instances, particularly at lower temperatures, 10%–20% of the chalcopyrite particles remained unleached with these particles appearing inactive as they were not covered by S0. Further work will focus on identifying the specific properties of these unleached chalcopyrite particles.

Acknowledgments

This research work was supported by Rio Tinto and the Australian Research Council via the Linkage Project “Solution and surface speciation evolution during chalcopyrite leaching” (LP110200326). In addition, the financial support from the Fundamental Research Funds for the Central Universities (WUT: 2016IVA046) is gratefully acknowledged.

Author Contributions

Andrea R. Gerson and Yubiao Li conceived and designed the experiments; Yubiao Li performed the experiments; Yubiao Li, Gujie Qian and Jun Li analyzed the data; Andrea R. Gerson and Zhenlun Wei contributed reagents/materials/analysis tools; all authors have contributed to the writing of the paper.

Conflicts of Interest

The authors declare no conflict of interest.

References

  1. Habashi, F. Chalcopyrite. In Its Chemistry and Metallurgy; McGraw-Hill: New York, NY, USA, 1978. [Google Scholar]
  2. Li, J.; Kawashima, N.; Kaplun, K.; Absolon, V.J.; Gerson, A.R. Chalcopyrite leaching: The rate controlling factors. Geochim. Cosmochim. Acta 2010, 74, 2881–2893. [Google Scholar] [CrossRef]
  3. Kaplun, K.; Li, J.; Kawashima, N.; Gerson, A.R. Cu and Fe chalcopyrite leach activation energies and the effect of added Fe3+. Geochim. Cosmochim. Acta 2011, 75, 5865–5878. [Google Scholar] [CrossRef]
  4. Kimball, B.E.; Rimstidt, J.D.; Brantley, S.L. Chalcopyrite dissolution rate laws. Appl. Geochem. 2010, 25, 972–983. [Google Scholar] [CrossRef]
  5. Li, Y.; Kawashima, N.; Li, J.; Chandra, A.P.; Gerson, A.R. A review of the structure, and fundamental mechanisms and kinetics of the leaching of chalcopyrite. Adv. Colloid Interface Sci. 2013, 197–198, 1–32. [Google Scholar] [CrossRef] [PubMed]
  6. Kametani, H.; Aoki, A. Effect of suspension potential on the oxidation rate of copper concentrate in a sulfuric acid solution. Metall. Mater. Trans. B 1985, 16, 695–705. [Google Scholar] [CrossRef]
  7. Córdoba, E.M.; Muñoz, J.A.; Blázquez, M.L.; González, F.; Ballester, A. Leaching of chalcopyrite with ferric ion. Part III: Effect of redox potential on the silver-catalyzed process. Hydrometallurgy 2008, 93, 97–105. [Google Scholar] [CrossRef]
  8. Watling, H.R. Chalcopyrite hydrometallurgy at atmospheric pressure: 1. Review of acidic sulfate, sulfate-chloride and sulfate-nitrate process options. Hydrometallurgy 2013, 140, 163–180. [Google Scholar] [CrossRef]
  9. Jones, D.L.; Peters, E. The leaching of chalcopyrite with ferric sulfate and ferric chloride. Extr. Metall. Copp. 1976, 2, 633–653. [Google Scholar]
  10. Lin, H.; Sohn, H.; Wadsworth, M. The kinetics of leaching of chalcopyrite and pyrite grains in primary copper ore by dissolved-oxygen. In Hydrometallurgical Reactor Design and Kinetics; TMS-AIME: Warrendale, PA, USA, 1986; pp. 149–168. [Google Scholar]
  11. Hirato, T.; Majima, H.; Awakura, Y. The leaching of chalcopyrite with ferric sulfate. Metall. Mater. Trans. B 1987, 18, 489–496. [Google Scholar] [CrossRef]
  12. Hiroyoshi, N.; Miki, H.; Hirajima, T.; Tsunekawa, M. A model for ferrous-promoted chalcopyrite leaching. Hydrometallurgy 2000, 57, 31–38. [Google Scholar] [CrossRef]
  13. Hiroyoshi, N.; Miki, H.; Hirajima, T.; Tsunekawa, M. Enhancement of chalcopyrite leaching by ferrous ions in acidic ferric sulfate solutions. Hydrometallurgy 2001, 60, 185–197. [Google Scholar] [CrossRef]
  14. Qiu, T.; Nie, G.; Wang, J.; Cui, L. Kinetic process of oxidative leaching of chalcopyrite under low oxygen pressure and low temperature. Trans. Nonferrous Met. Soc. China 2007, 17, 418–422. [Google Scholar] [CrossRef]
  15. Klauber, C. A critical review of the surface chemistry of acidic ferric sulphate dissolution of chalcopyrite with regards to hindered dissolution. Int. J. Miner. Proc. 2008, 86, 1–17. [Google Scholar] [CrossRef]
  16. Watling, H.R. The bioleaching of sulphide minerals with emphasis on copper sulphides—A review. Hydrometallurgy 2006, 84, 81–108. [Google Scholar] [CrossRef]
  17. Munoz, P.B.; Miller, J.D.; Wadsworth, M.E. Reaction mechanism for the acid ferric sulfate leaching of chalcopyrite. Metall. Trans. B 1979, 10, 149–158. [Google Scholar] [CrossRef]
  18. Pradhan, N.; Nathsarma, K.C.; Srinivasa Rao, K.; Sukla, L.B.; Mishra, B.K. Heap bioleaching of chalcopyrite: A review. Miner. Eng. 2008, 21, 355–365. [Google Scholar] [CrossRef]
  19. Sokic, M.D.; Markovic, B.; Zivkovic, D. Kinetics of chalcopyrite leaching by sodium nitrate in sulphuric acid. Hydrometallurgy 2009, 95, 273–279. [Google Scholar] [CrossRef]
  20. Li, Y.; Chandra, A.P.; Gerson, A.R. Scanning photoelectron microscopy studies of freshly fractured chalcopyrite exposed to O2 and H2O. Geochim. Cosmochim. Acta 2014, 133, 372–386. [Google Scholar] [CrossRef]
  21. Hiroyoshi, N.; Arai, M.; Miki, H.; Tsunekawa, M.; Hirajima, T. A new reaction model for the catalytic effect of silver ions on chalcopyrite leaching in sulfuric acid solutions. Hydrometallurgy 2002, 63, 257–267. [Google Scholar] [CrossRef]
  22. Koleini, S.M.J.; Jafarian, M.; Abdollahy, M.; Aghazadeh, V. Galvanic leaching of chalcopyrite in atmospheric pressure and sulfate media: Kinetic and surface studies. Ind. Eng. Chem. Res. 2010, 49, 5997–6002. [Google Scholar] [CrossRef]
  23. Antonijevic, M.M.; Jankovic, Z.D.; Dimitrijevic, M.D. Kinetics of chalcopyrite dissolution by hydrogen peroxide in sulphuric acid. Hydrometallurgy 2004, 71, 329–334. [Google Scholar] [CrossRef]
  24. Adebayo, A.; Ipinmoroti, K.; Ajayi, O. Dissolution kinetics of chalcopyrite with hydrogen peroxide in sulphuric acid medium. Chem. Biochem. Eng. Q. 2003, 17, 213–218. [Google Scholar]
  25. Yévenes, L.V.; Miki, H.; Nicol, M. The dissolution of chalcopyrite in chloride solutions: Part 2: Effect of various parameters on the rate. Hydrometallurgy 2010, 103, 80–85. [Google Scholar] [CrossRef]
  26. Aydogan, S.; Ucar, G.; Canbazoglu, M. Dissolution kinetics of chalcopyrite in acidic potassium dichromate solution. Hydrometallurgy 2006, 81, 45–51. [Google Scholar] [CrossRef]
  27. Saxena, N.N.; Mandre, N.R. Mixed control kinetics of copper dissolution for copper ore using ferric chloride. Hydrometallurgy 1992, 28, 111–117. [Google Scholar] [CrossRef]
  28. Dutrizac, J.E. Elemental sulphur formation during the ferric sulphate leaching of chalcopyrite. Can. Metall. Q. 1989, 28, 337–344. [Google Scholar] [CrossRef]
  29. Antonijevic, M.M.; Jankovic, Z.; Dimitrijevic, M. Investigation of the kinetics of chalcopyrite oxidation by potassium dichromate. Hydrometallurgy 1994, 35, 187–201. [Google Scholar] [CrossRef]
  30. Klauber, C.; Parker, A.; van Bronswijk, W.; Watling, H. Sulphur speciation of leached chalcopyrite surfaces as determined by X-ray photoelectron spectroscopy. Int. J. Miner. Proc. 2001, 62, 65–94. [Google Scholar] [CrossRef]
  31. Hackl, R.P.; Dreisinger, D.B.; Peters, E.; King, J.A. Passivation of chalcopyrite during oxidative leaching in sulfate media. Hydrometallurgy 1995, 39, 25–48. [Google Scholar] [CrossRef]
  32. Tshilombo, A.F.; Petersen, J.; Dixon, D.G. The influence of applied potentials and temperature on the electrochemical response of chalcopyrite during bacterial leaching. Miner. Eng. 2002, 15, 809–813. [Google Scholar] [CrossRef]
  33. Córdoba, E.M.; Muñoz, J.A.; Blázquez, M.L.; González, F.; Ballester, A. Leaching of chalcopyrite with ferric ion. Part I: General aspects. Hydrometallurgy 2008, 93, 81–87. [Google Scholar] [CrossRef]
  34. Parker, A.J.; Paul, R.L.; Power, G.P. Electrochemistry of the oxidative leaching of copper from chalcopyrite. J. Electroanal. Chem. Interfacial Electrochem. 1981, 118, 305–316. [Google Scholar] [CrossRef]
  35. Harmer, S.L.; Thomas, J.E.; Fornasiero, D.; Gerson, A.R. The evolution of surface layers formed during chalcopyrite leaching. Geochim. Cosmochim. Acta 2006, 70, 4392–4402. [Google Scholar] [CrossRef]
  36. Buckley, A.N.; Woods, R. An X-ray photoelectron spectroscopic study of the oxidation of chalcopyrite. Aust. J. Chem. 1984, 37, 2403–2413. [Google Scholar] [CrossRef]
  37. Brion, D. Photoelectron spectroscopic study of the surface degradation of pyrite (FeS2), chalcopyrite (CuFeS2), sphalerite (ZnS), and galena (PbS) in air and water. Appl. Surf. Sci. 1980, 5, 133–152. [Google Scholar] [CrossRef]
  38. Petersen, J.; Dixon, D.G. Thermophilic heap leaching of a chalcopyrite concentrate. Miner. Eng. 2002, 15, 777–785. [Google Scholar] [CrossRef]
  39. Petersen, J.; Dixon, D.G. Competitive bioleaching of pyrite and chalcopyrite. Hydrometallurgy 2006, 83, 40–49. [Google Scholar] [CrossRef]
  40. Li, Y.; Qian, G.; Li, J.; Gerson, A. The rate controlling parameters in the hydrometallurgical leaching of chalcopyrite. In Proceedings of the ALTA 2014, Perth, Australia, 24–31 May 2014; pp. 399–410.
  41. Sandström, A.; Shchukarev, A.; Paul, J. XPS characterisation of chalcopyrite chemically and bio-leached at high and low redox potential. Miner. Eng. 2005, 18, 505–515. [Google Scholar] [CrossRef]
  42. Córdoba, E.M.; Muñoz, J.A.; Blázquez, M.L.; González, F.; Ballester, A. Leaching of chalcopyrite with ferric ion. Part II: Effect of redox potential. Hydrometallurgy 2008, 93, 88–96. [Google Scholar] [CrossRef]
  43. Hiroyoshi, N.; Kitagawa, H.; Tsunekawa, M. Effect of solution composition on the optimum redox potential for chalcopyrite leaching in sulfuric acid solutions. Hydrometallurgy 2008, 91, 144–149. [Google Scholar] [CrossRef]
  44. Geelhoed, J.S.; Meeussen, J.C.L.; Hillier, S.; Lumsdon, D.G.; Thomas, R.P.; Farmer, J.G.; Paterson, E. Identification and geochemical modeling of processes controlling leaching of CR(VI) and other major elements from chromite ore processing residue. Geochim. Cosmochim. Acta 2002, 66, 3927–3942. [Google Scholar] [CrossRef]
  45. Schiopu, N.; Tiruta-Barna, L.; Jayr, E.; Méhu, J.; Moszkowicz, P. Modelling and simulation of concrete leaching under outdoor exposure conditions. Sci. Total Environ. 2009, 407, 1613–1630. [Google Scholar] [CrossRef] [PubMed]
  46. Tiruta-Barna, L. Using phreeqc for modelling and simulation of dynamic leaching tests and scenarios. J. Hazard. Mater. 2008, 157, 525–533. [Google Scholar] [CrossRef] [PubMed]
  47. Halim, C.E.; Short, S.A.; Scott, J.A.; Amal, R.; Low, G. Modelling the leaching of Pb, Cd, As, and Cr from cementitious waste using phreeqc. J. Hazard. Mater. 2005, 125, 45–61. [Google Scholar] [CrossRef] [PubMed]
  48. Parkhurst, D.L.; Appelo, C.A.J. User’s Guide to Phreeqc (Version 2): A Computer Program for Speciation, Batch-Reaction, One-Dimensional Transport, and Inverse Geochemical Calculations; U.S. Geological Survey: Denver, CO, USA, 1999. [Google Scholar]
  49. Briggs, D.; Seah, M.P. Practical Surface Analysis: By Auger and X-ray Photoelectron Spectroscopy; John Wiley & Sons: Chichester, UK, 1983. [Google Scholar]
  50. Smart, R.S.C. Surface layers in base metal sulphide flotation. Miner. Eng. 1991, 4, 891–909. [Google Scholar] [CrossRef]
  51. Mahajan, V.; Misra, M.; Zhong, K.; Fuerstenau, M.C. Enhanced leaching of copper from chalcopyrite in hydrogen peroxide-glycol system. Miner. Eng. 2007, 20, 670–674. [Google Scholar] [CrossRef]
  52. Yue, G.; Zhao, L.; Olvera, O.G.; Asselin, E. Speciation of the H2SO4–Fe2(SO4)3–FeSO4–H2O system and development of an expression to predict the redox potential of the Fe3+/Fe2+ couple up to 150 °C. Hydrometallurgy 2014, 147–148, 196–209. [Google Scholar] [CrossRef]
  53. Velardo, A.; Giona, M.; Adrover, A.; Pagnanelli, F.; Toro, L. Two-layer shrinking-core model: Parameter estimation for the reaction order in leaching processes. Chem. Eng. J. 2002, 90, 231–240. [Google Scholar] [CrossRef]
  54. Córdoba, E.M.; Muñoz, J.A.; Blázquez, M.L.; González, F.; Ballester, A. Leaching of chalcopyrite with ferric ion. Part IV: The role of redox potential in the presence of mesophilic and thermophilic bacteria. Hydrometallurgy 2008, 93, 106–115. [Google Scholar] [CrossRef]
  55. Dutrizac, J. The dissolution of chalcopyrite in ferric sulfate and ferric chloride media. Metall. Mater. Trans. B 1981, 12, 371–378. [Google Scholar] [CrossRef]
  56. Nicol, M.; Miki, H.; Velásquez-Yévenes, L. The dissolution of chalcopyrite in chloride solutions: Part 3. Mechanisms. Hydrometallurgy 2010, 103, 86–95. [Google Scholar] [CrossRef]
  57. Vilcáez, J.; Yamada, R.; Inoue, C. Effect of pH reduction and ferric ion addition on the leaching of chalcopyrite at thermophilic temperatures. Hydrometallurgy 2009, 96, 62–71. [Google Scholar] [CrossRef]
  58. Vilcáez, J.; Suto, K.; Inoue, C. Bioleaching of chalcopyrite with thermophiles: Temperature-pH-ORP dependence. Int. J. Miner. Proc. 2008, 88, 37–44. [Google Scholar] [CrossRef]
  59. Vilcáez, J.; Inoue, C. Mathematical modeling of thermophilic bioleaching of chalcopyrite. Miner. Eng. 2009, 22, 951–960. [Google Scholar] [CrossRef]
  60. He, H.; Xia, J.; Hong, F.; Tao, X.; Leng, Y.; Zhao, Y. Analysis of sulfur speciation on chalcopyrite surface bioleached with acidithiobacillus ferrooxidans. Miner. Eng. 2012, 27–28, 60–64. [Google Scholar] [CrossRef]
  61. Pan, H.; Yang, H.; Tong, L.; Zhong, C.; Zhao, Y. Control method of chalcopyrite passivation in bioleaching. Trans. Nonferrous Met. Soc.China 2012, 22, 2255–2260. [Google Scholar] [CrossRef]
  62. Gómez, E.; Blázquez, M.L.; Ballester, A.; González, F. Study by SEM and EDS of chalcopyrite bioleaching using a new thermophilic bacteria. Miner. Eng. 1996, 9, 985–999. [Google Scholar] [CrossRef]
  63. Third, K.A.; Cord-Ruwisch, R.; Watling, H.R. The role of iron-oxidizing bacteria in stimulation or inhibition of chalcopyrite bioleaching. Hydrometallurgy 2000, 57, 225–233. [Google Scholar] [CrossRef]
  64. Gericke, M.; Pinches, A.; van Rooyen, J.V. Bioleaching of a chalcopyrite concentrate using an extremely thermophilic culture. Int. J. Miner. Proc. 2001, 62, 243–255. [Google Scholar] [CrossRef]
  65. Keeling, S.E.; Palmer, M.L.; Caracatsanis, F.C.; Johnson, J.A.; Watling, H.R. Leaching of chalcopyrite and sphalerite using bacteria enriched from a spent chalcocite heap. Miner. Eng. 2005, 18, 1289–1296. [Google Scholar] [CrossRef]
  66. Ahmadi, A.; Schaffie, M.; Petersen, J.; Schippers, A.; Ranjbar, M. Conventional and electrochemical bioleaching of chalcopyrite concentrates by moderately thermophilic bacteria at high pulp density. Hydrometallurgy 2011, 106, 84–92. [Google Scholar] [CrossRef]
  67. Tshilombo, A.F. Mechanism and Kinetics of Chalcopyrite Passivation and Depassivation During Ferric and Microbial Leaching. Ph.D. Thesis, University of Brithish Columbia, Vancouver, BC, Canada, 2004. [Google Scholar]
  68. Wang, J.; Qin, W.; Zhang, Y.; Yang, C.; Zhang, J.; Nai, S.; Shang, H.; Qiu, G. Bacterial leaching of chalcopyrite and bornite with native bioleaching microorganism. Trans. Nonferrous Met. Soc. China 2008, 18, 1468–1472. [Google Scholar] [CrossRef]
  69. Mahajan, V.K. Study of Chalcopyrite Oxidation in Hydrogen Peroxide-Ethylene Glycol System. Master’s Thesis, University of Nevada, Reno, NV, USA, 2005. [Google Scholar]
  70. Dreisinger, D.; Abed, N. A fundamental study of the reductive leaching of chalcopyrite using metallic iron part I: Kinetic analysis. Hydrometallurgy 2002, 66, 37–57. [Google Scholar] [CrossRef]
  71. Li, Y.; Qian, G.; Li, J.; Gerson, A.R. Kinetics and roles of solution and surface species of chalcopyrite dissolution at 650 mV. Geochim. Cosmochim. Acta 2015, 161, 188–202. [Google Scholar] [CrossRef]
  72. Dong, T.; Hua, Y.; Zhang, Q.; Zhou, D. Leaching of chalcopyrite with brønsted acidic ionic liquid. Hydrometallurgy 2009, 99, 33–38. [Google Scholar] [CrossRef]
  73. Brümmer, G.W.; Barrow, N.J.; Fischer, L. Effect of porosity of goethite on the sorption of six heavy metal ions. Eur. J. Soil Sci. 2013, 64, 805–813. [Google Scholar] [CrossRef]
  74. Nesbitt, H.W.; Muir, I.J. X-ray photoelectron spectroscopic study of a pristine pyrite surface reacted with water vapour and air. Geochim. Cosmochim. Acta 1994, 58, 4667–4679. [Google Scholar] [CrossRef]
  75. McIntyre, N.S.; Zetaruk, D.G. X-ray photoelectron spectroscopic studies of iron oxides. Anal. Chem. 1977, 49, 1521–1529. [Google Scholar] [CrossRef]
  76. Nesbitt, H.W.; Muir, I.J. Oxidation states and speciation of secondary products on pyrite and arsenopyrite reacted with mine waste waters and air. Mineral. Petrol. 1998, 62, 123–144. [Google Scholar] [CrossRef]
  77. Acres, R.G.; Harmer, S.L.; Beattie, D.A. Synchrotron xps, nexafs, and tof-sims studies of solution exposed chalcopyrite and heterogeneous chalcopyrite with pyrite. Miner. Eng. 2010, 23, 928–936. [Google Scholar] [CrossRef]
  78. Mikhlin, Y.L.; Tomashevich, Y.V.; Asanov, I.P.; Okotrub, A.V.; Varnek, V.A.; Vyalikh, D.V. Spectroscopic and electrochemical characterization of the surface layers of chalcopyrite (CuFeS2) reacted in acidic solutions. Appl. Surface Sci. 2004, 225, 395–409. [Google Scholar] [CrossRef]
  79. Ghahremaninezhad, A.; Dixon, D.G.; Asselin, E. Electrochemical and xps analysis of chalcopyrite (CuFeS2) dissolution in sulfuric acid solution. Electrochim. Acta 2013, 87, 97–112. [Google Scholar] [CrossRef]
  80. Fairthorne, G.; Fornasiero, D.; Ralston, J. Effect of oxidation on the collectorless flotation of chalcopyrite. Int. J. Miner. Proc. 1997, 49, 31–48. [Google Scholar] [CrossRef]
  81. Acres, R.G.; Harmer, S.L.; Shui, H.W.; Chen, C.H.; Beattie, D.A. Synchrotron scanning photoemission microscopy of homogeneous and heterogeneous metal sulfide minerals. J. Synchrotron Radiat. 2011, 18, 649–657. [Google Scholar] [CrossRef] [PubMed]
  82. Dixon, D.G.; Mayne, D.D.; Baxter, K.G. Galvanox™—A novel galvanically-assisted atmospheric leaching technology for copper concentrates. Can. Metall. Q. 2008, 47, 327–336. [Google Scholar] [CrossRef]
  83. Cancho, L.; Blázquez, M.L.; Ballester, A.; González, F.; Muñoz, J.A. Bioleaching of a chalcopyrite concentrate with moderate thermophilic microorganisms in a continuous reactor system. Hydrometallurgy 2007, 87, 100–111. [Google Scholar] [CrossRef]
  84. Chen, M.; Zhang, L.; Gu, G.; Hu, Y.; Su, L. Effects of microorganisms on surface properties of chalcopyrite and bioleaching. Trans. Nonferrous Met. Soc. China 2008, 18, 1421–1426. [Google Scholar] [CrossRef]
  85. Fu, B.; Zhou, H.; Zhang, R.; Qiu, G. Bioleaching of chalcopyrite by pure and mixed cultures of acidithiobacillus spp. And leptospirillum ferriphilum. Int. Biodeterior. Biodegrad. 2008, 62, 109–115. [Google Scholar] [CrossRef]
  86. Antonijevic, M.M.; Bogdanovic, G.D. Investigation of the leaching of chalcopyritic ore in acidic solutions. Hydrometallurgy 2004, 73, 245–256. [Google Scholar] [CrossRef]
Figure 1. Cu concentrations and % extraction versus time for leaching experiments at 750 mV at 35, 43, 50, 65 and 75 °C: (a) pH 1.0, no iron addition; (b) pH 1.0 with 4 mmol iron addition; (c) pH 1.5, no iron addition; (d) pH 2.0, no iron addition; (e) Fe concentration versus Cu concentration at 750 mV, 75 °C and pH 1.0–2.0.
Minerals 06 00083 g001
Figure 2. Comparison of the free Fe3+/Fe2+ activity ratio calculated using the Nernst Equation (Equation (2)) and the PHREEQC solution speciation simulation software.
Minerals 06 00083 g002
Figure 3. E a (kJ·mol−1) calculation based on leaching with (a) <10% Cu extraction; (b) 20%–80% Cu extraction.
Minerals 06 00083 g003
Figure 4. Predicted and measured log r for <10% Cu extraction at 750 mV, 35–75 °C, pH 1.0 (with and without iron addition), 1.5 and 2.0 without iron addition.
Minerals 06 00083 g004
Figure 5. Relative surface area normalised leach rate and Cu extraction (%) against leach time for leaching at pH 1.0, 43 °C and 750 mV without iron addition. The large estimated errors for the last few data points are due to error propagation based on both experimental and fitting errors.
Minerals 06 00083 g005
Figure 6. High-resolution S 2p XP spectra collected from chalcopyrite leached for 1 h at 750 mV, 75 °C and pH 1.0 without iron addition.
Minerals 06 00083 g006
Figure 7. Fe 2p XP spectra collected from chalcopyrite leached at 750 mV, 75 °C and pH 1.0 for (a) 1 h and (b) 30 h both without iron addition and for (c) 1 h and (d) 30 h with iron addition.
Minerals 06 00083 g007
Figure 8. SEM images of final residues collected from leaches carried out at 750 mV, pH 1.0 without iron addition at: (a) 35 °C, (b) 43 °C, (c) 50 °C, (d) 65 °C, (e) 75 °C; pH 2.0 without iron addition at: (f) 35 °C, (g) 43 °C, (h) 50 °C, (i) 65 °C, (j) selected particle from (i), (k) 75 °C; (l) ED spectra from selected area shown in (j).
Minerals 06 00083 g008
Figure 9. SEM images collected from chalcopyrite leached with 4 mmol added iron at 750 mV and 75 °C for (a) 1 h, (b) 30 h, (c) 72 h; without iron addition for (d) 1 h, (e) 30 h, (f) 72 h.
Minerals 06 00083 g009
Table 1. Elemental composition of chalcopyrite sample measured by ICP-AES (total error for each element: 5%).
ElementSCuFeSiCaBiZnPbAsAlCoKMg
wt %3433290.890.760.290.540.300.060.040.100.020.02
Table 2. The activities of predominant Fe, Cu and S species calculated for 1 h and 30 h of leaching at pH 1.0 and 75 °C with and without iron addition. All species with activity greater than 10−10 are listed.
Solution SpeciesActivity (10−4)
No Iron Addition4 mmol Iron Addition
1 h30 h1 h30 h
Cu2+1.0729.200.8533.06
CuSO40.4615.780.3819.01
Fe2+0.9728.4512.7539.76
FeSO40.2910.643.9915.82
Fe3+0.0230.670.300.94
FeSO4+0.0341.270.481.89
FeOH2+1.47 × 10−30.040.020.06
Fe(SO4)21.31 × 10−46.12 × 10−31.92 × 10−39.67 × 10−3
Fe(OH)2+4.86 × 10−61.42 × 10−46.38 × 10−51.99 × 10−4
HSO4823.51037867.21103
SO42−18.7323.619.7325.10
Table 3. XPS elemental quantification (at.%) for the feed chalcopyrite and chalcopyrite leached at 750 mV, 75 °C and pH 1.0.
Element Core-LevelAverage Binding Energy (eV)FeedNo Iron Addition4 mmol Iron Addition
1 h30 h1 h30 h
Cu 2p3/2932.4122213148
Fe 2p3/2710.38129103
S 2p3/2162.68066787689
Table 4. S species (% S) for feed chalcopyrite and chalcopyrite surfaces leached at 750 mV, 75 °C and pH 1.0 for 1 h and 30 h.
S SpeciesBinding Energy (eV)FWHM (eV)FeedNo Iron4 mmol Iron Addition
1 h30 h1 h30 h
Surface S2−160.5–160.80.5–0.603200
Bulk S2−161.10.5–0.6416454533
S22−162.0–162.20.6–0.71796914
Sn2−162.9–163.21.0–1.23019333371
S0163.6–163.81.0–1.203239
SO42−168.2–169.21.2–1.580000
Energy loss164.8–165.21.2–1.542323

