Article

Assessment of Excavation Broken Zone around Gateways under Various Geological Conditions: A Case Study in Sichuan Province, China

1
State Key Laboratory of Coal Mine Disaster Dynamics and Control, Chongqing University, Chongqing 400044, China
2
Technology Center, Sichuan Coal Industry Group Limited Liability Company, Chengdu 610091, China
*
Author to whom correspondence should be addressed.
Minerals 2016, 6(3), 72; https://doi.org/10.3390/min6030072
Submission received: 28 April 2016 / Revised: 26 June 2016 / Accepted: 4 July 2016 / Published: 13 July 2016

Abstract

:
To study common failure characteristics of gateways, a total of 55 typical gateways at coal mines, in Sichuan Province, China, were selected for investigating the rules of broken widths based on the ground-penetrating radar (GPR) technique and numerical model. Results indicated that the broken width values around the gateways were larger than 1.5 m, and those in the roof and high side wall were larger than those in the low side wall, as a whole. The width values had close relationships with the thickness of the coal seam and immediate roof, angle of the coal seam, and depth of the gateways. Furthermore, combined with the plastic zone of numerical models in 3-Dimensional Distinct Element Code (3DEC) and the broken width, we obtained the excavation broken zone (EBZ) cross-section diagram for each gateway and determined that the EBZ appeared to have a basically elliptical shape—with the long axis along the seam inclination direction and the short axis along the vertical direction of the rock layer—and that this elliptical shape was only slightly affected by the gateway cross-section shape. It was observed that the failure extent was greater in the seam inclination direction than in the vertical direction of the rock layer. Obviously, the gateways presented asymmetric failure characteristics and implied that an asymmetric support system should be provided when using bolts, cables, and shotcrete combined with steel mesh and steel belts. Such a support system could improve material parameters and form a combined arch structure in surrounding rocks, with arch crown and arch springing thicknesses that are larger in the roof and high side wall.

Graphical Abstract

1. Introduction

Gateway failure range plays a guiding role in determining the support parameters of surrounding rock, and efforts along these lines have been discussed by many researchers [1,2,3,4,5]. Terms such as different failure ranges, excavation damaged zone (EDZ), disturbed rock zone (DRZ), broken rock zone (BRZ), excavation disturbed zone (EdZ), and excavation influenced zone (EIZ) have been defined by many causes, and it has been noted that after excavating the gateway, the stress balance state of surrounding coal and rock mass would be broken, convert to a biaxial or uniaxial stress states from a triaxial stress state, and form concentrated stress around the gateway. Coal and rock mass have different failure ranges after influenced by redistributed stresses. This indicates that the main distinction of different failure ranges is the difference in physical, mechanical, and hydraulic properties of the coal and rock mass [6,7]. Moreover, the properties related to strength and stiffness are especially different. Therefore, intact zone, excavation plastic zone (EPZ) and excavation broken zone (EBZ) are employed for the present study, as shown in Figure 1 [4,5].
The intact zone is the intact surrounding rock with an in situ stress state in which the properties of the rock masses have not been altered from the original state. The EPZ is defined as a zone without major changes in flow, transport properties that develop with micro-fracturing, and an integrated structure with a certain carrying capacity for deep coal and rock mass [6,7]. Thus, the EPZ is not the key zone to control in order to obtain stability of coal and rock mass that surrounds gateways. The EBZ is defined as a zone with major changes in flow and transport properties that develop with macro-fracturing; its size plays a significant role in the stability around man-made openings, and it has sparked deep discussion and research. Dong et al. [1] proposed the concept of EBZ and advanced the idea that the key factors to be considered for roadway support are the extent of EBZ and the bulking force caused by EBZ. Then, the assessment of EBZ was mainly used to design a support system that could maintain the stability of manmade openings. Therefore, the support design should be adjusted to utilize the self-bearing capacity of the surrounding rock masses. Wang et al. [4] investigated 14 typical roadway EBZs under both dynamic and static pressure and designed a supporting system. It was indicated that when the width of the EBZ was larger than the bolt length, the employment of bolts alone would be insufficient to maintain the roadway stability; in that case, reinforcement cables must be added to the support system. Tsang and Bernier [6] presented a number of studies that synthesized various ideas to identify the formation processes, parameters, and long-term safety state of EBZs in four types of geomaterials: crystalline rock, rock salt, and indurated and plastic claystones. Therefore, the assessment and characterization of EBZs in underground coal mines are major issues for roadway support system design as well as long-term mine safety and productivity.
Obtaining the EBZ width is a key stage to designing the support system, and many methods have been provided. Schuster et al. [8] and Malmgren et al. [9] utilized seismic waves to investigate EBZ in boreholes drilled in rock. Li et al. [10], Wang et al. [4], and Tan et al. [11] presented a borehole image method with a digital panoramic borehole camera installed in the surrounding rock masses to study the evolution of EBZ and roof deformation. Moreover, Wang et al. [4] combined the Nonmetallic Ultrasonic Detection techniques to evaluate the extent of EBZ in surrounding rock masses. The results of these studies showed that Borehole Camera Detection was an intuitive and an effective method.
On the other hand, to effectively evaluate the EBZ, some numerical models have been proposed. Hommand-Etienne et al. [12] and Golshani et al. [13] built the numerical model to analyze the plastic zone around man-made openings. They both concluded that the development of the EBZ was a function of time and that the shotcrete support was necessary to guarantee the stability of roadways and prevent further expansion and development of the damaged zone. Li [14] used a two-part liner elastic Hooke's numerical model in the TOUGH-FLAC3D code to study the mechanical response of the plastic zone. Pellet et al. [15] presented a 3D numerical simulation of the mechanical behavior of deep underground galleries with a special emphasis on the time-dependent development of the Excavation Damage Zone. Gao et al. [16] proposed a UDEC Trigon approach, and Kang et al. [17] adopted the method of intrinsic capability to simulate the initiation, propagation, and coalescence of fractures, as well as the interaction between them and any pre-existing discontinuities. In the UDEC Trigon approach, the EBZ can be observed clearly, and the supporting effect can be obtained obviously with a support system of bolts, cables and shotcrete combined with steel mesh and steel belts.
Although the above-mentioned approaches are imperative to evaluate the EBZ, they cannot be effectively used to predict all geological and geometrical conditions of man-made openings. For seismic waves, borehole images, and Nonmetallic Ultrasonic Detection techniques, boreholes would consume more time, money, and manpower. Particularly for the numerical model method, the results usually indicate that the width to the excavation boundary for the EPZ is larger than that of EBZ, as shown in Figure 1. Even for the UDEC Trigon approach, the results are significantly influenced by geological conditions and physio-mechanical parameters. Thus, the numerical results are sometimes to be referenced only for support.
To overcome these limitations, Ground Penetrating Radar (GPR) techniques are thusly proposed. GPR is a non-destructive method that provides a relatively quick geophysical measurement and is widely used for testing various engineering structures by providing continuous images of the interior of the media being analyzed [18,19]. GPR can provide information on the medium and details of a structure [20,21], such as pavement analysis [22], bridge and railway monitoring [23], the location of reinforcing bars and metal elements in concrete bases [24], the damage in reinforced concrete [18], and layer thickness [25]. GPR can also be adopted in coal mines. Church et al. [26] used GPR for strata control. Zhang et al. [27] utilized GPR to detect coal seam geological factors, such as fault structure, fracture zone, and collapse column. Strange et al. [28] described the application of GPR system for measuring coal thickness, coal depth, and near-surface interface in coal mining operations. Koarolu et al. [29] applied this method to obtain geological properties of coal seams near the surface.
During the process of using GPR, it was found that internal interference of hardware system influenced the result, such as jitter, bad antenna shielding effect, or more easily disturbed by coupling signal. Sometimes, it had weak reflection signals for some structures, and the technology for detecting weak signals needs improving. In addition, GPR was given priority for qualitative explanation at present, but quantitative standards remained to be further studied. However, GPR as an advanced non-destructive detection technology has the advantages of high precision, efficiency, and resolution, it is convenient to use and carry, and it provides fast results that are quite reliable. Therefore, GPR can be used to obtain crack distribution characteristics and broken widths in a test location, and its advantages are superior to other methods [30,31].
Therefore, to further develop our understanding of the failure characteristics of gateways surrounding rock, and to provide a referenced supporting method, the following works were conducted in the present study. First, investigation of test fields, which included examination of geological conditions, size and shape parameters of gateways, and physical and mechanical parameters of surrounding rock for 55 typical gateways. Second, test of the gateways’ broken width by GPR, and analysis of a cross-section diagram of the excavation broken zone combined with the broken width and plastic zone width obtained by three-dimensional distinct element code (3DEC). Finally, providing a referenced support method for gateways.

2. Investigation of Test Field

The investigation fields are distributed over a large area, and the test coal mines are located in five mining areas (denoted areas 1, 2, 3, 4 and 5), in Sichuan Province, China, as shown in the satellite image in Figure 2a,b; in total there are 55 typical gateways at 19 coal mines. The investigated factors includes the geological conditions, physical and mechanical parameters of surrounding rock, and gateway cross-section shape and size. Some of these features have a significant influence on the broken width, and some are for the numerical analysis.

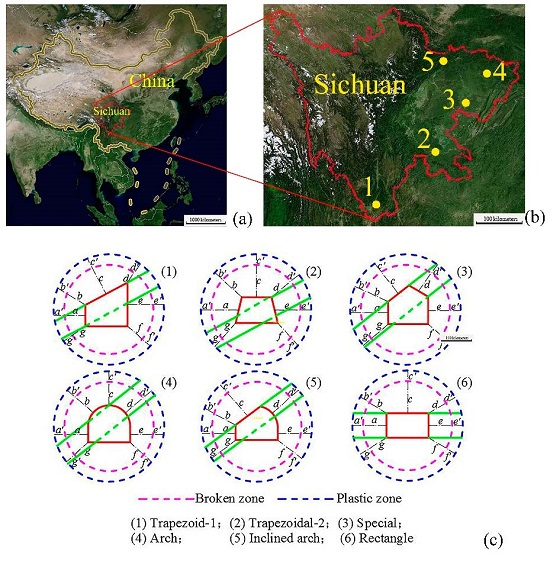
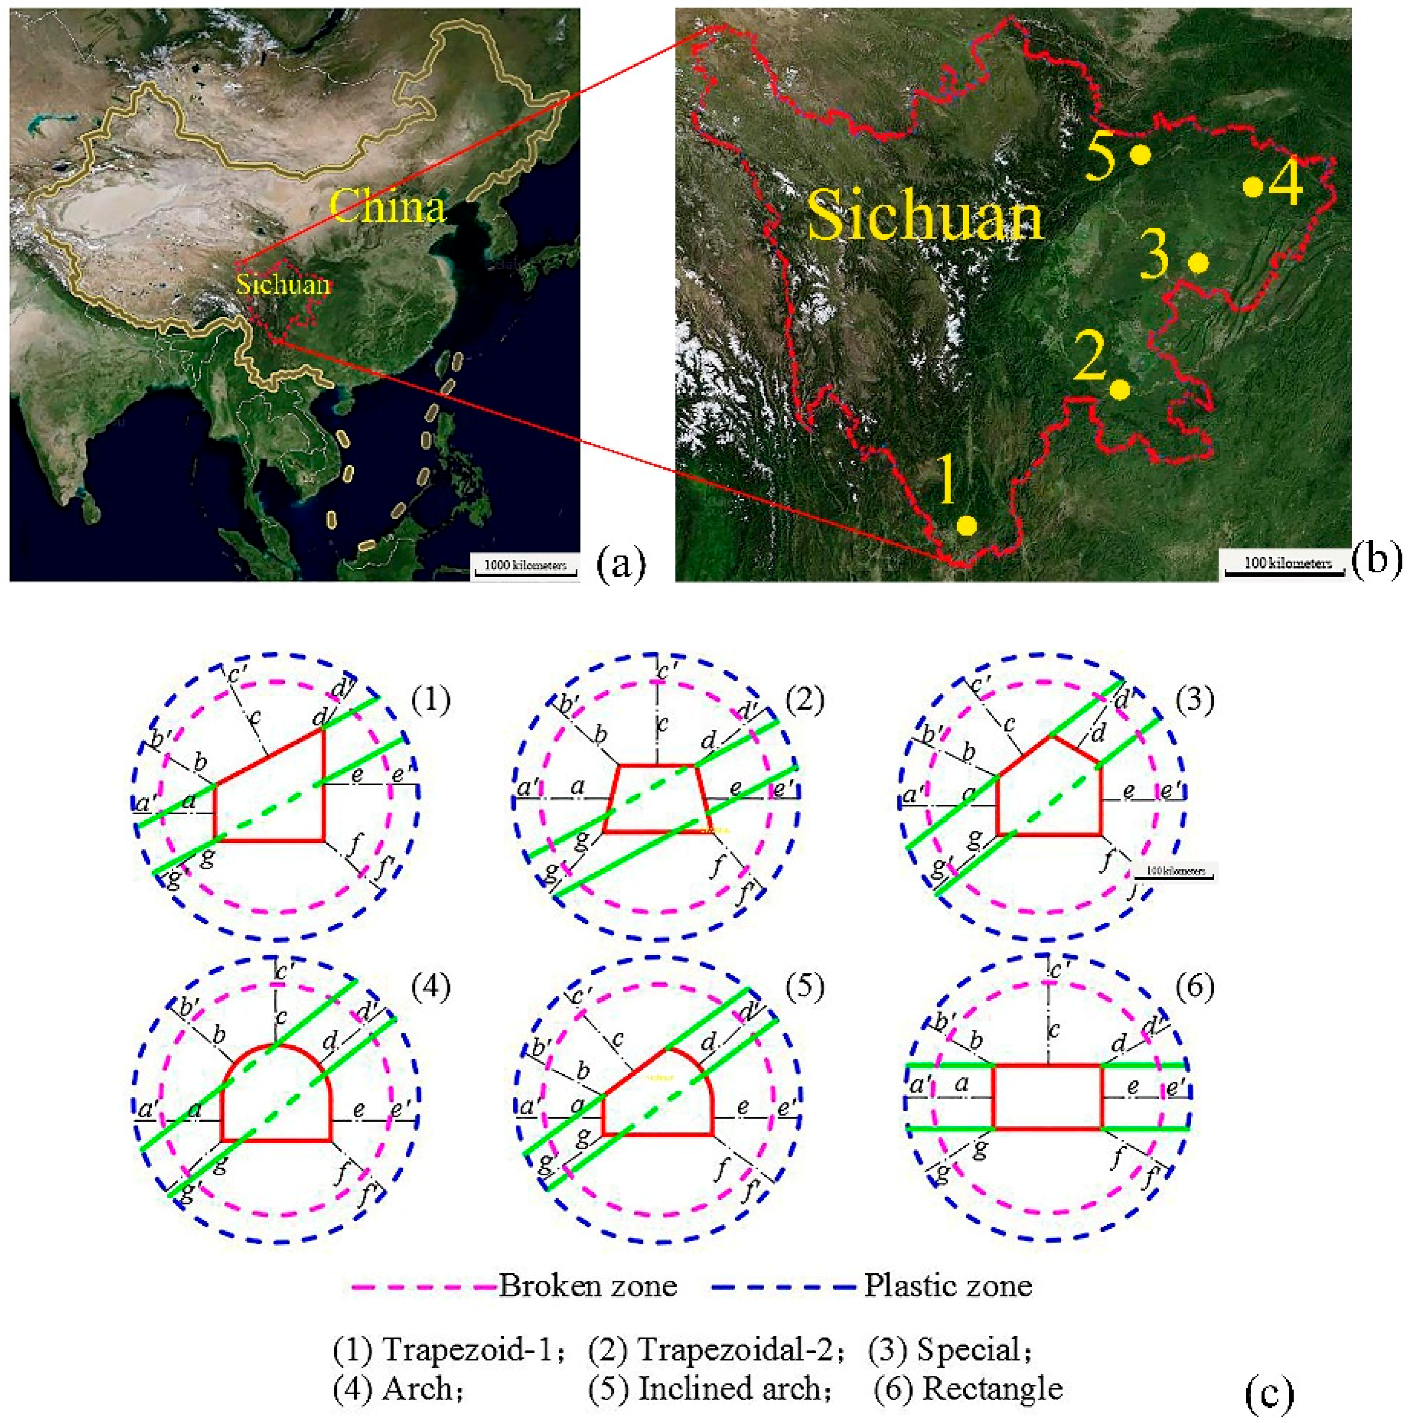
2.1. Geological Conditions of Gateways

The geological conditions around the extracted gateway mainly include the lithology and thickness of surrounding rock, buried depth, dip angle, and thickness of the coal seam. Results indicated that it has complex geological conditions affected by severe geological movements. The key factors for influencing the broken width had large variable ranges, as shown in Table 1.
On the other hand, we found that the coal-bearing strata of the tested gateways are Triassic and Permian, including the Xujiahe Formation (T3xj), the Daqiaodi Formation (T3d), the Longtan Formation (P2l), and Xuanwei Formation (P2x), as shown in Table 2. Most of the strata were formed under sedimentary and tectonic movement with a low cementation degree and poor mechanical properties of each rock material and bedding plane. In addition, the majority of the immediate roofs of the gateways were soft mudstone and argillaceous siltstone, with some of the siltstone—having poor vibration resistance—easily loosened or broken.
To conduct the numerical analysis by 3-Dimensional Distinct Element Code (3DEC) [32], the thickness of the roof, floor, and coal seam, as well as physical and mechanical parameters (e.g., bulk modulus, shear modulus, density, internal friction angle, cohesion, and tensile strength) of related coal and rock mass were collected from each mine. The main material parameters of lithology are listed in Table 3. In addition, the mechanical and physical properties of the contacts between every two layers are described in [33].

2.2. Cross-Section and Size

The investigation showed that most tested gateways used blasting excavation, few used comprehensive mechanized excavation, and a total of six kinds of cross-section shapes were collected from the 55 gateways—as shown in Figure 2c—including the width and two side wall heights of each gateway for numerical analysis.

3. Test of Gateways Broken Width

To obtain the result of broken width around gateways, the selection of test location, test principle, and equipment are imperative.

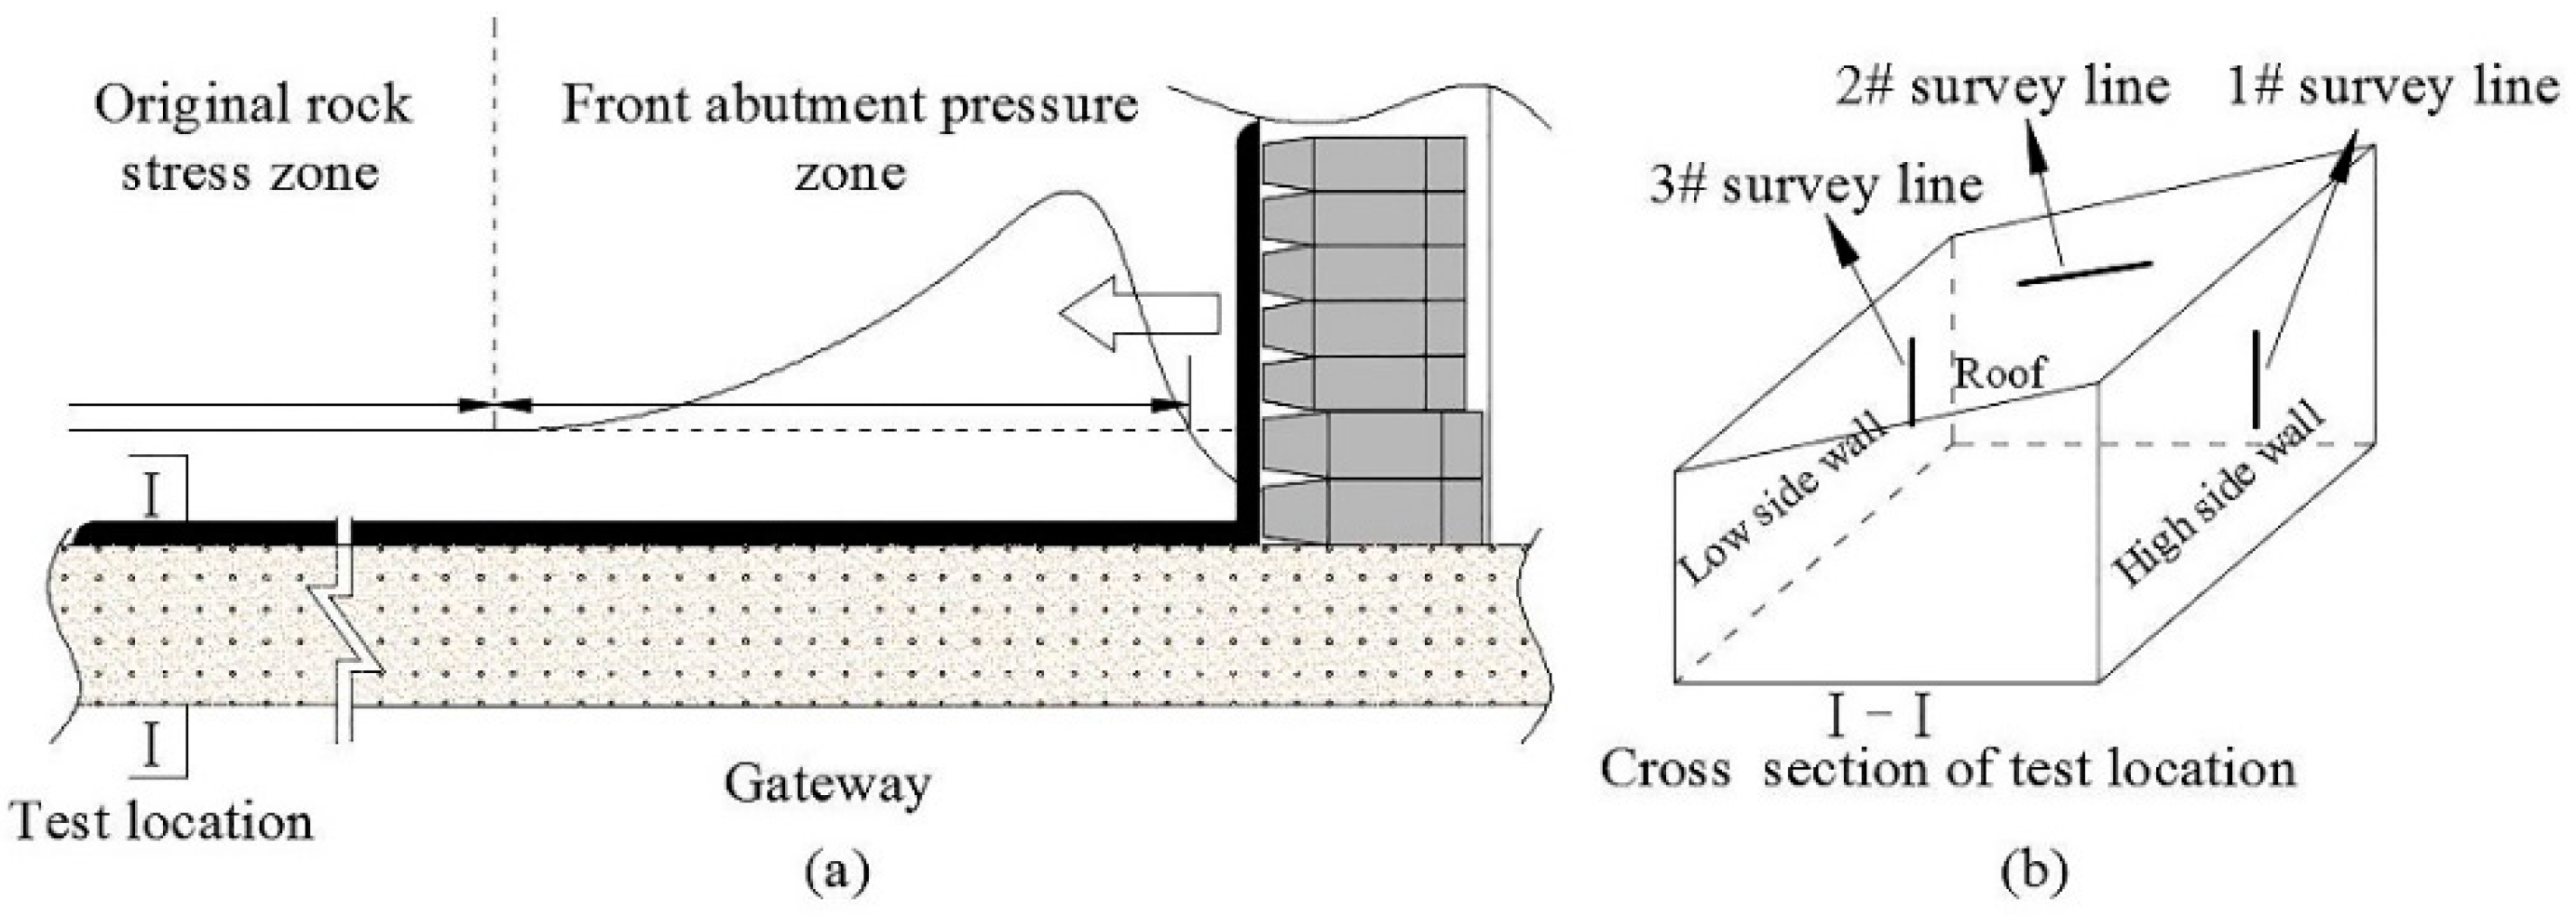
3.1. Test Location of Gateways

The test locations were in advanced roadways of head entry or tail entry beyond the front abutment pressure zone and in the original rock stress zones and under static pressure, where the roof and two side walls did not have large deformation and did not need to have reinforced support. The distances to the mining faces were usually greater than 30 m, as shown in Figure 3a. Each gateway cross-section was arranged with three survey lines on the high side wall, low side wall, and roof, and the maximum broken width in a survey line was selected as the utilization data (such as “b” on the roof) when the conditions of the roadways were variable, as shown in Figure 3b.

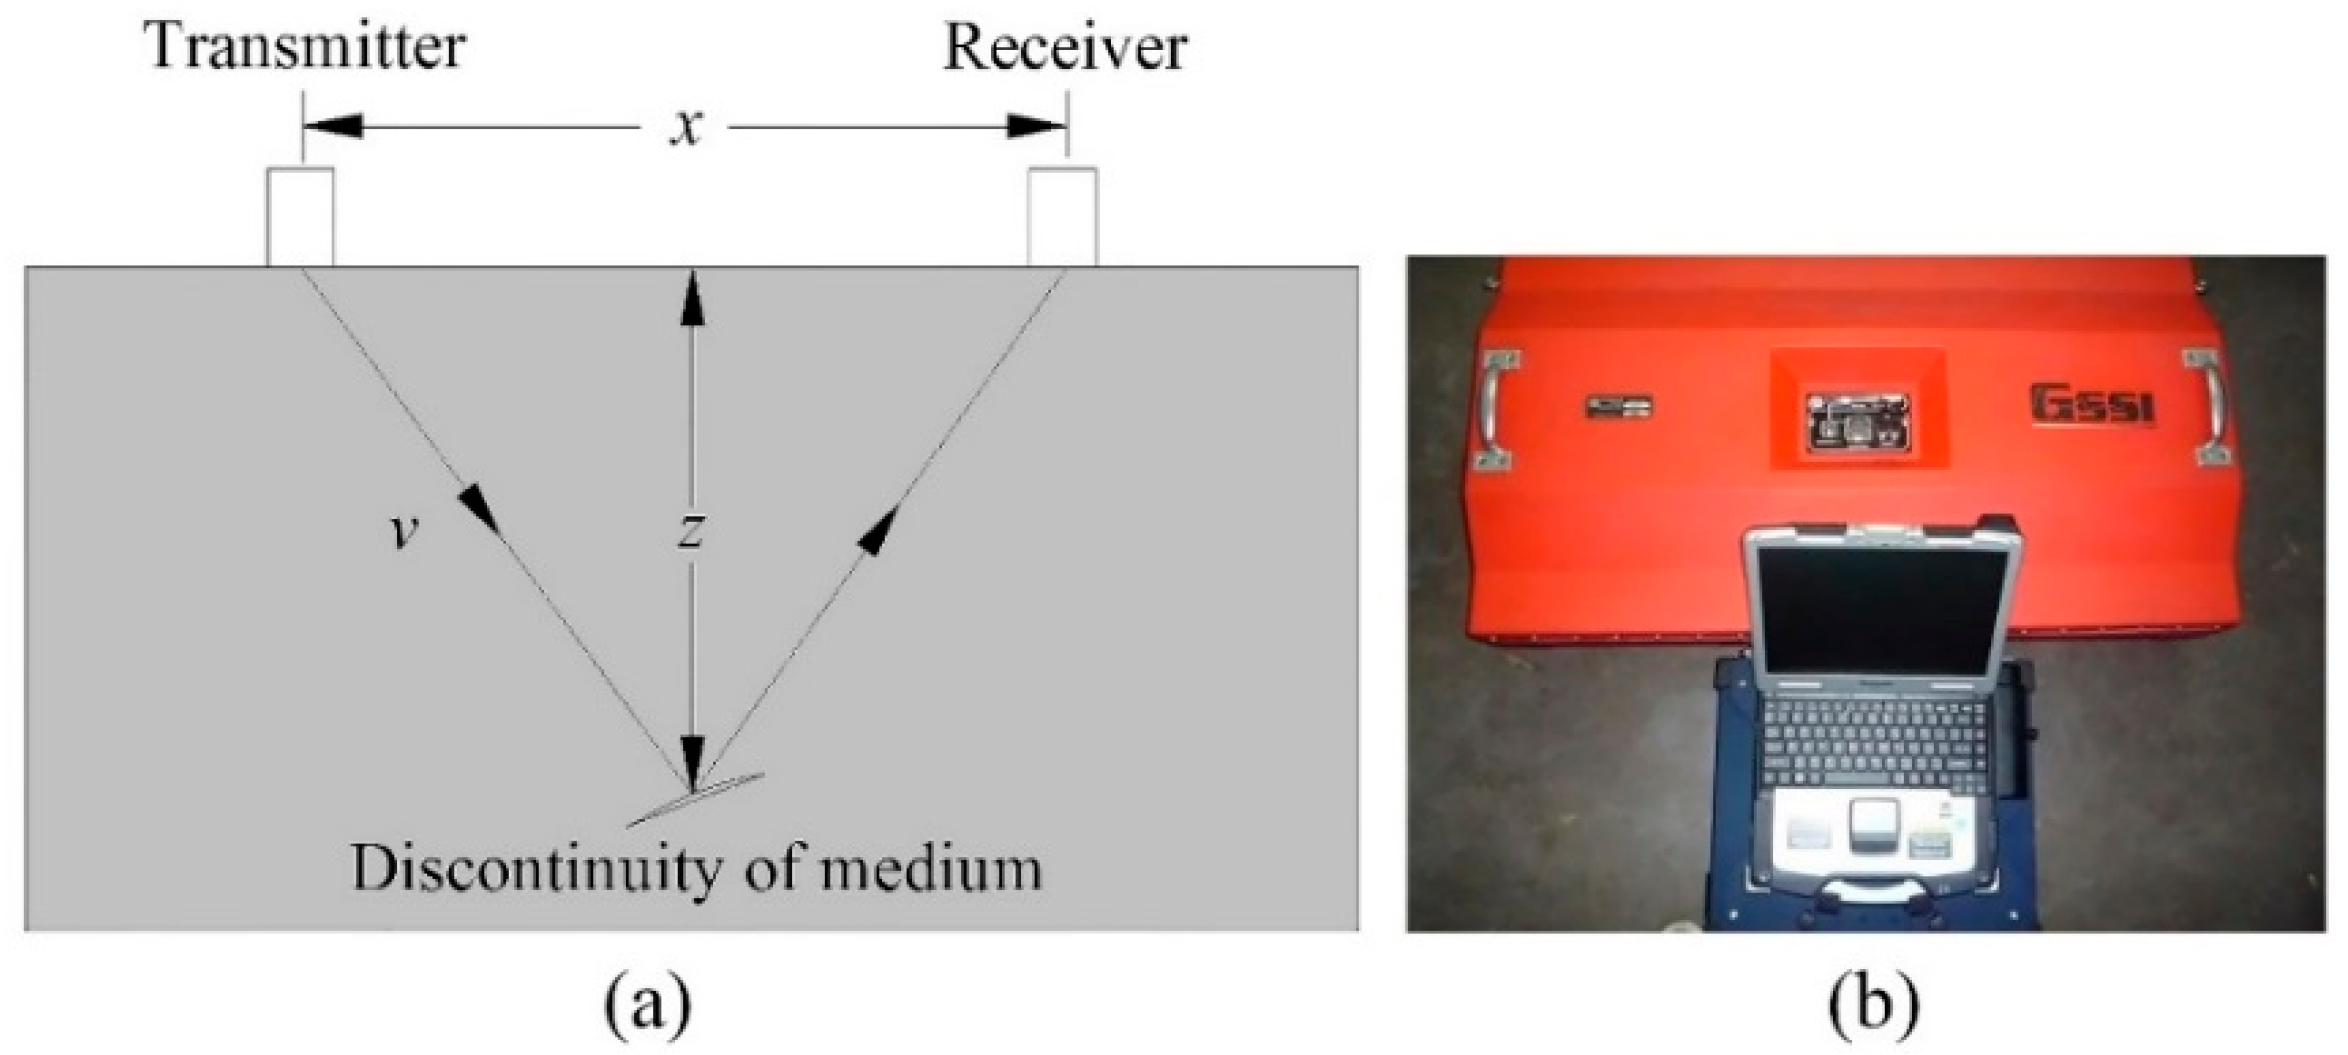
3.2. Test Principle of GPR

GPR technology has a similar principle to seismic wave and sonar technology, which launch high-frequency short-pulse electromagnetic waves into the rock medium; the spread of the signal depends on the high-frequency electrical characteristics of the medium. Generally, joint, crack, and fracture structures in a rock medium can change some of the electrical characteristics, and the changed electrical characteristics will cause electromagnetic wave signal reflection and generate radar reflected waves. Reflected waves will be received, magnified and digitized by the probe and stored in a computer. After editing the acquired data, we can obtain different types (e.g., waveform, grayscale, colour) of geology radar profiles. Thus, the measured results are obtained [31]. The working process and principle are shown in Figure 4a.
The depth of reflection interface can be obtained from Equation (1):
z = v 2 t 2 x 2 2
where z is the depth of the reflection interface, t is the propagation time from the probe to the reflection interface of the electromagnetic wave, x is the distance between the transmitter and the receiver, and v is the electromagnetic wave velocity in the medium.
Rock and coal mass is considered to be a low-loss medium; therefore, it is useful to approximate the wave velocity as Equation (2) [34]:
v = c ε
where c is the wave velocity in a vacuum of approximately 30 cm/ns, and ε is the relative permittivity of the medium.
The relative permittivity constants of some mediums are shown in Table 4. The medium of separation is usually air. It can be observed from the table that the relative permittivity of the rock and coal medium, and the separation structure such as a fracture or crack, are rather different. GPR electromagnetic waves reflect well from the structure surface. Thus, detection of a failure structure in the roof and two side walls of a gateway by GPR is practicable [35].
In reality, the distance between the transmitter and the receiver is very short, so x is approximately equal to 0. According to Equations (1) and (2), Equation (3) was computed to determine the depth of the reflection interface:
z = v t 2 = c t ε
In this paper, an SIR-20 Model multichannel perspective radar made by GSSI in the USA, as shown in Figure 4b, was adopted to investigate the broken widths of gateways. This radar is a type of highly efficient geophysical exploration instrument, especially for shallow detecting. A 100 MHz centre frequency antenna was employed during the radar data acquisition.

3.3. Results and Analyses of Gateways Broken Width

After four months of working with GPR, it yielded 55 typical gateways broken widths, including those in the high side wall, low side wall, and roof. In order to analyze the relationship between the broken width and the gateway geological conditions, the gateways were numbered from 1–55, as shown in Figure 5.
The following can be observed from the broken widths:
(1)
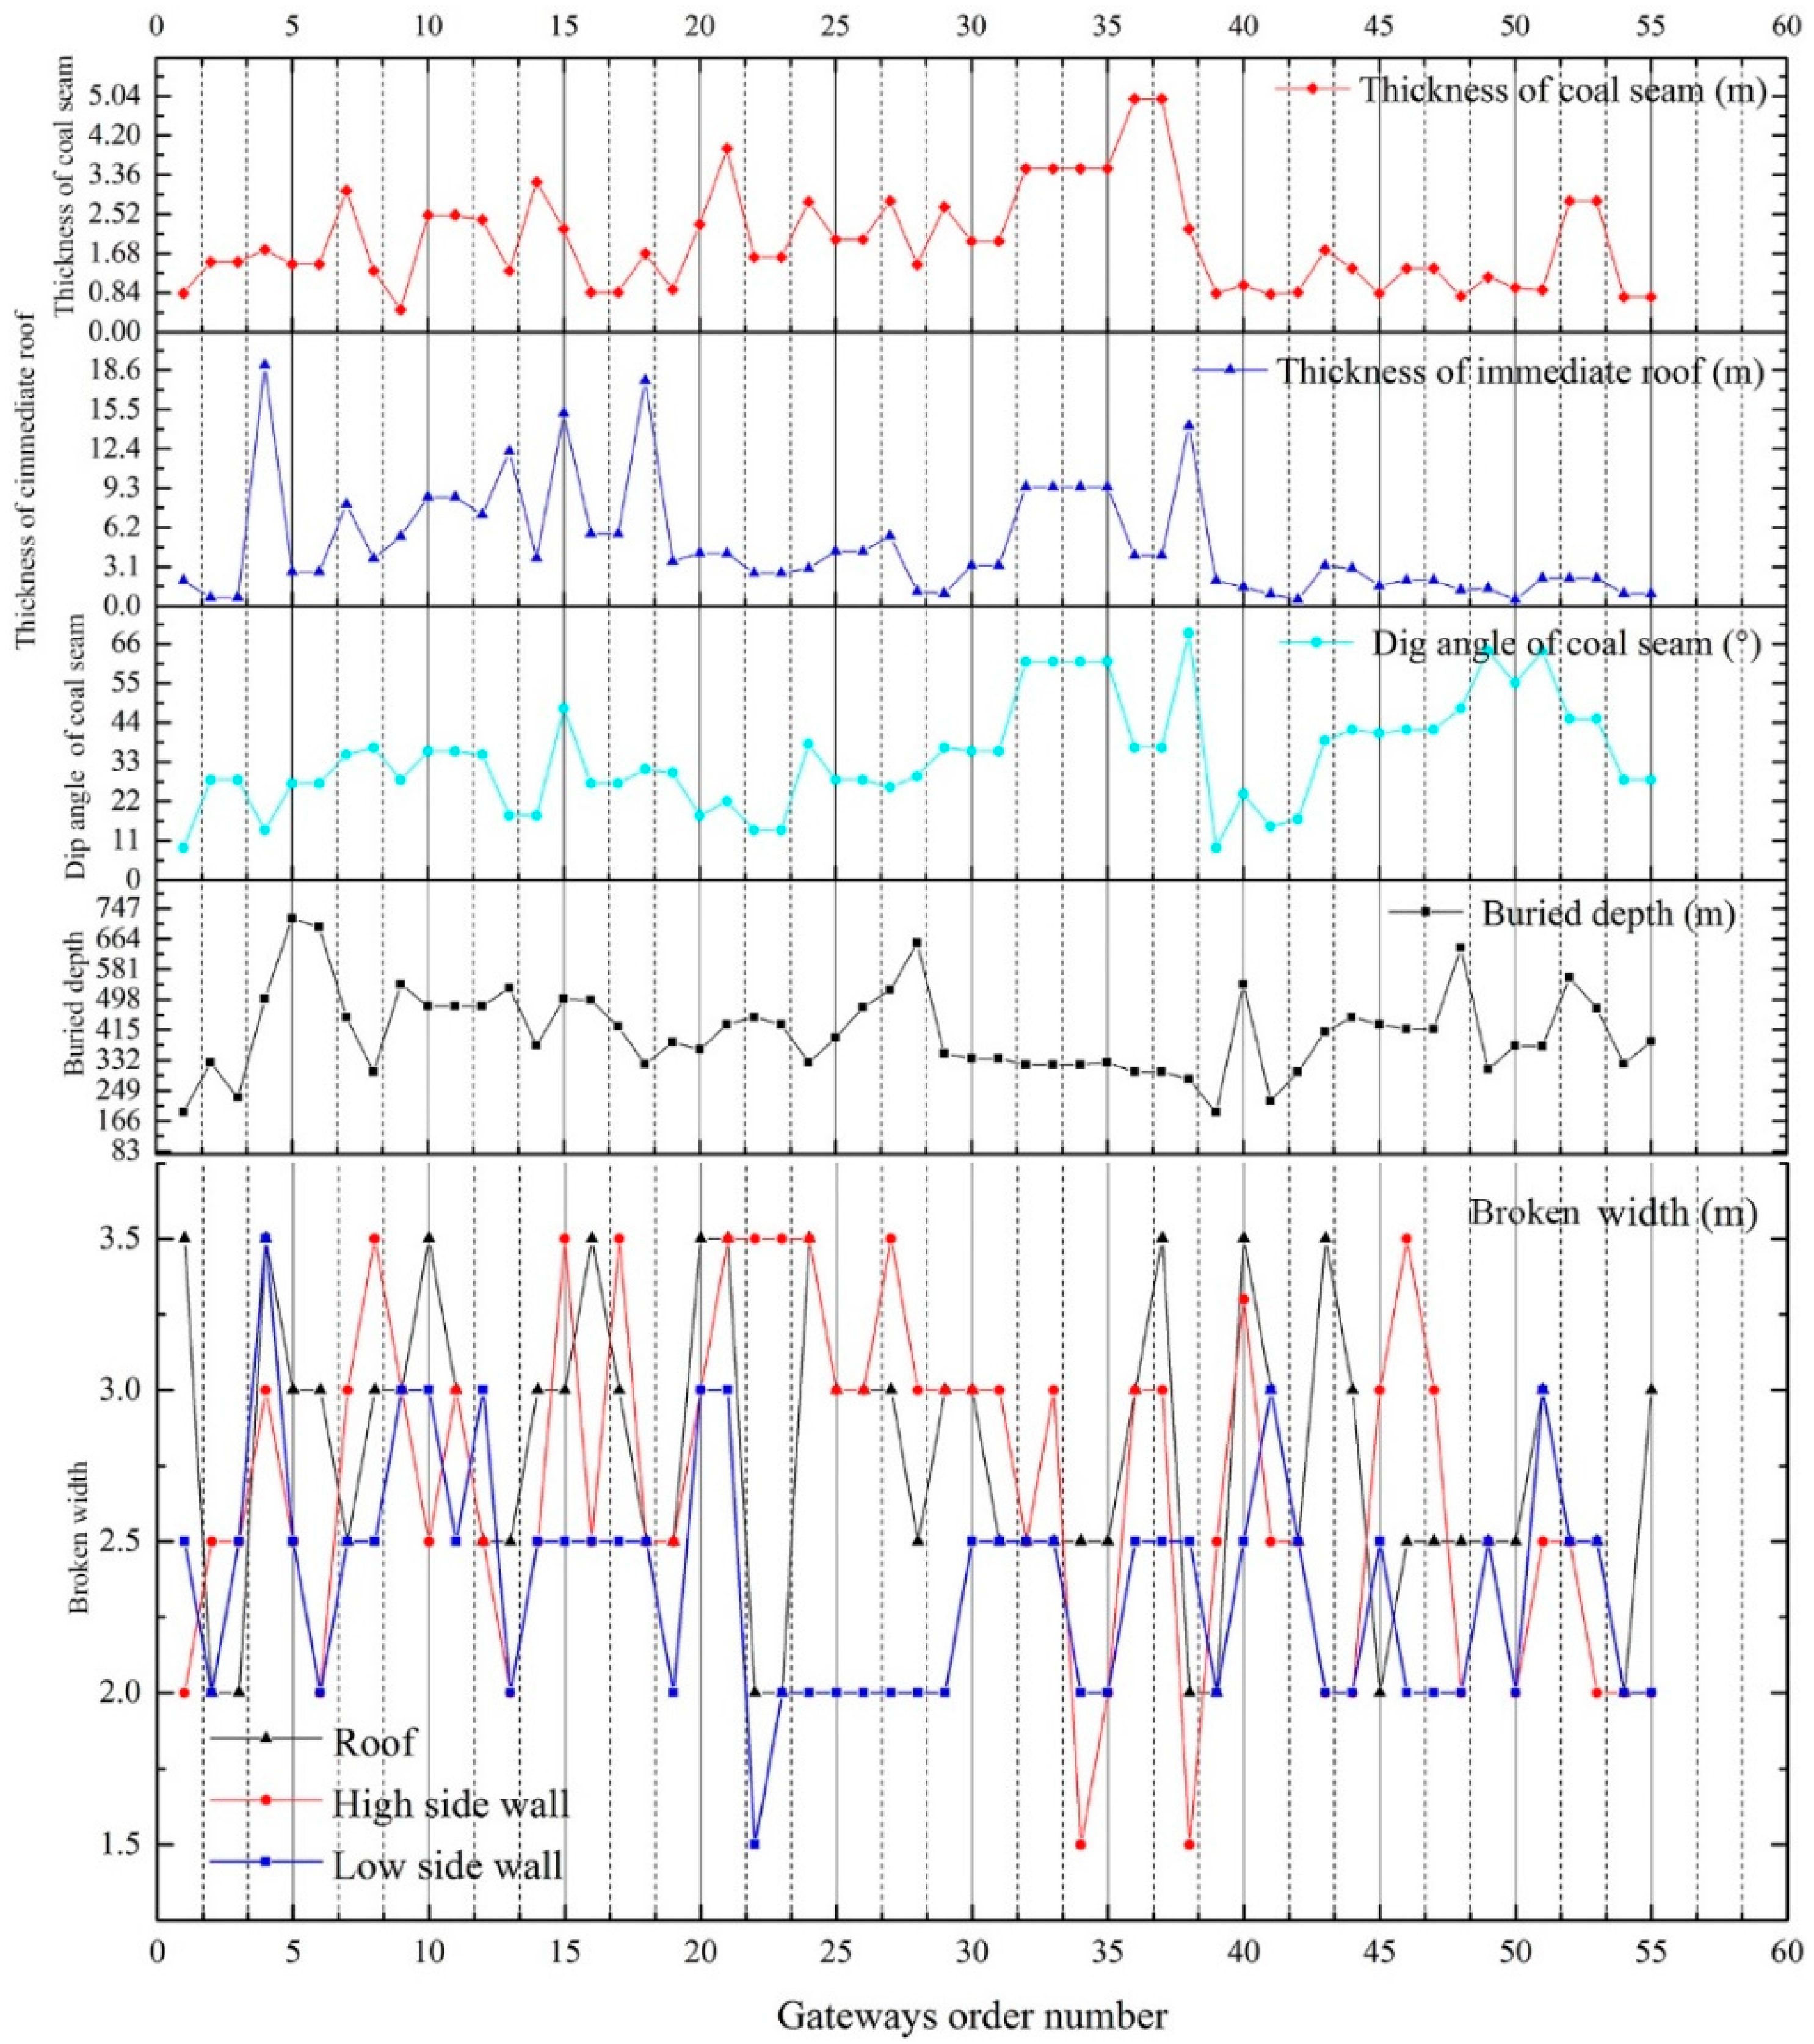
The broken widths of the tested gateways were large; the minimum value was 1.5 m, and the maximum value was 3.5 m; and
(2)
The broken width in the roof and high side wall were generally greater than that in the low side wall.
Also, combined with the broken width, buried depth of the gateways, dip angle, and thickness of immediate roof and coal seam, the following conclusions were obtained:
(1)
There was a certain relationship between the thickness of the coal seam and the thickness of the immediate roof for tested gateways with similar a change tendency, particularly between gateways No. 20–50.
(2)
For the relatively larger thicknesses of the coal seam and immediate roof, the broken width in the roof and the high side wall were larger; conversely, they were relatively small, which was more obvious among the gateways No. 35–55. The reason this phenomenon occurred was that the coal seam and roof rock mass had low strength and could easily become shear, causing tensile failure and increased failure range, and thus resulted in larger broken width.
(3)
For coal seams with a small dip angle, the broken widths in the roof were larger, as seen in gateways No. 15–25. For a large dip angle of the coal seam, the broken widths in the roof were smaller, which was evident in gateways No. 30–40 and 45–55. The primary reasons lay in the large dip angle, the roof having transitioned from coal mass to rock mass, as well as the increased compressive stress and reduced tensile stress in the roof rock mass which led to small failures. At the same time, the small failure roof would be carrying a large load, leading to concentrated stress that could not be transferred into the deep rock mass to damage them. Thus, the above phenomenon would result.
(4)
The smaller the buried depth, the smaller the broken width, which was obviously reflected among gateways No. 30–40. For gateway No. 40, the buried depth was relatively large, as was the broken width value. For a few gateways in front of and behind gateway No. 40, they had small buried depths and small broken widths. Explanation of this phenomenon is increased stress with increased buried depth, and increased concentration stress in the stress redistribution process. In addition, the tensile stress in the surrounding coal and rock mass would increase, and rock mass would fail more easily, eventually causing serious failure in the rock surrounding the gateway and increasing the broken width. Conversely, it decreased.
It can be observed from the above analyses that there were certain relationships between broken widths and the gateway geological conditions; but for some gateways, they were not quite clear. Through in-depth analysis, we found that the factors affecting the broken width changed simultaneously; they could not meet the single factor condition and thus were analyzed by single factor variation. For example, as the buried depth increased, the thickness of the coal seam decreased; meanwhile, the influence of the two factors on the change tendency of the broken width was not obvious, as remarkable seen in gateways No. 5–10. On the other hand, the blasting excavation and the geologic structure could also lead to this phenomenon.
In reality, gateway broken width was controlled by the combined action of various factors, including initial stress (buried depth and tectonic stress), rock mass strength, gateway cross-section and support, and so on. The data of broken width in Figure 5 fully illustrated the combined action. Furthermore, broken width as a multi-factor single index to evaluate the damage degree of surrounding rock, and Figure 5 sufficiently demonstrated the practicability and scientificity of the evaluate index.

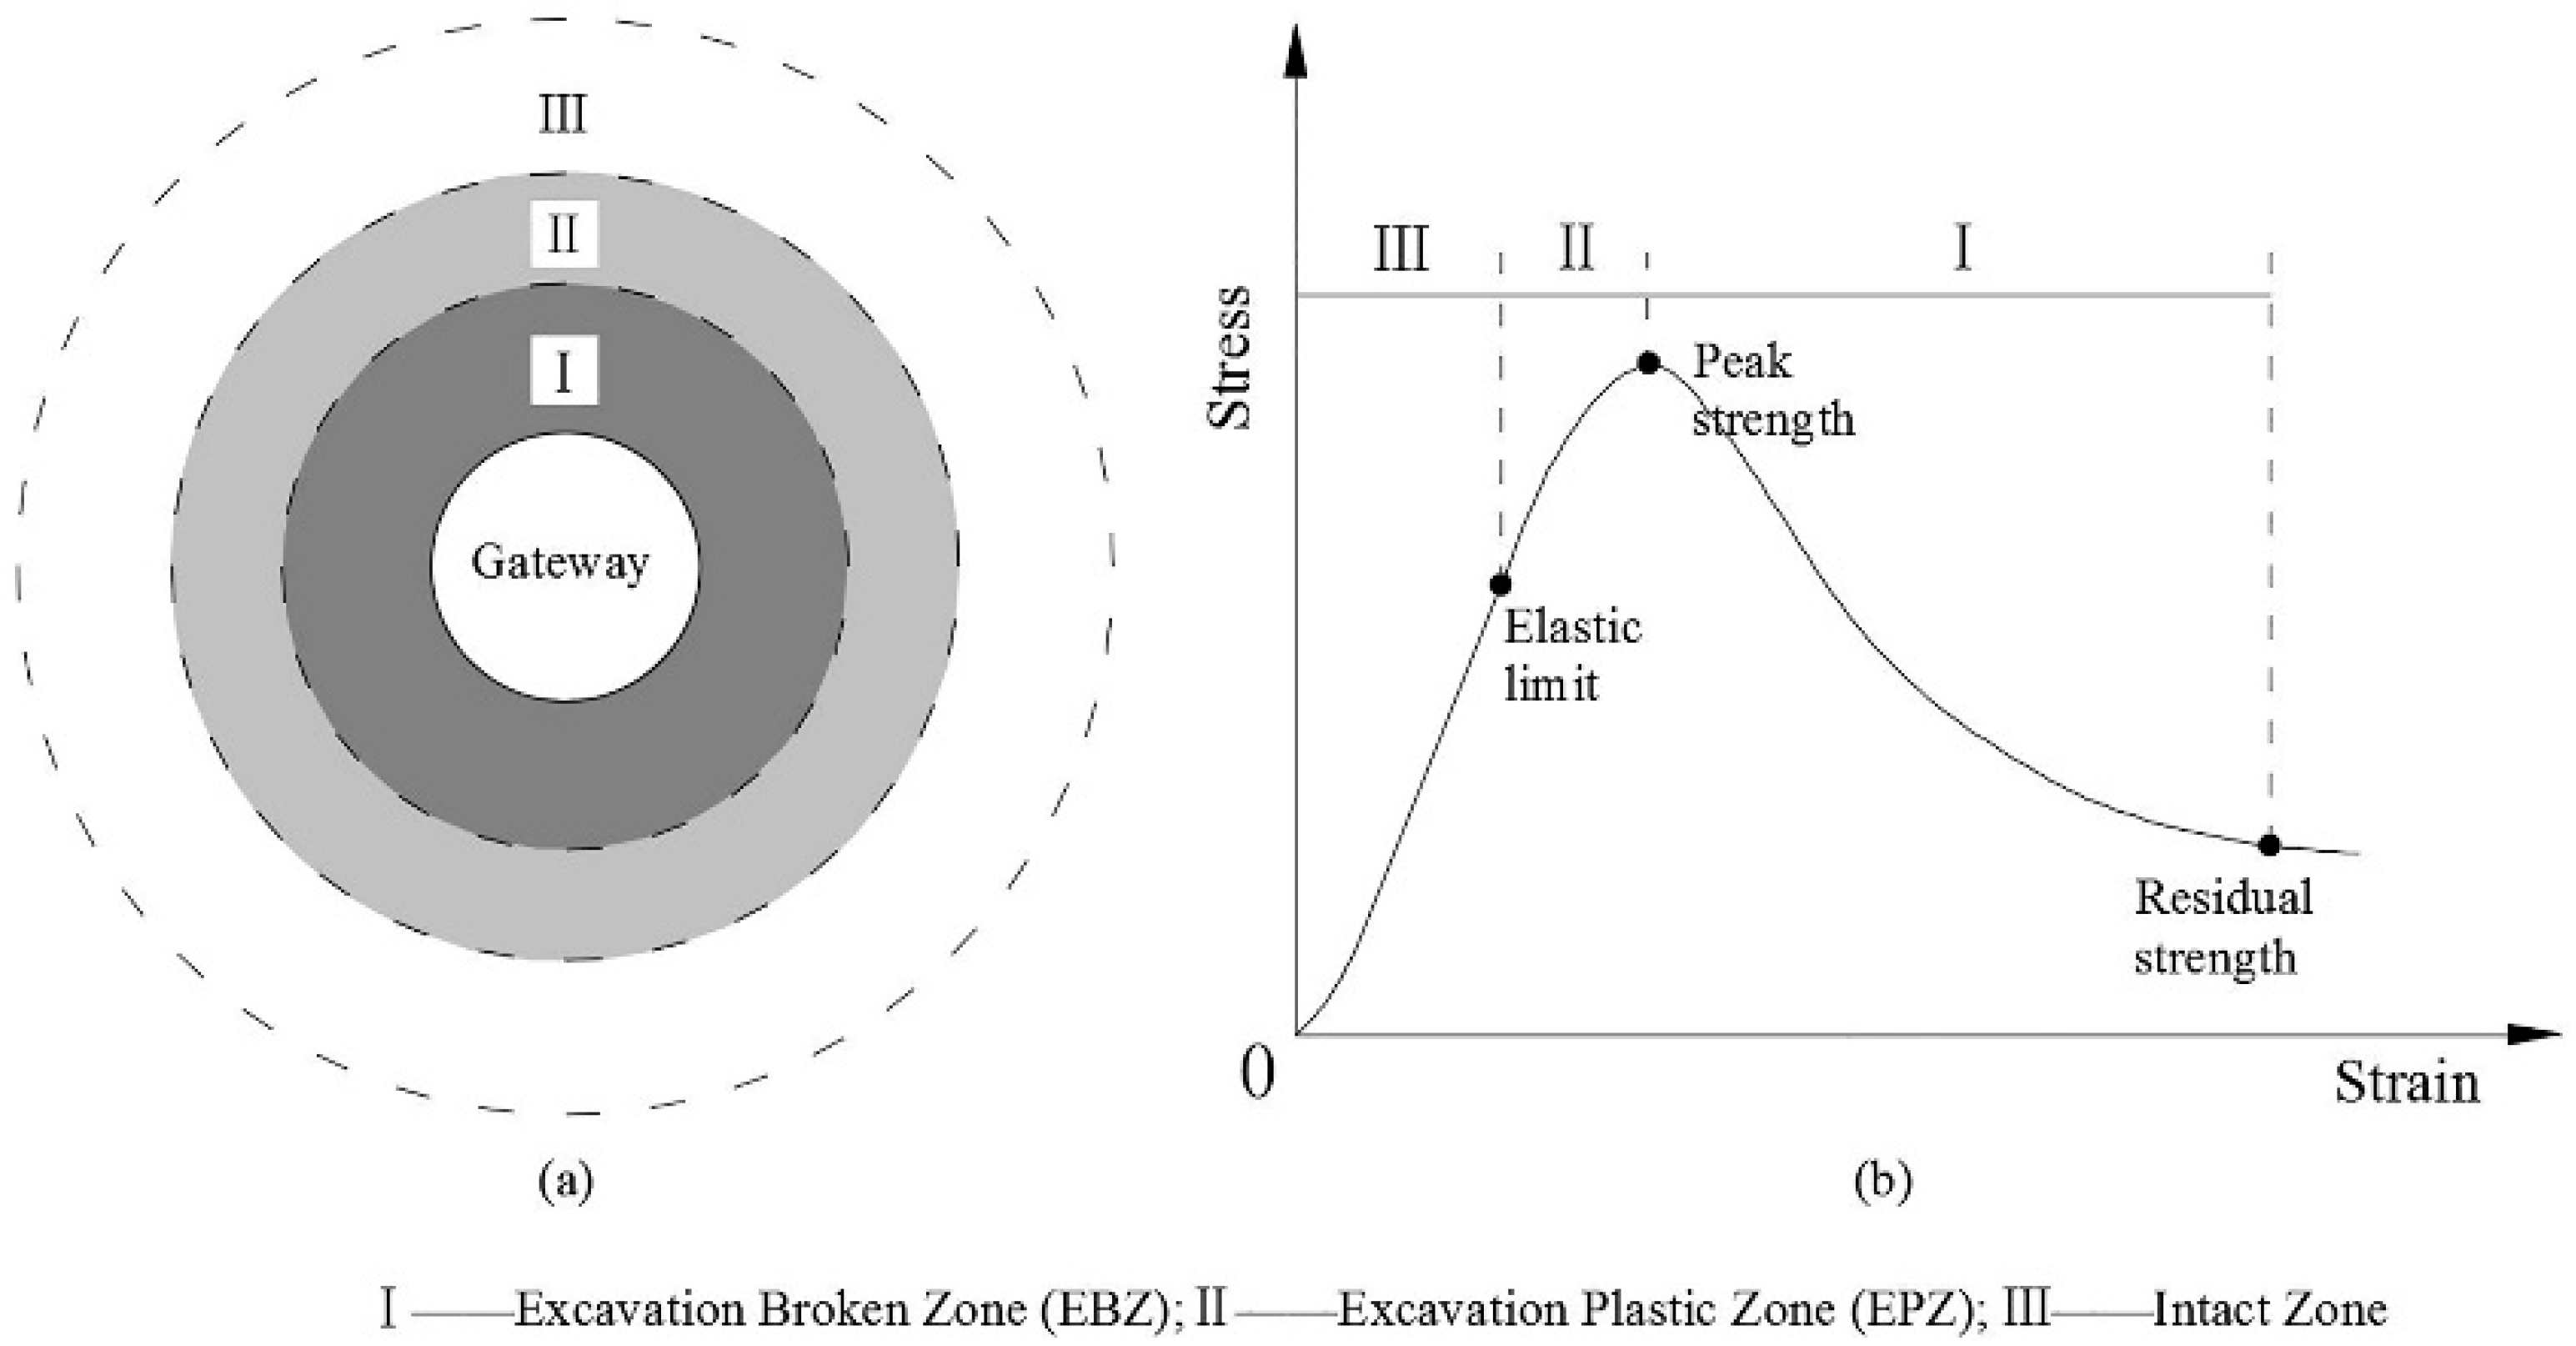
4. Cross-Section Diagram of Excavation Broken Zone (EBZ)

The excavation broken zone around gateways can present failure characteristics of the coal and rock mass and provide a strong pertinent support system for the roof and two walls according to the failure characteristics, rather than utilizing a conventional support system. However, the above field-tested broken widths showed that there were only three sets of data in a gateway cross-section, which cannot obtain the accurate EBZ. In addition, significant differences in cross-section shape, geological conditions and physical and mechanical properties of coal and rock mass between tested gateways would increase the errors of the EBZ. As a result, this paper acquired 7 directions of typical plastic width data by theoretical calculation in 3DEC and combined them with field-tested data to speculate the tested gateway broken width in 7 directions of the surrounding rock to obtain a high-precision EBZ.

4.1. Steps for Obtaining EBZ

The specific steps for obtaining EBZ were as follows.
(1) Build 55 plane strain models of 3DEC. Models with dimensions of 50 m × 1 m × 50 m in the x, y, and z directions, respectively, were built by 3DEC according to each gateway geological condition, one gateway model was shown in Figure 6a. The physical and mechanical parameters of each mode material were obtained from the investigation (seen Section 2.1) and obeyed the Mohr-Coulomb shear failure criterion and tensile failure criteria, and the following yield criterion (Equations (4) and (5)) was used. The contact obeyed the Coulomb Slip model [33].
(2) Determine the boundary conditions of models. The state of in situ stress was defined by σz = λH in the vertical direction and σx = σy = kλH in the horizontal direction, where λ = 0.027 MPa/m, H was the buried depth, and k was the coefficient of horizontal stress obtained from each mine. A vertical pressure of p = λH was applied on the top surface, the velocity of the bottom surface was restricted in all three directions (vx = vy = vz = 0 m/s), and of the other four surfaces were restricted in the normal direction (vn = 0 m/s) as shown in Figure 6a. First, it had an initial equilibrium calculation with elastic stress state, and after that gateway cross-section was excavated; then, it had another equilibrium calculation and the plastic zone appeared around gateway.
(3) Obtaining plastic zone widths in 7 directions. The gateway broken widths in 7 directions were a, b, c, d, e, f, and g, while a, c and e were the field test values among them. After calculating, the 7 directions plastic zone width of a′, b′, c′, d′, e′, f′, and g′ were extracted, as shown in Figure 2c. One gateway of plastic zone widths is shown in Figure 6b.
(4) Calculating EBZ widths. The fractures and cracks of coal and rock in the excavation broken zone were attributed to the discontinuous medium and the lack of a mature theory to calculate the broken widths. On the other hand, the plastic zone in the numerical model was computed based on a continuum theory with failure criteria, which did not consider the joints behavior inside coal and rock mass. Therefore, EBZ was fundamentally different from the plastic zone; in general, the broken width was less than the width of the plastic zone (a < a′, b < b′, c < c′, d < d′, e < e′, f < f′, g < g′), and could not simply replace the EBZ with the plastic zone. However, to date, no quantitative relationship between the EBZ and the plastic zone has been found; this problem still requires significant work. Therefore, this paper treated plastic zone width, such as a′–g′, as the intermediate variable and calculated the EBZ width in another 4 directions according to a certain proportion as shown in Equation (4).
{ b = ( ( b a × a ) + ( b c × c ) ) / 2 d = ( ( d c × c ) + ( d e × e ) ) / 2 f = f e × e g = g a × a

4.2. Cross-Section Diagram Resulting from EBZ
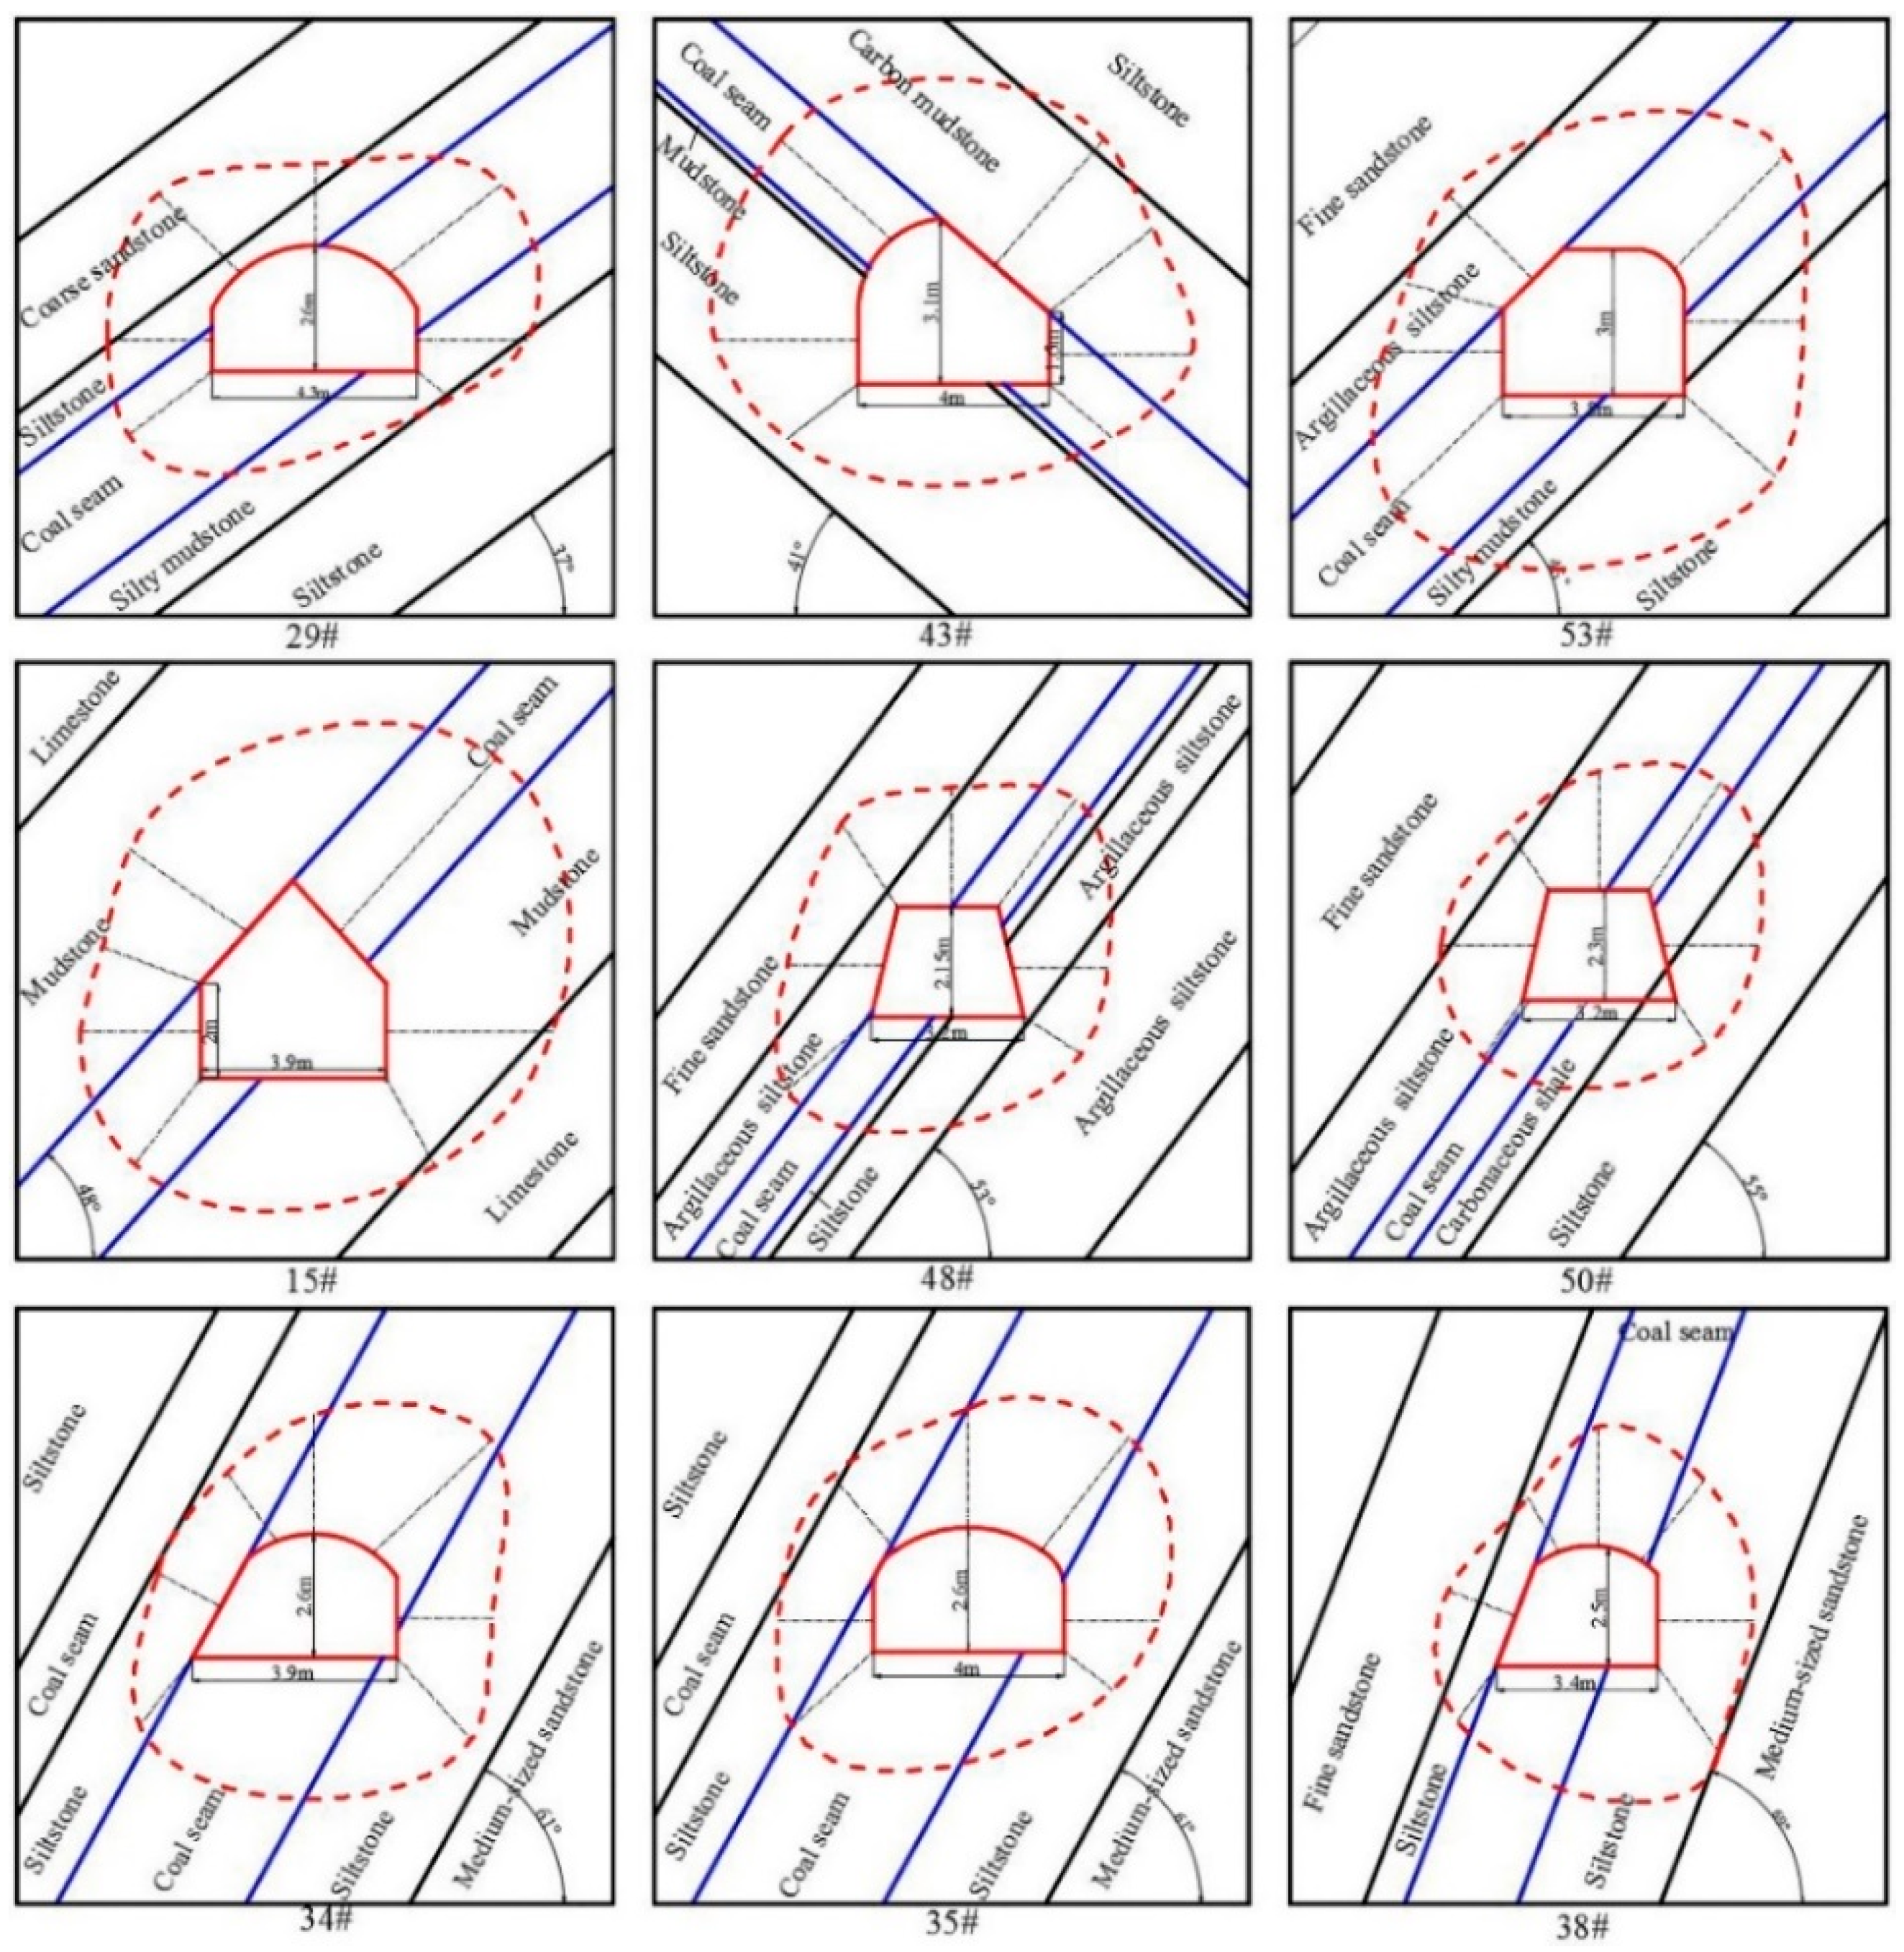
Each gateway EBZ cross-section diagram was mapped using a smooth curve after obtaining the other 4 directions of broken width values utilizing Equation (6). Because 55 cross-section diagrams were a large quantity, only 21 representative diagrams were listed, as indicated by the red elliptical shapes shown in Figure 7.
The 21 cross-section diagrams were arranged according to the coal seam dip angle size, representing 55 gateways’ EBZ distribution patterns. It could be observed that the diagrams contain a wealth of information, including the cross-section shape, section size, surrounding rock lithology, and coal seam dip angle. Moreover, the diagrams could reflect whether the EBZ was extended to the main roof and convey the size and shape of the EBZ resulting from the interaction of the above conditions. Furthermore, the following results can be found by deep analysis.
(1)
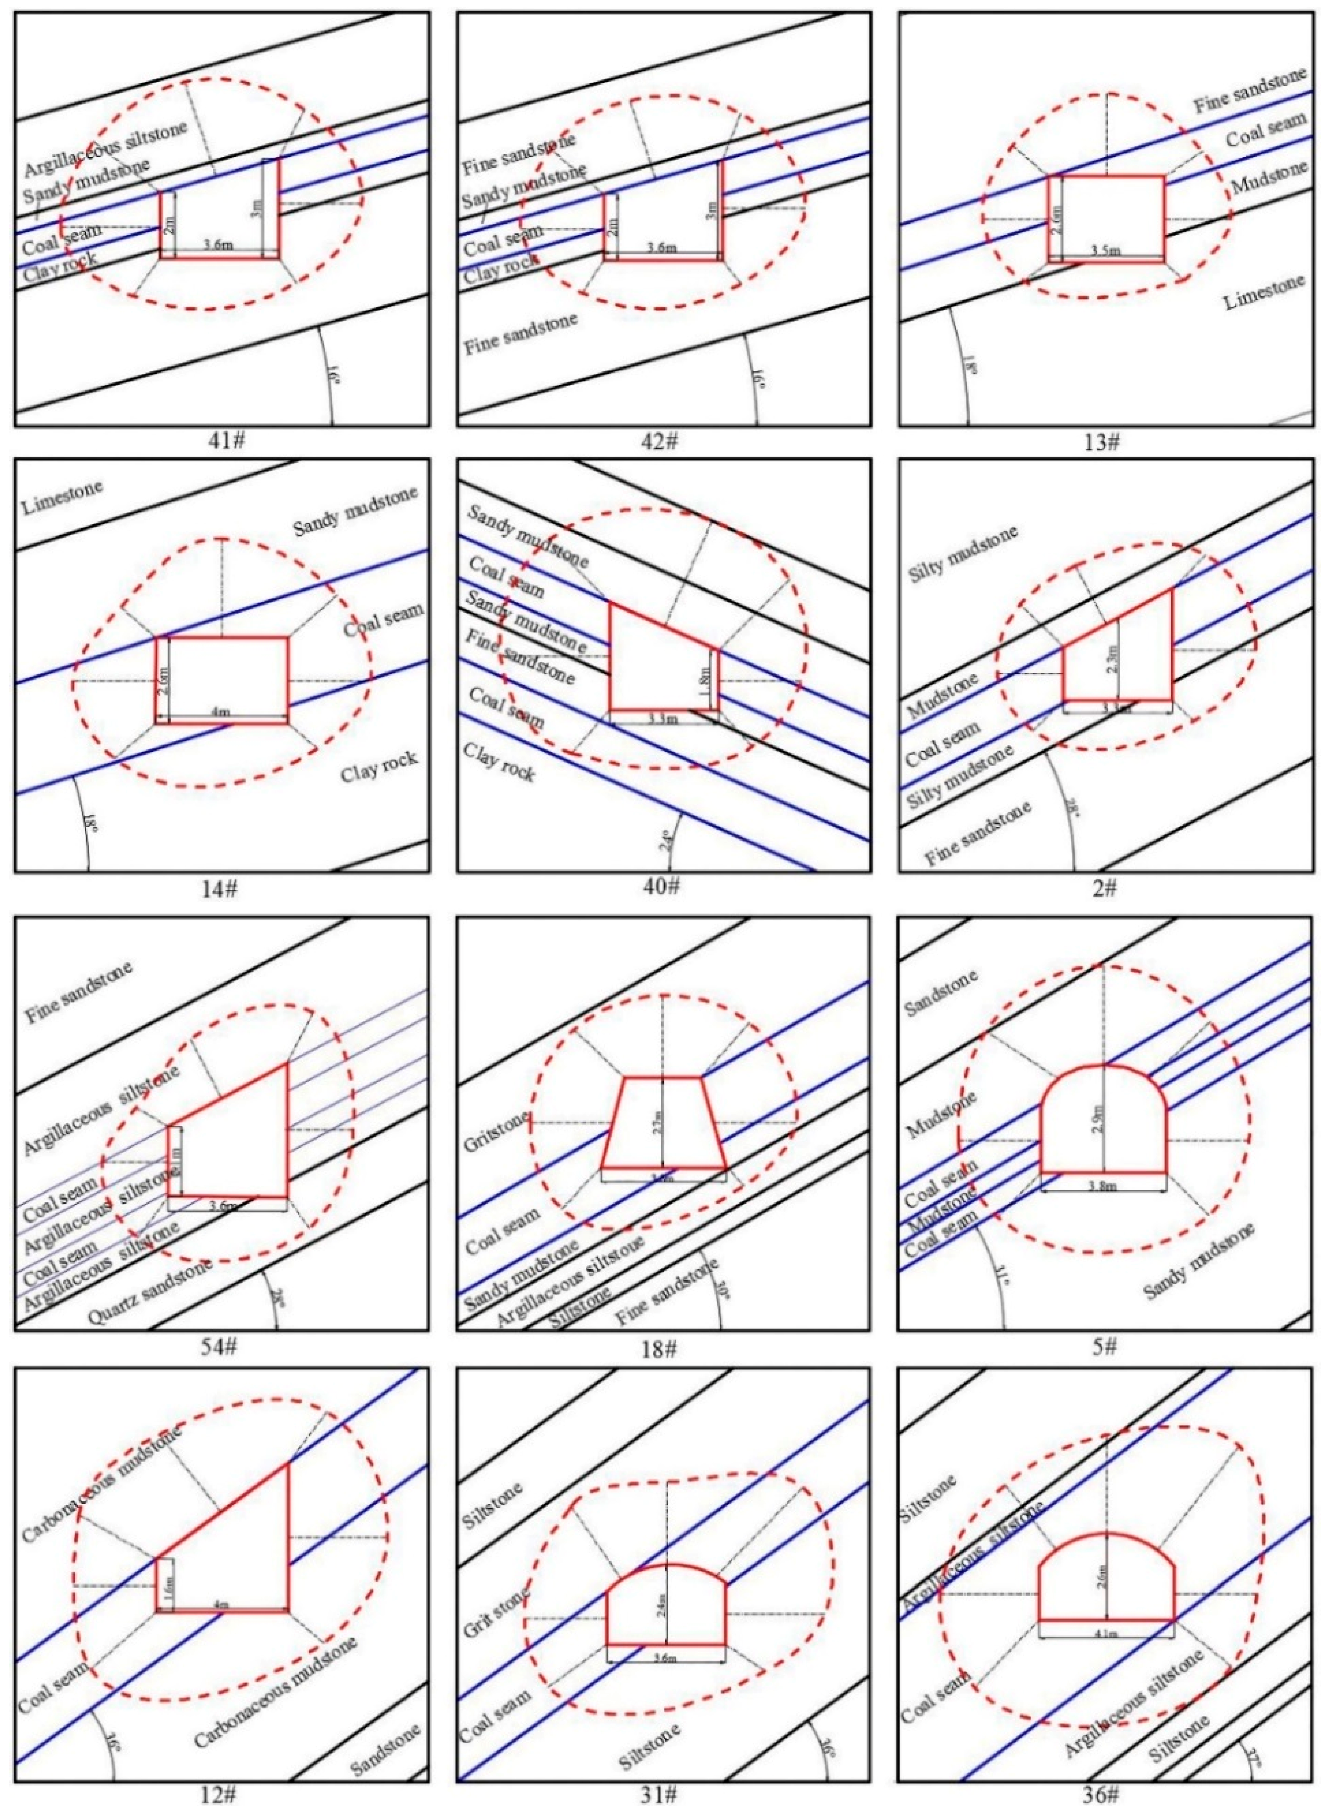
The shapes of the EBZs were elliptical or approximately elliptical, except in a few gateways such as No. 18 and No. 5, whose EBZ shapes were circular.
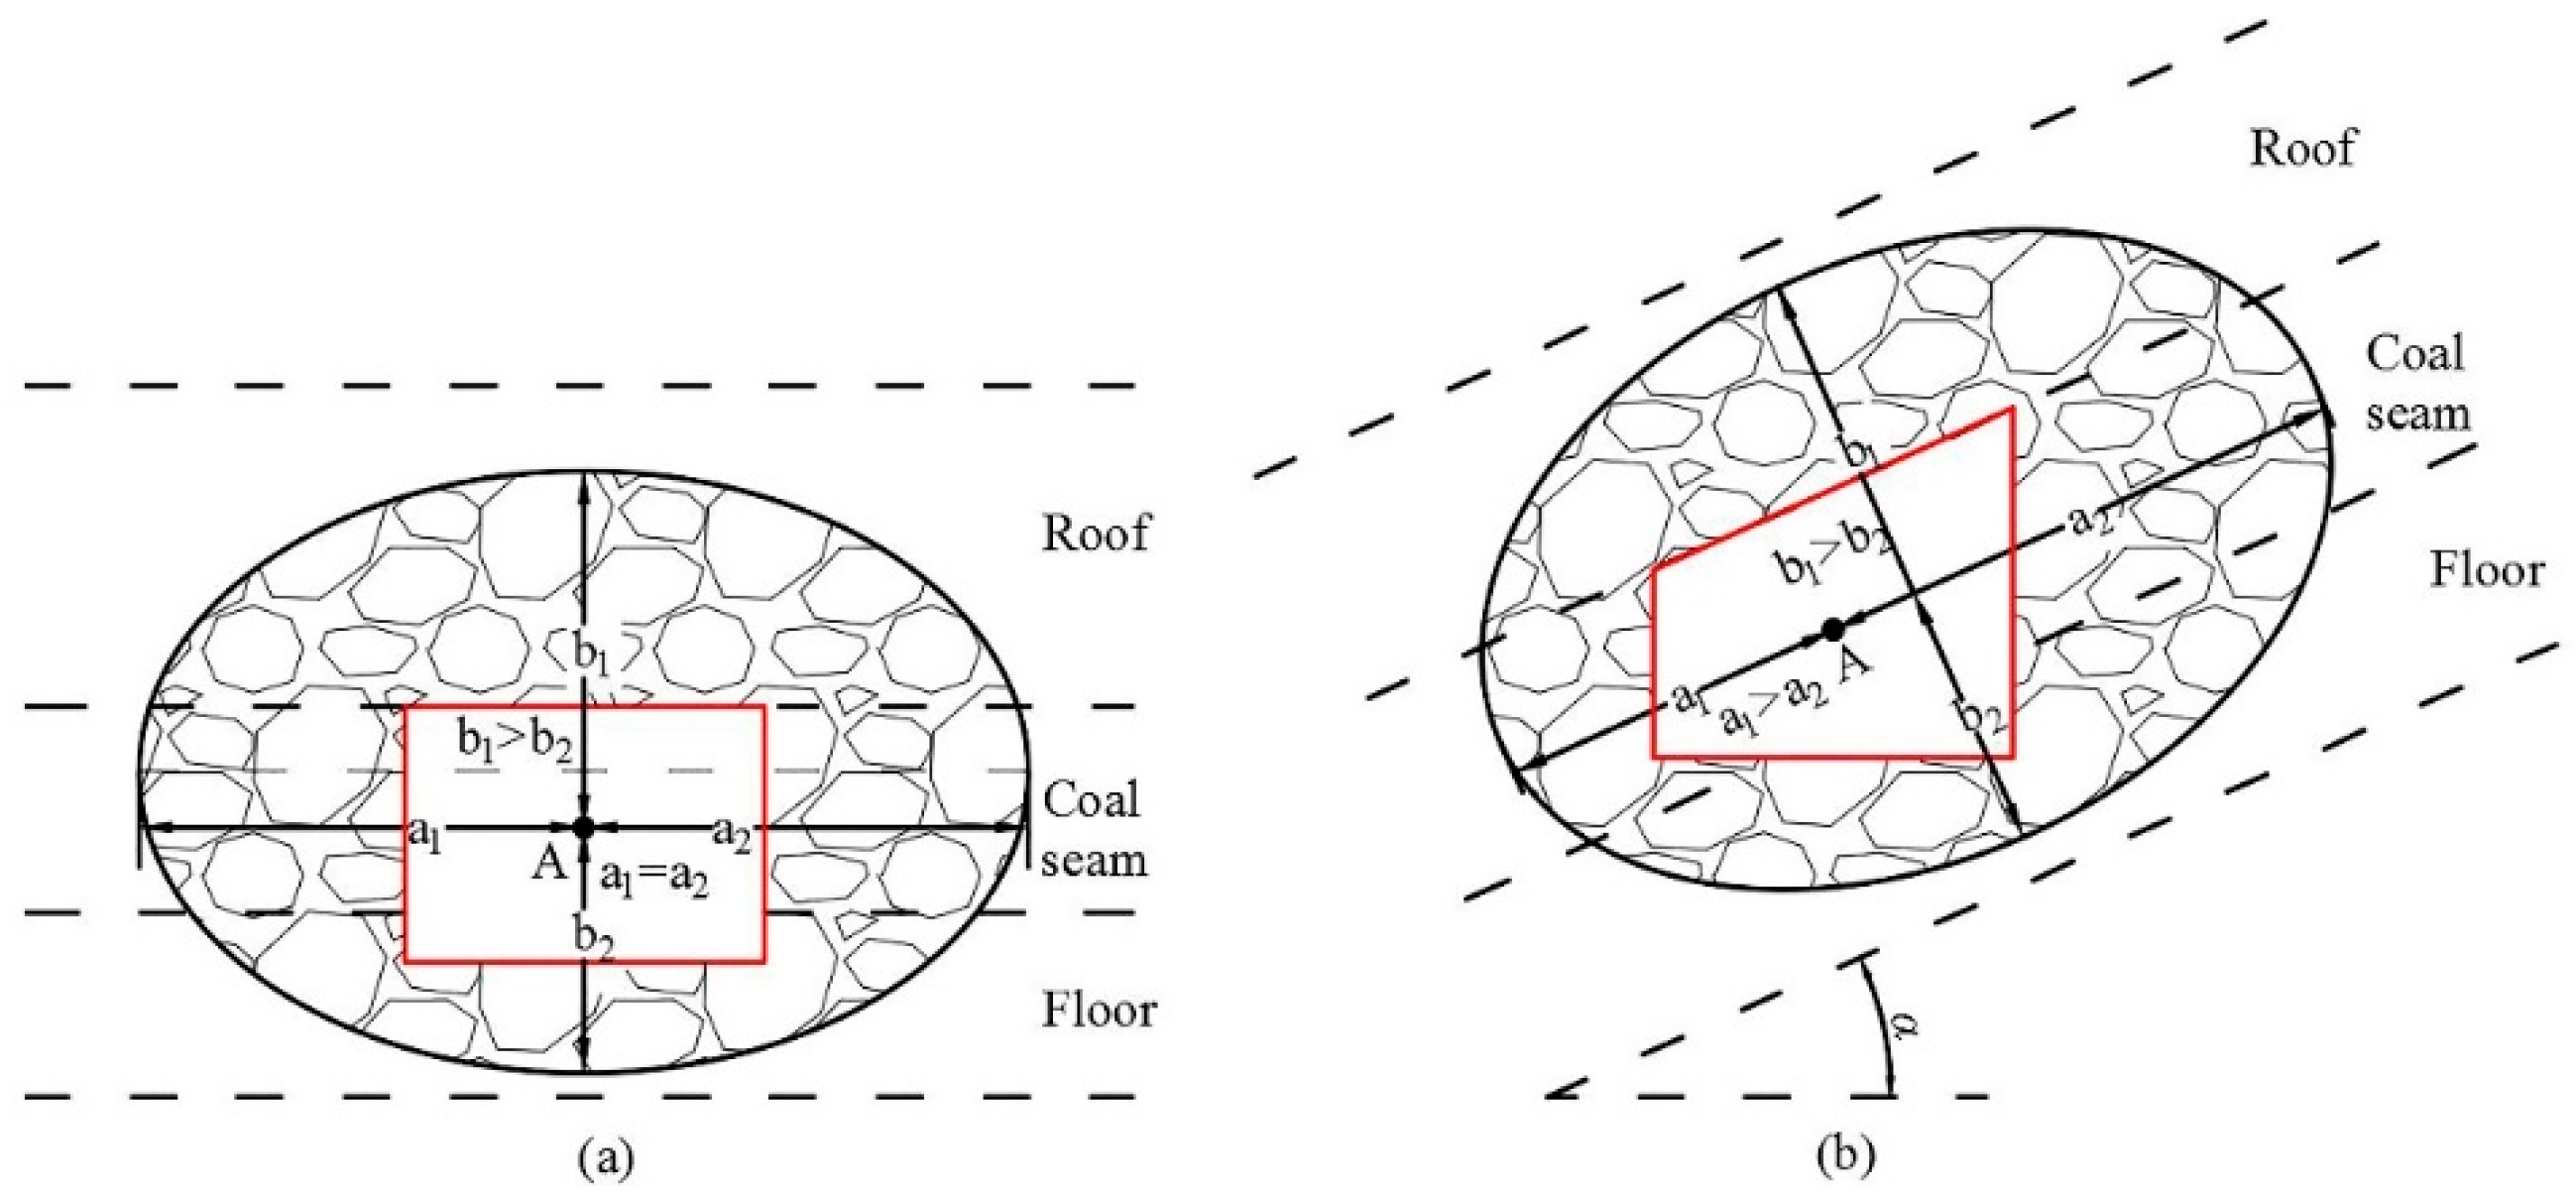
(2)
The long axis of the elliptical EBZ shapes was along or close to the horizontal direction, and the EBZ was symmetrically distributed on the gateway centreline when the dip angle was small, as in gateways No. 41, 42, 13, and 14. With increasing dip angle, the long axis of the ellipse along or close to the coal seam was in the inclination direction, and the short axis was along or close to the vertical plane direction.
(3)
The elliptical EBZ shape was not only distributed in the stratum with the entire dip angle range, but was also distributed in the 6 cross-section shapes of the gateways, such as No. 41 Trapezoid-1, No. 14 rectangular, No. 31 arch, No. 43 and 34 inclined arch, No. 15 special, and No. 50 Trapezoid-2. These cross-section diagrams indicated that the elliptical EBZ was distributed without a fixed cross-section shape, illustrating that the influence of the gateway cross-section shape on the EBZ distribution shape can be ignored.
(4)
The gateways with elliptical EBZ shapes included blasting and comprehensive mechanized excavated gateways, which presented that the excavating method had little effect on gateway failure formation.

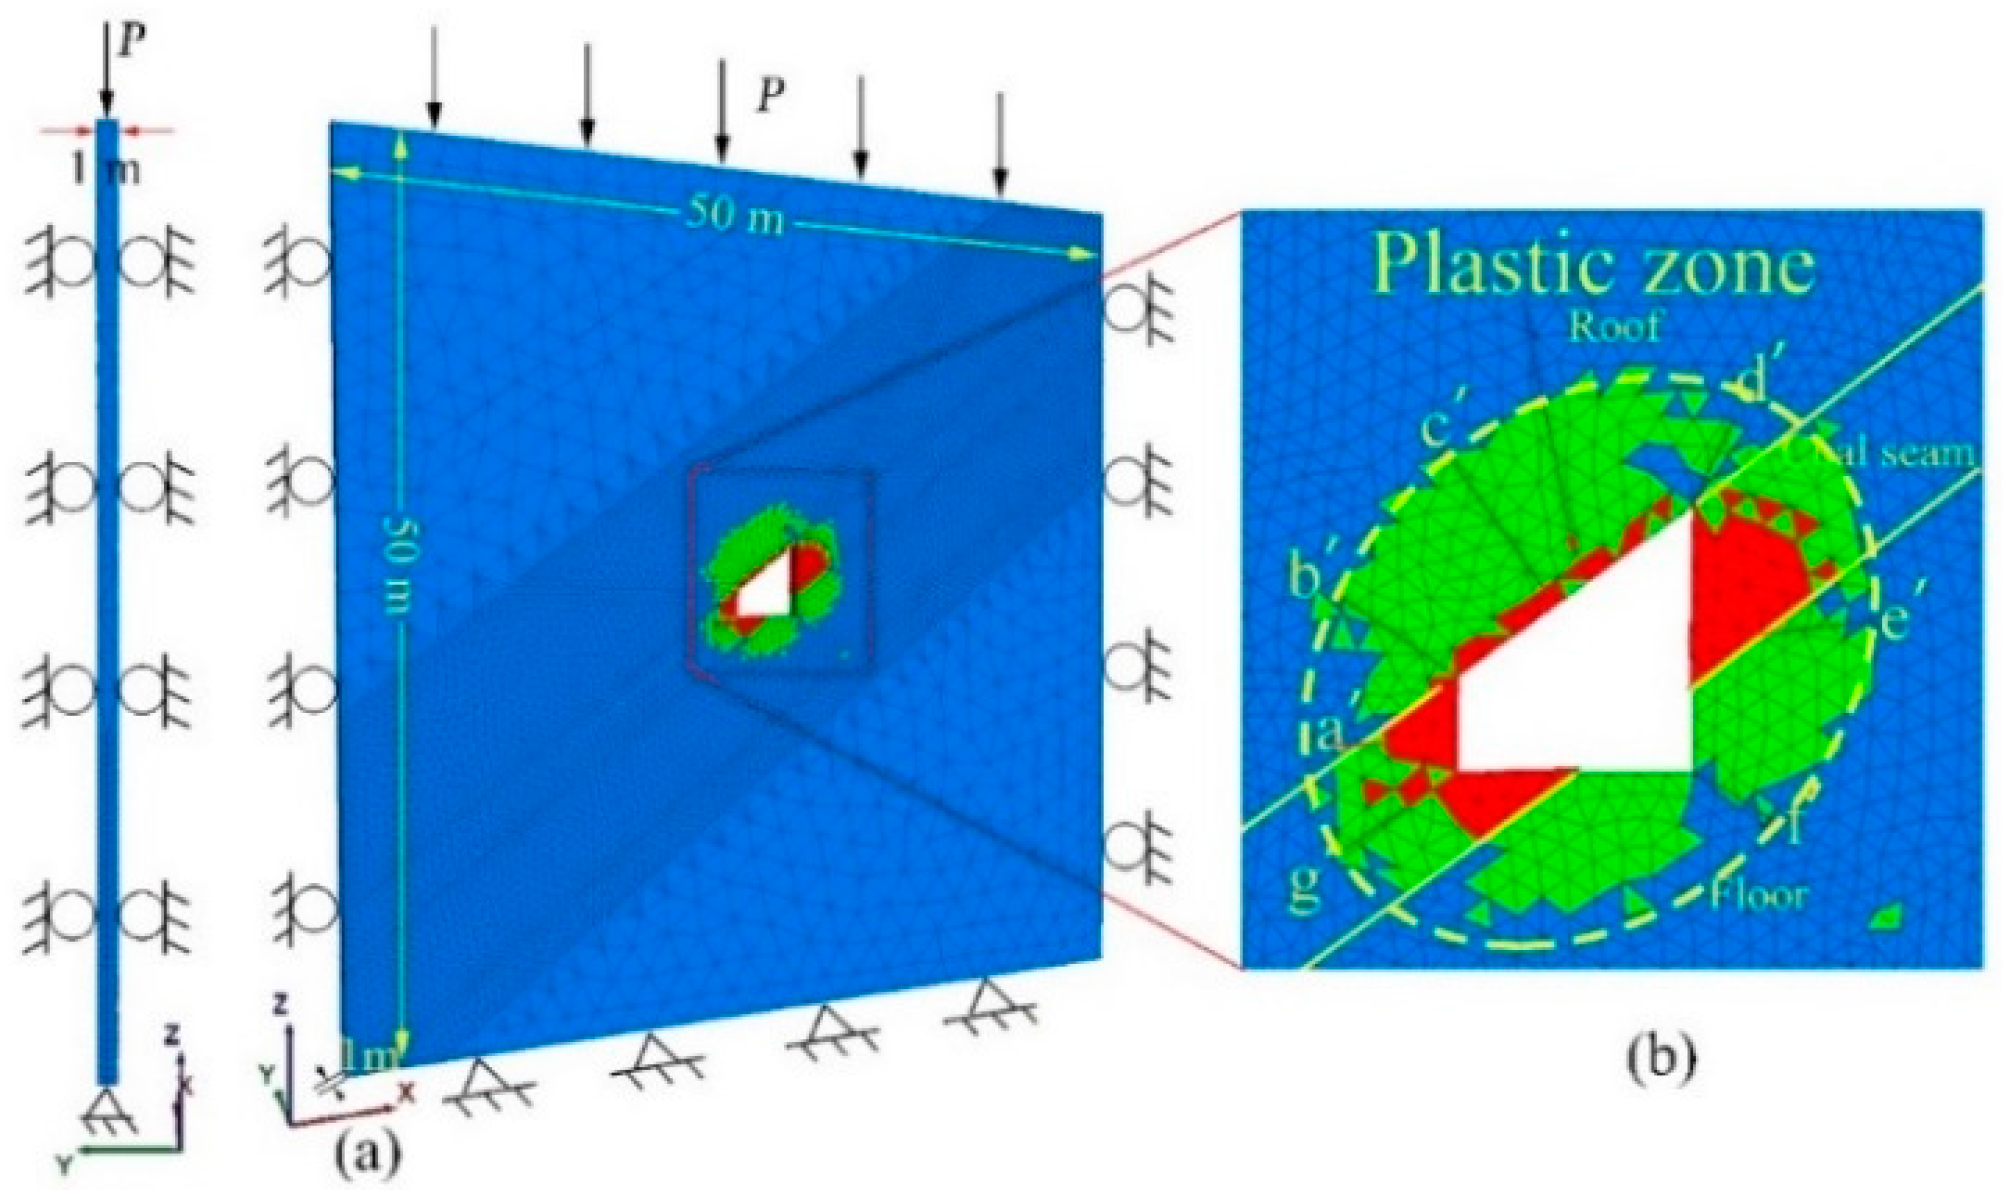
4.3. Failure Characteristics of Gateways Surrounding Rock

The EBZ shapes for the 55 gateways above provided a preliminary understanding, but we can infer that other gateways in mines should have these characteristics. Followed is the detailed summary.
For a small coal seam dip angle (α), a symmetric ellipse EBZ was distributed at the centre point A of the gateway (a1 = a2) in the long axis direction, as seen in Figure 8a. As α increases, asymmetric ellipse EBZ was distributed to point A (a1 > a2), resulting in serious failure of coal and rock mass in the high side wall, as seen in Figure 8b. In addition, in the short axis direction of the EBZ, b1 > b2 was indicated in above two cases.

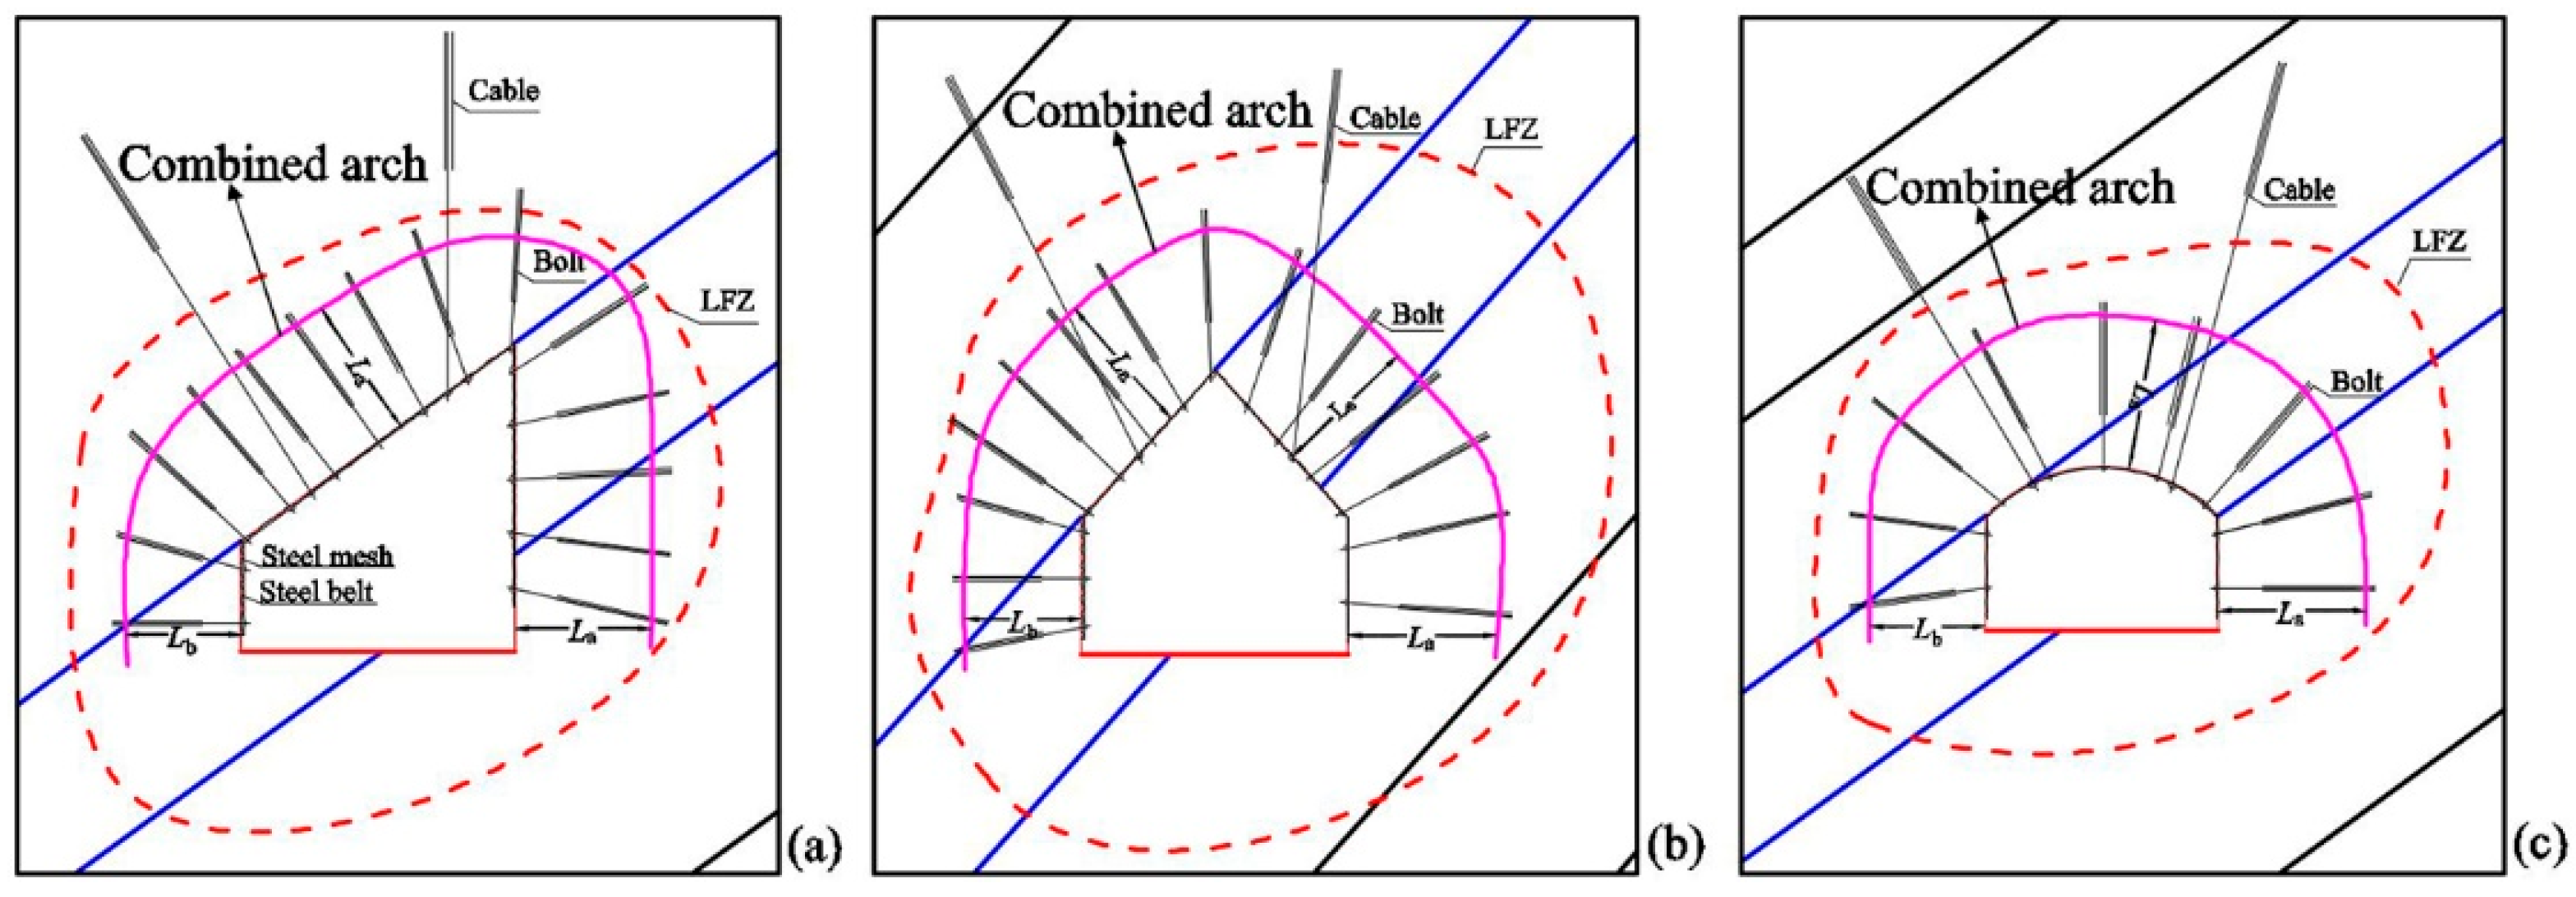
5. Supporting Technology

The above investigation demonstrated that the coal seam dip angle mostly varies from 25°–40° in coal mines; this finding indicates that most of the gateways would present an asymmetric failure type to the gateway centre. In previous studies—owing to the asymmetric coal and rock mass structure and stress evolution—bedding-plane shear slip and high stress dilatancy mechanism caused asymmetric deformation failure patterns in the gateways [36,37]. For the broken coal and rock mass within the EBZ, a large hulking force would be produced, become larger with increasing broken width, and become the main supporting object [1].
However, for a field support system, the bolts and cables usually have a low pretension force, and the support parameters were basically consistent in the two side walls and the roof. Moreover, the two side walls bolt lengths were equal for most parts of the coal mine, presenting a phenomenon of a symmetrical support method supporting asymmetrical failure structure, thus leading to multiple occurrences of large deformations and slice in the surrounding rock.
Therefore, an asymmetric control technique was required to support the gateways with the EBZ characteristics above using bolts, cables and shotcrete combined with steel mesh and steel belts. In reality, the bolts installed within the EBZ can form a combined arch structure in the surrounding rocks [4]. Because of the larger broken width in roof and high side wall, the improved support parameters could lead to the arch crown, and the arch springing thickness in the roof and high side wall were larger than that in the low side wall (La > Lb), enhancing the bearing capacity of the larger failure zone, as shown in Figure 9. This asymmetric control technique was conducive to maintaining the stability of the gateway. At present, asymmetric control technology has achieved the expected effect in many soft fractured rock mass roadways, especially in deep mine roadways [38,39].
In the field, engineers can determine the detailed supporting parameters according to the geological conditions. When dip angle of the coal seam is larger, high strength bolt can be used, the bolt lengths and bolt anchorage lengths in roof and high side wall can be increased, and the pretension force of bolts and cables can be improved.
This support system used an extensible bolting method, and the anchorage length was not less than 50% of the bolt length to increase the anchoring force in larger EBZ. This support system could increase the sphere of pretension force, and the effect of pretension force anchor in soft rock is better than that in hard rock [40]. Cable reinforcement must be added to the support system with an overhanging effect and anchored beyond the EBZ in the stable roof rocks [4].
The analysis above provided reference for support design.

6. Discussions

Here, it can be seen that the model indicated in Figure 1b was associated with strain softening behaviour, and the numerical model used Mohr-Coulomb elastic parameters to calculate the plastic zone, which seems inconsistent. In reality, Figure 1b presents a typical failure zone, which has obvious plastic. However, brittle fracture for several rocks indicated that it had a small plastic zone, and could even be ignored. Thus, adopting the entire model according to the strain softening model was unreasonable. Also, the failure criterion of Mohr-Coulomb is a plane mode, which does not consider the second principal stress, and made it unsuitable for calculation with three-dimensional stress. But since no failure criterion with three-dimensional stress is widely used in numerical simulation process at present, Mohr-Coulomb model can be adopted in the underground engineering field, and the physical and mechanical parameters for the material can be easily collected because they are widely used. As is well-known, the plastic zone formed was just when the stress went beyond the yield point, and the broken zone formed when the stress went beyond the peak point in the stress-stain curve, so the plastic width was larger than broken width, as analysis in Section 4.1 covered, and we employed the proportional relationship of plastic zone width with broken width. Moreover, many gateways were excavated by blasting and its damage couldn’t be modeled by the strain softening model. Thus, this method of utilizing the plastic zone width of Mohr-Coulomb model to calculate the broken width in the other 4 directions was feasible.
In addition, excavation methods had a great influence on the distributions of stresses and influenced the resulting EBZ distribution. Blasting excavation included two stages: blast forming stage and stress adjustment stage [41]. According to the blasting mechanism of rock, blast forming stage occurs over a short time, and can be divided into dynamic effect stage and static effect stage. In dynamic effect stage, stress wave and strong unloading effect after detonation effect would produce tensile stress, and lead to tensile fracture in rock. In static effect stage, the residual gas pressure produced after detonation effect works into the cracks. Stress adjustment stage had relatively long time—the failure being basically caused by concentration stress—and the gateway excavated by comprehensive mechanized methods usually only has the stress adjustment stage. Therefore, blasting excavation had larger broken width than that for comprehensive mechanized excavation.
Table 5 lists the broken width, the geological conditions, and excavated method for 4 gateways. Two gateways were located in the same coal mine area, and the other two were in the same coal mine. It could be seen that 5102 South tailgate and 3102 headgate had similar geological conditions, gateway cross-section shape, and size. However, 3102 headgate—excavated by blasting—had a larger broken width in low side wall, roof, and high side wall than that of 5102 south tailgate excavated by comprehensive mechanized methods. Similarly, 2121-31 tailgate and 2115 No. 3 headgate had the same geological conditions and gateway cross-section parameters, but 2115 No. 3 headgate—excavated by blasting—had a larger broken width in low side wall, roof, and high side wall than that of 2121-31 tailgate excavated by comprehensive mechanized. It was fully verified that blasting had a more damaging effects to rock.

7. Conclusions

GPR and 3DEC models were employed to determine the state of the EBZ in the surrounding rock of 55 gateways at coal mines in Sichuan Province, China. The primary conclusions with regard to gateways with similar geological conditions were as follows.
In general, the broken widths in the roof and high side wall were relatively large compared to those in the low side wall. It was found that the broken width was significantly influenced by the buried depth of the gateway, coal seam dip angle, coal seam thickness, and immediate roof thickness. Larger coal seam, immediate roof thickness, and smaller coal seam dip angle had relatively larger broken widths in the roof and high side wall. Furthermore, the broken widths also increased with the increase of the buried depth. However, the change in trend was not evident. In reality, broken width is the result of a combined action, and as a multi-factor single index for evaluating the damage degree of surrounding rock, this phenomenon sufficiently demonstrated the practicability and scientificity of the evaluate index.
Combined with the tested broken widths and plastic zones in the 3DEC model, each gateway EBZ cross-section diagram was mapped with a smooth curve. It was found that the EBZ distribution shapes were basically elliptical. The long axis was along the seam inclination direction, the short axis was along the vertical direction of the rock layer, and the failure extent was greater in the seam inclination direction than that in the vertical direction of the rock layer in the surrounding coal and rock mass. Also, the elliptical shape had little relationship with the gateway cross-section shape, presenting asymmetric failure formation.
An asymmetry control technique can be used for gateway stabilization. The bolt length in the roof and the high side wall should be larger than that in the low side wall, and the reinforcement cable must be anchored in the stable surrounding rocks. The bolts within the EBZ formed a combined arch structure in the surrounding rocks, and the thickness of the arch crown and arch springing should be larger in the roof and high side wall, respectively. In addition, cables should have an overhanging and reinforcing effect for the combined arch. This support method only provided a reference for field support design.
Furthermore, based on the above, future research directions can focus on the details of support parameter design under different geological conditions, and the support parameters can not only maintain the gateway stability in excavating and mining stages, but also be advantageous for no-pillar mining—such as gob-side entry retaining—in later stages, taking into consideration the gateway system’s comprehensive utilization.

Acknowledgments

The authors gratefully acknowledge fundings supported by National Natural Science Foundation Project of China (51474039, 51404046, U1361205, 51404168), and by State Key Laboratory of Coal Mine Disaster Dynamics and Control (2011DA105287–ZD201302, 2011DA105287–MS201403).

Author Contributions

Hongyun Yang had the original idea for this study, all co-authors were involved in data analytics work, sample characterization, as well as writing and revising all parts of this manuscript.

Conflicts of Interest

The authors declare no conflict of interest.

References

  1. Dong, F.; Song, H.; Guo, Z.; Lu, S.; Liang, S. Roadway support theory based on broken rock zone. J. China Coal Soc. 1994, 19, 21–32. [Google Scholar]
  2. Pusch, R.; Stanfors, R. The zone of disturbance around blasted tunnels at depth. Int. J. Rock Mec. Min. Sci. Geomech. Abstr. 1992, 29, 447–456. [Google Scholar] [CrossRef]
  3. Kelsall, P.C.; Case, J.B.; Chabannes, C.R. Evaluation of excavation-induced changes in rock permeability. Int. J. Rock Mec. Min. Sci. Geomech. Abstr. 1984, 21, 123–135. [Google Scholar] [CrossRef]
  4. Wang, H.; Jiang, Y.; Xue, S.; Shen, B.; Wang, C.; Lv, J.; Yang, T. Assessment of excavation damaged zone around roadways under dynamic pressure induced by an active mining process. Int. J. Rock Mec. Min. Sci. 2015, 77, 265–277. [Google Scholar] [CrossRef]
  5. Renaud, V.; Balland, C.; Verdel, T. Numerical simulation and development of data inversion in borehole ultrasonic imaging. J. Appl. Geophys. 2011, 73, 357–367. [Google Scholar] [CrossRef]
  6. Tsang, C.-F.; Bernier, F.; Davies, C. Geohydromechanical processes in the excavation damaged zone in crystalline rock, rock salt, and indurated and plastic clays—In the context of radioactive waste disposal. Int. J. Rock Mec. Min. Sci. 2005, 42, 109–125. [Google Scholar] [CrossRef]
  7. Sato, T.; Kikuchi, T.; Sugihara, K. In-situ experiments on an excavation disturbed zone induced by mechanical excavation in neogene sedimentary rock at tono mine, central japan. Eng. Geol. 2000, 56, 97–108. [Google Scholar] [CrossRef]
  8. Schuster, K.; Alheid, H.J.; Böddener, D. Seismic investigation of the excavation damaged zone in opalinus clay. Eng. Geol. 2001, 61, 189–197. [Google Scholar] [CrossRef]
  9. Malmgren, L.; Saiang, D.; Töyrä, J.; Bodare, A. The excavation disturbed zone (EDZ) at Kiirunavaara mine, sweden—By seismic measurements. J. Appl. Geophys. 2007, 61, 1–15. [Google Scholar] [CrossRef]
  10. Li, S.; Feng, X.T.; Li, Z.; Zhang, C.; Chen, B. Evolution of fractures in the excavation damaged zone of a deeply buried tunnel during TBM construction. Int. J. Rock Mec. Min. Sci. 2012, 55, 125–138. [Google Scholar] [CrossRef]
  11. Tan, Y.L.; Yu, F.H.; Chen, L. A new approach for predicting bedding separation of roof strata in underground coalmines. Int. J. Rock Mec. Min. Sci. 2013, 61, 183–188. [Google Scholar] [CrossRef]
  12. Homand-Etienne, F.; Hoxha, D.; Shao, J.F. A continuum damage constitutive law for brittle rocks. Comput. Geotech. 1998, 22, 135–151. [Google Scholar] [CrossRef]
  13. Golshani, A.; Oda, M.; Okui, Y.; Takemura, T.; Munkhtogoo, E. Numerical simulation of the excavation damaged zone around an opening in brittle rock. Int. J. Rock Mec. Min. Sci. 2007, 44, 835–845. [Google Scholar] [CrossRef]
  14. Li, L.C.; Liu, H.H. A numerical study of the mechanical response to excavation and ventilation around tunnels in clay rocks. Int. J. Rock Mec. Min. Sci. 2013, 59, 22–32. [Google Scholar] [CrossRef]
  15. Pellet, F.; Roosefid, M.; Deleruyelle, F. On the 3D numerical modelling of the time-dependent development of the damage zone around underground galleries during and after excavation. Tunn. Undergr. Space Technol. 2009, 24, 665–674. [Google Scholar] [CrossRef]
  16. Gao, F.Q.; Stead, D. The application of a modified voronoi logic to brittle fracture modelling at the laboratory and field scale. Int. J. Rock Mec. Min. Sci. 2014, 68, 1–14. [Google Scholar] [CrossRef]
  17. Kang, H.P.; Lin, J.; Fan, M.J. Investigation on support pattern of a coal mine roadway within soft rocks—A case study. Int. J. Coal Geol. 2015, 140, 31–40. [Google Scholar] [CrossRef]
  18. Pérez-Gracia, V.; García García, F.; Rodriguez Abad, I. Gpr evaluation of the damage found in the reinforced concrete base of a block of flats: A case study. NDT E Int. 2008, 41, 341–353. [Google Scholar] [CrossRef]
  19. Xiang, L.; Zhou, H.; Shu, Z.; Tan, S.; Liang, G.; Zhu, J. GPR evaluation of the damaoshan highway tunnel: A case study. NDT E Int. 2013, 59, 68–76. [Google Scholar] [CrossRef]
  20. McCann, D.M.; Forde, M.C. Review of ndt methods in the assessment of concrete and masonry structures. NDT E Int. 2001, 34, 71–84. [Google Scholar] [CrossRef]
  21. Orbán, Z.; Gutermann, M. Assessment of masonry arch railway bridges using non-destructive in-situ testing methods. Eng. Struct. 2009, 31, 2287–2298. [Google Scholar] [CrossRef]
  22. Benedetto, A.; Pensa, S. Indirect diagnosis of pavement structural damages using surface GPR reflection techniques. J. Appl. Geophys. 2007, 62, 107–123. [Google Scholar] [CrossRef]
  23. Porsani, J.L.; Sauck, W.A.; Júnior, A.O.S. GPR for mapping fractures and as a guide for the extraction of ornamental granite from a quarry: A case study from southern brazil. J. Appl. Geophys. 2006, 58, 177–187. [Google Scholar] [CrossRef]
  24. Shaw, M.R.; Millard, S.G.; Molyneaux, T.C.K.; Taylor, M.J.; Bungey, J.H. Location of steel reinforcement in concrete using ground penetrating radar and neural networks. NDT E Int. 2005, 38, 203–212. [Google Scholar] [CrossRef]
  25. Loizos, A.; Plati, C. Accuracy of pavement thicknesses estimation using different ground penetrating radar analysis approaches. NDT E Int. 2007, 40, 147–157. [Google Scholar] [CrossRef]
  26. Church, R.H.; Webb, W.E.; Boyle, J.R. Ground-Penetrating Radar for Strata Control; Report of Investigations; United States Bureau of Mines: Washington, DC, USA, 1985.
  27. Zhang, P.; Li, Y.; Zhao, Y.; Guo, L. Application and analysis on structure exploration of coal seam by mine ground penetrating radar. In Proceedings of the 2012 14th International Conference on Ground Penetrating Radar, GPR 2012, Shanghai, China, 4–8 June 2012; pp. 469–472.
  28. Strange, A.D.; Ralston, J.C.; Chandran, V. Application of ground penetrating radar technology for near-surface interface determination in coal mining. In Proceedings of the 2005 IEEE International Conference on Acoustics, Speech, and Signal Processing, ICASSP '05, Philadelphia, PA, USA, 18–23 March 2005; Institute of Electrical and Electronics Engineers Inc.: Philadelphia, PA, USA; pp. V701–V704.
  29. Koarolu, S.; Erik, N.Y. Ground penetrating radar (GPR) method of geological properties of coal seams near the surface. In Proceedings of the 14th International Multidisciplinary Scientific Geoconference and EXPO, SGEM 2014, Albena, Bulgaria, 17–26 June 2014; International Multidisciplinary Scientific Geoconference: Albena, Bulgaria; pp. 467–474.
  30. Bai, B.; Zhou, J. Advances and applications of ground penetrating radar measuring technology. Chin. J. Rock Mech. Eng. 2001, 20, 527–531. [Google Scholar]
  31. Song, H.; Wang, C.; Jia, Y. Principle of measuring broken rock zone around underground roadway with gpr and its application. J. China Univ. Min. Technol. 2002, 31, 370–373. [Google Scholar]
  32. Itasca. 3DEC—3 Dimensional Distinct Element Code; Itasca Consulting Group Inc.: Minneapolis, MN, USA, 2013. [Google Scholar]
  33. Gao, F.; Stead, D.; Kang, H.; Wu, Y. Discrete element modelling of deformation and damage of a roadway driven along an unstable goaf—A case study. Int. J. Coal Geol. 2014, 127, 100–110. [Google Scholar] [CrossRef]
  34. Davis, J.L.; Annan, A.P. Ground-penetrating radar for high-resolution mapping of soil and rock stratigraphy. Geophys. Prospect. 1989, 37, 531–551. [Google Scholar] [CrossRef]
  35. Xie, J.L.; Xu, J.L. Ground penetrating radar-based experimental simulation and signal interpretation on roadway roof separation detection. Arab. J. Geosci. 2015, 8, 1273–1280. [Google Scholar] [CrossRef]
  36. Fan, K.-G.; Jiang, J.-Q. Deformation failure and non-harmonious control mechanism of surrounding rocks of roadways with weak structures. J. China Univ. Min. Technol. 2007, 36, 54–59. [Google Scholar]
  37. Cao, S.G.; Zou, D.J.; Bai, Y.J.; He, P.J.; Wu, H.R. Surrounding rock control of mining roadway in the thin coal seam group with short distance and “three soft”. J. Min. Saf. Eng. 2011, 28, 524–529. [Google Scholar]
  38. Sun, X.; Zhang, G.; Cai, F.; Yu, S. Asymmetric deformation mechanism within inclined rock strata induced by excavation in deep roadway and its controlling countermeasures. Chin. J. Rock Mech. Eng. 2009, 28, 1137–1143. [Google Scholar]
  39. Yu, Y.; Bai, J.; Wang, X.; Shen, W.; Lian, C. Study on asymmetric distortion and failure characteristics and stability control of soft rock roadway. J. Min. Saf. Eng. 2014, 31, 340–346. [Google Scholar]
  40. Zheng, X.-G.; Zhang, N.; Xue, F. Study on stress distribution law in anchoring section of prestressed bolt. J. Min. Saf. Eng. 2012, 29, 365–370. [Google Scholar]
  41. Xiao, J.; Feng, X.; Lin, D. Influence of blasting round on excavation damaged zone of surrounding rock. Chin. J. Rock Mech. Eng. 2010, 29, 2248–2255. [Google Scholar]
Figure 1. Surrounding rock failure mode of gateway. (a) Schematic diagram of failure zone; (b) failure zone in the view of stress–strain curve obtained by triaxial compression test.
Minerals 06 00072 g001
Figure 2. Investigate field. (a) and (b) the location of the test coal mines, in Sichuan Province, China; (c) gateways cross-section shape.
Minerals 06 00072 g002
Figure 3. Test location. (a) The test location in the gateway; (b) the cross-section of test location.
Minerals 06 00072 g003
Figure 4. Test of ground-penetrating radar (GPR). (a) The measuring principle of electromagnetic wave; and (b) SIR-20 Model multi-channel perspective radar.
Minerals 06 00072 g004
Figure 5. Broken width and the geological conditions of tested gateways.
Minerals 06 00072 g005
Figure 6. One gateway three-dimensional distinct element code (3DEC) mode. (a) Numerical model, (b) Plastic zone.
Minerals 06 00072 g006
Figure 7. Excavation broken zone (EBZ) cross-section diagram for gateways.
Minerals 06 00072 g007aMinerals 06 00072 g007b
Figure 8. EBZ distribution characteristics. (a) For small coal seam dip angle; (b) For large coal seam dip angle.
Minerals 06 00072 g008
Figure 9. The cross-section of the support system. (a) Support for trapezoid cross-section; (b) Support for special cross-section; (c) Support for arch or inclined arch cross-section.
Minerals 06 00072 g009
Table 1. Geological conditions parameters of test gateways.
ConditionsBuried Depth/(m)Dip Angle/(°)Thickness of Immediate Roof/(m)Thickness of Coal Seam/(m)
minimumapproximately 2009less than 10.5
maximumapproximately 70067approximately 18close to 5
most300–50025–403–60.8–2.5
Table 2. Coal-bearing strata of tested gateways.
PhanerozoicMesozoicTriassic (T)T3Xujiahe Formation (T3xj)-
-Daqiaodi Formation (T3d)
PaleozoicPermian (P)P2Longtan Formation (P2l)Xuanwei Formation (P2x)
--
Table 3. Material parameters of main lithology.
Main LithologyDensity/(kg/m3)Bulk Modulus K/(GPa)Shear Modulus G/(GPa)Cohesion C/(MPa)Friction Angle φ/(°)Tensile Strength σt/(MPa)
Coal14002.051.021.70351.1
Mudstone254113.39.812.8422.9
Sandstone302013.910.46.3403
Siltstone26002.911.041.1120.3
Clay rock24603.982.171.8251.0
Table 4. Relative dielectric constants of some mediums.
MediumsAirWaterLimestoneCoalSandstoneShaleMudstoneSandy MudstoneClay Rock
ε18174.545–155–255.538–12
Table 5. Broken width in gateways with different excavation method.
Coal MinesGatewaySection-CrossExcavation MethodBottom Width (m)Dip Angle (°)Broken width (°)
Low Side WallRoofHigh Side Wall
The same coal mine area Lizi Ya 5102 south tailgateSpecialcomprehensive mechanized3.5402.422.52
Lizi Ya south two 3102 headgateSpecialblasting3.9482.533.5
Dabao Ding 2121-31 tailgatetrapezoidcomprehensive mechanized3.8302.52.52.5
2115#3 headgatetrapezoidblasting3.83033.53

