
Petrology and Geochemistry of the Harlan, Kellioka, and Darby Coals from the Louellen 7.5-Minute Quadrangle, Harlan County, Kentucky

 ,
,
Abstract
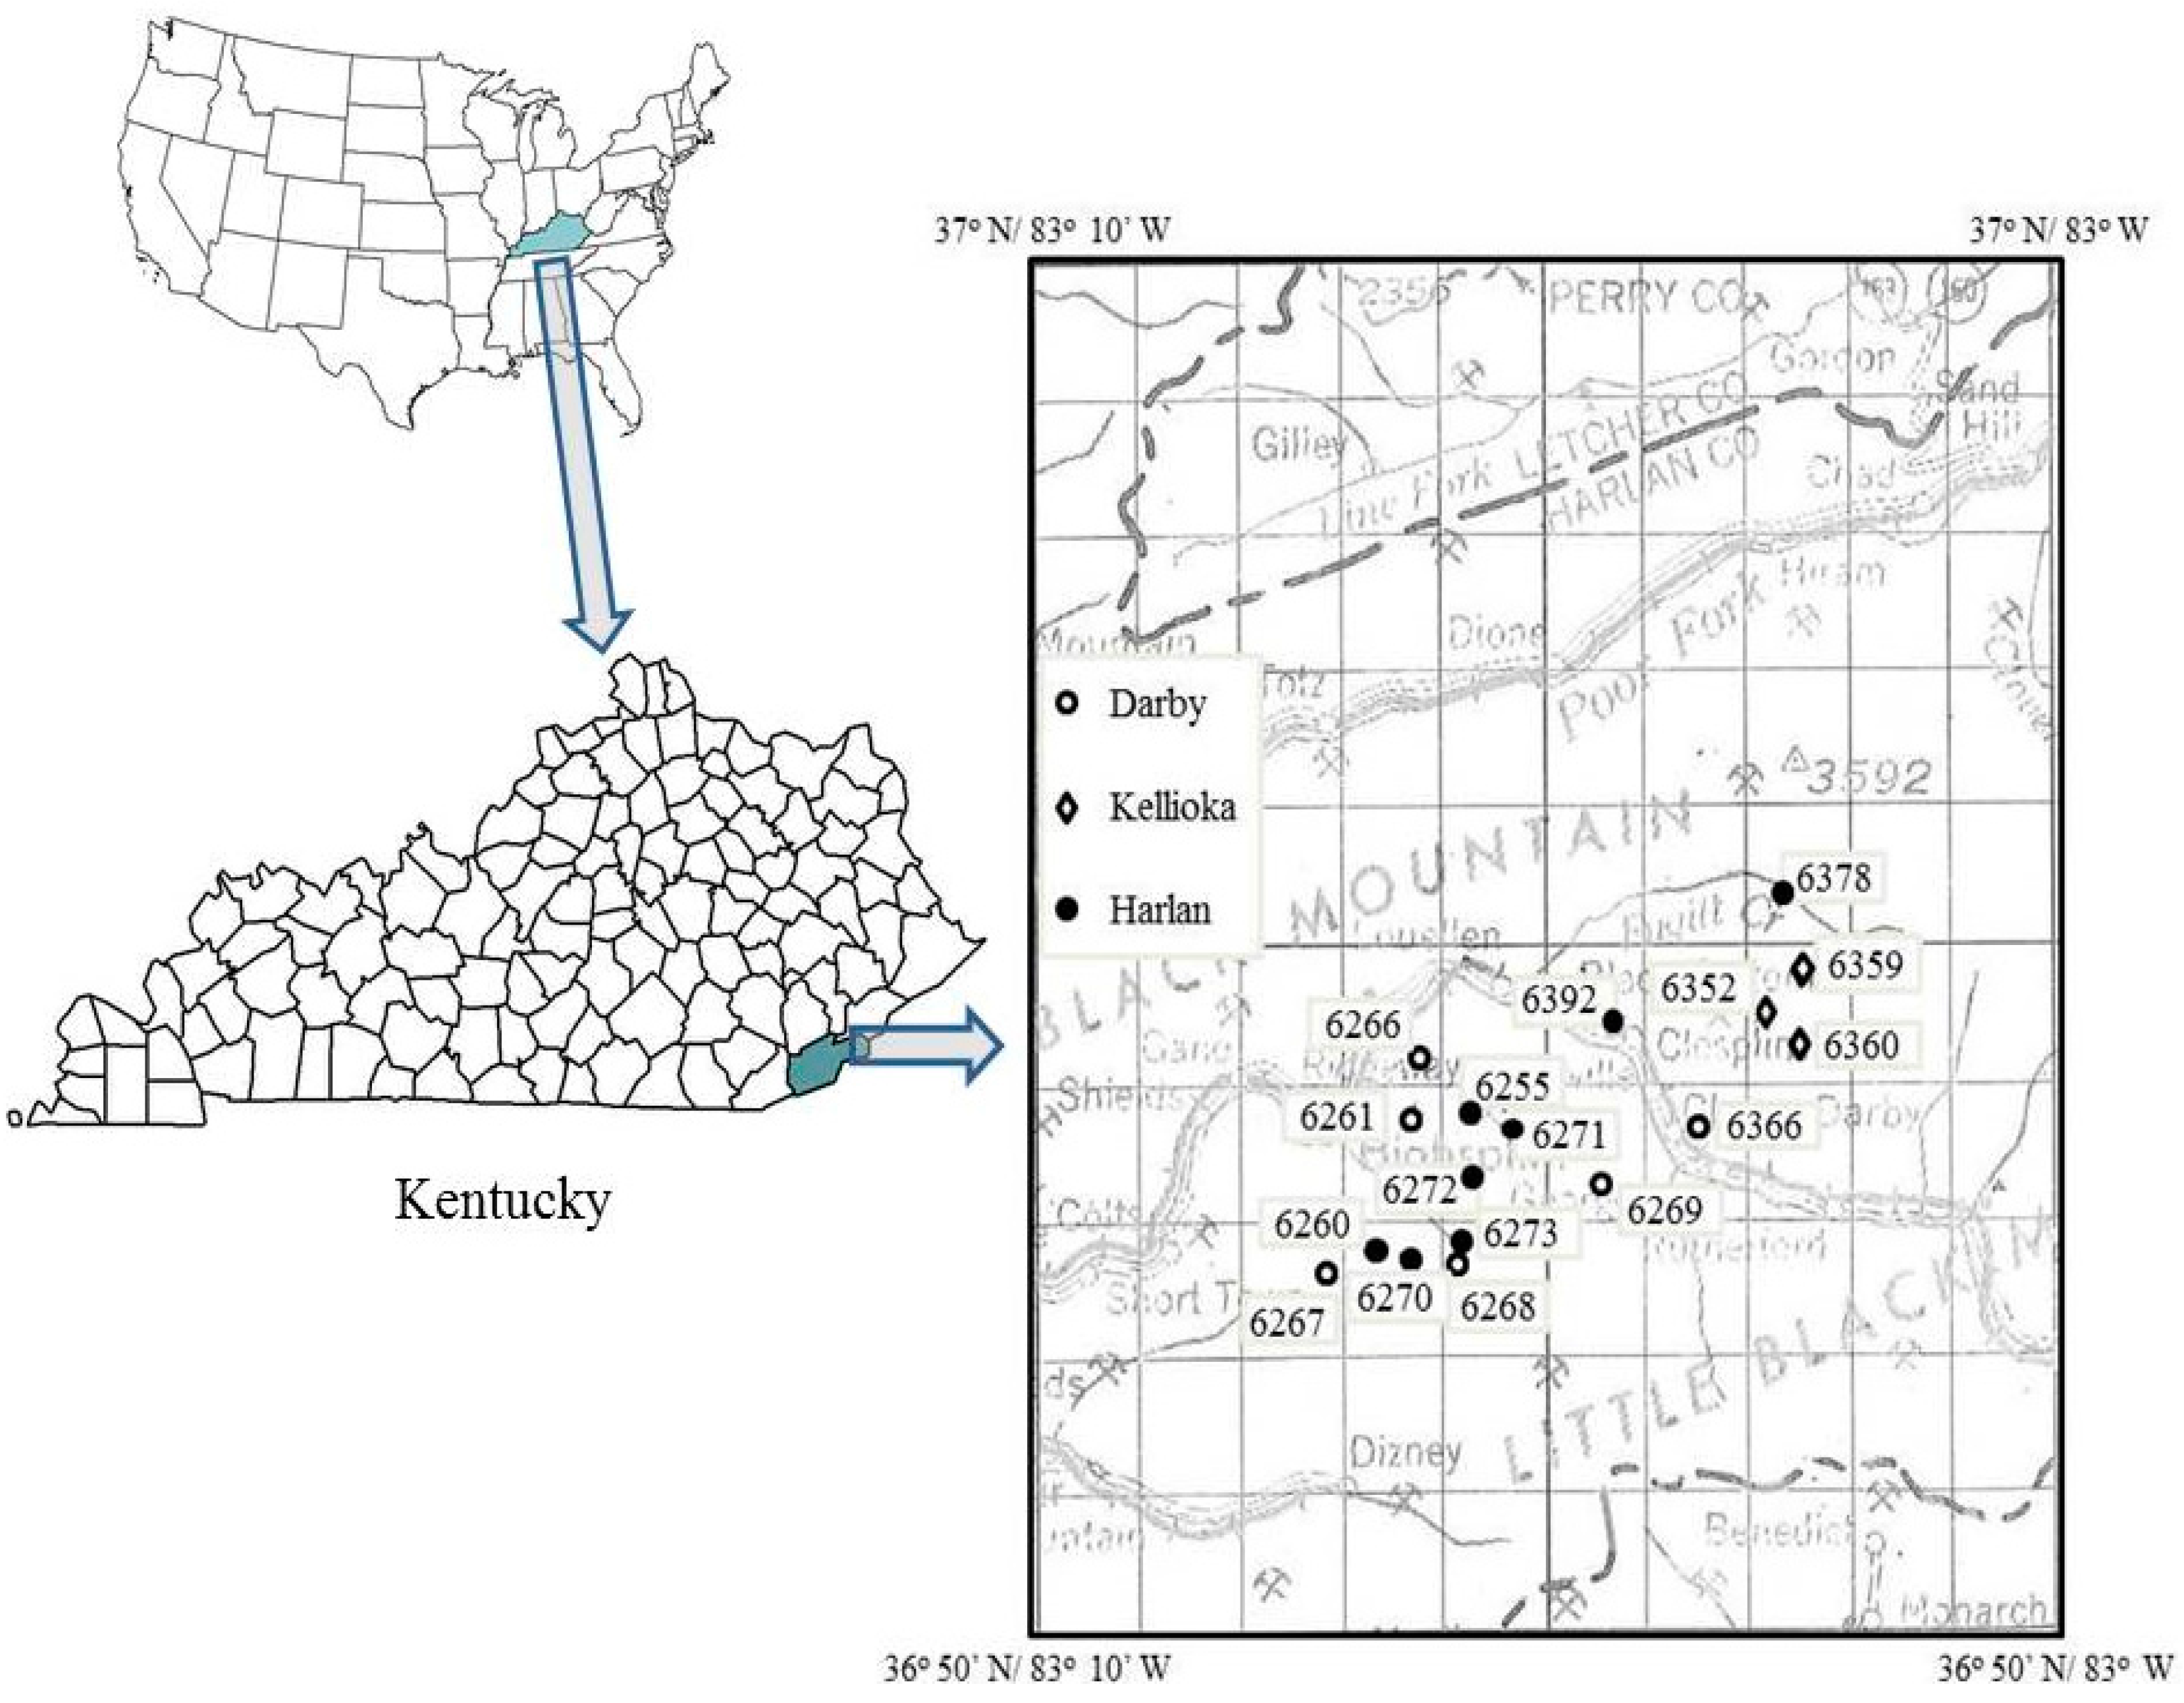
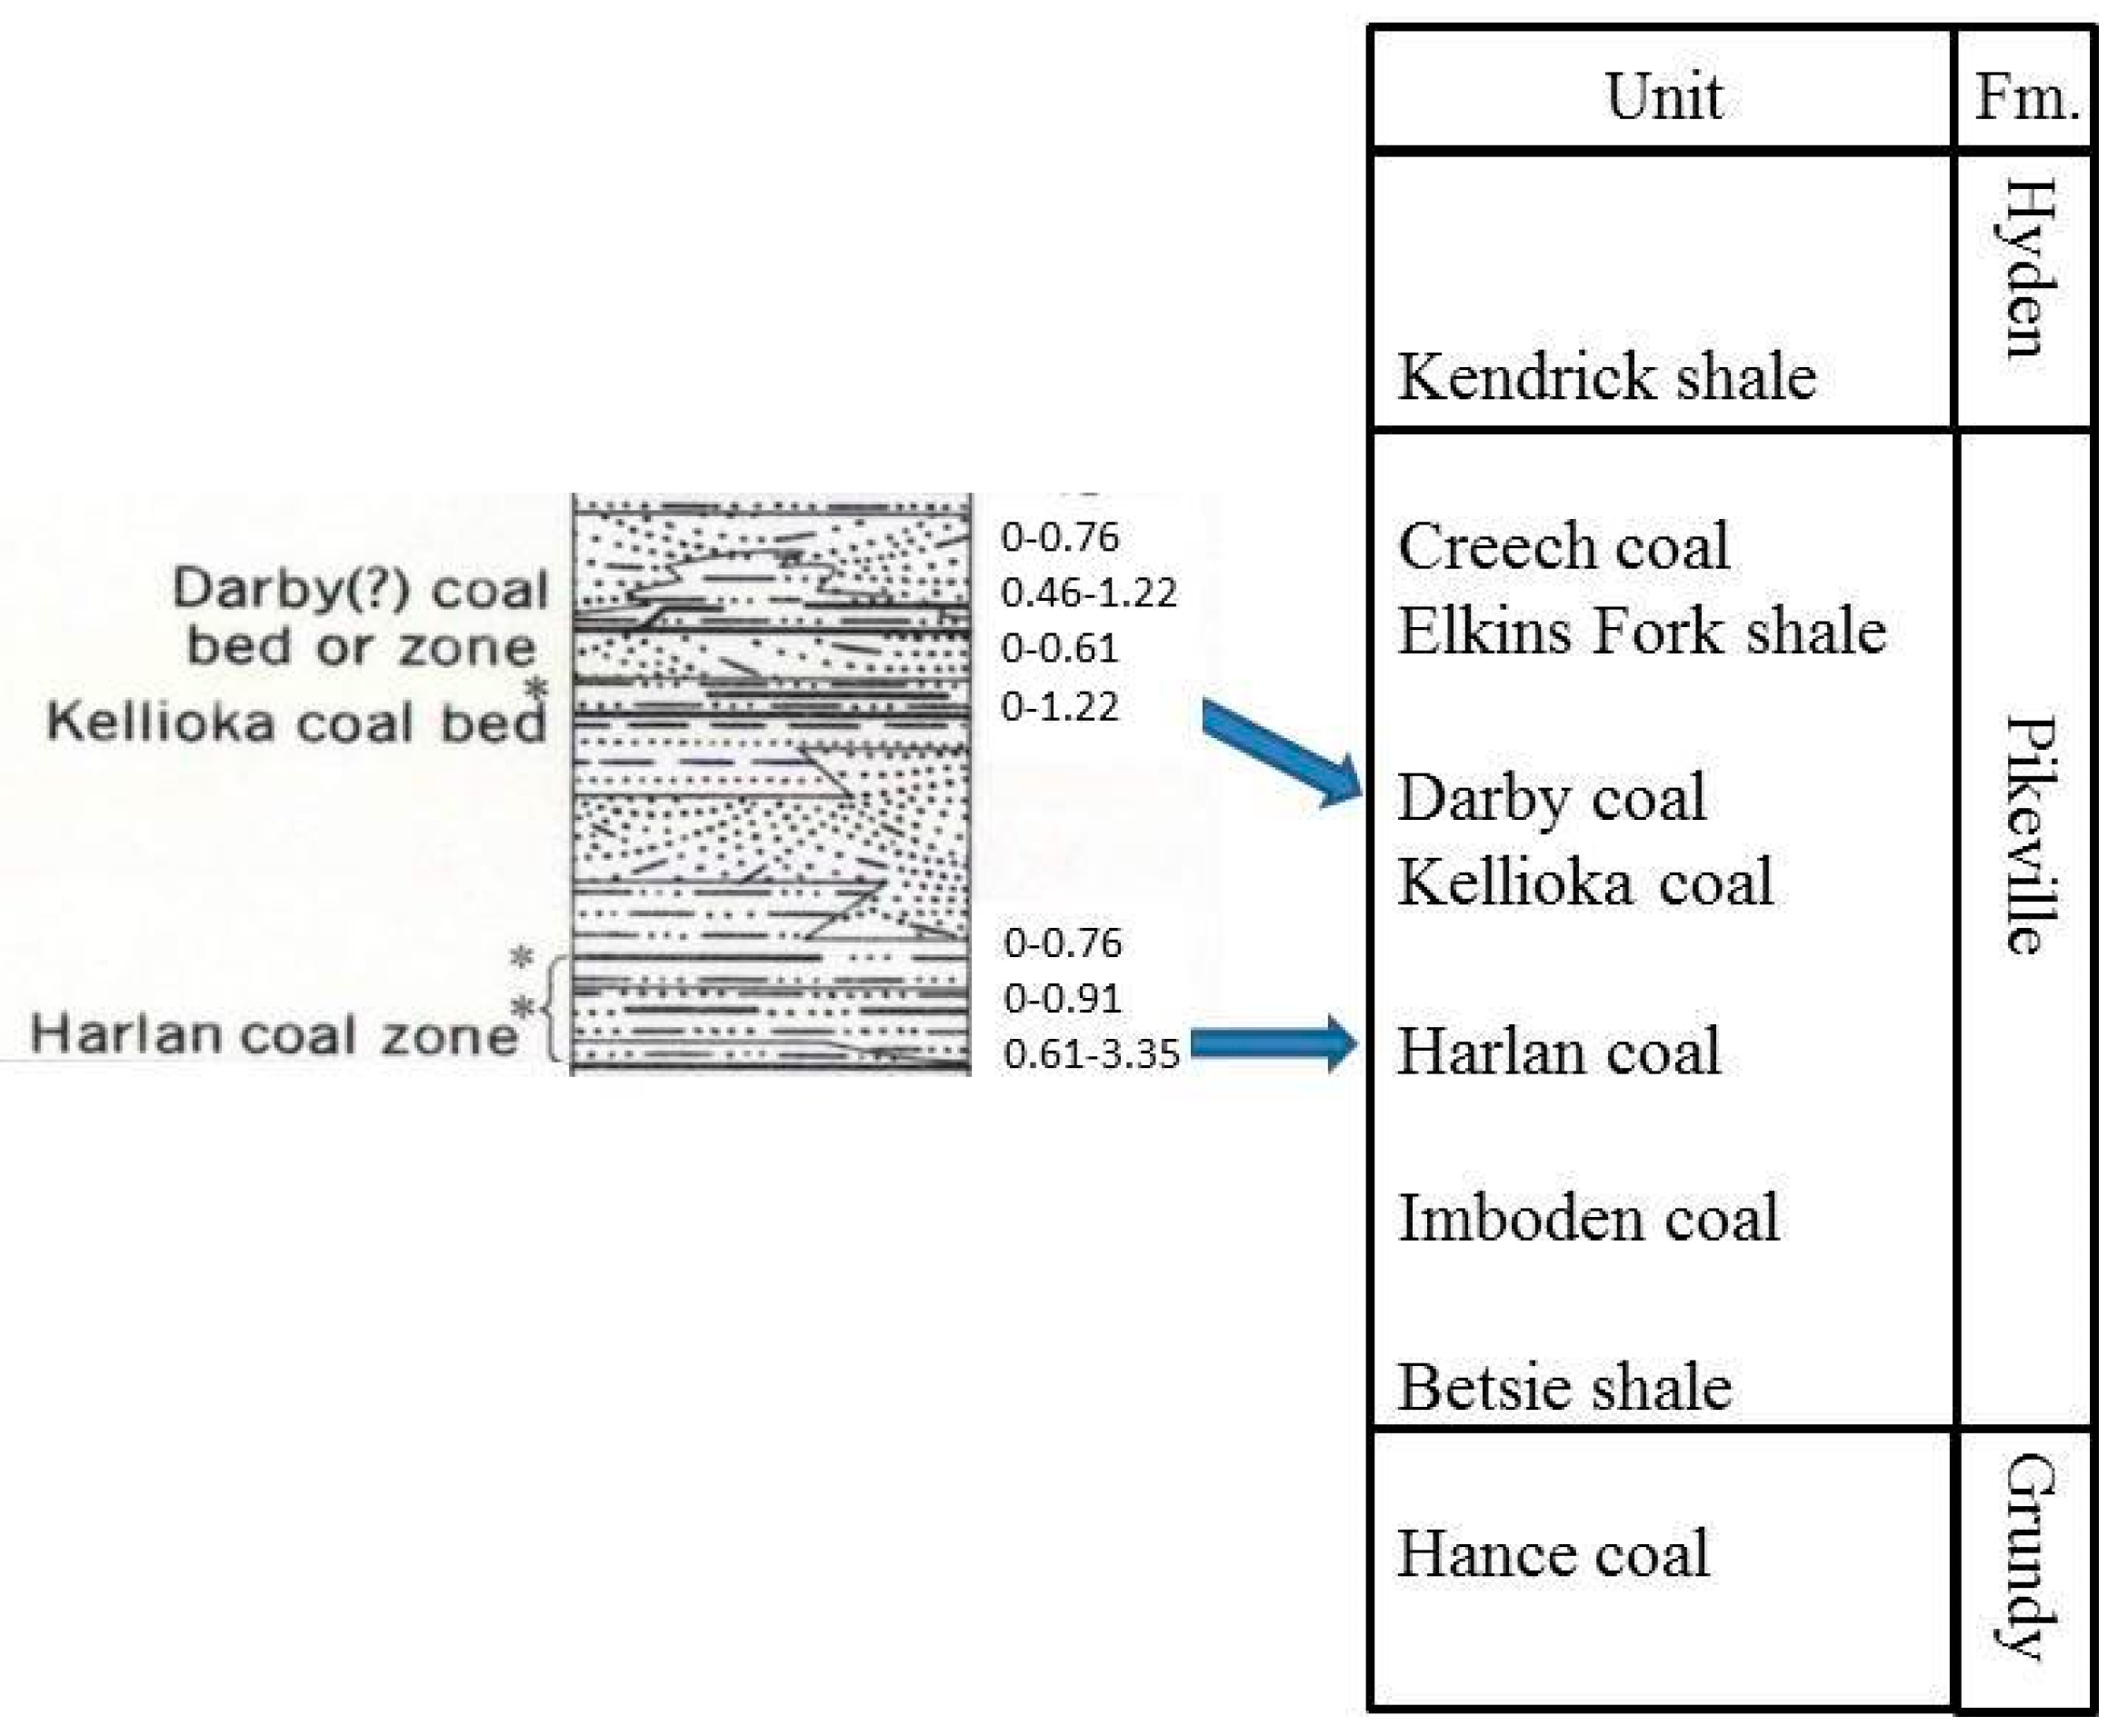
:1. Introduction


2. Methods

| Elements | MDL | Elements | MDL | Elements | MDL |
|---|---|---|---|---|---|
| Li | 0.0090 | Zr | 0.0173 | Gd | 0.0113 |
| Be | 0.0103 | Nb | 0.0567 | Tb | 0.0071 |
| Sc | 0.0067 | Mo | 0.1052 | Dy | 0.0198 |
| V | 0.0062 | Ag | 0.0028 | Ho | 0.0044 |
| Cr | 0.0293 | Cd | 0.0019 | Er | 0.0089 |
| Co | 0.0032 | Sn | 0.0176 | Tm | 0.0061 |
| Ni | 0.0219 | Sb | 0.0037 | Yb | 0.0050 |
| Cu | 0.0481 | In | 0.0028 | Lu | 0.0042 |
| Zn | 0.1547 | Cs | 0.0088 | Hf | 0.0129 |
| Ga | 0.0016 | Ba | 0.2019 | Ta | 0.1194 |
| Ge | 0.0015 | La | 0.0165 | W | 0.1465 |
| As | 0.1799 | Ce | 0.0071 | Tl | 0.2137 |
| Se | 0.2291 | Pr | 0.0122 | Pb | 0.0124 |
| Rb | 0.7208 | Nd | 0.0247 | Bi | 0.0331 |
| Sr | 0.0440 | Sm | 0.0229 | Th | 0.0677 |
| Y | 0.0144 | Eu | 0.0049 | U | 0.88 |
3. Discussion and Results
3.1. Proximate and Sulfur Analysis
| Coal | Sample | Bench | Thickness (cm) | Mois | Ash | S (t) | S (py) | S (sulf) | S (org) |
|---|---|---|---|---|---|---|---|---|---|
| Harlan | 6255 | wc | 111.60 | 2.11 | 7.64 | 1.10 | 0.25 | 0.00 | 0.85 |
| 6256 | 1/4 (top) | 16.70 | 2.41 | 18.66 | 1.30 | 0.37 | 0.02 | 0.91 | |
| 6257 | 2/4 | 9.60 | 2.29 | 5.94 | 1.73 | 0.67 | 0.02 | 1.04 | |
| 6258 | 3/4 | 28.40 | 2.20 | 11.34 | 1.85 | 0.84 | 0.03 | 0.98 | |
| 6259 | 4/4 | 57.00 | 2.20 | 8.40 | 1.08 | 0.26 | 0.01 | 0.81 | |
| 6260 | wc | 140.21 | 1.98 | 8.88 | 1.19 | 0.30 | 0.01 | 0.88 | |
| 6270 | wc | 121.92 | 1.73 | 13.54 | 1.07 | nd | nd | nd | |
| 6271 | wc | 126.49 | 1.59 | 10.75 | 1.22 | nd | nd | nd | |
| 6272 | wc | 126.49 | 1.79 | 14.54 | 1.35 | nd | nd | nd | |
| 6273 | wc | 134.11 | 1.76 | 35.91 | 0.91 | nd | nd | nd | |
| 6378 | wc | 272.80 | 2.08 | 9.19 | 0.91 | 0.20 | 0.00 | 0.71 | |
| 6379 | 1/9 (top) | 27.43 | 2.03 | 9.36 | 0.89 | 0.11 | 0.01 | 0.77 | |
| 6380 | 2/9 | 11.58 | 1.43 | 29.52 | 0.53 | 0.09 | 0.00 | 0.44 | |
| 6381 | 3/9 | 32.92 | 2.07 | 8.84 | 1.34 | 0.30 | 0.01 | 1.03 | |
| 6382 | 4/9 | 17.68 | 1.80 | 4.96 | 0.79 | 0.08 | 0.01 | 0.70 | |
| 6383 | 5/9 | 51.51 | 2.13 | 5.46 | 1.51 | 0.44 | 0.02 | 1.05 | |
| 6384 | 6/9 | 13.41 | 2.57 | 23.80 | 2.06 | 1.23 | 0.06 | 0.77 | |
| 6385 | 7/9 | 3.35 | 1.49 | 16.96 | 0.49 | 0.04 | 0.00 | 0.45 | |
| 6386 | 8/9 | 41.15 | 2.07 | 3.41 | 0.64 | 0.08 | 0.00 | 0.56 | |
| 6387 | 9/9 | 50.29 | 2.21 | 7.67 | 1.19 | 0.34 | 0.04 | 0.81 | |
| 6392 | wc | 292.61 | 1.88 | 16.72 | 1.09 | 0.29 | 0.00 | 0.80 | |
| 6393 | 1/11 (top) | 35.05 | 1.72 | 7.65 | 0.71 | 0.05 | 0.00 | 0.66 | |
| 6394 | 2/11 | 6.71 | 1.44 | 8.02 | 0.73 | 0.06 | 0.00 | 0.67 | |
| 6395 | 3/11 | 23.77 | 1.70 | 5.93 | 1.27 | 0.24 | 0.01 | 1.02 | |
| 6396 | 4/11 | 6.40 | 2.68 | 25.88 | 1.09 | 0.36 | 0.00 | 0.73 | |
| 6397 | 5/11 | 17.98 | 1.69 | 4.74 | 0.98 | 0.12 | 0.00 | 0.86 | |
| 6398 | 6/11 | 3.05 | 1.17 | 5.48 | 0.80 | 0.01 | 0.00 | 0.79 | |
| 6399 | 7/11 | 49.38 | 1.85 | 4.24 | 0.95 | 0.12 | 0.00 | 0.83 | |
| 6400 | 8/11 | 20.42 | 1.91 | 53.04 | 1.37 | 0.73 | 0.04 | 0.60 | |
| 6401 | 9/11 | 6.71 | 1.77 | 23.13 | 0.58 | 0.09 | 0.00 | 0.49 | |
| 6402 | 10/11 | 43.89 | 1.95 | 4.51 | 0.77 | 0.09 | 0.00 | 0.68 | |
| 6403 | 11/11 | 52.12 | 2.25 | 5.87 | 1.25 | 0.41 | 0.03 | 0.81 | |
| Kellioka | 6352 | wc | 86.87 | 2.41 | 5.44 | 0.72 | 0.11 | 0.00 | 0.61 |
| 6353 | 1/6 (top) | 18.29 | 2.60 | 3.14 | 0.93 | 0.21 | 0.02 | 0.70 | |
| 6354 | 2/6 | 16.76 | 2.60 | 3.22 | 1.13 | 0.39 | 0.03 | 0.71 | |
| 6355 | 3/6 | 8.23 | 2.32 | 2.27 | 0.52 | 0.05 | 0.00 | 0.47 | |
| 6356 | 4/6 | 11.58 | 1.99 | 2.00 | 0.56 | 0.05 | 0.00 | 0.51 | |
| 6357 | 5/6 | 19.81 | 1.79 | 3.80 | 0.52 | 0.03 | 0.00 | 0.49 | |
| 6358 | 6/6 | 12.19 | 2.06 | 15.62 | 0.60 | 0.09 | 0.01 | 0.50 | |
| 6359 | wc | 107.19 | 2.07 | 4.19 | 0.67 | 0.10 | 0.00 | 0.57 | |
| 6360 | wc | 113.03 | 2.09 | 4.86 | 0.97 | 0.29 | 0.01 | 0.67 | |
| 6361 | 1/5 (top) | 19.81 | 2.25 | 3.75 | 1.06 | 0.26 | 0.03 | 0.77 | |
| 6362 | 2/5 | 15.85 | 2.00 | 4.50 | 0.92 | 0.14 | 0.02 | 0.76 | |
| 6363 | 3/5 | 12.80 | 2.14 | 2.93 | 0.65 | 0.05 | 0.00 | 0.60 | |
| 6364 | 4/5 | 43.59 | 1.87 | 3.98 | 0.64 | 0.03 | 0.01 | 0.60 | |
| 6365 | 5/5 | 21.03 | 2.13 | 10.26 | 1.14 | 0.36 | 0.04 | 0.74 | |
| Darby | 6261 | wc | 92.05 | 2.59 | 2.18 | 0.56 | 0.06 | 0.00 | 0.50 |
| 6262 | 1/4 (top) | 13.41 | 2.56 | 1.77 | 0.53 | 0.04 | 0.01 | 0.48 | |
| 6263 | 2/4 | 12.19 | 5.23 | 1.93 | 0.48 | 0.04 | 0.01 | 0.43 | |
| 6264 | 3/4 | 49.38 | 3.46 | 1.29 | 0.55 | 0.04 | 0.00 | 0.51 | |
| 6265 | 4/4 | 17.07 | 3.55 | 1.80 | 0.60 | 0.05 | 0.01 | 0.54 | |
| 6266 | wc | 99.06 | 1.94 | 2.21 | 0.54 | nd | nd | nd | |
| 6267 | wc | 164.59 | 1.96 | 3.04 | 0.70 | nd | nd | nd | |
| 6268 | wc | 108.20 | 2.20 | 2.67 | 0.63 | nd | nd | nd | |
| 6269 | wc | 102.11 | 1.85 | 4.06 | 0.53 | nd | nd | nd | |
| 6366 | wc | 76.71 | 3.03 | 2.21 | 0.63 | 0.04 | 0.01 | 0.58 | |
| 6367 | 1/5 (top) | 3.35 | 2.54 | 7.44 | 0.56 | 0.07 | 0.02 | 0.47 | |
| 6368 | 2/5 | 13.41 | 2.11 | 2.02 | 0.53 | 0.05 | 0.01 | 0.47 | |
| 6369 | 3/5 | 4.57 | 2.23 | 3.28 | 0.53 | 0.04 | 0.01 | 0.48 | |
| 6370 | 4/5 | 41.45 | 3.12 | 1.76 | 0.54 | 0.05 | 0.02 | 0.47 | |
| 6371 | 5/5 | 14.33 | 3.29 | 2.78 | 0.59 | 0.04 | 0.02 | 0.53 |
3.2. Petrology

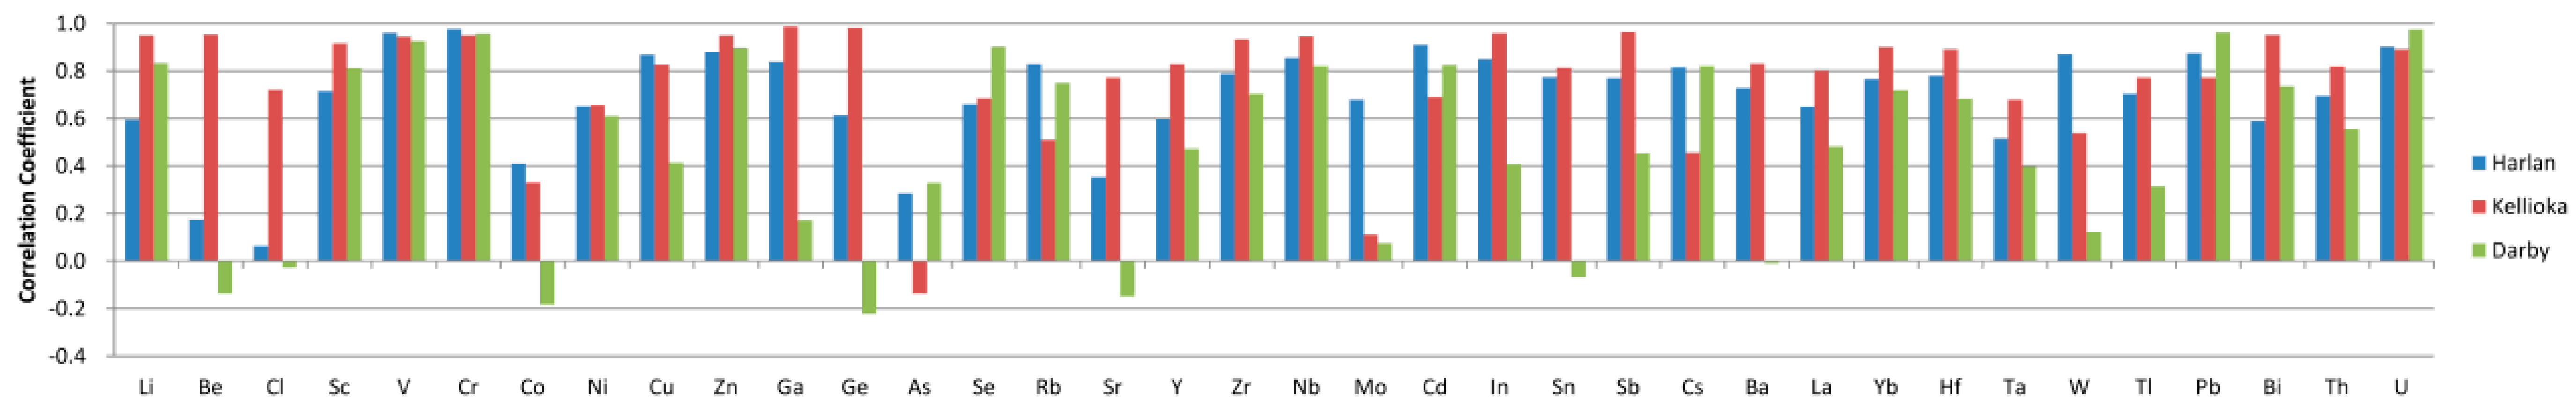
3.3. Elemental Geochemistry
| Coal | Sample | Bench | T | CT | VD | CD | CG | G | T-V | F | SF | Mic | Mac | Sec | Fun | ID | T-I | Sp | Cut | Res | Alg | LD | Sub | Ex | T-L | Sil | Sul | Car | Oth | T-M | Ro,max |
|---|---|---|---|---|---|---|---|---|---|---|---|---|---|---|---|---|---|---|---|---|---|---|---|---|---|---|---|---|---|---|---|
| Harlan | 6255 | wc | 3 | 40.2 | 3.4 | 15.2 | 3 | 1.2 | 66 | 3.2 | 3.8 | 3.8 | 0.2 | 0.4 | 0 | 4.6 | 16 | 12.6 | 1 | 2.8 | 0 | 0.2 | 0 | 0 | 16.6 | 0.8 | 0.6 | 0 | 0 | 1.4 | 0.95 |
| 6256 | 1/4 | 3.6 | 39 | 7 | 18.4 | 1.6 | 2.6 | 72.2 | 2.2 | 3 | 1.8 | 0.2 | 0.4 | 0 | 1.6 | 9.2 | 9.2 | 0.2 | 2.4 | 0 | 0.2 | 0 | 0 | 12 | 5.8 | 0.8 | 0 | 0 | 6.6 | 0.91 | |
| 6257 | 2/4 | 0.6 | 26.2 | 1.2 | 29.8 | 0.2 | 0.4 | 58.4 | 4.2 | 4.4 | 4.2 | 2.8 | 0 | 0 | 7.2 | 22.8 | 12.4 | 0 | 4.8 | 0 | 0 | 0 | 0 | 17.2 | 0 | 1.6 | 0 | 0 | 1.6 | 0.96 | |
| 6258 | 3/4 | 2.2 | 59.8 | 1.6 | 8.4 | 0.6 | 1.8 | 74.4 | 2.2 | 1.2 | 1.2 | 0.4 | 0 | 0 | 4.8 | 9.8 | 7.6 | 1.2 | 1.6 | 0 | 0 | 0 | 0.2 | 10.6 | 1.8 | 3.4 | 0 | 0 | 5.2 | 0.93 | |
| 6259 | 4/4 | 2 | 61 | 1.2 | 6.4 | 0.2 | 0.4 | 71.2 | 7 | 4.8 | 1.2 | 0.6 | 0.4 | 0 | 2.6 | 16.6 | 8.8 | 0.6 | 1.6 | 0 | 0 | 0 | 0 | 11 | 0.2 | 1 | 0 | 0 | 1.2 | 0.93 | |
| WA-H1 | 2.2 | 54.4 | 2.2 | 10.7 | 0.5 | 1.1 | 71.1 | 4.8 | 3.6 | 1.5 | 0.7 | 0.3 | 0 | 3.4 | 14.3 | 8.9 | 0.6 | 2.0 | 0 | 0 | 0 | 0.1 | 11.6 | 1.4 | 1.6 | 0.0 | 0.0 | 3.1 | 0.93 | ||
| 6260 | wc | 0.4 | 63.8 | 1.6 | 7.4 | 0.2 | 1.2 | 74.6 | 4.4 | 3.8 | 0.6 | 0.6 | 0.2 | 0 | 4.2 | 13.8 | 6.6 | 1 | 1.4 | 0 | 0 | 0 | 0 | 9 | 1.4 | 1.2 | 0 | 0 | 2.6 | 0.88 | |
| 6270 | wc | 0.6 | 60 | 2.8 | 7 | 0.4 | 1.2 | 72 | 6 | 3.4 | 0.8 | 0.8 | 0 | 0 | 2.6 | 13.6 | 5.4 | 0.6 | 1.8 | 0 | 0 | 0 | 0 | 7.8 | 5 | 1.6 | 0 | 0 | 6.6 | 0.9 | |
| 6271 | wc | 1 | 57.6 | 1.8 | 10.6 | 1 | 1.4 | 73.4 | 4 | 2.4 | 1.2 | 1.8 | 0 | 0 | 1.8 | 11.2 | 7 | 0.2 | 0.8 | 0 | 0.4 | 0 | 0 | 8.4 | 5.8 | 0.8 | 0.4 | 0 | 7 | 0.87 | |
| 6272 | wc | 1 | 52.2 | 0.8 | 7.4 | 2.4 | 1 | 64.8 | 6 | 2.4 | 2.4 | 2.2 | 0.8 | 0 | 3.6 | 17.4 | 10 | 0.2 | 1.8 | 0 | 0 | 0 | 0 | 12 | 4.4 | 1.2 | 0 | 0.2 | 5.8 | 0.9 | |
| 6273 | wc | 3.6 | 35.2 | 7 | 9.4 | 1.2 | 1.6 | 58 | 4.6 | 0.2 | 1.6 | 0.8 | 0.4 | 0 | 2 | 9.6 | 4 | 1 | 1.8 | 0 | 0.4 | 0 | 0.2 | 7.4 | 23.4 | 1.4 | 0 | 0.2 | 25 | 0.89 | |
| 6378 | wc | 1.2 | 58.2 | 1 | 8 | 2.4 | 4 | 74.8 | 3.6 | 2 | 2.8 | 1 | 0.6 | 0 | 1.4 | 11.4 | 8.8 | 1.2 | 0.6 | 0 | 0.2 | 0 | 0 | 10.8 | 2.4 | 0.4 | 0 | 0.2 | 3 | 0.95 | |
| 6379 | 1/9 | 2.8 | 25 | 0.6 | 13 | 1.4 | 2.4 | 45.2 | 5.8 | 13.4 | 4.4 | 9 | 0.6 | 0 | 7.4 | 40.6 | 7.2 | 1 | 2.2 | 0 | 0 | 0 | 0 | 10.4 | 3.4 | 0.2 | 0 | 0.2 | 3.8 | 0.93 | |
| 6380 | 2/9 | 2.8 | 22.2 | 3.2 | 9.2 | 0.6 | 1.8 | 39.8 | 6.8 | 7.8 | 5.4 | 3.8 | 1.8 | 0 | 7.8 | 33.4 | 9.8 | 0 | 8.4 | 0 | 0 | 0 | 0 | 18.2 | 7.8 | 0.2 | 0 | 0.6 | 8.6 | 0.92 | |
| 6381 | 3/9 | 1 | 55.6 | 1.2 | 7.4 | 1.6 | 3.8 | 70.6 | 2.4 | 3.4 | 3.2 | 1 | 0.6 | 0 | 3 | 13.6 | 8.2 | 1.6 | 1.4 | 0 | 0 | 0 | 0 | 11.2 | 2.2 | 2 | 0 | 0.4 | 4.6 | 0.91 | |
| 6382 | 4/9 | 2 | 46.4 | 2 | 11.2 | 1 | 2 | 64.6 | 2 | 4.6 | 2.6 | 2 | 0.4 | 0 | 4.4 | 16 | 14 | 0.6 | 3.4 | 0 | 0 | 0 | 0 | 18 | 0.6 | 0.4 | 0 | 0.4 | 1.4 | 0.92 | |
| 6383 | 5/9 | 2.8 | 57.8 | 0 | 10 | 1.4 | 1.2 | 73.2 | 5.2 | 3.6 | 5 | 0.4 | 0 | 0 | 2.8 | 17 | 7.2 | 0.4 | 0.6 | 0.4 | 0 | 0 | 0 | 8.6 | 0.6 | 0.6 | 0 | 0 | 1.2 | 0.93 | |
| 6384 | 6/9 | 3.6 | 38.4 | 6.4 | 12.2 | 1.2 | 2.2 | 64 | 0.4 | 2.6 | 2.2 | 0 | 0.4 | 0 | 3.8 | 9.4 | 5.4 | 0.8 | 2 | 0 | 0 | 0 | 0 | 8.2 | 13.4 | 5 | 0 | 0 | 18.4 | 0.91 | |
| 6385 | 7/9 | 4.2 | 13 | 3.4 | 13.2 | 0.6 | 1.8 | 36.2 | 11.6 | 14.8 | 1.8 | 3.2 | 0.6 | 0 | 13 | 45 | 14 | 0.2 | 2.8 | 0 | 0 | 0 | 0 | 17 | 1.2 | 0.6 | 0 | 0 | 1.8 | 0.92 | |
| 6386 | 8/9 | 1 | 60 | 0.2 | 16.4 | 1 | 1 | 79.6 | 2 | 0.2 | 2.6 | 0 | 0 | 0 | 1.4 | 6.2 | 8 | 1.2 | 2.8 | 0 | 0 | 0 | 0 | 12 | 1.8 | 0.2 | 0.2 | 0 | 2.2 | 0.95 | |
| 6387 | 9/9 | 1.2 | 59.8 | 1.2 | 9.2 | 0.8 | 0.8 | 73 | 3.8 | 4 | 3.4 | 0.2 | 0 | 0 | 2.2 | 13.6 | 8.2 | 0.4 | 1.6 | 0 | 0.4 | 0 | 0 | 10.6 | 1.8 | 1 | 0 | 0 | 2.8 | 0.95 | |
| WA-H2 | 1.9 | 50.6 | 1.2 | 11.1 | 1.2 | 1.7 | 67.6 | 3.8 | 4.5 | 3.6 | 1.6 | 0.3 | 0 | 3.5 | 17.3 | 8.3 | 0.8 | 2.1 | 0.1 | 0.1 | 0 | 0 | 11.3 | 2.6 | 1.0 | 0 | 0.1 | 3.7 | 0.93 | ||
| 6392 | wc | 4.4 | 51.8 | 1 | 11 | 1.2 | 0.8 | 70.2 | 3.2 | 4.6 | 1.4 | 1 | 0 | 0.2 | 4 | 14.4 | 8 | 0 | 1 | 0 | 0.4 | 0 | 0 | 9.4 | 5 | 1 | 0 | 0 | 6 | 0.85 | |
| 6393 | 1/11 | 0.8 | 22.8 | 3.4 | 23.2 | 0.8 | 1.4 | 52.4 | 3.4 | 11.2 | 2.6 | 5 | 1.8 | 0 | 7.2 | 31.2 | 10.4 | 0 | 0.8 | 0 | 0.6 | 0 | 0 | 11.8 | 4.6 | 0 | 0 | 0 | 4.6 | 0.82 | |
| 6394 | 2/11 | 1.2 | 25 | 1 | 18.8 | 0.2 | 0.2 | 46.4 | 4.4 | 13.8 | 3.4 | 1.8 | 1 | 0 | 9.6 | 34 | 14 | 0.4 | 3.4 | 0 | 0 | 0 | 0 | 17.8 | 1.8 | 0 | 0 | 0 | 1.8 | 0.83 | |
| 6395 | 3/11 | 2.2 | 57.6 | 0.8 | 10.8 | 1.2 | 1.4 | 74 | 2.6 | 5 | 2 | 0.4 | 0 | 0 | 3.4 | 13.4 | 6.4 | 3 | 1.2 | 0 | 0 | 0 | 0.2 | 10.8 | 0.8 | 0.6 | 0.4 | 0 | 1.8 | 0.82 | |
| 6396 | 4/11 | 6.4 | 46.8 | 7 | 8.8 | 2.4 | 0.4 | 71.8 | 4 | 3.4 | 1.8 | 0.2 | 0 | 0 | 1.2 | 10.6 | 2.4 | 1 | 1.6 | 0 | 0 | 0 | 0 | 5 | 9.4 | 2.8 | 0.4 | 0 | 12.6 | 0.78 | |
| 6397 | 5/11 | 1 | 51.6 | 0.2 | 10.2 | 0.2 | 2.2 | 65.4 | 3 | 4.8 | 1.8 | 2.2 | 0.4 | 0 | 5.6 | 17.8 | 10.4 | 1 | 3.2 | 0.4 | 0.8 | 0 | 0 | 15.8 | 0.4 | 0.2 | 0.2 | 0.2 | 1 | 0.81 | |
| 6398 | 6/11 | 0.2 | 16.2 | 0.4 | 12.8 | 1 | 0.6 | 31.2 | 2.2 | 7.4 | 3.4 | 4.2 | 0.4 | 0 | 14 | 31.6 | 29.2 | 0 | 7.4 | 0 | 0 | 0 | 0 | 36.6 | 0.2 | 0.4 | 0 | 0 | 0.6 | 0.86 | |
| 6399 | 7/11 | 4 | 58.6 | 0 | 17.6 | 0.2 | 1.2 | 81.6 | 3.2 | 3.2 | 2 | 0.2 | 0 | 0 | 1.6 | 10.2 | 5.2 | 0.6 | 0.6 | 0 | 0 | 0 | 0 | 6.4 | 0.8 | 1 | 0 | 0 | 1.8 | 0.8 | |
| 6400 | 8/11 | 5.4 | 26.2 | 5.8 | 10.2 | 1.6 | 0.4 | 49.6 | 2.6 | 3.2 | 0.2 | 0 | 0 | 0 | 1.6 | 7.6 | 2.4 | 0 | 0.2 | 0 | 0 | 0 | 0 | 2.6 | 35.4 | 4.8 | 0 | 0 | 40.2 | 0.78 | |
| 6401 | 9/11 | 1.8 | 47.6 | 0.8 | 7.8 | 0 | 0.8 | 58.8 | 4.4 | 2.8 | 0.4 | 0.4 | 0 | 0 | 9.8 | 17.8 | 13 | 1.2 | 2 | 0 | 0.8 | 0 | 0 | 17 | 6.4 | 0 | 0 | 0 | 6.4 | 0.82 | |
| 6402 | 10/11 | 2.4 | 66.2 | 0.4 | 5.2 | 0.2 | 2.4 | 76.8 | 0.6 | 0.2 | 1.6 | 0 | 0.2 | 0 | 1.8 | 4.4 | 11 | 2 | 1.8 | 0 | 1.6 | 0 | 0 | 16.4 | 2.2 | 0 | 0.2 | 0 | 2.4 | 0.87 | |
| 6403 | 11/11 | 2.4 | 64.2 | 0.4 | 9.8 | 0 | 2.2 | 79 | 3.8 | 2.2 | 2.2 | 0 | 0.4 | 0 | 1.4 | 10 | 7.8 | 1 | 1 | 0 | 0.6 | 0 | 0 | 10.4 | 0.2 | 0.2 | 0.2 | 0 | 0.6 | 0.86 | |
| WA-H3 | 2.7 | 51.4 | 1.4 | 12.7 | 0.5 | 1.6 | 70.2 | 2.8 | 4.2 | 1.9 | 1.0 | 0.4 | 0 | 3.1 | 13.5 | 8.1 | 1.0 | 1.3 | 0 | 0.5 | 0 | 0 | 11.0 | 4.4 | 0.8 | 0.1 | 0.0 | 5.3 | 0.83 | ||
| WA-H | 2.0 | 52.3 | 2.2 | 10.0 | 1.3 | 1.5 | 69.3 | 4.2 | 3.2 | 2.0 | 1.1 | 0.3 | 0 | 3.1 | 13.9 | 8.0 | 0.7 | 1.6 | 0 | 0.2 | 0 | 0 | 10.5 | 5.1 | 1.0 | 0.1 | 0.1 | 6.3 | 0.90 | ||
| Kellioka | 6352 | wc | 1.0 | 54.4 | 1.4 | 15.4 | 0.6 | 0.6 | 73.4 | 4.0 | 4.6 | 2.0 | 1.2 | 0.4 | 0 | 4.0 | 16.2 | 7.4 | 0.8 | 0.8 | 0 | 0 | 0 | 0 | 9.0 | 1.4 | 0 | 0 | 0 | 1.4 | 0.94 |
| 6353 | 1/6 | 0.0 | 69.4 | 0.8 | 10.2 | 0.6 | 1.6 | 82.6 | 1.4 | 0.8 | 3.2 | 0.0 | 0.2 | 0 | 0.8 | 6.4 | 7.0 | 1.2 | 0.2 | 0 | 0 | 0 | 0 | 8.4 | 0.8 | 1.8 | 0 | 0 | 2.6 | 0.94 | |
| 6354 | 2/6 | 1.4 | 57.9 | 0.8 | 13.4 | 0.4 | 1.4 | 75.4 | 3.2 | 3.8 | 2.8 | 0.2 | 0.0 | 0 | 2.6 | 12.6 | 7.8 | 1.0 | 1.0 | 0 | 0 | 0 | 0 | 9.8 | 0.6 | 1.6 | 0 | 0 | 2.2 | 0.94 | |
| 6355 | 3/6 | 0.6 | 44.6 | 0.0 | 17.2 | 0.4 | 0.6 | 63.4 | 5.2 | 11.6 | 2.0 | 2.4 | 0.0 | 0 | 4.6 | 25.8 | 9.8 | 0.2 | 0.6 | 0 | 0 | 0 | 0 | 10.6 | 0.2 | 0 | 0 | 0 | 0.2 | 0.93 | |
| 6356 | 4/6 | 0.8 | 47.8 | 0.0 | 14.2 | 0.4 | 1.0 | 64.2 | 4.8 | 6.4 | 3.6 | 2.2 | 0.2 | 0 | 6.6 | 23.8 | 7.8 | 1.0 | 2.2 | 0 | 0.6 | 0 | 0 | 11.6 | 0.2 | 0 | 0.2 | 0 | 0.4 | 0.92 | |
| 6357 | 5/6 | 4.0 | 22.2 | 0.8 | 9.4 | 0.8 | 3.4 | 40.6 | 7.0 | 12.8 | 5.2 | 6.4 | 1.6 | 0 | 11.6 | 44.6 | 9.8 | 0.0 | 4.4 | 0 | 0.4 | 0 | 0 | 14.6 | 0.0 | 0.0 | 0.0 | 0.2 | 0.2 | 0.96 | |
| 6358 | 6/6 | 3.2 | 58.4 | 2.2 | 3.8 | 0.0 | 1.0 | 68.6 | 3.0 | 2.4 | 4.6 | 0.4 | 0.0 | 0 | 2.2 | 12.6 | 6.6 | 1.0 | 2.4 | 0 | 0.2 | 0 | 0 | 10.2 | 8.2 | 0.4 | 0.0 | 0.0 | 8.6 | 0.91 | |
| WA-K1 | 1.8 | 49.6 | 0.8 | 10.9 | 0.5 | 1.7 | 65.4 | 4.1 | 6.1 | 3.7 | 2.1 | 0.4 | 0 | 4.9 | 21.3 | 8.1 | 0.7 | 1.9 | 0 | 0.2 | 0 | 0 | 11.0 | 1.5 | 0.7 | 0 | 0 | 2.3 | 0.94 | ||
| 6359 | wc | 2.2 | 50.6 | 0.6 | 7.8 | 0.0 | 1.6 | 62.8 | 3.2 | 6.6 | 3.8 | 2.6 | 0.0 | 0 | 6.0 | 22.2 | 10.2 | 0.0 | 2.8 | 0 | 0.0 | 0 | 0 | 13.0 | 1.8 | 0.2 | 0 | 0 | 2.0 | 0.90 | |
| 6360 | wc | 1.2 | 55.8 | 1.6 | 8.6 | 0.4 | 1.2 | 68.8 | 6.0 | 4.2 | 4.6 | 2.2 | 0.2 | 0 | 5.2 | 22.4 | 6.2 | 0.2 | 1.0 | 0 | 0.2 | 0 | 0.2 | 7.8 | 0.8 | 0.2 | 0 | 0 | 1.0 | 0.96 | |
| 6361 | 1/5 | 3.4 | 65.2 | 0.8 | 8.4 | 0.2 | 2.0 | 80.0 | 2.2 | 1.2 | 7.0 | 0.0 | 0.2 | 0 | 1.0 | 11.6 | 3.6 | 0.6 | 0.4 | 0.2 | 0.4 | 0 | 0 | 5.2 | 1.6 | 1.2 | 0.4 | 0 | 3.2 | 0.95 | |
| 6362 | 2/5 | 1.2 | 48.6 | 1.6 | 16.2 | 0.2 | 2.0 | 69.8 | 3.0 | 4.2 | 3.4 | 0.0 | 0.4 | 0 | 4.6 | 15.6 | 10.8 | 0.4 | 1.0 | 0 | 0.6 | 0 | 0 | 12.8 | 1.6 | 0.2 | 0.0 | 0 | 1.8 | 0.94 | |
| 6363 | 3/5 | 0.6 | 43.4 | 0.0 | 18.2 | 0.6 | 0.6 | 63.4 | 3.4 | 8.4 | 5.6 | 1.0 | 0.0 | 0 | 6.0 | 24.4 | 8.8 | 0.0 | 1.4 | 0 | 0.6 | 0 | 0 | 10.8 | 0.4 | 0.4 | 0.6 | 0 | 1.4 | 0.96 | |
| 6364 | 4/5 | 2.6 | 26.8 | 0.2 | 15.2 | 0.8 | 2.0 | 47.6 | 5.4 | 16.0 | 5.0 | 4.6 | 0.6 | 0 | 10.6 | 42.2 | 6.6 | 0.2 | 2.0 | 0 | 0.8 | 0 | 0 | 9.6 | 0.6 | 0 | 0 | 0 | 0.6 | 0.95 | |
| 6365 | 5/5 | 4.4 | 49.8 | 3.4 | 12.2 | 1.4 | 4.4 | 75.6 | 1.6 | 1.8 | 4.0 | 0.2 | 0.6 | 0 | 1.2 | 9.4 | 4.8 | 1.6 | 1.0 | 1.2 | 0.8 | 0 | 0 | 9.4 | 3.0 | 2.6 | 0 | 0 | 5.6 | 0.94 | |
| WA-K2 | WA | 2.7 | 42.7 | 1.1 | 13.9 | 0.7 | 2.3 | 63.4 | 3.6 | 8.3 | 5.0 | 1.9 | 0.4 | 0 | 5.8 | 25.0 | 6.6 | 0.5 | 1.3 | 0.3 | 0.7 | 0 | 0 | 9.4 | 1.3 | 0.8 | 0.1 | 0 | 2.2 | 0.95 | |
| WA-K | 1.8 | 50.6 | 1.1 | 11.3 | 0.4 | 1.5 | 66.8 | 4.2 | 6.0 | 3.8 | 2.0 | 0.3 | 0 | 5.2 | 21.4 | 7.7 | 0.5 | 1.6 | 0.1 | 0.2 | 0 | 0 | 10.0 | 1.4 | 0.4 | 0 | 0 | 1.8 | 0.94 | ||
| Darby | 6261 | wc | 6.8 | 54.2 | 0 | 11.2 | 1.8 | 3.8 | 77.8 | 4.2 | 2 | 2.4 | 0.2 | 0 | 0 | 3.4 | 12.2 | 6.8 | 1.6 | 0.8 | 0 | 0.2 | 0 | 0 | 9.4 | 0.2 | 0.2 | 0.2 | 0 | 0.6 | 0.93 |
| 6262 | 1/4 | 1.6 | 40.2 | 0.2 | 16.6 | 0.4 | 1.6 | 60.6 | 4.2 | 8 | 4 | 0.2 | 0.2 | 0 | 7 | 23.6 | 12 | 0.6 | 2.4 | 0 | 0.4 | 0 | 0 | 15.4 | 0 | 0.4 | 0 | 0 | 0.4 | 0.86 | |
| 6263 | 2/4 | 4 | 55.4 | 0 | 11.2 | 0.4 | 2.4 | 73.4 | 9 | 2.8 | 4.8 | 0 | 0 | 0 | 3.6 | 20.2 | 5.6 | 0 | 0.6 | 0 | 0.2 | 0 | 0 | 6.4 | 0 | 0 | 0 | 0 | 0 | 0.9 | |
| 6264 | 3/4 | 2.8 | 57.2 | 0.4 | 13.2 | 0.2 | 4 | 77.8 | 4.2 | 3 | 0.4 | 0 | 0 | 0 | 2.2 | 9.8 | 9.2 | 1 | 1.8 | 0 | 0.2 | 0 | 0.2 | 12.4 | 0 | 0 | 0 | 0 | 0 | 0.93 | |
| 6265 | 4/4 | 3.6 | 64.2 | 0 | 5.4 | 0.8 | 8.8 | 82.8 | 2.4 | 0.4 | 2.2 | 0 | 0 | 0 | 0.8 | 5.8 | 7.8 | 1.2 | 1.2 | 0 | 0.8 | 0 | 0 | 11 | 0 | 0.4 | 0 | 0 | 0.4 | 0.92 | |
| WA-D1 | 2.8 | 55.8 | 0.3 | 12.1 | 0.4 | 4.6 | 76.0 | 3.8 | 3.3 | 1.4 | 0 | 0 | 0 | 2.7 | 11.3 | 9.4 | 1.0 | 1.8 | 0.0 | 0.4 | 0 | 0.1 | 12.6 | 0.0 | 0.2 | 0 | 0 | 0.2 | 0.92 | ||
| 6266 | wc | 1 | 64.6 | 0.2 | 9.2 | 0 | 3.2 | 78.2 | 1.4 | 4.4 | 0.2 | 1 | 0 | 0 | 3.4 | 10.4 | 6 | 1.8 | 2.4 | 0 | 0.4 | 0 | 0 | 10.6 | 0.8 | 0 | 0 | 0 | 0.8 | 0.93 | |
| 6267 | wc | 2 | 57.6 | 0.4 | 9.2 | 0.2 | 2.2 | 71.6 | 2.4 | 5.2 | 2.2 | 3.2 | 0 | 0 | 4 | 17 | 7 | 0.8 | 1 | 0 | 0 | 0 | 0 | 8.8 | 1.8 | 0.8 | 0 | 0 | 2.6 | 0.92 | |
| 6268 | wc | 7.6 | 49.2 | 0.6 | 11.8 | 0.4 | 2.2 | 71.8 | 2.4 | 9.4 | 0.8 | 0.6 | 0.4 | 0 | 4.6 | 18.2 | 7 | 0.4 | 1.2 | 0 | 0 | 0 | 0 | 8.6 | 1.4 | 0 | 0 | 0 | 1.4 | 0.92 | |
| 6269 | wc | 1 | 55.8 | 0.6 | 13.6 | 0 | 2.2 | 73.2 | 2.6 | 5.8 | 0.8 | 1.4 | 0 | 0 | 2 | 12.6 | 9.6 | 0.8 | 1.8 | 0 | 0.2 | 0 | 0 | 12.4 | 1.6 | 0.2 | 0 | 0 | 1.8 | 0.9 | |
| 6366 | wc | 5.4 | 48.8 | 0 | 11.8 | 0.2 | 2.6 | 68.8 | 2 | 10 | 3 | 1.2 | 0.2 | 0 | 4 | 20.4 | 6.6 | 0.6 | 3 | 0 | 0.4 | 0 | 0 | 10.6 | 0.2 | 0 | 0 | 0 | 0.2 | 0.99 | |
| 6367 | 1/5 | 0.4 | 17.4 | 1.2 | 15 | 0 | 1.6 | 35.6 | 1.6 | 25.8 | 2.4 | 5.6 | 0 | 0 | 4.6 | 40 | 14.8 | 0 | 7.2 | 0 | 0.2 | 0 | 0 | 22.2 | 2 | 0 | 0.2 | 0 | 2.2 | 0.95 | |
| 6368 | 2/5 | 0.8 | 41.8 | 0 | 18 | 0 | 0.4 | 61 | 0.2 | 12.8 | 1.6 | 0.6 | 0.2 | 0 | 9 | 24.4 | 9.4 | 0 | 4.8 | 0 | 0.2 | 0 | 0 | 14.4 | 0.2 | 0 | 0 | 0 | 0.2 | 0.95 | |
| 6369 | 3/5 | 3.8 | 38 | 0.6 | 10.6 | 0 | 2.6 | 55.6 | 5.4 | 10.4 | 1.4 | 0.8 | 0.6 | 0 | 5.4 | 24 | 12.8 | 0.4 | 5.4 | 0 | 1.6 | 0 | 0 | 20.2 | 0.2 | 0 | 0 | 0 | 0.2 | 0.93 | |
| 6370 | 4/5 | 4.4 | 65 | 0 | 10 | 0.4 | 0 | 79.8 | 2.4 | 2.6 | 0.4 | 0 | 0.4 | 0 | 2.8 | 8.6 | 7.6 | 1 | 1 | 0 | 2 | 0 | 0 | 11.6 | 0 | 0 | 0 | 0 | 0 | 1 | |
| 6371 | 5/5 | 5.6 | 69 | 0.6 | 6.6 | 0.4 | 1.4 | 83.6 | 2.6 | 2 | 3.2 | 0 | 0 | 0 | 2.6 | 10.4 | 2.4 | 1.2 | 0.6 | 0 | 1 | 0 | 0 | 5.2 | 0.8 | 0 | 0 | 0 | 0.8 | 0.97 | |
| WA-D2 | 3.8 | 58.0 | 0.2 | 11.0 | 0.3 | 0.6 | 73.9 | 2.2 | 5.7 | 1.3 | 0.4 | 0.3 | 0 | 4.1 | 14.0 | 7.6 | 0.8 | 2.1 | 0 | 1.4 | 0 | 0 | 11.9 | 0.3 | 0 | 0 | 0 | 0.3 | 0.98 | ||
| WA-D | 3.8 | 55.5 | 0.3 | 11.2 | 0.4 | 2.7 | 73.9 | 2.6 | 5.7 | 1.5 | 1.0 | 0.1 | 0 | 3.5 | 14.5 | 7.5 | 1.0 | 1.8 | 0 | 0.4 | 0 | 0 | 10.6 | 0.8 | 0.2 | 0 | 0 | 1.0 | 0.94 |

| Coal | Sample | Bench | SiO2 | TiO2 | Al2O3 | Fe2O3 | MgO | CaO | Na2O | K2O | P2O5 | Li | Be | Cl | Sc | V | Cr | Co | Ni | Cu | Zn | Ga | Ge |
|---|---|---|---|---|---|---|---|---|---|---|---|---|---|---|---|---|---|---|---|---|---|---|---|
| Harlan | 6255 | wc | 3.82 | 0.123 | 2.67 | 0.58 | 0.073 | 0.12 | 0.001 | 0.254 | 0.009 | 17.2 | 1.58 | 0.02 | 1.69 | 26.2 | 10.8 | 6.4 | 10.8 | 22.7 | 7.59 | 3.79 | 0.59 |
| 6256 | 1/4 | 9.99 | 0.185 | 6.09 | 1.1 | 0.285 | 0.08 | 0.044 | 0.883 | 0.019 | 36.6 | 2.16 | 0.02 | 3 | 75.7 | 26.7 | 8.69 | 22 | 43.3 | 35.5 | 8.95 | 1.44 | |
| 6257 | 2/4 | 2.47 | 0.096 | 1.74 | 1.35 | 0.036 | 0.17 | bdl | 0.082 | 0.006 | 8.69 | 0.65 | 0.02 | 0.94 | 15.5 | 7.54 | 2.15 | 8.25 | 13.4 | 4.2 | 2.14 | 0.25 | |
| 6258 | 3/4 | 4.99 | 0.144 | 3.79 | 1.75 | 0.113 | 0.1 | 0.014 | 0.442 | 0.013 | 29.4 | 0.62 | 0.03 | 1.55 | 37.5 | 14.7 | 3.28 | 12.4 | 27.5 | 8.3 | 5.33 | 0.42 | |
| 6259 | 4/4 | 4.15 | 0.136 | 3.04 | 0.56 | 0.081 | 0.15 | 0.012 | 0.286 | 0.01 | 20.6 | 2.68 | bdl | 1.75 | 34.0 | 12.7 | 10.7 | 15.4 | 30.0 | 9.7 | 4.85 | 1.05 | |
| WA-H1 | 5.09 | 0.142 | 3.575 | 1.011 | 0.116 | 0.13 | 0.016 | 0.397 | 0.012 | 24.2 | 1.9 | 0.02 | 1.82 | 39.5 | 14.8 | 7.8 | 15 | 29.9 | 12.7 | 5.35 | 0.88 | ||
| 6260 | wc | 4.34 | 0.129 | 3.25 | 0.59 | 0.106 | 0.18 | 0.028 | 0.277 | 0.011 | 19.8 | 3.59 | bdl | 1.88 | 35.7 | 13.2 | 9.06 | 16.1 | 23.9 | 10.7 | 5.0 | 2.14 | |
| 6270 | wc | 6.62 | 0.164 | 4.61 | 0.73 | 0.269 | 0.57 | 0.12 | 0.536 | 0.017 | 26.8 | 4.18 | 0.02 | 1.19 | 43.3 | 17.8 | 23.7 | 25 | 35.4 | 19.5 | 6.85 | 1.39 | |
| 6271 | wc | 5.02 | 0.122 | 3.32 | 1.36 | 0.169 | 0.33 | 0.07 | 0.377 | 0.016 | 19.1 | 1.76 | bdl | 3.11 | 32.4 | 16 | 44.4 | 45.3 | 44.9 | 21.1 | 5.05 | 0.89 | |
| 6272 | wc | 7.18 | 0.172 | 4.75 | 1.1 | 0.276 | 0.43 | 0.131 | 0.552 | 0.017 | 27.3 | 1.59 | 0.02 | 3.31 | 34.1 | 16.9 | 19.9 | 26.3 | 29.8 | 18 | 6.83 | 1.28 | |
| 6273 | wc | 17.6 | 0.388 | 11.4 | 3.4 | 0.854 | 0.51 | 0.297 | 1.66 | 0.037 | 64.5 | 4.13 | 0.02 | 8.05 | 112 | 45.4 | 16.6 | 32.7 | 74.9 | 61.3 | 17.5 | 2.35 | |
| 6378 | wc | 4.63 | 0.115 | 2.9 | 0.77 | 0.127 | 0.3 | 0.052 | 0.31 | 0.017 | 16.7 | 0.86 | bdl | 0.38 | 25.6 | 10.8 | 2.91 | 7.62 | 19.0 | 10.1 | 3.78 | 1.46 | |
| 6379 | 1/9 | 5.53 | 0.183 | 2.76 | 0.44 | 0.068 | 0.18 | bdl | 0.16 | 0.056 | 16.6 | 2.26 | bdl | 3.46 | 30.7 | 14.3 | 5.39 | 8.4 | 28.2 | 9.16 | 5.58 | 5.05 | |
| 6380 | 2/9 | 19.7 | 0.466 | 7.46 | 0.57 | 0.22 | 0.01 | 0.033 | 1.032 | 0.051 | 27.0 | 1.29 | bdl | 1.5 | 51.1 | 32.3 | 3.16 | 7.35 | 25.7 | 10.9 | 10.7 | 0.85 | |
| 6381 | 3/9 | 4.03 | 0.093 | 3.12 | 0.91 | 0.088 | 0.22 | 0.063 | 0.328 | 0.019 | 17.0 | 0.47 | bdl | 1.11 | 26.4 | 11.4 | 3.18 | 7.42 | 22.8 | 8.46 | 4.01 | 0.39 | |
| 6382 | 4/9 | 2.31 | 0.094 | 1.93 | 0.31 | 0.039 | 0.14 | 0.041 | 0.08 | 0.034 | 10.9 | 0.47 | bdl | 1.33 | 16.6 | 7.62 | 1.77 | 6.04 | 14.8 | 3.75 | 2.41 | 0.29 | |
| 6383 | 5/9 | 1.96 | 0.045 | 1.67 | 1.27 | 0.051 | 0.35 | 0.033 | 0.077 | 0.042 | 5.56 | 1.82 | bdl | 1.42 | 14 | 6.51 | 1.86 | 4.41 | 6.78 | 7.64 | 3.55 | 0.33 | |
| 6384 | 6/9 | 12.1 | 0.243 | 7.58 | 2.46 | 0.355 | 0.08 | 0.071 | 0.936 | 0.015 | 36.4 | 2.01 | bdl | 7.22 | 63.8 | 37.0 | 24.6 | 83.4 | 95.8 | 31.9 | 9.19 | 1.43 | |
| 6385 | 7/9 | 10.3 | 0.412 | 5.39 | 0.38 | 0.124 | 0.15 | 0.017 | 0.257 | 0.01 | 2.25 | 0.67 | bdl | 4.42 | nd | nd | nd | nd | nd | nd | 3.99 | 0.44 | |
| 6386 | 8/9 | 1.32 | 0.03 | 1.19 | 0.44 | 0.069 | 0.22 | 0.06 | 0.077 | 0.002 | 6.42 | 0.32 | bdl | 0.82 | 7.21 | nd | 0.14 | nd | 0.59 | 4.03 | 1.28 | 0.16 | |
| 6387 | 9/9 | 3.41 | 0.084 | 2.44 | 1.02 | 0.12 | 0.3 | 0.045 | 0.273 | 0.006 | 19.3 | 1.38 | 0.02 | 1.83 | 22.8 | 9.56 | 3.45 | 8.49 | 18.9 | 11.4 | 3.49 | 1.96 | |
| WA-H2 | 4.32 | 0.111 | 2.713 | 0.895 | 0.099 | 0.24 | 0.043 | 0.252 | 0.025 | 14.2 | 1.23 | bdl | 1.94 | 22.5 | 10.4 | 3.71 | 9.78 | 18.8 | 9.16 | 4.01 | 1.24 | ||
| 6392 | wc | 8.77 | 0.177 | 5.3 | 1.11 | 0.296 | 0.23 | 0.194 | 0.68 | 0.012 | bdl | bdl | bdl | nd | nd | nd | nd | nd | nd | nd | nd | nd | |
| 6393 | 1/11 | 4.03 | 0.128 | 2.9 | 0.24 | 0.056 | 0.09 | 0.068 | 0.138 | 0.006 | 23.2 | 10.37 | bdl | 1.29 | 16.9 | 9.69 | 4.83 | 8.65 | 20.3 | 5.2 | 5.19 | 5.68 | |
| 6394 | 2/11 | 4.22 | 0.068 | 3.2 | 0.22 | 0.042 | 0.11 | 0.05 | 0.115 | 0.01 | 24.5 | 1.05 | bdl | 1.31 | 27.2 | 12.1 | 3.53 | 9.59 | 14.6 | 2.97 | 4.91 | 0.86 | |
| 6395 | 3/11 | 2.60 | 0.053 | 2.14 | 0.67 | 0.057 | 0.2 | 0.068 | 0.137 | 0.007 | 15.3 | 0.48 | bdl | 0.97 | 23.6 | 7.19 | 4.03 | 9.41 | 21.4 | 6.46 | 3.18 | 0.49 | |
| 6396 | 4/11 | 12.1 | 0.318 | 9.32 | 1.06 | 0.483 | 0.81 | 0.405 | 1.521 | 0.022 | 48.6 | 0.96 | bdl | 1.81 | 83.6 | 35.2 | 6.02 | 17.6 | 62.4 | 38.7 | 11.3 | 0.75 | |
| 6397 | 5/11 | 2.15 | 0.038 | 0.67 | 1.44 | 0.048 | 0.29 | 0.011 | 0.101 | 0.003 | 2.36 | 0.25 | bdl | 0.73 | 23.7 | 4.66 | 1.37 | 4.32 | 3.1 | 9.11 | 0.94 | 2.12 | |
| 6398 | 6/11 | 1.96 | 0.04 | 0.65 | 2.41 | 0.037 | 0.32 | 0.001 | 0.083 | 0.002 | 12.1 | 0.33 | bdl | 0.81 | 18.3 | 8.64 | 8.47 | 7.86 | 14.1 | 3.93 | 2.8 | 2.06 | |
| 6399 | 7/11 | 1.27 | 0.027 | 0.45 | 2.04 | 0.025 | 0.38 | bdl | 0.056 | 0.009 | 9.79 | 0.77 | bdl | 0.71 | 11.4 | 6.71 | 0.4 | 1.22 | 7.38 | 2.85 | 1.89 | 1.7 | |
| 6400 | 8/11 | 21.1 | 0.37 | 6.96 | 21.14 | 0.408 | 5.56 | 0.102 | 0.892 | 0.032 | 29.1 | 3.03 | bdl | 6.95 | 161 | 56.2 | 21.5 | 57.1 | 112 | 73.2 | 10 | 13.22 | |
| 6401 | 9/11 | 10.3 | 0.238 | 7.7 | 2.09 | 0.448 | 1.42 | 0.605 | 0.62 | 0.018 | bdl | bdl | bdl | nd | 55.1 | 23.1 | 7.4 | 25 | 32.4 | 14.3 | nd | nd | |
| 6402 | 10/11 | 1.99 | 0.047 | 1.35 | 0.7 | 0.087 | 0.12 | 0.048 | 0.177 | 0.004 | 11.7 | 0.95 | bdl | 0.84 | 14.8 | 5.7 | 2.75 | 6.88 | 16.2 | 16.1 | 2.03 | 0.27 | |
| 6403 | 11/11 | 2.59 | 0.062 | 1.75 | 0.92 | 0.111 | 0.15 | 0.064 | 0.23 | 0.005 | 15.3 | 1.19 | bdl | 1.02 | 18.5 | 7.28 | 3.38 | 8.66 | 20.1 | 18.8 | 2.56 | 0.35 | |
| WA-H3 | 4.13 | 0.09 | 2.174 | 2.616 | 0.104 | 0.64 | 0.057 | 0.237 | 0.008 | 15.9 | 2.31 | bdl | 1.43 | 30.2 | 11.735 | 4.38 | 10.8 | 24.1 | 15.8 | 3.51 | 2.51 | ||
| WA-H | 6.50 | 0.157 | 4.24 | 1.287 | 0.226 | 0.33 | 0.092 | 0.503 | 0.016 | 22.3 | 2.1 | bdl | 2.25 | 36.5 | 15.245 | 12.6 | 18.1 | 29.4 | 16.9 | 5.61 | 1.34 | ||
| Kellioka | 6352 | wc | 2.80 | 0.091 | 1.54 | 0.5 | 0.079 | 0.23 | 0.04 | 0.138 | 0.043 | 6.27 | 1.31 | nd | 1.7 | 13.1 | 7 | 5.26 | 9.26 | 16.3 | 7.64 | 2.72 | 1.58 |
| 6353 | 1/6 | 1.42 | 0.036 | 0.92 | 0.54 | 0.034 | 0.07 | 0.02 | 0.097 | 0.002 | 3.32 | 1.34 | 0.03 | 1.29 | 7.34 | 3.56 | 2.12 | 6.26 | 7.37 | 2.7 | 1.83 | 0.22 | |
| 6354 | 2/6 | 1.25 | 0.036 | 0.84 | 0.88 | 0.031 | 0.09 | 0.026 | 0.07 | 0.002 | 2.81 | 0.22 | 0.04 | 0.76 | 6.51 | 3.45 | 1.85 | 6.85 | 10.9 | 1.78 | 1.11 | 0.14 | |
| 6355 | 3/6 | 0.71 | 0.028 | 0.58 | 0.23 | 0.033 | 0.67 | 0.033 | 0.004 | 0.002 | 1.01 | 0.12 | 0.03 | 0.44 | 2.75 | 1.93 | 1.77 | 6.79 | 9.11 | 1.67 | 0.55 | 0.08 | |
| 6356 | 4/6 | 0.83 | 0.039 | 0.63 | 0.26 | 0.031 | 0.17 | 0.033 | 0.008 | 0.001 | 1.61 | 0.2 | 0.03 | 0.75 | 4.42 | 3.31 | 4.37 | 10.6 | 18.4 | 1.88 | 1.07 | 0.15 | |
| 6357 | 5/6 | 1.97 | 0.092 | 1.03 | 0.25 | 0.061 | 0.37 | 0.037 | 0.005 | 0.005 | 4.1 | 0.44 | 0.03 | 1.43 | 7.67 | 5.16 | 5.44 | 8.47 | 21.5 | 3.7 | 1.09 | 0.11 | |
| 6358 | 6/6 | 8.91 | 0.221 | 4.76 | 0.59 | 0.232 | 0.08 | 0.024 | 0.81 | 0.01 | 17.6 | 7.66 | 0.04 | 5.55 | 50.9 | 20.2 | 6.94 | 15.3 | 32.7 | 21.3 | 13.2 | 14.7 | |
| WA-K1 | 2.42 | 0.074 | 1.398 | 0.48 | 0.067 | 0.21 | 0.029 | 0.15 | 0.004 | 4.9 | 1.54 | 0.03 | 1.66 | 12.5 | 6.04 | 3.77 | 8.77 | 16.5 | 5.15 | 2.9 | 2.19 | ||
| 6359 | wc | 1.97 | 0.069 | 1.14 | 0.6 | 0.047 | 0.2 | 0.028 | 0.085 | 0.057 | 6.72 | 1.07 | nd | 0.95 | 10.4 | 7.16 | 2.35 | 5.77 | 10.7 | 3.49 | 2.07 | 1.58 | |
| 6360 | wc | 2.27 | 0.078 | 1.31 | 0.73 | 0.055 | 0.22 | 0.033 | 0.103 | 0.065 | 5.51 | 0.99 | nd | 1.91 | 10.6 | 6.25 | 15.4 | 13.9 | 15.6 | 4.49 | 2.28 | 1.55 | |
| 6361 | 1/5 | 1.71 | 0.038 | 1.01 | 0.69 | 0.057 | 0.1 | 0.028 | 0.121 | 0.004 | 4.46 | 0.71 | 0.03 | 2.32 | 10 | 4.85 | 19.07 | 8.47 | 14.9 | 3.34 | 2.16 | 0.85 | |
| 6362 | 2/5 | 2.29 | 0.058 | 1.29 | 0.5 | 0.067 | 0.11 | 0.042 | 0.141 | 0.006 | 5.01 | 0.26 | 0.03 | 0.51 | 9.7 | 5.06 | 1.37 | 4.57 | 10.7 | 2.76 | 1.68 | 0.18 | |
| 6363 | 3/5 | 0.75 | 0.027 | 0.72 | 0.57 | 0.081 | 0.75 | 0.038 | 0.007 | 0.017 | 1.07 | 0.11 | 0.03 | 0.23 | 3.16 | 1.56 | 1.15 | 4.11 | 8.14 | 1.64 | 0.49 | 0.08 | |
| 6364 | 4/5 | 1.96 | 0.093 | 1.1 | 0.29 | 0.038 | 0.31 | 0.051 | 0.004 | 0.146 | 3.77 | 0.35 | 0.03 | 1.39 | 8.54 | 6.90 | 3.44 | 7.03 | 17.4 | 2.58 | 1.47 | 0.13 | |
| 6365 | 5/5 | 5.21 | 0.147 | 3.3 | 0.89 | 0.108 | 0.12 | 0.019 | 0.446 | 0.043 | 17.2 | 2.72 | 0.04 | 2.65 | 52.4 | 19.4 | 16.3 | 29.4 | 31.5 | 7.52 | 7.42 | 8.94 | |
| WA-K2 | 2.43 | 0.081 | 1.477 | 0.533 | 0.063 | 0.26 | 0.038 | 0.126 | 0.068 | 6.2 | 0.81 | 0.03 | 1.53 | 16.5 | 8.0 | 8.02 | 10.8 | 17.6 | 3.55 | 2.62 | 1.90 | ||
| WA-K | 2.38 | 0.079 | 1.373 | 0.569 | 0.062 | 0.23 | 0.034 | 0.12 | 0.047 | 5.94 | 1.14 | 0.01 | 1.55 | 12.6 | 6.89 | 6.95 | 9.7 | 15.3 | 4.86 | 2.52 | 1.76 | ||
| Darby | 6261 | wc | 0.90 | 0.033 | 0.71 | 0.24 | 0.044 | 0.18 | 0.026 | 0.056 | 0.004 | 2.71 | 4.76 | 0.05 | 1.06 | 6.55 | 3.42 | 10.5 | 9.81 | 10.7 | 1.79 | 2.6 | 4.72 |
| 6262 | 1/4 | 0.77 | 0.052 | 0.62 | 0.15 | 0.023 | 0.14 | 0.01 | 0.008 | 0.004 | 2.12 | 19.67 | 0.04 | 1.66 | 6.32 | 3.78 | 16.5 | 9.87 | 8.02 | 1.76 | 10.7 | 11.0 | |
| 6263 | 2/4 | 0.64 | 0.028 | 0.68 | 0.22 | 0.048 | 0.26 | 0.041 | 0.011 | 0.003 | nd | nd | 0.03 | nd | nd | nd | nd | nd | nd | nd | nd | nd | |
| 6264 | 3/4 | 0.39 | 0.015 | 0.49 | 0.2 | 0.031 | 0.13 | 0.033 | 0.006 | 0.002 | 2.44 | 0.48 | 0.04 | 0.33 | 2.55 | 1.5 | 5.69 | 7.58 | 7.51 | 1.36 | 0.43 | 0.11 | |
| 6265 | 4/4 | 0.77 | 0.025 | 0.63 | 0.21 | 0.026 | 0.06 | 0.014 | 0.056 | 0.003 | 2.57 | 7.41 | 0.05 | 0.09 | 8.28 | 3.47 | 19 | 12 | 16.7 | 1.78 | 3.21 | 10.3 | |
| WA-D1 | 0.54 | 0.023 | 0.542 | 0.19 | 0.029 | 0.117 | 0.025 | 0.017 | 0.003 | 2.41 | 5.18 | 0.04 | 0.5 | 4.41 | 2.30 | 10.3 | 8.91 | 9.56 | 1.52 | 2.74 | 4.11 | ||
| 6266 | wc | 0.89 | 0.031 | 0.73 | 0.26 | 0.05 | 0.14 | 0.051 | 0.054 | 0.004 | 2.47 | 0.78 | 0.04 | 1.07 | 5.89 | 2.57 | 1.59 | 5.41 | 3.86 | 5.48 | 1.15 | 4.70 | |
| 6267 | wc | 1.35 | 0.04 | 0.83 | 0.43 | 0.06 | 0.18 | 0.063 | 0.082 | 0.004 | 3.08 | 1.23 | 0.05 | 0.26 | 9.21 | 4.56 | 2.12 | 4.79 | 10.5 | 3.53 | 2.42 | 2.03 | |
| 6268 | wc | 1.20 | 0.035 | 0.78 | 0.3 | 0.052 | 0.17 | 0.059 | 0.071 | 0.003 | 4.83 | 4.68 | 0.03 | 0.66 | 7.71 | 3.51 | 3.63 | 5.59 | 9.47 | 2.78 | 2.64 | 0.49 | |
| 6269 | wc | 2.00 | 0.053 | 1.18 | 0.38 | 0.102 | 0.15 | 0.058 | 0.129 | 0.005 | 4.23 | 2.12 | 0.04 | 0.47 | 13.1 | 6.71 | 4.29 | 8.82 | 14.1 | 4.84 | 2.69 | 1.44 | |
| 6366 | wc | 1.05 | 0.034 | 0.75 | 0.23 | 0.024 | 0.06 | 0.026 | 0.038 | 0.002 | 3.06 | 0.5 | nd | 0.49 | 6.6 | 3.14 | 7.02 | 5.99 | 8.13 | 2.03 | 1.09 | 0.21 | |
| 6367 | 1/5 | 4.38 | 0.098 | 2.07 | 0.5 | 0.124 | 0.02 | bdl | 0.247 | 0.005 | 7.75 | 2.9 | 0.04 | 4.59 | 72.2 | 15.4 | 5.69 | 18.8 | 14.1 | 18.5 | 4.85 | 1.59 | |
| 6368 | 2/5 | 1.03 | 0.046 | 0.61 | 0.2 | 0.018 | 0.08 | 0.021 | 0.008 | 0.003 | 2.77 | 0.12 | nd | 0.86 | 6.06 | 2.45 | 1.03 | 2.16 | 4.09 | 2.19 | 0.86 | 0.3 | |
| 6369 | 3/5 | 1.89 | 0.098 | 0.98 | 0.18 | 0.02 | 0.04 | 0.043 | 0.019 | 0.004 | 1.42 | 0.18 | nd | 1.13 | 8.27 | 3.71 | 1.34 | 4.1 | 6.43 | 3.61 | 0.71 | 0.16 | |
| 6370 | 4/5 | 0.70 | 0.024 | 0.64 | 0.25 | 0.021 | 0.06 | 0.038 | 0.019 | 0.002 | 2.50 | 0.14 | 0.04 | 0.45 | 5.15 | 2.04 | 0.75 | 1.83 | 4.26 | 2.84 | 0.68 | 0.11 | |
| 6371 | 5/5 | 1.35 | 0.029 | 0.95 | 0.29 | 0.031 | 0.04 | 0.013 | 0.067 | 0.003 | 4.35 | 0.25 | 0.17 | 0.65 | 3.92 | 2.33 | 0.83 | 2.62 | 2.14 | 9.08 | 1.23 | 0.22 | |
| WA-D2 | 1.11 | 0.036 | 0.77 | 0.26 | 0.027 | 0.06 | 0.029 | 0.036 | 0.003 | 3.05 | 0.28 | 0.055 | 0.78 | 8.18 | 2.85 | 1.06 | 2.91 | 4.39 | 4.61 | 1.0 | 0.23 | ||
| WA-D | 1.13 | 0.036 | 0.79 | 0.29 | 0.048 | 0.13 | 0.042 | 0.06 | 0.003 | 3.23 | 2.44 | 0.038 | 0.66 | 7.71 | 3.63 | 5.08 | 6.53 | 8.84 | 3.32 | 2.04 | 2.24 | ||
| Coal | Sample | Bench | As | Se | Rb | Sr | Zr | Nb | Mo | Cd | In | Sn | Sb | Cs | Ba | Hf | Ta | W | Tl | Pb | Bi | Th | U |
| Harlan | 6255 | wc | 10 | 0.1 | 10.2 | 54.1 | 22.7 | 2.79 | 2.09 | 0.11 | 0.017 | 0.66 | 0.78 | 0.86 | 67.4 | 0.65 | 1.31 | 0.5 | 0.94 | 6.43 | 0.13 | 1.75 | 1.11 |
| 6256 | 1/4 | 5.23 | 0.15 | 31.8 | 44.9 | 31.6 | 4.16 | 3.08 | 0.17 | 0.031 | 1.17 | 2.36 | 3.31 | 109 | 0.98 | 0.32 | 0.92 | 0.81 | 13.32 | 0.14 | 2.77 | 2.62 | |
| 6257 | 2/4 | 37.8 | 0.17 | 1.37 | 45.3 | 17.2 | 1.95 | 3.24 | 0.09 | 0.013 | 0.56 | 0.37 | 0.21 | 33.4 | 0.51 | 0.19 | 0.33 | 2.43 | 4.43 | 0.11 | 1.17 | 0.79 | |
| 6258 | 3/4 | 22.6 | 0.13 | 14.1 | 45.9 | 27.3 | 2.89 | 3.96 | 0.12 | 0.021 | 0.88 | 1.11 | 1.46 | 64.8 | 0.8 | 0.27 | 0.42 | 1.51 | 9.34 | 0.17 | 1.89 | 2.77 | |
| 6259 | 4/4 | 6.33 | 0.1 | 7.09 | 47.9 | 23.4 | 2.75 | 2.05 | 0.13 | 0.016 | 0.62 | 1.31 | 0.75 | 60.5 | 0.65 | 0.5 | 0.64 | 0.42 | 7.19 | 0.1 | 2.05 | 1.57 | |
| WA-H1 | 13 | 0.12 | 12.1 | 46.7 | 25.1 | 2.93 | 2.79 | 0.13 | 0.019 | 0.76 | 1.34 | 1.27 | 66.6 | 0.73 | 0.39 | 0.6 | 0.93 | 8.42 | 0.12 | 2.04 | 1.97 | ||
| 6260 | wc | 9.54 | 0.05 | 8.41 | 64.9 | 23.8 | 2.79 | 2.34 | 0.13 | 0.017 | 0.67 | 0.97 | 1.02 | 66.7 | 0.66 | 0.38 | 0.58 | 0.74 | 6.39 | 0.13 | 2.16 | 1.7 | |
| 6270 | wc | 9.44 | 0.15 | 10 | 350 | 30.2 | 3.69 | 2.74 | 0.18 | 0.024 | 0.92 | 1 | 1.79 | 307 | 0.88 | 0.57 | 0.83 | 0.72 | 6.86 | 0.16 | 0.69 | 2.23 | |
| 6271 | wc | 10.6 | 0.27 | 6.59 | 46.4 | 23.1 | 2.82 | 3.08 | 0.18 | 0.017 | 0.71 | 1.1 | 1.02 | 66.6 | 0.67 | 0.36 | 0.6 | 0.68 | 10.54 | 0.1 | 3.08 | 1.79 | |
| 6272 | wc | 20 | 0.24 | 23.1 | 108 | 31.3 | 3.98 | 2.39 | 0.15 | 0.025 | 0.91 | 1.19 | 1.62 | 144 | 0.9 | 0.46 | 0.7 | 1.24 | 9 | 0.17 | 3.46 | 2.36 | |
| 6273 | wc | 7.96 | 0.32 | 52.9 | 170 | 67.9 | 8.54 | 2.38 | 0.53 | 0.062 | 2.04 | 1.43 | 4.51 | 307 | 1.86 | 0.95 | 1.04 | 1.49 | 25.38 | 0.38 | 8.16 | 4.32 | |
| 6378 | wc | 4.2 | 0.17 | 3.74 | 75.8 | 20.5 | 2.15 | 1.7 | 0.1 | 0.014 | 0.55 | 0.7 | 0.74 | 64.7 | 0.59 | 0.17 | 0.27 | 0.3 | 5.35 | 0.11 | 0.42 | 0.99 | |
| 6379 | 1/9 | 6.2 | 0.18 | 4.81 | 131 | 38.3 | 4.47 | 1.21 | 0.09 | 0.025 | 0.92 | 1.05 | 0.52 | 85.3 | 1.04 | 0.39 | 0.54 | 0.19 | 7.84 | 0.2 | 2.88 | 1.55 | |
| 6380 | 2/9 | 2.08 | 0.21 | 21.2 | 122 | 99.7 | 9.14 | 0.76 | 0.2 | 0.039 | 1.9 | 0.41 | 2.58 | 140 | 2.74 | 0.72 | 0.62 | 0.16 | 11.47 | 0.25 | 1.43 | 1.74 | |
| 6381 | 3/9 | 11.1 | 0.08 | 5.82 | 84.3 | 15.6 | 1.71 | 2.82 | 0.1 | 0.019 | 0.57 | 0.8 | 0.79 | 119 | 0.46 | 0.15 | 0.29 | 0.6 | 6.23 | 0.12 | 1.09 | 0.68 | |
| 6382 | 4/9 | 1.76 | 0.04 | 1.25 | 128 | 17 | 1.86 | 1.59 | 0.11 | 0.013 | 0.42 | 0.54 | 0.18 | 96.7 | 0.49 | 0.17 | 0.21 | 0.07 | 4.59 | 0.11 | 1.06 | 0.52 | |
| 6383 | 5/9 | 22.3 | 0.15 | 12.5 | 23.2 | 9.36 | 1.17 | 3.36 | 0.04 | 0.011 | 0.35 | 0.5 | 0.9 | 51.4 | 0.25 | 0.13 | 0.3 | 0.12 | 3.74 | 0.06 | 1.26 | 0.74 | |
| 6384 | 6/9 | 14.5 | 0.14 | 14.8 | 618 | 40.9 | 5.52 | 3.38 | 0.41 | 0.035 | 1.22 | 1.92 | 1.01 | 499 | 1.06 | 0.53 | 0.93 | 1.33 | 30.58 | 0.28 | 6.17 | 4.2 | |
| 6385 | 7/9 | 0.91 | 0.27 | 39.3 | 6.6 | 70.2 | 8.78 | 0.82 | 0 | 0.012 | 1.34 | 0.36 | 0.55 | 84.8 | 1.89 | 1.65 | 0.65 | −0.06 | 0 | 0.01 | 4.07 | 1.3 | |
| 6386 | 8/9 | 1.35 | 0.07 | 1.6 | 25 | 5.46 | 0.76 | 2.01 | 0.09 | 0.007 | 0.2 | 0.15 | 0.14 | 18.1 | 0.17 | 0.32 | 0.2 | 0.02 | 9.12 | 0.05 | 0.55 | 0.27 | |
| 6387 | 9/9 | 14.1 | 0.14 | 8.03 | 91.3 | 15.1 | 1.55 | 1.62 | 0.12 | 0.011 | 0.49 | 0.86 | 1.21 | 95 | 0.47 | 0.14 | 0.36 | 1.05 | 5.47 | 0.11 | 1.49 | 0.81 | |
| WA-H2 | 10.8 | 0.13 | 8.16 | 101 | 21.1 | 2.37 | 2.2 | 0.11 | 0.016 | 0.58 | 0.69 | 0.81 | 99.1 | 0.59 | 0.27 | 0.37 | 0.42 | 7.57 | 0.12 | 1.64 | 0.98 | ||
| 6392 | wc | nd | nd | nd | nd | nd | nd | nd | nd | nd | nd | nd | nd | nd | nd | nd | nd | nd | nd | nd | nd | nd | |
| 6393 | 1/11 | 1.5 | 0.08 | 3.05 | 27.3 | 25.1 | 2.8 | 0.8 | 0.07 | 0.014 | 0.55 | 0.67 | 0.3 | 75.5 | 0.67 | 0.26 | 0.31 | 0.11 | 6.84 | 0.15 | 1.37 | 0.75 | |
| 6394 | 2/11 | 2 | 0.07 | 2.04 | 23.1 | 13.1 | 2.01 | 0.63 | 0.03 | 0.012 | 0.36 | 0.55 | 0.25 | 34.1 | 0.4 | 0.15 | 0.17 | 0.06 | 7.83 | 0.08 | 0.9 | 0.71 | |
| 6395 | 3/11 | 11.8 | 0.08 | 1.98 | 79.3 | 9.36 | 1.1 | 3.46 | 0.09 | 0.011 | 0.36 | 1.48 | 0.23 | 78.9 | 0.29 | 0.15 | 0.44 | 0.82 | 7.18 | 0.09 | 1.13 | 0.9 | |
| 6396 | 4/11 | 5.12 | 0.61 | 23.3 | 96.7 | 56.8 | 6.04 | 3.68 | 0.32 | 0.049 | 1.74 | 1.75 | 3.11 | 191 | 1.73 | 0.5 | 0.4 | 0.41 | 20.85 | 0.6 | 0.83 | 1.98 | |
| 6397 | 5/11 | 2.47 | 0.06 | 4.88 | 10.5 | 6.98 | 0.73 | 1.33 | 0.06 | 0.003 | 0.19 | 0.24 | 0.33 | 110 | 0.18 | 0.06 | 0.12 | 0.33 | 9.07 | 0.01 | 0.38 | 0.35 | |
| 6398 | 6/11 | 3.6 | 0.03 | 11.2 | 60 | 7.92 | 0.91 | 3.04 | 0.04 | 0.009 | 0.17 | 0.8 | 0.73 | 54.4 | 0.18 | 0.09 | 0.2 | 0.14 | 6.66 | 0.05 | 0.6 | 0.89 | |
| 6399 | 7/11 | 1.85 | 0.04 | 2.87 | 36.8 | 5.68 | 0.66 | 4.01 | 0.04 | 0.007 | 0.21 | 0.08 | 0.58 | 42.5 | 0.16 | 0.21 | 0.12 | 0.01 | 3.24 | 0.06 | 0.36 | 0.25 | |
| 6400 | 8/11 | 35.6 | 0.32 | 42.3 | 115 | 61.3 | 7.89 | 25.97 | 0.89 | 0.041 | 1.53 | 4.6 | 3.11 | 519 | 1.5 | 0.82 | 1.98 | 19.36 | 53.6 | 0.17 | 5.17 | 7.97 | |
| 6401 | 9/11 | nd | nd | 36.1 | 794 | 87.2 | 6.25 | nd | nd | nd | nd | nd | nd | 665 | nd | nd | nd | nd | nd | nd | nd | nd | |
| 6402 | 10/11 | 10.8 | 0.09 | 5.34 | 57 | 5.84 | 0.91 | 1.12 | 0.06 | 0.011 | 0.83 | 0.67 | 0.54 | 58.2 | 0.26 | 0.08 | 0.3 | 0.62 | 6.66 | 0.04 | 1.12 | 0.82 | |
| 6403 | 11/11 | 14.4 | 0.08 | 5.34 | 67.5 | 9.64 | 1.17 | 1.44 | 0.12 | 0.014 | 1.64 | 0.81 | 0.65 | 70.2 | 0.34 | 0.18 | 0.37 | 0.87 | 7.71 | 0.08 | 1.51 | 1.09 | |
| WA-H3 | 9.58 | 0.1 | 7.56 | 54.8 | 15.4 | 1.88 | 3.96 | 0.15 | 0.014 | 0.81 | 0.97 | 0.76 | 104 | 0.45 | 0.23 | 0.41 | 1.94 | 10.54 | 0.09 | 1.34 | 1.32 | ||
| WA-H | 9.56 | 0.15 | 13 | 97.4 | 25.5 | 3.09 | 2.33 | 0.16 | 0.02 | 0.78 | 0.92 | 1.31 | 118 | 0.73 | 0.46 | 0.54 | 0.85 | 8.77 | 0.14 | 2.25 | 1.71 | ||
| Kellioka | 6352 | wc | 3.12 | 0.09 | 6.12 | 106 | 10.5 | 1.49 | 0.91 | 0.08 | 0.012 | 0.46 | 0.53 | 0.69 | 85.5 | 0.38 | 0.14 | 0.36 | 0.26 | 4.46 | 0.11 | 1.4 | 0.77 |
| 6353 | 1/6 | 16.2 | 0.06 | 4.85 | 67.9 | 5.64 | 0.72 | 1.21 | 0.04 | 0.005 | 0.21 | 0.45 | 0.44 | 63.5 | 0.17 | 0.07 | 0.54 | 0.51 | 3.37 | 0.05 | 0.76 | 0.5 | |
| 6354 | 2/6 | 39.7 | 0.05 | 3.2 | 85.7 | 3.7 | 0.72 | 0.94 | 0.05 | 0.006 | 0.17 | 0.15 | 0.23 | 73.8 | 0.17 | 0.13 | 0.11 | 0.89 | 2.9 | 0.07 | 0.72 | 0.49 | |
| 6355 | 3/6 | 0.74 | 0.03 | 0.05 | 117 | 3.29 | 0.56 | 0.6 | 0.02 | 0.004 | 0.15 | 0.05 | 0.01 | 91.9 | 0.15 | 0.06 | 0.08 | 0.08 | 1.62 | 0.02 | 0.33 | 0.15 | |
| 6356 | 4/6 | 0.47 | 0.04 | 0.3 | 116 | 6.96 | 0.84 | 0.56 | 0.03 | 0.006 | 0.25 | 0.08 | 0.03 | 102 | 0.19 | 0.08 | 0.13 | 0.12 | 1.72 | 0.05 | 0.51 | 0.26 | |
| 6357 | 5/6 | 0.68 | 0.06 | 0.06 | 198 | −0.01 | 2.06 | 0.32 | 0.05 | 0.015 | 0.91 | 0.1 | 0.02 | 104 | 0.49 | 0.29 | 0.14 | 0.12 | 3.1 | 0.1 | 1.56 | 0.62 | |
| 6358 | 6/6 | 2.12 | 0.13 | 3.55 | 587 | 38.2 | 4.96 | 0.79 | 0.16 | 0.046 | 1.18 | 2.71 | 0.25 | 543 | 0.94 | 0.43 | 0.64 | 1.39 | 13.78 | 0.31 | 3.5 | 1.91 | |
| WA-K1 | 11.6 | 0.06 | 2.2 | 185 | 8.5 | 1.62 | 0.75 | 0.06 | 0.013 | 0.5 | 0.54 | 0.18 | 150 | 0.35 | 0.18 | 0.28 | 0.53 | 4.29 | 0.1 | 1.25 | 0.66 | ||
| 6359 | wc | 7.31 | 0.12 | 2.51 | 72 | 13 | 1.6 | 0.79 | 0.08 | 0.008 | 0.5 | 0.54 | 0.24 | 74 | 0.41 | 0.21 | 0.35 | 0.16 | 3.3 | 0.06 | 0.72 | 0.81 | |
| 6360 | wc | 49.8 | 0.14 | 2.33 | 129 | 14.8 | 1.94 | 1.13 | 0.17 | 0.011 | 0.53 | 0.56 | 0.25 | 107 | 0.46 | 0.43 | 0.38 | 0.45 | 14.55 | 0.09 | 1.9 | 1.05 | |
| 6361 | 1/5 | 37.3 | 0.08 | 3.98 | 102 | 6.34 | 1.19 | 1.63 | 0.14 | 0.009 | 0.22 | 0.77 | 0.23 | 93.2 | 0.21 | 0.15 | 0.76 | 0.25 | 2.71 | 0.06 | 0.91 | 1.09 | |
| 6362 | 2/5 | 23.9 | 0.07 | 1.77 | 69.5 | 9.2 | 1.11 | 1.02 | 0.04 | 0.008 | 0.36 | 0.16 | 0.28 | 64.1 | 0.27 | 0.09 | 0.11 | 0.44 | 3.23 | 0.07 | 0.29 | 0.46 | |
| 6363 | 3/5 | 0.79 | 0.07 | 0.11 | 100 | 4.73 | 0.56 | 0.94 | 0.03 | 0.004 | 0.18 | 0.1 | 0.01 | 67.6 | 0.14 | 0.05 | 0.1 | 0.08 | 2.08 | 0.06 | 0.14 | 0.21 | |
| 6364 | 4/5 | 0.84 | 0.06 | 0 | 276 | 0 | 2.01 | 0.62 | 0.05 | 0.012 | 0.39 | 0.15 | 0.01 | 186 | 0.53 | 0.21 | 0.18 | 0.09 | 3.46 | 0.1 | 1.87 | 0.63 | |
| 6365 | 5/5 | 8.37 | 0.14 | 11.9 | 118 | 24.9 | 3.3 | 1.23 | 0.17 | 0.021 | 0.71 | 1.83 | 1 | 106 | 0.71 | 0.26 | 0.47 | 0.58 | 10.68 | 0.14 | 1.59 | 1.29 | |
| WA-K2 | 11.8 | 0.08 | 3.17 | 167 | 7.56 | 1.82 | 1 | 0.09 | 0.012 | 0.39 | 0.57 | 0.27 | 124 | 0.43 | 0.17 | 0.32 | 0.26 | 4.48 | 0.09 | 1.23 | 0.76 | ||
| WA-K | 16.8 | 0.1 | 3.27 | 132 | 10.9 | 1.69 | 0.92 | 0.1 | 0.011 | 0.48 | 0.55 | 0.33 | 108 | 0.41 | 0.23 | 0.34 | 0.33 | 6.22 | 0.09 | 1.3 | 0.81 | ||
| Darby | 6261 | wc | 1.2 | 0.09 | 1.65 | 82.8 | 4.93 | 0.79 | 0.46 | 0.03 | 0.006 | 0.17 | 0.66 | 0.18 | 58 | 0.17 | 0.06 | 0.27 | 0.15 | 2 | 0.04 | 0.47 | 0.28 |
| 6262 | 1/4 | 0.74 | 0.09 | 0.18 | 75.9 | 1.74 | 1.47 | 0.17 | 0.02 | 0.005 | 0.29 | 0.97 | 0.02 | 44 | 0.28 | 0.1 | 0.28 | 0.2 | 1.94 | 0.04 | 0.69 | 0.24 | |
| 6264 | 3/4 | 0.63 | 0.05 | 0.16 | 101 | 1.21 | 0.29 | 0.49 | 0.02 | 0.004 | 0.16 | 0.05 | 0.02 | 86.5 | 0.07 | 0.03 | 0.1 | 0.02 | 1.02 | 0.03 | 0.17 | 0.05 | |
| 6265 | 4/4 | 1.24 | 0.08 | 0.55 | 29.8 | 4.24 | 0.76 | 0.46 | 0.04 | 0.006 | 0.21 | 1.43 | 0.13 | 17.3 | 0.13 | 0.04 | 0.45 | 0.17 | 1.93 | 0.04 | 0.04 | 0.26 | |
| WA-D1 | 0.78 | 0.06 | 0.25 | 81.8 | 1.95 | 0.59 | 0.43 | 0.02 | 0.005 | 0.19 | 0.5 | 0.04 | 64.6 | 0.12 | 0.04 | 0.21 | 0.08 | 1.37 | 0.03 | 0.23 | 0.13 | ||
| 6266 | wc | 1.42 | 0.1 | 0.68 | 31.4 | 5.53 | 0.81 | 0.48 | 0.04 | 0.004 | 0.16 | 0.6 | 0.11 | 21.4 | 0.16 | 0.09 | 0.23 | 0.61 | 1.88 | 0.03 | 0.66 | 0.32 | |
| 6267 | wc | 8.64 | 0.09 | 4.62 | 44.6 | 7.01 | 1.05 | 0.78 | 0.06 | 0.005 | 0.21 | 0.45 | 0.29 | 56.5 | 0.21 | 0.08 | 0.36 | 0.2 | 2.84 | 0.03 | 0.18 | 0.54 | |
| 6268 | wc | 2.82 | 0.07 | 3.37 | 74.9 | 5.79 | 0.8 | 0.57 | 0.04 | 0.006 | 0.16 | 0.22 | 0.25 | 71.9 | 0.17 | 0.09 | 0.18 | 0.24 | 2.26 | 0.05 | 0.29 | 0.25 | |
| 6269 | wc | 1.33 | 0.11 | 1.54 | 99.2 | 8.74 | 0.7 | 0.95 | 0.07 | 0.009 | 0.24 | 0.34 | 0.16 | 83.8 | 0.26 | 0.05 | 0.17 | 0.9 | 4.38 | 0.08 | 0.45 | 0.6 | |
| 6366 | wc | 1.51 | 0.05 | 0.33 | 63.4 | 5.87 | 0.74 | 0.98 | 0.07 | 0.005 | 0.2 | 0.14 | 0.07 | 52.9 | 0.17 | 0.08 | 0.21 | 0.13 | 1.41 | 0.05 | 0.41 | 0.23 | |
| 6367 | 1/5 | 3.47 | 0.32 | 6.42 | 29.3 | 16.9 | 3.37 | 0.65 | 0.09 | 0.014 | 0.73 | 1.69 | 0.5 | 39.7 | 0.48 | 0.16 | 0.34 | 0.29 | 6.75 | 0.1 | 1.1 | 1.52 | |
| 6368 | 2/5 | 0.85 | 0.09 | 3.83 | 7.72 | 8.74 | 1.03 | 1.33 | 0.03 | 0.003 | 0.26 | 0.25 | 0.25 | 15.1 | 0.22 | 0.1 | 0.55 | 0.2 | 1.71 | 0.02 | 0.65 | 0.22 | |
| 6369 | 3/5 | 1.07 | 0.05 | 2.77 | 3.01 | 20.8 | 2.11 | 1.18 | 0.06 | 0.003 | 0.38 | 0.09 | 0.22 | 12.5 | 0.57 | 0.3 | 0.31 | 0.15 | 2.38 | 0.01 | 1.26 | 0.36 | |
| 6370 | 4/5 | 1.34 | 0.05 | 0.46 | 41.7 | 4.07 | 0.54 | 1.27 | 0.03 | 0.004 | 4.32 | 0.63 | 0.03 | 54.5 | 0.13 | 0.09 | 0.14 | 0.24 | 1.31 | 0.04 | 0.42 | 0.14 | |
| 6371 | 5/5 | 3.94 | 0.09 | 1.07 | 140 | 4.66 | 0.69 | 0.87 | 0.06 | 0.026 | 0.21 | 0.13 | 0.09 | 141.6 | 0.16 | 0.1 | 0.38 | 0.34 | 1.64 | 0.06 | 0.6 | 0.31 | |
| WA-D2 | 1.81 | 0.07 | 1.56 | 51.3 | 6.54 | 0.87 | 1.17 | 0.04 | 0.00829 | 2.46 | 0.49 | 0.11 | 60.7 | 0.19 | 0.11 | 0.27 | 0.25 | 1.74 | 0.04 | 0.57 | 0.26 | ||
| WA-D | 2.44 | 0.08 | 1.75 | 66.2 | 5.79 | 0.79 | 0.73 | 0.04 | 0.006 | 0.47 | 0.42 | 0.15 | 58.7 | 0.18 | 0.08 | 0.24 | 0.32 | 2.23 | 0.04 | 0.41 | 0.33 |


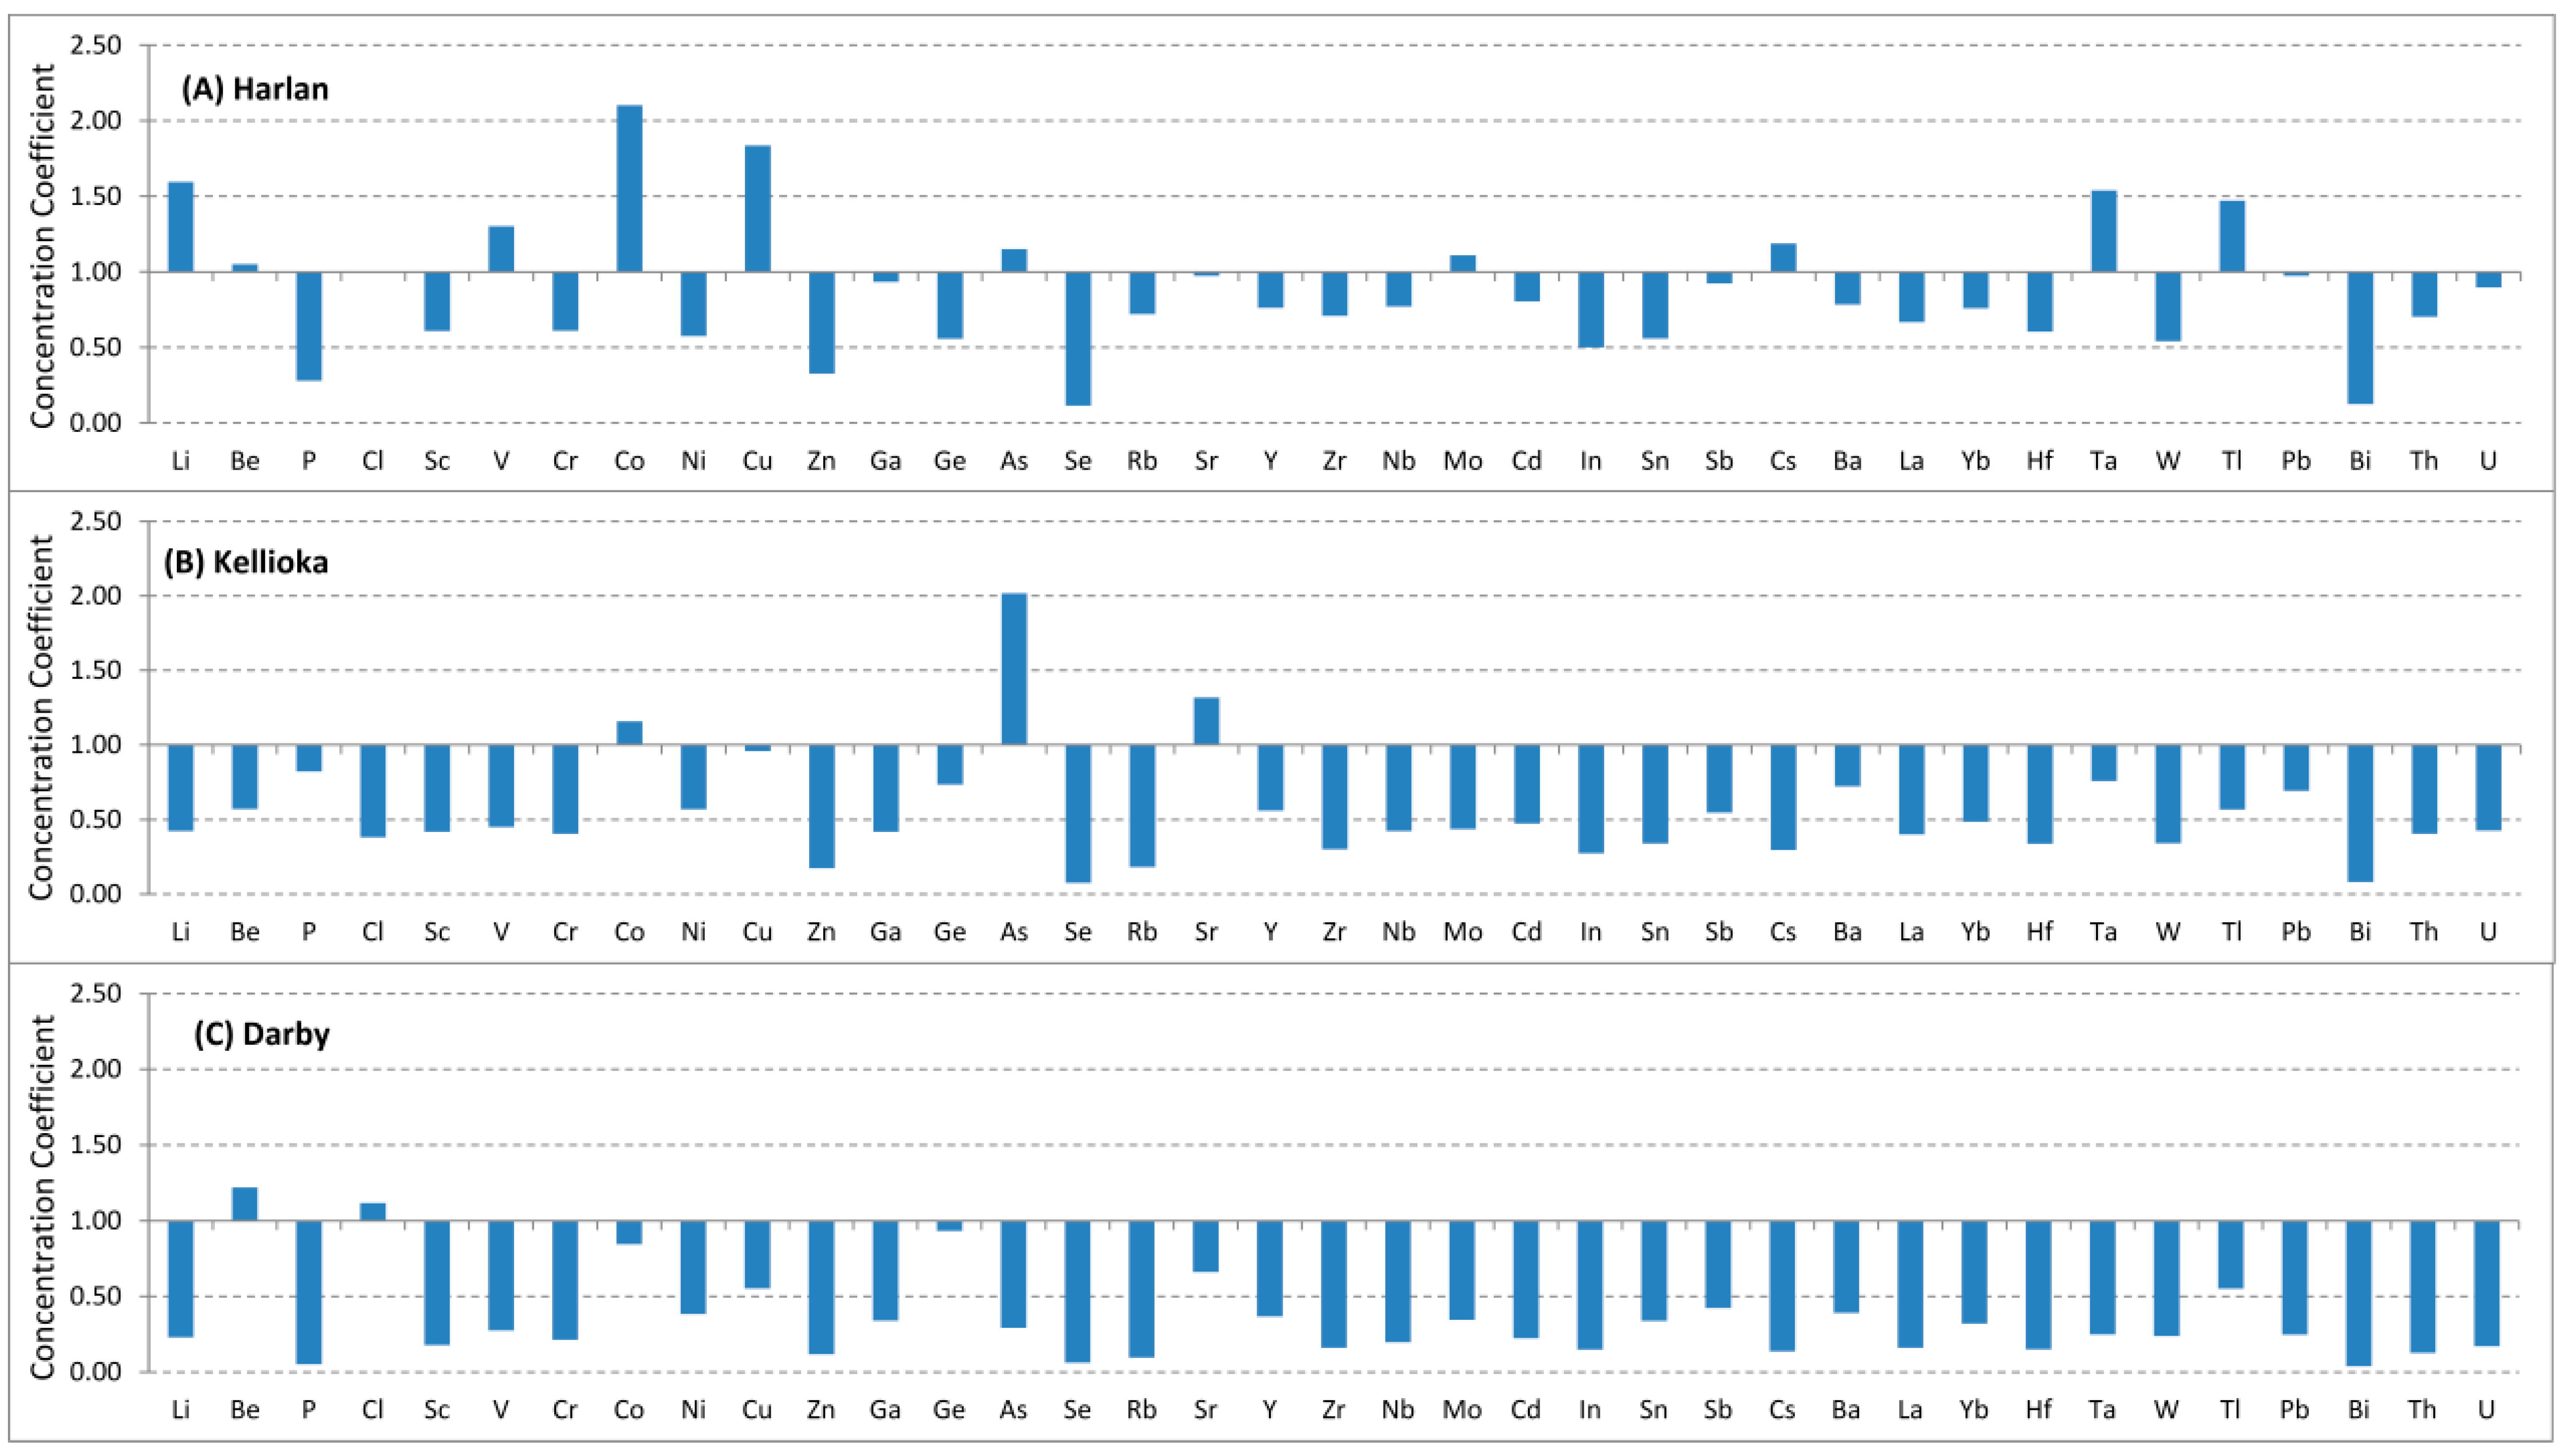
3.3.1. The Harlan coals
3.3.2. The Kellioka coals
3.3.3. The Darby coals
3.4. Rare Earth Elements and Yttrium

| Coal | Sample | Bench | La | Ce | Pr | Nd | Sm | Eu | Gd | Tb | Dy | Y | Ho | Er | Tm | Yb | Lu |
|---|---|---|---|---|---|---|---|---|---|---|---|---|---|---|---|---|---|
| Harlan | 6255 | wc | 6.82 | 7.82 | 1.65 | 7.01 | 1.49 | 0.31 | 1.5 | 0.21 | 1.34 | 6.77 | 0.25 | 0.78 | 0.1 | 0.73 | 0.1 |
| 6256 | 1/4 | 13.6 | 19 | 3.61 | 15.76 | 3.46 | 0.68 | 3.25 | 0.43 | 2.49 | 10.8 | 0.44 | 1.33 | 0.17 | 1.18 | 0.16 | |
| 6257 | 2/4 | 3.63 | 7.25 | 0.99 | 4.44 | 1.01 | 0.21 | 1.06 | 0.15 | 0.89 | 4.72 | 0.16 | 0.49 | 0.06 | 0.44 | 0.06 | |
| 6258 | 3/4 | 6.38 | 16 | 1.56 | 6.53 | 1.3 | 0.25 | 1.32 | 0.17 | 1.04 | 4.72 | 0.19 | 0.6 | 0.08 | 0.62 | 0.08 | |
| 6259 | 4/4 | 7.06 | 11.4 | 1.84 | 7.88 | 1.69 | 0.36 | 1.77 | 0.26 | 1.66 | 8.94 | 0.32 | 1.02 | 0.13 | 0.97 | 0.13 | |
| WA-H1 | 7.58 | 13.4 | 1.96 | 8.42 | 1.8 | 0.37 | 1.82 | 0.25 | 1.56 | 7.78 | 0.29 | 0.91 | 0.12 | 0.87 | 0.12 | ||
| 6260 | wc | 7.55 | 18.3 | 1.94 | 8.33 | 1.8 | 0.37 | 1.86 | 0.26 | 1.56 | 7.86 | 0.29 | 0.89 | 0.11 | 0.83 | 0.11 | |
| 6270 | wc | 3.24 | 16.6 | 1.42 | 6.21 | 1.43 | 0.33 | 1.41 | 0.23 | 1.31 | 3.04 | 0.26 | 0.79 | 0.11 | 0.75 | 0.11 | |
| 6271 | wc | 8.55 | 19.3 | 2.25 | 9.09 | 1.83 | 0.4 | 1.96 | 0.29 | 1.51 | 7.67 | 0.3 | 0.86 | 0.12 | 0.82 | 0.12 | |
| 6272 | wc | 10.1 | 18.5 | 2.69 | 10.8 | 2.23 | 0.5 | 2.33 | 0.35 | 1.87 | 8.99 | 0.35 | 1.05 | 0.14 | 0.99 | 0.14 | |
| 6273 | wc | 23.3 | 54.1 | 6.06 | 24 | 4.65 | 1 | 4.84 | 0.68 | 3.48 | 16.39 | 0.65 | 1.97 | 0.26 | 1.85 | 0.26 | |
| 6378 | wc | 2.59 | 12.7 | 0.92 | 4.12 | 0.91 | 0.19 | 0.89 | 0.12 | 0.76 | 1.43 | 0.14 | 0.45 | 0.06 | 0.42 | 0.06 | |
| 6379 | 1/9 | 11.4 | 22.4 | 2.3 | 9.02 | 1.77 | 0.36 | 1.97 | 0.28 | 1.81 | 9.74 | 0.34 | 1.06 | 0.13 | 0.95 | 0.13 | |
| 6380 | 2/9 | 4.41 | 30.5 | 1.48 | 6.11 | 1.21 | 0.23 | 1.26 | 0.17 | 1.13 | 2.42 | 0.21 | 0.7 | 0.1 | 0.73 | 0.09 | |
| 6381 | 3/9 | 4.7 | 9.47 | 1.29 | 5.68 | 1.21 | 0.25 | 1.17 | 0.15 | 0.89 | 4.2 | 0.15 | 0.48 | 0.06 | 0.47 | 0.06 | |
| 6382 | 4/9 | 6.85 | 14.3 | 1.55 | 6.45 | 1.32 | 0.27 | 1.32 | 0.17 | 0.99 | 4.99 | 0.17 | 0.53 | 0.07 | 0.48 | 0.06 | |
| 6383 | 5/9 | 4.9 | 12.2 | 1.34 | 5.6 | 1.15 | 0.27 | 1.23 | 0.18 | 0.92 | 4.66 | 0.17 | 0.49 | 0.06 | 0.44 | 0.06 | |
| 6384 | 6/9 | 19.7 | 46.8 | 5.21 | 21.01 | 4.37 | 0.96 | 4.45 | 0.64 | 3.42 | 14.8 | 0.62 | 1.84 | 0.25 | 1.7 | 0.24 | |
| 6385 | 7/9 | 12.2 | 24 | 2.91 | 11.95 | 2.54 | 0.55 | 2.76 | 0.4 | 2.2 | 12.4 | 0.42 | 1.25 | 0.17 | 1.17 | 0.16 | |
| 6386 | 8/9 | 3.34 | 7.42 | 0.76 | 3.23 | 0.67 | 0.17 | 0.72 | 0.09 | 0.48 | 2.63 | 0.09 | 0.25 | 0.03 | 0.22 | 0.03 | |
| 6387 | 9/9 | 5.97 | 14.2 | 1.46 | 6.22 | 1.31 | 0.27 | 1.35 | 0.18 | 1.14 | 6.49 | 0.22 | 0.71 | 0.09 | 0.66 | 0.09 | |
| WA-H2 | 6.56 | 15.6 | 1.62 | 6.72 | 1.39 | 0.3 | 1.45 | 0.2 | 1.15 | 5.76 | 0.21 | 0.65 | 0.08 | 0.6 | 0.08 | ||
| 6393 | 1/11 | 5.87 | 7.06 | 1.47 | 6.28 | 1.39 | 0.3 | 1.45 | 0.21 | 1.34 | 7.17 | 0.25 | 0.74 | 0.09 | 0.65 | 0.09 | |
| 6394 | 2/11 | 2.8 | 2.23 | 0.97 | 4.49 | 1.25 | 0.28 | 1.33 | 0.22 | 1.4 | 4.97 | 0.23 | 0.65 | 0.08 | 0.54 | 0.07 | |
| 6395 | 3/11 | 4.22 | 6.68 | 1.24 | 5.48 | 1.27 | 0.27 | 1.27 | 0.18 | 1.05 | 4.43 | 0.18 | 0.54 | 0.07 | 0.48 | 0.06 | |
| 6396 | 4/11 | 3.02 | 13.5 | 1.19 | 5.33 | 1.2 | 0.26 | 1.08 | 0.16 | 1.02 | 2.05 | 0.19 | 0.67 | 0.1 | 0.73 | 0.1 | |
| 6397 | 5/11 | 2 | 4.32 | 0.44 | 1.81 | 0.34 | 0.08 | 0.35 | 0.04 | 0.27 | 1.48 | 0.05 | 0.17 | 0.02 | 0.16 | 0.02 | |
| 6398 | 6/11 | 1.66 | 3.53 | 0.43 | 1.67 | 0.33 | 0.09 | 0.37 | 0.05 | 0.3 | 1.57 | 0.06 | 0.18 | 0.03 | 0.18 | 0.03 | |
| 6399 | 7/11 | 1.25 | 2.39 | 0.27 | 1.1 | 0.21 | 0.05 | 0.26 | 0.04 | 0.23 | 1.19 | 0.04 | 0.14 | 0.02 | 0.14 | 0.02 | |
| 6400 | 8/11 | 15.1 | 31.9 | 3.91 | 15.78 | 3.18 | 0.92 | 3.51 | 0.49 | 2.76 | 14.34 | 0.51 | 1.59 | 0.22 | 1.53 | 0.22 | |
| 6402 | 10/11 | 3.86 | 9.64 | 0.96 | 4.1 | 0.88 | 0.19 | 0.93 | 0.12 | 0.74 | 3.99 | 0.14 | 0.42 | 0.05 | 0.37 | 0.05 | |
| 6403 | 11/11 | 4.93 | 11.6 | 1.25 | 5.34 | 1.12 | 0.24 | 1.2 | 0.16 | 0.95 | 4.95 | 0.17 | 0.53 | 0.07 | 0.49 | 0.06 | |
| WA-H3 | 4.56 | 9.26 | 1.18 | 4.97 | 1.06 | 0.25 | 1.13 | 0.16 | 0.94 | 4.71 | 0.17 | 0.53 | 0.07 | 0.49 | 0.07 | ||
| WA-H | 7.35 | 16.9 | 1.97 | 8.15 | 1.69 | 0.37 | 1.74 | 0.25 | 1.41 | 6.4 | 0.26 | 0.81 | 0.11 | 0.76 | 0.11 | ||
| Kellioka | 6352 | wc | 4.22 | 9.87 | 1.01 | 4.22 | 0.9 | 0.2 | 1 | 0.14 | 0.96 | 5.68 | 0.18 | 0.59 | 0.08 | 0.55 | 0.07 |
| 6353 | 1/6 | 2.29 | 5.52 | 0.63 | 2.85 | 0.7 | 0.17 | 0.88 | 0.14 | 0.95 | 6.49 | 0.19 | 0.62 | 0.08 | 0.55 | 0.08 | |
| 6354 | 2/6 | 2.54 | 6.01 | 0.63 | 2.68 | 0.55 | 0.12 | 0.59 | 0.07 | 0.43 | 2.1 | 0.08 | 0.23 | 0.03 | 0.2 | 0.03 | |
| 6355 | 3/6 | 1.95 | 4.11 | 0.41 | 1.7 | 0.33 | 0.08 | 0.35 | 0.04 | 0.27 | 1.34 | 0.05 | 0.14 | 0.02 | 0.13 | 0.02 | |
| 6356 | 4/6 | 2.81 | 6.09 | 0.55 | 2.23 | 0.42 | 0.1 | 0.47 | 0.06 | 0.36 | 1.89 | 0.07 | 0.2 | 0.03 | 0.17 | 0.02 | |
| 6357 | 5/6 | 4.99 | 10.8 | 0.97 | 3.86 | 0.74 | 0.16 | 0.82 | 0.11 | 0.65 | 3.53 | 0.12 | 0.37 | 0.05 | 0.34 | 0.05 | |
| 6358 | 6/6 | 9.41 | 19.4 | 2.32 | 8.89 | 1.61 | 0.39 | 1.92 | 0.31 | 2.03 | 12.37 | 0.43 | 1.4 | 0.19 | 1.36 | 0.2 | |
| WA-K1 | 3.99 | 8.7 | 0.91 | 3.7 | 0.74 | 0.17 | 0.85 | 0.12 | 0.79 | 4.69 | 0.16 | 0.5 | 0.06 | 0.46 | 0.06 | ||
| 6359 | wc | 2.93 | 8.56 | 0.87 | 3.5 | 0.71 | 0.18 | 0.78 | 0.12 | 0.68 | 2.69 | 0.13 | 0.41 | 0.06 | 0.37 | 0.05 | |
| 6360 | wc | 5.67 | 12.5 | 1.37 | 5.42 | 1.08 | 0.26 | 1.2 | 0.18 | 1.01 | 5.47 | 0.2 | 0.6 | 0.08 | 0.56 | 0.08 | |
| 6361 | 1/5 | 2.52 | 6.07 | 0.77 | 3.34 | 0.81 | 0.21 | 0.93 | 0.18 | 1.17 | 7.46 | 0.24 | 0.76 | 0.1 | 0.69 | 0.1 | |
| 6362 | 2/5 | 1.56 | 6.14 | 0.52 | 2.28 | 0.49 | 0.11 | 0.48 | 0.06 | 0.38 | 1.2 | 0.07 | 0.21 | 0.03 | 0.21 | 0.03 | |
| 6363 | 3/5 | 0.39 | 2.32 | 0.1 | 0.44 | 0.09 | 0.03 | 0.12 | 0.01 | 0.08 | 0.4 | 0.01 | 0.04 | 0.01 | 0.04 | 0.01 | |
| 6364 | 4/5 | 7.08 | 13.8 | 1.38 | 5.56 | 1.05 | 0.23 | 1.12 | 0.15 | 0.87 | 4.57 | 0.16 | 0.48 | 0.06 | 0.42 | 0.06 | |
| 6365 | 5/5 | 9.8 | 22.7 | 2.2 | 8.9 | 1.78 | 0.36 | 1.89 | 0.26 | 1.67 | 9.46 | 0.32 | 1.03 | 0.13 | 0.96 | 0.14 | |
| WA-K2 | 5.26 | 11.7 | 1.16 | 4.75 | 0.96 | 0.21 | 1.03 | 0.15 | 0.91 | 5.04 | 0.17 | 0.54 | 0.07 | 0.5 | 0.07 | ||
| WA-K | 4.41 | 10.3 | 1.06 | 4.32 | 0.88 | 0.2 | 0.97 | 0.14 | 0.87 | 4.71 | 0.17 | 0.53 | 0.07 | 0.49 | 0.07 | ||
| Darby | 6261 | wc | 2.08 | 5.4 | 0.52 | 2.32 | 0.55 | 0.13 | 0.67 | 0.1 | 0.7 | 5.13 | 0.14 | 0.46 | 0.06 | 0.42 | 0.06 |
| 6262 | 1/4 | 3.4 | 6.99 | 0.71 | 3.15 | 0.75 | 0.19 | 0.98 | 0.16 | 1.24 | 10.23 | 0.26 | 0.84 | 0.11 | 0.76 | 0.1 | |
| 6264 | 3/4 | 1.43 | 3.99 | 0.36 | 1.64 | 0.36 | 0.09 | 0.4 | 0.05 | 0.31 | 1.9 | 0.06 | 0.17 | 0.02 | 0.14 | 0.02 | |
| 6265 | 4/4 | 0.56 | 3.09 | 0.24 | 1.19 | 0.34 | 0.08 | 0.43 | 0.08 | 0.64 | 1.41 | 0.14 | 0.46 | 0.06 | 0.41 | 0.06 | |
| WA-D1 | 1.57 | 4.3 | 0.39 | 1.8 | 0.42 | 0.1 | 0.5 | 0.07 | 0.54 | 3.19 | 0.11 | 0.34 | 0.04 | 0.3 | 0.04 | ||
| 6266 | wc | 2.02 | 5.13 | 0.57 | 2.45 | 0.57 | 0.15 | 0.62 | 0.11 | 0.68 | 4.41 | 0.14 | 0.42 | 0.06 | 0.38 | 0.06 | |
| 6267 | wc | 1.61 | 5.51 | 0.53 | 2.25 | 0.49 | 0.13 | 0.54 | 0.09 | 0.57 | 1.37 | 0.12 | 0.36 | 0.05 | 0.31 | 0.04 | |
| 6268 | wc | 1.38 | 4.76 | 0.45 | 1.93 | 0.43 | 0.11 | 0.47 | 0.08 | 0.45 | 2.06 | 0.09 | 0.27 | 0.04 | 0.25 | 0.04 | |
| 6269 | wc | 1.77 | 6 | 0.6 | 2.59 | 0.59 | 0.14 | 0.61 | 0.1 | 0.63 | 2.27 | 0.12 | 0.39 | 0.05 | 0.36 | 0.05 | |
| 6366 | wc | 1.57 | 3.68 | 0.45 | 2.04 | 0.47 | 0.11 | 0.52 | 0.08 | 0.48 | 2.83 | 0.09 | 0.29 | 0.04 | 0.26 | 0.04 | |
| 6367 | 1/5 | 3.89 | 12.47 | 1.18 | 5.51 | 1.5 | 0.35 | 1.77 | 0.29 | 1.99 | 11.8 | 0.39 | 1.26 | 0.17 | 1.23 | 0.16 | |
| 6368 | 2/5 | 3.15 | 7.52 | 0.77 | 3.26 | 0.71 | 0.18 | 0.86 | 0.14 | 0.84 | 7.77 | 0.18 | 0.54 | 0.07 | 0.46 | 0.07 | |
| 6369 | 3/5 | 4.18 | 8.95 | 0.85 | 3.33 | 0.64 | 0.15 | 0.72 | 0.09 | 0.5 | 2.82 | 0.09 | 0.29 | 0.04 | 0.27 | 0.04 | |
| 6370 | 4/5 | 1.67 | 4.02 | 0.47 | 2 | 0.42 | 0.12 | 0.43 | 0.06 | 0.32 | 1.65 | 0.06 | 0.18 | 0.02 | 0.16 | 0.02 | |
| 6371 | 5/5 | 1.85 | 3.82 | 0.59 | 2.61 | 0.62 | 0.16 | 0.63 | 0.1 | 0.57 | 3.02 | 0.11 | 0.31 | 0.04 | 0.27 | 0.04 | |
| WA-D2 | 2.21 | 5.25 | 0.6 | 2.56 | 0.57 | 0.15 | 0.62 | 0.09 | 0.54 | 3.48 | 0.11 | 0.32 | 0.04 | 0.29 | 0.04 | ||
| WA-D | 1.78 | 5 | 0.51 | 2.24 | 0.51 | 0.13 | 0.57 | 0.09 | 0.57 | 3.09 | 0.11 | 0.36 | 0.05 | 0.32 | 0.04 |


4. Summary
Acknowledgments
Author Contributions
Conflicts of Interest
References
- Bragg, B.; Reece, F. Which Side Are You On? Sony/ATV Music Publishing LLC (Current Copyright Owner): Nashville, TN, USA, 1931. [Google Scholar]
- Woolley, B. We Be Here When the Morning Comes; University Press of Kentucky: Lexington, KY, USA, 1975. [Google Scholar]
- Portelli, A. They Say in Harlan County: An Oral History; Oxford University Press: Oxford, UK, 2010. [Google Scholar]
- Caudill, H.M. Theirs Be the Power—The Moguls of Eastern Kentucky; University of Illinois Press: Urbana, IL, USA, 1983. [Google Scholar]
- Shifflett, C.A. Coal Towns: Life, Work, and Culture in Company Towns of Southern Appalachia, 1880–1960; University of Tennessee Press: Knoxville, TN, USA, 1991. [Google Scholar]
- Rice, C.L.; Smith, J.H. Correlation of Coal Beds, Coal Zones, and Key Stratigraphic Units, Pennsylvanian Rocks of Eastern Kentucky; U.S. Geological Survey Map MF-1188; U.S. Geological Survey: Washington, DC, USA, 1980.
- Hatton, A.R.; Hower, J.C.; Helfrich, C.T.; Pollock, J.D.; Wild, G.D. Lithologic succession in the Path Fork coal bed (Breathitt Formation, Middle Pennsylvanian), southeastern Kentucky. Org. Geochem. 1992, 18, 301–311. [Google Scholar] [CrossRef]
- Esterle, J.S.; Ferm, J.C. Relationship between petrographic and chemical properties and coal seam geometry, Hance seam, Breathitt Formation, southeastern Kentucky. Int. J. Coal Geol. 1986, 6, 199–214. [Google Scholar] [CrossRef]
- Hubbard, T.E.; Miller, T.R.; Hower, J.C.; Ferm, J.C.; Helfrich, C.F. The Upper Hance coal bed in southeastern Kentucky: Palynologic, geochemical, and petrographic evidence for environmental succession. Int. J. Coal Geol. 2002, 49, 177–194. [Google Scholar] [CrossRef]
- Froelich, A.J. Geologic Map of the Louellen Quadrangle, Southeastern Kentucky; U.S. Geological Survey Map GQ-1060; U.S. Geological Survey: Washington, DC, USA, 1975.
- Chesnut, D.R. Geologic framework for the coal-bearing rocks of the Central Appalachian Basin. Int. J. Coal Geol. 1996, 31, 55–66. [Google Scholar] [CrossRef]
- Greb, S.F.; Eble, C.F.; Hower, J.C. Depositional history of the Fire Clay coal bed (Late Duckmantian), eastern Kentucky, USA. Int. J. Coal Geol. 1999, 40, 255–280. [Google Scholar] [CrossRef]
- Greb, S.F.; Eble, C.F.; Hower, J.C.; Andrews, W.M. Multiple-bench architecture and interpretations of original mire phases in Middle Pennsylvanian coal seams: Examples from the Eastern Kentucky coal field. Int. J. Coal Geol. 2002, 49, 147–175. [Google Scholar] [CrossRef]
- Greb, S.F.; Eble, C.F.; Chesnut, D.R., Jr. Comparison of the Eastern and Western Kentucky coal fields (Pennsylvanian), USA—Why are coal distribution patterns and sulfur contents so different in these coal fields? Int. J. Coal Geol. 2002, 50, 89–118. [Google Scholar] [CrossRef]
- Aitken, J.F.; Flint, S.S. The application of high-resolution sequence stratigraphy to fluvial systems: A case study from the Upper Carboniferous Breathitt Group, eastern Kentucky, USA. Sedimentology 1995, 42, 3–30. [Google Scholar] [CrossRef]
- Aitken, J.F.; Flint, S.S. Variable Expressions of Interfluvial Sequence Boundaries in the Breathitt Group (Pennsylvanian), Eastern Kentucky, USA; Geological Society Special Publication: London, UK, 1996; pp. 193–206. [Google Scholar]
- Hower, J.C.; Bland, A.E. Geochemistry of the Pond Creek coal bed, Eastern Kentucky coalfield. Int. J. Coal Geol. 1989, 11, 205–226. [Google Scholar] [CrossRef]
- Dai, S.; Wang, X.; Zhou, Y.; Hower, J.C.; Li, D.; Chen, W.; Zhu, X. Chemical and mineralogical compositions of silicic, mafic, and alkali tonsteins in the late Permian coals from the Songzao Coalfield, Chongqing, Southwest China. Chem. Geol. 2011, 282, 29–44. [Google Scholar] [CrossRef]
- Li, X.; Dai, S.; Zhang, W.; Li, T.; Zheng, X.; Chen, W. Determination of As and Se in coal and coal combustion products using closed vessel microwave digestion and collision/reaction cell technology (CCT) of inductively coupled plasma mass spectrometry (ICP-MS). Int. J. Coal Geol. 2014, 124, 1–4. [Google Scholar] [CrossRef]
- International Committee for Coal and Organic Petrology. The new vitrinite classification (ICCP system 1994). Fuel 1998, 77, 349–358. [Google Scholar]
- International Committee for Coal and Organic Petrology. The new inertinite classification (ICCP system 1994). Fuel 2001, 80, 459–471. [Google Scholar]
- Hower, J.C.; Pollock, J.D.; Griswold, T.B. Structural Controls on Petrology and Geochemistry of the Pond Creek Coal Bed, Pike and Martin Counties, Eastern Kentucky. In Geology in Coal Resource Utilization, American Association of Petroleum Geologists; Peters, D.C., Ed.; Energy Minerals Division: Tulsa, OK, USA, 1991; pp. 413–427. [Google Scholar]
- Rimmer, S.M.; Hower, J.C.; Moore, T.A.; Esterle, J.S.; Walton, R.L.; Helfrich, C.T. Petrography and palynology of the Blue Gem coal bed, southeastern Kentucky, USA. Int. J. Coal Geol. 2000, 42, 159–184. [Google Scholar] [CrossRef]
- Eble, C.F.; Hower, J.C.; Andrews, W.M., Jr. Paleoecology of the Fire Clay coal bed in a portion of the Eastern Kentucky coal field. Palaeogeogr. Palaeoclimatol. Palaeoecol. 1994, 106, 287–305. [Google Scholar] [CrossRef]
- Hower, J.C.; Andrews, W.M., Jr.; Wild, G.D.; Eble, C.F.; Dulong, F.T.; Salter, T.L. Coal quality trends for the Fire Clay coal bed, southeastern Kentucky. J. Coal Qual. 1994, 13, 13–26. [Google Scholar]
- Ketris, M.P.; Yudovich, Y.E. Estimates of Clarkes for carbonaceous biolithes: World average for trace elements contents in black shales and coals. Int. J. Coal Geol. 2009, 78, 135–148. [Google Scholar] [CrossRef]
- Dai, S.; Seredin, V.V.; Ward, C.R.; Hower, J.C.; Xing, Y.; Zhang, W.; Song, W.; Wang, P. Enrichment of U-Se-Mo-Re-V in coals preserved within marine carbonate successions: Geochemical and mineralogical data from the Late Permian Guiding Coalfield, Guizhou, China. Miner. Deposita 2015, 50, 159–186. [Google Scholar] [CrossRef]
- Hower, J.C.; Taulbee, D.N.; Rimmer, S.M.; Morrell, L.G. Petrographic and geochemical anatomy of lithotypes from the Blue Gem coal bed, southeastern Kentucky. Energy Fuels 1994, 8, 719–728. [Google Scholar] [CrossRef]
- Hower, J.C.; Rimmer, S.M.; Bland, A.E. Geochemistry of the Blue Gem coal bed, Knox County, Kentucky. Int. J. Coal Geol. 1991, 18, 211–231. [Google Scholar] [CrossRef]
- Seredin, V.V.; Dai, S. Coal deposits as a potential alternative source for lanthanides and yttrium. Int. J. Coal Geol. 2012, 94, 67–93. [Google Scholar] [CrossRef]
- Zubović, P. Physico-Chemical Properties of Certain Minor Elements as Controlling Factors in Their Distribution in Coal. In Coal Science; Given, P.H., Ed.; American Chemical Society Advances in Chemistry Series: Washington, DC, USA, 1966; pp. 211–231. [Google Scholar]
- Hower, J.C.; Greb, S.F.; Cobb, J.C.; Williams, D.A. Discussion on origin of vanadium in coals: Parts of the Western Kentucky (USA) No. 9 coal rich in vanadium: Special Publication No. 125, 1997, 273–286. J. Geol. Soc. Lond. 2000, 157, 1257–1259. [Google Scholar] [CrossRef]
- Yudovich, Y.E. Notes on the marginal enrichment of Germanium in coal beds. Int. J. Coal Geol. 2003, 56, 223–232. [Google Scholar] [CrossRef]
- Sakulpitakphon, T.; Hower, J.C.; Schram, W.H.; Ward, C.R. Tracking Mercury from the Mine to the Power Plant: Geochemistry of the Manchester Coal Bed, Clay County, Kentucky. Int. J. Coal Geol. 2004, 57, 127–141. [Google Scholar] [CrossRef]
- Taylor, S.R.; McLennan, S.M. The Continental Crust: Its Composition and Evolution. Blackwell: London, UK, 1985; p. 312. [Google Scholar]
- Hower, J.C.; Pollock, J.D. Petrology of the River Gem Coal Bed, Whitley County, Kentucky. Int. J. Coal Geol. 1989, 11, 227–245. [Google Scholar] [CrossRef]
- Hower, J.C.; Riley, J.T.; Thomas, G.A.; Griswold, T.B. Chlorine in Kentucky coals. J. Coal Qual. 1991, 10, 152–158. [Google Scholar]
- Hower, J.C.; Hiett, J.K.; Wild, G.D.; Eble, C.F. Coal resources, production, and quality in the Eastern Kentucky coalfield: Perspectives on the future of steam coal production. Nonrenew. Resour. 1994, 3, 216–236. [Google Scholar] [CrossRef]
- Hower, J.C.; Ruppert, L.F.; Eble, C.F.; Graham, U.M. Geochemical and palynological indicators of the paleoecology of the River Gem coal bed, Whitley County, Kentucky. Int. J. Coal Geol. 1996, 31, 135–149. [Google Scholar] [CrossRef]
- Andrews, W.M., Jr.; Hower, J.C.; Hiett, J.K. Investigations of the Fire Clay coal bed, southeastern Kentucky, in the vicinity of sandstone washouts. Int. J. Coal Geol. 1994, 26, 95–115. [Google Scholar] [CrossRef]
- Mardon, S.M.; Hower, J.C. Impact of coal properties on coal combustion by-product quality: Examples from a Kentucky power plant. Int. J. Coal Geol. 2004, 59, 153–169. [Google Scholar] [CrossRef]
- Dai, S.; Wang, P.; Ward, C.R.; Tang, Y.; Song, X.; Jiang, J.; Hower, J.C.; Li, T.; Seredin, V.V.; Wagner, N.J.; et al. Elemental and mineralogical anomalies in the coal-hosted Ge ore deposit of Lincang, Yunnan, Southwestern China: Key role of N2-CO2-mixed hydrothermal solutions. Int. J. Coal Geol. 2014. [Google Scholar] [CrossRef]
- Dai, S.; Hower, J.C.; Ward, C.R.; Guo, W.; Song, H.; O’Keefe, J.M.K.; Xie, P.; Hood, M.M.; Yan, X. Elements and phosphorus minerals in the middle Jurassic inertinite-rich coals of the Muli Coalfield on the Tibetan Plateau. Int. J. Coal Geol. 2015, 144–145, 23–47. [Google Scholar] [CrossRef]
© 2015 by the authors; licensee MDPI, Basel, Switzerland. This article is an open access article distributed under the terms and conditions of the Creative Commons by Attribution (CC-BY) license (http://creativecommons.org/licenses/by/4.0/).
Share and Cite
Johnston, M.N.; Hower, J.C.; Dai, S.; Wang, P.; Xie, P.; Liu, J. Petrology and Geochemistry of the Harlan, Kellioka, and Darby Coals from the Louellen 7.5-Minute Quadrangle, Harlan County, Kentucky. Minerals 2015, 5, 894-918. https://doi.org/10.3390/min5040532
Johnston MN, Hower JC, Dai S, Wang P, Xie P, Liu J. Petrology and Geochemistry of the Harlan, Kellioka, and Darby Coals from the Louellen 7.5-Minute Quadrangle, Harlan County, Kentucky. Minerals. 2015; 5(4):894-918. https://doi.org/10.3390/min5040532
Chicago/Turabian StyleJohnston, Michelle N., James C. Hower, Shifeng Dai, Peipei Wang, Panpan Xie, and Jingjing Liu. 2015. "Petrology and Geochemistry of the Harlan, Kellioka, and Darby Coals from the Louellen 7.5-Minute Quadrangle, Harlan County, Kentucky" Minerals 5, no. 4: 894-918. https://doi.org/10.3390/min5040532